Nutrient Management in Aquaponics: Comparison of Three Approaches for Cultivating Lettuce, Mint and Mushroom Herb


1
Department of Life and Environmental Science, Università Politecnica delle Marche, via Brecce Bianche, 60131 Ancona, Italy
2
Institute for Natural Resource Sciences, Zurich University of Applied Sciences, Grüental, 8820 Wädenswil, Switzerland
*
Author to whom correspondence should be addressed.
Agronomy 2018, 8(3), 27; https://doi.org/10.3390/agronomy8030027
Submission received: 10 February 2018
/
Revised: 3 March 2018
/
Accepted: 5 March 2018
/
Published: 7 March 2018
Abstract
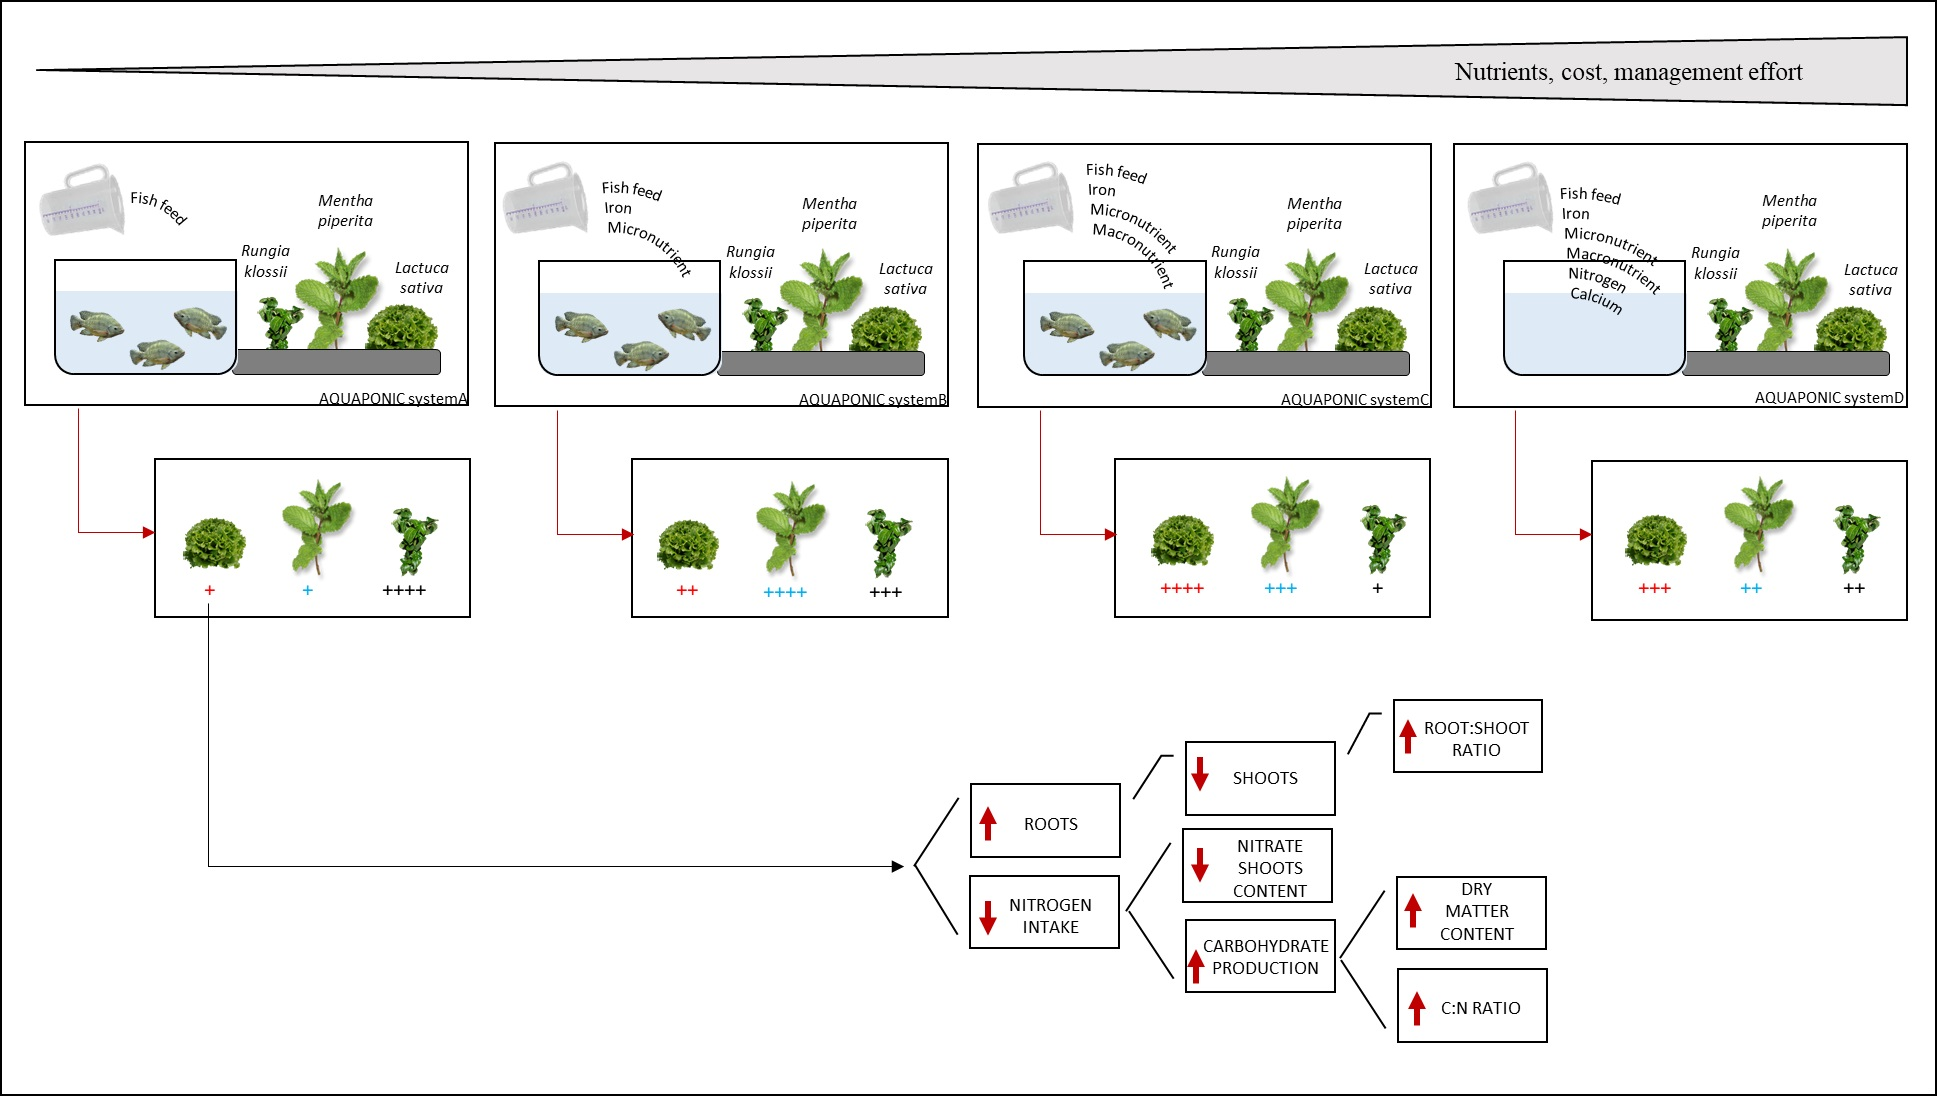
:Nutrients that are contained in aquaculture effluent may not supply sufficient levels of nutrients for proper plant development and growth in hydroponics; therefore, they need to be supplemented. To determine the required level of supplementation, three identical aquaponic systems (A, B, and C) and one hydroponic system (D) were stocked with lettuce, mint, and mushroom herbs. The aquaponic systems were stocked with Nile tilapia. System A only received nutrients derived from fish feed; system B received nutrients from fish feed as well as weekly supplements of micronutrients and Fe; system C received the same nutrients as B, with weekly supplements of the macronutrients, P and K; in system D, a hydroponic inorganic solution containing N, Ca, and the same nutrients as system C was added weekly. Lettuce achieved the highest yields in system C, mint in system B, and mushroom herb in systems A and B. The present study demonstrated that the nutritional requirements of the mint and mushroom herb make them suitable for aquaponic farming because they require low levels of supplement addition, and hence little management effort, resulting in minimal cost increases. While the addition of supplements accelerated the lettuce growth (Systems B, C), and even surpassed the growth in hydroponic (System C vs. D), the nutritional quality (polyphenols, nitrate content) was better without supplementation.
Keywords:
aquaponics; hydroponics; lettuce; nutrient; floating raft culture; tilapia; nitrogen; phosphate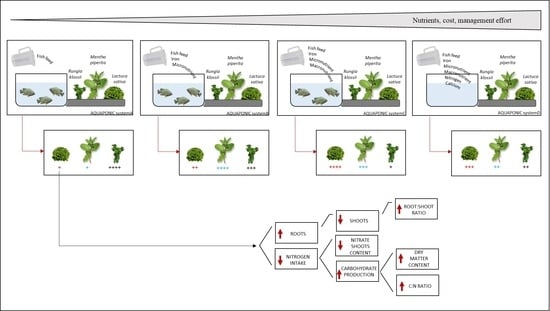
1. Introduction
Aquaponics is the combination of hydroponics and recirculating aquaculture in a single water cycle [1]. In aquaponic systems (AP), the nutrients that are needed for plant growth are entirely or partly supplied by fish waste; teleosts mostly excrete nitrogen (N) in the form of ammonia (NH4) through their gills [2,3], while their faeces contain organic N, phosphorus (P), and carbon (C) [4,5]. In contrast to AP, where most nutrients are organic in origin, conventional hydroponic cultivation techniques provide plants with inorganic nutrients [6]. Several authors have investigated the possibility of using organically bound nutrients [7,8,9], which need to be released by microorganisms before being assimilated by plants. This process is, however, slower than if inorganic nutrients are used [10]. It has been suggested that nutrients from aquaculture effluents may not supply sufficient levels of potassium (K), calcium (Ca) or iron (Fe) for proper plant development, therefore these need to be added as supplements to the system to ensure optimal plant performance [11,12,13,14]. However, adding these supplements requires closer management of the system and leads to greater costs [15,16,17]. Lettuce is commonly grown hydroponically in greenhouses. In these recirculating hydroponic systems, the disposal of large volumes of spent nutrient solutions, which still contain high concentrations of eutrophying nutrients, poses a significant ecological risk [18,19], and has recently been prohibited by some countries (e.g., The Netherlands).
In AP, the levels of nutrients are often lower than those in conventional hydroponics [20]; nevertheless, comparable levels of productivity have been reported. This poses the question whether “organically” derived nutrients are more effective than nutrients derived from readily soluble mineral fertilizers [20,21]. In order to establish this, it is important to know the exact nutrient demand of the crops being cultivated, i.e., whether they can thrive on the water composition derived from aquaculture directly or whether nutrient supplements are needed. Understanding this would also expand current knowledge on nutrient dynamics in AP.
The purpose of this study was to investigate the influence of three different AP nutrient regimes on crop productivity and quality, and to compare them to cultivation in conventional hydroponic systems. An additional goal was to establish whether maximizing management effort, in the form of administering large amounts of nutrients, maximizes the production for different plants species.
2. Results
2.1. Water Quality
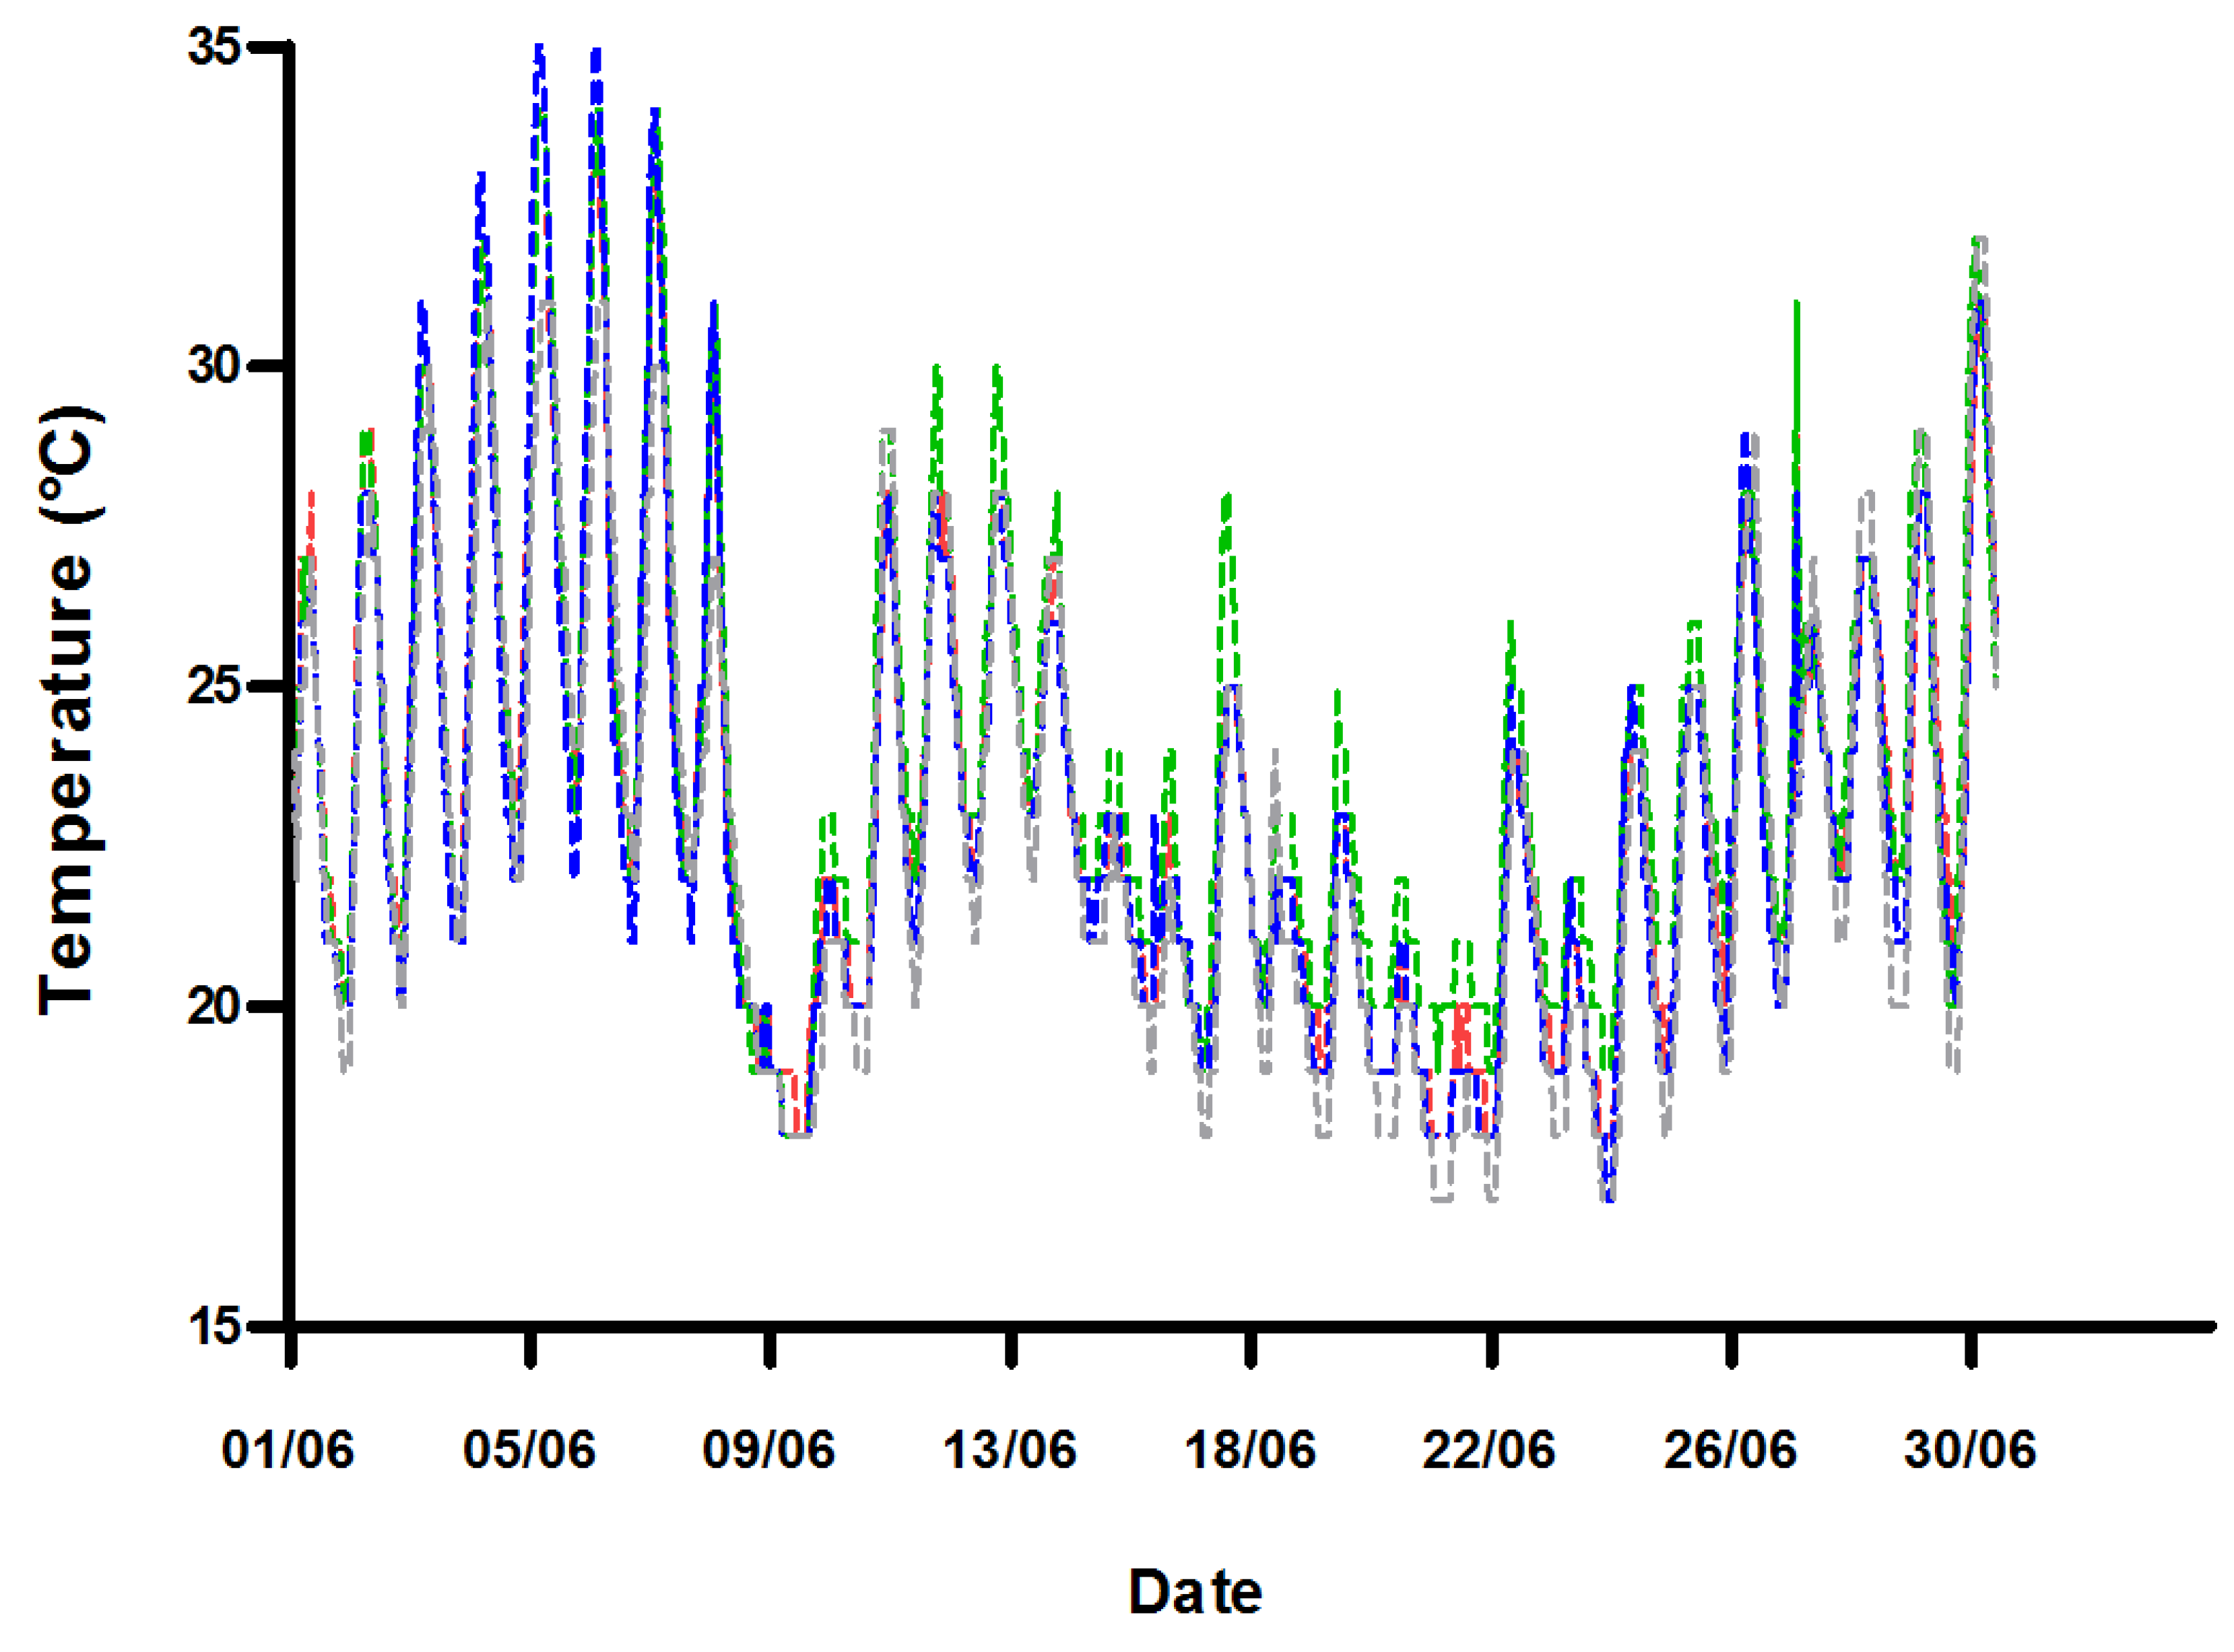
Water in the floating raft tables, and therefore the plant root zone, (Figure 1) was subjected to large daily temperature variations of up to 12 °C, due to the shallow water and the direct exposure to sunlight. No differences were measured in water temperature between the four experimental systems, despite A, B, and C receiving warmer aquaculture effluent.
2.2. Growth of Fish and Plants
The specific growth rates for the Nile tilapia over 57 days were 1.20%, 1.17%, 1.33%, and feed conversion ratios were 1.25, 1.49, and 1.16 in A, B, and C, respectively. During the experiment, only one fish died, and this was in system A (Table 2).
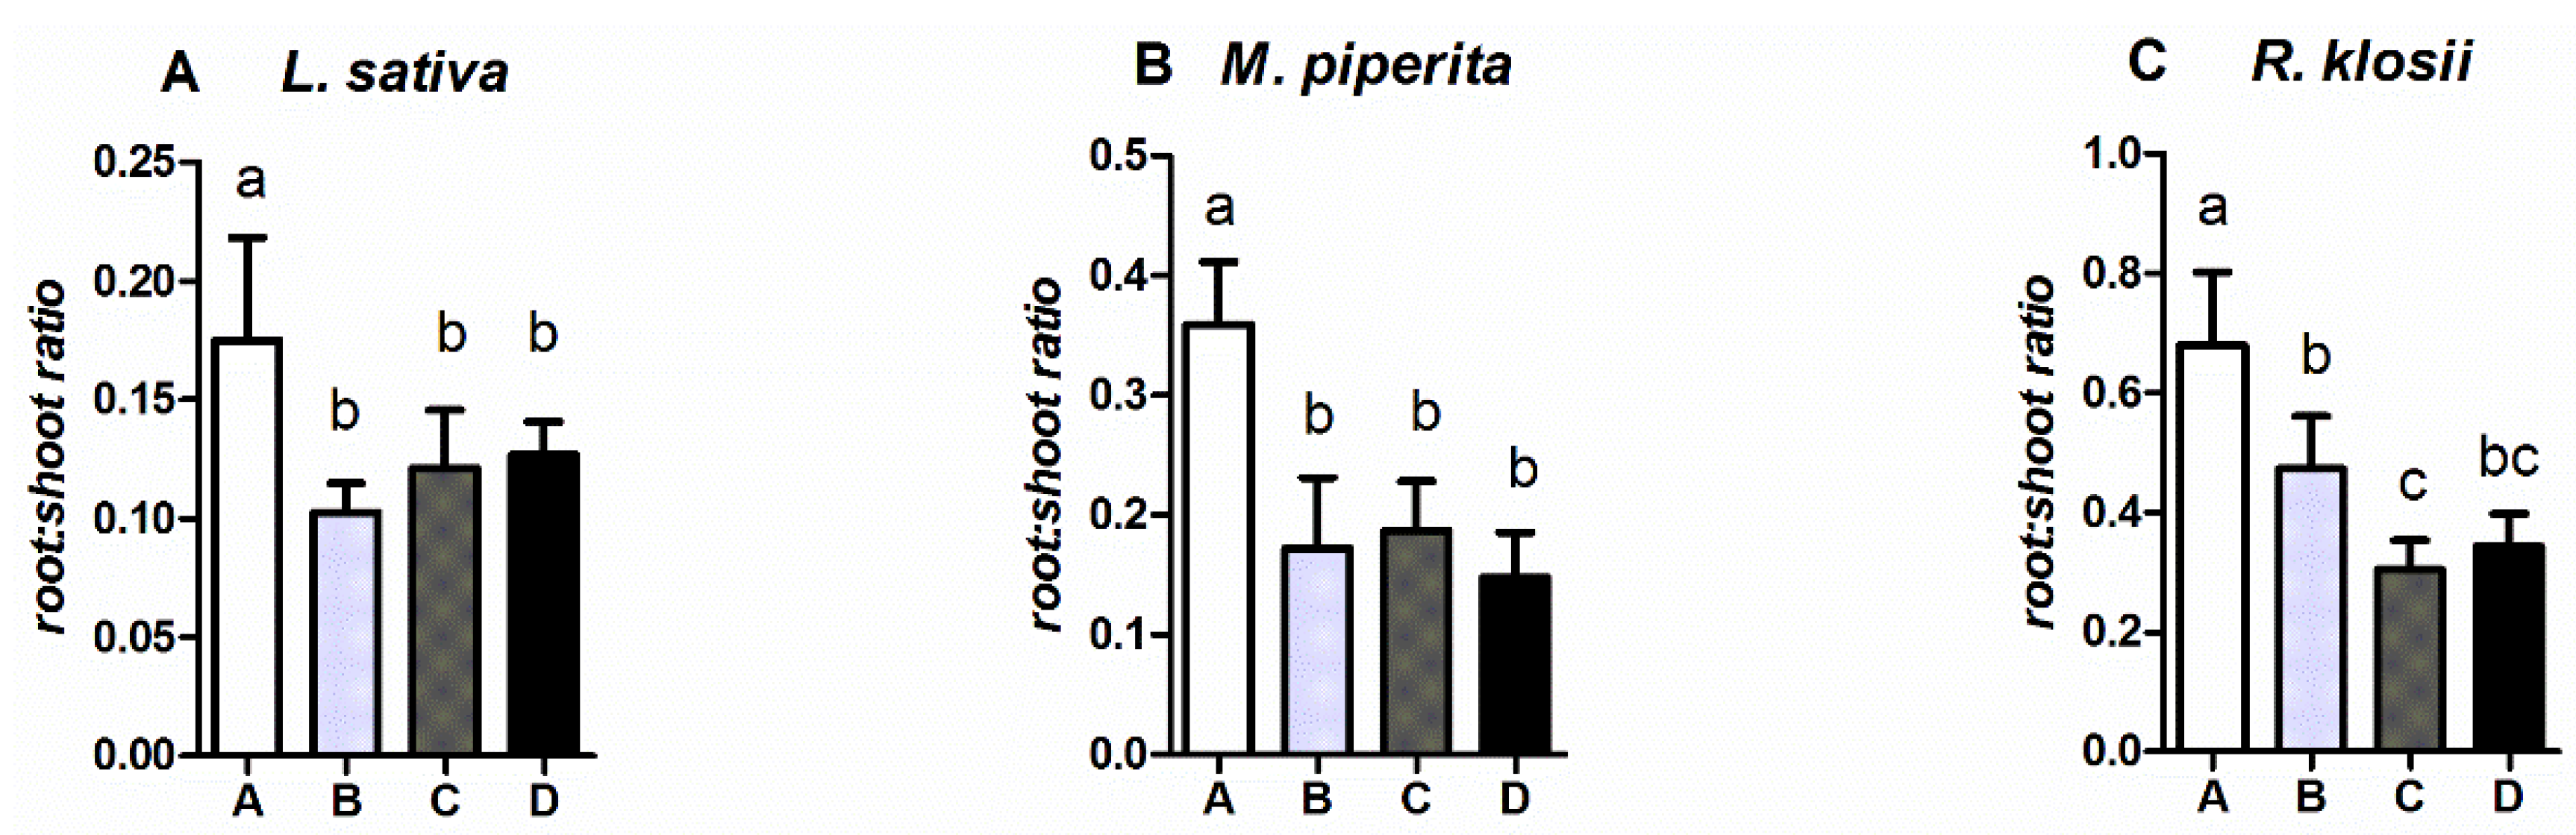
The highest level of lettuce production (both as total biomass, and as shoots) was found in system C, followed by systems D, B, and A. The fresh shoot weight from the unsellable lettuce was 94 g, while fresh roots weighed 22.6 g. The lettuce was poorly developed with green-yellow leaves (Table 3). For mint, the highest level of production was observed in B, followed by C, D, and A. Despite the second highest level of production being in system A, six mints in this system were unsellable, with a total shoots weight of 22.6 g and poorly developed roots (total fresh weight of 0.6 g). These plants had suffered light deprivation due to the rapid growth of the surrounding plants. The mushroom herbs performed best in system A. The root systems of all the species were most developed in system A. The root-to-shoot ratio for three plant species was significantly higher in system A than in the other systems. Furthermore, this ratio was also significantly higher in system B than in C for the mushroom herbs (Figure 3).
2.3. Chlorophyll (CHL), Epidermal UV-Absorbance (FLV) and Nitrogen Balance Index (NBI)
The indices of plant status are shown in Figure 4. The mints in system A exhibited significantly lower CHL to FLV ratios (or NBI) than the mints in systems B and D. They also had significantly higher levels of FLV than mints in systems B, C, and D. Both of the values indicate a certain amount of stress response in mint when growing in the system without nutrient supplementation. No significant differences were found for these two indices in lettuce grown in different AP systems. However, the levels of CHL were highest in the lettuces from systems A and B, and significantly lower in those from C and D.
2.4. Nitrate Levels in Plant Tissue
Significant differences in the mean NO3 content were found in mushroom herbs: plants from system B showed a significant increase in NO3 content when compared to the plants from the hydroponic system (Figure 5).
2.5. Dry Matter and CHN
The lettuce and mint shoot biomass had a higher dry matter content in system A than in the others (p < 0.05) (Figure 6 Left). The C/N ratio in the biomass, which reflects the N supply to the plant, was in most cases highest in AP System A, which received no supplements. In most cases, it was lowest in System D (hydroponic), while Systems B (micronutrient supplementation), and System C (micronutrient plus N supplementation) had intermediate values.
2.6. Water Loss during Storage
Lettuce from systems A, B, C, and D lost 24.6%, 22.3%, 21.8%, and 23.6% of water, respectively, within 14 days of storage. All lettuce lost turgor and presented brown edges.
3. Discussion
As expected, the lettuce grew the least in the non-fertilized system A (65% of the maximum production level observed in system C); conversely, the root biomass was the highest, which illustrates that the plants were trying to absorb as many nutrients as possible. The slow growth together with the strong root development may have been induced by the low concentration of P in system A. In fact, in system A, P was derived exclusively from the remains of fish feed and faeces that were constantly removed by the solids removal unit, thus decreasing the P concentration. Despite this, P did accumulate in system A during the trial, increasing from 2.64 mg L−1 PO4-P to 4.54 mg L−1. However, these values were still ten times lower than in systems C and D, where approximately 35 mg L−1 P was added weekly. Several authors [22,23,24] have shown that under P deficiency, plants like lettuce allocate energy to increase root growth (increasing their probability of finding this nutrient), rather than producing shoots, resulting in an increased root-to-shoot ratio. Studying greenhouse lettuce (L. sativa cv. ‘Rachel’), Buwalda et al. [25] found that a P shortage increases both the root-to-shoot ratio and dry matter content, while it decreases the NO3 content in the shoot. Previous studies may explain the higher root-to-shoot ratio of lettuce grown in aquaponics system A, even if these results may have been caused by the deficiency of micronutrients in the water, rather than by a P deficiency. In fact, despite the lower P concentration in the water, the final biomass of the lettuce cultivated in system B (micronutrients added) was higher than in system A. All three species that were grown in system A had higher dry matter contents, both in the shoots and the roots. However, only the lettuce and mint had lower concentrations of NO3.
NO3 is an important parameter to be considered when determining vegetable quality. After assimilation, NO3 can be transformed into NO2 and nitric oxide, which are dangerous to human health [26]. The consumption of vegetables rich in NO3 increases their concentration in the human body [27]. To prevent negative health impacts, the European Commission [28] regulates NO3 content in lettuces and other vegetables. The maximum amount of NO3 that is permitted in lettuces ranges from 2000 to 5000 mg kg−1, depending on the type of lettuce and the harvesting time. For Lactuca sativa cultivated in greenhouses and harvested between April 1 and September 30, the NO3 limit is 4000 mg kg−1. In this study, the concentration was below this threshold value for all of the experimental groups (see Figure 5). Moreover, no significant differences in NO3 in the leaves were found between the groups. Mint and mushroom herb, however, are not subject to this European normative regulation.
The lowest NO3 values were measured in the plants that were grown in system A, except for the mushroom herbs. High intensity light reduces NO3 levels in leaves [29,30,31]. However, in this research project, all of the plants were subject to the same natural light regime. Once again, the difference in NO3 content may be closely related to the P concentration in the water. Several studies have affirmed that P limitation decreases NO3 levels in leaves, decreasing N uptake by roots [32,33,34].
Furthermore, differences in NO3 accumulation in leaves may depend on the use of organic and inorganic N sources, especially in lettuce; Pavlou et al. [35] found that in romaine-type lettuce (Lactuca sativa cv. Corsica), inorganic N increases the concentration of NO3 in leaves when compared to organic N derived from sheep manure. However, the NO3 levels are subject to significant fluctuations in some vegetables.
NO3 and carbohydrates are involved in osmotic adjustment; specifically, their relationship is inversely proportional and is regulated by the intensity of light [36,37,38]. In this study, P-shortages seemed to reduce the N intake and increase carbohydrate production in the lettuce cultivated in system A. These results agree with several studies that described how P limitations induce the accumulation of carbohydrates, such as organic acids and sugars that are needed for osmotic regulation [39,40]. Consequently, an increase in the dry matter content was found in lettuce grown in system A, as reported by Sorensen et al. [41], who studied crisphead lettuce.
In terms of CHL, lettuces grown in system A had a significantly higher content than lettuces from all the other systems (A > B > C > D); this value may be negatively related to NO3 content in leaves; Behr and Wiebe [42] demonstrated that in lettuces, low NO3 levels increase the production of sugar, which is derived from an increase in photosynthetic activity and chlorophyll.
The C/N ratio was highest in the non-fertilized system A, where there was an obvious modification in the allocation of C and N. When comparing shoots of the plants that were tested, the C/N ratio and NO3 levels in the leaves seemed to follow opposite trends. However, C/N trends in both the shoots and the roots as well as the dry matter were similar. It is possible that the higher increase in C/N ratios in lettuce and mint grown in system A were connected to the shortage of other nutrients, such as Fe and P. This may have led to reduced nitrogen intake and consequently the accumulation of carbohydrates for osmotic adjustment, as previously described. This would also explain why the C/N values were again lower in System B, which was only supplemented with micronutrients. The deviating C/N trends that were observed in the mushroom herbs suggest that this plant has fundamentally different nutrient requirements to lettuce and mint.
The content of polyphenols in plants is a further interesting aspect to be considered. Polyphenol compounds, such as flavonols, are derived from secondary metabolism in plants [43]; their anti-oxidant activity makes these compounds important for human health [44,45,46]. However, polyphenolic compounds are also produced by plants in response to stressors; Fe deficiency may increase polyphenol synthesis in plants [47]. Mint cultivated in system A showed a significant increase in polyphenols compared to the other systems. This high value may depend on the Fe limitation in the water. Lettuce grown in system A also exhibited a higher polyphenol level, although these differences were not significant. Lettuce is considered to be an interesting source of phenolic compounds and, for this reason especially, a ‘healthy food’ [48]. Studying lettuce, Oh et al. [49] demonstrated that it is possible to use mild environmental stresses to improve the phytochemical content of substances considered health-promoting in human food.
Water parameters seemed to highlight a high level of variability in the nutrient uptake of the plants; K and N tended to accumulate in all of the aquaponic systems because of the constant supply of fish waste. Conversely, N and K were continuously consumed in system D, which received weekly supplements; in order to compensate, hydroponics are subjected to continuous nutrient control and therefore have higher management costs. However, it stands to reason that plants respond to different nutrient regimes, which are based on their nutritional requirements; lettuce needs more nutrients to improve the speed of growth than mint and mushroom herb, though the lettuce cultivated in system A also reached a commercial size in the same time. This lettuce showed even lower nitrate content, meaning system A returned healthier food for human consumption than the other systems.
Mint seemed to be more sensitive to micronutrient limitations than to macronutrient deficiency. Lastly, mushroom herb production was higher in A and B, and growth seemed to be inhibited under high nutrient concentrations.
In all three plant species tested, root biomass was more developed in the systems where management effort was lower (A and B), indicating that more energy was wasted by increasing the sorption surface, which enhances the probability of capturing nutrients. The benefit of these systems was that the lower edible yield corresponded to a lower NO3 content (except for the mushroom herbs), which produces a better quality of lettuce and mint.
High management effort does not correspond to maximum production yields and quality. For instance, nutrients enhanced the speed of growth, and the lettuce biomass grown in system C, even when a P shortage increased phenol compounds and decreased the nitrate content in the leaves of the system A lettuces. The addition of macronutrients to the cultivation of mushroom herbs and mint also resulted in inhibited productivity, meaning that money would be wasted in a production environment.
4. Material and Methods
4.1. System Design
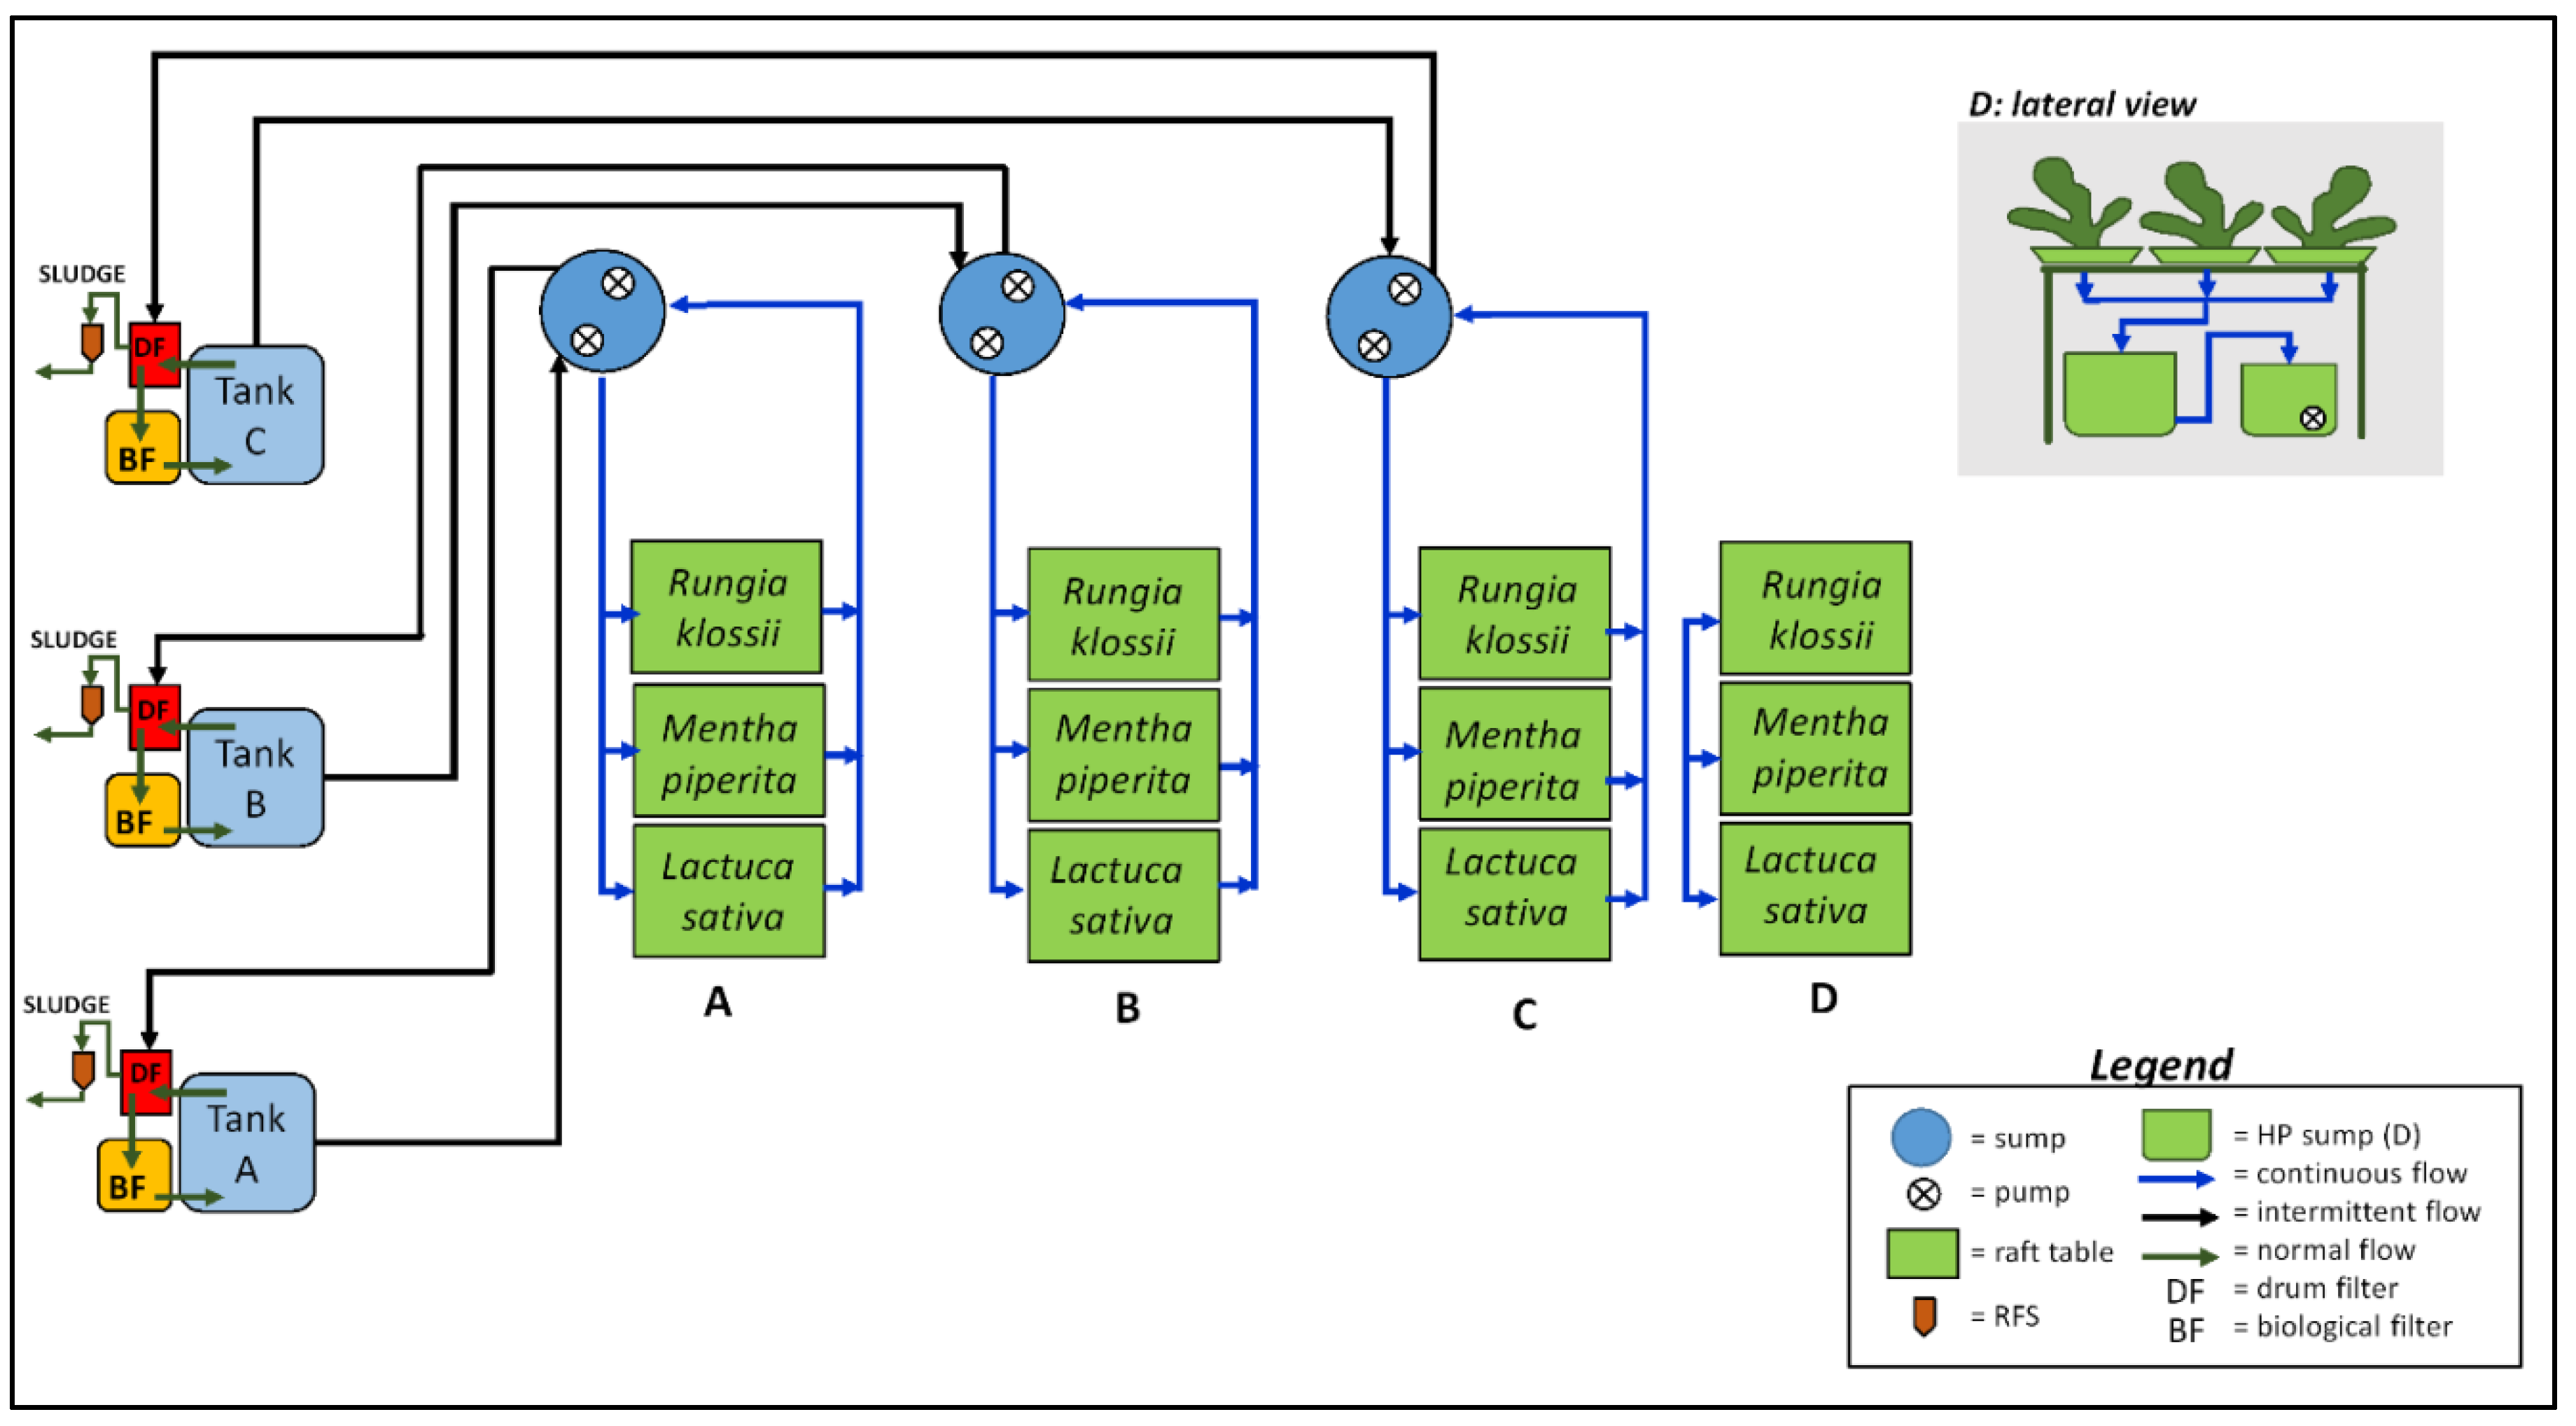
The experiment took place between 29 May and 30 June 2015. Three identical aquaponic systems (A, B, and C) and one hydroponic system (D) were assembled in a foliar greenhouse at the Zurich University of Applied Sciences (ZHAW) in Wädenswil, Switzerland (47.217262, 8.681461) (Figure 7). Each AP consisted of a fish tank, a solids removal unit (drum filter), a moving-bed biofilter, an oxygenation zone, a solids thickening unit (radial flow settler—RFS), and a hydroponic unit. The biofilter was connected to the plant sump, to where water was pumped every 30 min. From the sump, water was continuously pumped to a hydroponic unit comprised of three table sections (1.2 m × 2 m each) for plant production, covering a total surface of 7.2 m2 for each AP. Each table section was filled with 25 mm water and was covered with floating styrofoam rafts (Dry Hydroponics B.V., NL). The plant holders allowed for densities of 20 plants per m2 for lettuces and 40 plants per m2 for mints and mushroom herbs. The total water volume in each system was approximately 4200 L. The conventional hydroponic system (D) consisted of a HP unit as described above and two sumps with a total volume of approximately 630 L. The backflow from the A, B, and C sumps to the aquaculture system drum filter was controlled by water level sensors that maintained a constant water level in the sumps. Fish sludge from the drum filter was passed to the RFS in order to sediment. The liquid supernatant was recirculated to the drum filters so that some of the nutrients and water could be retrieved. Settled and floating sludge were removed three times a week and were discarded.
Temperature and oxygen were regulated at 26 °C and 8 mg O2 L−1 by a HACH Lange SC1000 controller (HACH Lange, Loveland, CO, USA). Temperature, pH, electrical conductivity (EC) and oxygen levels were also measured three times a week using a HACH Lange HQ40d portable multimeter. Temperature loggers (Hygrochron iButtons, Maximintegrated, San Jose, CA, USA) were immersed in the first table sections of each system, in the plants’ root zone below the rafts.
Each fish tank was stocked with 50 Nile tilapia (Oreochromis niloticus, see Table 2), each weighing approximately 220 g (see Table 2). The fish were fed approximately 2% of their body weight per day with Tilapia Vegi 4.5 mm, a floating, extruded feed (Hokovit Hofmann Nutrition AG, Bützberg, Switzerland). (main ingredients: soybean meal, wheat, corn gluten meal, linseed oil; composition in g/kg: crude protein 375, crude lipid 72, crude fiber 23, ash 86)). Feeding was distributed over six automated feeding times (7:00, 8:00, 10:00, 12:00, 15:00, 17:00), and the total amount of feed added was recorded. The fish were monitored every day to evaluate feeding and appetite, and to check for possible deaths. Three crops were tested: lettuce (Lactuca sativa YACHT, Salanova®), the crop of most economic interest, and two herbs: a mint (Mentha piperita CHOCOLATE) and mushroom herb (Rungia klossii). Each hydroponic unit hosted 36 lettuces, 72 mints, and 72 mushroom herbs. The plants were exposed to a natural photoperiod.
4.2. Experimental Design
The lettuce seeds were pelleted (coated) [50] and planted individually in rockwool cubes in a seedling tray for germination on 5 May. The mints and mushroom herbs were purchased as seedlings and were planted in rockwool cubes to propagate. The cubes were punched and the center was removed to make space for the seedling. The seedlings were transferred to the floating styrofoam raft holes at the start of the experiment on 29 May. Initially, they were placed directly on the table, but after six, eight, and nine days (lettuce, mushroom herb, mint, respectively) the roots were long enough to reach the water and the seedlings were moved to the plant holders and placed on top of the rafts.
During cultivation, the plants were observed daily for signs of pests or disease. In the second week after planting, Amblyseius cucumeris predatory mites (in Vermiculite, Andermatt Biocontrol AG, Grossdietwil, Switzerland) were scattered at a density of 25 per m2 to combat thrips (Thysanoptera). No other treatment was necessary.
Four different nutrient regimes were applied over the four-week trial (see Table 4). In system A, nutrients were derived exclusively from fish feed; in system B, nutrients were derived from fish feed with supplements of micronutrients and Fe; in system C, nutrients were derived from fish feed with supplements of micronutrients and Fe plus the macronutrients P, K, magnesium (Mg), and sulfur (S). System D (hydroponic) served as a control, with a nutrient solution that was prepared using the same inorganic fertilizers as system C, with the addition of N and Ca. The amount of nutrients, cost, and management effort increased from system A to D. To maintain the pH at approximately 6, 16% nitric acid solution (HNO3) was added to the hydroponic system (D), while potassium hydroxide (KOH) was added to the aquaponic systems (A,B,C) to buffer the pH at 6.5. The total input of HNO3 and KOH are recorded in Table 4.
The system water was analyzed weekly for phosphate-phosphorus (PO4-P), ammonium-nitrogen (NH4-N), nitrite-nitrogen (NO2-N), nitrate-nitrogen (NO3-N), K, Fe, Ca, Mg, and water hardness (Calcium carbonate, CaCO3) using HACH Lange LCK Tests and the values measured using a DR3800 VIS Spectrophotometer (HACH Lange). The required quantities of nutrient supplements to be added to each system were calculated using a HydroBuddy calculator, v1.50 [51]. Target values were set at 60 mg L−1 NO3-N, 35 mg L−1 PO4-P, 150 mg L−1 K+, 3 mg L−1 Fe, 130 mg L−1 Ca2+, 40 mg L−1 Mg2+. Fertilizers were added directly to the biofilter or to the two hydroponic sumps in system D.
4.3. Sampling Plants and Fish
The experiment ended after approximately four weeks, when the plants had reached commercial sizes. Lettuces, mints, and mushroom herbs were sampled and harvested on 26, 29, and 30 June, respectively. The plants were categorized into sellable and unsellable; the unsellable plants were excluded from further biomass analysis. The plants were harvested by cutting above the substrate, the rock wool substrate block was removed, including the roots it contained, and the roots that were protruding from the substrate were separated from the plant. The total biomass, fresh shoot weight, fresh root weight, and root-to-shoot ratio were recorded. The final fish biomass was also recorded at the end of the experiment.
4.4. Assessing Plant Quality
Before harvesting, the chlorophyll content (CHL), epidermal UV-absorbance (FLV), Nitrogen Balance Index (NBI), and anthocyanins (ANTH) were determined for live lettuce and mints using a Dualex® scientific leaf clip (ForceA, Orsay, France), while the thick leaves of the mushroom herbs did not allow for this method to be used. Dualex Scientific is a hand leaf-clip tool that combines the use of fluorescence and the light transmission of leaves to determine leaf condition [52].
The chlorophyll and phenolic compound content provides information on the condition of the plant; in optimal conditions, plant photosynthesis produces proteins and chlorophyll through primary metabolism; conversely, in the case of a nitrogen deficiency, plants activate their secondary metabolism, which is associated with the production of secondary compounds i.e., flavonols. NBI is the ratio between CHL and FLV and is an indicator of the N status of plants; FLV is an index of the phenolic content, which mostly consists of flavonols.
4.5. Nitrate Levels in Leaf Tissue
Three samples of lettuce, mint, and mushroom herb were collected and stored at −20 °C for NO3 measurement. The analysis was conducted on the leaves of the lettuce and mint, and on the leaves and stems of the mushroom herb. The samples were firstly blended, and then 10 g were transferred to a beaker and were diluted in 50 mL distilled water. The beaker was covered with a watch glass and the solution was boiled and stirred for 15 min, before water was added to adjust the final volume to 100 mL. A colorimetric strip was immersed in the solution and then read in a spectrophotometer (Reflectoquant®Nitrate-Test, Merck, Darmstadt, Germany) to give the NO3 value in mg L−1.
4.6. Organic Matter and CHN-Elemental Analysis
Three specimens of each variety were harvested and weighed (in duplicate) as described in Section 2.4. Samples were dried at 105 °C to a constant weight (for approximately 48 h). The dried samples were powdered and 0.1 g of each sample (in duplicate) was folded in aluminum foil for C and N analysis in a CHN analyzer (LECO, TruSpec CHN Macro Analyser, Saint Joseph, MI, USA).
4.7. Water Loss during Storage
Water loss can indicate the quality of leafy vegetables. After harvesting, high water loss during storage results in decreased marketable weight and impairs visual quality. Moreover, water loss makes vegetables more sensitive to pathogen attack [53]. To determine post-harvest water loss, six lettuce samples from each experimental system were harvested, wrapped in a perforated plastic salad bag, weighed, and stored in the dark at +4 °C. Over the following two weeks, the samples were weighed every second day.
4.8. Statistical Analysis
A one-way analysis of variance was applied to the data, followed by Bonferroni’s multiple comparison test to determine the differences between the groups using GraphPad Prism statistical software, version 5.00 for Windows (GraphPad Software, La Jolla, CA, USA, www.graphpad.com). The significance level was set at p < 0.05.
5. Conclusions
In conclusion, this study highlights that higher management effort and costs do not always result in optimal plant growth; the management effort is highly dependent on the plant species that are cultivated. More specifically, the moderate nutritional requirements of mint and mushroom herb make them suitable for farming in AP with little management effort and costs. For lettuce, the addition of micro- and macronutrients improved the speed of growth, even though lettuce grown in the non-fertilized system reached a commercial size in the same timeframe. It is therefore important to know the nutrient response of each species that is cultivated in aquaponics in order to optimize productivity and investment.
Acknowledgments
The authors would like to acknowledge support by COST Action FA1305—The EU Aquaponics Hub—Realising Sustainable Integrated Fish and Vegetable Production for the EU for the Short Term Scientific Mission Grant to V.N. We thank the ZHAW, Institute of Natural Resource Sciences in Wädenswil for both funding this publication and providing research facilities.
Author Contributions
V.N., A.G. and A.M. conceived and designed the experiment; V.N., Z.S. and A.M. performed the experiment and the measurements; V.N. and A.G. analyzed the data. R.J. was the main supervisor of the project. V.N. wrote the first draft, all authors contributed to discussion and writing of the paper.
Conflicts of Interest
The authors declare no conflict of interest.
References
- Diver, S.; Rinehart, L. Aquaponics—Integration of Hydroponics with Aquaculture; ATTRA—National Sustainable Agriculture Information Service: Fayetteville, AR, USA, 2010; 28p. [Google Scholar]
- Rakocy, J.E.; Losordo, T.M.; Masser, M.P. Recirculating Aquaculture Tank Production Systems. Integrating Fish and Plant Culture; SRAC Publication: Stoneville, MS, USA, 1992; pp. 1–8. [Google Scholar]
- Wilkie, M.P. Mechanisms of ammonia excretion across fish gills. Comp. Biochem. Physiol. 1997, 1, 39–50. [Google Scholar] [CrossRef]
- Naylor, S.J.; Moccia, R.D.; Durant, G.M. The chemical composition of settleable solid fish waste (manure) from commercial Rainbow Trout farms in Ontario, Canada. N. Am. J. Aquacult. 1999, 61, 21–26. [Google Scholar] [CrossRef]
- Saba, G.K.; Steinberg, D.K. Abundance, composition, and sinking rates of fish fecal pellets in the Santa Barbara Channel. Sci. Rep. 2012, 2, 716. [Google Scholar] [CrossRef] [PubMed]
- Resh, H.M. Hydroponic Food Production: A Definitive Guidebook for the Advanced Home Gardener and the Commercial Hydroponic Grower; CRC Press: Boca Raton, FL, USA, 2012. [Google Scholar]
- Heeb, A.; Lundegårdh, B.; Ericsson, T.; Savage, G.P. Effects of nitrate-, ammonium-, and organic-nitrogen-based fertilizers on growth and yield of tomatoes. J. Plant Nutr. Soil Sci. 2005, 168, 123–129. [Google Scholar] [CrossRef]
- Premuzic, Z.; Bargiela, M.; Garcia, A.; Rendina, A.; Iorio, A. Calcium, iron, potassium, phosphorus, and vitamin C content of organic and hydroponic tomatoes. HortScience 1998, 33, 255–257. [Google Scholar]
- Shinohara, M.; Aoyama, C.; Fujiwara, K.; Watanabe, A.; Ohmori, H.; Uehara, Y.; Takano, M. Microbial mineralization of organic nitrogen into nitrate to allow the use of organic fertilizer in hydroponics. Soil Sci. Plant Nutr. 2011, 57, 190–203. [Google Scholar] [CrossRef]
- Atkin, K.; Nichols, M.A. Organic hydroponics. Acta Hort. 2004, 648, 121–127. [Google Scholar] [CrossRef]
- Seawright, D.E.; Stickney, R.R.; Walker, R.B. Nutrient dynamics in integrated aquaculture–hydroponics systems. Aquaculture 1998, 160, 215–237. [Google Scholar] [CrossRef]
- Rakocy, J.E.; Masser, M.P.; Losordo, T.M. Recirculating Aquaculture Tank Production Systems: Aquaponics–Integrating Fish and Plant Culture; SRAC Publication: Stoneville, MS, USA, 2006; pp. 1–16. [Google Scholar]
- Roosta, H.R. Comparison of the vegetative growth, eco-physiological characteristics and mineral nutrient content of basil plants in different irrigation ratios of hydroponic: Aquaponic solutions. J. Plant Nutr. 2014, 37, 1782–1803. [Google Scholar] [CrossRef]
- Schmautz, Z.; Graber, A.; Mathis, A.; Griessler Bulc, T.; Junge, R. Tomato production in aquaponic system: Mass balance and nutrient recycling. In Aquaculture Europe 15; EAS (European Aquaculture Society): Rotterdam, The Netherlands, 2015; Available online: https://www.was.org/easonline/AbstractDetail.aspx?i=4340 (accessed on 15 October 2017).
- Ako, H.; Baker, A. Small-scale lettuce production with hydroponics or aquaponics. Sustain. Agric. 2009, 2, 1–7. [Google Scholar]
- Goddek, S.; Delaide, B.; Mankasingh, U.; Ragnarsdottir, K.; Jijakli, H.; Thorarinsdottir, R. Challenges of sustainable and commercial aquaponics. Sustainability 2015, 7, 4199–4224. [Google Scholar] [CrossRef]
- Rakocy, J.E.; Bailey, D.S.; Shultz, K.A.; Cole, W.M. Evaluation of a commercial-scale aquaponic unit for the production of tilapia and lettuce. In Proceedings of the 4th International Symposium on Tilapia in Aquaculture, Orlando, FL, USA, 1 January 1997; pp. 603–612. [Google Scholar]
- Chen, X.G.; Gastaldi, C.; Siddiqi, M.Y.; Glass, A.D.M. Growth of a lettuce crop at low ambient nutrient concentrations: A strategy designed to limit the potential for eutrophication. J. Plant Nutr. 1997, 20, 1403–1417. [Google Scholar] [CrossRef]
- BC Ministry of Agriculture. Environmental Guidelines for Greenhouse Growers in British Columbia; BC Ministry of Agriculture, Fisheries and Food, Resource Management Branch: Abbotsford, BC, Canada, 1994.
- Bittsanszky, A.; Uzinger, N.; Gyulai, G.; Mathis, A.; Junge, R.; Kotzen, B.; Komives, T. Nutrient supply of plants in aquaponic systems. Ecocycles 2016, 2, 17–20. [Google Scholar] [CrossRef]
- Nichols, M.A.; Savidov, N.A. Aquaponics: A nutrient and water efficient production system. In Proceedings of the II International Symposium on Soilless Culture and Hydroponics, Puebla, Mexico, 15–19 May 2011; pp. 129–132. [Google Scholar]
- Cakmak, I.; Hengeler, C.; Marschner, H. Partitioning of shoot and root dry-matter and carbohydrates in bean plants suffering from phosphorus-, potassium- and magnesium-deficiency. J. Exp. Bot. 1994, 278, 1245–1250. [Google Scholar] [CrossRef]
- Hermans, C.; Hammond, J.P.; White, P.J.; Verbruggen, N. How do plants respond to nutrient shortage by biomass allocation? Trends Plant Sci. 2006, 12, 610–617. [Google Scholar] [CrossRef] [PubMed]
- Fernandez, M.C.; Rubio, G. Root morphological traits related to phosphorus-uptake efficiency of soybean, sunflower, and maize. J. Plant Nutr. Soil Sci. 2015, 5, 807–815. [Google Scholar] [CrossRef]
- Buwalda, F.; Warmenhoven, M. Growth-limiting phosphate nutrition suppresses nitrate accumulation in greenhouse lettuce. J. Exp. Bot. 1999, 335, 813–821. [Google Scholar] [CrossRef]
- Habermeyer, M.; Roth, A.; Guth, S.; Diel, P.; Engel, K.H.; Epe, B.; Fürst, P.; Heinz, V.; Humpf, H.U.; Joost, H.G.; et al. Nitrate and nitrite in the diet: How to assess their benefit and risk for human health. Mol. Nutr. Food Res. 2015, 59, 106–128. [Google Scholar] [CrossRef] [PubMed]
- Ashworth, A.; Mitchell, K.; Blackwell, J.R.; Vanhatalo, A.; Jones, A.M. High-nitrate vegetable diet increases plasma nitrate and nitrite concentrations and reduces blood pressure in healthy women. Public Health Nutr. 2015, 14, 2669–2678. [Google Scholar] [CrossRef] [PubMed]
- Commission Regulation (EU) No 1258/2011 of 2 December 2011 Amending Regulation (EC) No 1881/2006 as Regards Maximum Levels for Nitrates in Foodstuffs. Available online: https://www.fsai.ie/uploadedFiles/Reg1258_2011.pdf (accessed on 15 October 2017).
- Santamaria, P.; Elia, A.; Gonnella, M.; Parente, A.; Serio, F. Ways of reducing rocket salad nitrate content. Acta Hortic. 2001, 548, 529–537. [Google Scholar] [CrossRef]
- Umar, A.S.; Iqbal, M. Nitrate accumulation in plants, factors affecting the process, and human health implications. A review. Agron. Sustain. Dev. 2007, 27, 45–57. [Google Scholar] [CrossRef]
- Stagnari, F.; Galieni, A.; Pisante, M. Shading and nitrogen management affect quality, safety and yield of greenhouse-grown leaf lettuce. Sci. Hortic. 2015, 192, 70–79. [Google Scholar] [CrossRef]
- Jeschke, W.D.; Kirkby, E.A.; Peuke, A.D.; Pate, J.S.; Hartung, W. Effects of P deficiency on assimilation and transport of nitrate and phosphate in intact plants of castor bean (Ricinus communis L.). J. Exp. Bot. 1997, 48, 75–91. [Google Scholar] [CrossRef]
- De Groot, C.C.; Marcelis, L.F.M.; Van Den Boogaard, R.; Kaiser, W.M.; Lambers, H. Interaction of nitrogen and phosphorus nutrition in determining growth. Plant Soil 2003, 248, 257–268. [Google Scholar] [CrossRef]
- Zhaohui, W.; Shengxiu, L. Effects of nitrogen and phosphorus fertilization on plant growth and nitrate accumulation in vegetables. J. Plant Nutr. 2004, 3, 539–556. [Google Scholar] [CrossRef]
- Pavlou, G.C.; Ehaliotis, C.D.; Kavvadias, V.A. Effect of organic and inorganic fertilizers applied during successive crop seasons on growth and nitrate accumulation in lettuce. Sci. Hortic. 2007, 111, 319–325. [Google Scholar] [CrossRef]
- Blom-Zandstra, M. Nitrate accumulation in vegetables and its relationship to quality. Ann. Appl. Biol. 1989, 115, 553–561. [Google Scholar] [CrossRef]
- De Pinheiro Henriques, A.R.; Marcelis, L.F.M. Regulation of growth at steady-state nitrogen nutrition in lettuce (Lactuca sativa, L.): Interactive effects of nitrogen and irradiance. Ann. Bot. 2000, 86, 1073–1080. [Google Scholar] [CrossRef]
- He, J.; Lim, L.I.; Qin, L. Growth irradiance effects on productivity, photosynthesis, nitrate accumulation and assimilation of aeroponically grown Brassica alboglabra. J. Plant Nutr. 2015, 7, 1022–1035. [Google Scholar] [CrossRef]
- Pant, B.D.; Pant, P.; Erban, A.; Huhman, D.; Kopka, J.; Scheible, W.R. Identification of primary and secondary metabolites with phosphorus status-dependent abundance in Arabidopsis, and of the transcription factor PHR1 as a major regulator of metabolic changes during phosphorus limitation. Plant Cell Environ. 2015, 38, 172–187. [Google Scholar] [CrossRef] [PubMed]
- Priestley, C.A. Bases for the expression of the results of chemical analyses of plant tissue. Ann. Bot. 1973, 37, 943–953. [Google Scholar] [CrossRef]
- Sørensen, J.N.; Johansen, A.S.; Poulsen, N. Influence of growth conditions on the value of crisphead lettuce 1. Marketable and nutritional quality as affected by nitrogen supply, cultivar and plant age. Plant Food Hum. Nutr. 1994, 46, 1–11. [Google Scholar] [CrossRef]
- Behr, U.; Wiebe, H.-J. Relation between photosynthesis and nitrate content of lettuce cultivars. Sci. Hortic. 1992, 49, 175–179. [Google Scholar] [CrossRef]
- Aherne, S.A.; O’Brien, N.M. Dietary flavonols: Chemistry, food content, and metabolism. Nutrition 2002, 18, 75–81. [Google Scholar] [CrossRef]
- Herrmann, K. Flavonols and flavones in food plants: A review. Int. J. Food Sci. Technol. 1976, 11, 433–448. [Google Scholar] [CrossRef]
- Winkel-Shirley, B. Biosynthesis of flavonoids and effects of stress. Curr. Opin. Plant Biol. 2002, 5, 218–223. [Google Scholar] [CrossRef]
- Kaliora, A.C.; Batzaki, C.; Christea, M.G.; Kalogeropoulos, N. Nutritional evaluation and functional properties of traditional composite salad dishes. LWT-Food Sci. Technol. 2015, 62, 775–782. [Google Scholar] [CrossRef]
- Dixon, R.A.; Paiva, N.L. Stress-induced phenylpropanoid metabolism. Plant Cell 1995, 7, 1085–1097. [Google Scholar] [CrossRef] [PubMed]
- Alarcón-Flores, M.I.; Romero-González, R.; Vidal, J.L.M.; Frenich, A.G. Multiclass determination of phenolic compounds in different varieties of tomato and lettuce by ultra-high performance liquid chromatography coupled to tandem mass spectrometry. Food Chem. 2013, 141, 1120–1129. [Google Scholar] [CrossRef] [PubMed]
- Oh, M.-M.; Carey, E.E.; Rajashekar, C.B. Environmental stresses induce health-promoting phytochemicals in lettuce. Plant Physiol. Biochem. 2009, 47, 578–583. [Google Scholar] [CrossRef] [PubMed]
- Kaufman, G. Seed coating: A tool for stand establishment; a stimulus to seed quality. HortTechnology 1991, 1, 98–102. [Google Scholar]
- Fernandez, D. HydroBuddy: An Open Source Nutrient Calculator for Hydroponics and General Agriculture. v1.5. 2013. Available online: http://scienceinhydroponics.com (accessed on 23 May 2015).
- Cerovic, Z.G.; Ghozlen, N.B.; Milhade, C.; Obert, M.; Debuisson, S.; Moigne, M.L. Nondestructive diagnostic test for nitrogen nutrition of grapevine (Vitis vinifera L.) based on dualex leaf-clip measurements in the field. J. Agric. Food Chem. 2015, 63, 3669–3680. [Google Scholar] [CrossRef] [PubMed]
- Cantwell, M.; Reid, M.S. Postharvest physiology and handling of fresh culinary herbs. J. Herbs Spices Med. Plants 1993, 1, 93–126. [Google Scholar] [CrossRef]
Figure 1.
Plant root zone temperature (°C) in aquaponic systems A (red), B (green), and C (blue), and in hydroponic system D (grey).
Figure 1.
Plant root zone temperature (°C) in aquaponic systems A (red), B (green), and C (blue), and in hydroponic system D (grey).

Figure 2.
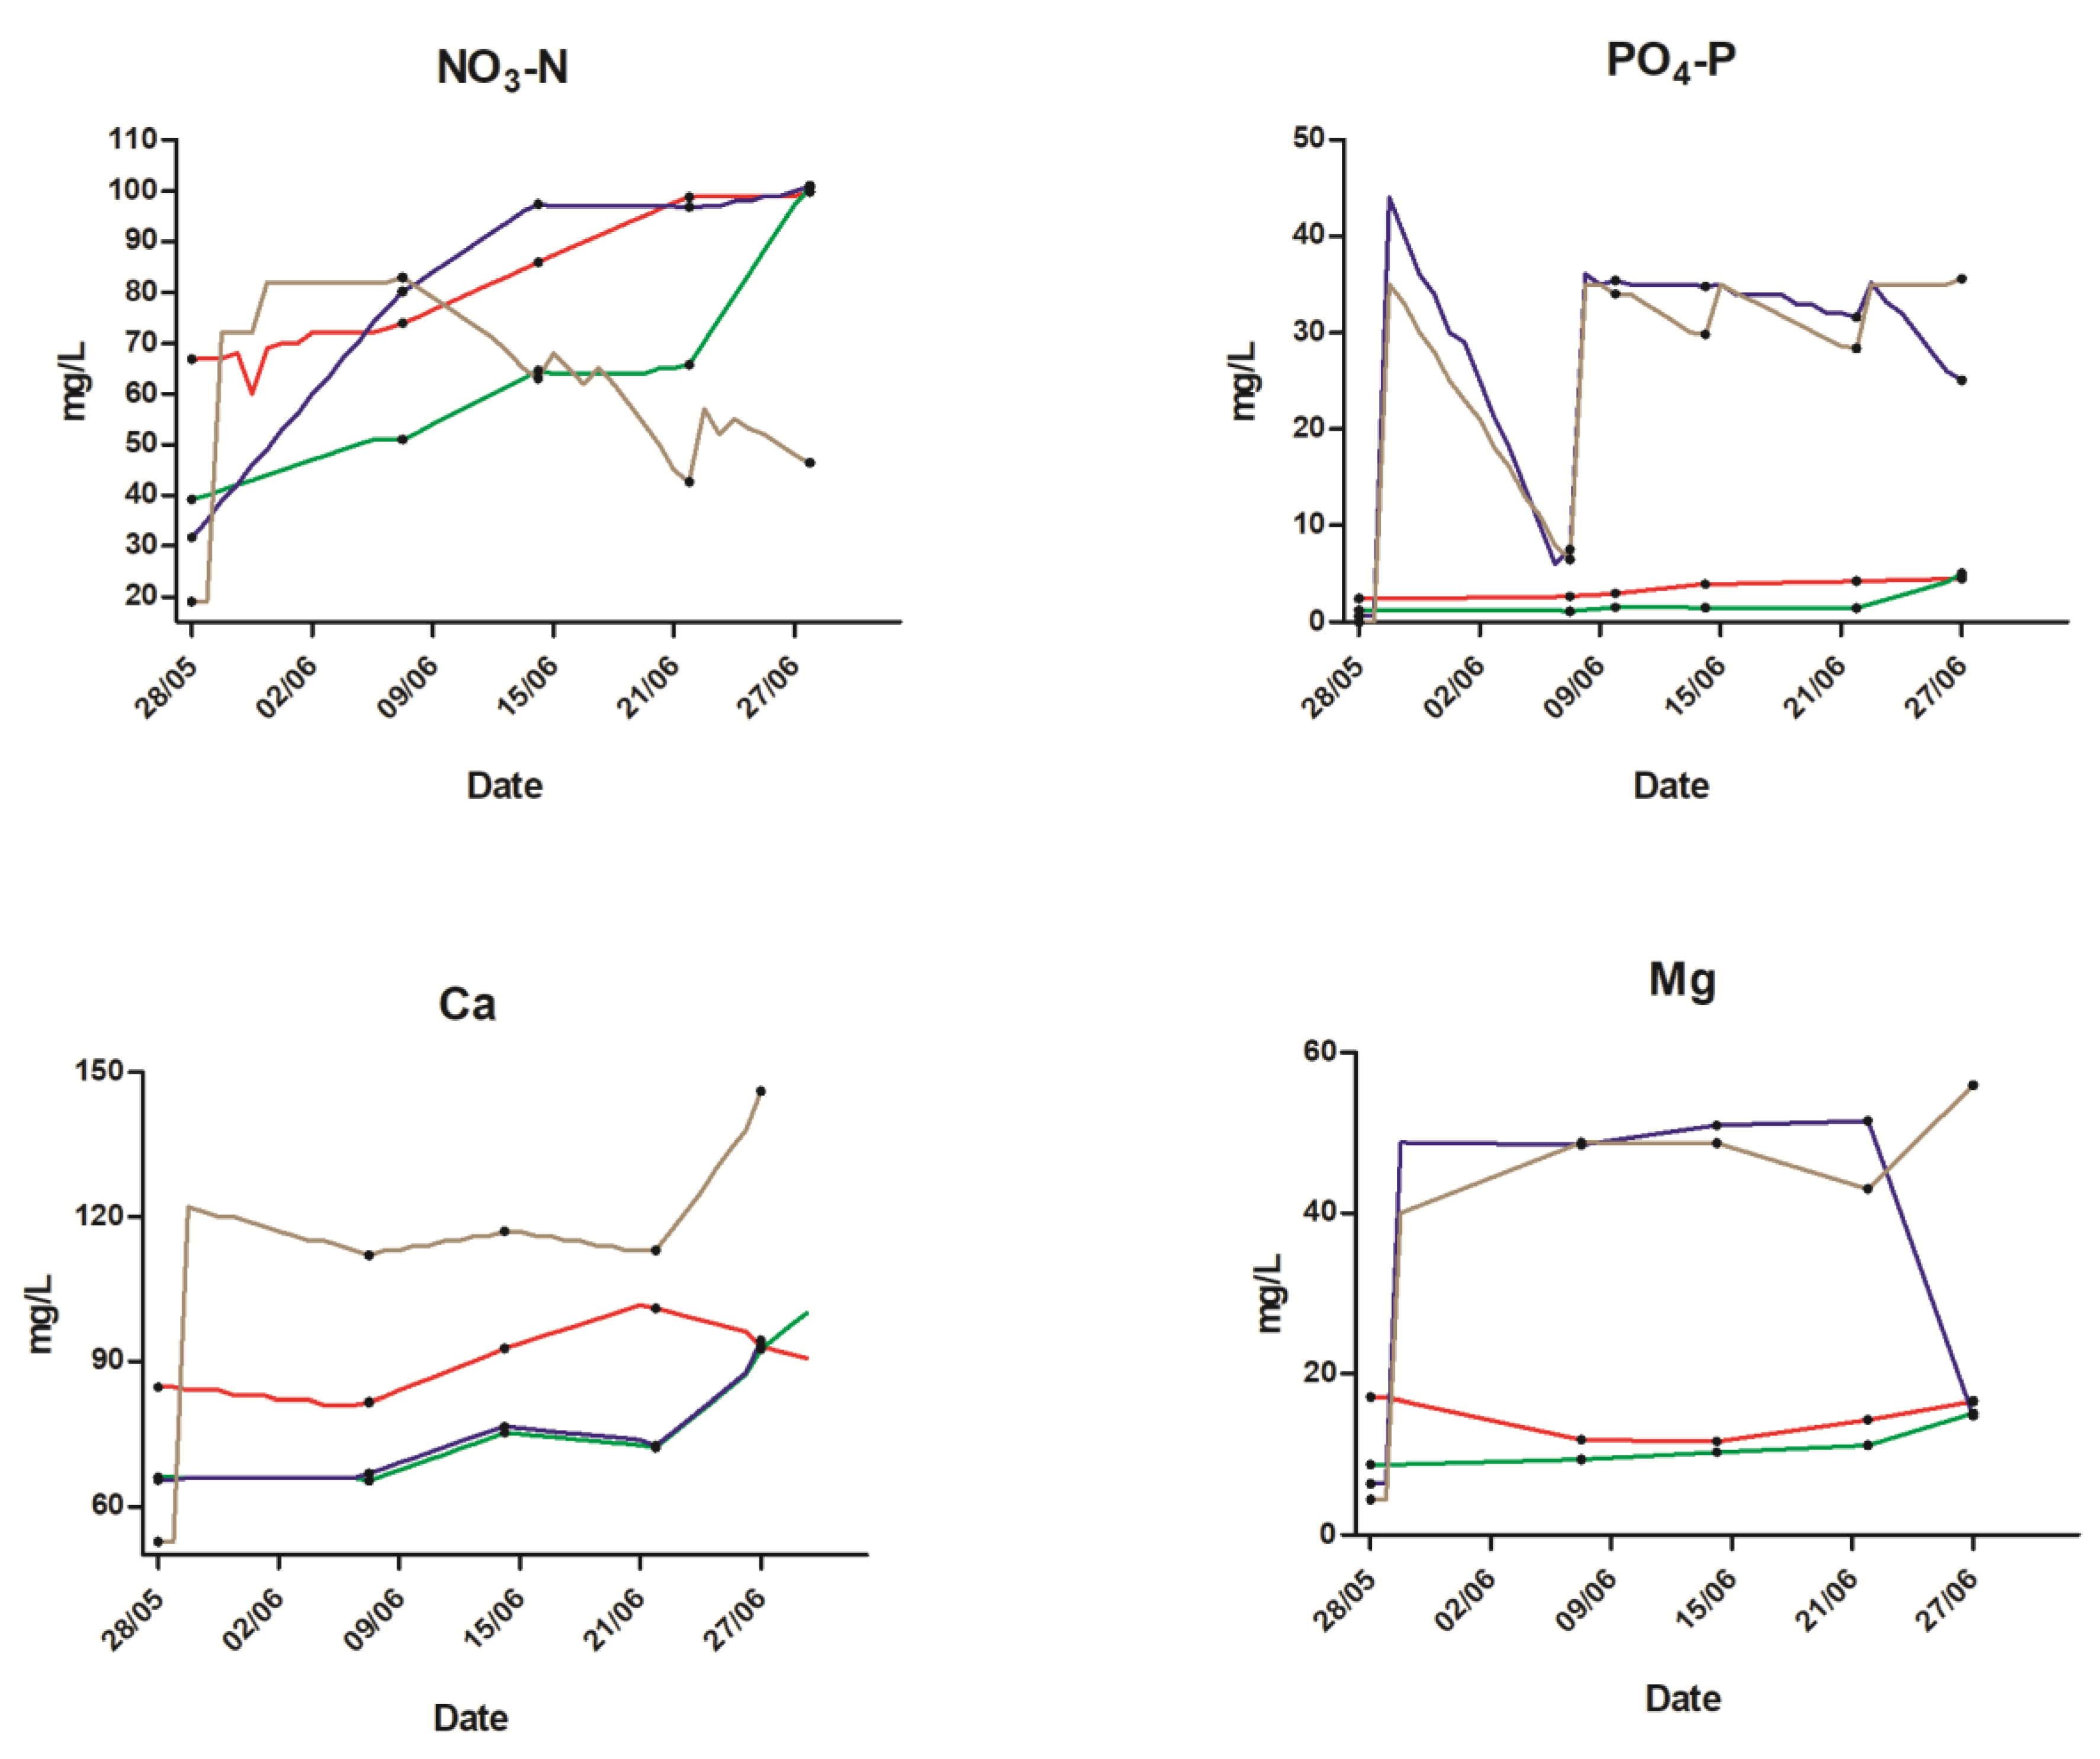
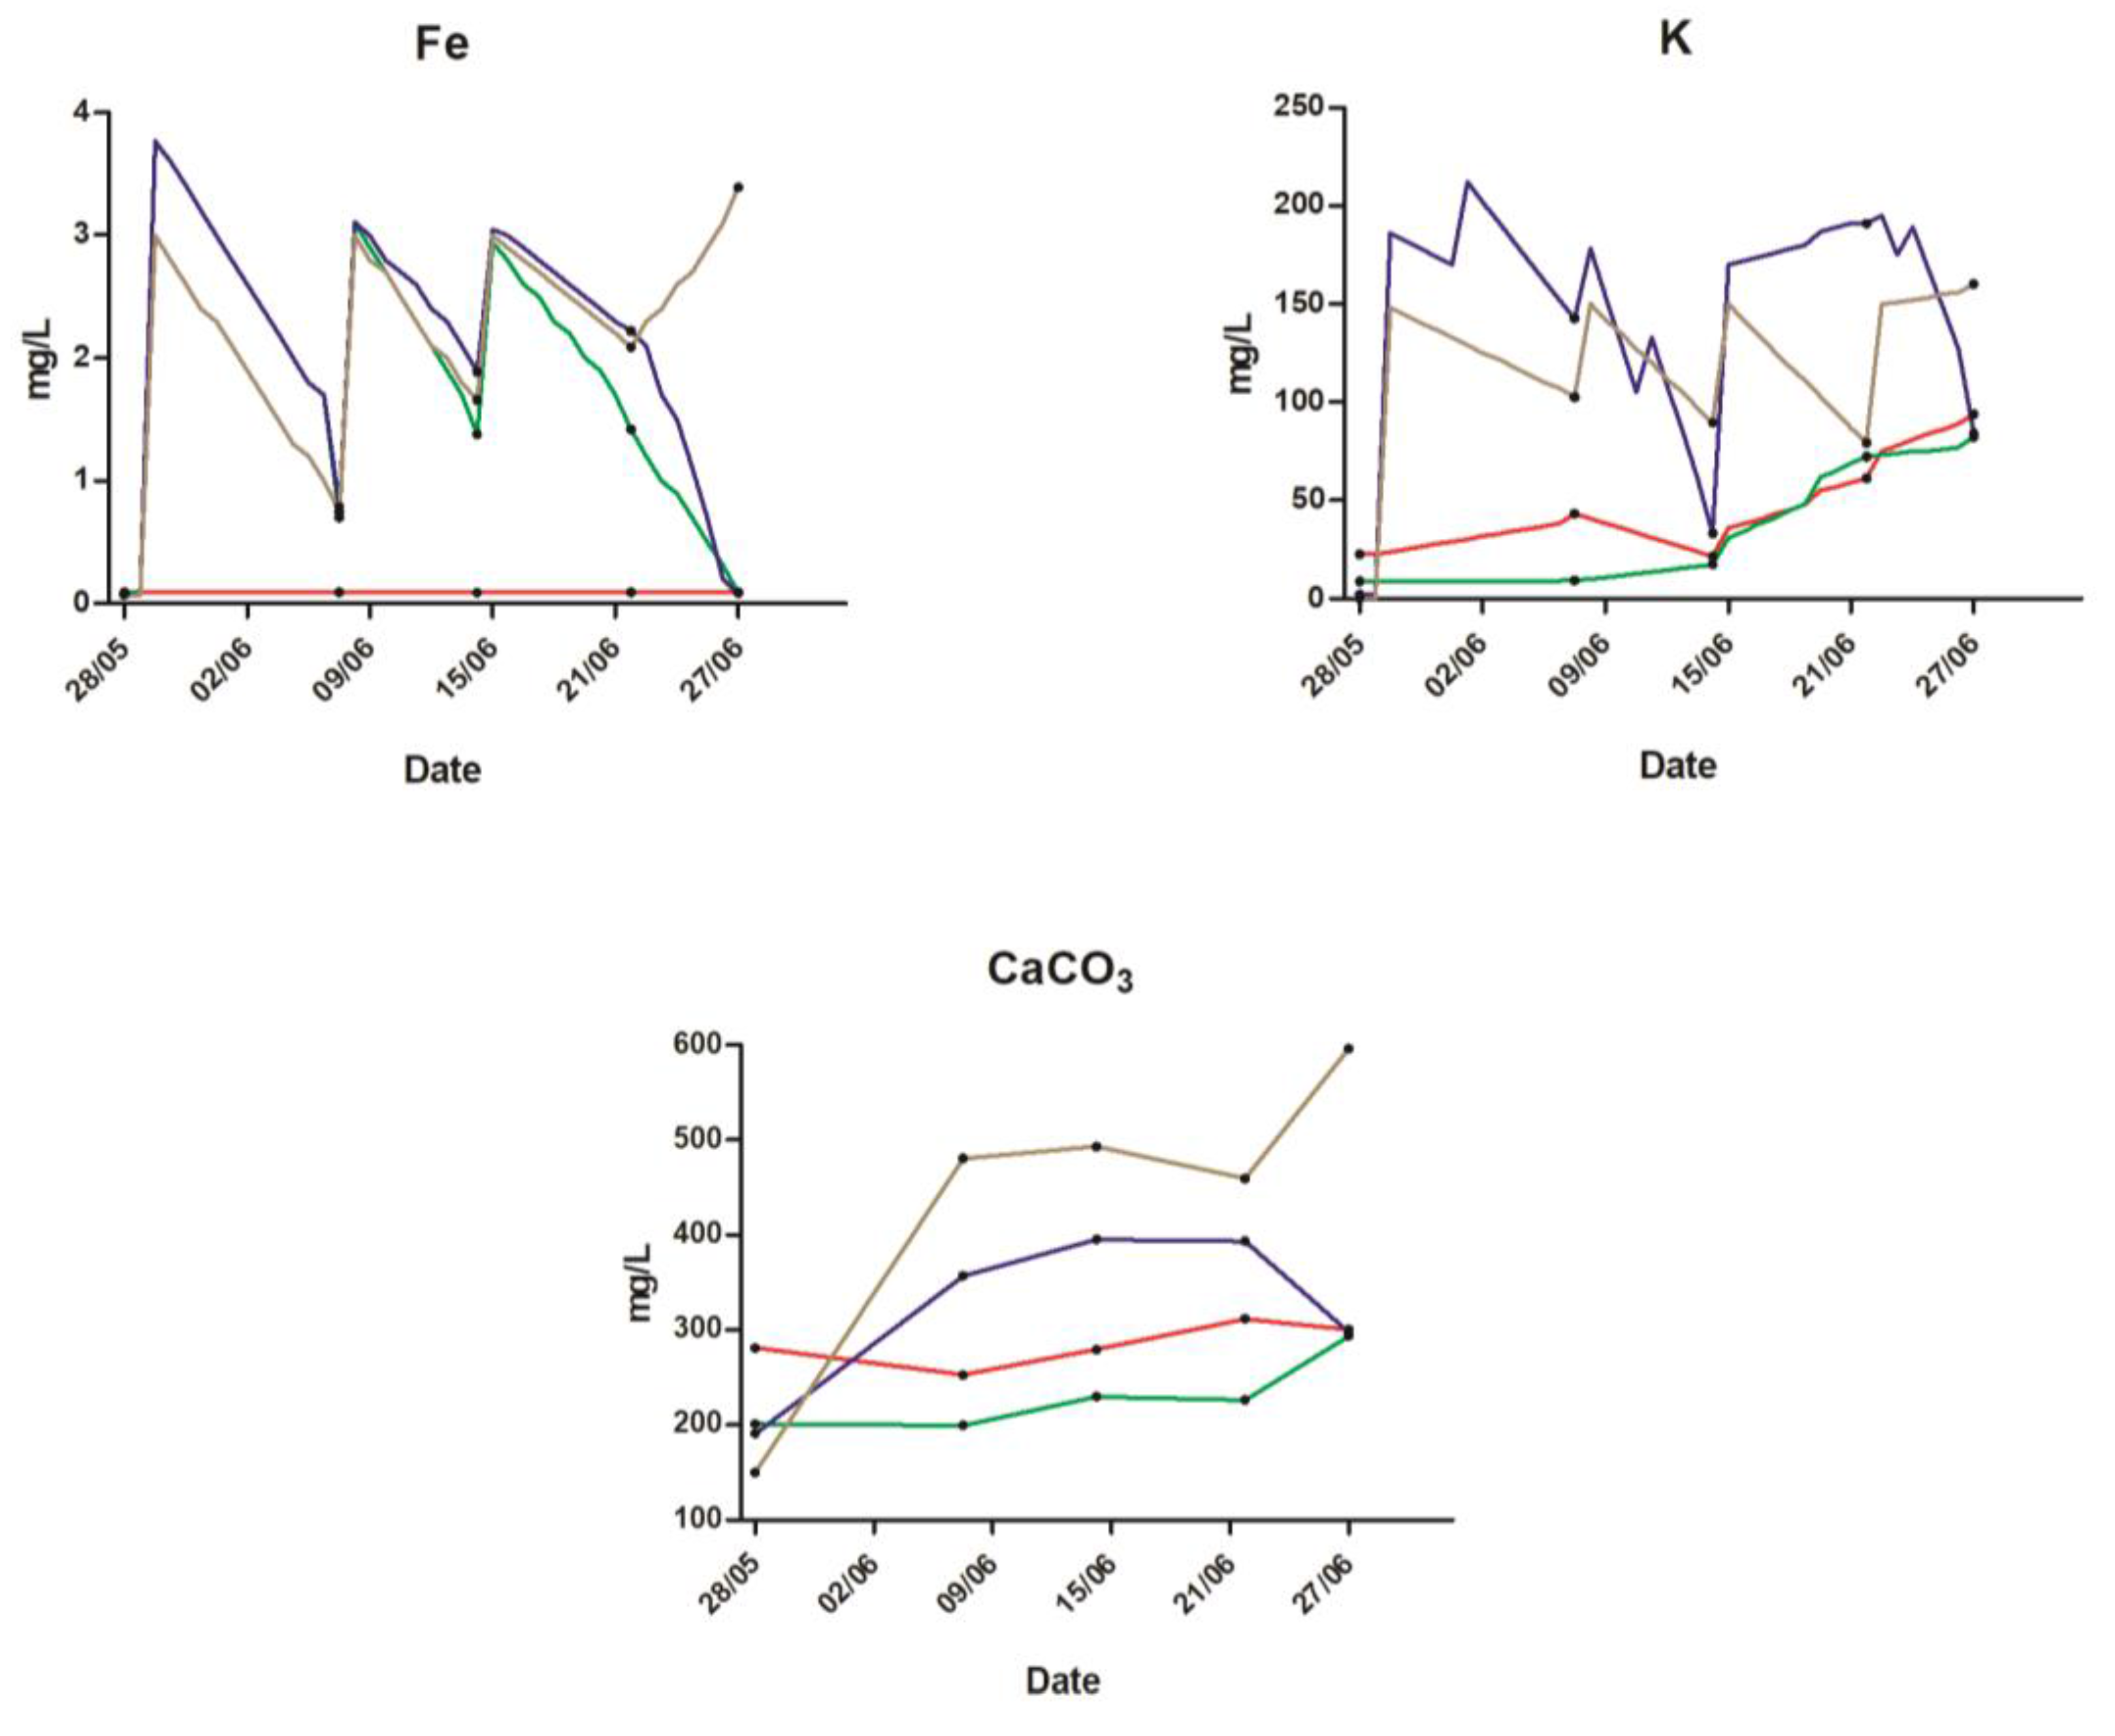
Concentrations of NO3-N, PO4-P, Ca, Mg, Fe, K, and CaCO3 (water hardness) in systems A (red), B (green), C (blue), and D (brown). Starting measurements show the baseline fish water quality before starting the experiments. Symbols (dots) represent measured values; based on these, fertilizer supplements were calculated in order to achieve the target values. The most probable progressions of concentrations were calculated and depicted with lines. The graph depicting water hardness reports only measured values, since there were no target values.
Figure 2.
Concentrations of NO3-N, PO4-P, Ca, Mg, Fe, K, and CaCO3 (water hardness) in systems A (red), B (green), C (blue), and D (brown). Starting measurements show the baseline fish water quality before starting the experiments. Symbols (dots) represent measured values; based on these, fertilizer supplements were calculated in order to achieve the target values. The most probable progressions of concentrations were calculated and depicted with lines. The graph depicting water hardness reports only measured values, since there were no target values.


Figure 3.
Root-to-shoot ratio in lettuce, mint, and mushroom herb in all four systems. Values are means ± SD. Different lower-case letters indicate significant differences (p < 0.05); n = 6.
Figure 3.
Root-to-shoot ratio in lettuce, mint, and mushroom herb in all four systems. Values are means ± SD. Different lower-case letters indicate significant differences (p < 0.05); n = 6.

Figure 4.
Chlorophyll content (CHL), phenolic compounds (FLAV), and chlorophyll to flavonol ratios (NBI) measured in lettuce and mint leaves in each experimental group. Values are means ± SD. Different lower-case letters indicate significant differences (p < 0.05); n = 6.
Figure 4.
Chlorophyll content (CHL), phenolic compounds (FLAV), and chlorophyll to flavonol ratios (NBI) measured in lettuce and mint leaves in each experimental group. Values are means ± SD. Different lower-case letters indicate significant differences (p < 0.05); n = 6.
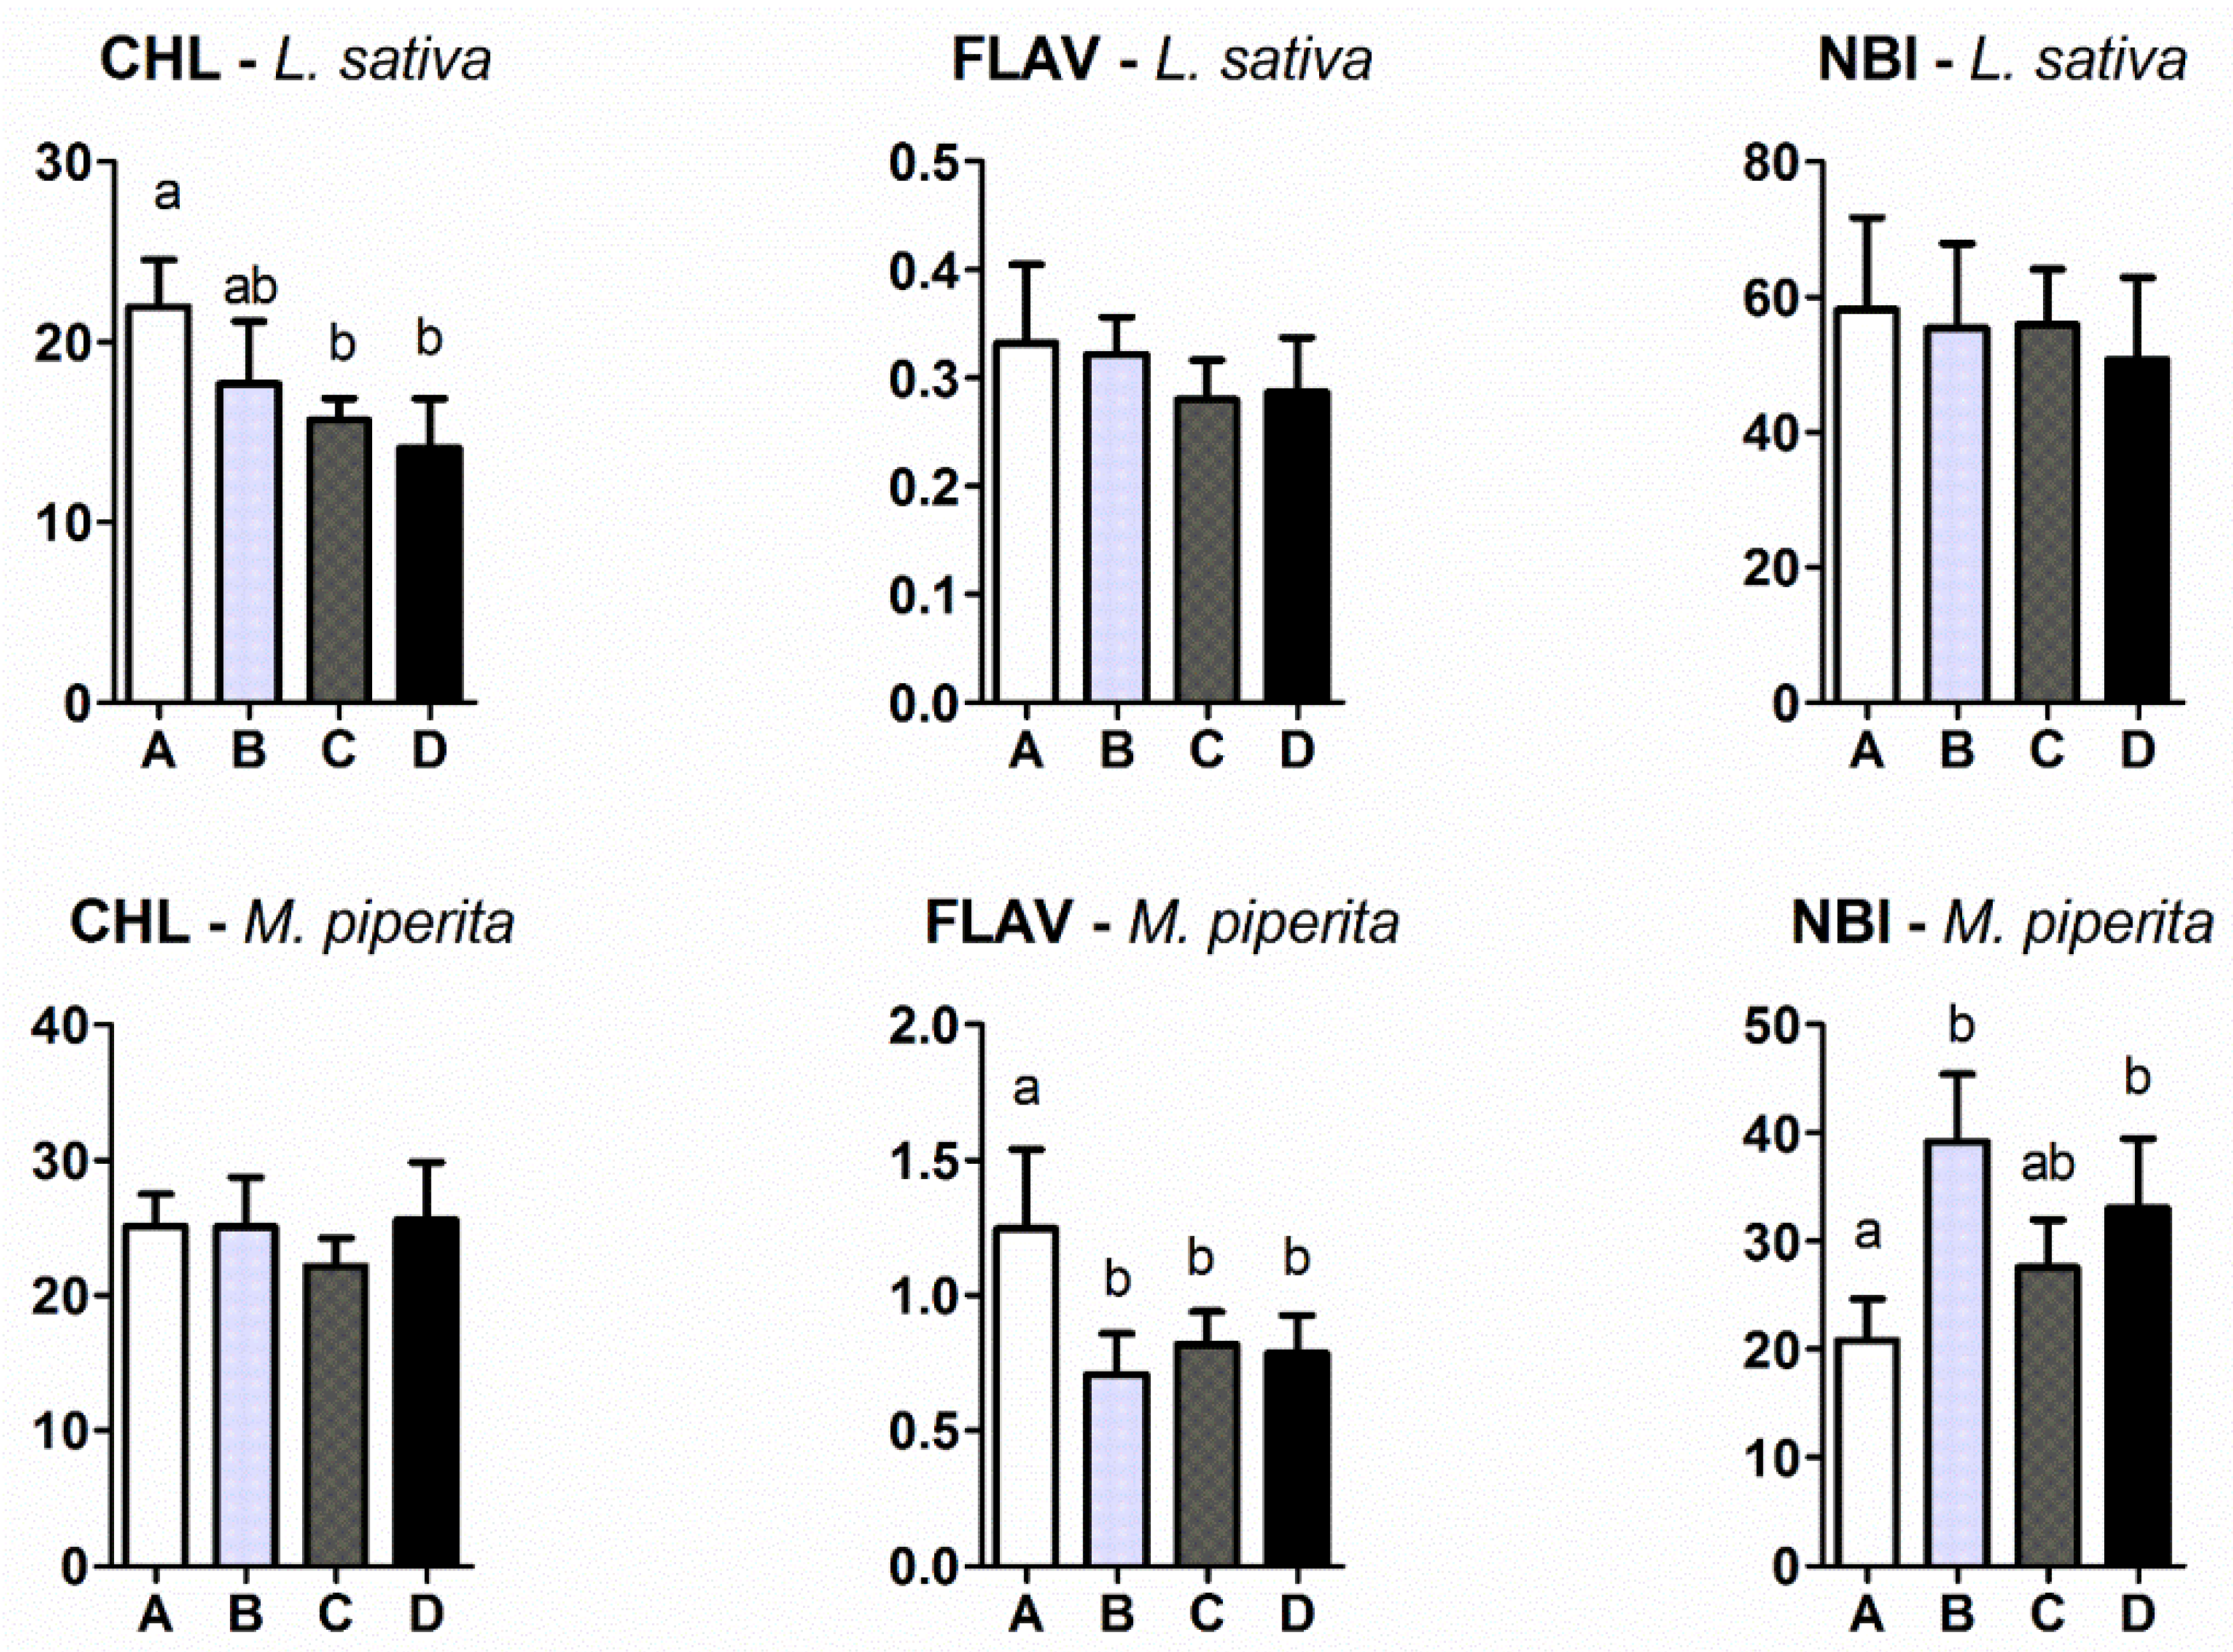
Figure 5.
Nitrate content (mg kg−1) in lettuce, mint and mushroom herb leaves from the different experimental groups. Values are means ± SD. Different lower-case letters indicate significant differences (p < 0.05); n = 3.
Figure 5.
Nitrate content (mg kg−1) in lettuce, mint and mushroom herb leaves from the different experimental groups. Values are means ± SD. Different lower-case letters indicate significant differences (p < 0.05); n = 3.
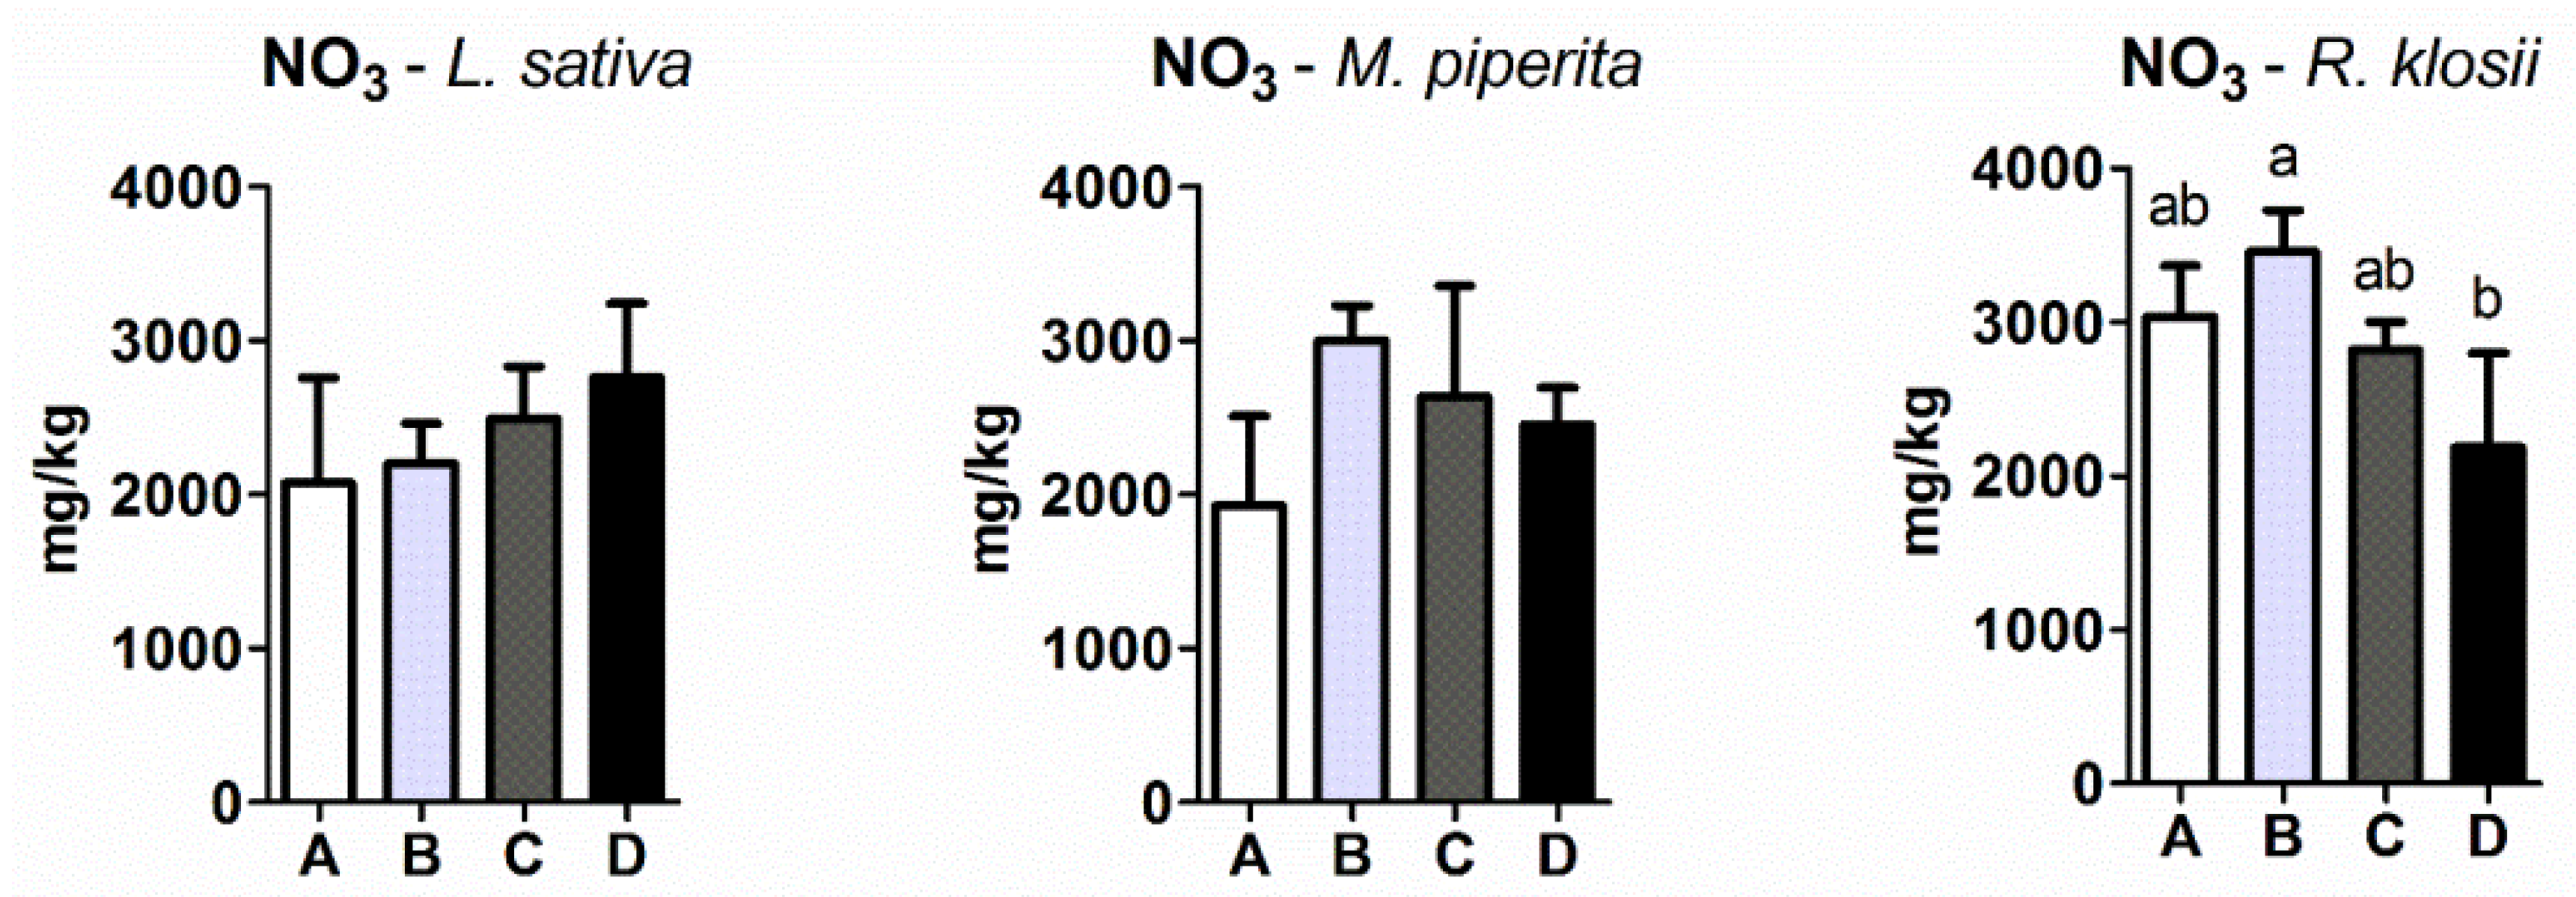
Figure 6.
Biomass composition of the lettuce, mint and mushroom herbs in the experimental groups. Values are means ± SD. Different lowercase letters indicate significant differences (p < 0.05). (Left) Dry weight fraction of the total fresh biomass in the shoots and roots (n = 6). (Right): Carbon to nitrogen atomic ratio (n = 3).
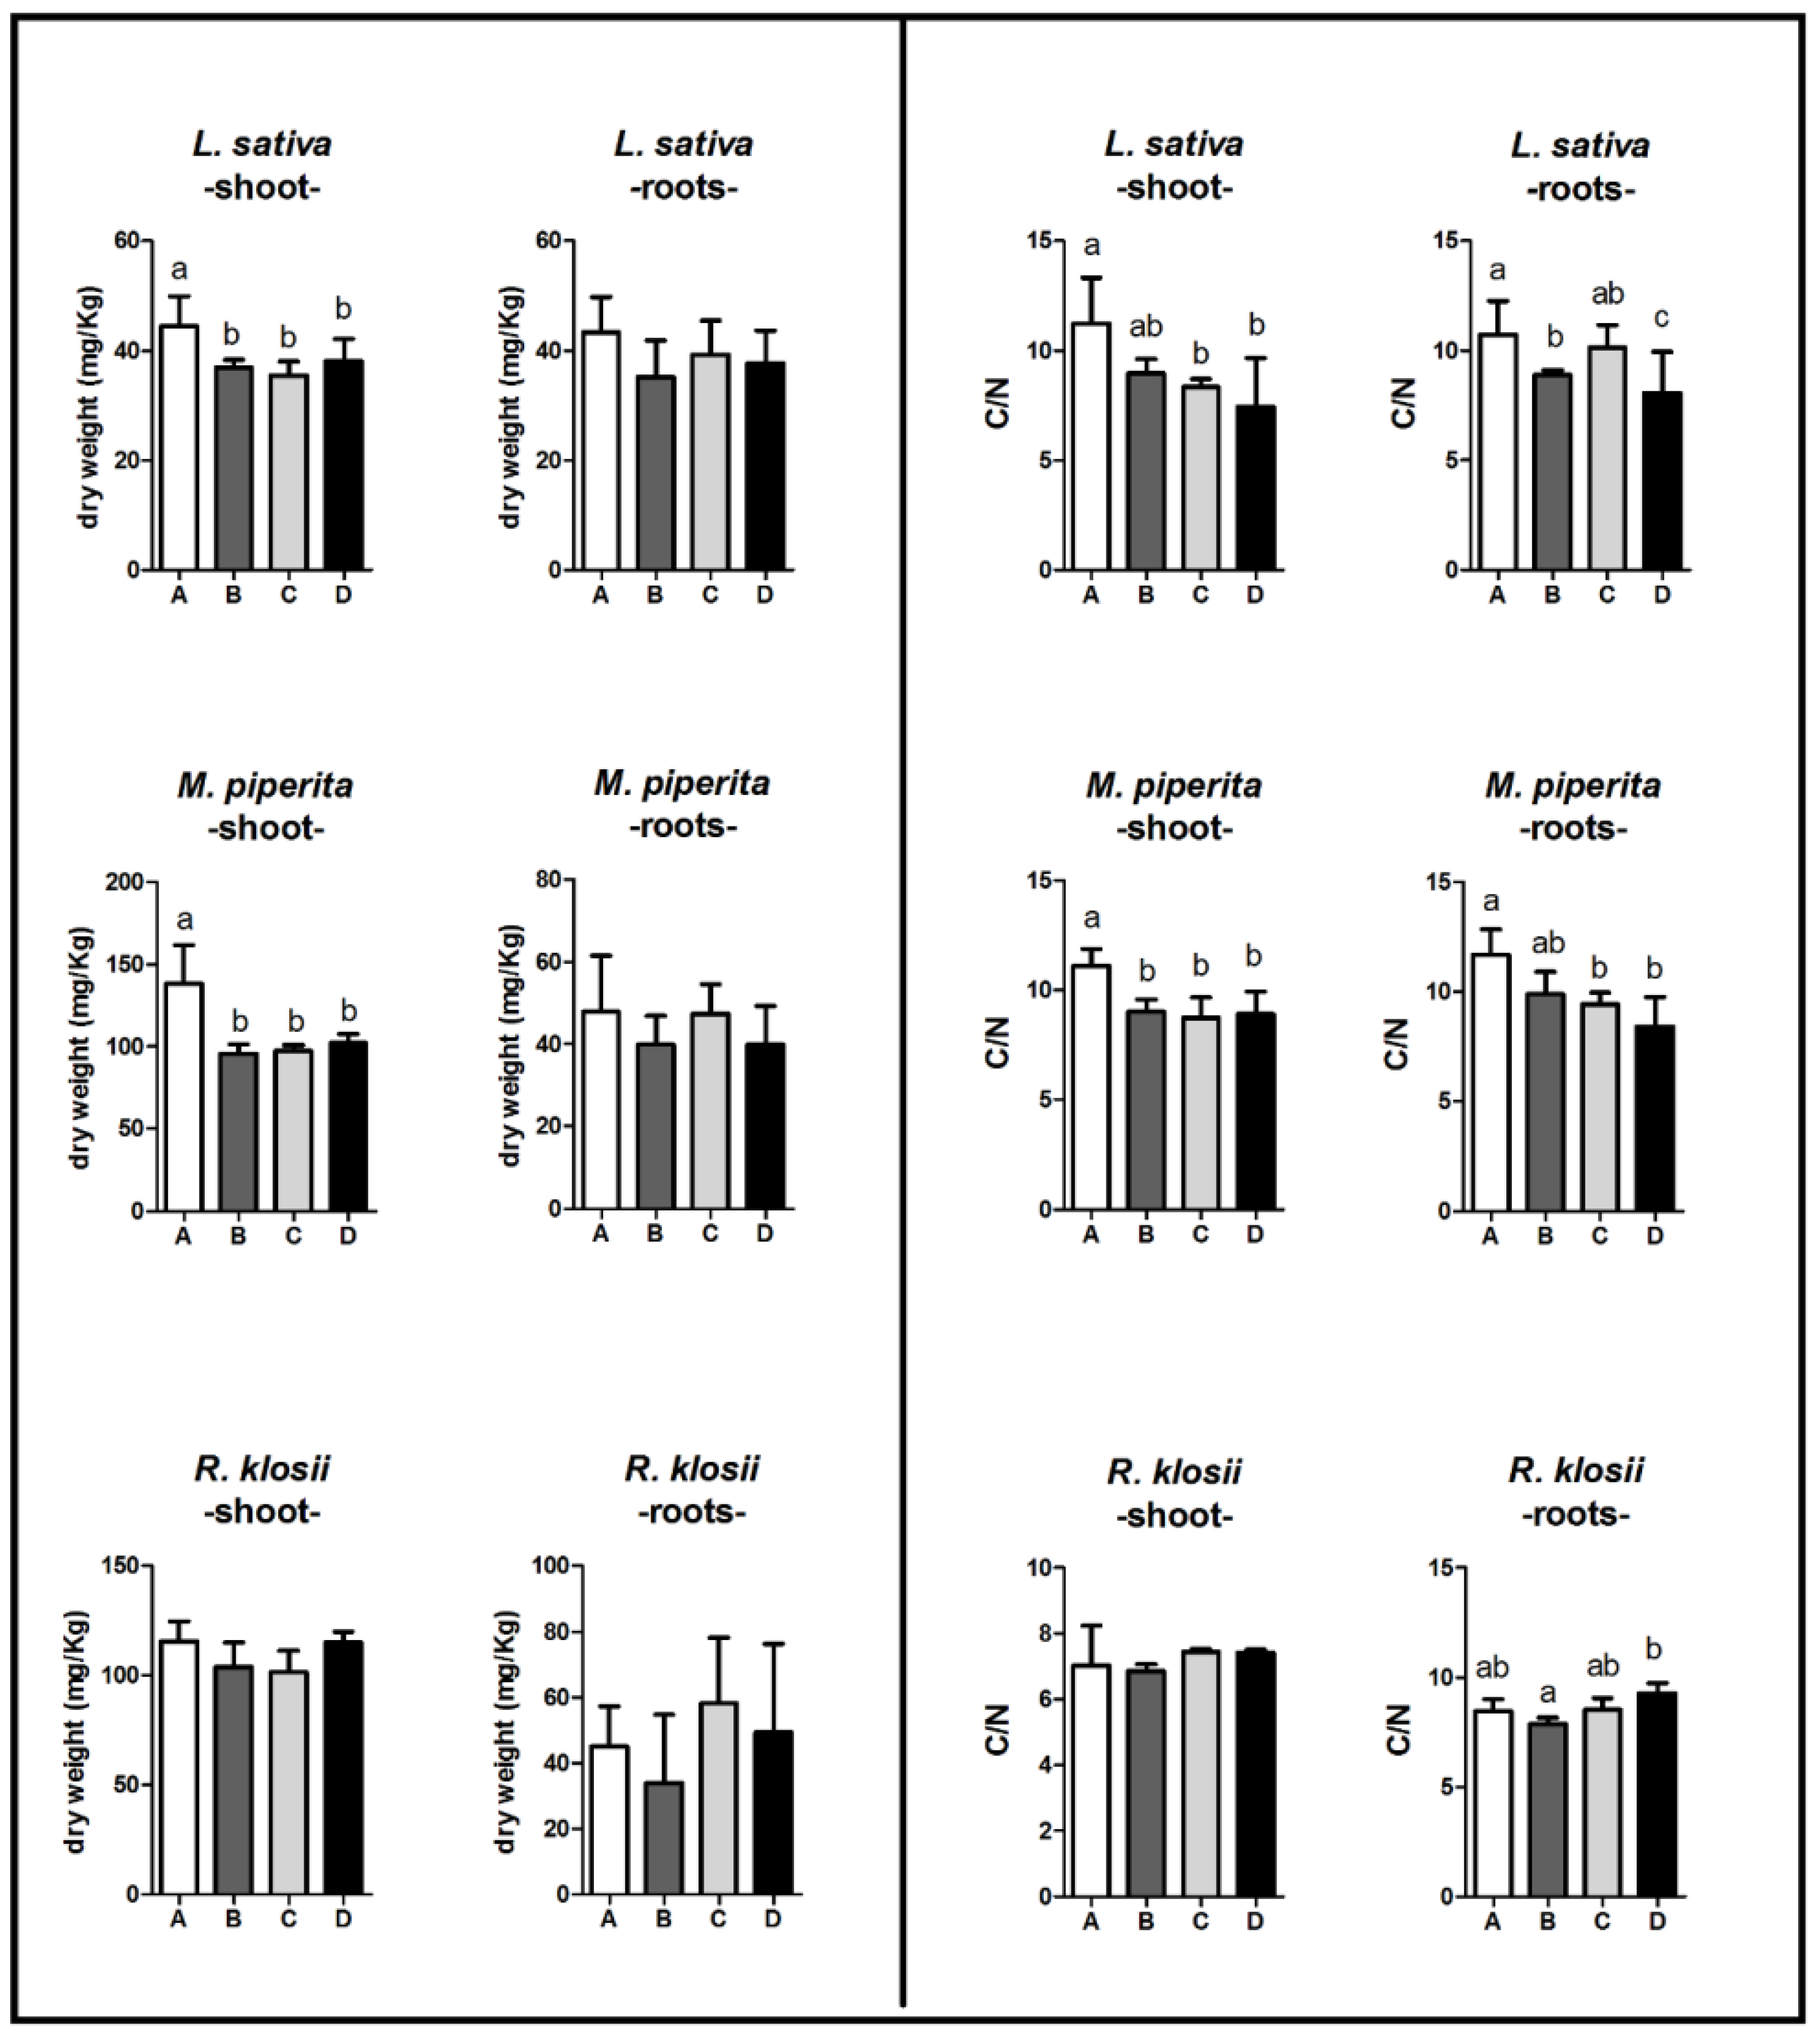
Figure 7.
Illustration of the aquaponic (A, B, C) and hydroponic (D) experimental units with water flows.
Figure 7.
Illustration of the aquaponic (A, B, C) and hydroponic (D) experimental units with water flows.


Table 1.
Recorded water quality and calculated average nutrient concentration in each system.
| Parameter | n | A | B | C | D |
|---|---|---|---|---|---|
| NH4-N (mg L−1) | 3 | 0.15 | 0.15–1.05 | 0.11–0.15 | 0.03–0.06 |
| NO2-N (mg L−1) | 3 | 0.03 | 0.03–0.04 | 0.01–0.02 | 0.25–0.04 |
| pH | 10 | 5.1–6.9 | 5.0–7.3 | 5.0–6.5 | 5.9–7.4 |
| O2 (mgL−1) | 10 | 7.5–8.3 | 7.1–8.6 | 6.6–8.4 | 5.9–7.6 |
| EC (µS cm−1) | 10 | 760–1042 | 550–1099 | 1483–1858 | 1234–1622 |
| T in fish tank (°C) | 10 | 25.8–29.8 | 24.8–28.4 | 25.5–28.8 | - |
| Average T in root zone (°C) | >1000 | 23.5 | 23.9 | 23.2 | 22.9 |
| NO3-N (mg L−1) | 84 | 62 | 82 | 63 | |
| PO4-P (mg L−1) | 3.5 | 1.9 | 28 | 28 | |
| K (mg L−1) | 48 | 35 | 146 | 123 | |
| Fe (mg L−1) | 0.1 | 1.8 | 2.1 | 2.3 | |
| Ca (mg L−1) | 90 | 74 | 74 | 117 | |
| Mg (mg L−1) | 15 | 11 | 32 | 35 |
Table 2.
Tilapia growth in three identical aquaponic systems, and calculation of feed conversion ratio (kgfeed/kgfish biomass).
Table 2.
Tilapia growth in three identical aquaponic systems, and calculation of feed conversion ratio (kgfeed/kgfish biomass).
| Date/Duration | Parameters | Tank A | Tank B | Tank C |
|---|---|---|---|---|
| 4 May 2015 | Number of fish | 50 | 50 | 50 |
| Total weight (kg) | 12.40 | 10.82 | 11.31 | |
| Average weight per fish (kg) | 0.248 | 0.216 | 0.226 | |
| 30 June 2015 | Number | 49 | 50 | 50 |
| Total weight (kg) | 24.11 | 21.03 | 24.20 | |
| Average weight per fish (kg) | 0.492 | 0.421 | 0.484 | |
| 57 days | Average weight gain per fish (kg) | 0.244 | 0.205 | 0.258 |
| Total fish biomass produced (kg) | 11.96 | 10.25 | 12.90 | |
| Specific growth rate (%/day) | 1.20 | 1.17 | 1.33 | |
| Feed conversion ratio (FCR) | 1.25 | 1.49 | 1.16 |
Table 3.
Fresh biomass at harvest for the production of lettuce, mint, and mushroom herbs in all of the systems. Relative production was calculated separately as the fraction of the highest production value for each species.
Table 3.
Fresh biomass at harvest for the production of lettuce, mint, and mushroom herbs in all of the systems. Relative production was calculated separately as the fraction of the highest production value for each species.
| Production Parameters | Lactuca sativa | Mentha piperita | Rungia klossii | |||||||||
|---|---|---|---|---|---|---|---|---|---|---|---|---|
| A | B | C | D | A | B | C | D | A | B | C | D | |
| Total No. of plants | 36 | 36 | 36 | 36 | 72 | 72 | 72 | 72 | 72 | 72 | 72 | 72 |
| No. of unsellable plants | 1 | / | / | / | 6 | / | / | / | / | / | / | / |
| No. of plants harvested | 35 | 36 | 36 | 36 | 66 | 72 | 72 | 72 | 72 | 72 | 72 | 72 |
| Total biomass (fresh) kg | 9.2 | 10.6 | 13.5 | 12.4 | 7.7 | 11.6 | 10.5 | 9.9 | 1.31 | 1.25 | 0.76 | 0.98 |
| Shoots (fresh) kg | 8.0 | 9.8 | 12.3 | 11.3 | 5.7 | 9.5 | 9.0 | 8.7 | 0.67 | 0.66 | 0.43 | 0.53 |
| Roots (fresh) kg | 1.2 | 0.8 | 1.2 | 1.1 | 2.0 | 2.1 | 1.6 | 1.2 | 0.64 | 0.58 | 0.33 | 0.44 |
| Average shoot weight g | 222.0 | 272.4 | 340.5 | 313.6 | 78.7 | 132.4 | 124.3 | 120.3 | 9.32 | 9.20 | 5.97 | 7.39 |
| Production (shoot) kg m−2 | 4.00 | 4.90 | 6.13 | 5.65 | 3.07 | 4.77 | 4.48 | 4.33 | 0.34 | 0.33 | 0.21 | 0.27 |
| relative production % | 65 | 80 | 100 | 92 | 59 | 100 | 94 | 91 | 100 | 100 | 64 | 79 |
Table 4.
Total input for the four experimental systems (A, B, and C = Aquaponic systems; D = Hydroponic system).
Table 4.
Total input for the four experimental systems (A, B, and C = Aquaponic systems; D = Hydroponic system).
| Elements | Source | Product Name & Supplier | Unit | A | B | C | D |
|---|---|---|---|---|---|---|---|
| (all) | Fish feed | Tilapia Vegi 4.5 mm Hokovit, CH | kg | 9.20 | 9.74 | 9.50 | 0 |
| Zn, B, Mn, Mo, Cu | Micronutrient solution | Multi Micro Mix Ökohum, Langrickenbach, Switzerland | g | 0 | 242 | 242 | 32.9 |
| Fe | Iron DTPA solution | SARL Plantin, France | g | 0 | 558 | 478 | 66.8 |
| P, K | Monopotassium phosphate, KH2PO4 | Krista™-MKP Yara GmbH & Co. KG, Dülmen, Germany | g | 0 | 0 | 1401 | 209 |
| Mg, S | Magnesium sulfate Heptahydrate (MgSO4·7H2O) | Bittersalz, rein technisch K + S KALI GmbH, Kassel, Germany | g | 0 | 0 | 1818 | 228 |
| K, S | Potassium sulfate, K2SO4 | SOP 100% soluble Yara GmbH & Co. KG, D | g | 0 | 0 | 2551 | 353 |
| NO3, Ca | Calcium nitrate, CaNO3 | YaraLiva™ CALCINIT™ Yara GmbH & Co. KG, D | g | 0 | 0 | 0 | 317 |
| KOH | KOH | KOH ≥85 %, Carl Roth GmbH, Karlsruhe, Germany | g | 250 | 200 | 950 | 0 |
| Nitric acid | HNO3 (16%) | Sigma-Aldrich (St. Louis, MO, USA) (FLUKA) | mL | 0 | 0 | 0 | 350 |
© 2018 by the authors. Licensee MDPI, Basel, Switzerland. This article is an open access article distributed under the terms and conditions of the Creative Commons Attribution (CC BY) license (http://creativecommons.org/licenses/by/4.0/).
Share and Cite
MDPI and ACS Style
Nozzi, V.; Graber, A.; Schmautz, Z.; Mathis, A.; Junge, R. Nutrient Management in Aquaponics: Comparison of Three Approaches for Cultivating Lettuce, Mint and Mushroom Herb. Agronomy 2018, 8, 27. https://doi.org/10.3390/agronomy8030027
AMA Style
Nozzi V, Graber A, Schmautz Z, Mathis A, Junge R. Nutrient Management in Aquaponics: Comparison of Three Approaches for Cultivating Lettuce, Mint and Mushroom Herb. Agronomy. 2018; 8(3):27. https://doi.org/10.3390/agronomy8030027
Chicago/Turabian StyleNozzi, Valentina, Andreas Graber, Zala Schmautz, Alex Mathis, and Ranka Junge. 2018. "Nutrient Management in Aquaponics: Comparison of Three Approaches for Cultivating Lettuce, Mint and Mushroom Herb" Agronomy 8, no. 3: 27. https://doi.org/10.3390/agronomy8030027
Note that from the first issue of 2016, this journal uses article numbers instead of page numbers. See further details here.