Article

Phosphate Sources and Their Placement Affecting Soil Phosphorus Pools in Sugarcane

by
Valdevan Rosendo dos Santos
1,
Amin Soltangheisi
2,
Henrique Coutinho Junqueira Franco
3,
Oriel Kolln
3,
André Cesar Vitti
4,
Carlos Tadeu dos Santos Dias
5 and
Paulo Sergio Pavinato
5,*
1
Federal University of Alagoas, Av, Manoel Severino Barbosa Bom Sucesso, Arapiraca, AL 57309-005, Brazil
2
Center for Nuclear Energy in Agriculture (CENA), University of Sao Paulo (USP), Av. Centenário, 303-São Dimas, Piracicaba, SP 13400-970, Brazil
3
Brazilian Bioethanol Science and Technology Laboratory (CTBE), Giuseppe Máximo Scalfaro, 10.000-Guará, Campinas, SP 13083-100, Brazil
4
Agency Paulista for Agribusiness Technology (APTA), Rodovia SP 127, km 30. Bairro: Vila Fátima, Piracicaba, SP 13400-970, Brazil
5
“Luiz de Queiroz” College of Agriculture, University of São Paulo, 11 Pádua Dias Avenue, Piracicaba, SP 13418-900, Brazil
*
Author to whom correspondence should be addressed.
Agronomy 2018, 8(12), 283; https://doi.org/10.3390/agronomy8120283
Submission received: 11 October 2018 / Revised: 21 November 2018 / Accepted: 23 November 2018 / Published: 27 November 2018
(This article belongs to the Special Issue Soil Phosphorus Dynamics: Agronomic and Environmental Impacts)

Abstract

:
Phosphate fertilizer placement at sugarcane (Saccharum spp.) establishment can strongly influence the distribution of soil P pools over crop cycles, and has a great influence in the availability of this nutrient to plant uptake. Our main objective was to evaluate sugarcane yield as well as changes in the distribution of soil P pools, under phosphate fertilizer sources and their management, over two years of sugarcane cultivation. The experiment was established in August 2013 with two phosphate sources (TSP (triple superphosphate) and RP (Bayovar rock phosphate)) and three application methods: as broadcast, at planting furrow and combining half broadcast/half plant furrow, all at the rate of 180 kg ha−1 soluble P2O5 being applied at crop establishment. Sugarcane yield and P uptake was evaluated, and soil was sampled after harvest in August 2015 to analyze P fractions. Substantial amounts of P derived from fertilizers were accumulated as inorganic and/or organic moderately labile P. Broadcast application of TSP was not able to enhance total P in 0–40 cm layer compared to control treatment. In general, TSP was more effective to supply P for sugarcane and keep more of this nutrient in all labile fractions in the soil. However, the potential residual effect of RP (Ca-P) is expected in the following years, slowly solubilizing over the time.

1. Introduction

Brazil grows 9.1 Mha of sugarcane. It is the world’s largest producer of sugar and accounts for one-third of the global production of bioethanol [1]. Sao Paulo is the top producing state with 4.7 Mha, accounting for 55.1% of Brazil’s sugarcane area [2]. It is estimated that a further 6.4 Mha of new sugarcane area will be required to meet the Brazilian demand for ethanol by 2021 [1]. This additional land will primarily come from areas currently in degraded pasture [3], which are classified as low yield environments because of their acid soils, low natural fertility and low phosphorus (P) availability [4].
Phosphorus plays an indispensable role in plant development, for photosynthesis, root development and tillering, and its addition to tropical soils is necessary for maximizing yield [5]. The typically acid soils in the Brazilian cerrado are naturally low in available P and have a large potential to immobilize P to clay and Fe and Al (hydr) oxides surfaces via adsorption. Only 10–30% of water soluble P fertilizer sources are taken up by plants in the year of application in tropical soils, with the remainder rendered largely unavailable for plant uptake through soil immobilization [6]. This adsorption increases with fertilizer–soil contact time and is greatest when highly soluble P fertilizers are applied to areas that have been recently converted from impoverished and degraded grassland [7]. Thus, high inputs of P fertilizer are continuously needed to optimize sugarcane yield, typically ranging 40–180 kg ha−1 of P2O5, and mostly applied at planting [8,9].
Phosphate fertilizer sources show distinct differences in soil P availability. Soluble sources are fully available for plants immediately after application, but are susceptible to rapid adsorption by the soil. Sources of P with low solubility such as rock phosphate (RP) release P more slowly into solution but are much less expensive and also less susceptible to adsorption over time [6,7,10]. In addition, phosphate fertilizer placement can strongly influence its agronomic efficiency in sugarcane. Previous research suggests that RP works better when broadcast and incorporated uniformly into the soil rooting layer, being as efficient as soluble P fertilizer sources. In this way, there are more roots in contact with zones of higher P concentrations, although the higher soil–P contact can increase chemical adsorption and keep more P in non-labile forms [10]. In contrast, localized P application (furrow) promotes less soil–P contact and hence minimizes adsorption and improves uptake of P by plants [11]. Understanding the dynamics of P when fertilizers are applied by different placement strategies can help to utilize P more efficiently in sugarcane fields, especially in newly converted areas with very low inherent soil P fertility.
More investigations are needed to understand the distribution of the different forms of P in the soil profile after P application with the aim of improving the efficiency of phosphate fertilizer management. Phosphorus fractionation procedures can contribute to our understanding of P availability dynamics by differentiating soil inorganic and organic P forms into operationally defined pools of labile, mod-labile and non-labile [12,13,14]. The objective of this study was to evaluate sugarcane yield and the distribution of soil P in the profile after two years of sugarcane cultivation following different sources and application methods of P fertilizer, to sugarcane grown in an area recently converted from degraded grassland in the Brazilian Cerrado.

2. Materials and Methods

2.1. Site Description and Experimental Treatments

A field experiment was established in Agudos, Sao Paulo State, Brazil, located at latitude 22°33′ S and longitude 49°06′ W with an altitude of 715 m, in August 2013. The first two cropping cycles of 2013/2014 and 2014/2015 were evaluated and the total rainfall was 914 and 1191 mm in each 12-month crop cycle, respectively. Here, we present only the results of the second season for cane yield and P extraction since we focused on the residual effect of fertilizers applied at plant establishment. The mean annual temperature in this region is approximately 21 °C with the maximum monthly mean temperature of 28 °C in February and the minimum of 11 °C in July.
The research site was previously a pastureland for extensive grazing for more than 20 years after Cerrado deforestation. Previous to sugarcane establishment, the pasture was desiccated with the application of glyphosate at the rate of 4 L of active ingredient ha−1. The soil was limed with 2.0 t ha−1 and treated with 1.0 t ha−1 of gypsum. Lime and gypsum were incorporated by two disc harrows to the layer of ~0–20 cm. The soil type is a loamy sand soil classified as Latossolo Vermelho Amarelo distrófico [15] or Hapludox [16]. Selected properties of the soil before the trial establishment are presented in Table 1.
The treatments were composed of two phosphate sources and three distinct fertilizer placements at sugarcane planting. Triple superphosphate (TSP—46% soluble P2O5) and Gafsa rock phosphate (RP—9.6% soluble and 28.5% total P2O5) were both: (i) broadcasted and incorporated to 0–20 cm (B); (ii) applied in the bottom of the planting furrow, around 20–30 cm deep (F); or (iii) applied half broadcast incorporated and half at planting furrow (B + F). The rate used was 180 kg ha−1 of soluble P2O5 (78 kg P ha−1) for all treatments (equivalent to a row material total of 391 and 1875 kg ha−1 for TSP and RP, respectively). A treatment without P application was also established as control. The arrangement was in a split-plot design with P sources as main plots and application methods as sub-plots, with three replicates. Each sub-plot consisted of 6 rows of 10 m, with 1.5 m of row space, comprising 90 m2 in total.
At establishment, the furrow was opened and the sugarcane (buds/stalks) planted manually at 18–20 buds per row meter, with the stalks arranged tip to end, cutting the stalks to a common length to ensure three to four buds on each individual piece. The stalks were then covered with a soil layer of 5–10 cm by mechanical operation. The sugarcane variety used was RB867515, which is the most currently cultivated variety in the Central-Southern Brazil, accounting for over 27% of the cropping area [17]. This variety is recommended for medium to low natural fertility soils. At planting, before disposing the stems in the furrow, the respective P fertilizer treatments were applied in combination with 60 kg ha−1 of N and 125 kg ha−1 of K as urea and potassium chloride, respectively. Fertilizer application for the second season was performed one and a half months after harvest, in August 2014, using 90 kg ha−1 of N and 90 kg ha−1 of K2O as ammonium nitrate and KCl, respectively. It was top-dressed in soil surface right beside the plant line (~10 cm). No P fertilizer was added in the second season.
Sugarcane yield and P uptake responses to the treatments after two growing seasons were investigated in August 2015. Harvest and tissue sampling were performed manually. Yield was considered for the four center row of sugarcane in the subplot (total 60 m2). Tissue samples were taken from top leaves, dead leaves and cane stalk, recording the total DM and P content of each plant part, determined by acid digestion method [18]. After determination, total P uptake was estimated by the sum of proportional amount in each part of the crop, being presented in the results only the total P.

2.2. Soil Sampling and Phosphorus Analyses

Soil samples were collected in August 2015 after the second harvest to account for P fractionation analysis. These samples were taken from the central rows of each sub-plot, right up the plant line, using an auger with 2 cm internal diameter, at the depths of 0–10, 10–20 and 20–40 cm. Four sub-samples were taken to form one composite sample in each sub-plot. Soil samples were air dried, passed through 2 mm sieve, and packed in polyethylene bags until the laboratory analysis.
The soil P fractionation was performed according to the methodology proposed by Hedley et al. [13], with modifications made by Condron et al. [19]. Different extractants were added to 0.5 g of soil in sequential order of: anion exchange resin (PAER) and NaHCO3 0.5 mol L−1 (PiBIC and PoBIC); labile inorganic and organic P; NaOH 0.1 mol L−1 and HCl 1.0 mol L−1 (PiHID-0.1, PoHID-0.1 and PHCl); moderately labile inorganic and organic P; and NaOH 0.5 mol L−1 (PiHID-0.5, PoHID-0.5) non-labile inorganic and organic P. In all steps, the suspension was stirred for 16 h in an end-over-end shaker (33 rpm). At the end of the sequential extraction, the remaining soil residue was dried at 50 °C, ground to homogenize, and digested with a mixture of concentrated H2SO4, 30% H2O2 and saturated magnesium chloride to determine the residual P (PResidual) [20]. The inorganic P was measured directly in extractant solutions by colorimetric method of Murphy and Riley [21] at 882 nm for acid extracts, and Dick and Tabatabai [22] at 700 nm for alkaline extracts, using spectrophotometer (Femto 600 plus, Femto, São Paulo-Brazil). The organic P in alkaline extractants was estimated by the difference between total P, determined after digestion of the extracts with 7.5% (weight/volume) ammonium persulfate ((NH4)2S2O8) solution and 50% H2SO4 in an autoclave (103 kPa, 121 °C) for 2 h [23], and the inorganic P in each extractant.
The maximum soil P adsorption capacity (PMAC) was estimated in soil samples collected at the depth of 0–20 cm before trial establishment, according to the methodology proposed by Sui and Thompson [24]. Two grams of soil were placed in 50 mL falcon tubes, in triplicate, and mixed with 20 mL of 13 different solution concentrations, equivalent to 0, 5, 10, 20, 40, 60, 80, 120, 200, 280, 360, 440, and 520 mg L−1 P. The solutions were prepared by dissolving KH2PO4 in 0.01 M CaCl2. The tubes were stirred for 48 h at 25 °C. After that, they were centrifuged at 2500 rpm for 10 min. The P concentration in supernatant was measured by colorimetric method of Murphy and Riley [21]. The P adsorption data were fitted to Langmuir equation, presented as value of PMAC in Table 1.
To identify the main minerals which can interfere with the availability of P in the soil, X-ray diffraction (XRD) analysis of the clay fraction was performed in the same 0–20 cm soil sampled previously to trial establishment, following the methodology described by Jackson [25] for glass slide preparation (Figure 1). The diffractograms were generated using a Miniflex II Desktop X-Ray Diffractometer (Rigaku Corporation, Tokyo, Japan), with CuKα radiation, with intervals from 5° to 30° 2θ and from 10° to 50° 2θ for samples without (Figure 1A) and with iron (Figure 1B), respectively. According to this analysis, a predominance of kaolinite and anatase in the soil was detected, otherwise a small amount of gibbsite and hematite were present, which influenced directly the small PMAC value mentioned above.

2.3. Statistical Analysis

Variance homogeneity and normality of data were tested for each analysis before conducting analysis of variance (ANOVA). Data were transformed using Box–Cox techniques [26] and outliers were removed when needed. Then, the data were submitted to ANOVA using GLM procedure to test the effect of phosphate fertilizer sources and application methods on soil P fractions, cane yield and P uptake. When the interaction source × placement and/or each individual factor were significant, means were tested using t-LSD (Student) (p < 0.05). All the statistical analyses were performed in SAS 9.4 (SAS Institute, Inc., Cary, NC, USA).

3. Results

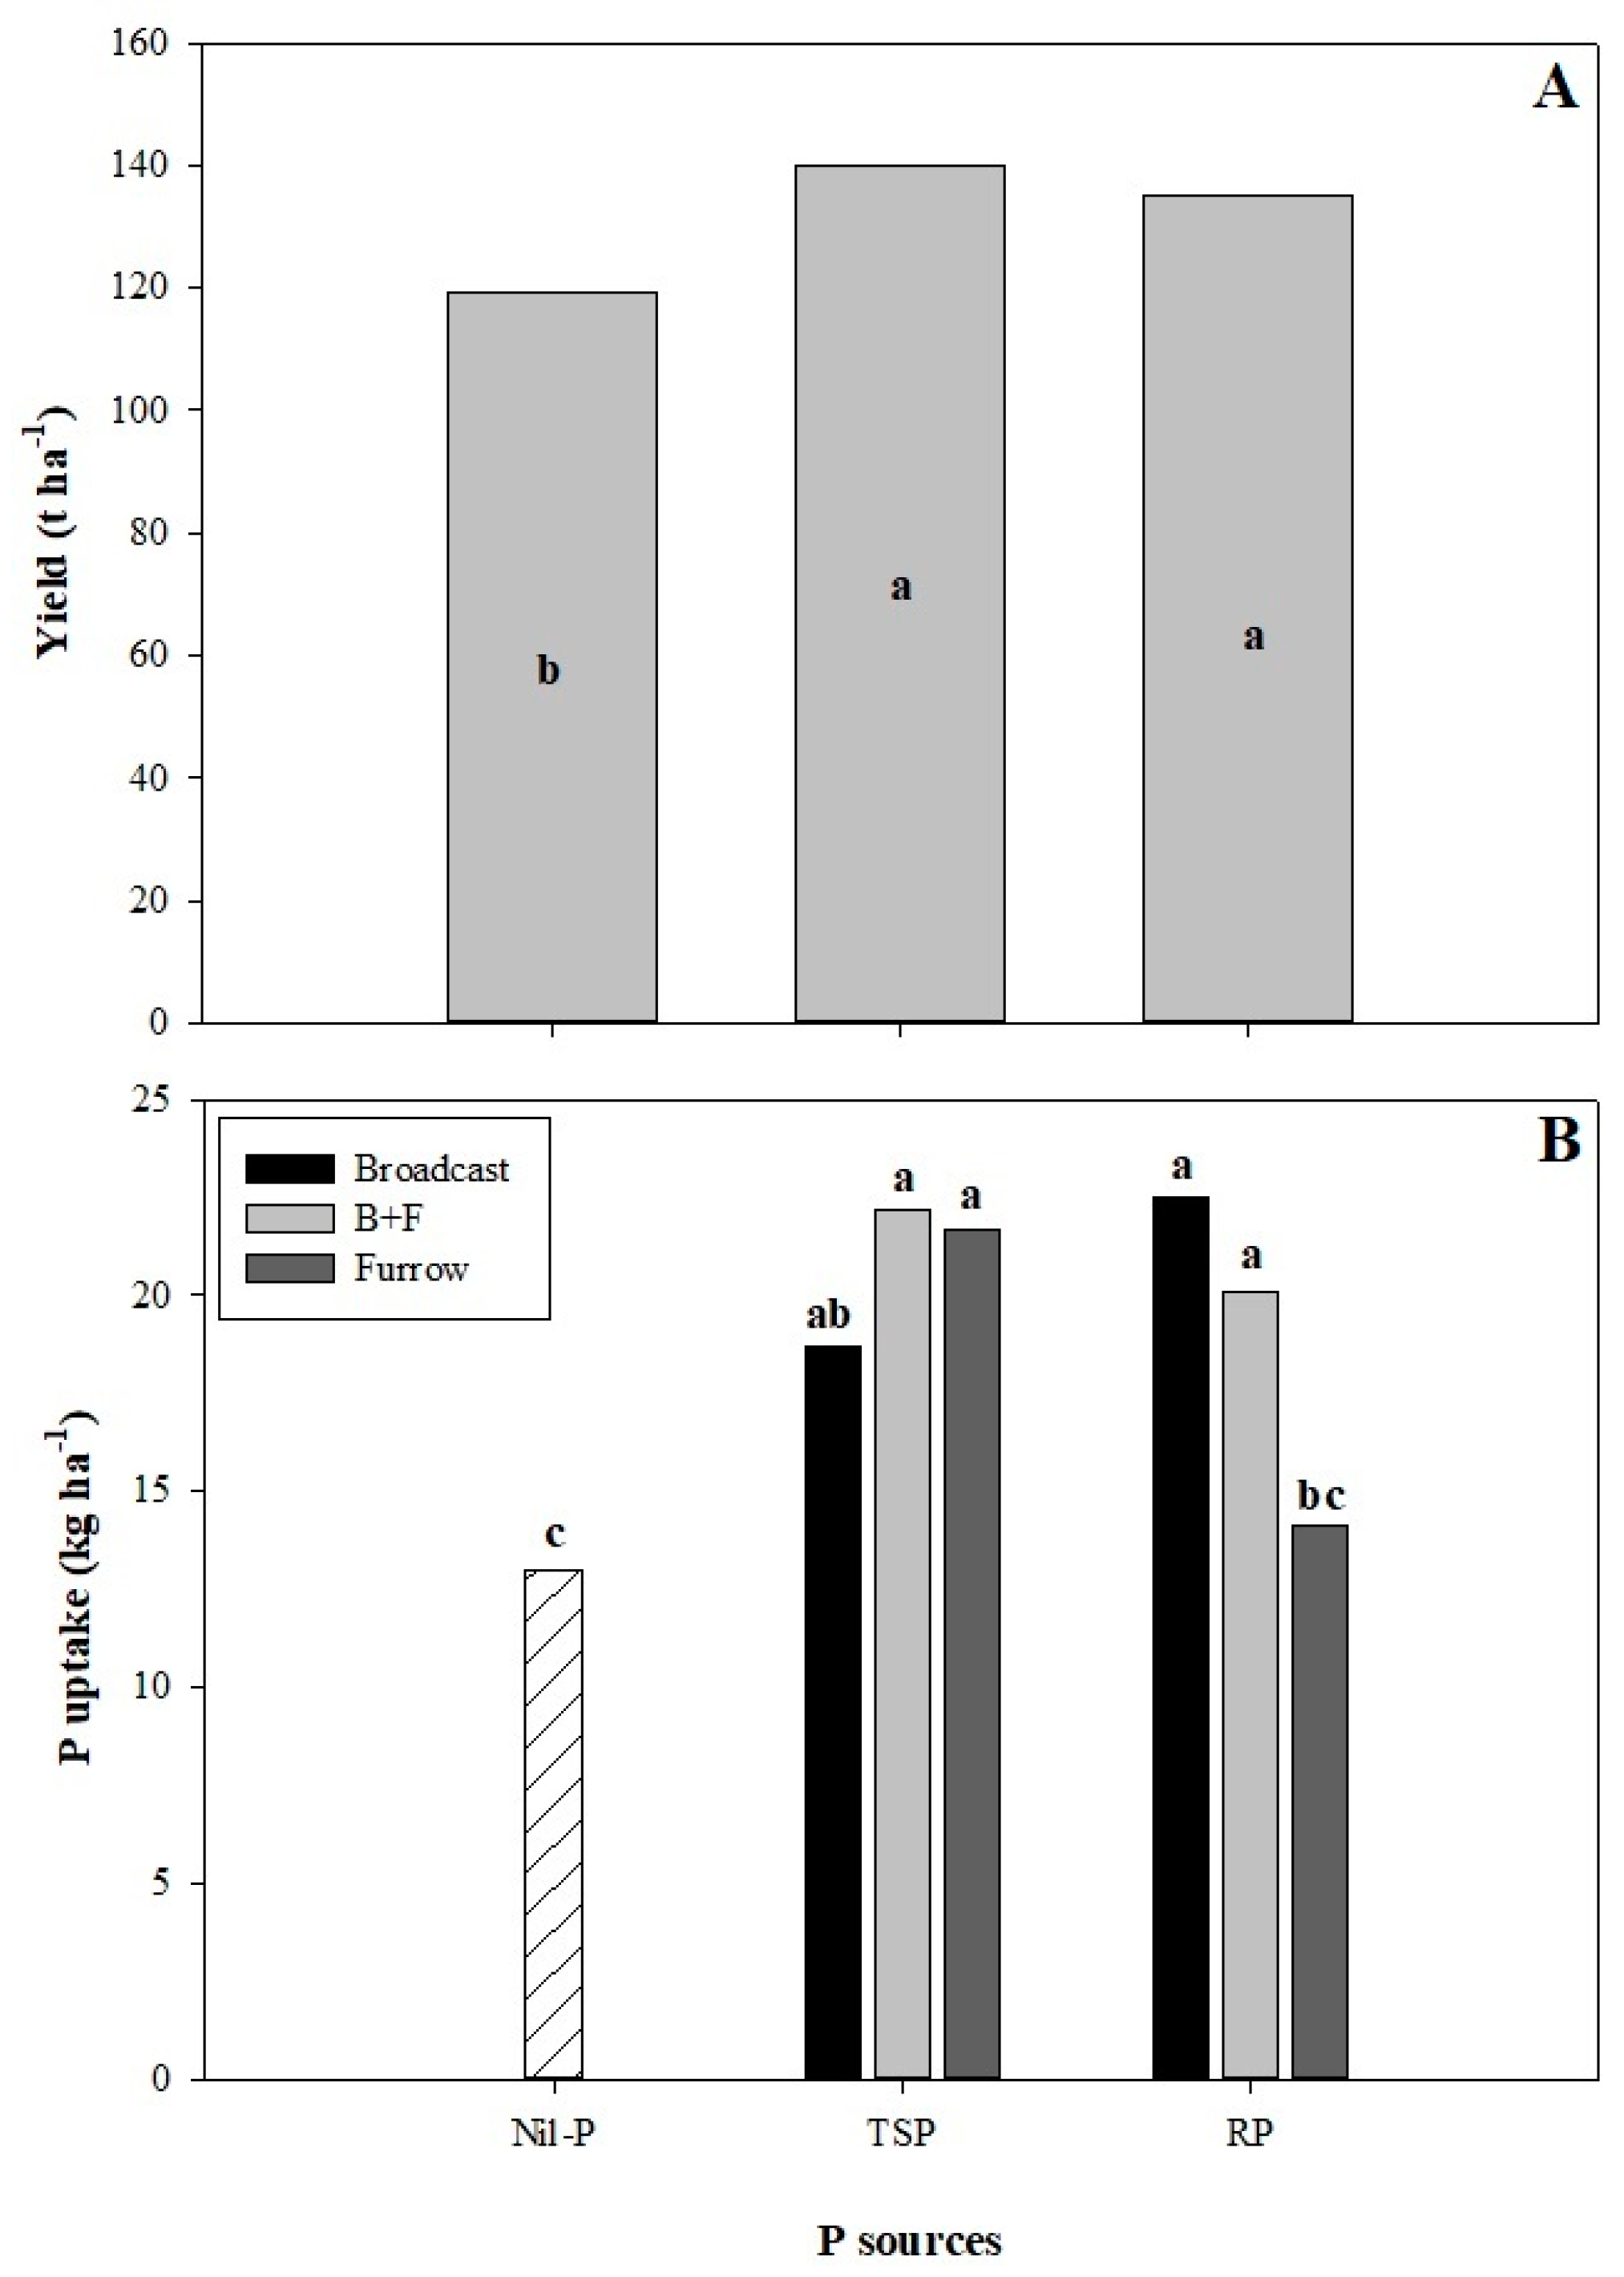
3.1. Cane Yield and P Uptake

Cane yield was significantly improved by P fertilizer sources used at establishment (139.8 and 135.2 t ha−1 under TSP and RP, respectively) when compared to control treatment (119.4 t ha−1) (Figure 2A) without significant effect of placement. Phosphorus uptake by sugarcane under TSP in all application methods and RP applied as broadcast and B + F were higher than control treatment and RP in planting furrow (Figure 2B).

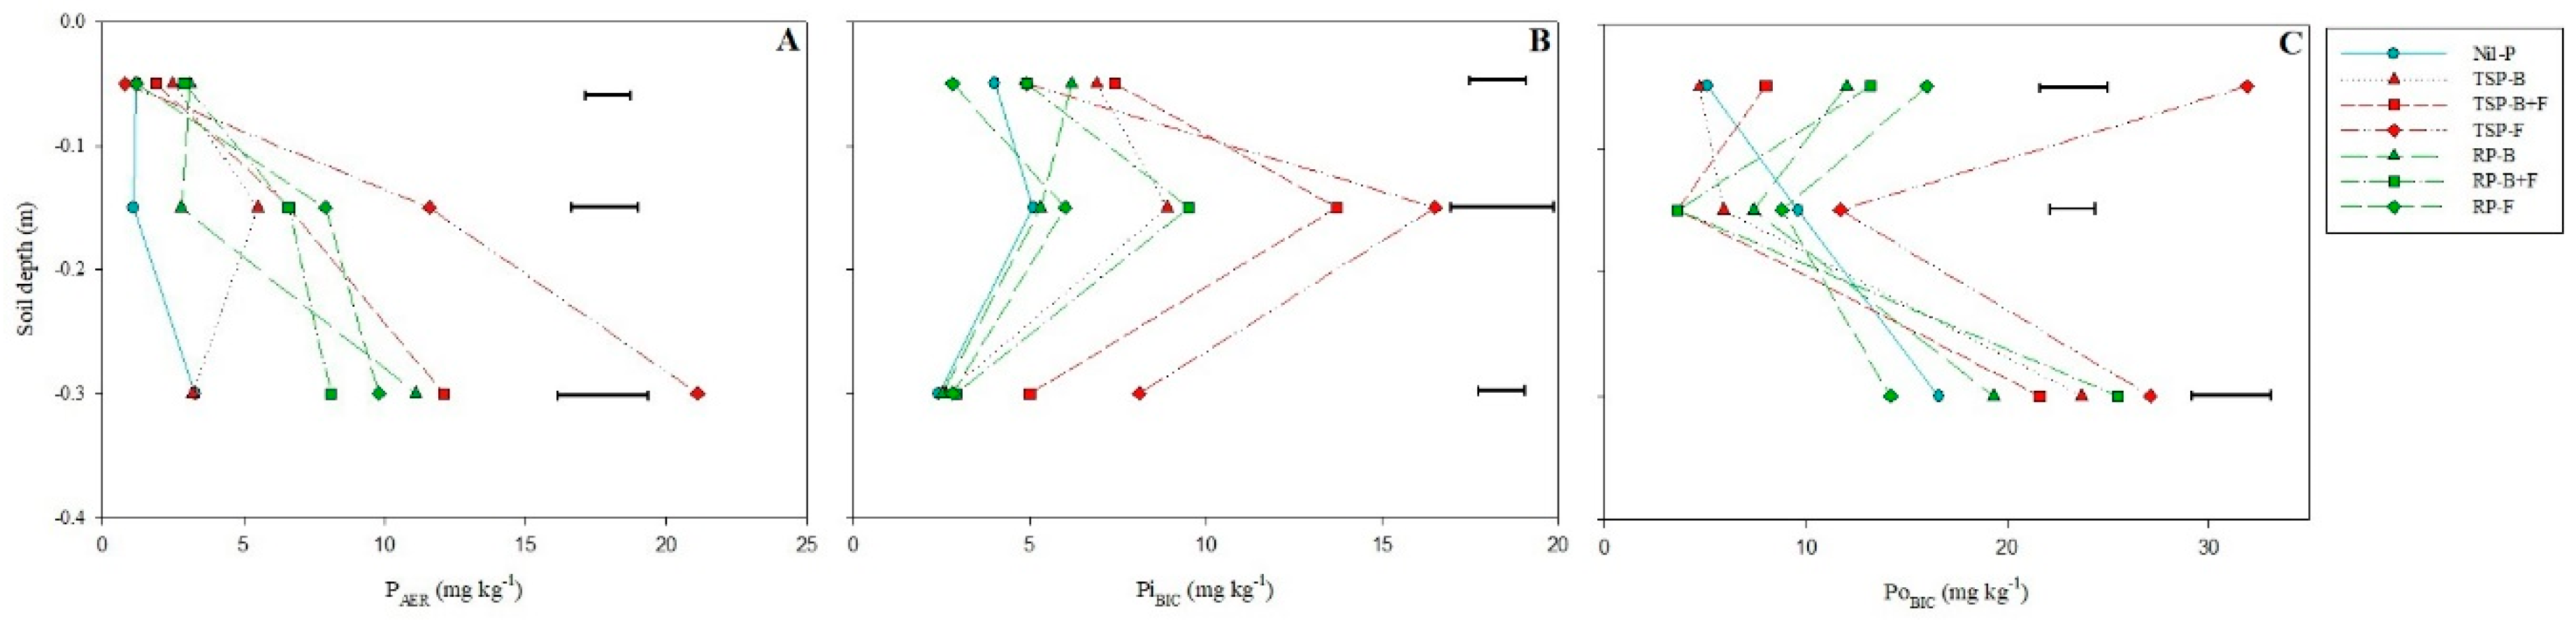
3.2. Labile P Fractions (PAER, PiBIC and PoBIC)

The evaluation of P lability after two years of trial establishment, right after sugarcane second harvest, is presented in Figure 3. The first fraction extracted was PAER, which is the labile inorganic P most readily diffused into soil solution and the most available one, easily taken up by sugarcane. According to our data, in the layer 0–10 cm, PAER level was lower than the other depths (Figure 3A), recording the highest value under RP broadcasted, but only significantly higher than TSP at planting furrow. The highest PAER levels were recorded under TSP applied in planting furrow in 10–20 and 20–40 cm, significantly higher than the other treatments. Broadcasted RP and TSP were not able to increase PAER significantly related to control treatment in 10–20 and 20–40 cm, respectively, while other treatments successfully increased PAER in these two depths.
The highest accumulation of inorganic P extracted by NaHCO3 0.5 mol L−1 (PiBIC) was observed in 10–20 cm for all sources and placements evaluated here, except for broadcasted RP which was in 0–10 cm surface layer (Figure 3B). Triple superphosphate applied all at planting furrow or B + F promoted a great increase in PiBIC level compared to the other treatments in 10–20 and 20–40 cm layers. Broadcast application was the most effective way to increase PiBIC in the layer 0–10 cm, while not detected in deeper layers since PiBIC fraction is not capable to move through the soil profile.
Organic P extracted by NaHCO3 0.5 mol L−1 (PoBIC) tended to accumulate more in 20–40 cm layer under all treatments, being TSP applied at furrow the one that promoted the highest PoBIC in all three evaluated layers (Figure 3C).

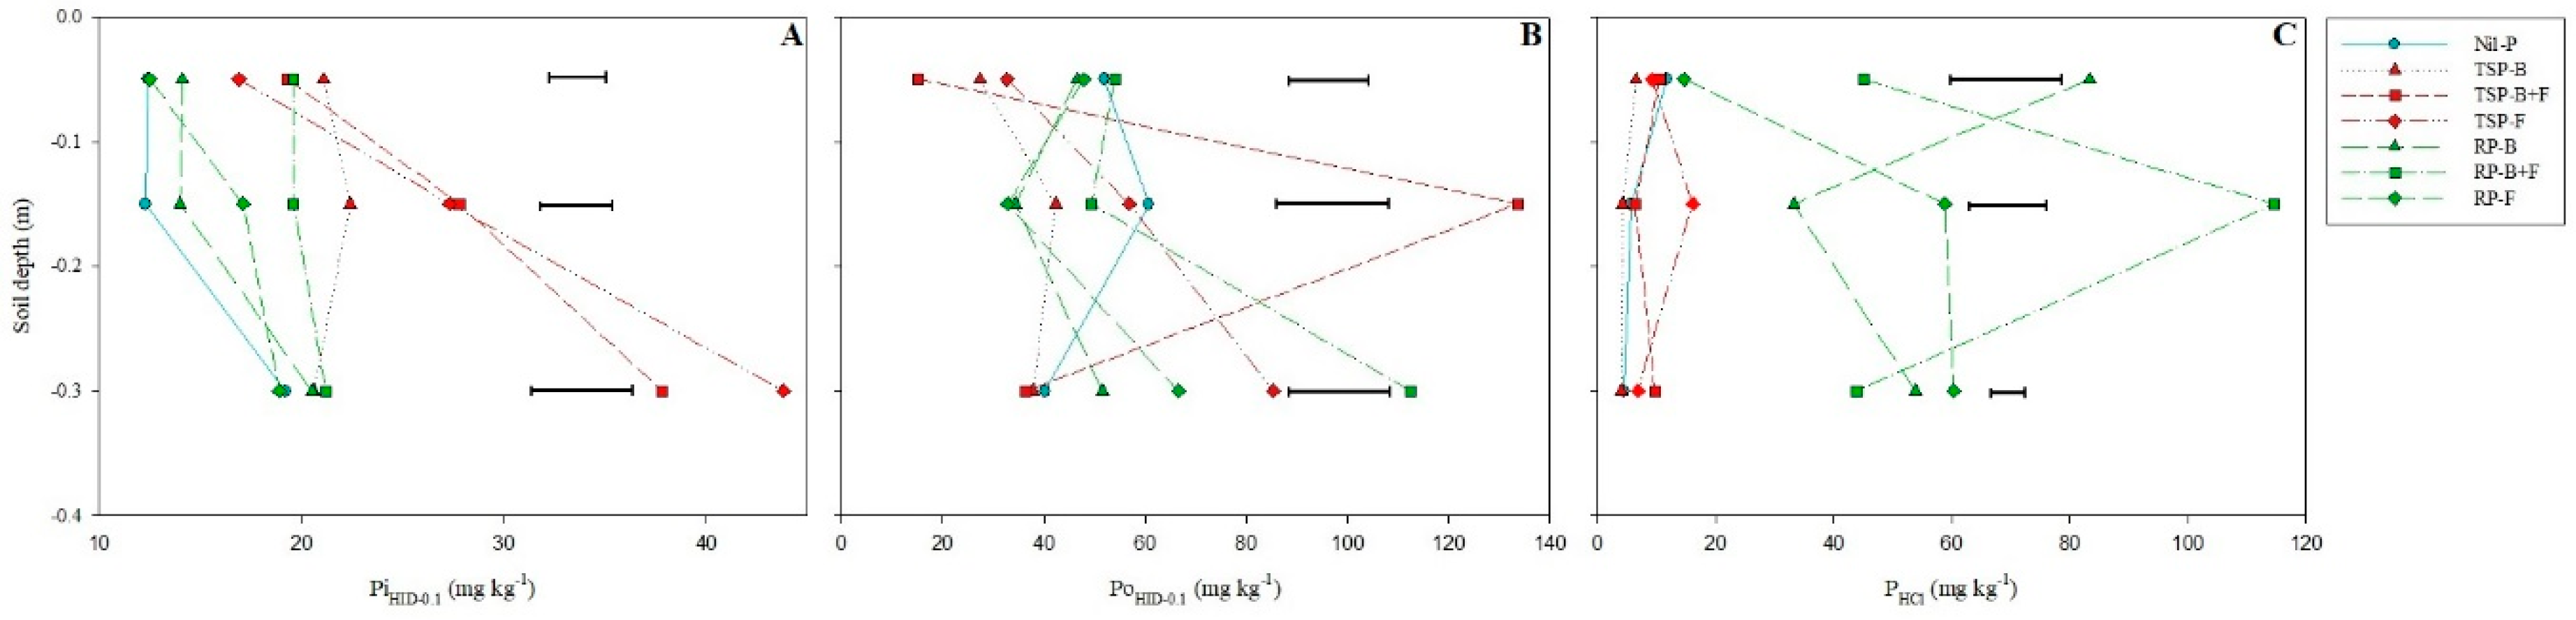
3.3. Moderately Labile P Fractions (PiHID-0.1, PoHID-0.1 and PHCl)

When we look into the P fractions of moderate lability in the soils it is clear that PiHID-0.1 level was significantly higher than control treatment in all the treatments except for RP both as broadcasted and at planting furrow in the layer 0–10 cm (Figure 4A). Triple Super Phosphate applied as B + F and at furrow promoted the highest PiHID-0.1 level compared to the other treatments in 10–20 cm, while RP broadcasted did not change this fraction compared to control treatment. In 20–40 cm depth, TSP at planting furrow and B + F promoted the highest content of PiHID-0.1, significantly higher than all other treatments, being 2.3 times higher than control treatment when applied at furrow. Meanwhile, RP at any application method and TSP broadcasted were not able to change this fraction compared to control treatment. Averaged across P sources and placements, PiHID-0.1 represented 8.5% of total P in 0–40 cm soil layer.
The use of RP did not change the organic P extracted by NaOH 0.1 mol L−1 (PoHID-0.1) in the top layer, keeping it similar to the control treatment (Figure 4B). However, TSP in all application methods resulted in lower contents of PoHID-0.1 compared to control treatment and RP. TSP and RP applied as B + F promoted the highest contents of PoHID-0.1 in 10–20 and 20–40 cm, respectively. Other sources and placements did not increase PoHID-0.1 compared to control treatment in 10–20 and 20–40 cm depth layers.
Triple superphosphate in all application methods did not enhance P extracted by HCl in all the layers compared to control treatment (Figure 4C). Broadcasted RP has accumulated the highest PHCl in 0–10 cm (83.3 mg kg−1), 12.8 times higher than TSP in the same application method, while in 10–20 and 20–40 cm B + F and furrow application of RP were the most effective methods to increase this P fraction, respectively. The highest concentration of PHCl was recorded in 10–20 cm depth under RP as B + F (114.5 mg kg−1), being 5.5 times higher than the average of the other treatments in the same layer.

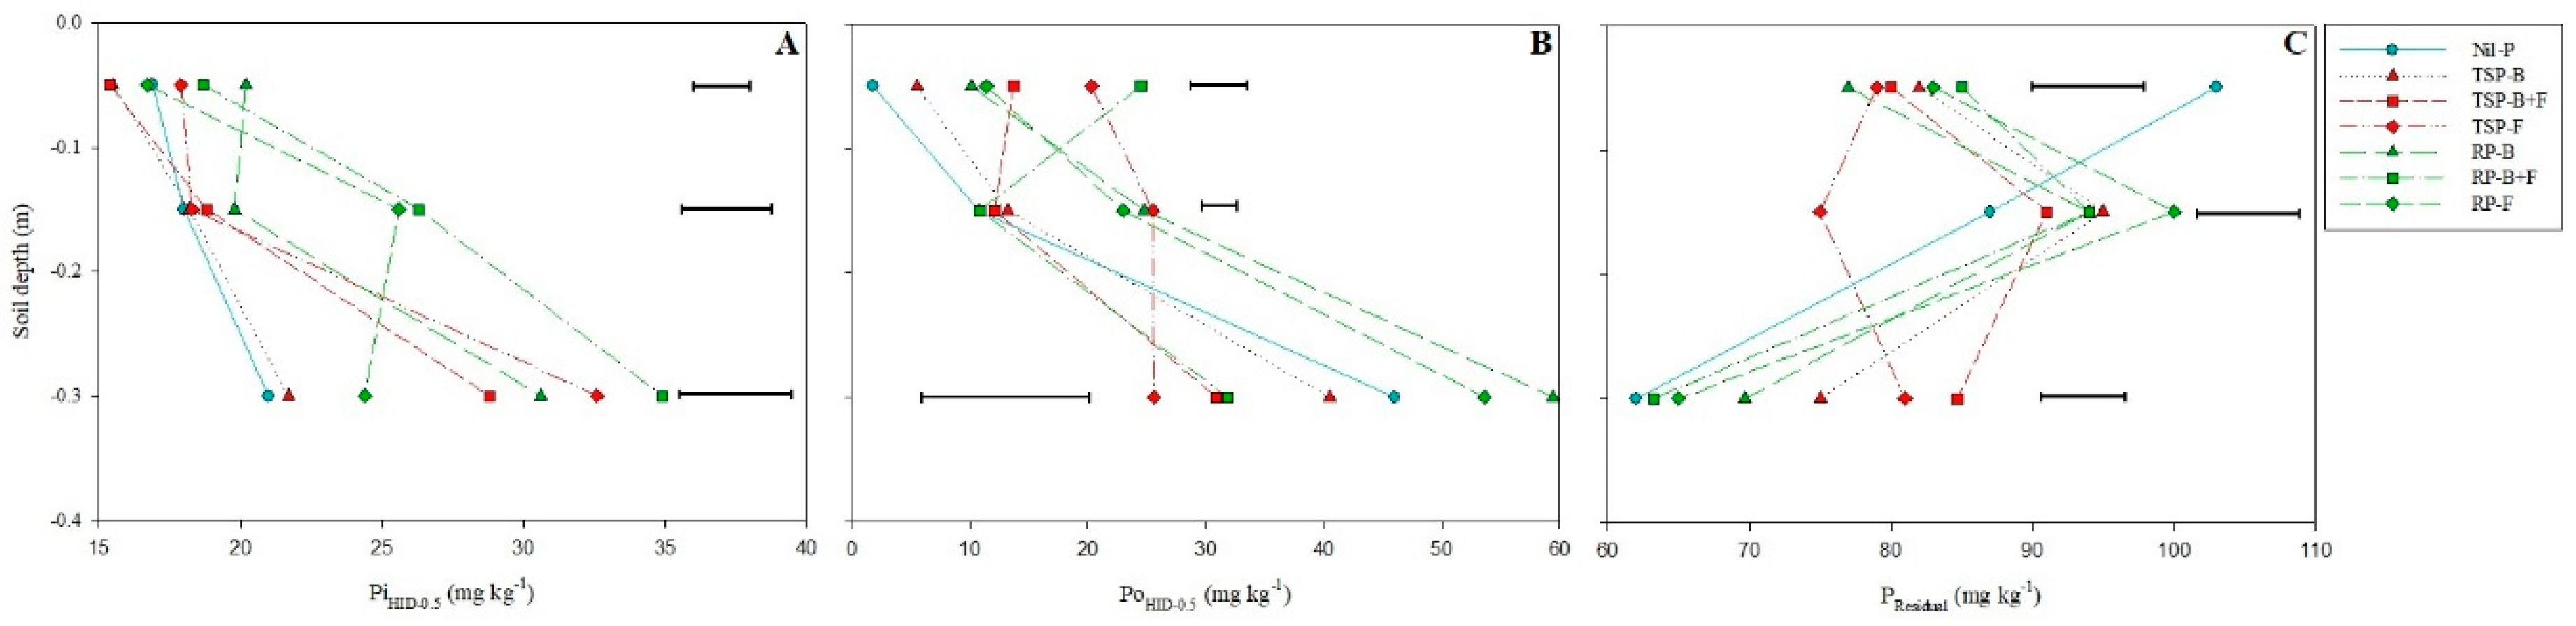
3.4. Non-Labile P Fractions (PiHID-0.5, PoHID-0.5 and PResidual)

Broadcasted RP was the only treatment which increased the content of non-labile inorganic P (PiHID-0.5) compared to control treatment in the top surface 0–10 cm (Figure 5A). In 10–20 cm, RP applied as B + F and at furrow promoted high contents of this P fraction, significantly higher than the others. In 20–40 cm, RP applied as B + F resulted in the highest content of PiHID-0.5. Overall, PiHID-0.5 tended to accumulate more in 20–40 cm depth and RP application was more successful to increase this P fraction compared to TSP in all three depths evaluated.
Organic P extracted by NaOH 0.5 mol L−1 (PoHID-0.5) in 0–10 cm was higher than control treatment in all treatments except for broadcasted TSP (Figure 5B). In 10–20 cm, TSP and RP at furrow application and RP at broadcast application resulted in the higher contents of PoHID-0.5 compared to the other treatments. Furrow application of TSP showed the lowest PoHID-0.5 content in 20–40 cm depth and it was the only one significantly different from control treatment. Looking at the soil profile, PoHID-0.5 followed the same trend as PiHID-0.5, i.e. enhanced with depth and tended to have more accumulation in 20–40 cm.
The highest content of residual P was recorded under control treatment in 0–10 cm, significantly higher than the other treatments, which is not clearly explained since other treatments were not different from each other (Figure 5C). In 10–20 cm, RP presented the highest PResidual level when applied at planting furrow. TSP applied at furrow promoted less PResidual compared to the other methods, while under RP the application method did not show any effect on this P pool. In 20–40 cm, B + F and furrow application of TSP resulted in significantly higher PResidual than RP applied in the same ways. The highest PResidual in this layer was recorded under TSP as B + F. Most of the PResidual accumulated in 10–20 cm when both P sources were applied, while control treatment presented the highest value in surface layer and decreased over the soil profile.

3.5. Soil P Balance over Time

The P balance was averaged over the whole soil profile (0–40 cm) according to the equation: {[(P0–10 × 10) + (P10–20 × 10) + (P20–40 × 20)]/40} − P concentration (0–40 cm) in control treatment (Table 2). The results showed that the highest accumulation of P derived from RP was recorded in PHCl for all application methods, as expected; broadcasted TSP was not able to enhance soil total P in the way we evaluated here; the P derived from TSP was more expressively observed in the form of PiHID-0.1 under all application placements (less expressive in broadcasted way) after two years; TSP applied at planting furrow resulted in the highest positive balance of labile P fractions (PAER, PiBIC and PoBIC); and PoHID-0.5 had a negative balance in all application methods under TSP, which may be indicative of P mineralization from organic forms after two years from the application of this soluble P source.

4. Discussion

Sugarcane yield was positively influenced by the application of P fertilizers, with gains of 13.2% and 17.1% under TSP and RP, respectively, compared to control treatment, irrespective of their placement (Figure 2A), which emphasizes the great importance of P supplementation for sugarcane development when introduced in new areas of low fertility soils. However, distinct fertilizer placements were not effective to change the yield, which means that broadcast or furrow applications are working in the same way for plant development. Similarly, Caione et al. [27] reported greater yield responses to P sources in the first cycle of sugarcane when TSP, Araxá and Bayovar RP were used at planting furrow, reaching up to 34% increase under TSP. In addition, dos Santos et al. [28] reported positive yield responses to many P fertilizer sources used, from 11.2% to 28.3% in Paddy soils of Northeast region of Brazil, being the worst as NPK formula and the best as TSP. Tsado et al. [29], working in an Alfisol in Nigeria, showed a profitable increase in sugarcane yield in the first plant cycle when SSP and RP were applied, with no significant differences among them. de Sousa et al. [30] investigated three seasons (ratoons) of sugarcane under five different P sources (TSP, termophosphate, MAP, Itafos RP, and Arad RP) in central Brazil and showed that all P sources enhanced the yield of the first ratoon, but the cumulative yield after three ratoons was not affected by P sources, while sugar production per hectare increased under fertilizer use.
Phosphorus uptake under P fertilizer sources was also much higher than control treatment, except for RP at furrow (Figure 2B). RP is not recommended to be applied at planting furrow since the accumulation of Ca-P in a specific region of the soil can delay P dissolution and does not enhance P uptake by the plants, as observed here. Broadcast and B + F placements of RP worked well for P uptake and may reach the equivalent yields of TSP over a longer timeframe. The use of RP in tropical acid soils can raise pH, reduce exchangeable Al and supply substantial amounts of P for cane, but needs longer incubation time to be as effective as soluble P sources, which is supported by the work of Hammond et al. [31] who showed that Bayovar RP can be as effective as TSP in yield improvements in sub-humid climates. In addition, de Sousa et al. [30] showed that the residual effect of less soluble phosphate sources was increased over the years. They recorded the following order for agronomic efficiency of different P sources after three years of cultivation: TSP > thermophosphate > MAP > Itafos RP > Arad RP.
The readily available fraction of P (PAER) was accumulated in deeper layers (10–20 and 20–40 cm) because of the application method, since at furrow and B + F treatments the fertilizers were applied close to or inside those layers. However, it was expected to see more PAER in the surface layer when broadcasted, but it was not (Figure 3), probably due to the leaching to lower soil layers or losing in runoff during high rainfall, as this P fraction is susceptible to such factors. Triple superphosphate application at planting furrow was found the best way to enhance PAER for sugarcane growth; otherwise, broadcast application of both sources should not be recommended as it did not enhance PAER as much as the other ones, besides being more susceptible to erosion. In general, the PiBIC under TSP was higher than RP in all depths since all P in TSP is readily soluble otherwise RP needs some dissolution to be available, demanding Ca-P linkage breaking from the mineral structure. Similar results were reported by Caione et al. [27], with TSP presenting higher PiBIC levels than RP sources. Otherwise, Ruaysoongnern and Keerati-Kasikorn [32] reported significantly higher amounts of PiBIC under RP in comparison to soluble P fertilizers. PiBIC levels were higher in 10–20 cm depth under all sources and placements compared to control treatment, showing that it can possibly move from the surface layers downward to deeper layers (here 20–40 cm).
The organic labile P (PoBIC) constituted a great proportion of labile P in our results (on average 52%). Furrow application of TSP resulted in the highest content of PoBIC in all depths which contrasted to what was reported by Caione et al. [27] whose results showed no effect of P sources on this P fraction. High content of PoBIC was detected in the surface layer under TSP at planting furrow, which can be explained by the recycling of organic forms by straw decomposition of the first sugarcane cycle, or by the conversion of less labile organic forms into labile forms over the cultivation time. Except of this treatment, for other treatments, PoBIC levels were higher in 20–40 cm than other depths. Under low pH (4.8 in our soil) and high activity of Fe and Al, typical of tropical weathered soils, the solubility of the secondary Pi forms is largely controlled by the mineralization of Po, and 80% of PAER variability can be explained by PoBIC [33].
A small amount of mod-labile P in the inorganic form was found as PiHID-0.1, averaged ~21 mg kg−1 over the profile (Figure 4), similar to those reported by Caione et al. [27], which can be explained by the type of dominant mineralogy of this soil, with only 11%–15% clay content and very small amounts of Fe and Al (Table 1 and Figure 1). PiHID-0.1 fraction is normally composed of P linked to amorphous and crystalline oxides of Fe and Al. It is a very reactive pool and has been identified as source or drain of available P in soil in the humid tropics [34], and must replenish the more labile reservoirs when depleted by plants or microorganisms [35]. In tropical soils, it has been confirmed that the addition of inorganic fertilizers raises the concentrations of both labile and mod-labile P [27,36,37]. Moreover, evaluating the preferred forms of P stocked in soils, Conte et al. [34] observed an increase in PiHID-0.1 with increasing the P application rate, reaching more than 20% of the total P in this fraction in soil. In our study, TSP applied as B + F or at planting furrow was the most effective to enhance PiHID-0.1 in 10–20 and 20–40 cm depth layers, which can be reallocated to labile P pools when this one is depleted.
Hydrochloric acid 1 mol L–1 can extract Ca-P from apatite, but also can extract other sparingly soluble Ca-P compounds or negatively charged oxide surfaces [13], which can represent a great amount of P in calcareous soils. Here, the PHCl in RP treatments was several times higher than TSP in all depths, the same as reported by Caione et al. [27]. Zoysa et al. [38] also reported that RP increased Ca-P fraction compared to control treatment, while TSP dominantly affected P extractable by resin and NaOH. PHCl is not readily available for plants in a short time and its availability depends on the soil properties, such as acidity, cation exchange capacity, soil P and Ca levels, and plant mechanisms such as organic acids released in the rhizosphere [39]. Other more stable forms of P, such as PiHID-0.5 and PoHID-0.5, were increased with depth, with higher amounts in 20–40 cm (Figure 5), whi h should be explained by fertilizer deposition in the furrow bottom (Furrow and B + F treatments).
Residual P is composed of recalcitrant organic and inorganic forms not available for plant uptake in the short term [37]. The great amount of PResidual observed here is consistent with highly weathered soils [27,28,29,30,31,32,33,34,35,36,37], where highly recalcitrant forms of P are accumulated in the soil as a consequence of chemical and/or physical ligand stability [33,34,35,36,37]. PResidual tended to accumulate more in 10–20 cm depth under P sources while under control treatment it decreased with depth, being the highest values detected in the surface layer.
Taking some notes of the general overview of the results, it can be detached that higher labile P levels were detected under TSP after two years, being an indicative of the low adsorption capacity (PMAC) of this soil due to its low concentrations of Fe and Al oxides in its mineralogy (Table 1 and Figure 1). Otherwise, our results show that RP needs more incubation time to react with soil particles and solubilizes more P, similar to TSP. Tambunan et al. [40] reported that RP dissolution can be enhanced by long time contact to the soil. In addition, Chien et al. [41] stated that the relative agronomic effectiveness of different RPs is higher or similar than soluble P fertilizers for long-term in perennial crops.
The agronomic efficiency of less soluble phosphate sources is generally lower in the first crop cycle of application (data observed but not presented here), but has a greater residual effect than soluble sources, with better agronomic efficiency in the subsequent years [42], which can be proven by our results, with similar cane yield under TSP and RP in the second year. In general, the proportion of labile and mod-labile P pools enhanced with fertilizer application, which is in agreement with other studies [27,36,37,43]. It also can be stated that PiHID-0.1 can act as a buffering pool in longer timeframe evaluations under soluble P sources, while this role is played by PHCl when RP is applied. PResidual balance under RP was almost null or negative in all application methods, which shows that P tended to be stored as PHCl. The highest accumulation of P derived from TSP was obtained at planting furrow method, which promotes a concentration of applied fertilizer and keeps it where placed.

5. Conclusions

Sugarcane yield was positively affected by phosphates application, irrespective of the source and application method, being the same response to TSP and RP after two years of evaluation. Placement as furrow and B + F application were the most effective for TSP and RP, respectively, to increase cane yield; otherwise, broadcast application is not recommended for any source.
In general, TSP was more effective to supply P for sugarcane and keep it in labile fraction in the soil compared to RP after two years of sugarcane establishment, detaching furrow application as the best management. Phosphorus from RP was dominantly stored as PHCl fraction in soil, while TSP tended to be stored as PiHID-0.1.
Although our results are consistent, we propose more years to better understand the potential residual effect of RP (Ca-P) for sugarcane, which is expected to be solubilized according to pH depletion over the cropping seasons.

Author Contributions

V.R.d.S., A.S., O.K., A.C.V., H.C.J.F., and P.S.P. set up the experiment and collected plant and soil samples; A.S. and C.T.d.S.D. analyzed data; V.R.d.S. and A.S. led the writing of the manuscript; P.S.P. supervised the overall project and reviewed the manuscript; and V.R.d.S. guided the laboratory work.

Funding

This research was supported by São Paulo Research Foundation (FAPESP) (Grant No. 2013/21604-1). In addition, it was supported by Coordination for the Improvement of Higher Education Personnel (CAPES), which supported the research (Grant No. 88881.064953/2014-01) and scholarship to the second author (Grant No. 88887.130287/2016-00).

Acknowledgments

The authors are thankful to Agricola BPZ and Agricola Pouso Alegre (APA), for all the support received for field experimental run and evaluations.

Conflicts of Interest

The authors declare no conflict of interest.

References

  1. Goldemberg, J.; Mello, F.F.; Cerri, C.E.; Davies, C.A.; Cerri, C.C. Meeting the global demand for biofuels in 2021 through sustainable land use change policy. Energy Policy 2014, 69, 14–18. [Google Scholar] [CrossRef]
  2. Companhia Nacional de Abastecimento—CONAB. Acompanhamento da Safra Brasileira de Cana-de-açúcar, Segundo Levantamento; CONAB: Brasília, Brazil, 2016; pp. 1–33. [Google Scholar]
  3. Walter, A.; Galdos, M.V.; Scarpare, F.V.; Leal, M.R.L.V.; Seabra, J.E.A.; da Cunha, M.P.; de Oliveira, C.O.F. Brazilian sugarcane ethanol: Developments so far and challenges for the future. Wiley Interdiscip. Rev. Energy Environ. 2014, 3, 70–92. [Google Scholar] [CrossRef]
  4. Rossetto, R.; Cantarella, H.; Dias, F.L.F.; Landell, M.G.A.; Vitti, A.C. Conservation management and nutrient recycling in sugarcane with a view to mechanical harvesting. Informações Agronômicas 2008, 124, 8–13. [Google Scholar]
  5. Devi, T.C.; Bharathalakshmi, M.; Kumari, M.B.G.S.; Naidu, N.V. Effect of sources and levels of phosphorus with zinc on yield and quality of sugarcane. Sugar Tech. 2012, 14, 195–198. [Google Scholar] [CrossRef]
  6. Savini, I.; Kihara, J.; Koala, S.; Mukalama, J.; Waswa, B.; Bationo, A. Long-term effects of TSP and Minjingu phosphate rock applications on yield response of maize and soybean in a humid tropical maize–legume cropping system. Nutr. Cycl. Agroecosyst. 2016, 104, 79–91. [Google Scholar] [CrossRef] [Green Version]
  7. Novais, R.D.; Braga, J.M.; Martins Filho, C.A.S. Efeito do tempo de incubação do fosfato-de-araxá em solos sobre o fósforo disponível. Rev. Bras. Cien. Solo 1980, 4, 153–155. [Google Scholar]
  8. Raij, B.V.; Cantarella, H.; Quaggio, J.; Furlani, A. Outras culturas industriais. In Recomendações de Adubação e Calagem Para o Estado de São Paulo; Instituto Agronômico de Campinas—IAC: Campinas, Brazil, 1997; Volume 100, pp. 233–243. [Google Scholar]
  9. Roy, E.D.; Richards, P.D.; Martinelli, L.A.; Della Coletta, L.; Lins, S.R.M.; Vazquez, F.F.; Willig, E.; Spera, S.A.; VanWey, L.K.; Porder, S. The phosphorus cost of agricultural intensification in the tropics. Nat. Plants 2016, 2, 16043. [Google Scholar] [CrossRef] [PubMed]
  10. Zapata, F.; Roy, R.N. Use of phosphate rocks for sustainable agriculture. FAO Fertil. Plant Nutr. Bull. 2004, 13, 1–148. [Google Scholar]
  11. Schröder, J.J.; Smit, A.L.; Cordell, D.; Rosemarin, A. Improved phosphorus use efficiency in agriculture: A key requirement for its sustainable use. Chemosphere 2011, 84, 822–831. [Google Scholar] [CrossRef] [PubMed]
  12. Crews, T.E.; Brookes, P.C. Changes in soil phosphorus forms through time in perennial versus annual agroecosystems. Agric. Ecosyst. Environ. 2014, 184, 168–181. [Google Scholar] [CrossRef]
  13. Hedley, M.J.; Stewart, J.W.B.; Chauhan, B. Changes in inorganic and organic soil phosphorus fractions induced by cultivation practices and by laboratory incubations. Soil Sci. Soc. Am. J. 1982, 46, 970–976. [Google Scholar] [CrossRef]
  14. Turner, B.L.; Cade-Menun, B.J.; Condron, L.M.; Newman, S. Extraction of soil organic phosphorus. Talanta 2005, 66, 294–306. [Google Scholar] [CrossRef] [PubMed] [Green Version]
  15. Empresa Brasileira de Pesquisa Agropecuaria—EMBRAPA. Sistema Brasileiro de Classificação do solo, 3rd ed.; EMBRAPA: Brasília, Brazil, 2013; p. 353. [Google Scholar]
  16. Soil Survey Staff. Keys to Soil Taxonomy, 12th ed.; United States Department of Agriculture—Natural Resources Conservation Service: Washington, DC, USA, 2014; p. 360. [Google Scholar]
  17. Universidade Federal de São Carlos—UFSCar. Programa de Melhoramento Genético da Cana-de-açúcar—PMGCA, Censo Varietal 2014; UFSCar: São Carlos, Brazil, 2016. [Google Scholar]
  18. Malavolta, E.; Vitti, G.C.; Oliveira, S.A. Avaliação do estado nutricional das plantas: Princípios e aplicações, 2nd ed.; POTAFOS: Piracicaba, Brazil, 1997; p. 319. [Google Scholar]
  19. Condron, L.M.; Goh, K.M.; Newman, R.H. Nature and distribution of soil phosphorus as revealed by a sequential extraction method followed by 31P nuclear magnetic resonance analysis. J. Soil Sci. 1985, 36, 199–207. [Google Scholar] [CrossRef]
  20. Brookes, P.C.; Powlson, D.S. Preventing phosphorus losses during perchloric acid digestion of sodium bicarbonate soil extracts. J. Sci. Food Agri. 1981, 32, 671–674. [Google Scholar] [CrossRef]
  21. Murphy, J.; Riley, J.P. A modified single solution method for the determination of phosphate in natural waters. Anal. Chim. Acta 1962, 27, 31–36. [Google Scholar] [CrossRef]
  22. Dick, W.A.; Tabatabai, M.A. Determination of orthophosphate in aqueous solutions containing labile organic and inorganic phosphorus compounds. J. Environ. Qual. 1977, 6, 82–85. [Google Scholar] [CrossRef]
  23. USEPA—United States Environmental Protection Agency. Methods of Chemical Analysis for Water and Wastes; Environmental Protection Agency: Cincinnati, OH, USA, 1971; p. 312. [Google Scholar]
  24. Sui, Y.; Thompson, M.L. Phosphorus sorption, desorption, and buffering capacity in a biosolids-amended mollisol. Soil Sci. Soc. Am. J. 2000, 64, 164–169. [Google Scholar] [CrossRef]
  25. Jackson, M.L. Soil Chemical Analysis—Advanced Course, 2nd ed.; University of Wisconsin, College of Agric., Department of Soils: Madison, WI, USA, 1979. [Google Scholar]
  26. Box, G.E.; Cox, D.R. An analysis of transformations. J. R. Stat. Soc. Ser. B (Methodol.) 1964, 26, 211–252. [Google Scholar]
  27. Caione, G.; de Mello Prado, R.; Campos, C.N.S.; Rodrigues, M.; Pavinato, P.S.; Agostinho, F.B. Phosphorus fractionation in soil cultivated with sugarcane fertilized by filter cake and phosphate sources. Commun. Soil Sci. Plant Anal. 2015, 46, 2449–2459. [Google Scholar] [CrossRef]
  28. Dos Santos, V.R.; Filho, G.M.; de Albuquerque, A.W.; da Costa, J.P.; dos Santos, C.G.; dos Santos, A.C. Crescimento e produtividade agrícola de cana-de-açúcar em diferentes fontes de fósforo. Rev. Bras. Eng. Agríc. Ambient. 2009, 13, 389–396. [Google Scholar] [CrossRef] [Green Version]
  29. Tsado, P.A.; Lawal, B.A.; Igwe, C.A.; Adeboye, M.K.A.; Odofin, A.J.; Adekambi, A.A. Effects of sources and levels of phosphorus on yield and quality of sugarcane in Southern Guinea Savanna Zone of Nigeria. Agric. Sci. Dev. 2013, 2, 25–27. [Google Scholar]
  30. De Sousa, R.T.X.; Korndörfer, G.H.; Brem Soares, R.A.; Fontoura, P.R. Phosphate fertilizers for sugarcane used at pre-planting (phosphorus fertilizer application). J. Plant Nutr. 2015, 38, 1444–1455. [Google Scholar] [CrossRef]
  31. Hammond, L.L.; Chien, S.H.; Easterwood, G.W. Agronomic effectiveness of Bayovar phosphate rock in soil with induced phosphorus retention. Soil Sci. Soc. Am. J. 1986, 50, 1601–1606. [Google Scholar] [CrossRef]
  32. Ruaysoongnern, S.; Keerati-Kasikorn, P. Role of phosphorus fertilization in improving the soil fertility of acid tropical and subtropical soils in Asia. In Nutrient Management for Sustainable Crop Production in Asia; Johnston, A.E., Syers, J.K., Eds.; CAB International: Oxon, UK; New York, NY, USA, 1998; p. 394. [Google Scholar]
  33. Negassa, W.; Leinweber, P. How does the Hedley sequential phosphorus fractionation reflect impacts of land use and management on soil phosphorus: A review. J. Plant Nutr. Soil Sci. 2009, 172, 305–325. [Google Scholar] [CrossRef]
  34. Conte, E.; Anghinoni, I.; Rheinheimer, D.D.S. Frações de fósforo acumuladas em Latossolo argiloso pela aplicação de fosfato no sistema plantio direto. Bras. Cien. Solo 2003, 27, 893–900. [Google Scholar] [CrossRef] [Green Version]
  35. Tiessen, H.J.W.B.; Stewart, J.W.B.; Cole, C.V. Pathways of phosphorus transformations in soils of differing pedogenesis. Soil Sci. Soc. Am. J. 1984, 48, 853–858. [Google Scholar] [CrossRef]
  36. Pavinato, P.S.; Merlin, A.; Rosolem, C.A. Phosphorus fractions in Brazilian Cerrado soils as affected by tillage. Soil Till. Res. 2009, 105, 149–155. [Google Scholar] [CrossRef]
  37. Rodrigues, M.; Pavinato, P.S.; Withers, P.J.A.; Teles, A.P.B.; Herrera, W.F.B. Legacy phosphorus and no tillage agriculture in tropical oxisols of the Brazilian savanna. Sci. Total Environ. 2016, 542, 1050–1061. [Google Scholar] [CrossRef] [PubMed]
  38. Zoysa, A.K.N.; Loganathan, P.; Hedley, M.J. Comparison of the agronomic effectiveness of a phosphate rock and triple superphosphate as phosphate fertilisers for tea (Camellia sinensis L.) on a strongly acidic Ultisol. Nutr. Cycl. Agroecosyst. 2001, 59, 95–105. [Google Scholar] [CrossRef]
  39. Hocking, P.J. Organic acids exuded from roots in phosphorus uptake and aluminum tolerance of plants in acid soils. Adv. Agron. 2001, 74, 63–97. [Google Scholar]
  40. Tambunan, D.; Hedley, M.J.; Bolan, N.S.; Turner, M.A. A comparison of sequential extraction procedures for measuring phosphate rock residues in soils. Fert. Res. 1993, 35, 183–191. [Google Scholar] [CrossRef]
  41. Chien, S.H.; Sale, P.W.G.; Hammond, L.L. Comparison of the Effectiveness of Phosphorus Fertilizer Products; International Rice Research Institute: Manila, Philippines, 1990; pp. 143–156. [Google Scholar]
  42. Shigaki, F.; Sharpley, A. Phosphorus source and soil properties effects on phosphorus availability. Soil Sci. 2011, 176, 502–507. [Google Scholar] [CrossRef]
  43. Pizzeghello, D.; Berti, A.; Nardi, S.; Morari, F. Relationship between soil test phosphorus and phosphorus release to solution in three soils after long-term mineral and manure application. Agric Ecosyst. Environ. 2016, 233, 214–223. [Google Scholar] [CrossRef]
Figure 1. X-ray diffraction of the clay fraction from the depth of 0–20 cm treated with dithionate-citrate-bicarbonate (DCB) (A) and without DCB (B). An, anatase; Cl, chlorite; Gb, gibbsite; Hm, Hematite; Kt, Kaolinite.
Agronomy 08 00283 g001
Figure 2. Cane yield (A); and sugarcane total P uptake (B) in different treatments. Means followed by the same letter were not significantly different at p < 0.05 by LSD test. Control treatment: no phosphorus addition; TSP, triple superphosphate; RP, rock phosphate; B + F, half broadcast and half furrow.
Agronomy 08 00283 g002
Figure 3. Changes of: PAER (A); PiBIC (B); and PoBIC (C) affected by different treatments in different soil layers. Horizontal bars show the standard error for the mean comparisons. Control treatment: no phosphorus addition; TSP: triple superphosphate; RP, rock phosphate; B, broadcast; F, furrow; B + F, half broadcast and half furrow.
Agronomy 08 00283 g003
Figure 4. Changes of: PiHID-0.1 (A); PoHID-0.1 (B); and PHCl (C) affected by different treatments in different soil layers. Horizontal bars show the standard error for the mean comparisons.
Agronomy 08 00283 g004
Figure 5. Changes of: PiHID-0.5 (A); PoHID-0.5 (B); and PResidual (C) affected by different treatments in different soil layers. Horizontal bars show the standard error for the mean comparisons.
Agronomy 08 00283 g005
Table 1. Selected physical and chemical properties of the soil before establishment of the sugarcane trial in 2013.
DepthpH CaCl2OM aP-resinKCaMgAlH + AlSB bCECBS cm dTextureDCBOxalatePMAC g
SandSiltClayFed eAld eFeo fAlo f
cm g kg1mg kg1mmolc kg−1%g kg−1mg kg−1
0−204.312.541.66.0432711.838.13116884411215.342.30.61.4342
20−403.9 31.93.026386.844.8154883527138
40−604.0 20.82.80.87344.338.5116383217151
60−803.9 10.72.80.99313.834.6117082524151
a Organic matter; b Sum of basic cations; c Base saturation; d Al saturation; e Fe and Al extracted by dithionate-citrate-bicarbonate; f Fe and Al extracted by ammonium oxalate; g Maximum soil adsorption capacity of P.
Table 2. Changes in soil P fractions compared to control treatment under sugarcane cultivation submitted to distinct phosphate sources and management after two years from cultivation.
ManagementPAERPiBICPoBICPiHID-0.1PoHID-0.1PHClPiHID-0.5PoHID-0.5PResidualPTotal
TSPRPTSPRPTSPRPTSPRPTSPRPTSPRPTSPRPTSPRPTSPRPTSPRP
mg kg−1
0–40 cm
Broadcast1.44.81.80.72.52.55.41.5−11.9−2.2−1.949.50.06.1−1.212.33.3−0.9−0.674.2
B + F6.04.24.31.61.75.014.94.67.233.92.555.33.79.5−4.3−1.46.6−2.142.6110.5
Furrow11.45.05.90.112.51.317.21.116.85.23.242.06.13.6−1.99.30.5−0.371.767.2
TSP—Triple superphosphate; RP—Rock phosphate; B + F—Half broadcast and half furrow. PAER —P extracted by anion exchange resin; PiBIC and PoBIC—Inorganic and organic P extracted by NaHCO3 0.5 mol L−1 respectively; PiHID-0.1 and PoHID-0.1—Inorganic and organic P extracted by NaOH 0.1 mol L−1 respectively; PHCl—Inorganic P extracted by HCl 1.0 mol L−1; PiHID-0.5, PoHID-0.5—Inorganic and organic P extracted by NaOH 0.5 mol L−1 respectively; PResidual—P extracted by H2SO4 + 30% H2O2 and saturated MgCl; PTotal—Sum of all previous fractions.

