
Soil Carbon and Nitrogen Stocks of Different Hawaiian Sugarcane Cultivars

Abstract
:1. Introduction
2. Materials and Methods
2.1. Study Area
2.2. Baseline Soil Properties of the Experimental Plots
2.3. Soil Variables
2.4. Plant Measurements
2.5. Statistical Analysis
3. Results
3.1. Soil Chemical Properties

| Soil | Soil Depth | pH 1 | EC a,1 | [Ca2+ | Mg2+ | K+ | Na+ | CEC]a,2 |
|---|---|---|---|---|---|---|---|---|
| cm | 1:1 | dS·m−1 | -----------------cmolc·kg−1 ------------- | |||||
| Pulehu | 0–20 | 8.10 b | 0.47 | 19.4 | 1.30 | 0.40 | 0.60 | 21.8 |
| 20–40 | 8.19 | 0.32 | 21.1 | 0.90 | 0.30 | 0.60 | 22.9 | |
| 40–80 | 8.23 | 0.30 | 22.4 | 1.80 | 0.30 | 0.80 | 25.3 | |
| 80–120 | 8.23 | 0.29 | 16.0 | 4.40 | 0.60 | 2.30 | 23.4 | |
| Molokai | 0–20 | 7.97 | 0.81 | 9.16 | 4.70 | 0.65 | 1.69 | 16.2 |
| 20–40 | 7.97 | 0.94 | 7.69 | 3.98 | 0.39 | 1.60 | 13.7 | |
| 40–80 | 7.55 | 1.13 | 4.11 | 2.41 | 0.13 | 4.12 | 10.8 | |
| 80–120 | 7.51 | 1.50 | 2.69 | 2.37 | 0.18 | 6.84 | 12.1 | |
| Soil | Soil Depth | TC | TN | BD a | Sand c | Silt c | Clay c | Texture d |
|---|---|---|---|---|---|---|---|---|
| cm | ---- kg·m−2---- | ---g·cm−3--- | ---------%--------- | |||||
| Pulehu | 0–20 | 4.26b | 0.90 | 1.37 | 53.8 | 15.8 | 30.4 | SCL |
| 20–40 | 3.98 | 0.78 | 1.39 | 58.9 | 11.6 | 29.4 | SCL | |
| 40–80 | 5.40 | 1.04 | 1.34 | 43.5 | 25.2 | 31.3 | C | |
| 80–120 | 5.25 | 0.78 | 1.32 | 41.6 | 22.0 | 36.4 | L | |
| Molokai | 0–20 | 2.91 | 0.31 | 1.26 | 27.0 | 44.2 | 28.0 | C |
| 20–40 | 2.86 | 0.26 | 1.23 | 22.0 | 50.2 | 27.8 | C | |
| 40–80 | 4.16 | 0.36 | 1.26 | 28.7 | 46.4 | 24.8 | L | |
| 80–120 | 3.38 | 0.21 | 1.31 | 36.5 | 36.6 | 26.8 | L | |
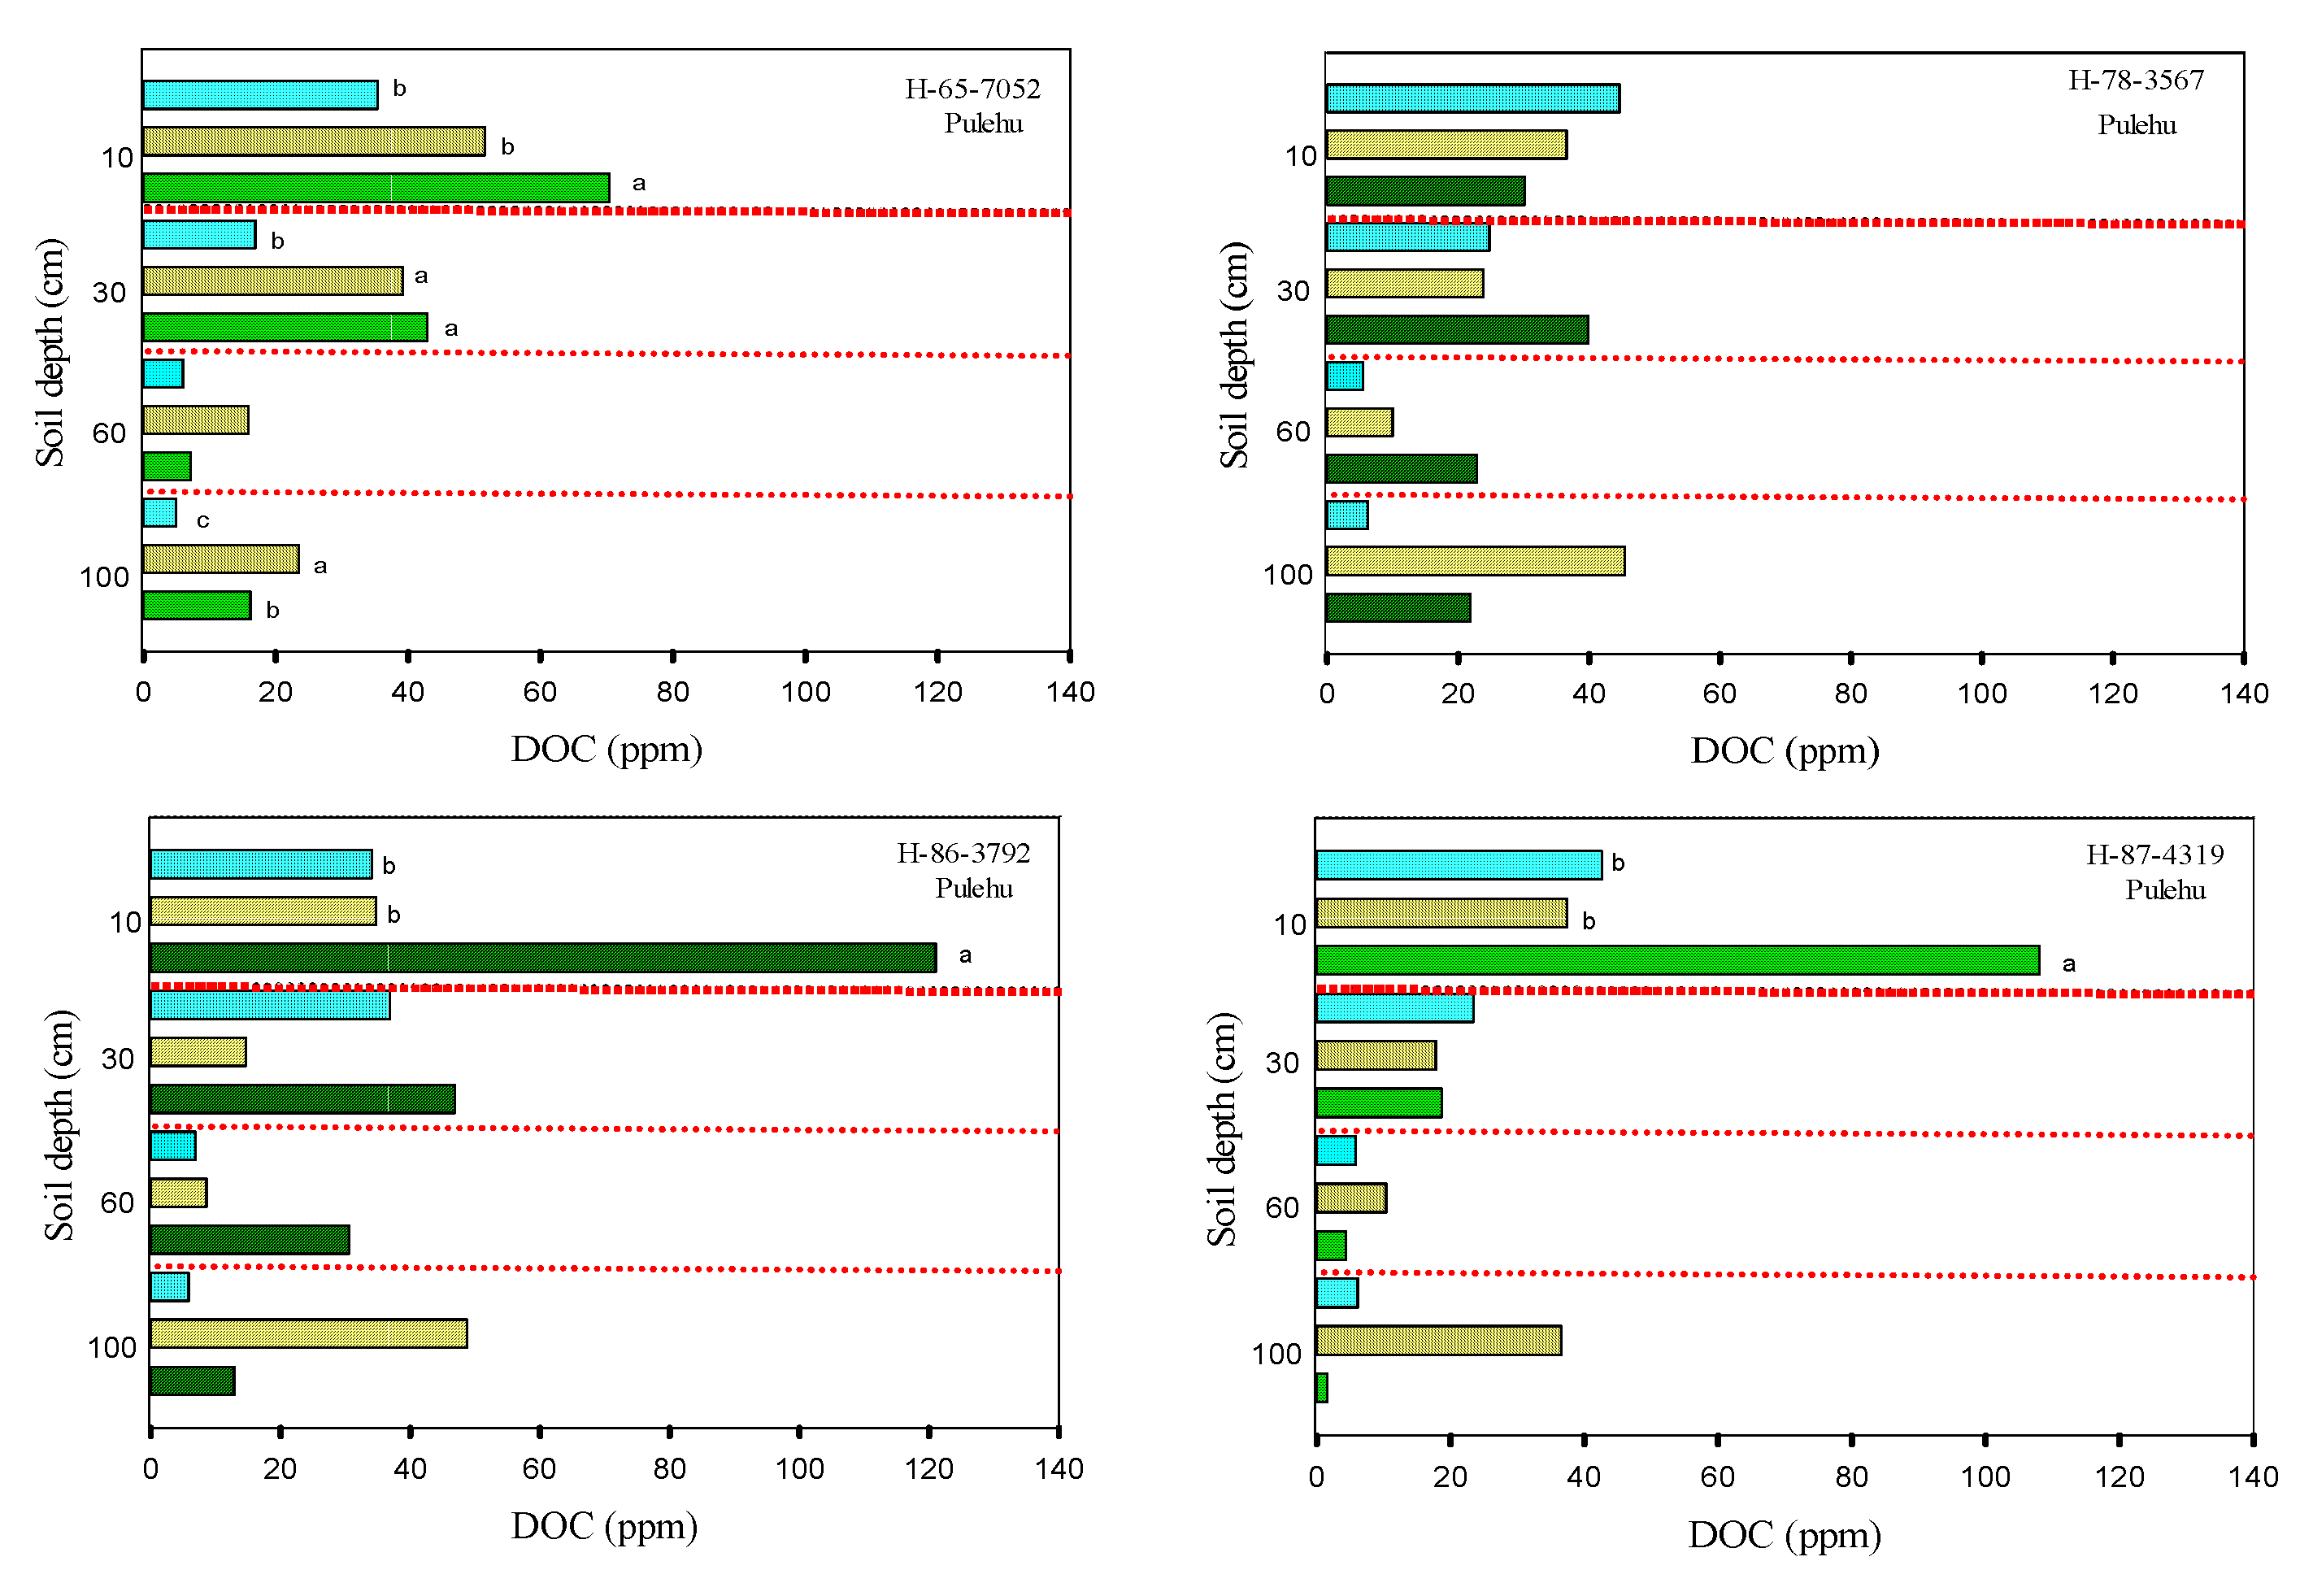
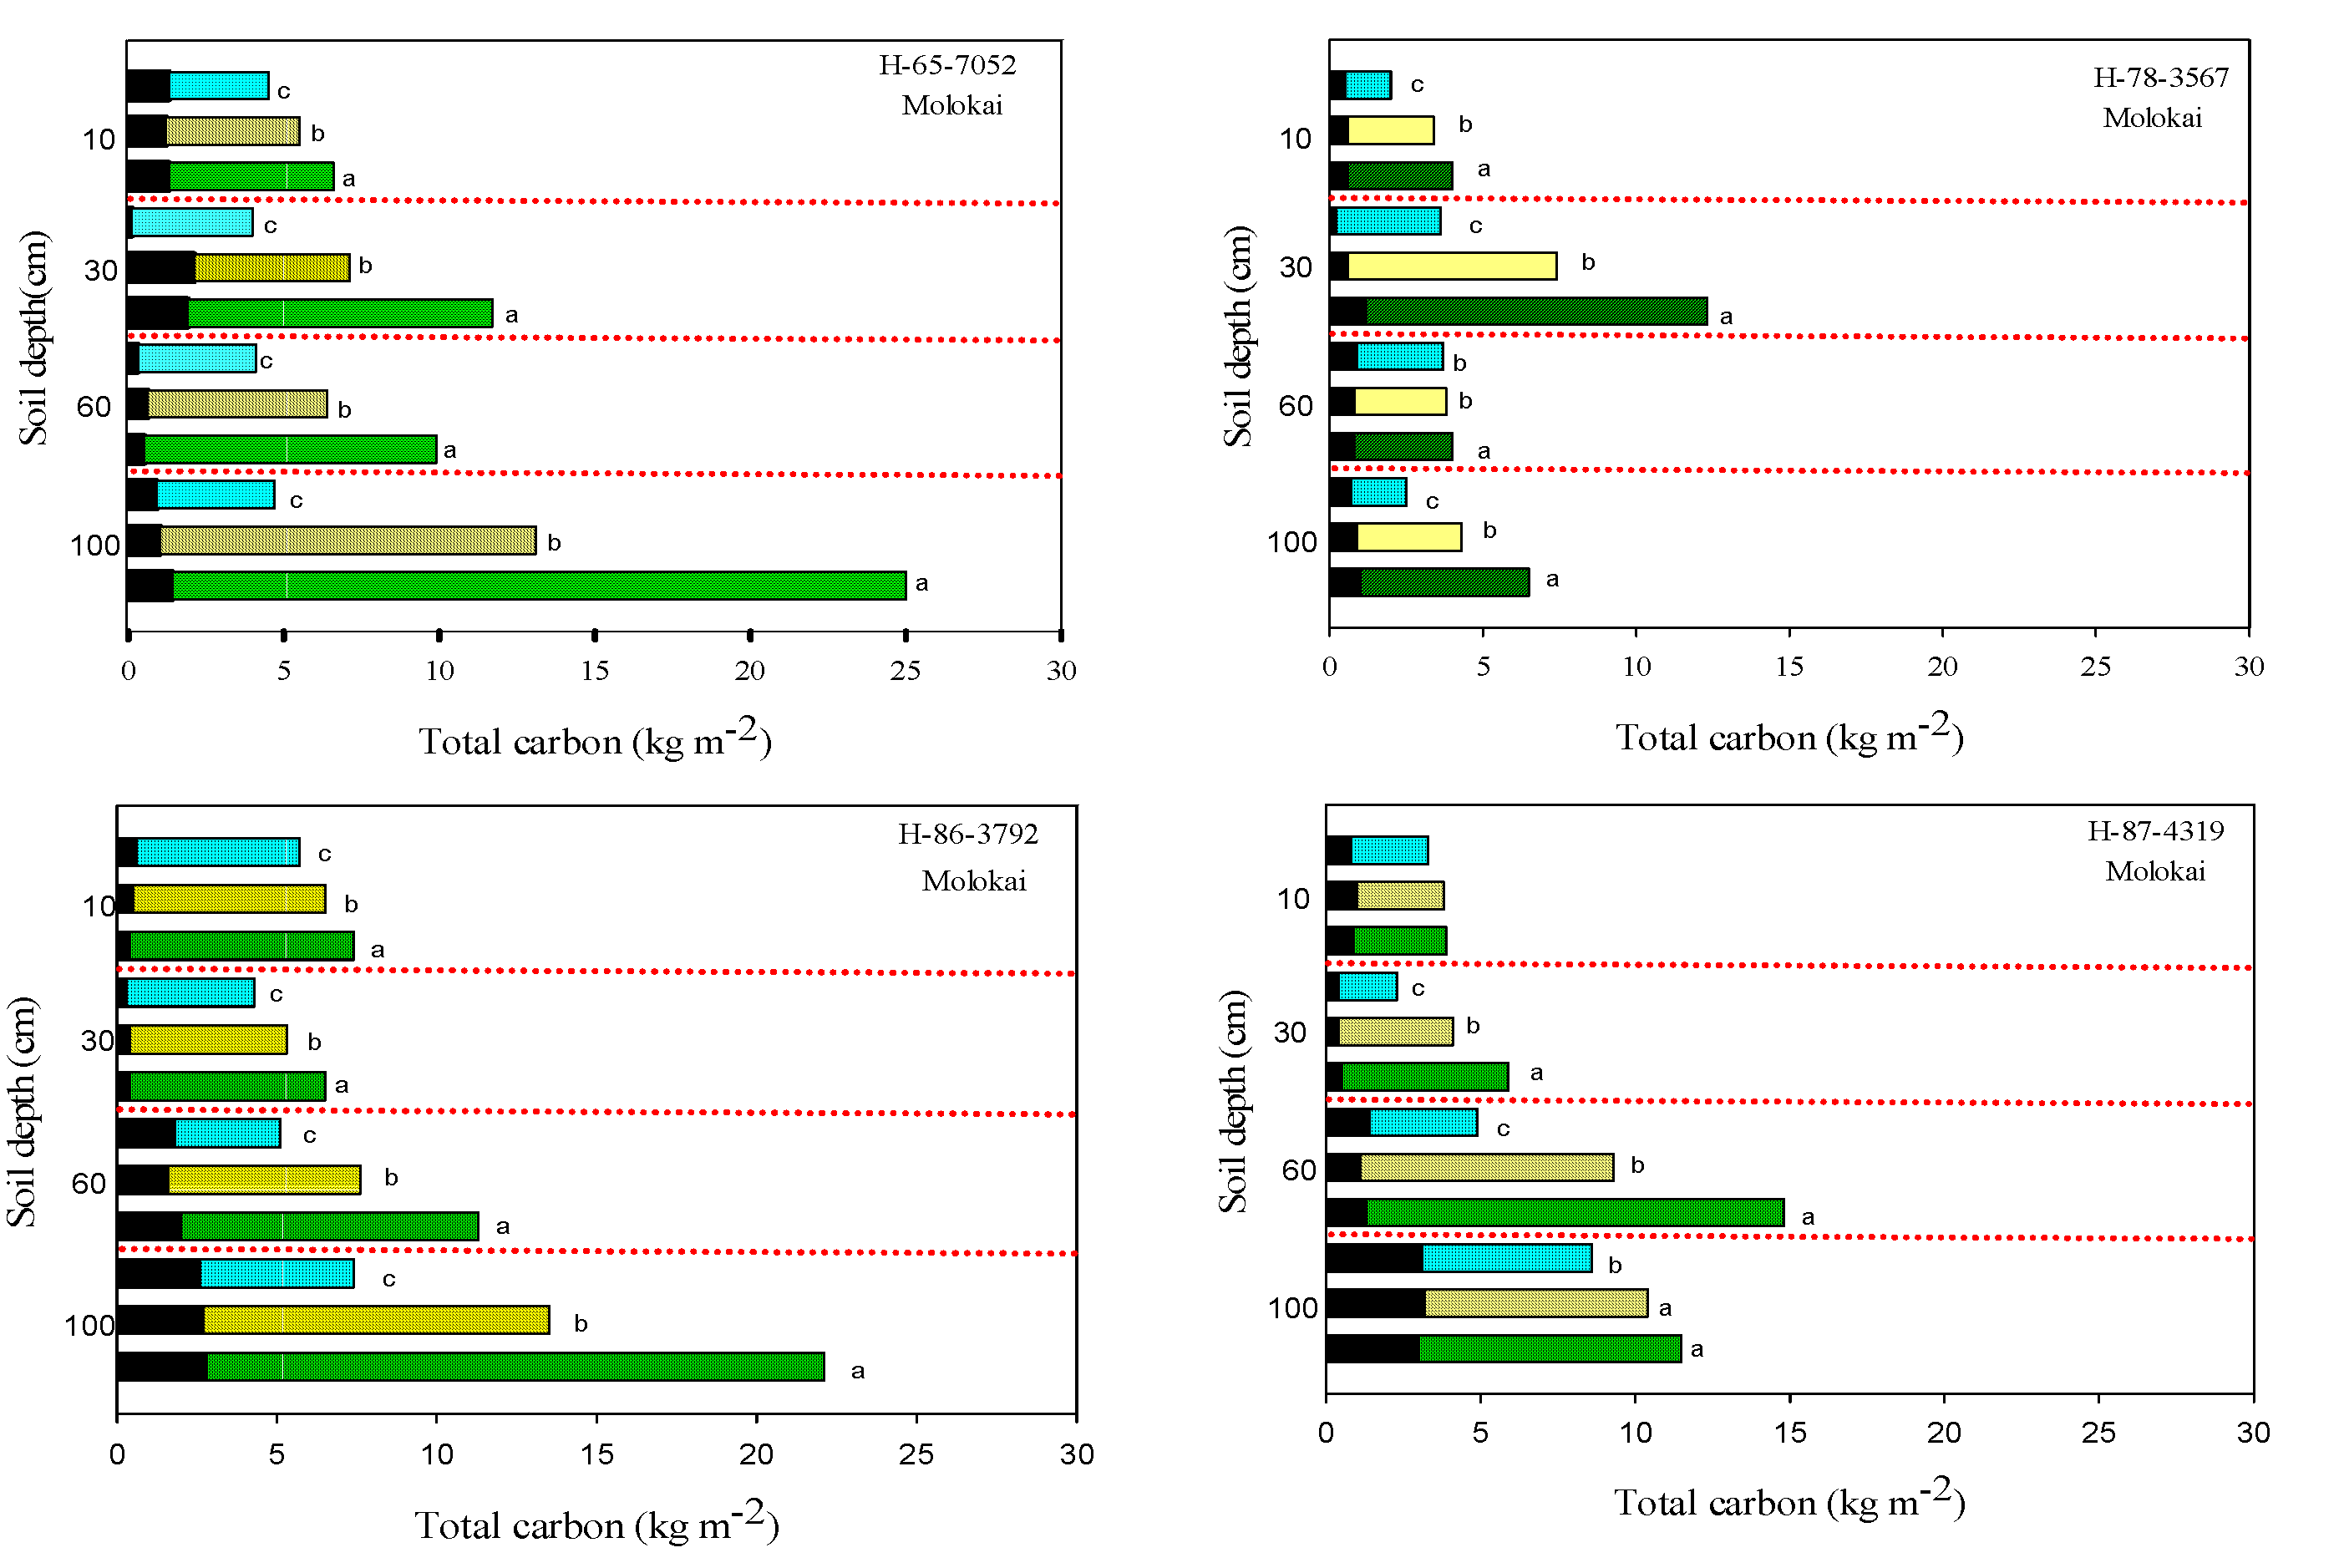
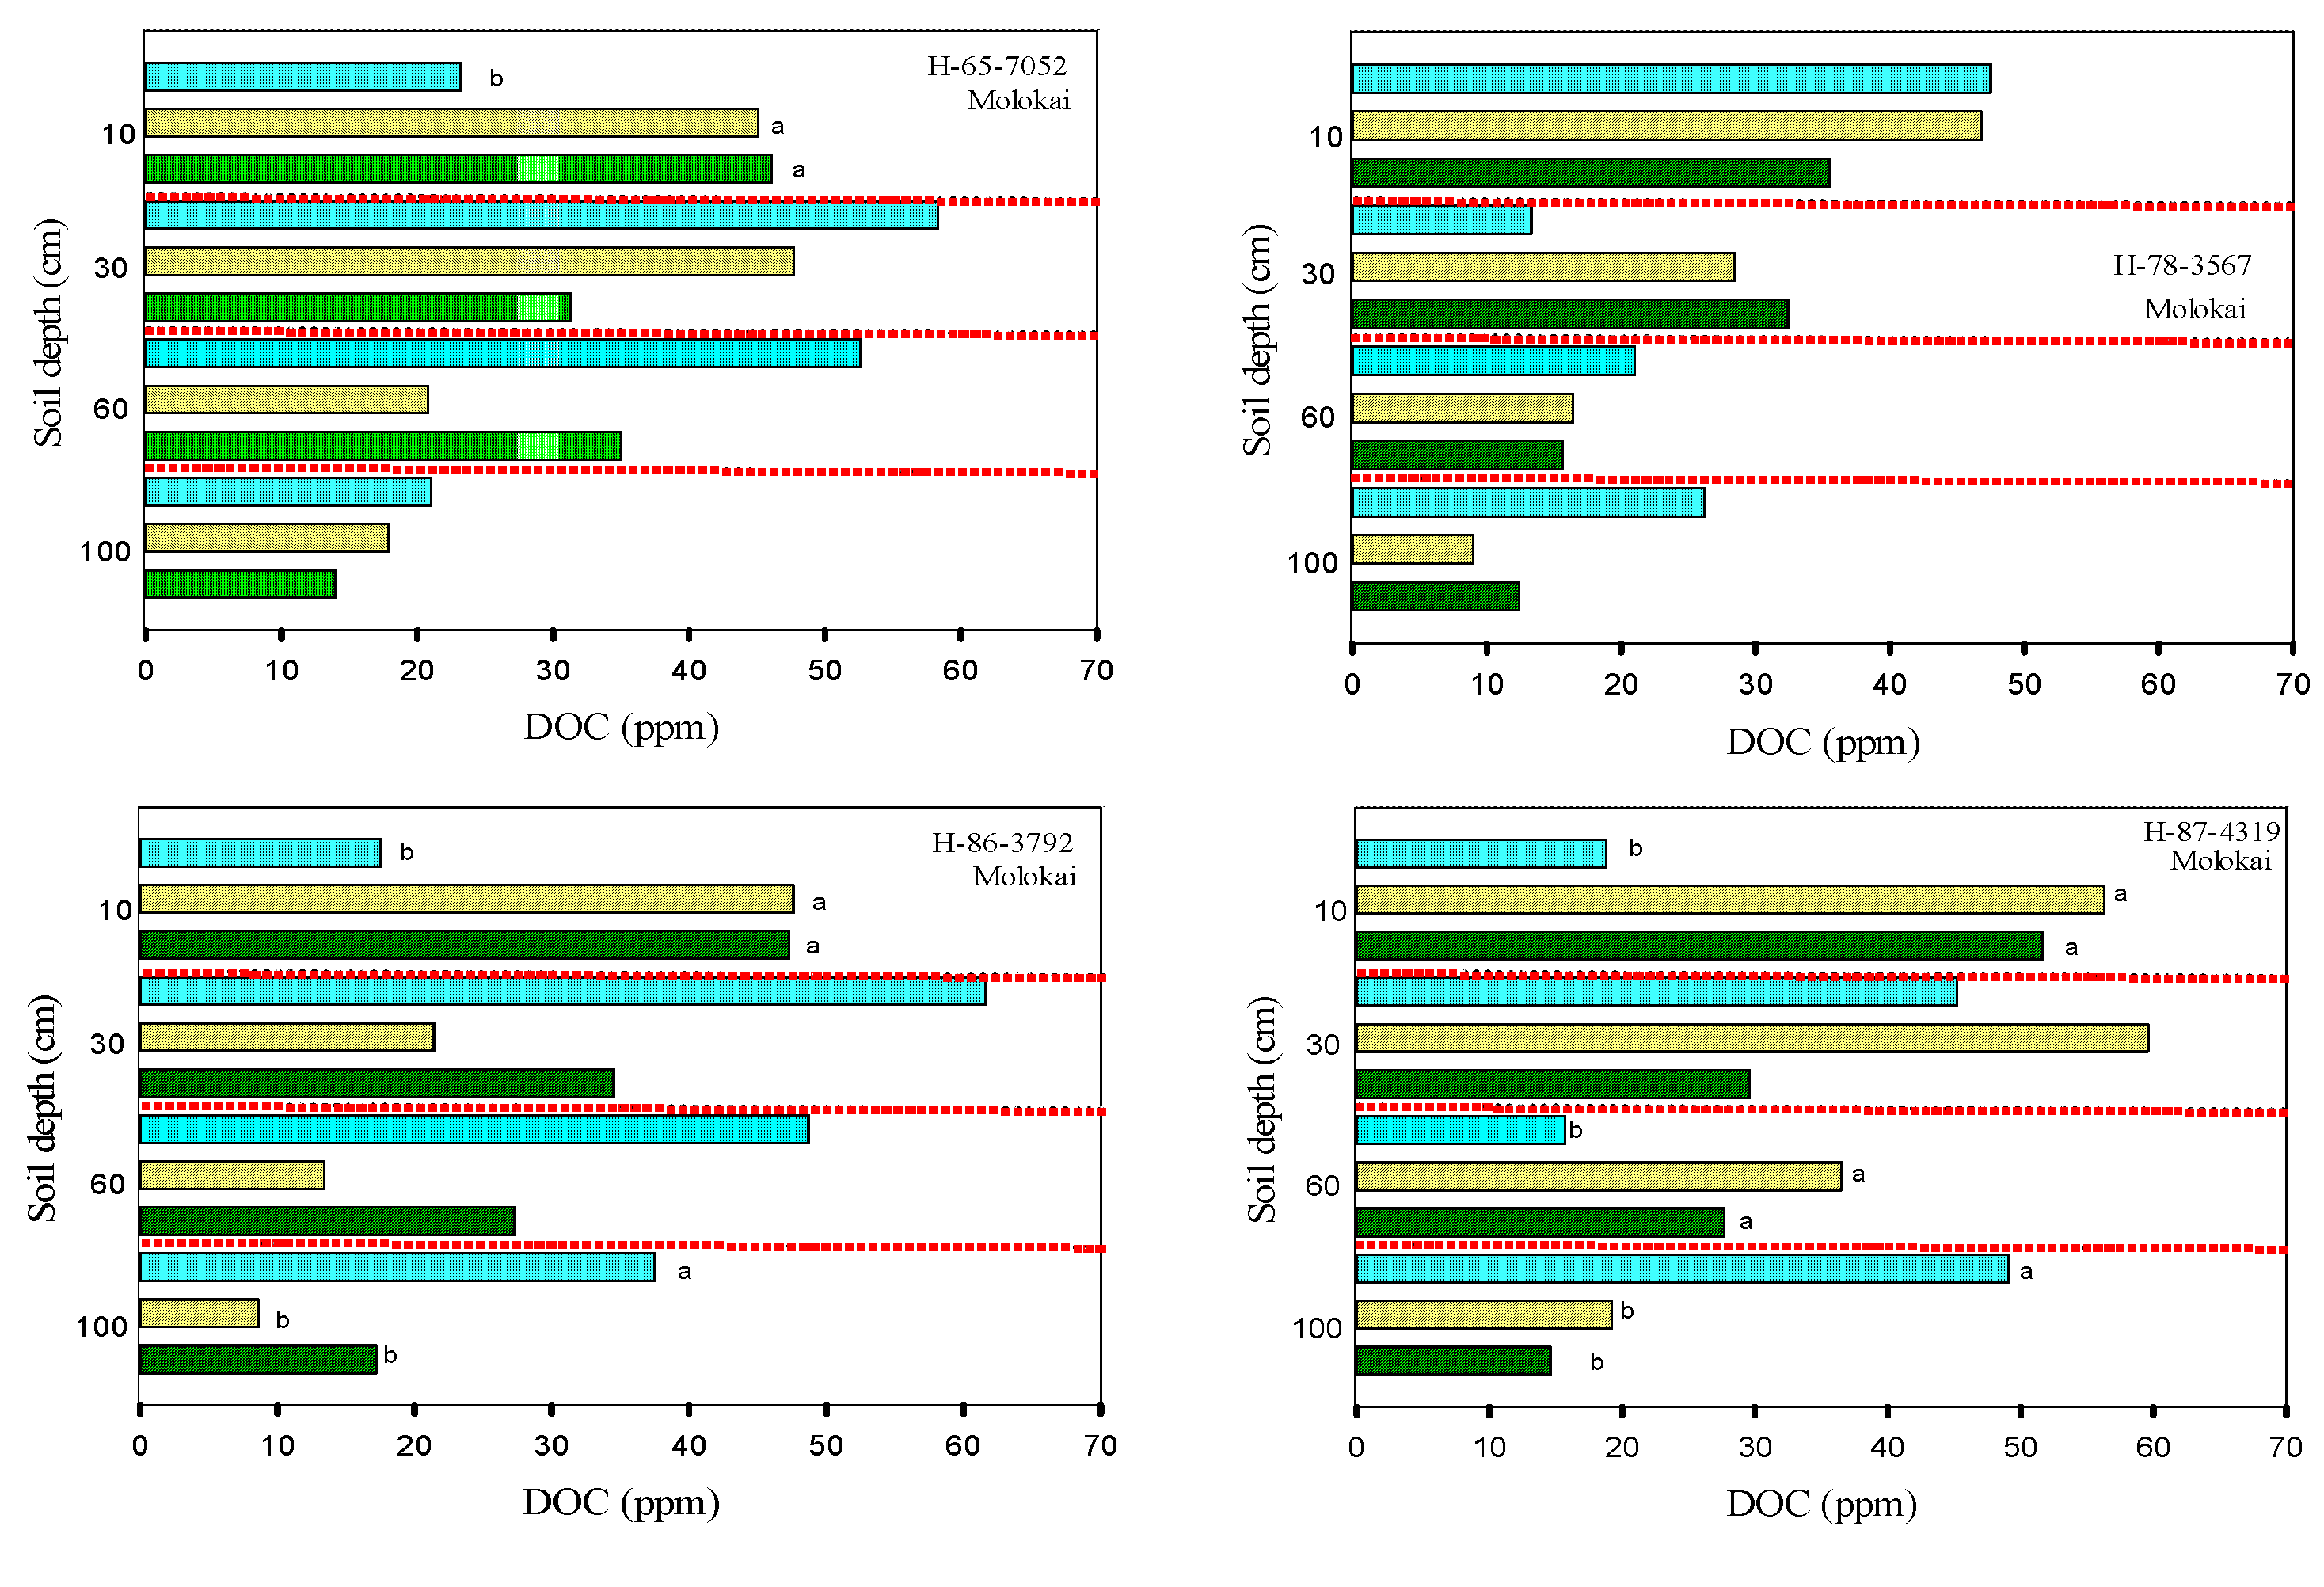
3.2. Soil Carbon

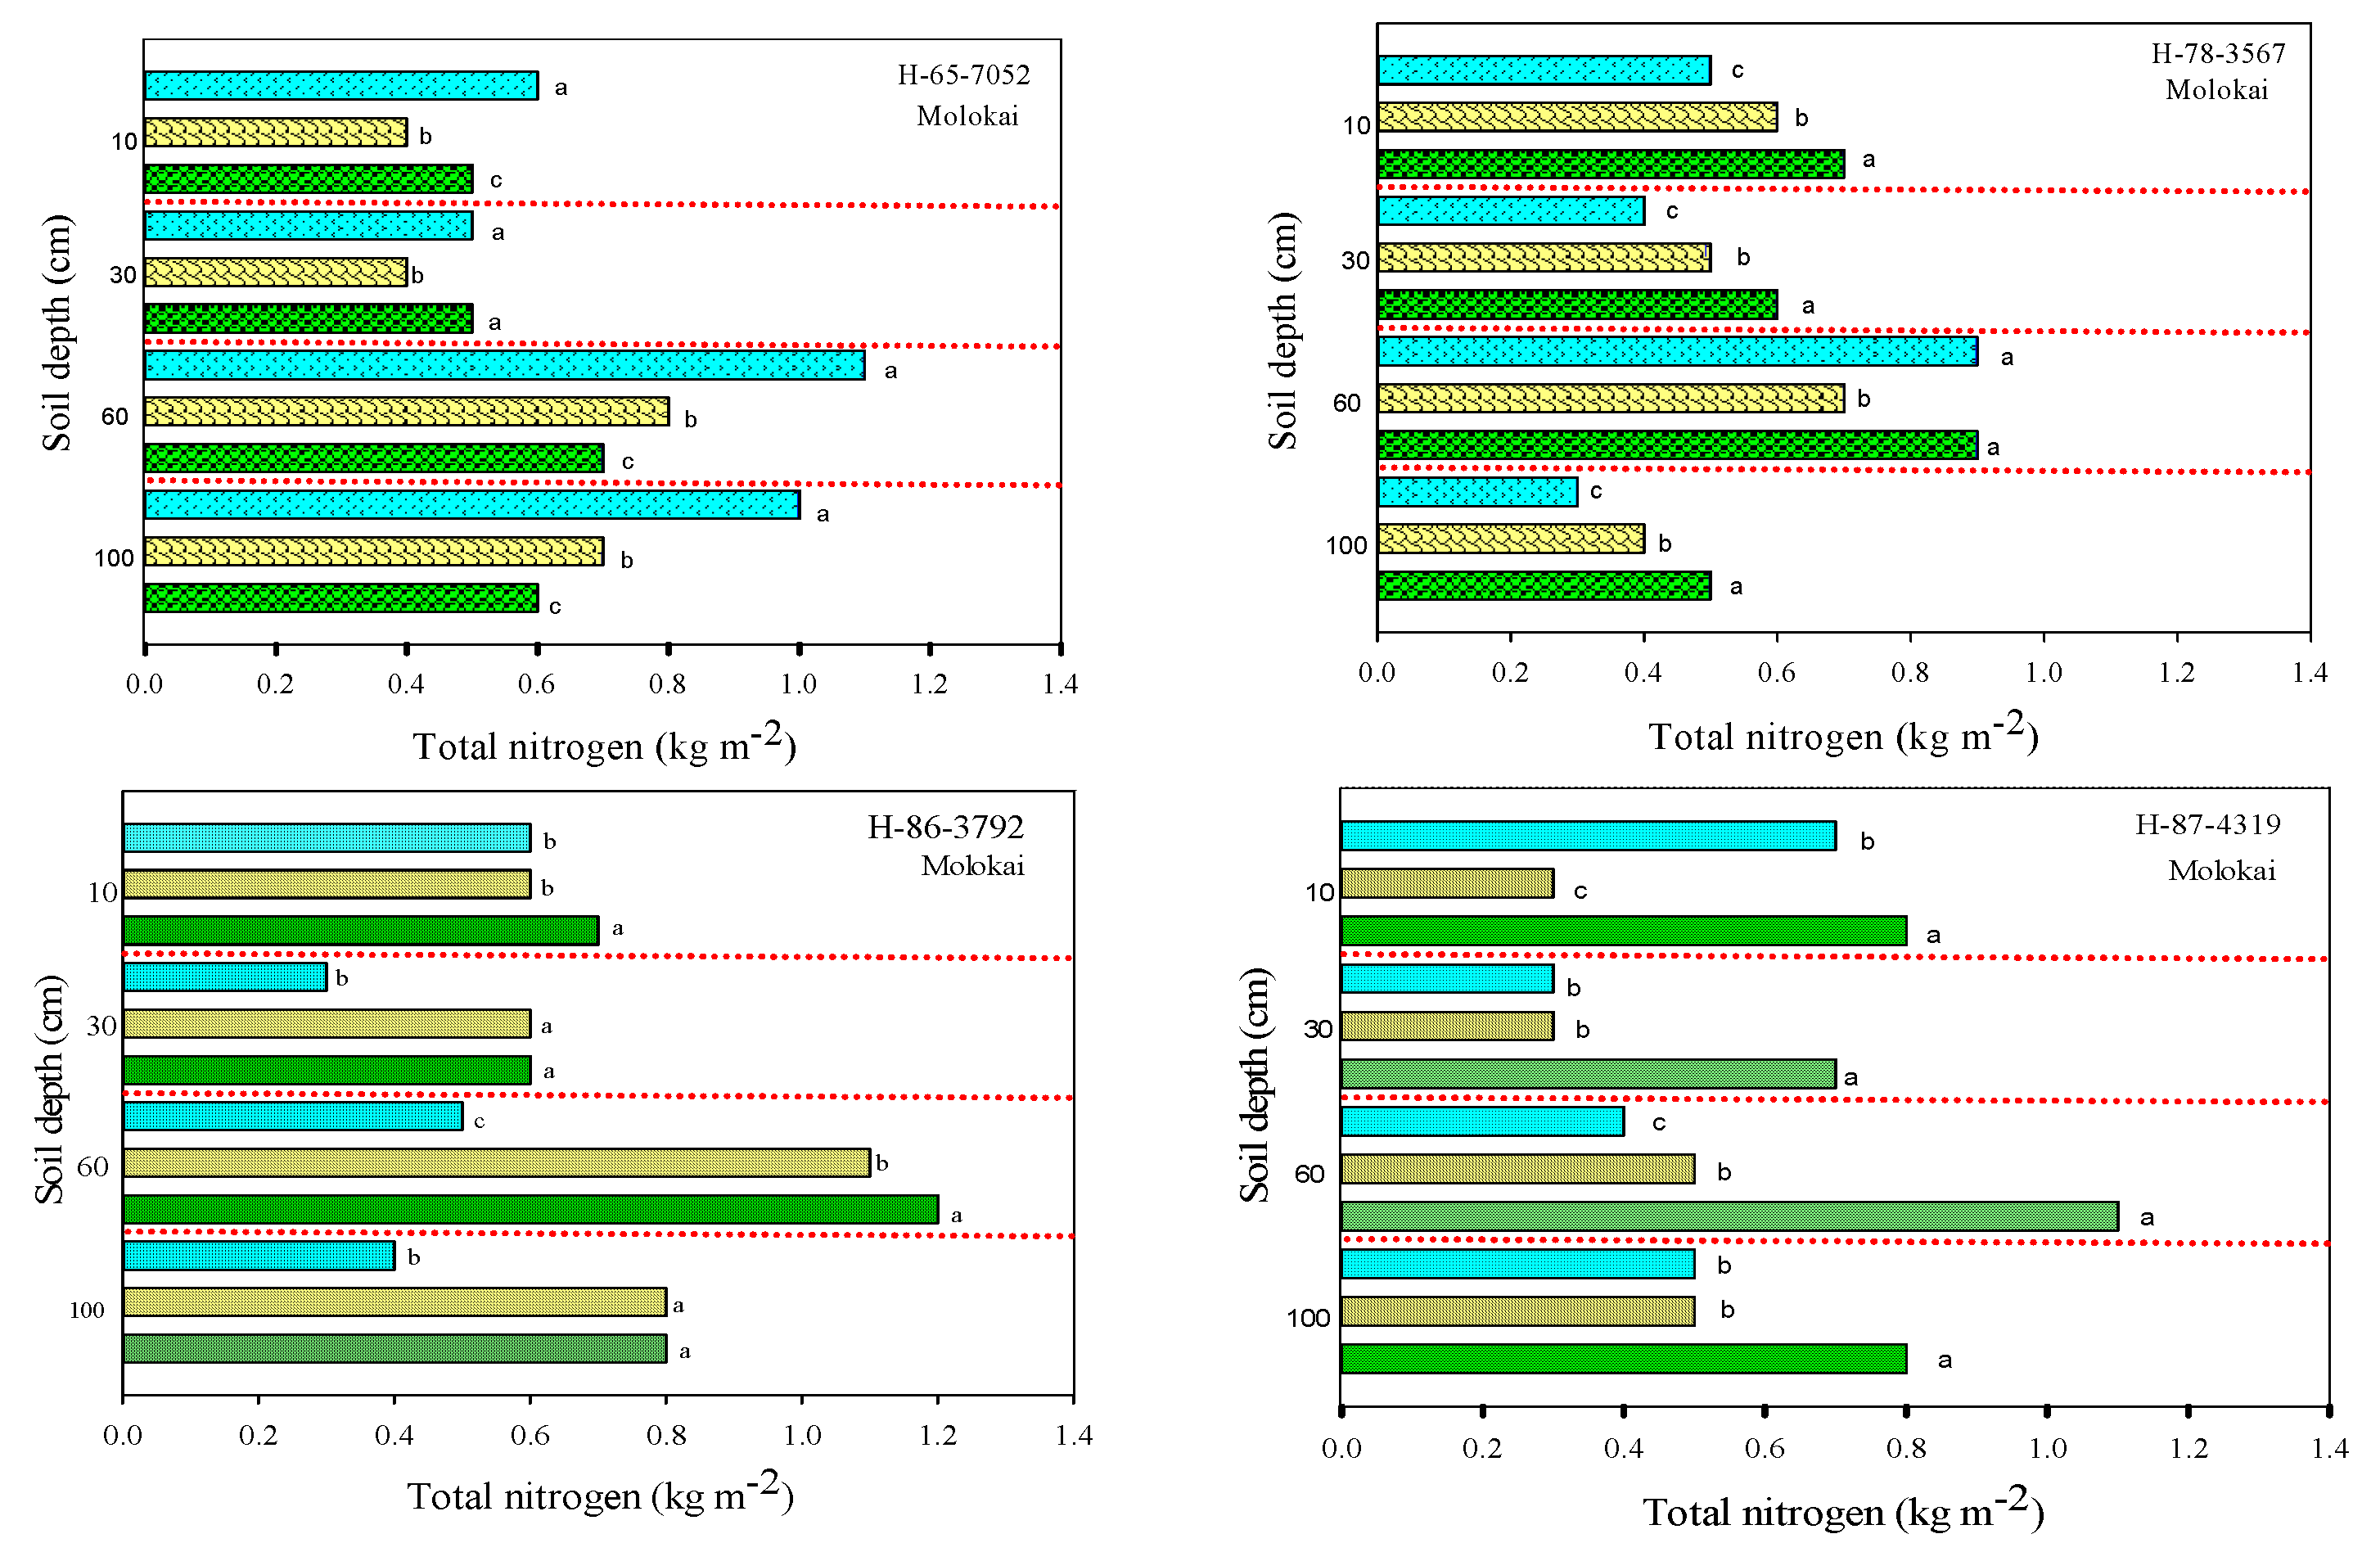
3.3. Soil Total Nitrogen and Nitrates
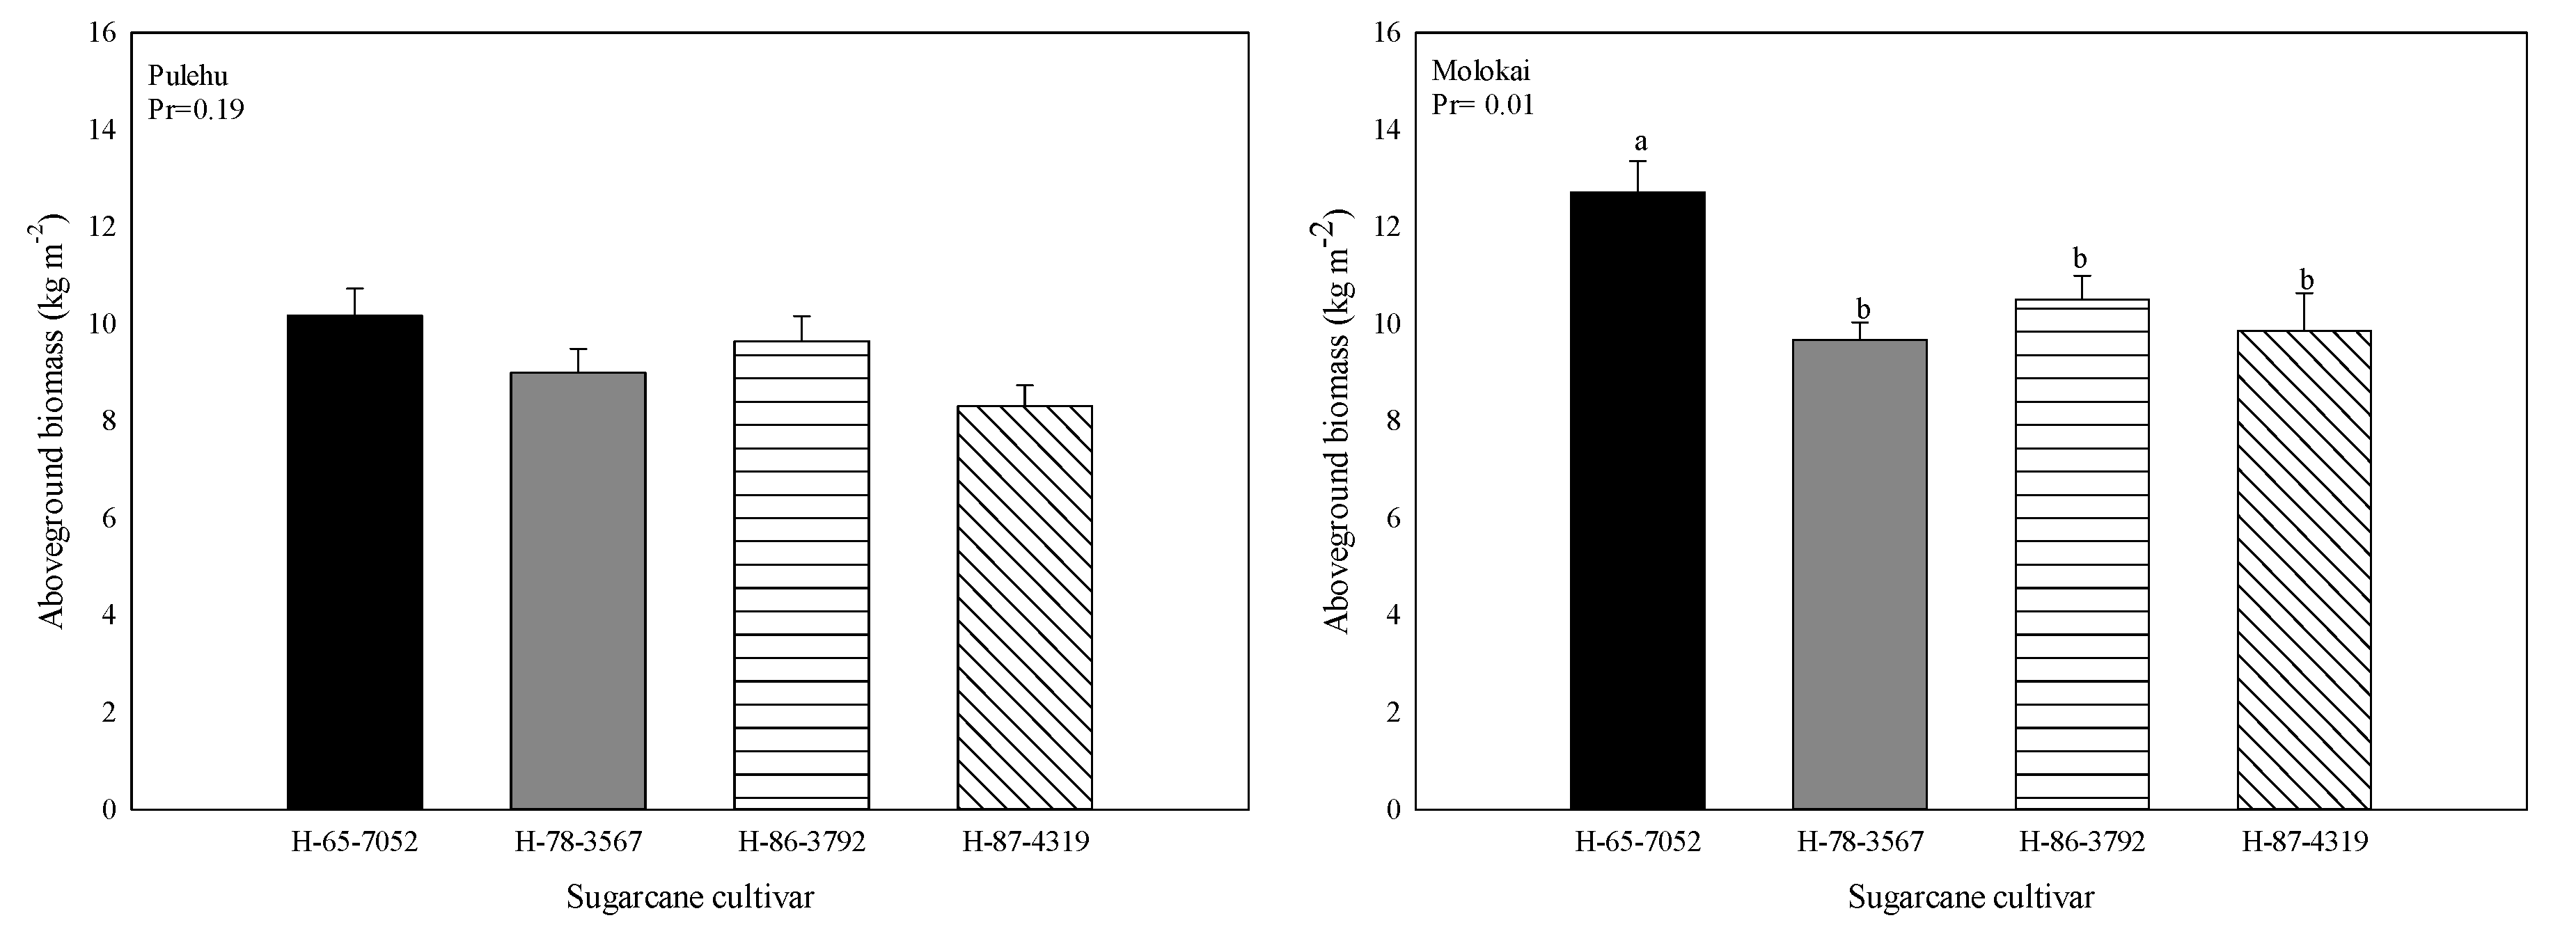
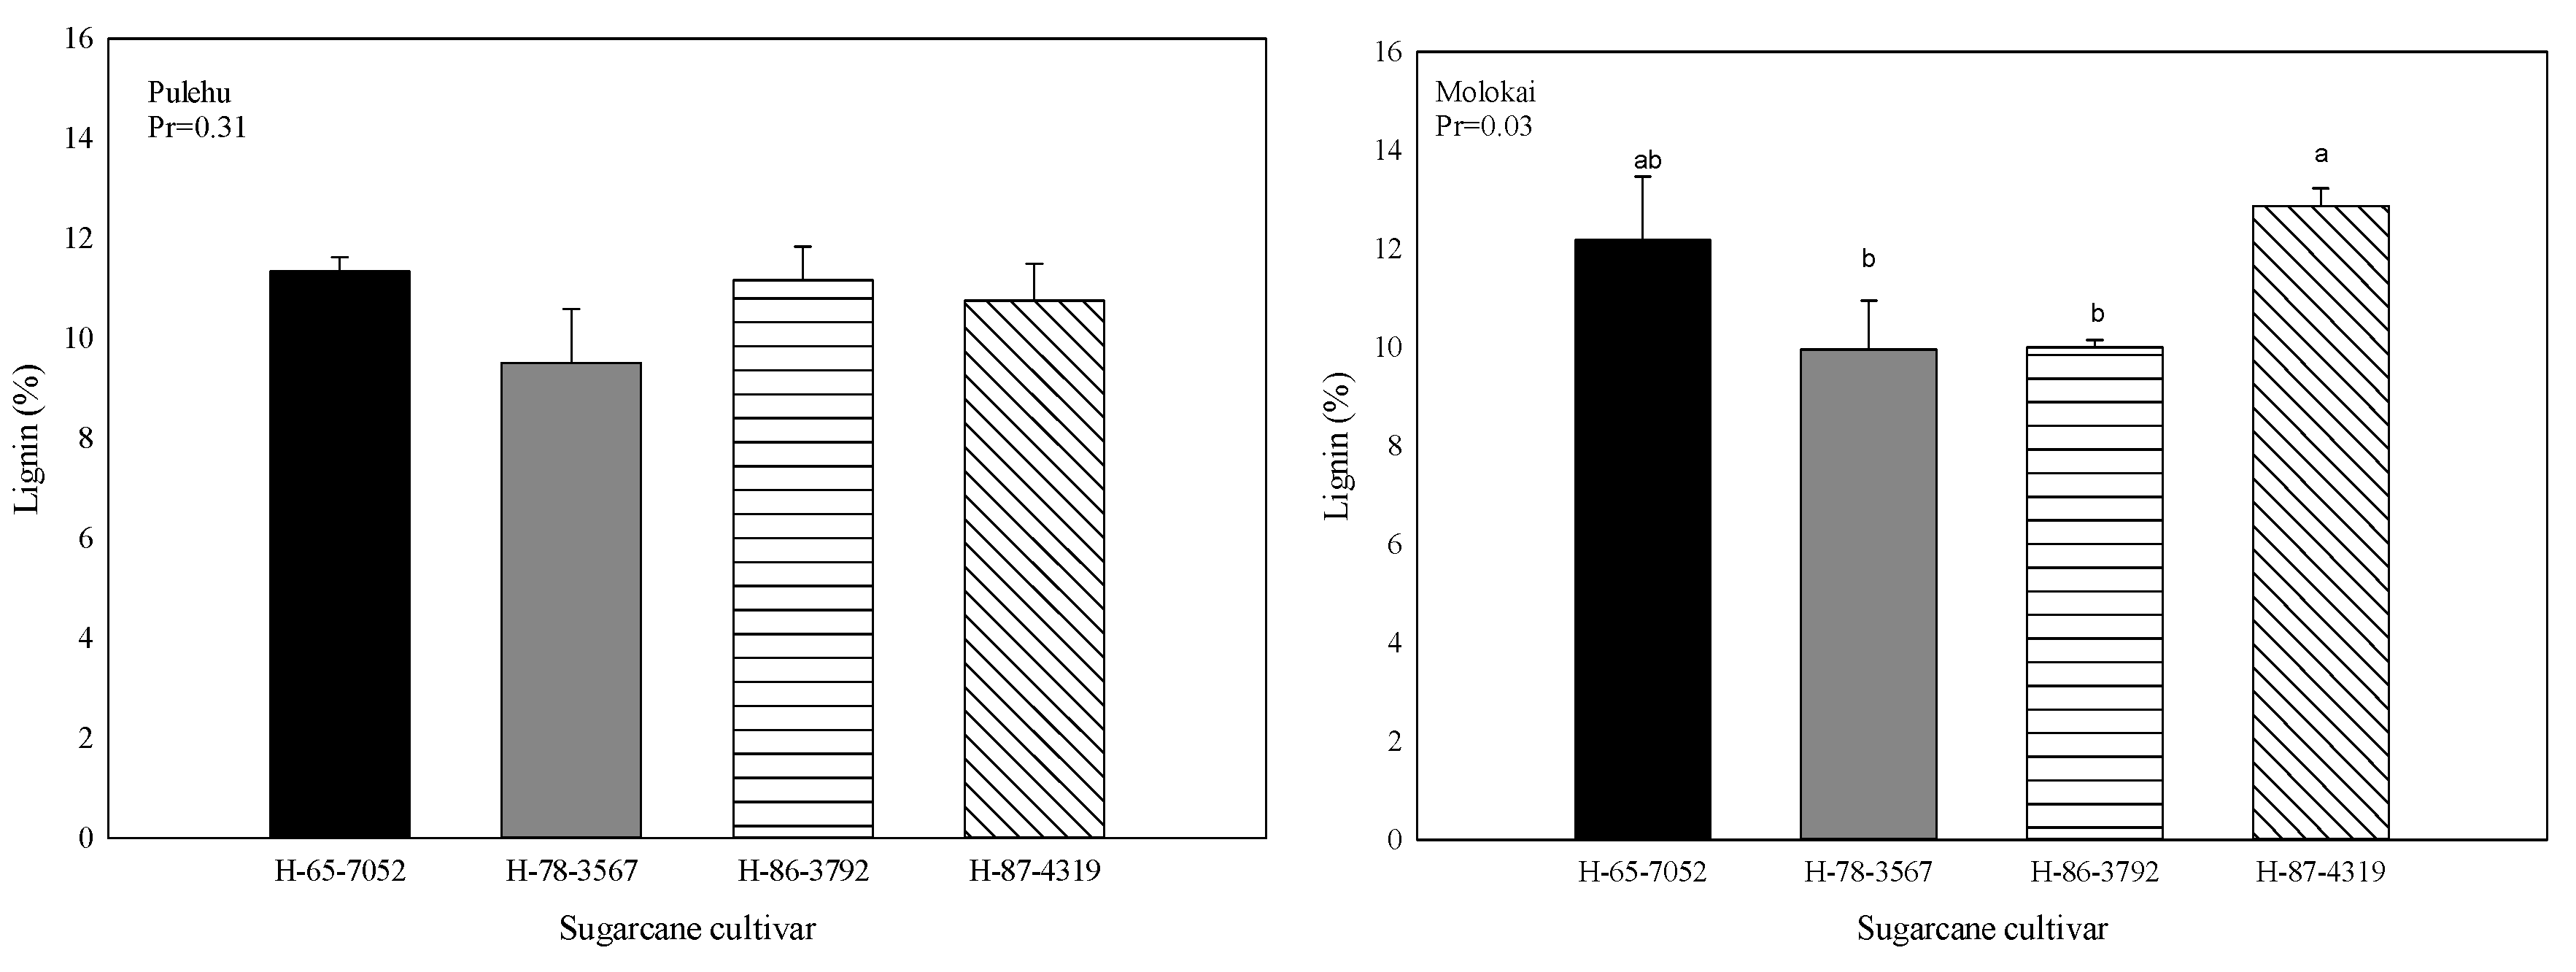
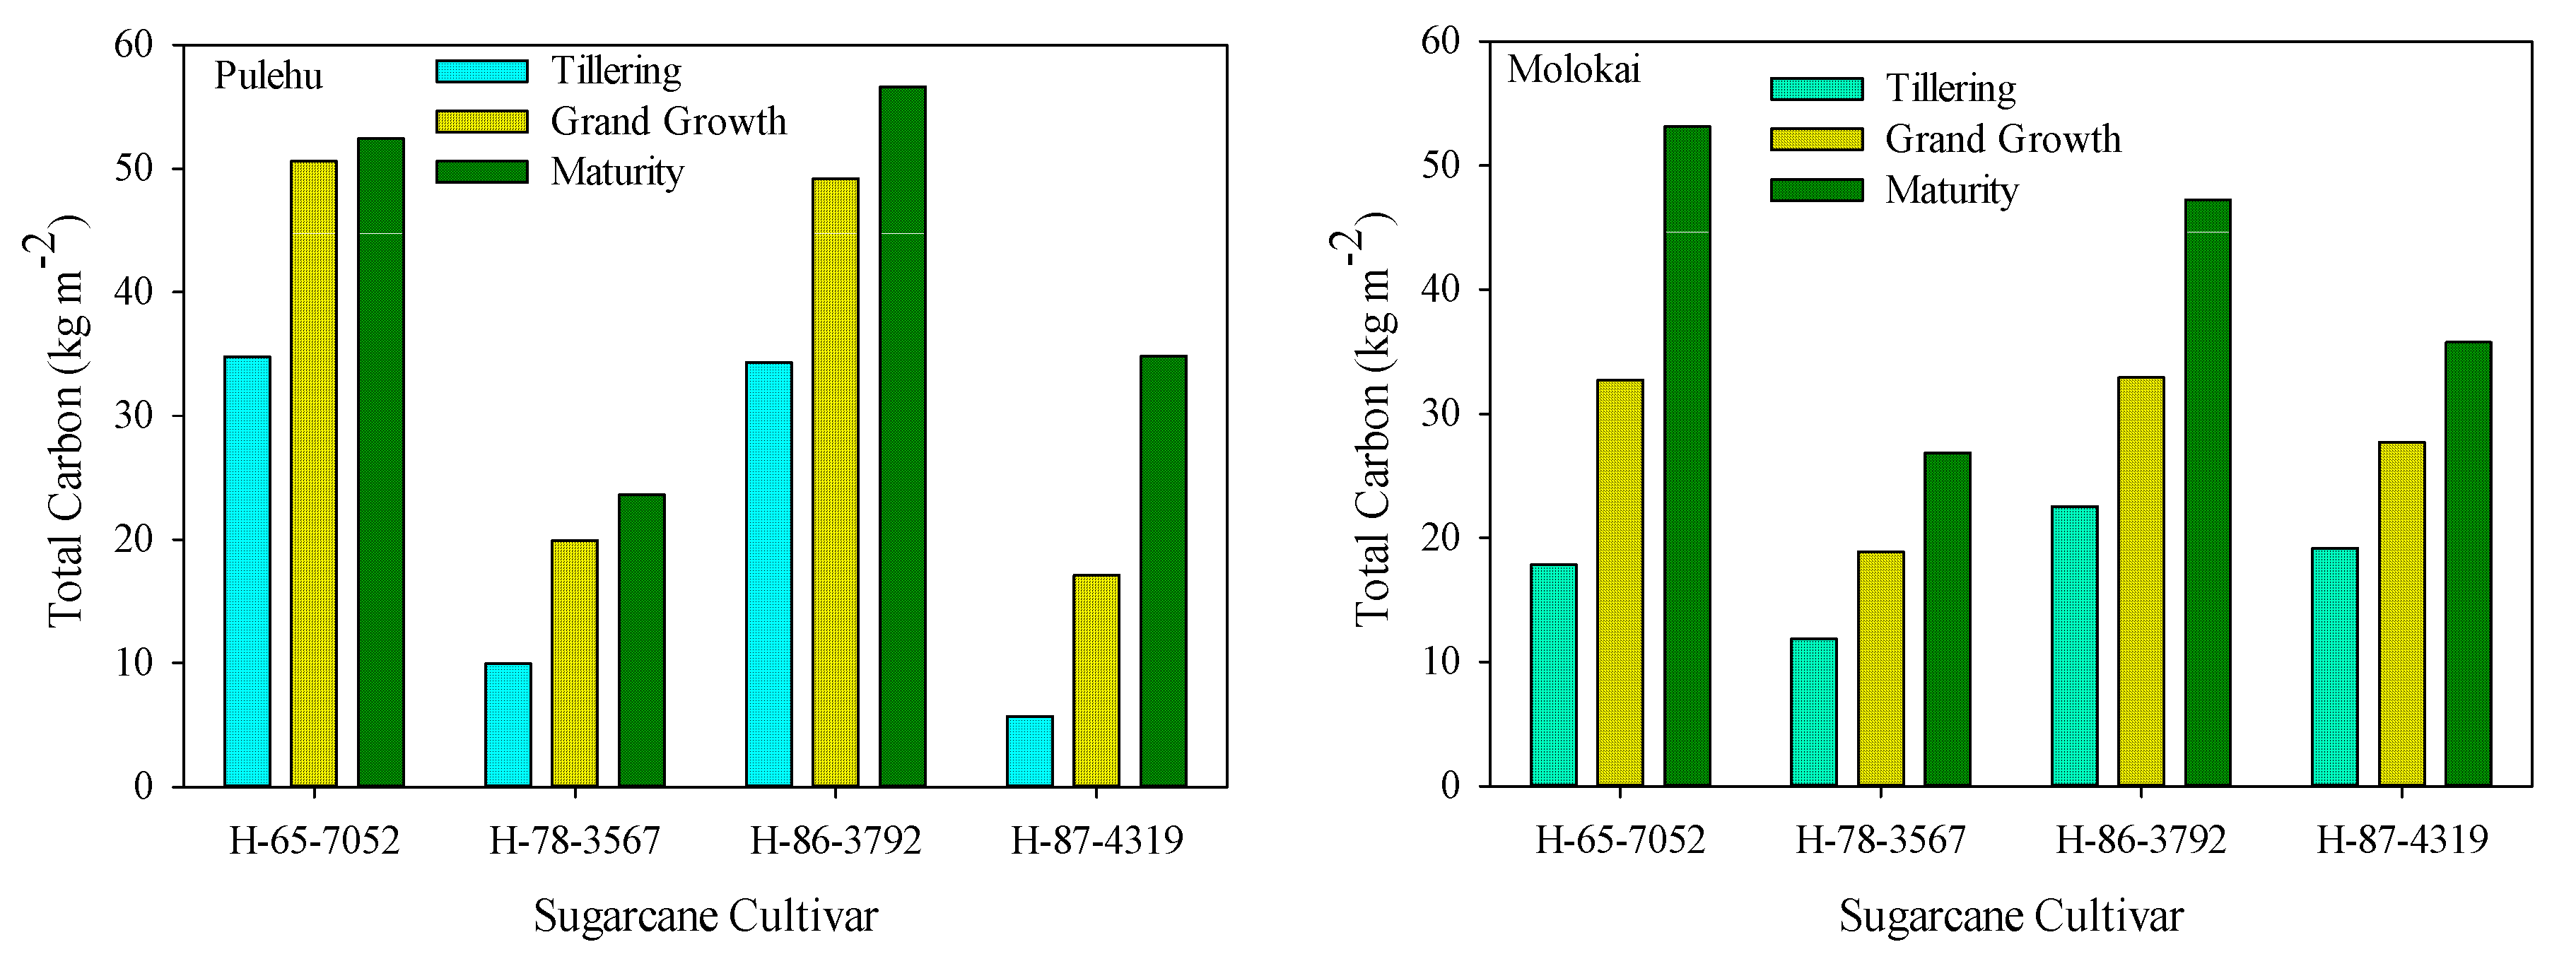
3.4. Aboveground Biomass, Lignin Content, Carbon and Nitrogen in Plant Samples


| Sugarcane Cultivar | Total Nitrogen | Total Carbon | C/N Ratio | |||
|---|---|---|---|---|---|---|
| Pulehu | Molokai | Pulehu | Molokai | Pulehu | Molokai | |
| ---------%-------- | ---------%-------- | |||||
| H-65-7052 | 0.256 c 1 BC | 0.181 c D | 50.9 a A 2 | 49.4 a B | 199 a B | 273 a A |
| H-78-3567 | 0.334 b A | 0.277 a B | 50.6 b AB | 46.8 b C | 151 b C | 169 c C |
| H-86-3792 | 0.367 a A | 0.214 b CD | 50.4 b AB | 50.1 a Ab | 137 c C | 234 ab A |
| H-87-4319 | 0.328 b A | 0.232 ab CD | 49.2 c B | 49.2 a B | 150 b C | 212 b B |
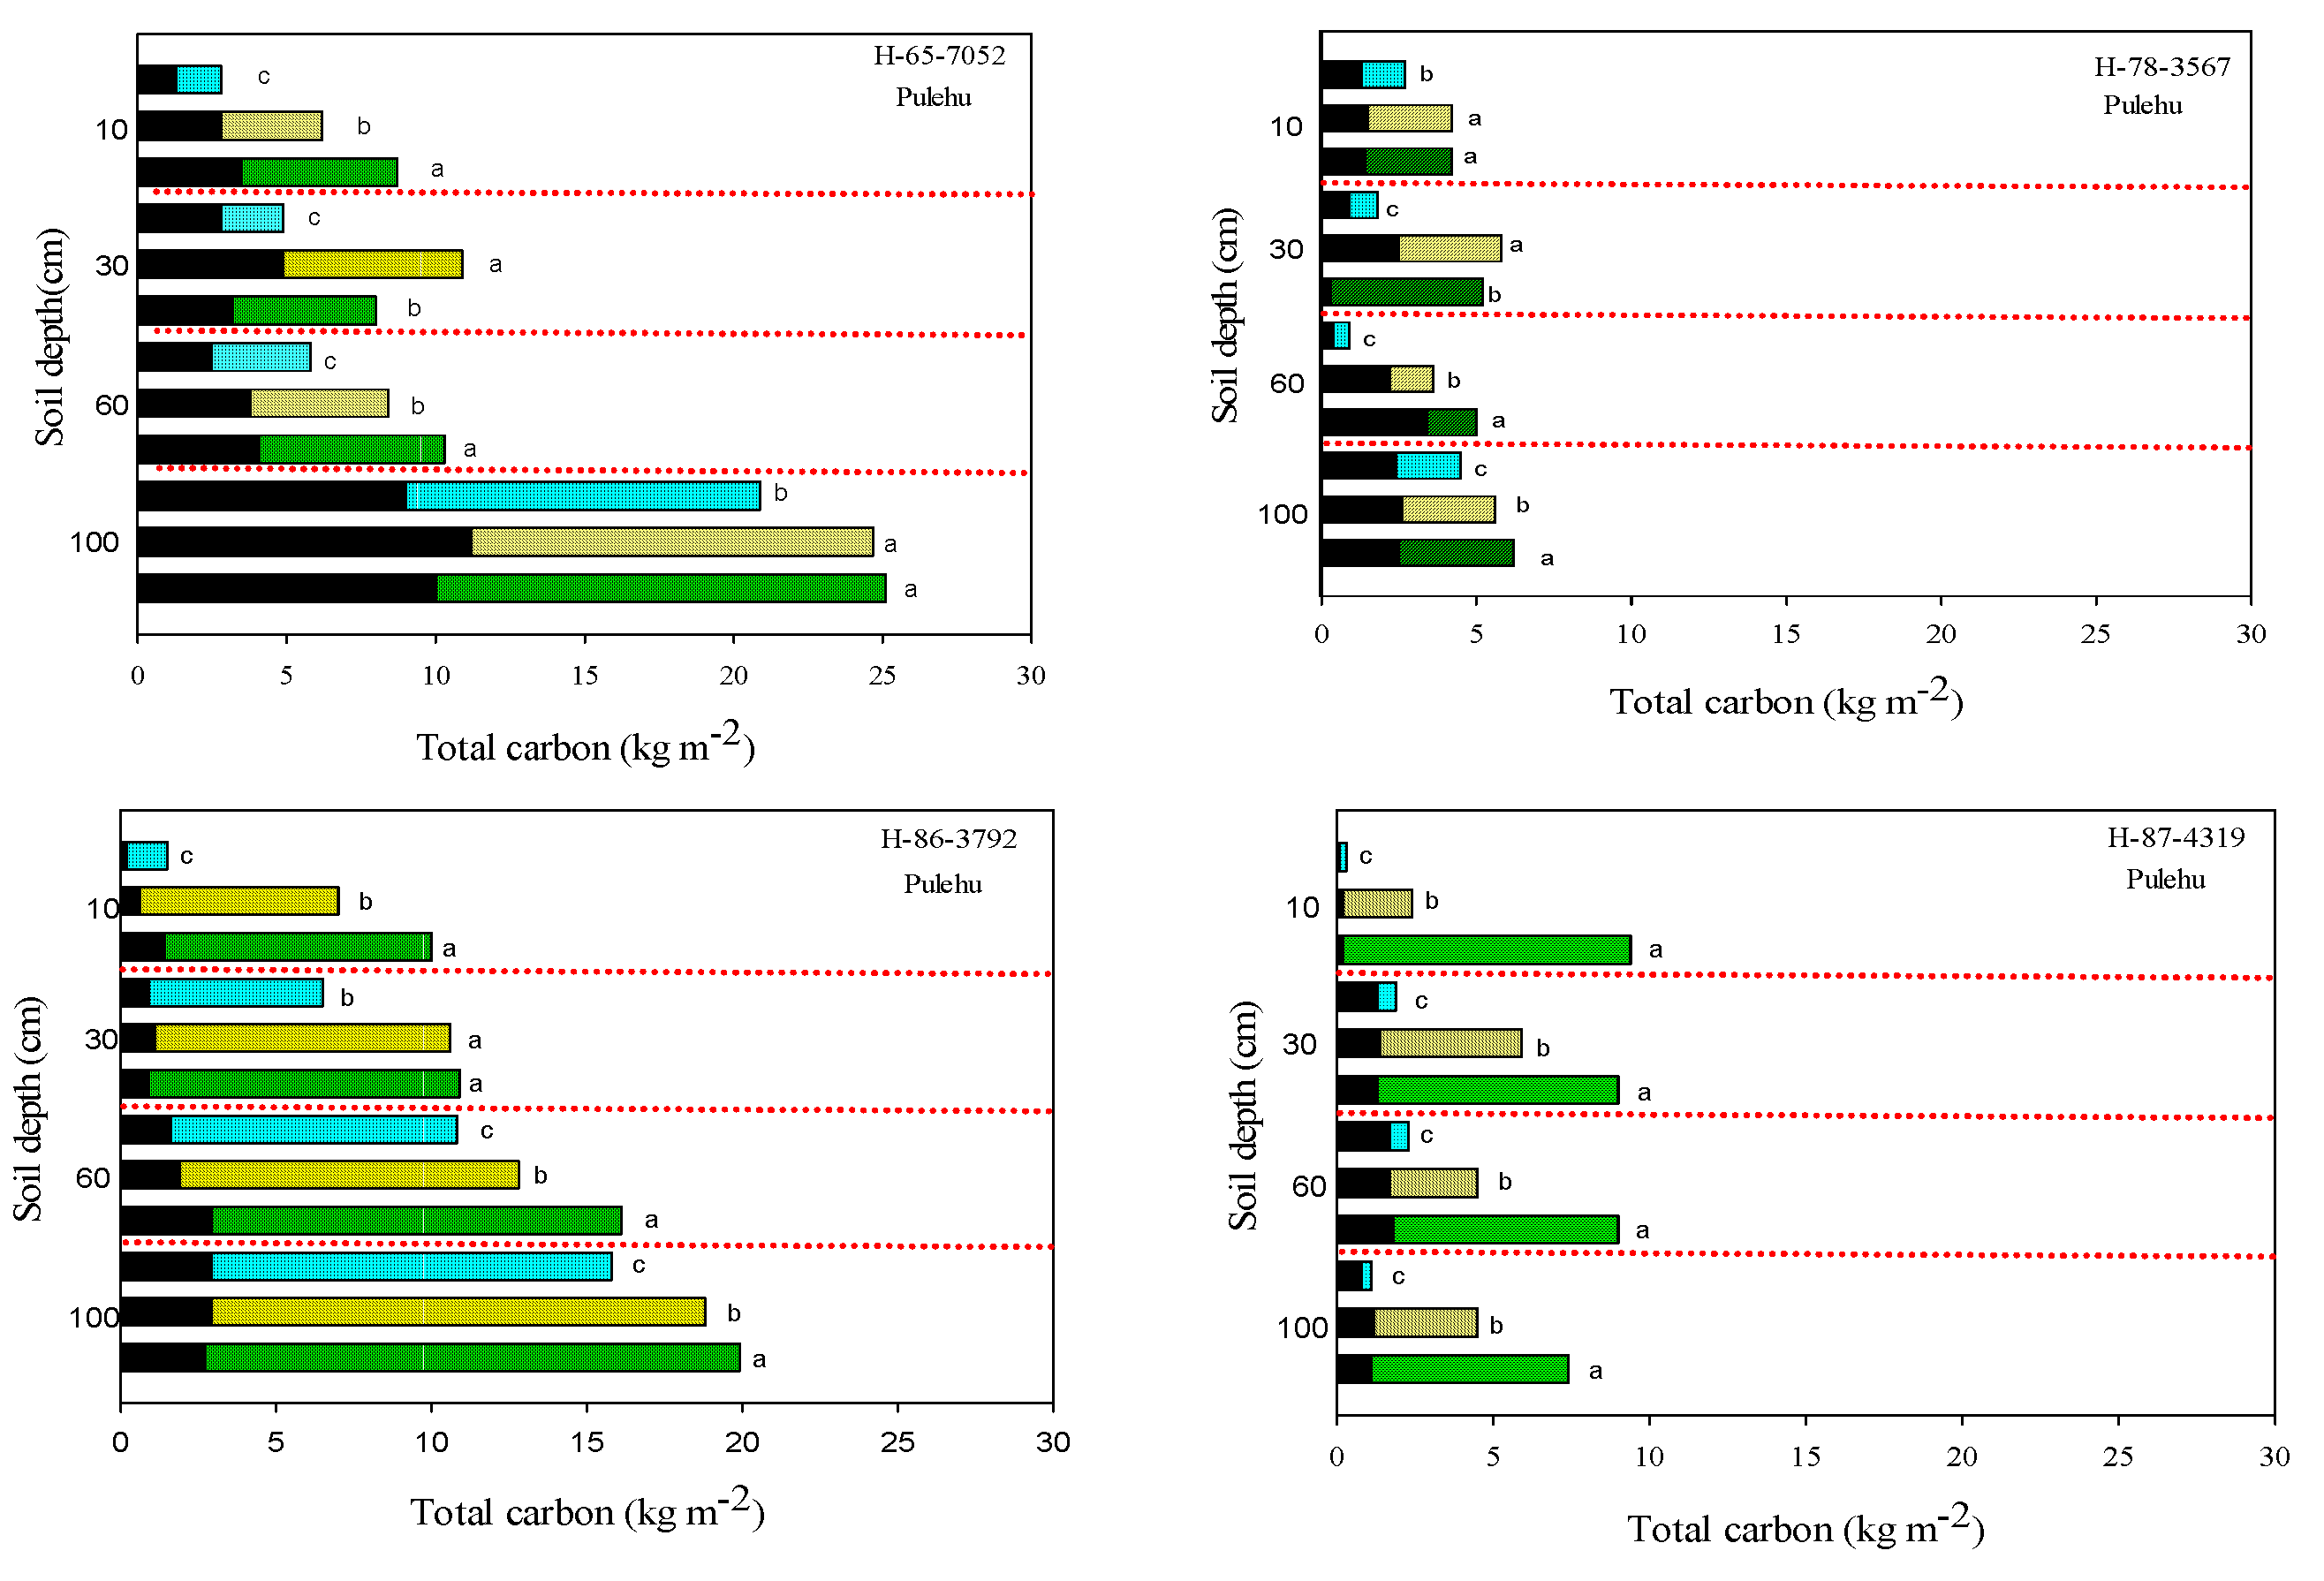
3.5. Soil Carbon Accumulation
| Sugarcane Cultivar | Pulehu Soils | Molokai Soils |
|---|---|---|
| ------------- kg·m−2------------ | ||
| H-65-7052 | 12.65 c 1 E | 33.62 a A 2 |
| H-78-3567 | 8.23 d G | 10.42 c F |
| H-86-3792 | 20.34 b C | 18.44 b D |
| H-87-4319 | 29.01 a B | 17.18 b D |
4. Discussion
4.1. Impacts of Hawaiian Sugarcane Practices Compared to Other Sugarcane Growing Regions
4.2. Relative Nitrogen Uptake Efficiency and Potential for Nitrate Leaching in Hawaiian Sugarcane
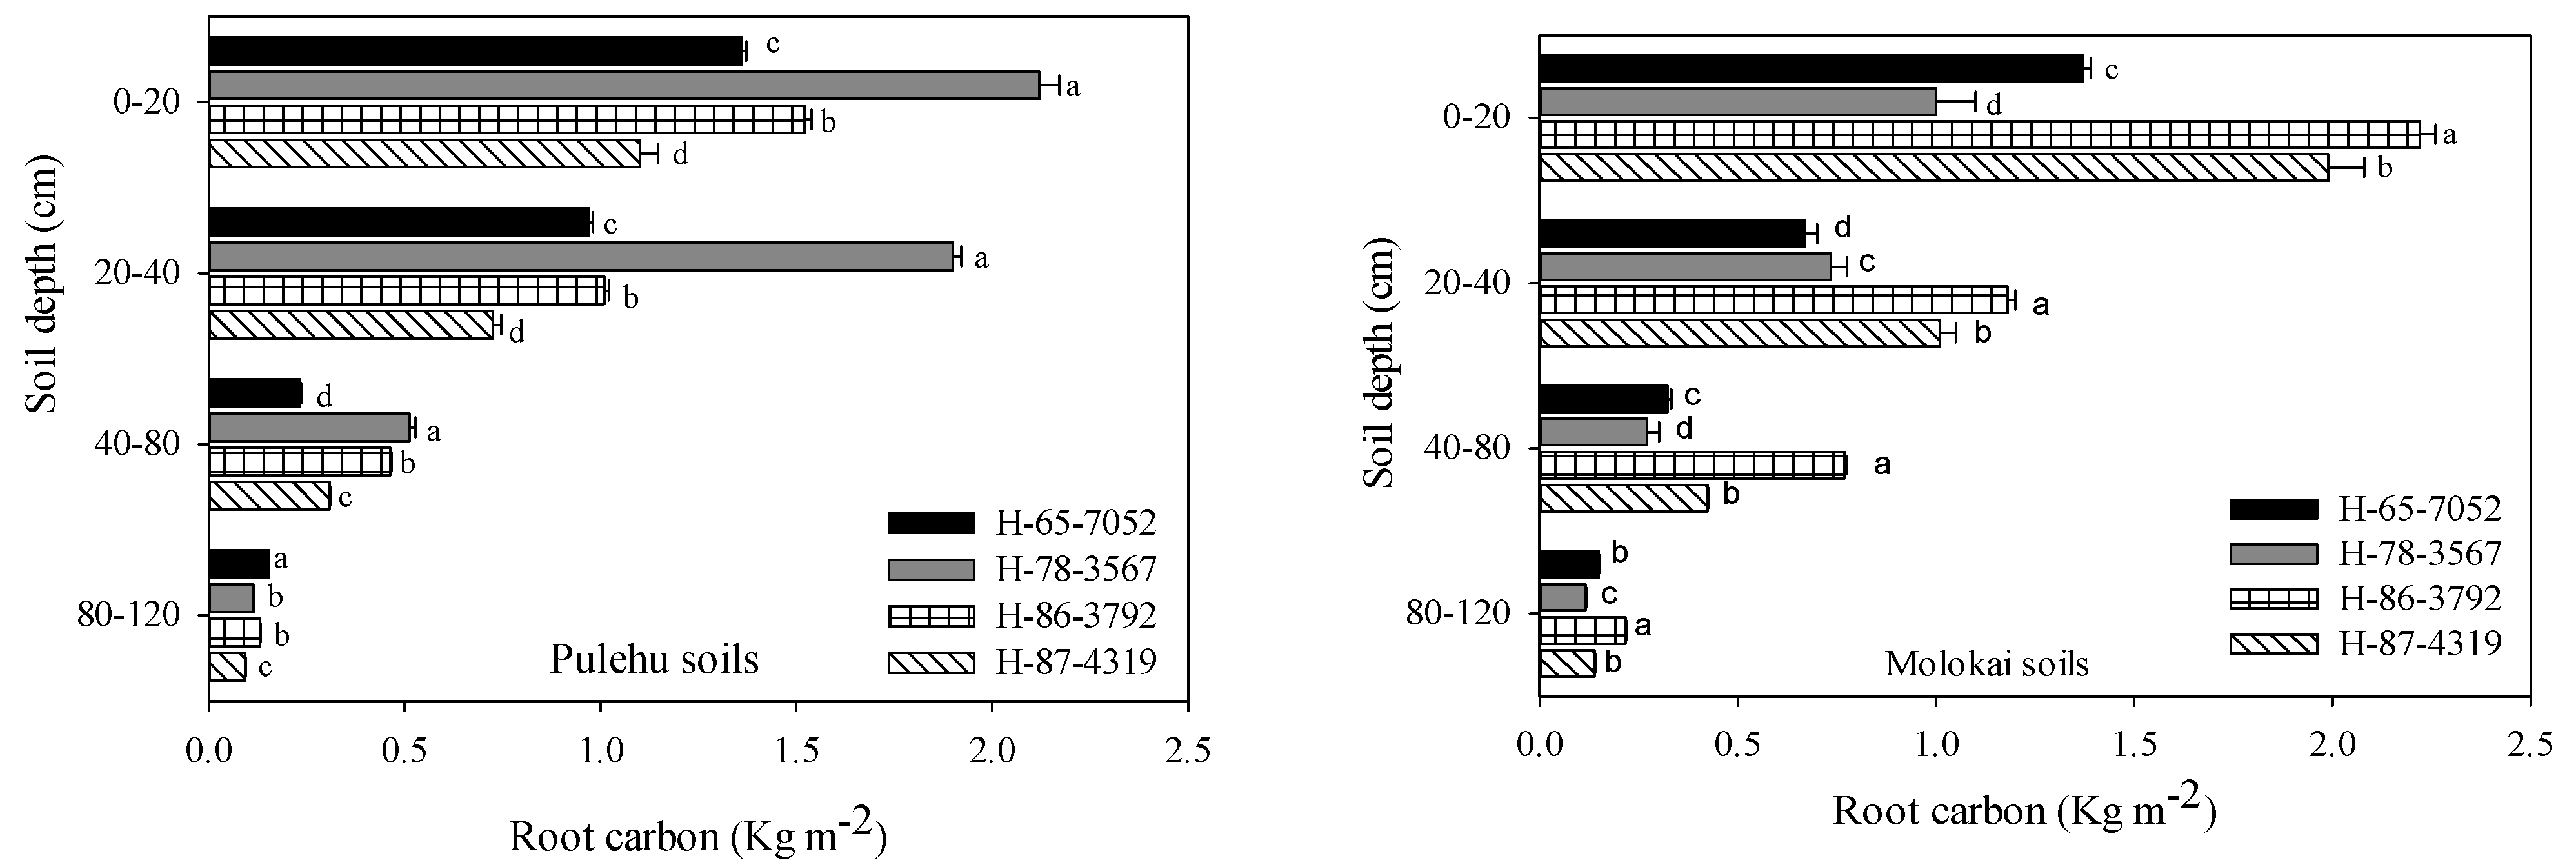
4.3. Root Dynamics and Soil C Sequestration
5. Conclusions
Acknowledgment
Author Contributions
Conflicts of Interest
References
- Kingston, G.; Annink, M.C.; Allen, D. Acquisition of nitrogen by ratoon crops of sugarcane as influence by waterlogging and split applications. Proc. Conf. Aust. Soc. Sugar Cane Technol. 2008, 26, 238–246. [Google Scholar]
- Furlan, F.F.; Tonon-Filho, R.; Pinto, F.H.P.B.; Costa, C.B.B.; Cruz, A.J.G.; Giordano, R.L.C.; Giordano, R.C. Bioelectricity versus bioethanol from sugarcane bagasse: It is worth being flexible? Biotechnol. Biofuels 2013, 6, 142. [Google Scholar] [CrossRef] [PubMed]
- Chandel, A.K.; da Silva, S.S.; Carvalho, W.; Singh, O.V. Sugarcane bagasse and leaves: Foreseeable biomass of biofuel and bio-products. J. Chem. Technol. Biotechnol. 2012, 87, 11–20. [Google Scholar] [CrossRef]
- Steiner, J.L. Biofuels: No Single Answer, Many Possibilities. Agric. Res. 2012, 60, 2. [Google Scholar]
- Evensen, C.I.; Muchow, R.C.; El-Swaify, S.A.; Osgood, R.V. Yield accumulation in irrigated sugarcane: I. Effect of crop age and cultivar. Agronomy J. 1997, 89, 638–646. [Google Scholar] [CrossRef]
- Heinz, D.J.; Osgood, R.V. A History of the Experiment Station: Hawaiian Sugar Planters’ Association. Hawaii. Planters’ Record. 2009, 61, 1–108. [Google Scholar]
- Anderson, R.G.; Tirado-Corbalá, R.; Wang, D.; Ayars, J.E. Long-Rotation sugarcane in Hawaii sustains high carbon accumulation and radiation use efficiency in 2nd year of growth. Agric. Ecosyst. Environ. 2015, 199, 216–224. [Google Scholar] [CrossRef]
- Giambelluca, T.W.; Chen, Q.; Frazier, A.G.; Price, J.P.; Chen, Y.-L.; Chu, P.-S.; Eischeid, J.K.; Delparte, D.M. Online Rainfall Atlas of Hawai‘i. Bull. Am. Meteorol. Soc. 2013, 94, 313–316. [Google Scholar] [CrossRef]
- Crop Profile for Sugarcane in Hawaii. 2000. Available online: www.ipmcenters.org/cropprofiles/docs/his sugarcane.html (accessed on 28 August 2011).
- Moore, R.C.; Fitschen, J.C. The drip irrigation revolution in the Hawaiian sugarcane industry. In Visions of the Future : Proceedings of the 3rd National Irrigation Symposium, Held in Conjunction with the 11th Annual International Irrigation Exposition, Phoenix Civic Plaza, Phoenix, AZ, USA; (accessed on 6 October 2011). 1990. [Google Scholar]
- Koehler, P.H.; Moore, P.H.; Jones, C.A.; dela Cruz, A.; Maretzki, A. Response of Drip-Irrigated Sugarcane to Drought Stress. Agronomy J. 1982, 74, 906. [Google Scholar] [CrossRef]
- Comstock, J.C.; Ferreira, S.A.; Tew, T.L. Hawaii’s Approach to Control of Sugarcane Smut. Plant Dis. 1983, 67, 452. [Google Scholar] [CrossRef]
- Sugihara, R.T.; Tobin, M.E.; Koehler, A.E. Zinc Phosphide Baits and Prebaiting for Controlling Rats in Hawaiian Sugarcane. J. Wildland Manag. 1995, 59, 882–889. [Google Scholar] [CrossRef]
- Plaut, Z.; Meinzer, F.C.; Federman, E. Leaf development, transpiration ad ion uptake and distribution in sugarcane cultivars grown under salinity. Plant Soil 2000, 218, 59–69. [Google Scholar] [CrossRef]
- Lal, R. Sequestration of atmospheric CO2 into global carbon pool. Energy Environ. Sci. 2008, 1, 86–100. [Google Scholar] [CrossRef]
- Yamauchi, H.; Bui, W. Drip irrigation and the survival of the Hawaiian sugarcane, Research Extension Series; 113. Hitahr: College of Tropical Agriculture and Human Resources, Honolulu, Hawai’i, USA, 1990. [Google Scholar]
- Davis, S.C.; Anderson-Teixeira, K.J.; DeLucia, E.H. Life-Cycle analysis and the ecology of biofuels. Trends Plant Sci. 2009, 14, 140–146. [Google Scholar] [CrossRef] [PubMed]
- Crutzen, P.J.; Mosier, A.R.; Smith, K.A.; Winiwarter, W. N2O release from agro-biofuel production negates global warming reduction by replacing fossil fuels. Atmos. Chem. Phys. 2008, 8, 389–395. [Google Scholar] [CrossRef]
- Bengtsson, J.; Lundkvist, H.; Saetre, P.; Sohlenius, B.; Soldreck, B. Effects of organic matter removal on the soil food web: forestry practices meet ecological theory. Appl. Soil Ecol. 1998, 9, 137–143. [Google Scholar] [CrossRef]
- Ulgiati, S.A. Comprehensive Energy and Economic Assessment of Biofuels: When “Green” is not enough. Crit. Rev. Plant Sci. 2001, 20, 71–106. [Google Scholar] [CrossRef]
- Mikhailova, E.A.; Post, C.J. Effect on land use on soil inorganic carbon stocks in the Russian Chernozen. J. Environ. Qual. 2006, 35, 1384–1388. [Google Scholar] [CrossRef] [PubMed]
- Wu, H.B.; Guo, Z.T.; Gao, Q.; Peng, C.H. Distribution of soil inorganic carbon storage and its changes due to agricultural land use activity in China. Agric. Ecosyst. Environ. 2009, 129, 413–421. [Google Scholar] [CrossRef]
- De Figueiredo, E.B.; la Scala, N., Jr. Greenhouse gas balance due to the conversion of sugarcane areas from burned to green harvest in Brazil. Agric. Ecosyst. Environ. 2011, 141, 77–85. [Google Scholar] [CrossRef]
- Galdos, M.V.; Cerri, C.C.; Cerri, C.E.P. Soil carbon stocks under burned and unburned sugarcane in Brazil. Geoderma 2009, 153, 347–352. [Google Scholar] [CrossRef]
- Correira, B.L.; Alleoni, L.R.F. Conteúdo de carbono e atributos químicos de Latossolo sob cana-de-açúcar colhida com e sem queima. Pesq. Agropec. Bras. 2011, 46, 944–952. [Google Scholar] [CrossRef]
- Christensen, B.T. Physical fractionation of soil and structural and functional complexity in organic matter turnover. Eur. J. Soil Sci. 2001, 52, 345–353. [Google Scholar] [CrossRef]
- Bayer, C.; Mielniczuk, J. Dinamica e funcao da material organica. In Fundamentos da Materia Organica do Solo:Ecossistemas Tropicais e Subtropicais, 2nd ed.; Santos, G.A., Silva, L.S., Canellas, L.P., Camargo, F.A.O., Eds.; Metrópole: Porto Alegre, Brazil, 2008; pp. 7–18. [Google Scholar]
- Hennecke, A.M.; Faist, M.; Reinhardt, J.; Junquera, V.; Neeft, J.; Fehrenbach, H. Biofuel greenhouse gas calculations under the European Renewable Energy Directive—A comparison of the BioGrace tool vs. the tool of the Roundtable on Sustainable Biofuels. Appl. Energy 2013, 102, 55–62. [Google Scholar] [CrossRef]
- Huang, H.; Khanna, M.; Önal, H.; Chen, X. Stacking low carbon policies on the renewable fuels standard: Economic and greenhouse gas implications. Energy Policy 2013, 56, 5–15. [Google Scholar] [CrossRef]
- Soil Survey Staff, Natural Resources Conservation Service, United States Department of Agriculture. Official Soil Series Descriptions. 2013. Available online: https://soilseries.sc.egov.usda.gov/OSD_Docs/C/CONSUMO.html (accessed on 8 June 2014).
- Thomas, G.W. Soil pH and Soil Acidity. In Methids of Soil Analysis: Chemical Methods. Part 3; Sparks, D.L., Ed.; Soil Science Society of America: Madison, WI, USA, 1996. [Google Scholar]
- Bouyoucos, G.J. Hydrometer method improved for making particle size analysis of soil. Agronomy J. 1962, 54, 464–465. [Google Scholar] [CrossRef]
- Warncke, D.; Brown, J.R. Potassium and other basic cations. In Recommended Chemical Soil Test Procedures for the North Central Region; NCR Publication No. 221; Missouri Agri Exp Station: Columbia, MO, USA, 1998; pp. 31–33. [Google Scholar]
- Moiser, A.R.; Syers, J.K.; Freney, J.R. Agriculture and the Nitrogen Cycle: Assessing the Impacts of Fertilizer use on Food Production and the Environment; Island Press: Washington, DC, USA, 2004. [Google Scholar]
- Hartemink, A.E. Sugarcane for bioethanol: Soil and environmental issues. Adv. Agronomy 2008, 99, 125–182. [Google Scholar]
- Bahmani, O.; Nasab, S.B.; Behzad, M.; Naseri, A.A. Assessment of Nitrogen Accumulation and Movement in Soil Profile under Different Irrigation and Fertigation Regime. Asian J. Agric. Res. 2009, 3, 38–46. [Google Scholar] [CrossRef]
- Rozeff, N. Sugarcane and Salinity—A review paper. Sugarcane 1995, 5, 8–19. [Google Scholar]
- Kumar, S.; Naidu, K.M.; Sehtiya, H.L. Causes of growth reduction in elongating and expanding leaf tissue of sugarcane under saline conditions. Aust. J. Plant Physiol. 1988, 21, 79–83. [Google Scholar] [CrossRef]
- Dominquez, S.P. Salim and sodicity in new sugarcane regions of Ingenio Providencia. Centro Investig. Cana Azúcar Columbia 1993, 12, 44–45. [Google Scholar]
- Gomez, P.J.F.; Torres, A.J.S. Effect of salinity in the development and production of two varieties of sugarcane (Saccharum sp). Centro de Investigacion de la Cana de Azucar de Colomba 1993, 12, 35–36. [Google Scholar]
- Watcharapirak, W. The Estimation of Carbon Storage in Various Growth Stages of Sugarcane in Sisatchanalai District, Sukhothai Province, Thailand. Master Thesis, Mahidol University, Bangkok, Thailand, 2009. [Google Scholar]
- Dominy, C.S.; Haynes, R.J. Influence of agricultural land management on organic matter content, microbial activity and aggregate stability in the profiles of two Oxisols. Biol. Fertil. Soils 2002, 36, 298–305. [Google Scholar]
- Orlando Filho, J.; Rosetto, R.; Muraok, T.; Zotelli, H.B. Efeitos do sistema de despalha (cana crua x cana queimada) sobre algumas propriedades do solo. STAB 1998, 16, 30–35. [Google Scholar]
- Souza, R.A.; Telles, T.S.; Machado, W.; Hungria, M.; Tavares Filho, J.; Guimarães, M.F. Effects of sugarcane harvesting with burning on the chemical and microbiological properties of the soil. Agric. Ecosyst. Environ. 2012, 155, 1–6. [Google Scholar] [CrossRef]
- Ball-Coelho, B.; Sampaio, E.V.S.B.; Tiessen, H.; Stewart, J.W.B. Root dynamic in plant ratoon crops of sugar cane. Plant Soil 1992, 142, 297–305. [Google Scholar] [CrossRef]
- Cerri, C.C.; Galdos, M.V.; Maia, S.M.F.; Bernoux, M.; Feigl, B.J.; Powlson, D.; Cerri, C.E.P. Effect of sugarcane harvesting systems on soil carbon stocks in Brazil: an examination of existing data. Eur. J. Soil Sci. 2011, 62, 23–28. [Google Scholar] [CrossRef]
- Robertson, F.A.; Thorburn, P.J. Management of sugarcane harvest residues: Consequence for soil carbon and nitrogen. Aust. J. Soil Res. 2007, 45, 13–23. [Google Scholar] [CrossRef]
- Thorbourn, P.J.; Meier, E.A.; Collins, K.; Robertson, F.A. Changes in soil carbon sequestration, fractionation and soil fertility in response to sugarcane residue retention are site-specific. Soil Tillage Res. 2012, 120, 99–111. [Google Scholar] [CrossRef]
- Smernik, R.J.; Skjemstad, J.O.; Oades, J.M. Virtual fractionation of charcoal from soil organic matter using solid state13C NMR spectral editing. Aust. J. Soil Res. 2000, 38, 665–683. [Google Scholar] [CrossRef]
- Canellas, L.P.; Velloso, A.C.X.; Marciano, C.R.; Ramalho, J.F.G.P.; Rumjanek, V.M.; Rezende, C.E.; Santos, G.A. Chemical soil properties of an Inceptisol under long-term sugarcane crops with vinasse application and without slash burning. R. Bras. Ciênc. Solo 2003, 27, 935–944. [Google Scholar] [CrossRef]
- Luca, E.F.; Feller, C.; Barthès, C.C.; Chaplot, B.V.; Campos, D.C.; Manechini, C. Avaliação de atributos físicos e estoques de carbono e nitrogênio em solos com queima e sem queima de canavial. R. Bras. Ciênc. Solo 2008, 32, 789–800. [Google Scholar] [CrossRef] [Green Version]
- Resende, A.S.; Xavier, R.P.; Oliveira, O.C.; Urquiaga, S.; Alves, R.J.; Boddey, R.M. Long-term effects of pre-harvest burning and nitrogen and vinasse application on yield of sugarcane and carbon and nitrogen stocks on a plantation in Pernambuco, N.E. Brazil. Plant Soil 2006, 281, 339–351. [Google Scholar] [CrossRef]
- Wiedenfeld, B.; Enciso, J. Sugarcane Responses to Irrigation and Nitrogen in Semiarid South Texas. Agronomy J. 2008, 100, 665–671. [Google Scholar] [CrossRef]
- Calcino, D.V. Australian Sugarcane Nutrition Manual; Sugar Research and Development Corporation/Bureau of Sugar Experiment Stations: Indooroopilly, Queensland, 1994. [Google Scholar]
- Kwong, K.F.N.K.; Deville, J. Application of 15N-labelled urea to sugarcane through a drip-irrigation system in Mauritius. Fertil. Res. 1994, 39, 223–228. [Google Scholar] [CrossRef]
- Takahashi, D.T. Effect of amount and timing on the fate of fertilizer nitrogen in lysimeter studies with N15. Haw. Planters’ Rec. 1967, 57, 292–309. [Google Scholar]
- Chang, J.H. The role of climatology in the Hawaiian sugar-cane industry: An example of applied agricultural climatology in the tropics. Pac. Sci. 1963, 17, 379–397. [Google Scholar]
- Stanford, G.; Ayres, A.S.; Dol, M. Mineralizable soil nitrogen in relation to fertilizer needs of sugarcane in Hawaii. Soil Sci. 1965, 99, 132–137. [Google Scholar] [CrossRef]
- Wood, R.A. The effect of time of application on the utilization of fertilizer nitrogen by plant cane. Proc. Int. Soc. Sugar Cane Technol. 1974, 15, 618–629. [Google Scholar]
- Thorburn, P.J.; Biggs, J.; Webster, A.; Biggs, I.M. An improved way to determine nitrogen fertiliser requirements of sugarcane crops to meet global environmental challenges. Plant Soil. 2011, 339, 51–67. [Google Scholar] [CrossRef]
- Mitchell, R.D.J.; Thorburn, P.J.; Larson, P. Quantifying the immediate loss of nutrients when sugarcane residues are burnt. Proc. Aust. Soc. Sugar Cane Technol. 2000, 22, 206–211. [Google Scholar]
- Ghiberto, P.; Libardi, P.; Brito, A.; Trivelin, P. Leaching of nutrients from a sugarcane crop growing on an Ultisol in Brazil. Agric. Water Manag. 2009, 96, 1443–1448. [Google Scholar] [CrossRef]
- Di, H.J.; Cameron, K.C. Nitrate leaching in temperate agroecosystems: Sources, factors and mitigating strategies. Nutr. Cycling Agroecosyst. 2002, 64, 237–256. [Google Scholar] [CrossRef]
- Verloop, J.; Boumans, L.J.M.; van Keulen, H.; Oenema, J.; Hilhorst, G.J.; Aarts, H.F.M.; Sebek, L.B.J. Reducing nitrate leaching to groundwater in an intensive dairy farming system. Nutr. Cycling Agroecosyst. 2006, 57, 67–73. [Google Scholar] [CrossRef]
- Pierzynski, G.M.; Sims, J.T.; Vance, G.F. Soils and Environmental Quality, 3rd ed.; Taylor and Francis: Boca Raton, FL, USA, 2005. [Google Scholar]
- Van Antwerpen, R. Sugarcane root growth and relationships to above-ground biomass. Proc. S. Afr. Sug. Technol. Ass. 1999, 73, 89–94. [Google Scholar]
- Wilhelm, W.W.; Johnson, J.M.F.; Hatfield, J.L.; Vorhees, W.B.; Linden, D.R. Crop and soil productivity response to corn residue removal: A literature review. Agronomy J. 2004, 78, 184–189. [Google Scholar] [CrossRef]
- Graham, M.H.; Haynes, R.J. Organic matter status and the size, activity and metabolic diversity of the soil microbial community in the row and inter-row of sugarcane under burning and trash retention. Soil Biol. Biochem. 2004, 38, 21–31. [Google Scholar] [CrossRef]
- Trumbore, S.E.; Davidson, E.A.; Barbosa, P.C.; Nepstadt, D.C.; Martinelle, L.A. Belowground cycling of carbon in forests and pastures of Eastern Amazonia. Glob. Biogeochem. Cycles 1995, 9, 515–528. [Google Scholar] [CrossRef]
- Canadell, J.; Jackson, R.B.; Ehleringer, J.R.; Mooney, H.A.; Sala, O.E.; Schulze, E.-D. Maximum root depth of vegetation types at the global scale. Oecologia 1996, 108, 583–595. [Google Scholar] [CrossRef]
- Brodie, H.W.; Yoshida, R.; Nickell, L.G. Effect of air and root temperatures on growth of four sugarcane clones. Hawaii. Sugarcane Plant. Assoc. 1965, 58, 21–52. [Google Scholar]
- Rostron, H. Radiant energy interception, root growth, dry matter production and the apparent yield potential of two sugarcane varieties. Proc. Int. Soc. Sugar Cane Technol. 1974, 15, 1001–1010. [Google Scholar]
- Smith, D.M.; Inman-Bamber, N.G.; Thorburn, P.J. Growth and function of the sugarcane root system. Field Crops Res. 2005, 92, 169–183. [Google Scholar] [CrossRef]
© 2015 by the authors; licensee MDPI, Basel, Switzerland. This article is an open access article distributed under the terms and conditions of the Creative Commons Attribution license (http://creativecommons.org/licenses/by/4.0/).
Share and Cite
Tirado-Corbalá, R.; Anderson, R.G.; Wang, D.; Ayars, J.E. Soil Carbon and Nitrogen Stocks of Different Hawaiian Sugarcane Cultivars. Agronomy 2015, 5, 239-261. https://doi.org/10.3390/agronomy5020239
Tirado-Corbalá R, Anderson RG, Wang D, Ayars JE. Soil Carbon and Nitrogen Stocks of Different Hawaiian Sugarcane Cultivars. Agronomy. 2015; 5(2):239-261. https://doi.org/10.3390/agronomy5020239
Chicago/Turabian StyleTirado-Corbalá, Rebecca, Ray G. Anderson, Dong Wang, and James E. Ayars. 2015. "Soil Carbon and Nitrogen Stocks of Different Hawaiian Sugarcane Cultivars" Agronomy 5, no. 2: 239-261. https://doi.org/10.3390/agronomy5020239