1. Introduction
Insecticides remain the chief method for managing tarnished plant bugs (TPB) ((
Lygus lineolaris (Palisot de Beauvois)) in Mid-South cotton. However, ongoing research programs are directed at improving host plant resistance (HPR) to this important pest, thereby expanding options for its control. One focus of HPR cotton breeding programs includes screening trials to identify differences in TPB feeding preferences among different cotton cultivars. Plant bugs (
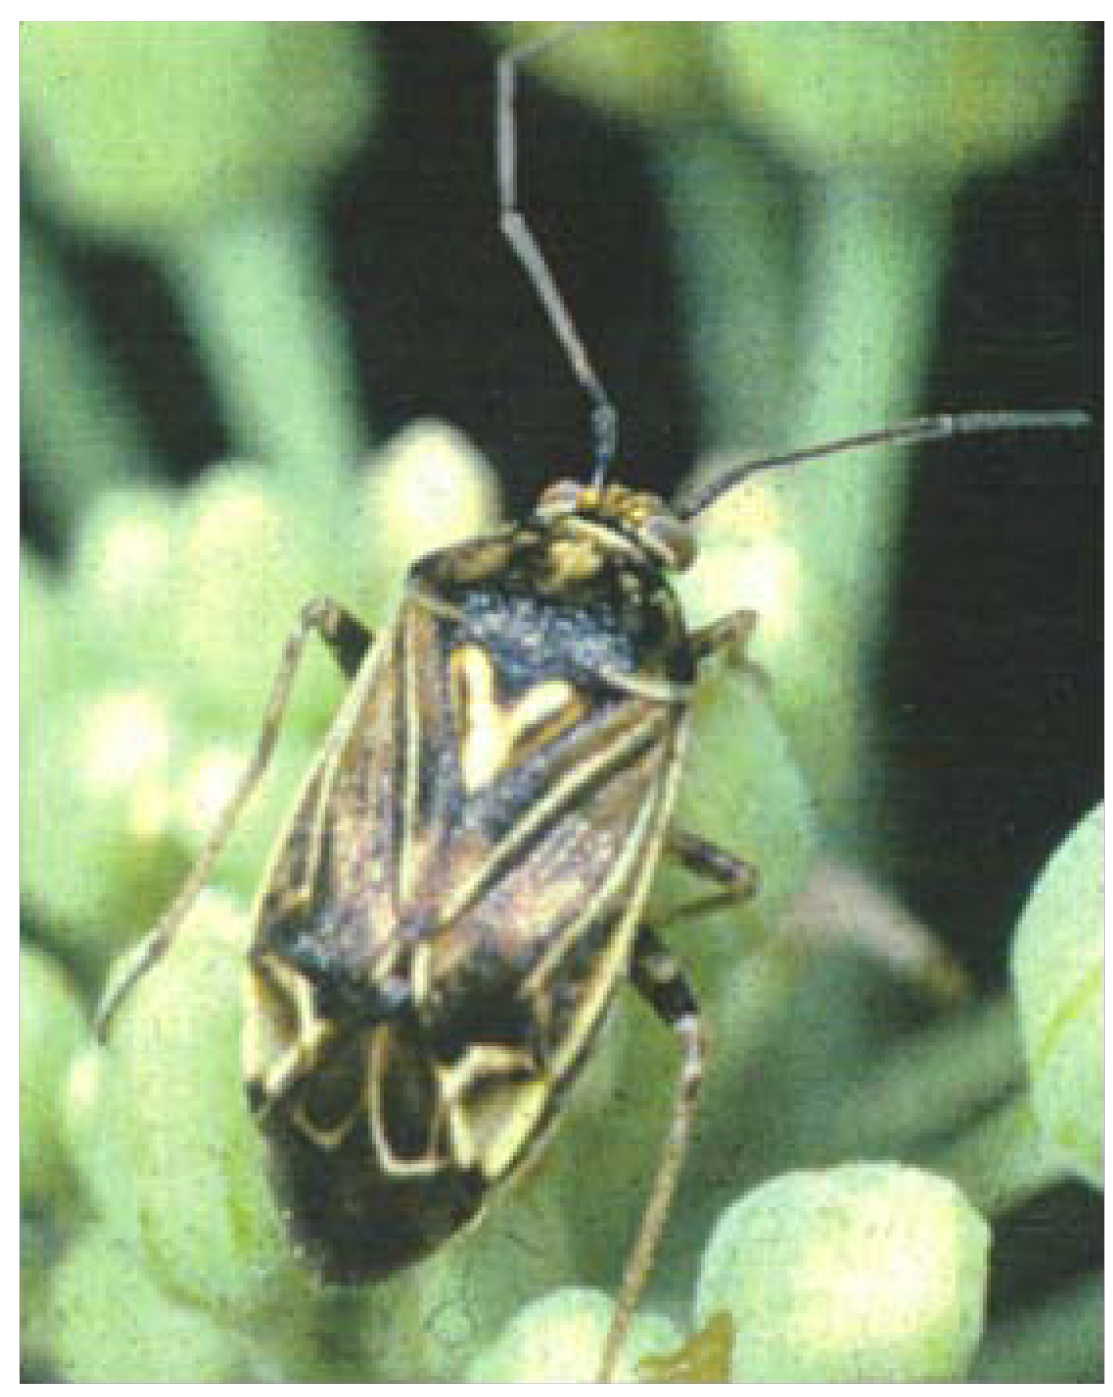
Figure 1) use the process of extra-oral digestion to feed on cotton tissues, which is also known as solid-to-liquid feeding [
1]. Cotton host plants have nutrient rich solid plant parts, especially meristematic cells, floral tissues and fruit, which provide food resources for this insect. Small cotton squares (<3 mm) are shed following TPB injury, but larger cotton squares typically are more tolerant and potentially remain on the plant after feeding damage.
Figure 1.
Adult tarnished plant bug (Heteroptera: Miridae. Lygus lineolaris).
Figure 1.
Adult tarnished plant bug (Heteroptera: Miridae. Lygus lineolaris).
The probability of square abscission following TPB feeding is a function of anther size. When anthers are barely visible, the bug feeds on the entire floral bud, but as the square grows, the anthers become large enough for the plant bug to selectively feed just on them, since they are rich in nitrogen. After these larger squares are fed upon, at anthesis the effects of anther injury are apparent as a “dirty” white flower [
2]. The presence of white flower anther injury (WFAI) is a reflection of the cumulative feeding that occurred after the square reached 3 mm in diameter [
3].
A standard, rapid, screening technique historically used in the University of Arkansas cotton breeding program to evaluate the HPR response to the TPB is to monitor WFAI among cultivar lines ([
4]; Bourland, unpublished). Field trials typically are planted with different cotton lines laid out in single row plots with multiple replications of the lines. A frego bract line is included in every trial as an indicator of plant bug feeding activity during the trial [
4,
5] and damaged flower counts are made daily after appearance of first flowers. Counts are continued up to physiological cutout, which is when the mean number of mainstem sympodial nodes above the first position white flower = 5. Results from these measurements over years and locations have shown relatively stable levels of bug preference for frego compared to other standards. As these HPR screening trials have progressed, the question arose whether or not some effects of TBP injury are potentially influenced by the size of the plots and arrangement patterns (interspersion) of the various cultivars among these plots.
Therefore, the primary objective of this research was to conduct field trials designed to investigate effects of plot size and cultivar interspersion upon incidence of white flowers with TPB anther injury in HPR experiments. The second objective was to present the results of the research (over two production seasons) while describing the novel design of the experiment. The concepts necessary to complete the statistical analysis of the design are presented.
3. Discussion
Effect of plot size on HPR screenings is a topic of investigation found throughout the literature. A few of these kinds of works are now examined in regards to the goals and design of the experiment employed herein. Considered first is the issue of observer effects on monitoring responses from plots of different sizes. Pascal and Guisan [
6] employed a multiple plot design to make inventories of plant species using different plot sizes and experienced observers. These researchers found that despite the sampling size, only 45%–63% of all species tallied were seen by all observers, while the majority of overlooked species had coverage extents of less than 0.1%. They also found that pairs of observers overlooked 10%–20% fewer species than a single observer.
Possibly the earliest study examining the effect of plot size on studies of insect resistance in cotton was by Ellington and colleagues [
7]. They concluded, within the constraints of their experiment, that most insect taxa studied displayed no significant preferences for small or large plots. These investigators used an 8 × 8 Latin square split plot design where 8 cotton genotypes defined the main plots and years defined the subplots. The experiment was repeated to test for differences in plot size, such that the main plots of one Latin square were eight rows wide while those of the other Latin square were 1 row wide. In each experiment, the rows were 28.8 m long.
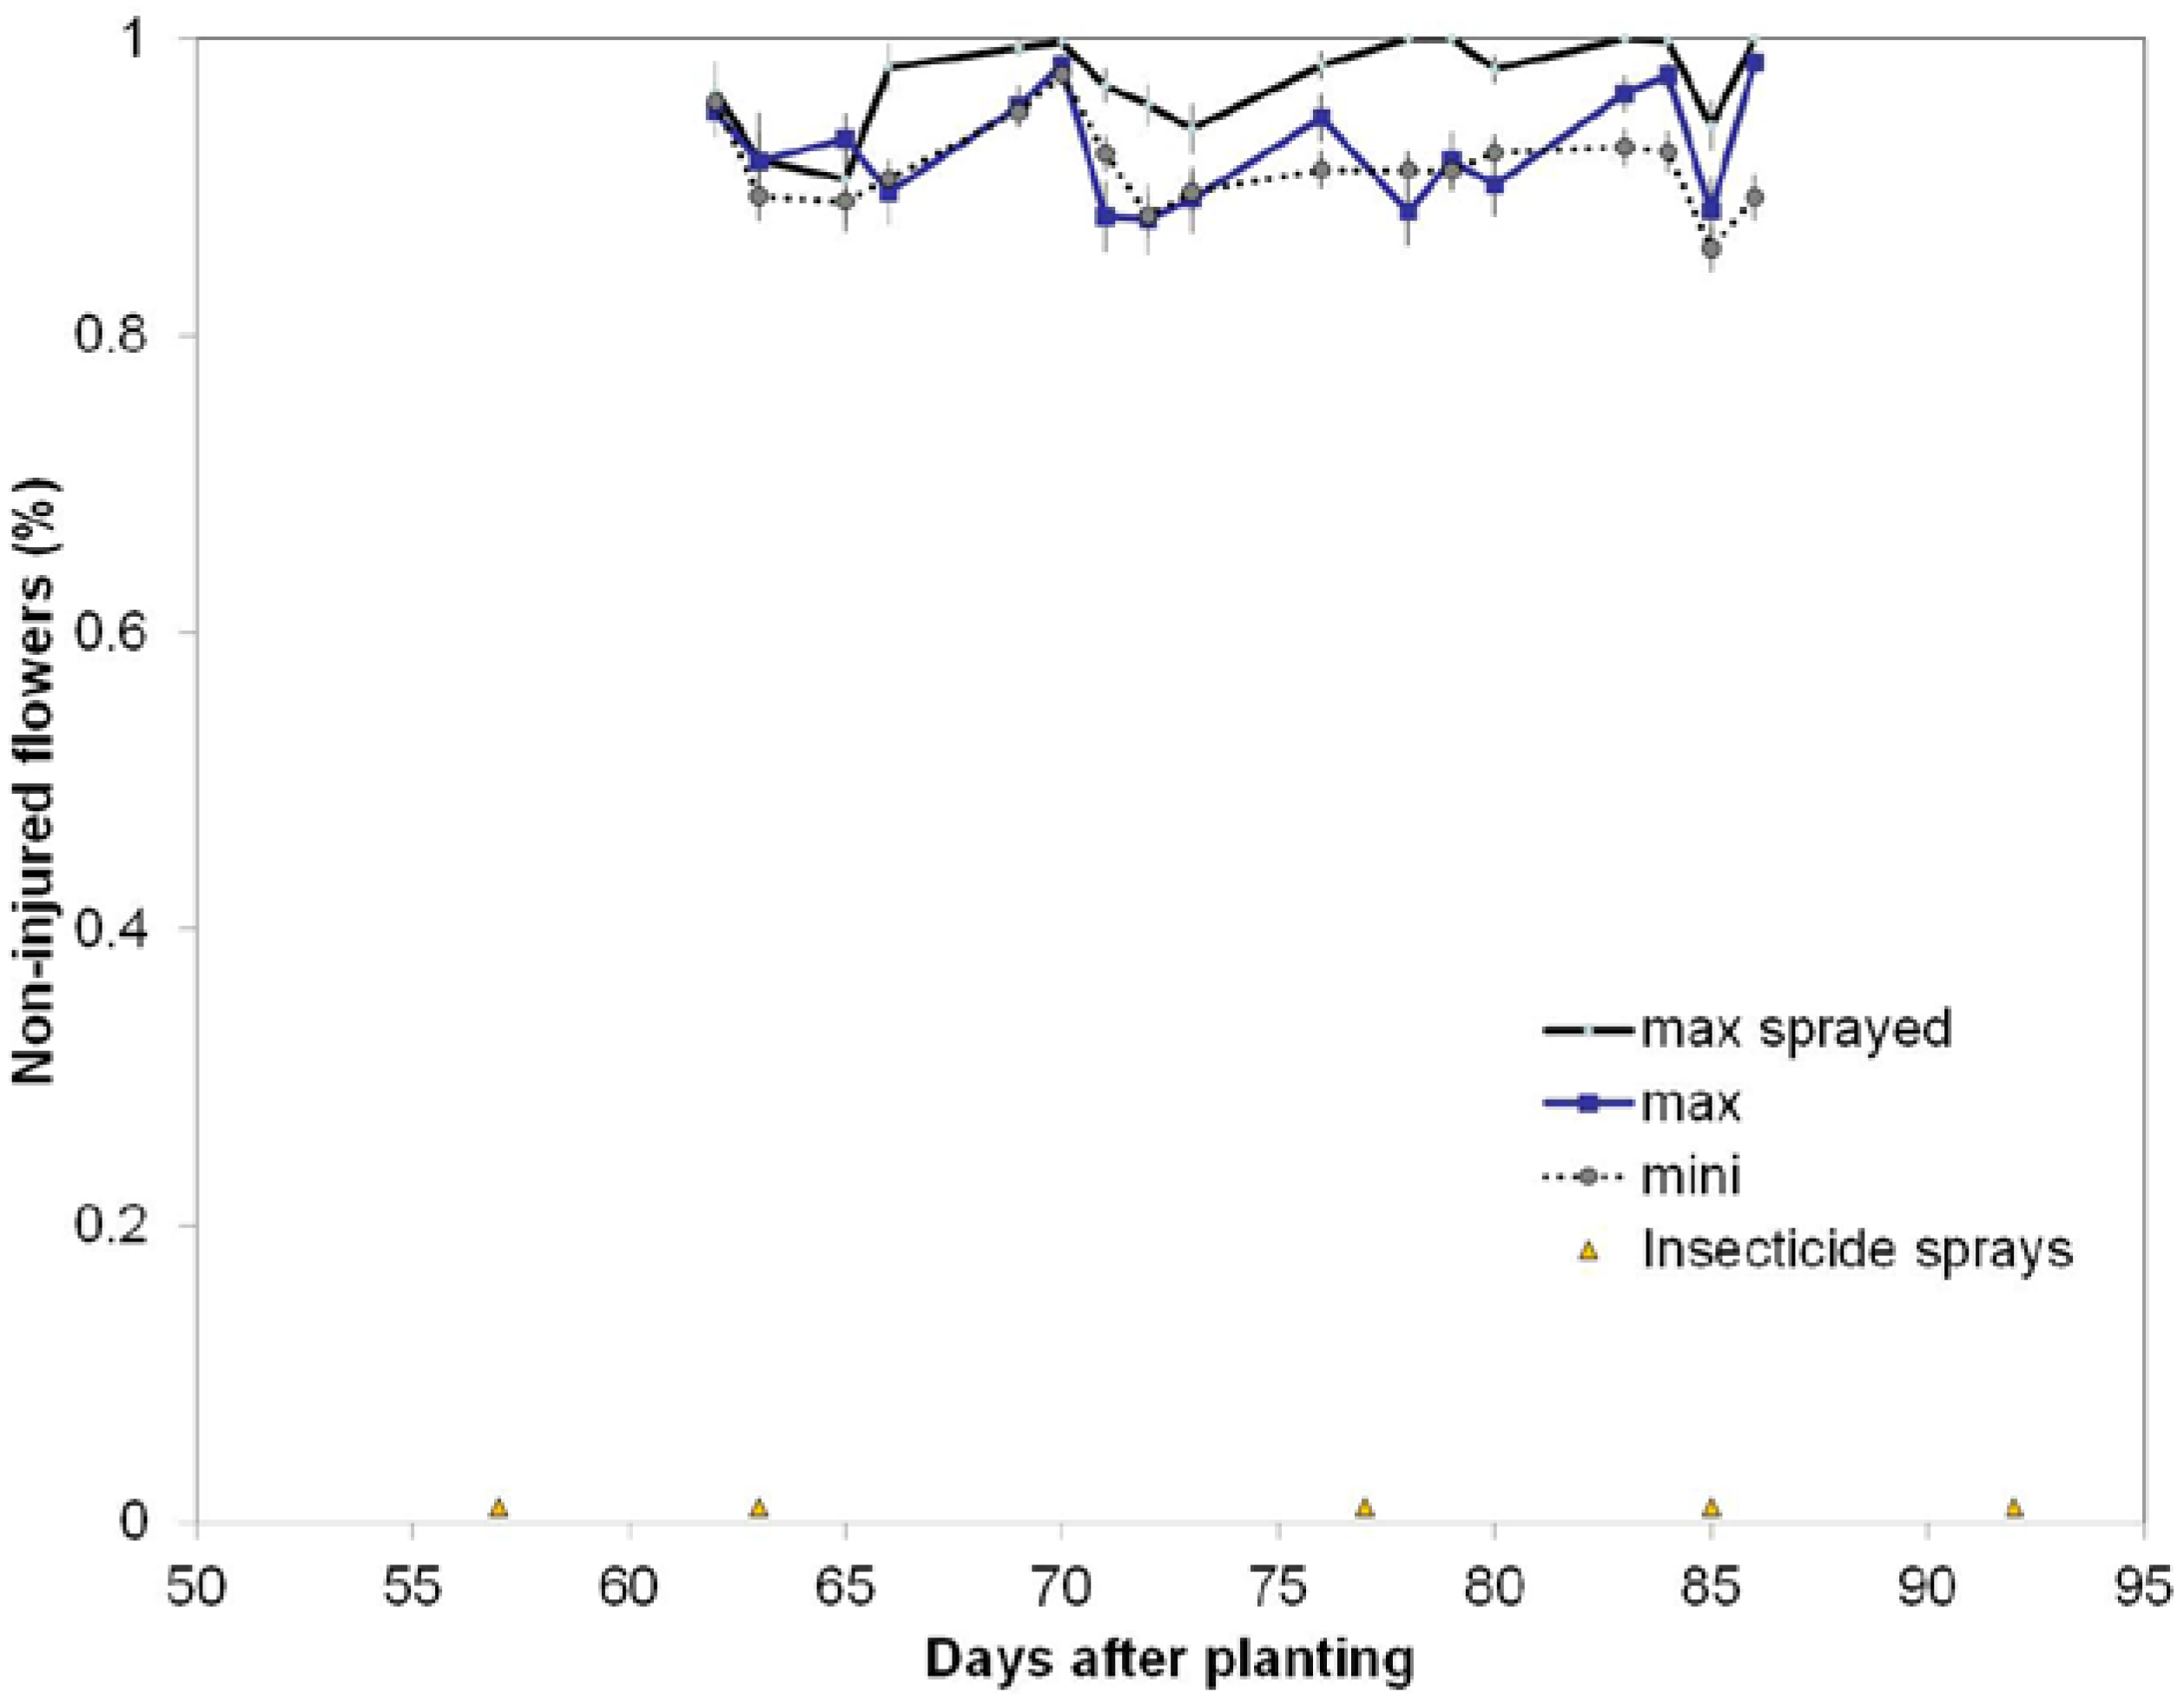
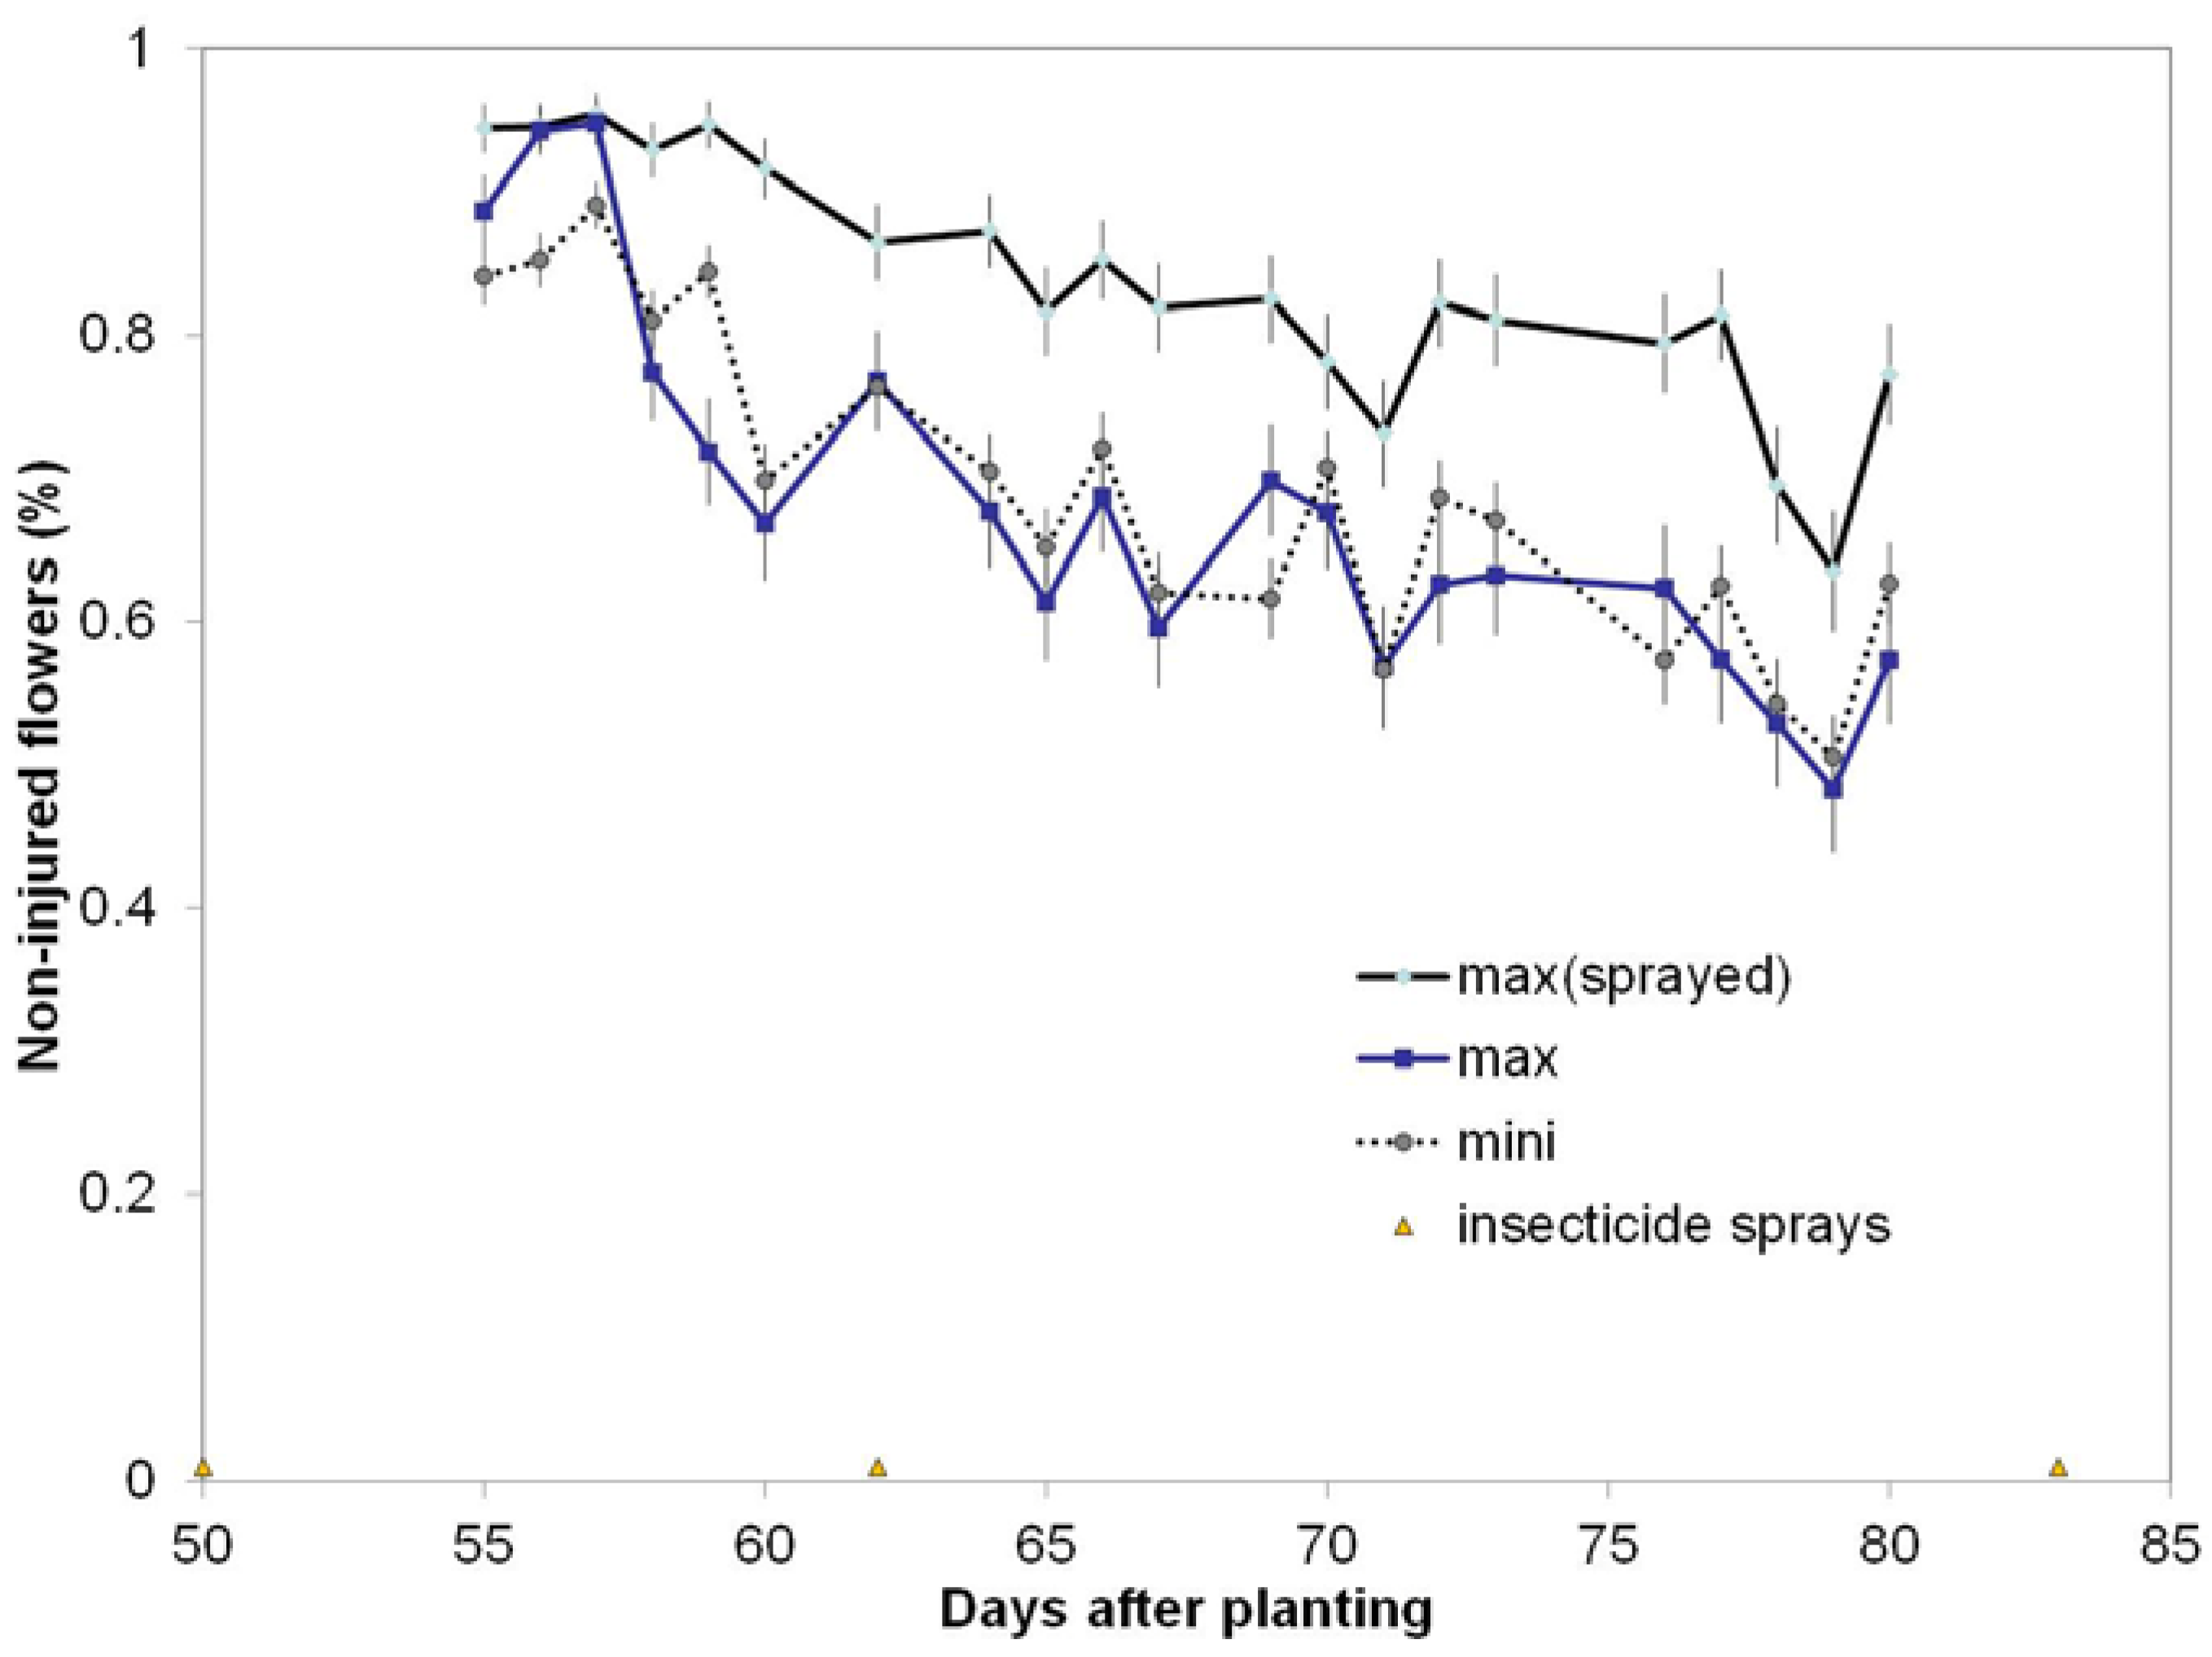
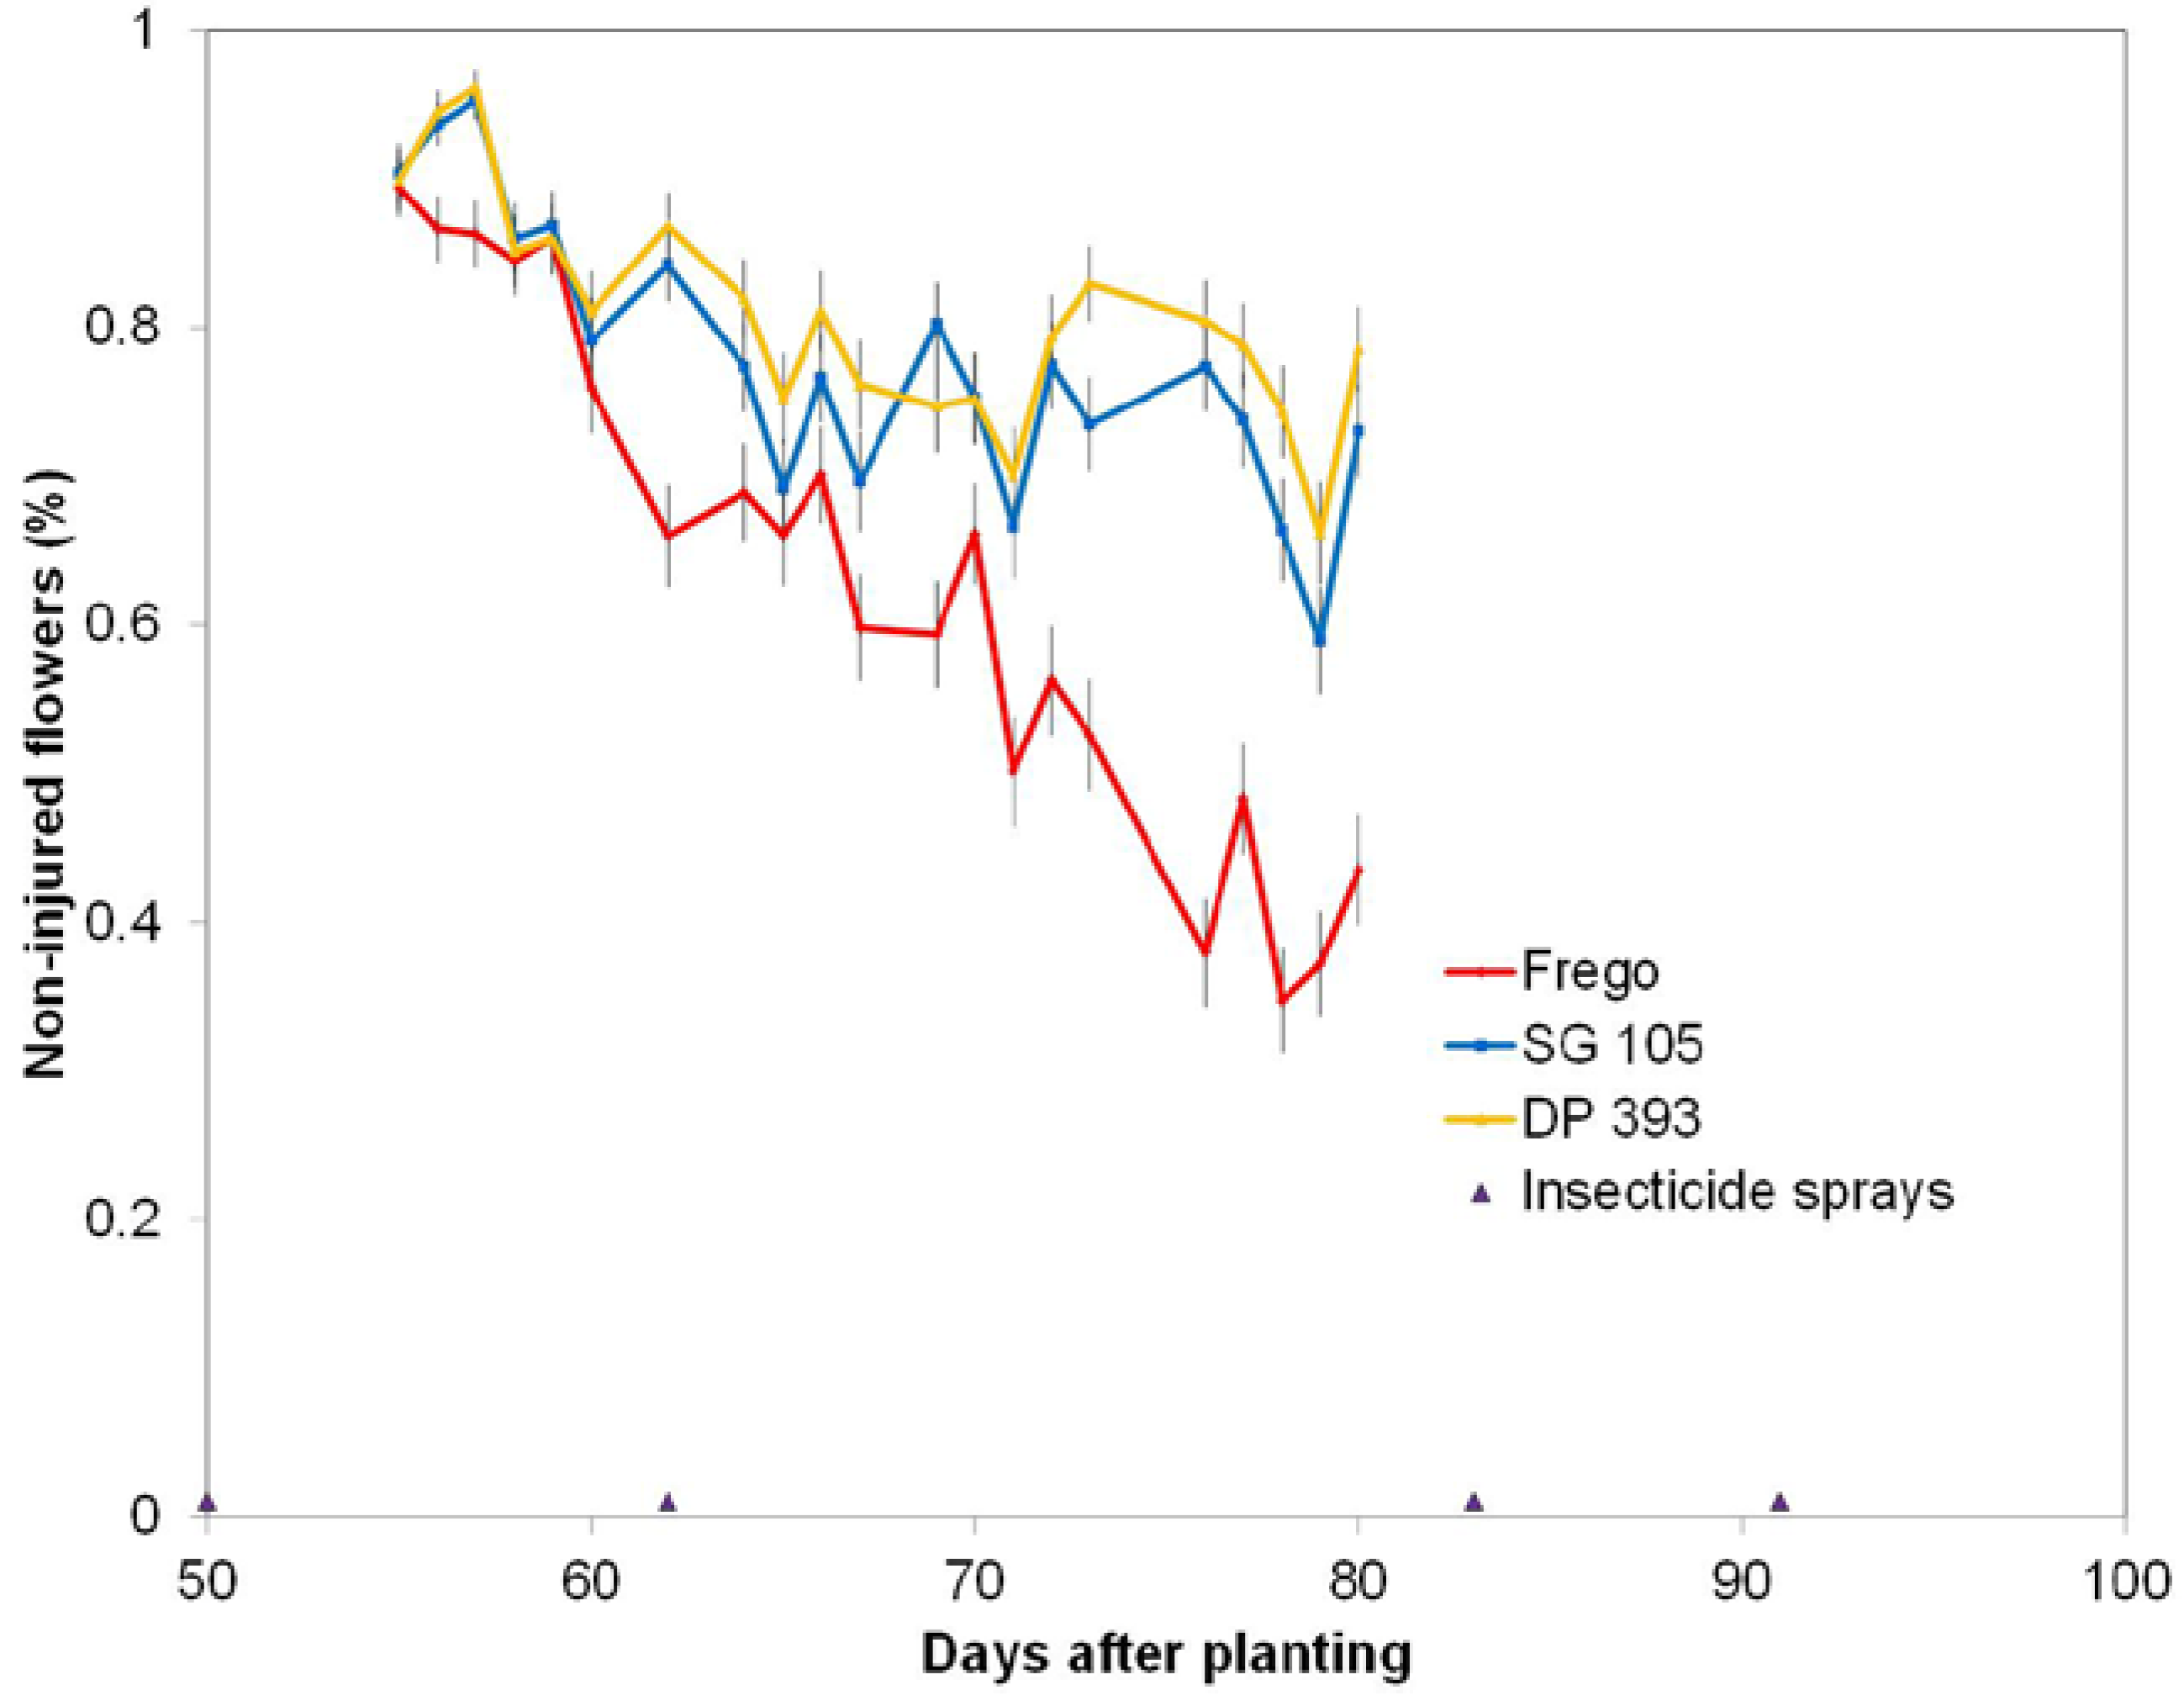
This study embedded the mini-plots within the max-plots to evaluate effects of plots size and interspersion of cultivars with the utilization of only one Latin square design and found that occurrences of WFAI were significantly different from zero regardless of plot size and were of similar trends across the two years (
Figure 4,
Figure 5,
Figure 6 and
Figure 7). While the visual appearance of WFAI injury is quite striking and easily visible, so that sampling errors due to sparse coverage are likely to be low, it is still possible to miss WF damage if the observer is on the opposite side of the plant from the damage. Therefore, WFAI counts could potentially be improved if observers worked in pairs on opposite sides of the mini- or max-plot row. Furthermore, if the WFAI counts were labeled according to the observer(s) and the time of day of each plot count, then observer effects (e.g., fatigue) could be included in the statistical design. Such a process provides a mechanism for quality control and would not greatly increase sampling effort. Additional helpful information would be to have the observer log the global positioning system (GPS) coordinates of the start and stop points of the length of row used to obtain the WFAI counts. Knowledge of variation of sampled row length (to reach a fixed count total of white flowers (WF) among field locations with different flowering rates would be extremely useful ancillary information for an analysis.
Working with the velvetbean caterpillar
Anticarsia gemmatalis (Hübner) on soybean, Funderburk and colleagues [
8] found that plot size did not affect relative rankings among cultivars in the density or percentage of defoliation; however, plot size and shape influenced the mean and precision of density and injury estimates. The design of the experiment used was a split-plot randomized complete block with each treatment replicated four times. The soybean cultivars were the sub-plot treatments and the whole plots were separated by a border row of the same plot type but planted with a soybean cultivar not being screened. They controlled for observer effect by using the same two persons, experienced in the collection of the data, and used the plot type by soybean cultivar interaction to obtain information on the influence of plot type on the relative rankings of the soybean cultivars.
This study on WFAI considered the interaction, yrow(MaxRow*MaxLine*MiniLine) and was found significant both years (
Table 1 and
Table 3). The interpretation of this interaction is that rates of WFAI counts are not influenced by plot size or interspersion among cultivars, but rates of damage can be altered by spraying the MaxLine plots.
Effects of plot size on selection criteria for sugarcane clones in another study that did not involve insects, were explored by Jackson and McRae [
9], who remarked that problems associated with the use of small plots are well known in field experimentation. Their claim affirms that the question posed by this research is relevant for recent cotton HPR efforts to the TPB. The sugarcane study stressed (1) prediction from simple models to describe correlated response to selection and (2) the use of different selection criteria over a wide range in combination with plot size × replicate configurations. Information from these models and criteria estimated parameters to predict effective approaches to selection in sugarcane breeding programs. While using more populations of clones or varieties than the three cotton cultivars of the present study, these investigators also used two different designs of the experiments: (a) a randomized complete block design with two blocks with treatments consisting of clone by plot shape combinations and (b) a 7 × 7 simple lattice with two complete blocks where the blocks contained all plots shapes of the seven sugarcane varieties. Both of their experiments employed constrained randomization to avoid different plot shapes of the same sugarcane clone (or variety) in any neighboring plots. This study on WFAI also employed constrained randomization with respect to the MiniLines embedded within the MaxLine assignments.
Principal results found by Jackson and McRae [
9] were that (1) plot size had a large effect on estimates of genetic variance for yield; (2) genetic variances for cane yield for 2-row plots were intermediate between the single-row and 6-row plots; and (3) error variances were also inflated in most cases in small plots compared with large plots. In contrast, this study on WFAI did not indicate effects of plot size, possibly because adult TPB have the behavioral capacity to spatially disperse themselves in a manner that matches the host plant suitability of the cotton crop [
10,
11,
12,
13].
Citing Gauch and Zobel [
14], another point discussed by Jackson and McRae [
9] was that given limited resources, there is a tradeoff between increasing replication, plot size, and number of genotypes that can be screened. While admitting the need for more research to determine an optimal system for sugarcane selections, one of their conclusions of interest to the WFAI study, is that an optimal system may involve usage of a large number of small single row plots within a larger plant crop. The WFAI study mirrors this recommendation by the usage of the max-plot with embedded mini-plot experimental units in a Latin square arrangement.
In the near future, one can envision the development of a variable-cultivar planting system that can embed potential HPR cultivars for TPB as georeferenced mini-plots in a sea of conventional cultivars derived as one, two, or three, split-planter max-plot arrangements for HPR evaluations in commercial production fields. If georeferenced field topography layers such as elevation, slope, soil type, or past yield history zones are also available, then such a study could be quite diverse. The statistical approach employed in this study would be combined with other concepts developed by Willers and Milliken and colleagues [
15,
16] to concurrently assess genotype by environment interaction effects of other candidate cultivars for TPB resistance.
An analysis where plot size and arrangements of plots were varied over years was described by Ratnadass and colleagues [
17]. Similar to the findings for WFAI, they found (1) a significant genotypic effect in regards to insect infestation and damage in both large and small plots, but (2) if plots were large, a significant border effect was found, which (3) differed according to whether the small plot bordered (or was centered to) the large plot. In this latter respect, they conclude that there is a small plot effect; however, none of their plot designs embedded random mini-plots among several cultivars within a large max-plot of an alternate cultivar, as done in this research. This contrast of results between these two experiments indicates a potential of alternate plot design wherein a max-plot of a susceptible cultivar contains only one mini-plot of a resistant cultivar and
vice versa, and these alternate pairs are themselves arranged as a Latin square. This candidate for an experiment could be extended to a large commercial field experiment where a grower wants to compare an alternate cultivar against a traditional standard, but confidence in use of the alternative is low. In this type of experiment, the size of max-plot could be very large compared to the mini-plot to further control risk, but might require additional tiers related to mapped features of field topography (
i.e., soil type, elevation,
etc.) or characteristics of the farm equipment [
16].
The Latin square design was selected as the basic design structure, and then modified through the concepts of (1) the max-plots; (2), the mini-plots; and (3) spraying a part of the max-plots, and then the assignment of (4) the MaxLine and (5) the MiniLine treatments to these plot types. This experimental structure was motivated by experiences learned in commercial cotton fields on TPB abundance and interspersion among crop habitat categories mapped through remote sensing analyses by Willers and colleagues [
10,
11,
12,
13]. Consequently, it is important to recognize that knowledge learned from prior experiments is a valuable resource for new technologies. Therefore, differences in crop type and planting dates in fields surrounding the WFAI max-plot Latin square, including intra-field movement of TPB from these alternate sources, were considerations for making decisions on how to embed the mini-plots. Since limited resources prevented the inclusion of remote sensing as another tool to aid in the detailed description of spatial and temporal trends in TPB abundance among the max- and mini-plots, the characteristics of the Latin square design to address potential trends in TPB intra-plot dispersion at the study location made it the obvious choice.
While the modifications to the Latin square design in this study are similar to work on spatial design of the experiments by Willers and Milliken and colleagues [
15,
16] there is one important distinction—this experiment did not explicitly use a geographical coordinate system to map the data, treatment, and design structures to locations on the surface of the earth. Overall, the results indicate that, despite the absence of geo-referenced information, the modified Latin square and statistical model provided useful information to the HPR program that requested the study.
Prior to the early 1990s, the statistical software capability to analyze data from an experiment with such a layout as used in this study was non-existent, or inaccessible to most investigators. As a consequence, the design of the experiment for the primary question of “Are TPB preferences affected by cultivar arrangements among different sizes of plots?” would have been considerably different than the modified Latin square layout presented in this paper. Therefore, this investigation demonstrates that current advances in statistical software (e.g., [
18,
19,
20]) offer the field agronomist and field entomologist exceptional opportunities to explore difficult and interesting questions. Useful results from such kinds of novel designs of experiments offer producers of crops important solutions to their problems.
4. Experimental Section
4.1. Study Area and Plot Layout
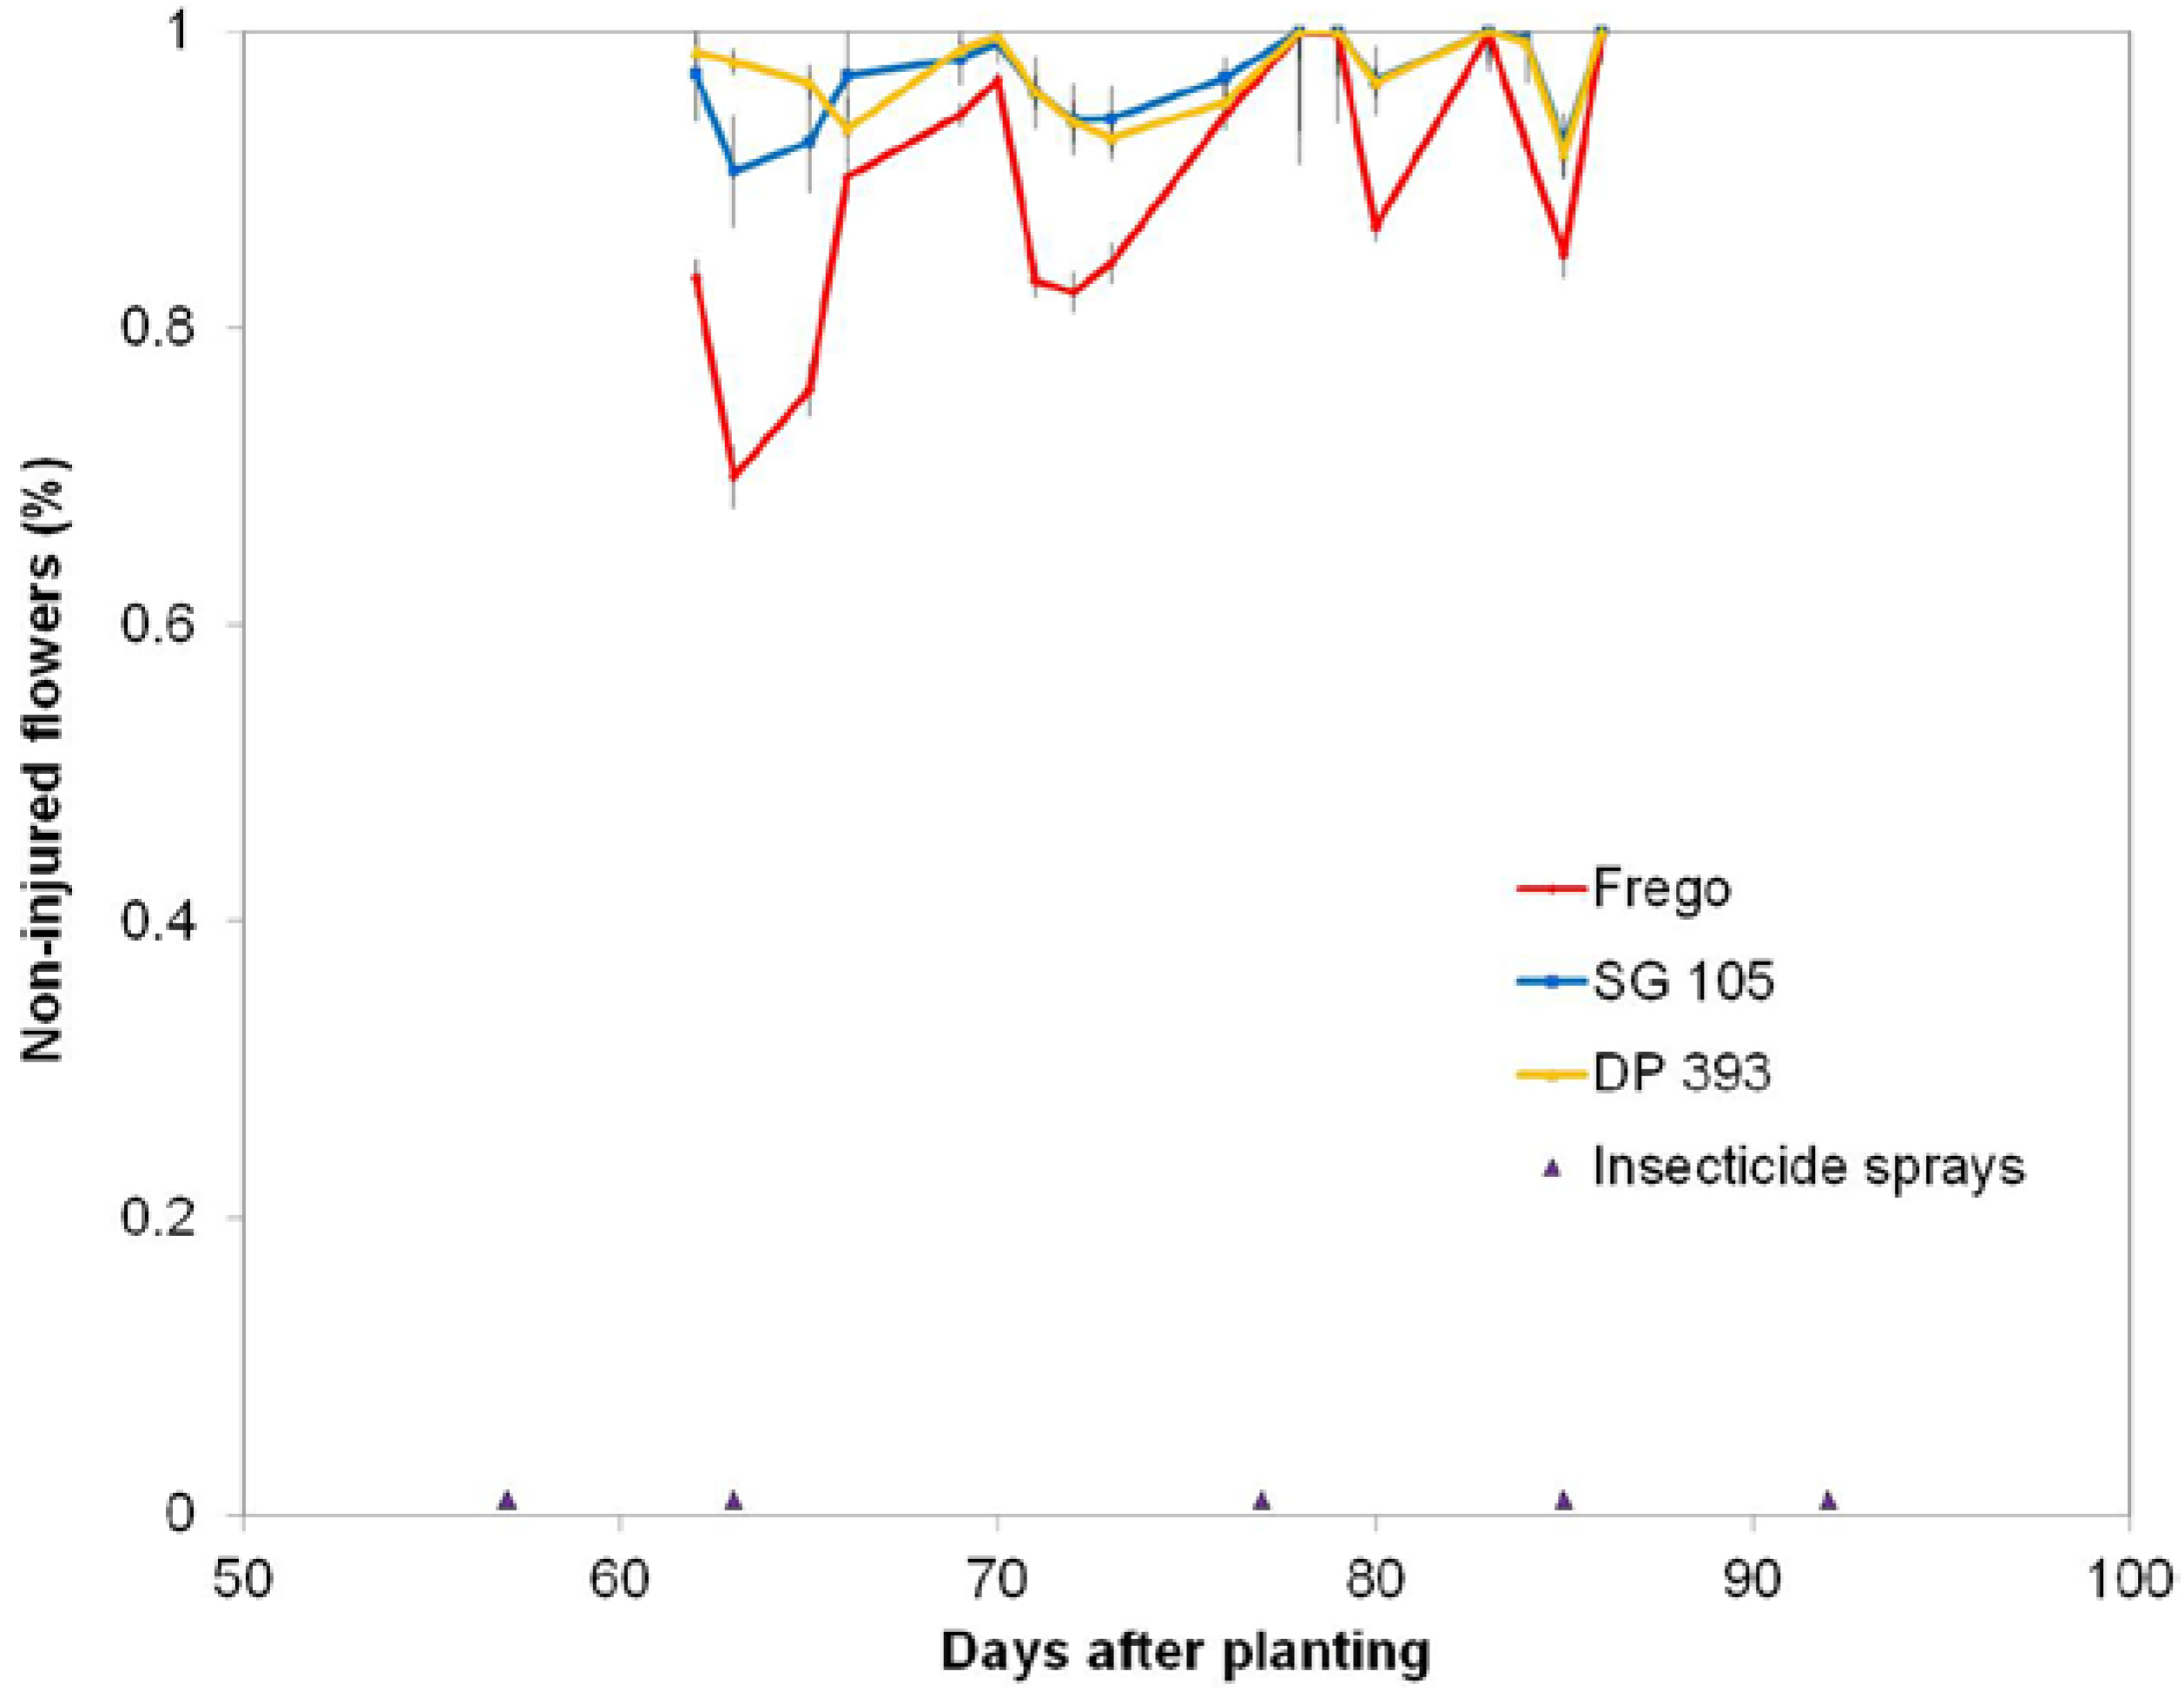
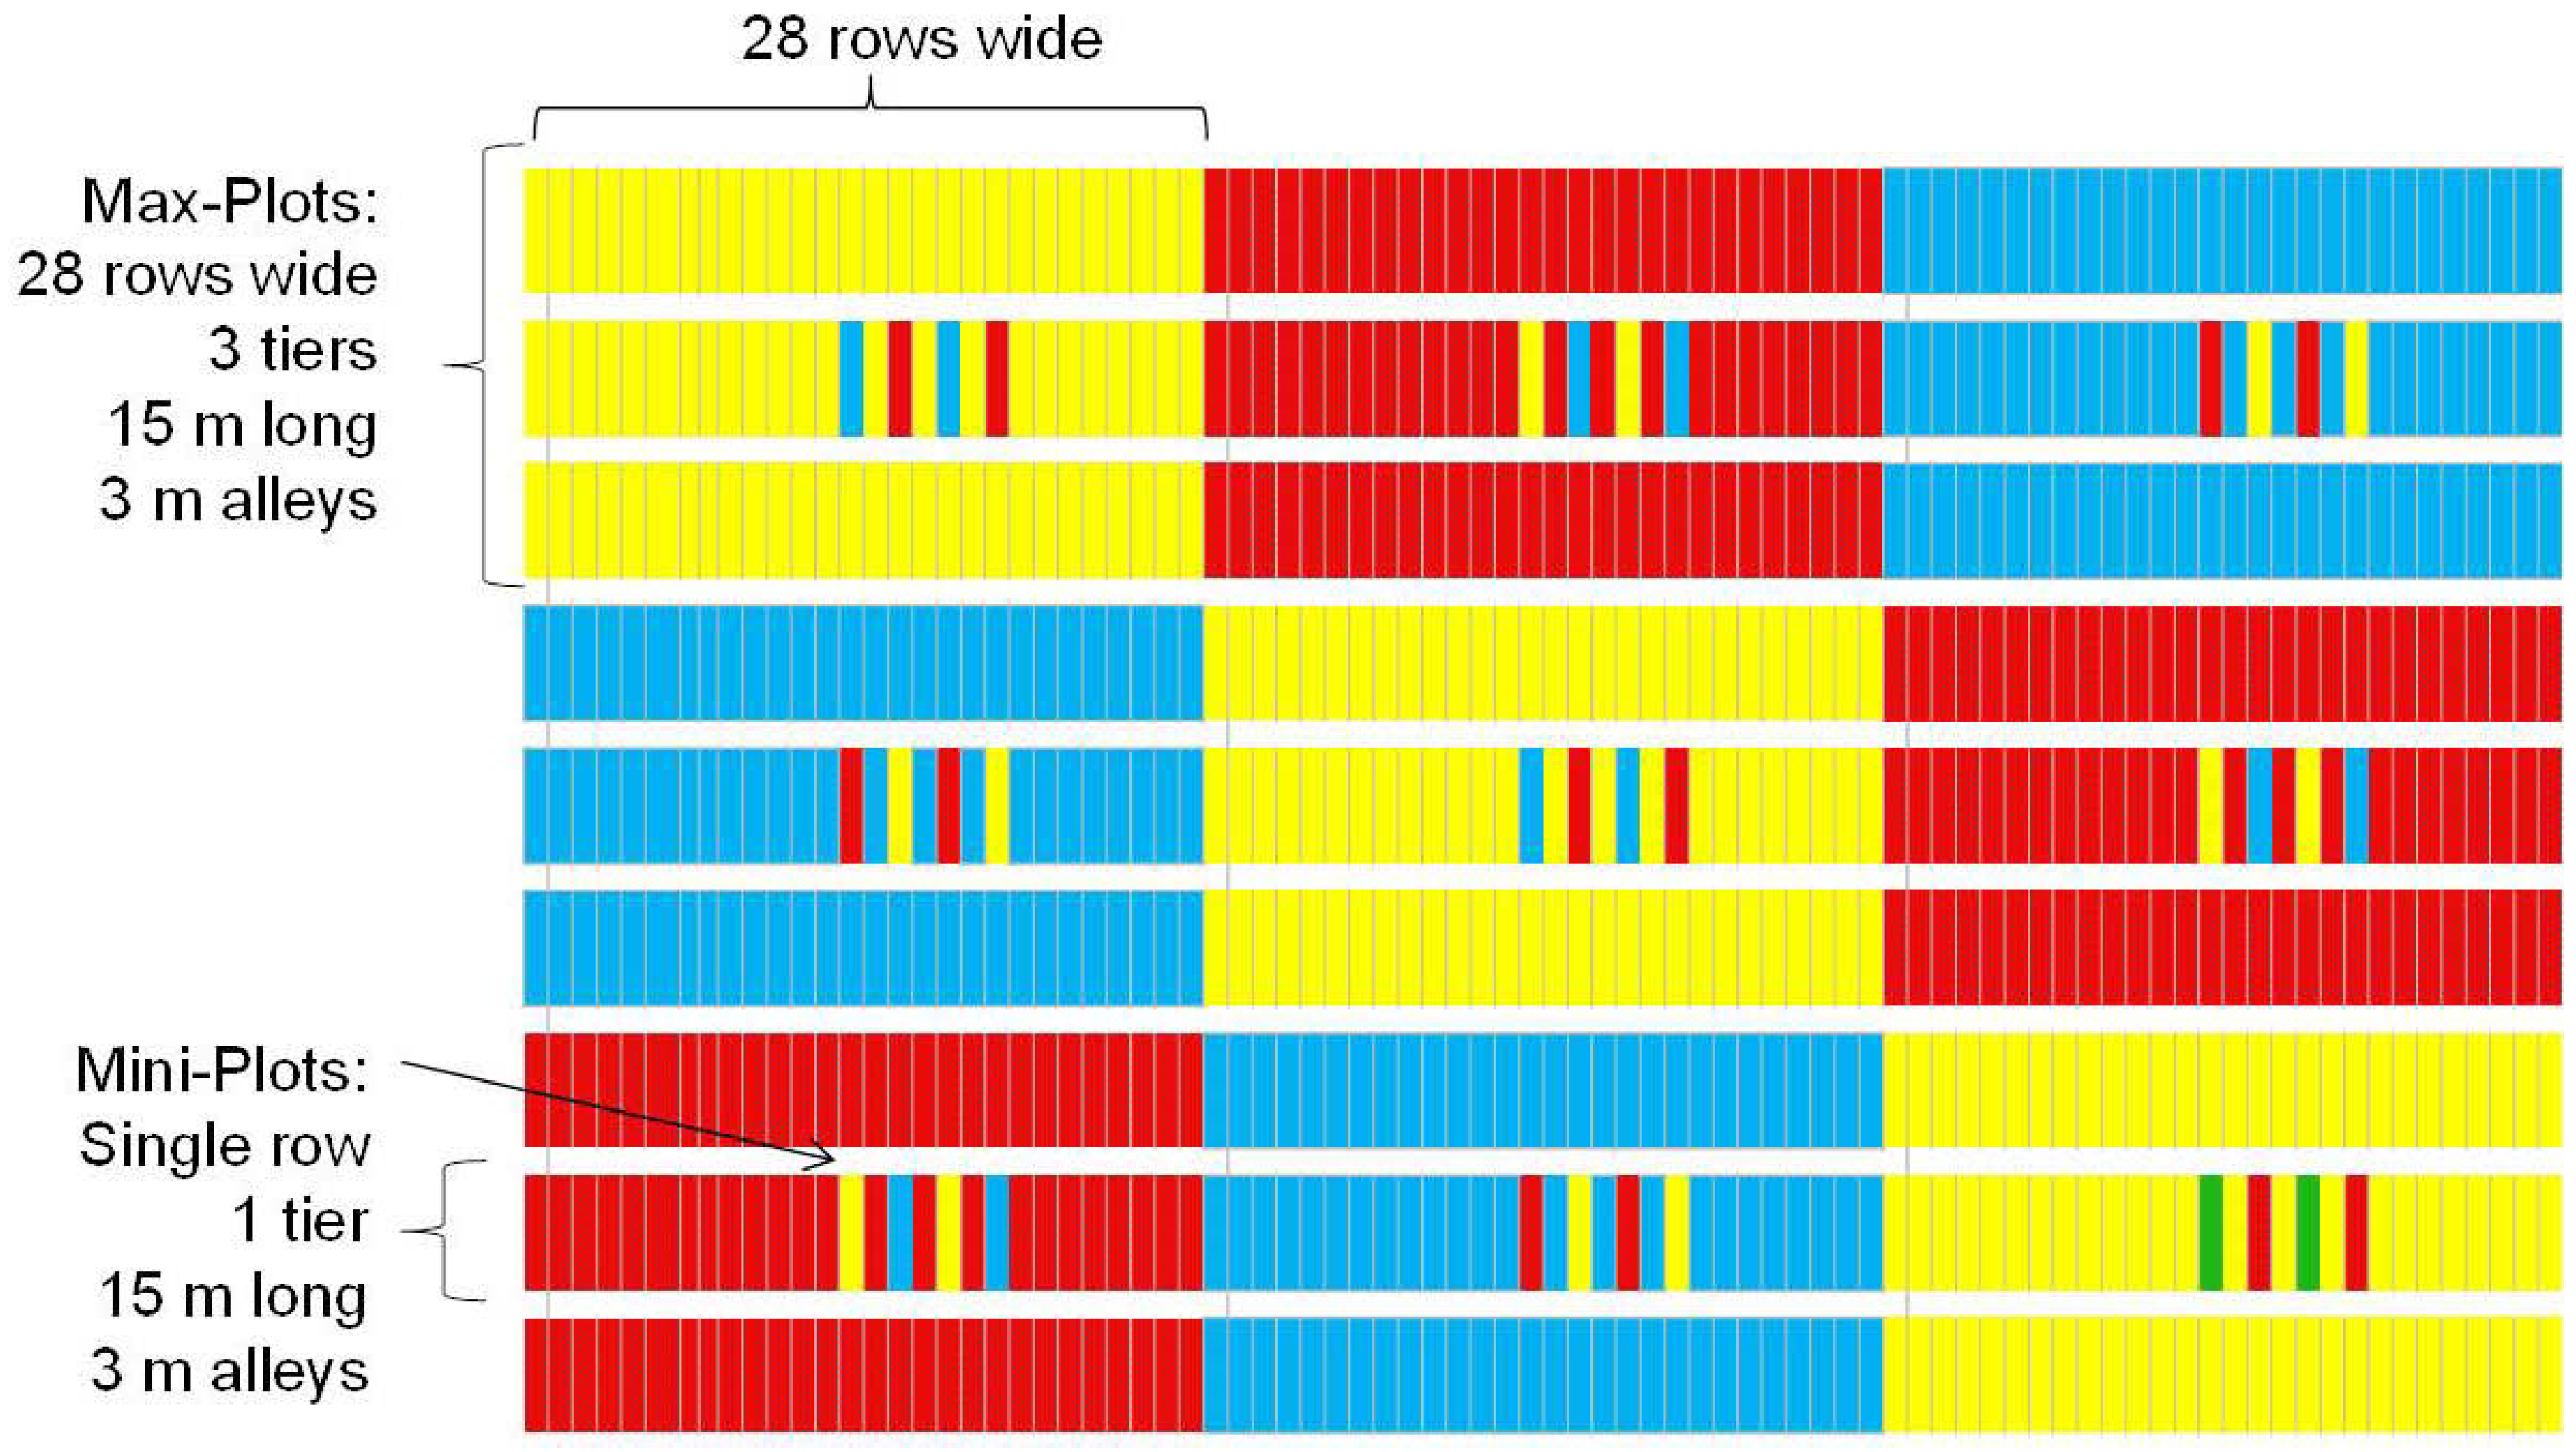
The experiment was conducted at the Cooperative University Research Farm at the Judd Hill Foundation Farm in Poinsett County, near Trumann, in northeast Arkansas. Planting dates were 8 May 2008 and 19 May 2009. A highly susceptible frego line, RBCDHGPIQH-1-97 (frego) was planted along with two standards, DP 393 and SG 105. The field layout (
Figure 8) consisted of 9 max-plots to which one of the three cotton lines was assigned using a Latin square arrangement. Each max-plot consisted of 28 planted rows, 65.62 m long, divided into three tiers of 15.24 m row lengths, with 3.64 m of alley separating the tiers. The center tier of each max-plot comprised a set of embedded mini-plots where the two lines not assigned to the max-plot were inserted between two rows of the line assigned to the max-plot. Specifically, within this middle tier, rows 13, 15, 17 and 19 consisted of the line assigned to the max-plot while rows 14, 16, 18, and 20 were alternately assigned to the other two lines. An additional factor was that insecticides were applied (with an eight-row boom) forming a strip down the first eight rows of each column of the Latin square. In
Figure 8, the three cotton lines planted are displayed as either red (frego), blue (SG 105) or yellow (DP 393) in the 2008 trial. Cotton lines were re-randomized in 2009, but field layout was similar.
Figure 8.
Plot diagram of the max-plot and mini-plot layout.
Figure 8.
Plot diagram of the max-plot and mini-plot layout.
4.2. White Flower Anther Injury (WFAI)
Assessments for WFAI were made 5 to 7 times weekly during the first 4 weeks of flowering. These weekly counts of the number of WFAI within the first 10 flowers encountered within the mini-plots of each max-plot provided the data to evaluate effects of plot sizes and interspersion of cultivars on the proportion of WFAI caused by TPB.
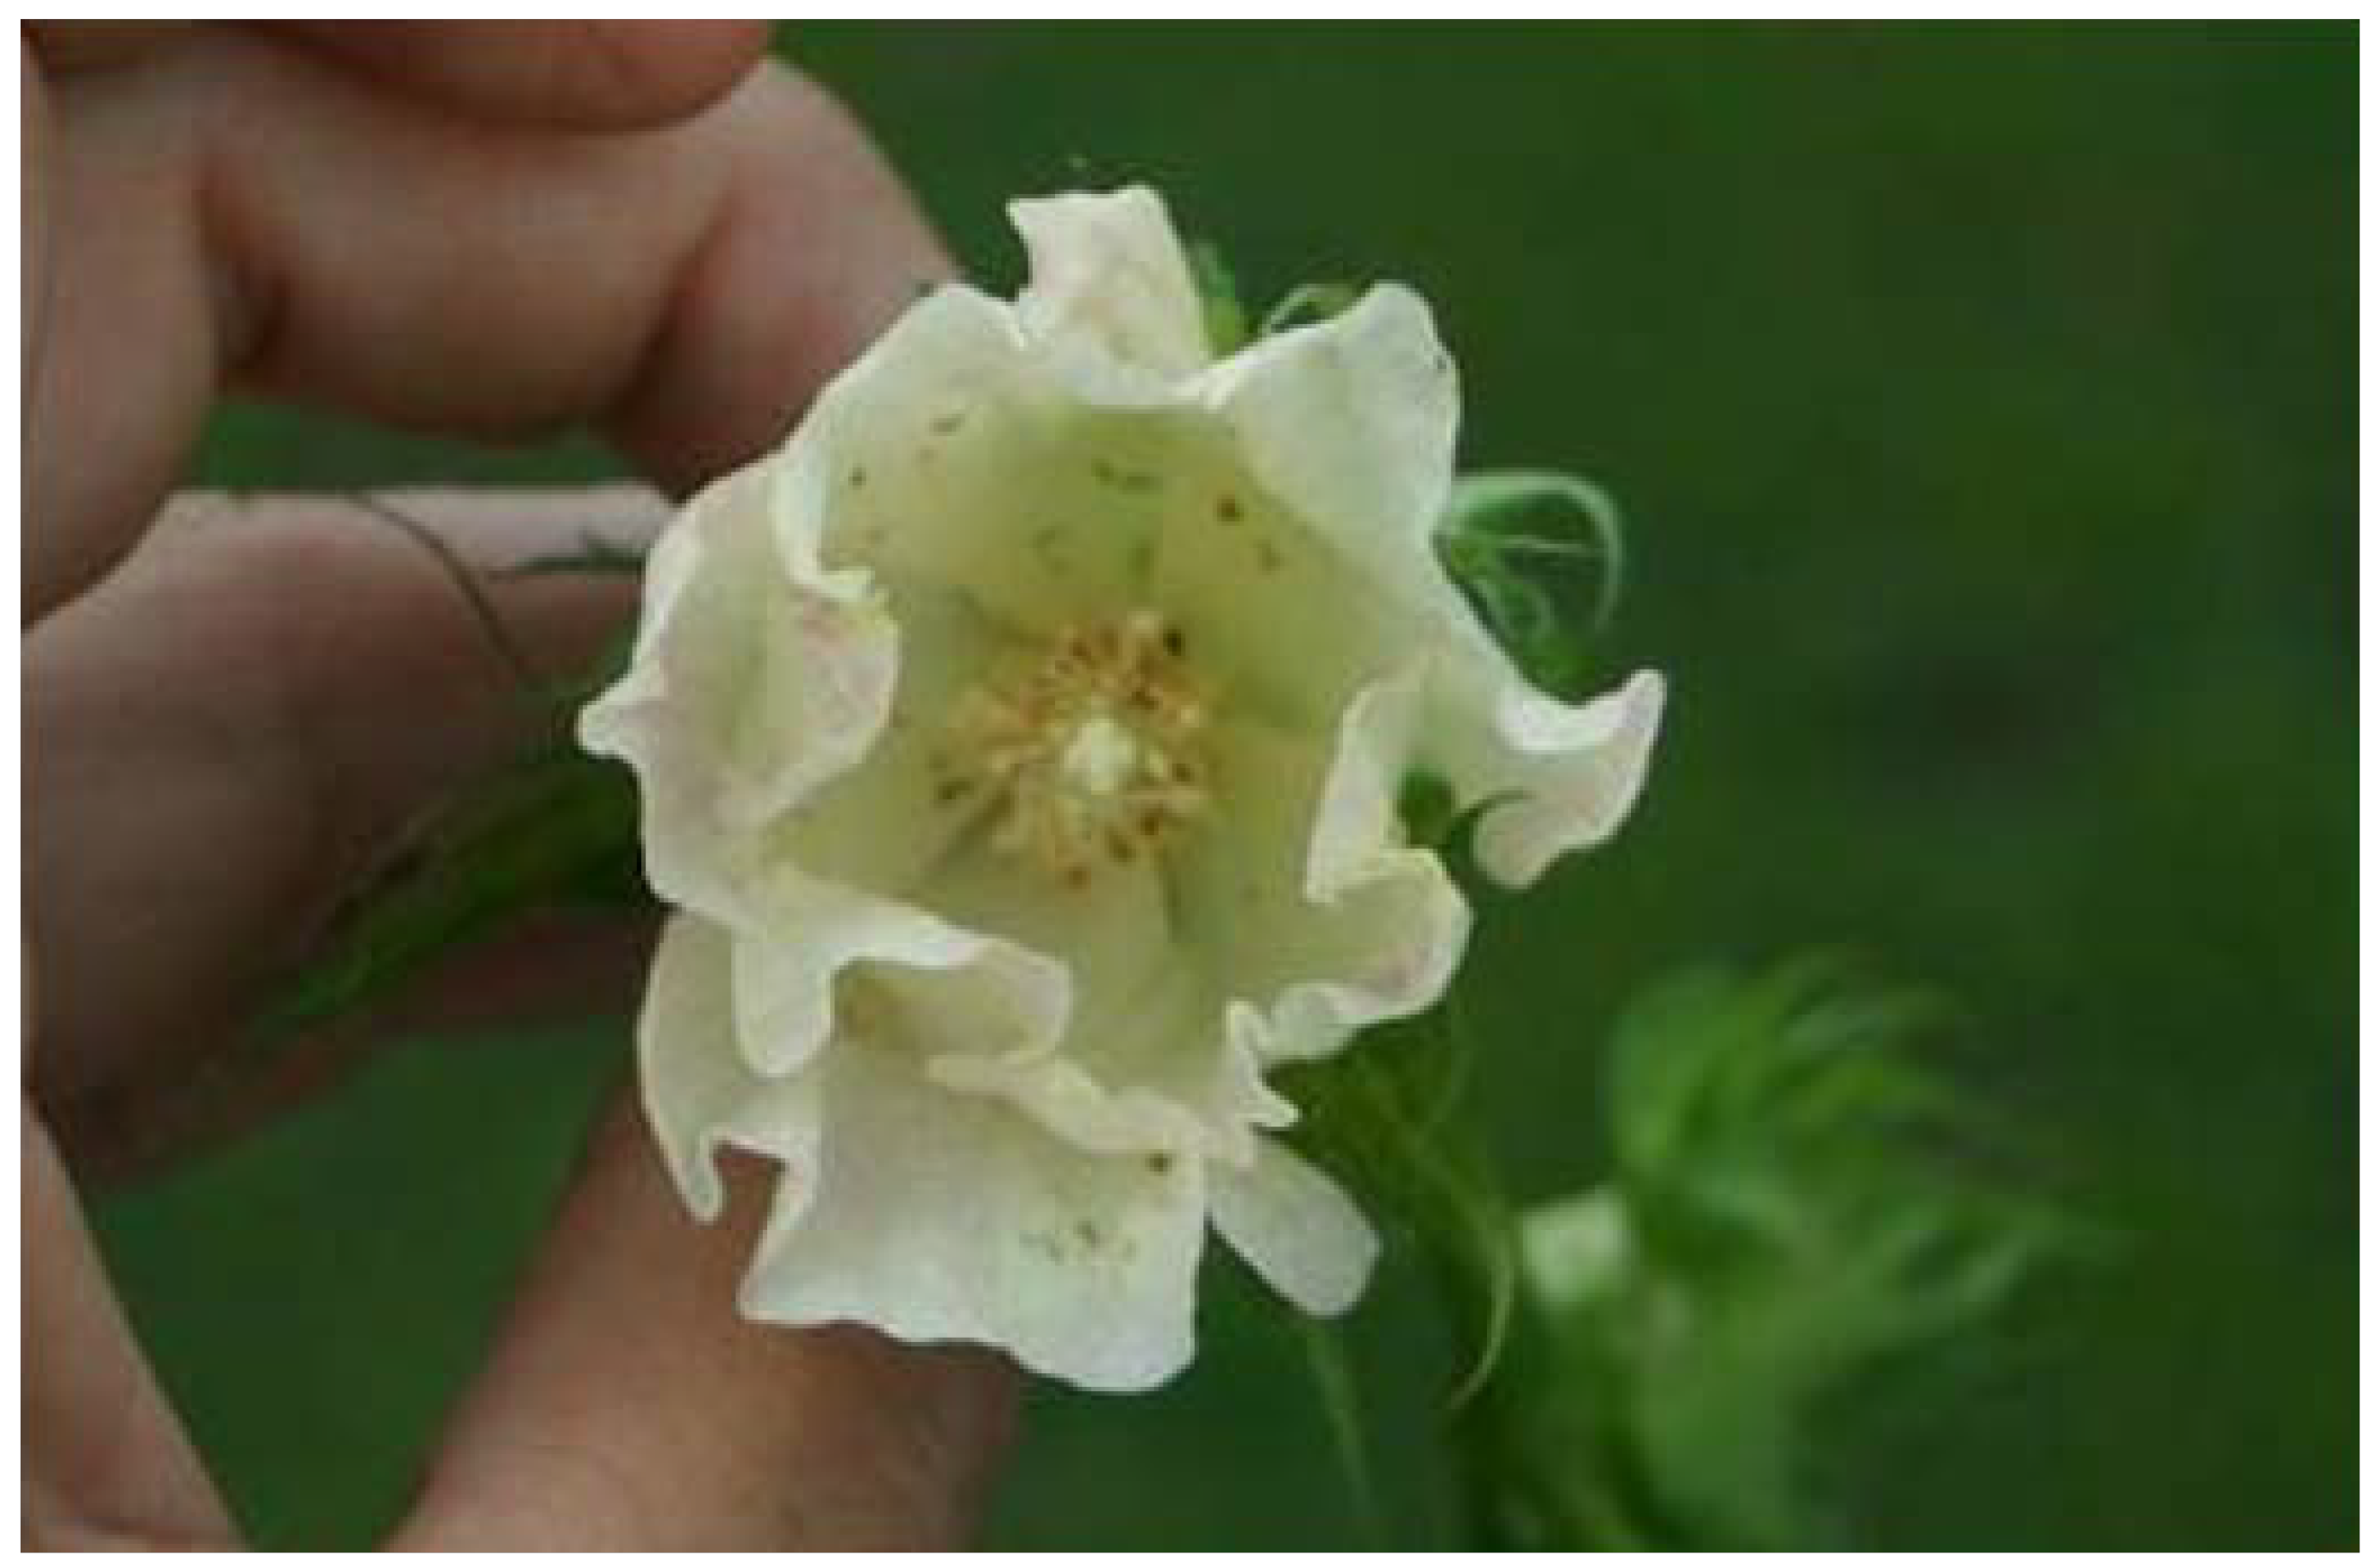
Thus, for the max-sprayed and max-non-sprayed plots, 3 samples of 10 consecutive WF per sample were taken each day counts were made. Counts of WF were fixed to a limit of 10 because (1) flowering rate is cultivar specific; (2) flowering rates vary with changes in DAP and weather; and (3) the mini-plots rows are short. This technique of using a fixed count limit for flowers, rather than a fixed distance of row within which to make counts, should mimic the search behaviors of the TPB that also has to respond to these variations in flowering rate and flower density among the cultivars. Using this sample of 10 WF, injury was categorized as either “0” for no anther injury or “1” if anther injury was present (
Figure 9). Counts were made (1) across all 3 tiers of rows 24, 25, 26 of the non-sprayed max-plots; (2), in rows 4, 5, 6 in all 3 tiers of the sprayed max-plots; and (3) in each of the 8 mini-plot rows within each max-plot. Count data were kept separate for each row. Samplers took care to minimize touching or causing other mechanical disturbances to the plants.
Figure 9.
Picture showing early symptoms of anther injury (i.e., darkened stamens, including the dark spots on the petals) to a white flower due to feeding by adult tarnished plant bug prior to antithesis.
Figure 9.
Picture showing early symptoms of anther injury (i.e., darkened stamens, including the dark spots on the petals) to a white flower due to feeding by adult tarnished plant bug prior to antithesis.
4.3. Cotton Plant Monitoring
Cotton plants were sampled both years in each max-plot from the squaring period through the physiological cutout period. In cotton, cutout can be defined as when the mean number of nodes above the first white flower position on a sympodial branch equals 5 nodes from the plant terminal. Sampling included measurement of plant height, number of sympodia, and presence or absence of first position squares, flowers, and bolls. In this paper, only the results of analyses for the WFAI are discussed.
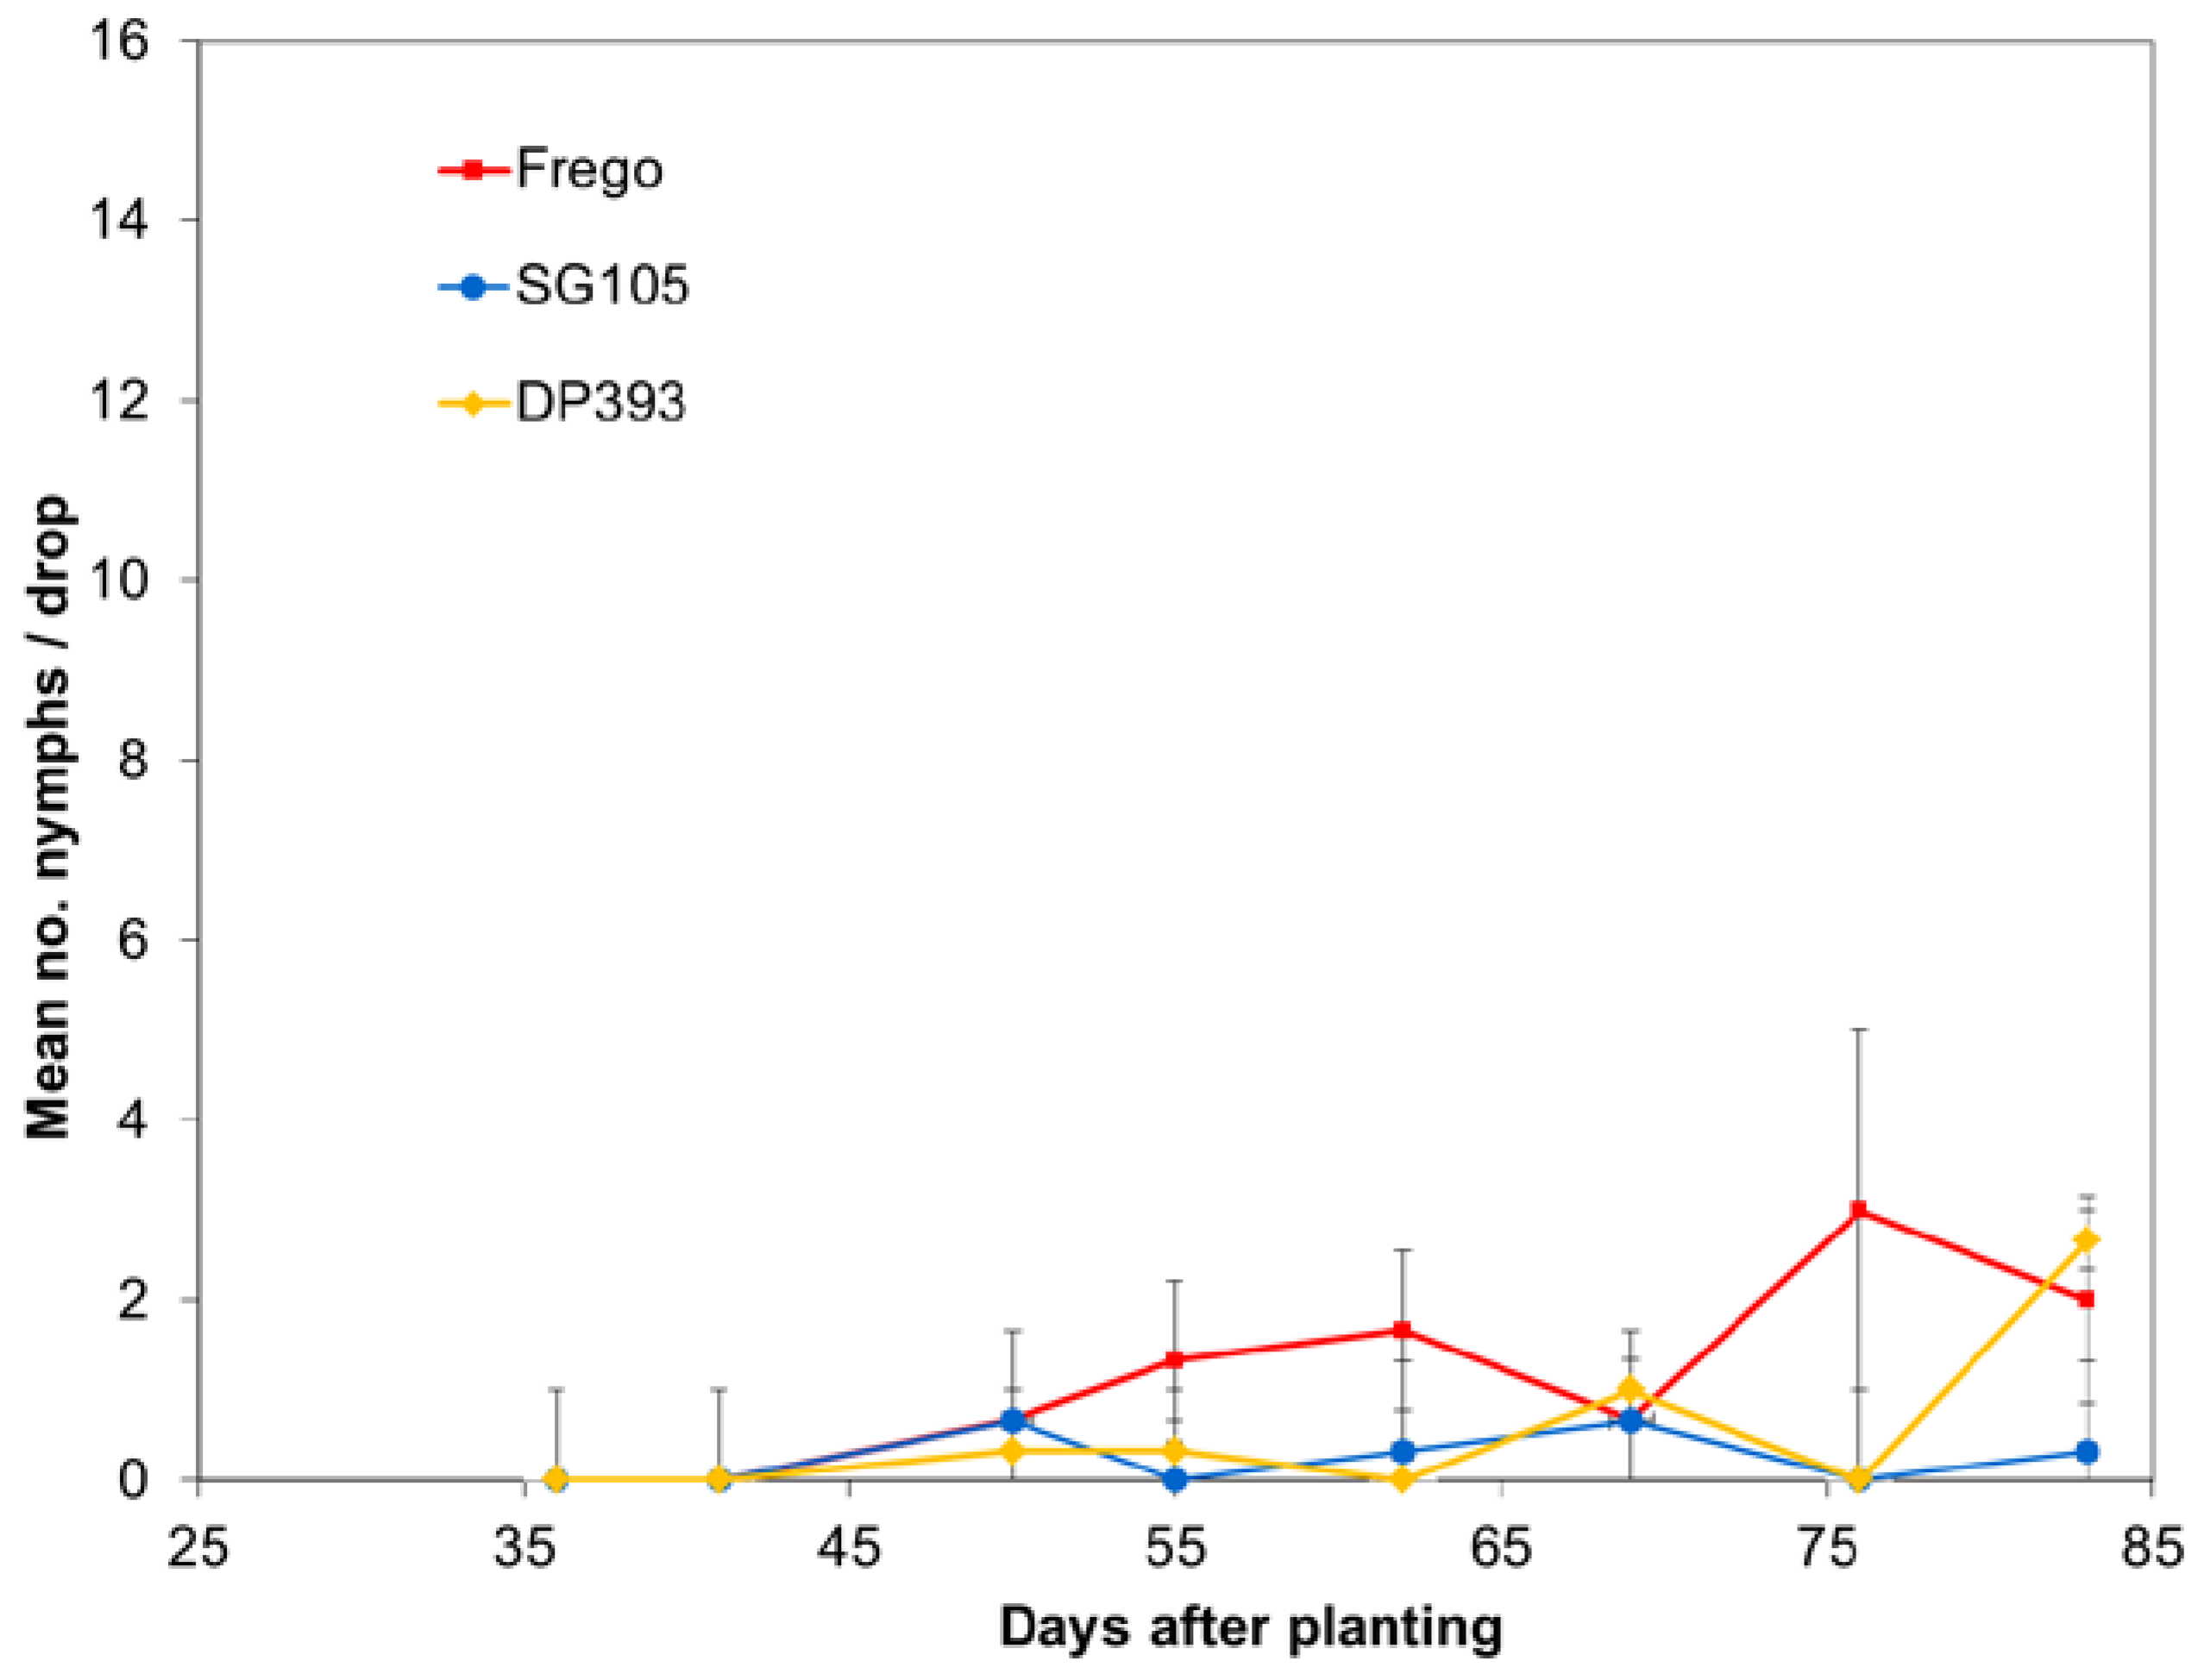
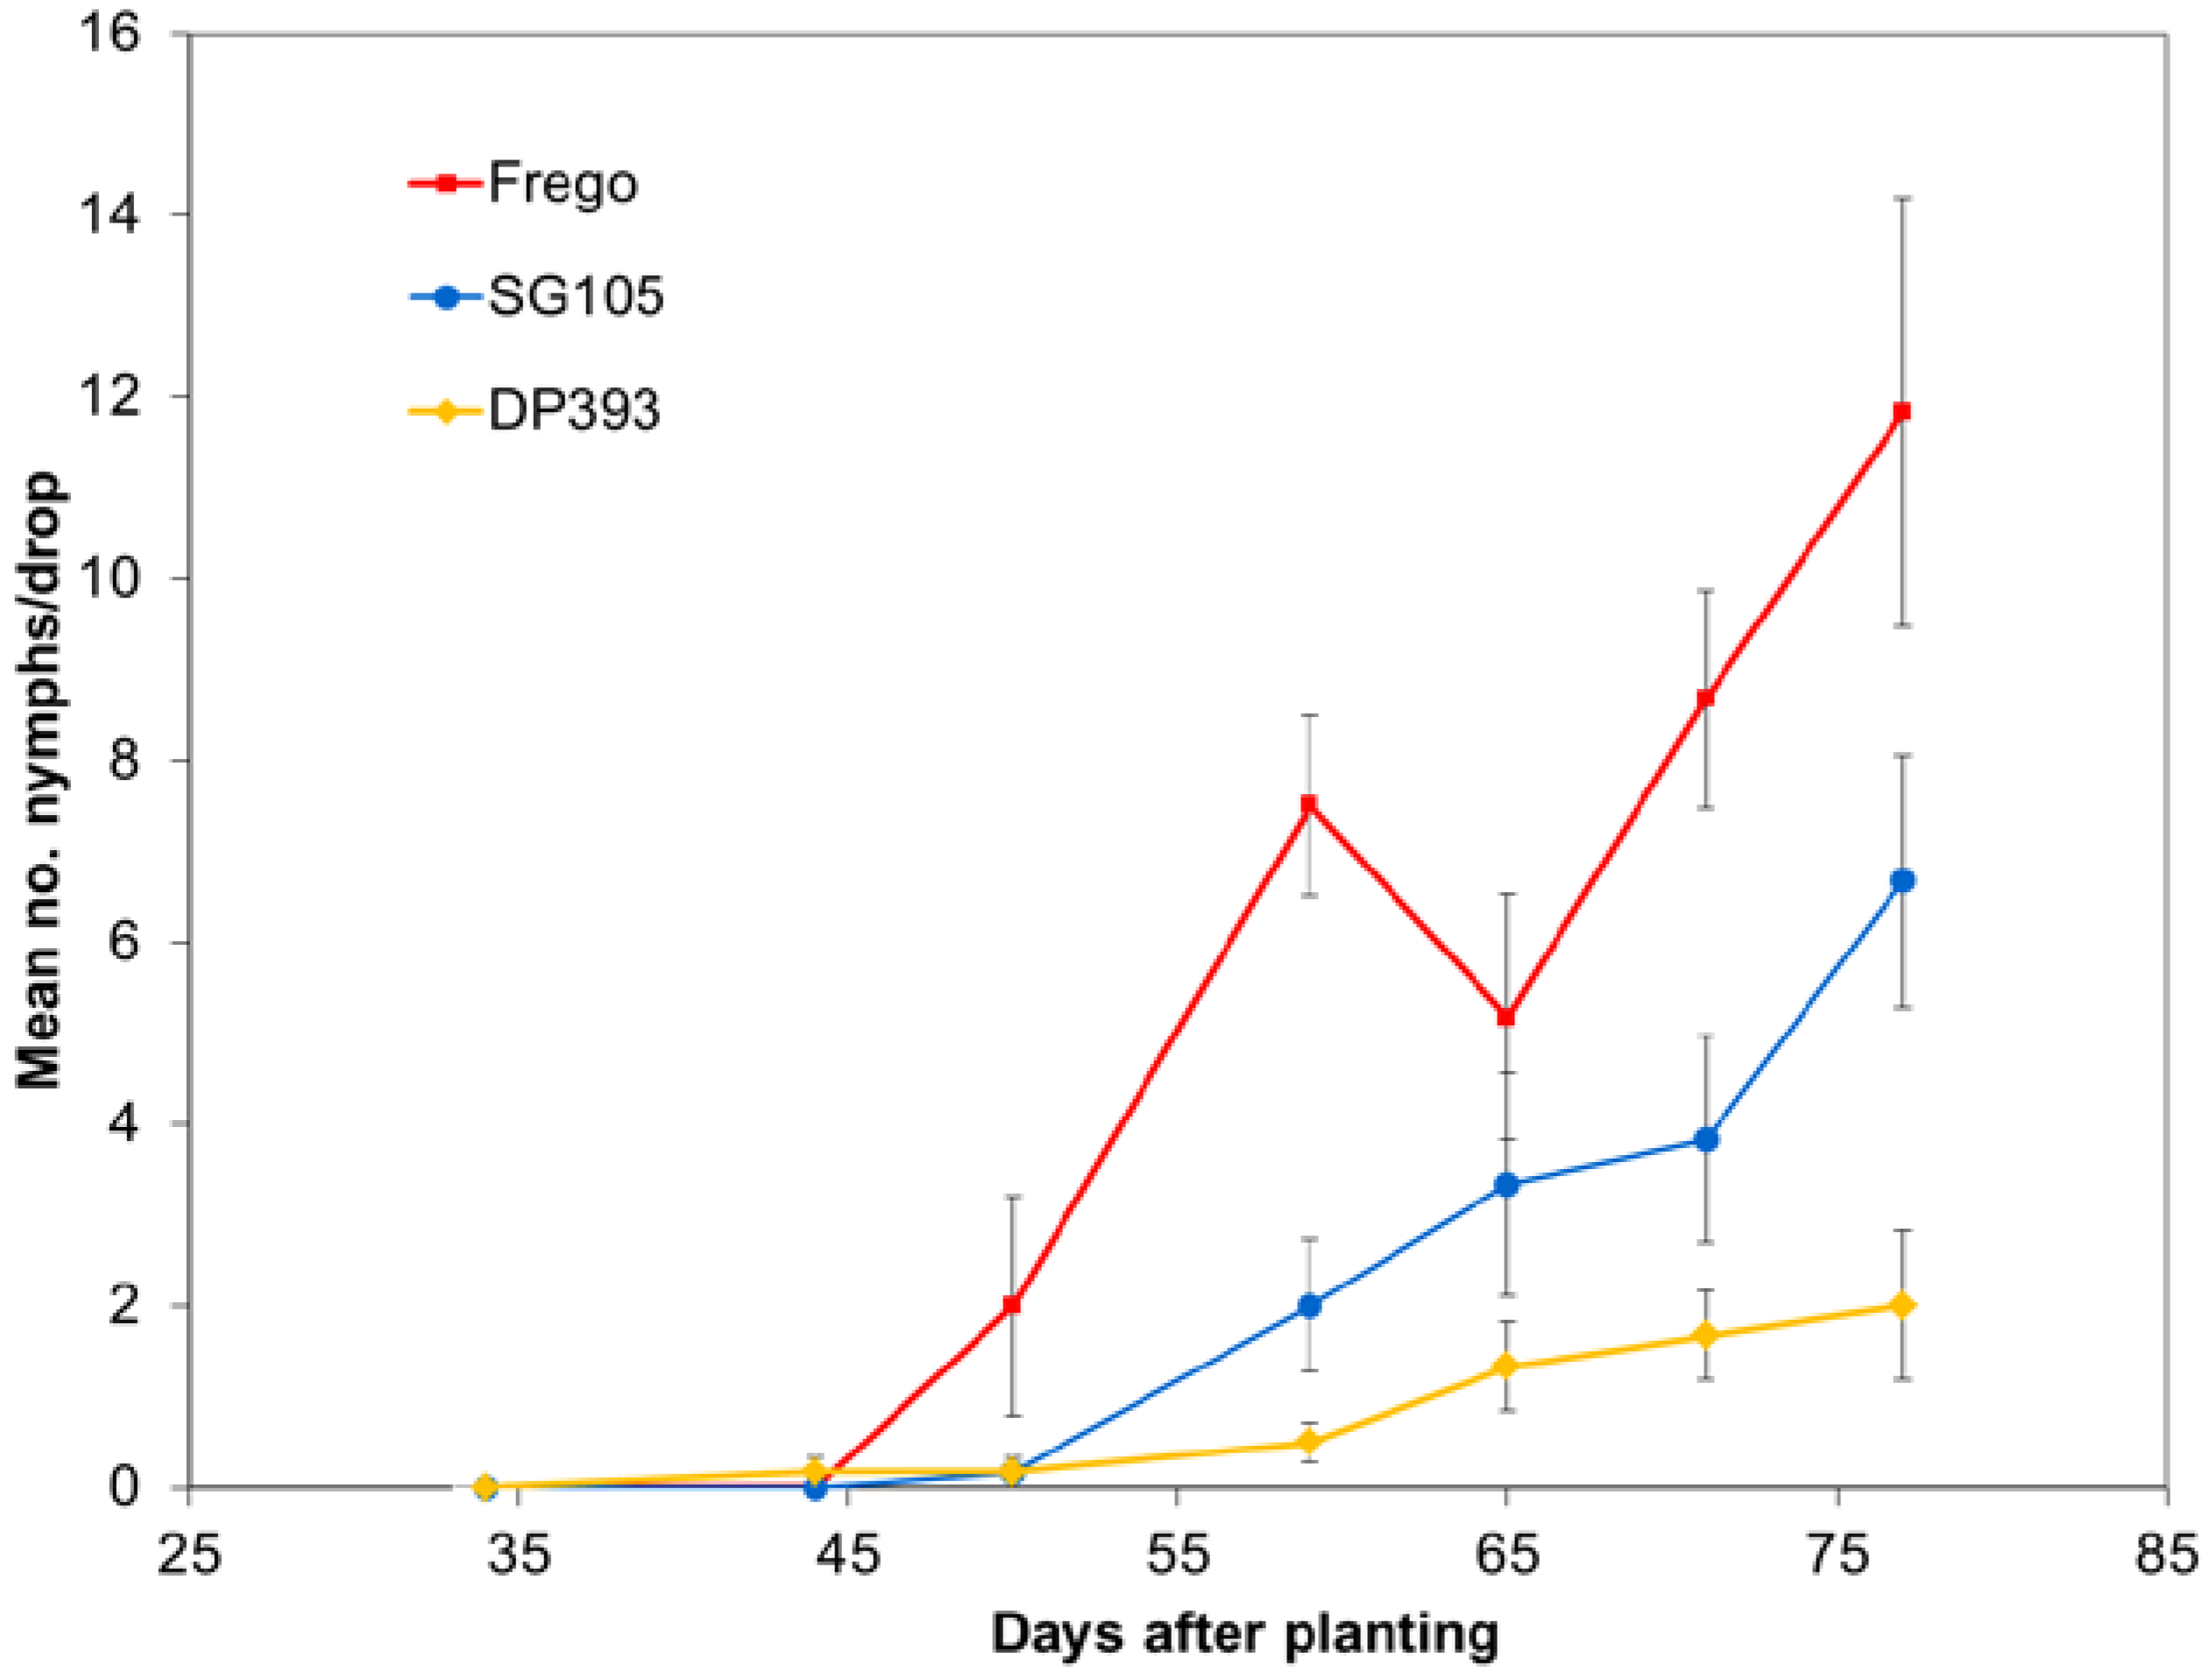
4.4. Plant Bug Monitoring
Each year population densities were monitored using weekly drop cloth sampling. Numbers of nymphs and adults were recorded. Rows 24 and 25 in the center tier of unsprayed max-plots were used for sampling. Variation in average number of collected insects was analyzed separately for each insect sampling date using ANOVA with Student-Newman-Keuls multiple comparison procedure.
4.5. Statistical Design and Analysis Methodology
A logistic regression model [
21] described trends in undamaged WF among the cotton lines, and tested effects on arrangement of cultivars among different plot sizes for different days after planting (DAP). The parameters for the logistic regression model were estimated with the Proc Glimmix procedure in SAS
® [
18]. The following sections describe how the statistical analysis model was built to analyze the WFAI counts from this TPB feeding preferences study.
4.6. Max-Plot Design
The max-plot design consists of a Latin square [
22] design structure with a one-way treatment structure where the three cotton lines (named MaxLine) are assigned to the rows and columns of the Latin square arrangement. The rows of the Latin square are named Max-Rows (MaxRow) and the columns named Max-Columns (MaxCol). The analysis of this part of the design is shown in
Table 5. The Error(Max-Plot) effect can be represented in a Proc Mixed random statement as MaxLine*MaxRow. Actually, it can be represented by any of the two way interactions between MaxLine, MaxRow and MaxCol because of the Latin square design structure and since each main effect is confounded with the interaction between the other two terms.
Table 5.
Analysis of the Max-plot structure.
Table 5.
Analysis of the Max-plot structure.
| Source | DF |
|---|
| MaxRow | 2 |
| MaxCol | 2 |
| MaxLine | 2 |
| Error(Max-Plot) | 2 |
4.7. Sprayer Strip Design
An insecticide was sprayed in strips consisting of the first 8 rows of each of the Max-Columns and the remaining 20 rows of each of the Max–Columns were not sprayed. This pattern of sprays forms split-plots within the Max-Columns and another strip-plot structure along the Max-Rows.
The non-sprayed section of each max-plot was separated into two sub-sections where one was the collection of the non-sprayed mini-plots and the other one comprised the remainder of the max-plot. Thus, the spray condition has three levels, designated as “max_sprayed”, “max_non_sprayed” and “mini_non_sprayed”.
There are 27 observations when the sprayer condition is included in the design. The sprayer treatment can be added to the analysis portion presented in
Table 5 to show a revised analysis as shown in
Table 6. The Error(Spray-Strip) component is computed as the Spray-Strip*MaxCol interaction and the Error(Max-Plot*Spray-Strip) component can be represented in a Proc Glimmix random statement as MaxLine*MaxRow*Spray-Strip which pools Spray-Strip*MaxRow and Spray-Strip*MaxRow*MaxLine components. Again, the Error(Max-Plot*Spray-Strip) can be represented by Spray-Strip interacting with any two of MaxLine, MaxRow or MaxCol effects. But to create the complete statistical model, more parts of this design have to be included.
4.8. Mini-Plot Design
One additional part of the design describes the mini-plots, or the sub-plots with two replications of each mini-line centered within the max-lines assigned to each of the max-plots (
Figure 8). The analysis in
Table 6 is then augmented to include the split-plot part of the mini-plots as shown in
Table 7. Measurements were made on three rows in the sprayed area and three rows in the non-sprayed area as well as on the 8 mini-plots. The 8 mini-plots consist of 4 replications (or mini-plots) of the max-line (the cultivar line assigned to the max-plot) and 2 replications each of the two lines not assigned to the max-plot. Thus, to this point, there are 14 observations per max-plot for a total of 14 × 9 = 126 observations. The mini-lines are only in the unsprayed condition, so there is no interaction for evaluating the mini-line by spray interaction.
Table 6.
Analysis of the Max-plot and Spray-Strip structures.
Table 6.
Analysis of the Max-plot and Spray-Strip structures.
| Source | DF |
|---|
| MaxRow | 2 |
| MaxCol | 2 |
| MaxLine | 2 |
| Error(Max-Plot) | 2 |
| Spray-Strip | 2 |
| Error(Spray-Strip) = Spray-Strip*MaxCol | 4 |
| Spray-Strip*MaxLine | 4 |
| Error(Max-Plot*Spray-Strip) | 8 |
Table 7.
Analysis of the Max-plot, Spray-Strip and Mini-plot structures.
Table 7.
Analysis of the Max-plot, Spray-Strip and Mini-plot structures.
| Source | DF |
|---|
| MaxRow | 2 |
| MaxCol | 2 |
| MaxLine | 2 |
| Error(Max-Plot) | 2 |
| Spray | 2 |
| Error(Spray) = Spray*MaxCol | 4 |
| Spray*MaxLine | 4 |
| Error(Max-Plot*Spray) | 8 |
| MiniLine | 2 |
| MiniLine*MaxLine | 4 |
| Error(Max-Plot*Mini-Plot) | 89 |
The Error(Max-Plot*Mini-Plot) consists of the variation of the replications of the mini- and max-treatments within each max-plot. There are three observations from the sprayed sub-section providing 2 degrees of freedom (DF), three observations from the unsprayed max-line section providing 2 degrees of freedom, 4 observations from the MaxLine in the mini-plots sub-section providing 3 degrees of freedom and 2 observations each from the MiniLines separated from the MaxLine to provide 1 degree of freedom each, to total 2 + 2 + 3 + 1 + 1 = 9 degrees of freedom from each max-plot. The additional source of variability comes from the interaction of the MiniLines with the MaxRows and MaxCols providing 9 degrees of freedom. Thus, there are 89 degrees of freedom for Error(Max-Plot intersecting with Mini-Plot). This effect can be represented in Proc Glimmix code as “yrow(MaxRow MaxCol MiniLine)” where “yrow” is a code denoting the number of crop rows within each of the Max-Plots for each of the above conditions; that is, sprayed MaxLine, unsprayed MaxLine, and unsprayed MiniLine. Under the unsprayed condition, one of the MiniLines is the same as the MaxLine while the other two of the MiniLines are not identical to the MaxLine.
4.9. Days after Planting (DAP) Part of the Design
Cotton rows in the mini- and max-plots (including sprayed rows) were measured for damaged white flower counts (up to 10 white flowers per plot type) daily between 62 and 89 DAP. So, DAP is a repeated measure on each of the plots and there is just one more error term plus all of the interactions of the treatment effects with DAP. The resulting analysis of variance is presented in
Table 8.
Table 8.
Analysis of the Max-plot, Spray-Strip, Mini-plot and Days after Planting structures.
Table 8.
Analysis of the Max-plot, Spray-Strip, Mini-plot and Days after Planting structures.
| Source | DF |
|---|
| MaxRow | 2 |
| MaxCol | 2 |
| MaxLine | 2 |
| Error(Max-Plot) | 2 |
| Spray-Strip | 2 |
| Error(Spray-Strip) = Spray-Strip *MaxCol | 4 |
| Spray-Strip *MaxLine | 4 |
| Error(Max-Plot* Spray-Strip) | 8 |
| MiniLine | 2 |
| MiniLine*MaxLine | 4 |
| Error(Max-Plot*Mini-Plot) | 89 |
| DAP | 16 |
| MaxLine*DAP | 32 |
| Spray-Strip *DAP | 32 |
| Spray-Strip *MaxLine*DAP | 64 |
| MiniLine*DAP | 32 |
| MiniLine*MaxLine*DAP | 64 |
| Error(Day) | 1696 |
The Error(Day) term comes from the interaction of DAP with each of the rows within a Max-Plot across the Max-Plots and can be computed as DAP*yrow(MaxRow MaxCol MiniLine). This error term expression enables the evaluation of the possibility of correlation among the repeated measures. The Proc Glimmix statement used to estimate the auto-correlation among these equally spaced time points is:
See the documentation for the Proc Glimmix statement for additional information on the syntax of this statement in SAS
®.
4.10. Building the Model
The response variable is binomial (number of damaged flowers out of 10 examined at random), so the binomial distribution is needed to describe this data. The process for analyzing categorical data is to reduce the model to just those effects that are significant, thus the above model (as described in
Table 8) is reduced before the treatment effects are evaluated. All terms of a significant interaction are retained in the model and these interaction effects are the ones used for comparing the treatment effects.
4.11. Fitting the Model
Table 9 and
Table 10 present the listing of the expected mean squares for the design. (See the Appendices for partial listing of Proc Glimmix code.) The statistical analysis for the 2009 experiment was highly similar to that accomplished for the 2008 experiment, and the expected mean squares for that year are not described for brevity.
Table 9.
Type 1 analysis of variance listing degrees of freedom and describing expected mean squares (EMS) for the 2008 experiment.
Table 9.
Type 1 analysis of variance listing degrees of freedom and describing expected mean squares (EMS) for the 2008 experiment.
| Source | df | Expected Mean Squares (EMS) † |
|---|
| MaxLine | 2 | σ2 + k92σ2(y(mxr*mxl*m)) + k93σ2(mxr*mxc*s) + k94σ2(mxc*s) + k95σ2(mxr*mxl) + k96σ2(mxc) + k97σ2(mxr) + Q(MaxLine,Spray,MaxLine*Spray,MiniLine,MaxLine*MiniLine,DAP,MaxLine*DAP,Spray*DAP,MaxLine*Spray*DAP,MiniLine*DAP,MaxLine*MiniLine*DAP) |
| Spray | 2 | σ2 + k76σ2(y(mxr*mxl*m)) + k77σ2(mxr*mxc*s) + k78σ2(mxc*s) + k79σ2(mxr*mxl) + k90σ2(mxc) +k91σ2(mxr) + Q(Spray,MaxLine*Spray, MiniLine,MaxLine*MiniLine, DAP,MaxLine*DAP,Spray*DAP, MaxLine*Spray*DAP, MiniLine*DAP, MaxLine*MiniLine*DAP) |
| MaxLine*Spray | 4 | σ2 + k70σ2(y(mxr*mxl*m)) + k71σ2(mxr*mxc*s) + k72σ2(mxc*s) + k73σ2(mxr*mxl) + k74σ2(mxc) + k75σ2(mxr) + Q(MaxLine*spray, MiniLine, maxLine*MiniLine, DAP, MaxLine*DAP, Spray*DAP, MaxLine*Spray*DAP, MiniLine*DAP, MaxLine*MiniLine*DAP) |
| MiniLine | 2 | σ2 + k64σ2(y(mxr*mxl*m)) + k65σ2(mxr*mxc*s) + k66σ2(mxc*s) + k67σ2(mxr*mxl) + k68σ2(mxc) + k69σ2(mxr) + Q(MiniLine, MaxLine*MiniLine, DAP, MaxLine*DAP,Spray*DAP, MaxLine*Spray*DAP, MiniLine*DAP, MaxLine*MiniLine*DAP) |
| MaxLine*MiniLine | 4 | σ2 + k58σ2(y(mxr*mxl*m)) + k59σ2(mxr*mxc*s) + k60σ2(mxc*s)) + k61σ2(mxr*mxl)+ k62σ2(mxc)) + k63σ2(mxr) + Q(MaxLine*MiniLine, DAP, MaxLine*DAP, Spray*DAP, MaxLine*Spray*DAP, MiniLine*DAP, MaxLine*MiniLine*DAP) |
| DAP | 16 | σ2 + k52σ2(y(mxr*mxl*m)) + k53σ2(mxr*mxc*s) + k54σ2(mxc*s) + k55σ2(mxr*mxl) + k56σ2(mxc) + k57σ2(mxr) + Q(DAP,MaxLine*DAP,Spray*DAP,MaxLine*Spray*DAP,MiniLine*DAP,MaxLine*MiniLine*DAP) |
| MaxLine*DAP | 32 | σ2 + k46σ2(y(mxr*mxl*m)) + k47σ2(mxr*mxc*s) + k48σ2(mxc*s) + k49σ2(mxr*mxl) + k50σ2(mxc) + k51σ2(mxr) + Q(MaxLine*DAP,Spray*DAP,MaxLine*Spray*DAP,MiniLine*DAP,MaxLine*MiniLine*DAP) |
| Spray*DAP | 32 | σ2 + k40σ2(y(mxr*mxl*m)) + k41σ2(mxr*mxc*s) +k42σ2(mxc*s)) + k43σ2(mxr*mxl) + k44σ2(mxc) + k45σ2(mxr) + Q(Spray*DAP,MaxLine*Spray*DAP,MiniLine*DAP,MaxLine*MiniLine*DAP) |
| MaxLine*Spray*DAP | 64 | σ2 + k34σ2(y(mxr*mxl*m)) + k35σ2(mxr*mxc*s) + k36σ2(mxc*s) + k37σ2(mxr*mxl) + k38σ2(mxc) + k39σ2(mxr) + Q(MaxLine*Spray*DAP,MiniLine*DAP,MaxLine*MiniLine*DAP) |
| MiniLine*DAP | 32 | σ2 + k28σ2(y(mxr*mxl*m)) + k29σ2(mxr*mxc*s) + k30σ2(mxc*s)) + k31σ2(mxr*mxl) + k32σ2(mxc) + k33σ2(mxr) + Q(MiniLine*DAP,MaxLine*MiniLine*DAP) |
| MaxLine*MiniLine*DAP | 64 | σ2 + k22σ2(y(mxr*mxl*m)) + k23σ2(mxr*mxc*s) + k24σ2(mxc*s) + k25σ2(mxr*mxl) + k26σ2(mxc) + k27σ2(mxr) + Q(MaxLine*MiniLine*DAP) |
| MaxRow | 2 | σ2 + k16σ2(y(mxr*mxl*m)) + k17σ2(mxr*mxc*s) + k18σ2(mxc*s) + k19σ2(mxr*mxl) + k20σ2(mxc) + k21σ2(mxr) |
| MaxCol | 2 | σ2 + k11σ2(y(mxr*mxl*m)) + k12σ2(mxr*mxc*s) + k13σ2σ2(mxc*s) + k14σ2(mxr*mxl) + k15σ2(mxc) |
| MaxRow*MaxLine | 2 | σ2 + k7σ2(y(mxr*mxl*m)) + k8σ2(mxr*mxc*s) + k9σ2(mxc*s) + k10σ2(mxr*mxl) |
| MaxCol*Spray | 4 | σ2 + k4σ2(y(mxr*mxl*m)) + k5σ2(mxr*mxc*s) + k6σ2(mxc*s) |
| MaxRow*MaxCol*Spray | 8 | σ2 + k2σ2y(mxr*mxl*m) + k3σ2(mxr*mxc*s) |
| yrow(MaxR*MaxL*MiniL) | 89 | σ2 + k1σ2y(mxr*mxl*m) |
Table 10.
Analysis of variance table for sums of squares and expected mean squares to accompany
Table 9.
Table 10.
Analysis of variance table for sums of squares and expected mean squares to accompany Table 9.
| Source | DF | Sum of Squares | Mean Square |
|---|
| MaxLine | 2 | 1.224409 | 0.612205 |
| Spray | 2 | 1.941194 | 0.970597 |
| MaxLine*Spray | 4 | 0.804896 | 0.201224 |
| MiniLine | 2 | 5.199635 | 2.599817 |
| MaxLine*MiniLine | 4 | 0.058314 | 0.014578 |
| DAP | 16 | 1.601946 | 0.100122 |
| MaxLine*DAP | 32 | 0.558275 | 0.017446 |
| Spray*DAP | 32 | 0.793727 | 0.024804 |
| MaxLine*Spray*DAP | 64 | 0.795100 | 0.012423 |
| MiniLine*DAP | 32 | 1.635895 | 0.051122 |
| MaxLine*MiniLine *DAP | 64 | 1.185991 | 0.018531 |
| MaxRow | 2 | 0.045929 | 0.022964 |
| MaxCol | 2 | 0.013550 | 0.006775 |
| MaxRow*MaxLine | 2 | 0.045241 | 0.022621 |
| MaxCol*Spray | 4 | 0.039992 | 0.009998 |
| MaxRow*MaxCol*Spray | 8 | 0.150683 | 0.018835 |
| yrow(MaxRow*MaxLine*MiniLine) | 89 | 1.751922 | 0.018838 |
| Residual | 1696 | 21.966128 | 0.012952 |


