1. Introduction
Understanding the effect of the process on the internal morphology of polymeric artifacts and its relationship with the final mechanical properties is the key-point for a correct prediction of reliability, performance and durability of a product. The complexity of the internal features, developed in the micro and sub-micro scales during common processing of thermoplastic polymers, requires additional studies on the relationships between morphology and properties. Consistently, characterization tests on micro and sub-micro scales, such as micro and nano indentation, are emerging as new approaches to provide quantitative information about the mechanical properties and morphology of polymeric materials [
1,
2]. The ability to measure properties on the nanometric length-scale is particularly important for objects such as molded parts in which the localized internal structures can have a significant impact on the bulk properties [
3,
4,
5,
6,
7,
8].
Recently, a multiscale mechanical characterization of injection-molded samples was performed by combining dynamic mechanical analysis, micro Indentation, and HarmoniX Atomic Force Microscopy tests [
9,
10]. Those results show that the molded samples present a complex multilayer morphology in which, starting from the sample surface, less organized structures (globules), characterized by mechanical properties similar to the quiescent amorphous phase, coexist with well-organized and oriented structures (fibrils), characterized by a high mechanical modulus. Intermediate behavior was found in the central part of the sample, where well developed spherulitic structures are characterized by a lower level of orientation [
11,
12].
The morphology developed in the molded parts can be highly dependent on imperfect or wrong processing conditions. They can be due to problems related to a combination of poor material characterization, imperfect tooling design, and inadequate control of the processing variables [
13,
14,
15,
16]. Knowing how intentionally created molding defects impact on the final product quality can help to recognize and avoid them in real conditions. Probably, among other parameters, the mold temperature is the most critical parameter to be monitored and controlled [
17,
18]. Despite the extensive studies, a clear correlation between the product properties and the mold temperature is not yet completely established. The situation becomes still more complex when a complete and accurate temperature control is difficult or even impossible. As a matter, non-controlled asymmetrical temperature fields are quite common when geometrical constraints, non-balance (or failure) of the cooling systems, and local overheating are present. In some special cases, high-temperature gradients are imposed by specific production requests such as micro-injection, in-mold labeling and over-molding [
19,
20]. Regardless of the specific reason for the non-uniform temperature, the results may give rise to severe problems such as inhomogeneous filling, low cycle repeatability, warpage, a lack of part performances and poor surface finishing [
21,
22]. The uneven temperature field may produce a sample with strong mechanical unbalancing with the possibility of warpage and the formation of cracks.
Liparoti et al. [
12,
23] reported the effect of induced asymmetrical fast surface temperature evolution on the morphology of injection molded isotactic polypropylene (iPP) samples. They showed a strong effect of two factors on the morphology of the final part: increasing the cavity surface temperature and varying the temperature pulse duration [
24]. Despite the continuous technological interest in this subject, only a few papers have tried to correlate the complex internal morphology produced in these conditions with the local mechanical properties within the molded parts.
The objective of this work is to provide an experimental morphological and mechanical characterization of molded samples obtained in highly asymmetrical mold temperature conditions. The mechanical properties along the sample thickness have been correlated to the mold temperature condition adopted. The correlation among processing conditions, mechanical properties and internal morphology of the moldings are also analyzed and discussed.
2. Materials and Methods
Thin bars of isotactic polypropylene (iPP) with a rectangular section were obtained by injection molding, using a mold cavity that can impose high temperature gradients in a very short time. The iPP adopted for the experiments was supplied by Montell (Ferrara, Italy), now Lyondell Basell Industries. It is a commercial grade (tradename Moplen T30G). Moplen T30G is a general purpose homopolymer for extrusion/molding applications, with a melt flow index of 3.6 (ASTM D1238/L). The molecular weight distribution was determined by a size exclusion chromatography, with weight-average molar mass Mw of 376,000 g·mol−1, polydispersity index Mw/Mn of 6.7, and a meso pentads content 87.6%.
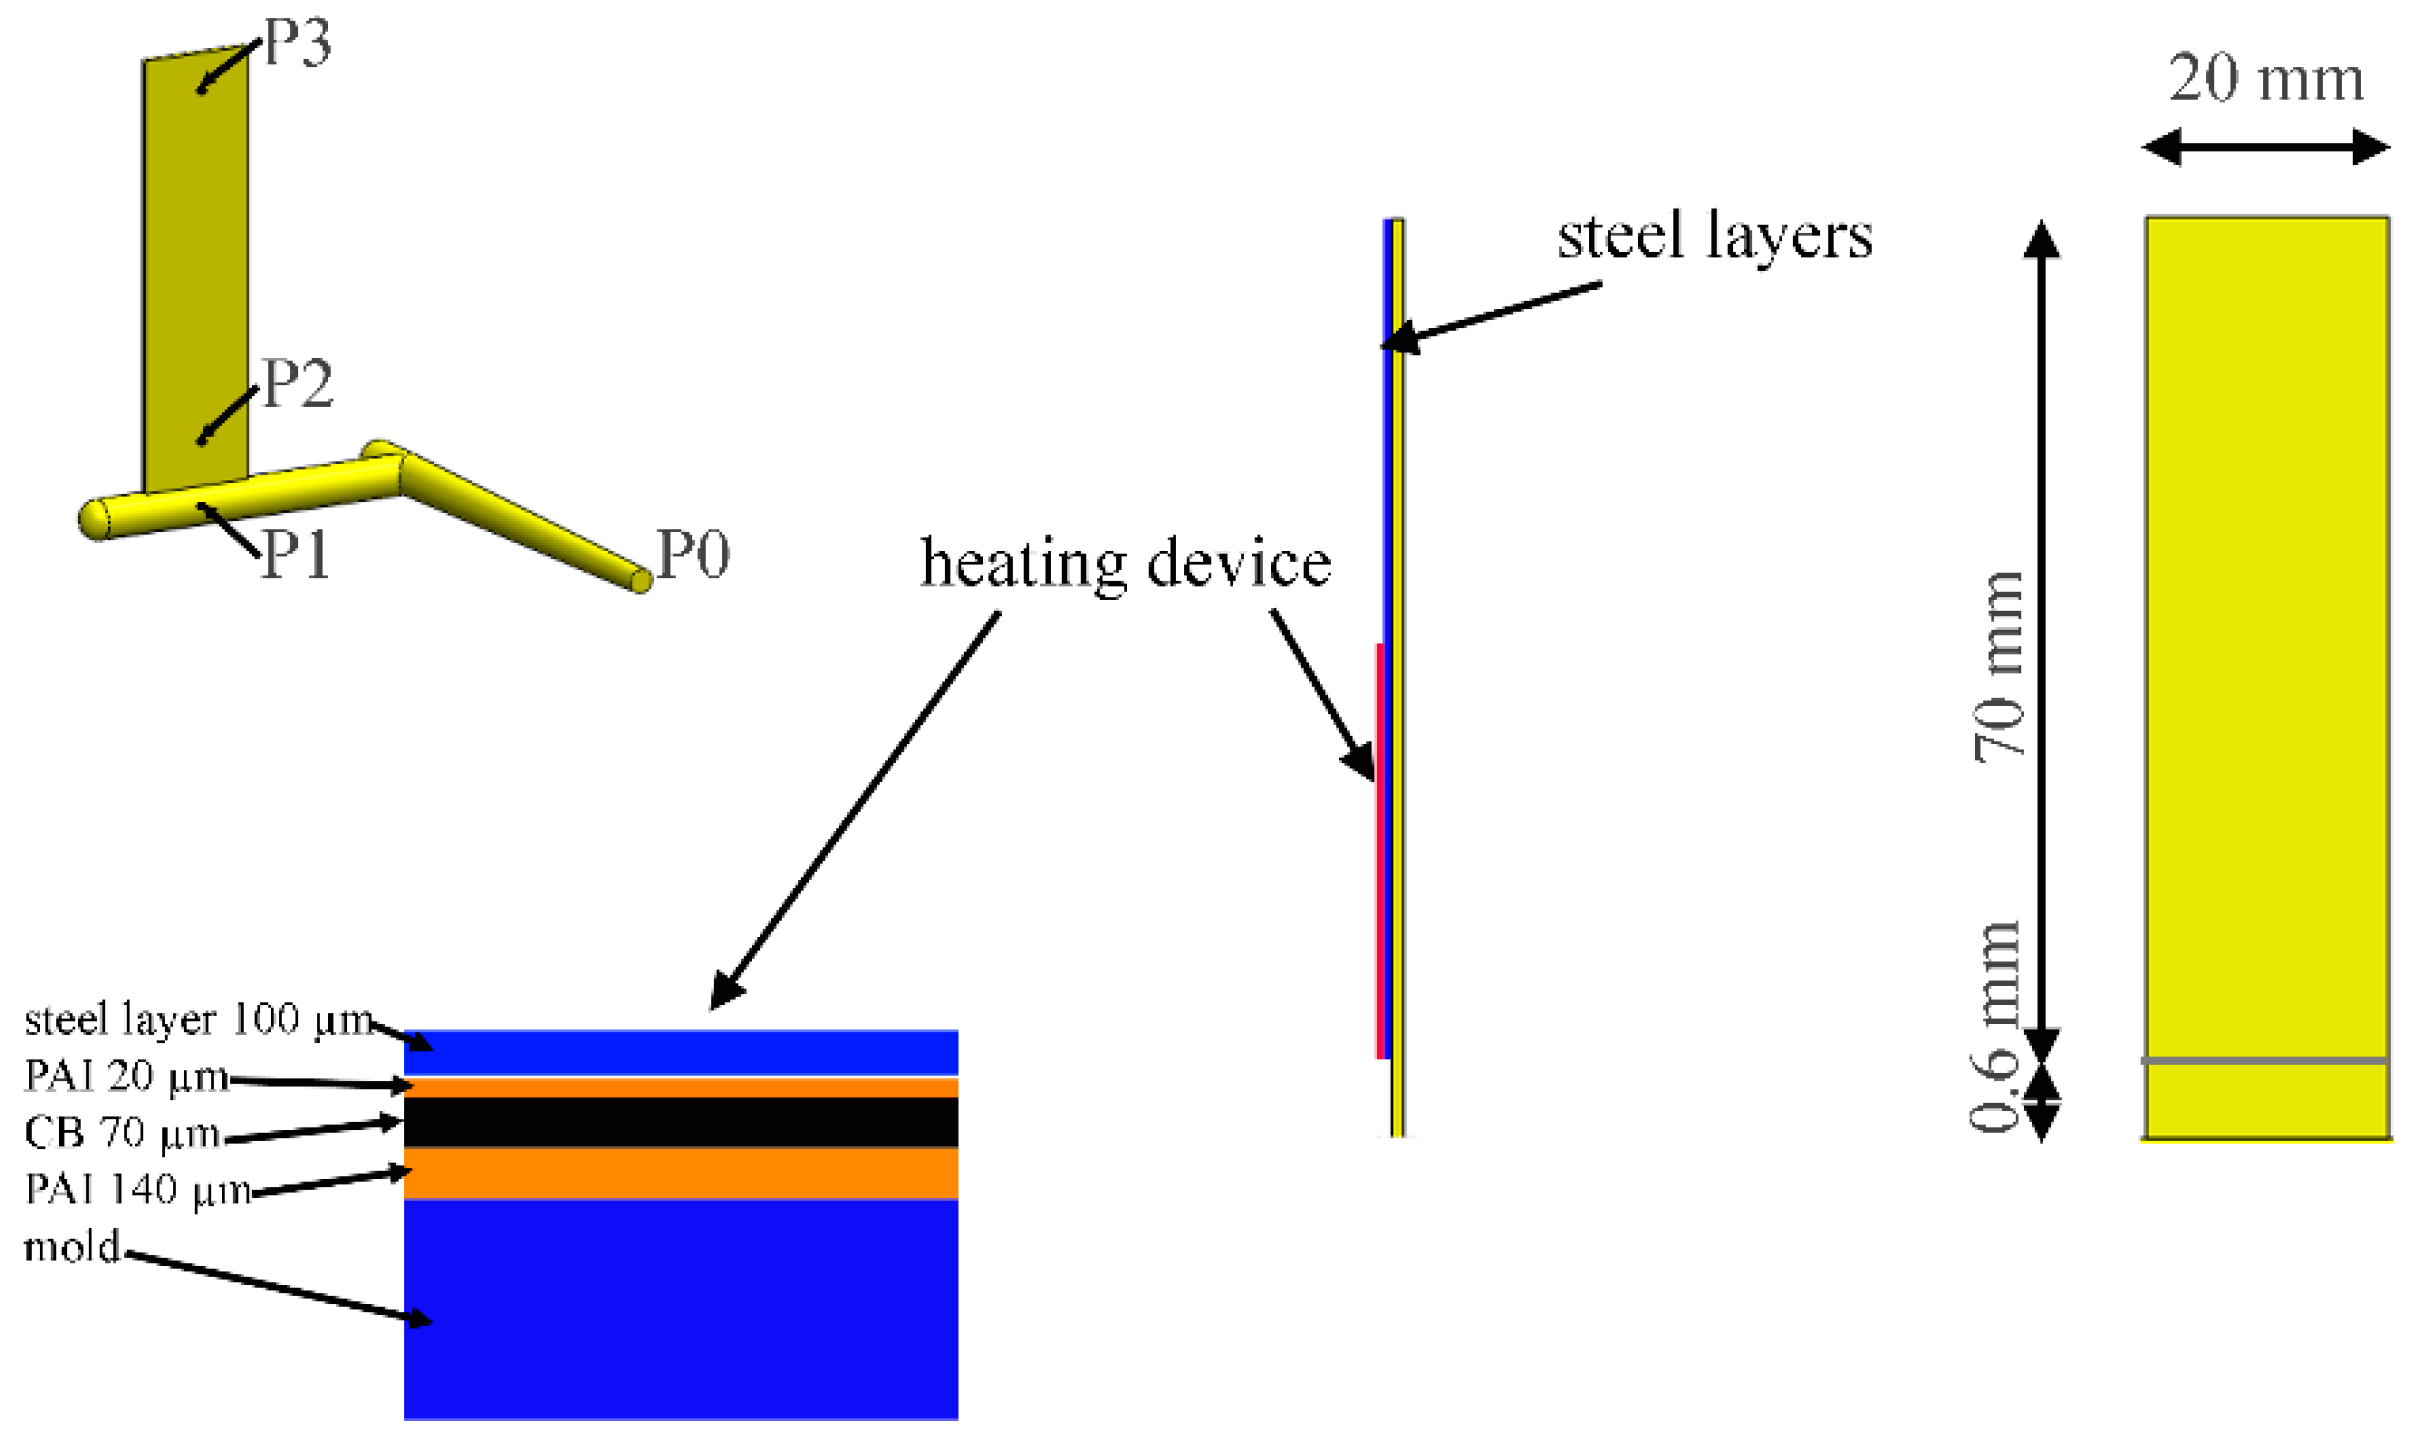
Figure 1 shows the geometry of the samples and the sketch of the heating device. In particular, the mold has a gate 1 mm thickness and a rectangular cavity of length
L = 70 mm, width
W = 20 mm, and thickness
S = 1 mm.
The injection molding tests were carried out with a 70-ton Canbio reciprocating screw, injection-molding machine (Negri-Bossi, Cologno Monzese, Milan, Italy). The experiments were performed with an average volumetric flow rate of 3 cm
3·s
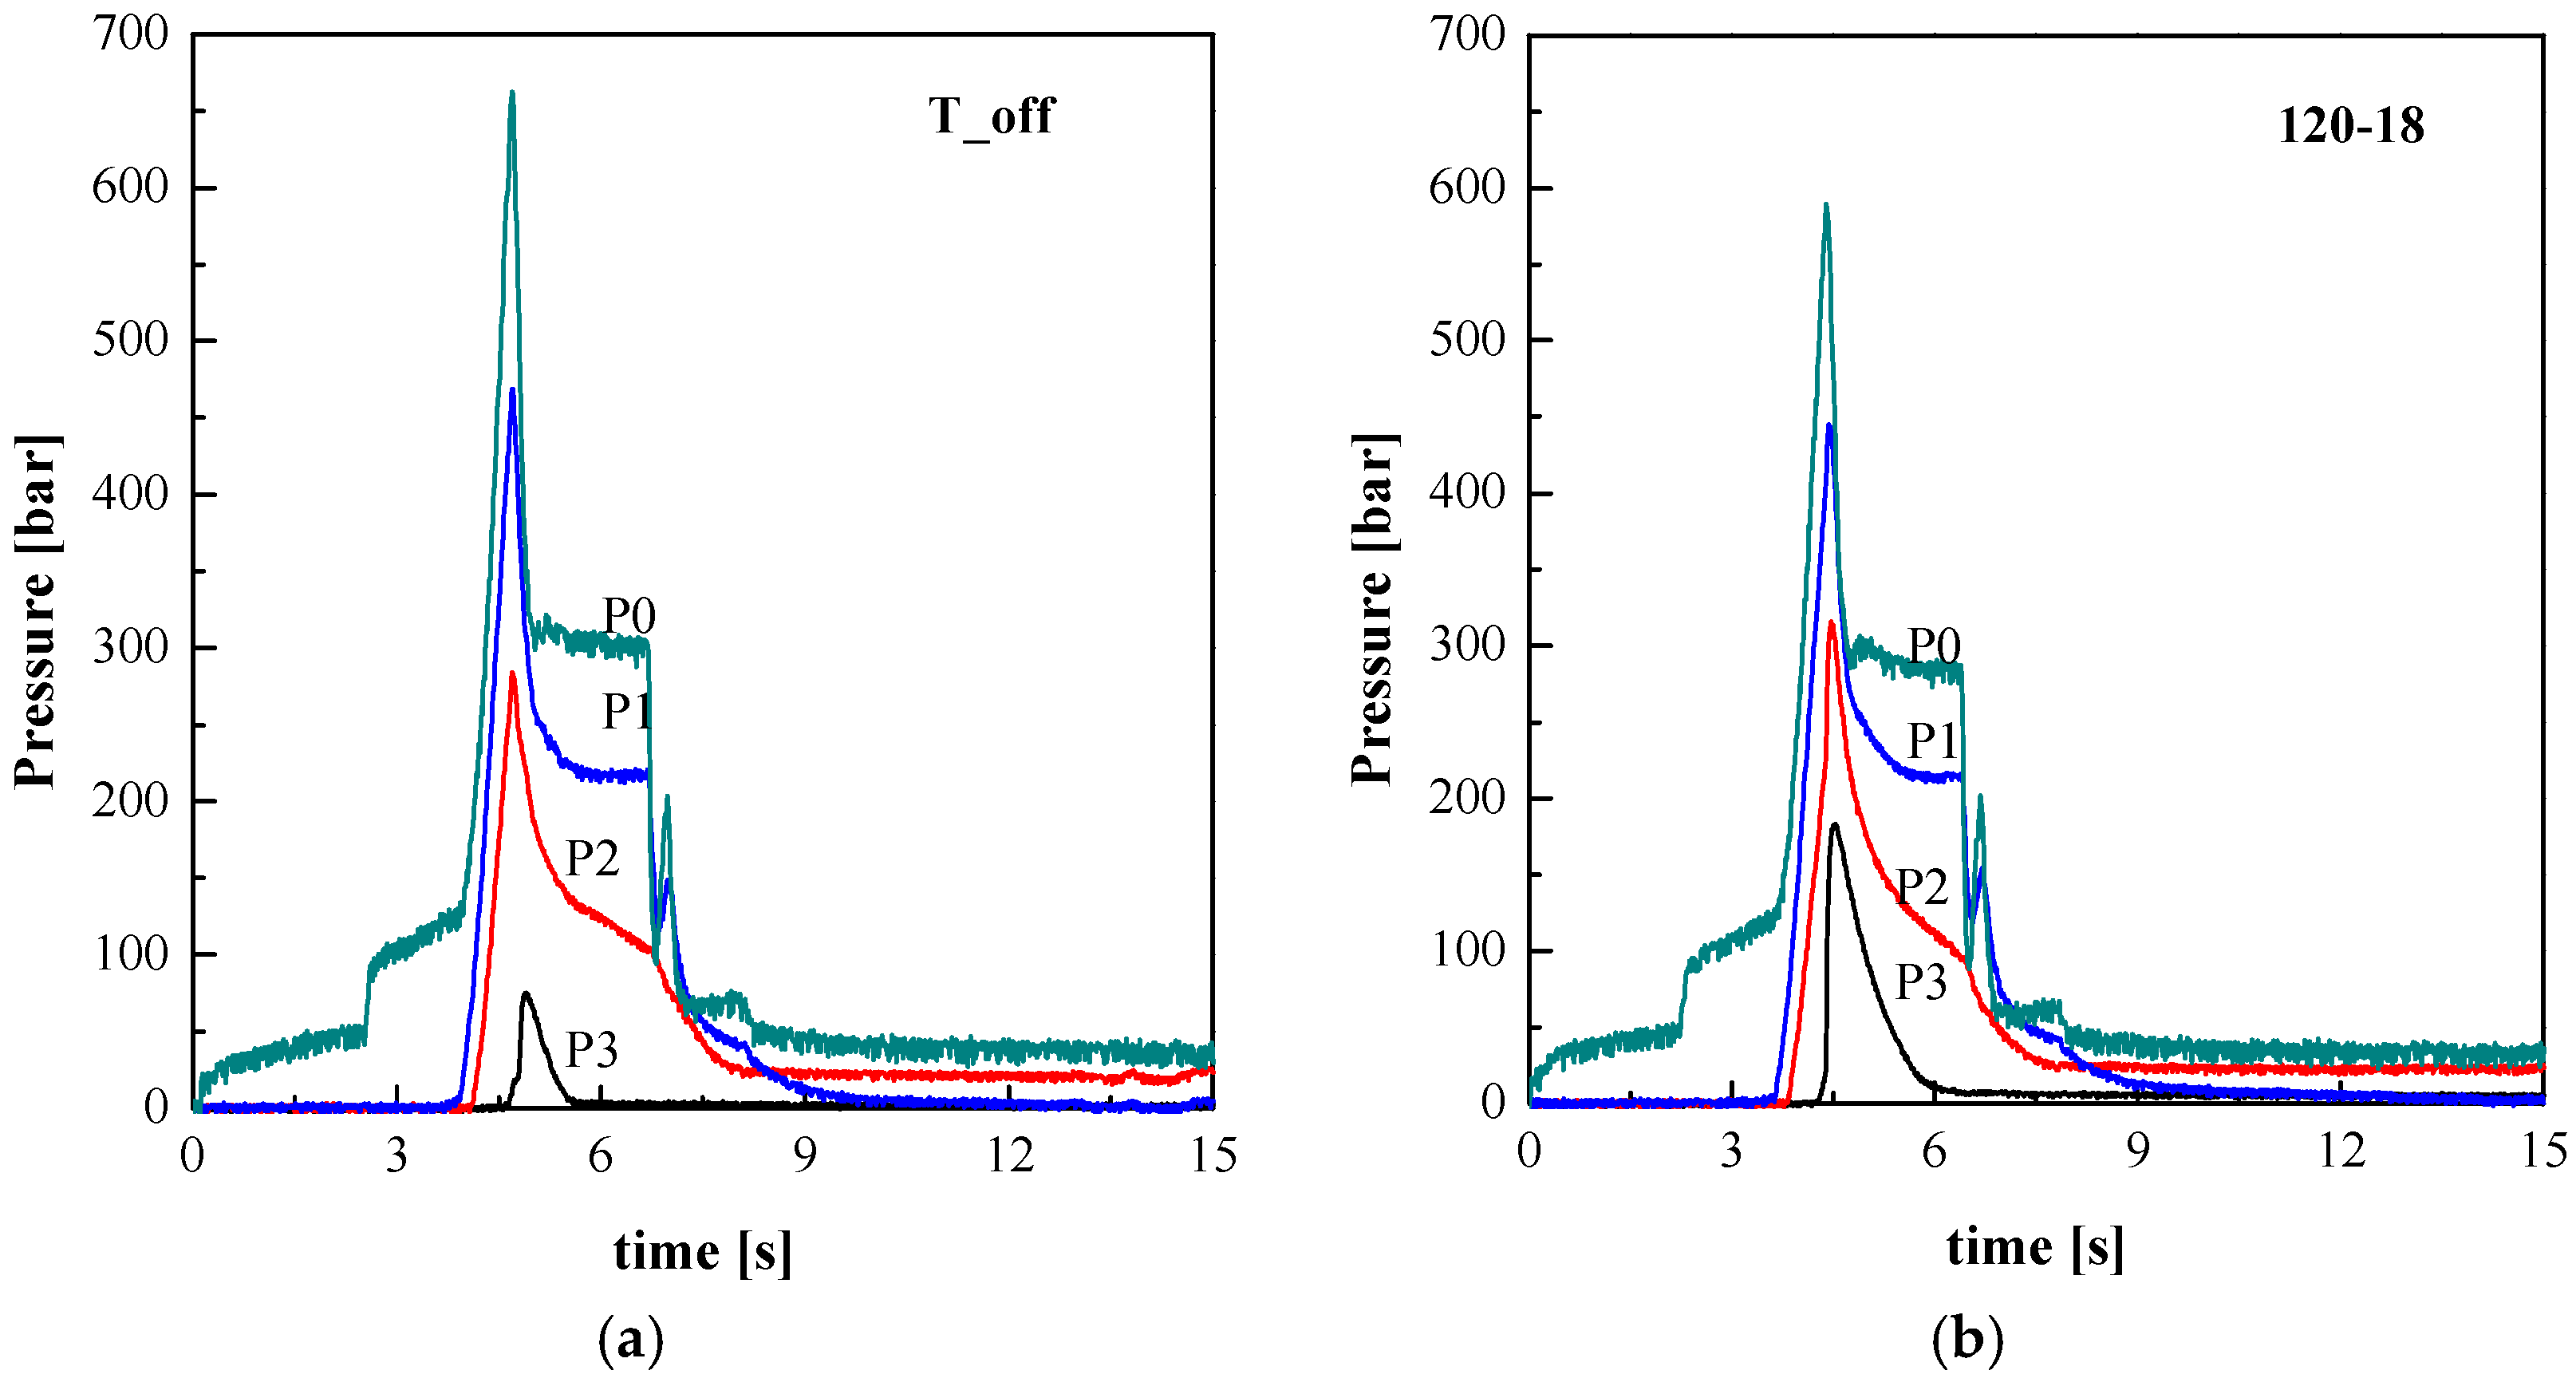
−1 (the cavity filling time was about 0.5 s), a melt injection temperature of 220 °C and a mold temperature of 20 °C. A holding pressure of 300 bar was adopted with a holding time of 2 s. The pressure was measured in four different positions along the flow path by means of piezoelectric pressure transducers. In particular, one transducer is located in the injection chamber, P0, one just before the gate, P1, and two in the cavity, P2 and P3 (20 and 50 mm downstream from the gate). Their locations are indicated in
Figure 1. As also shown in
Figure 1, a thin heater is located below the cavity surface and it is protected by a thin steel layer (100 μm). The thin heater was adopted for quickly and accurately controlling the temperature on one side of the cavity (on the moving plate of the mold). A detailed description of the heating device is reported elsewhere [
25]. The melt temperature in position P2 was measured with a temperature probe located on the protective steel layer.
The molding conditions adopted in the tests considered in this work are summarized in
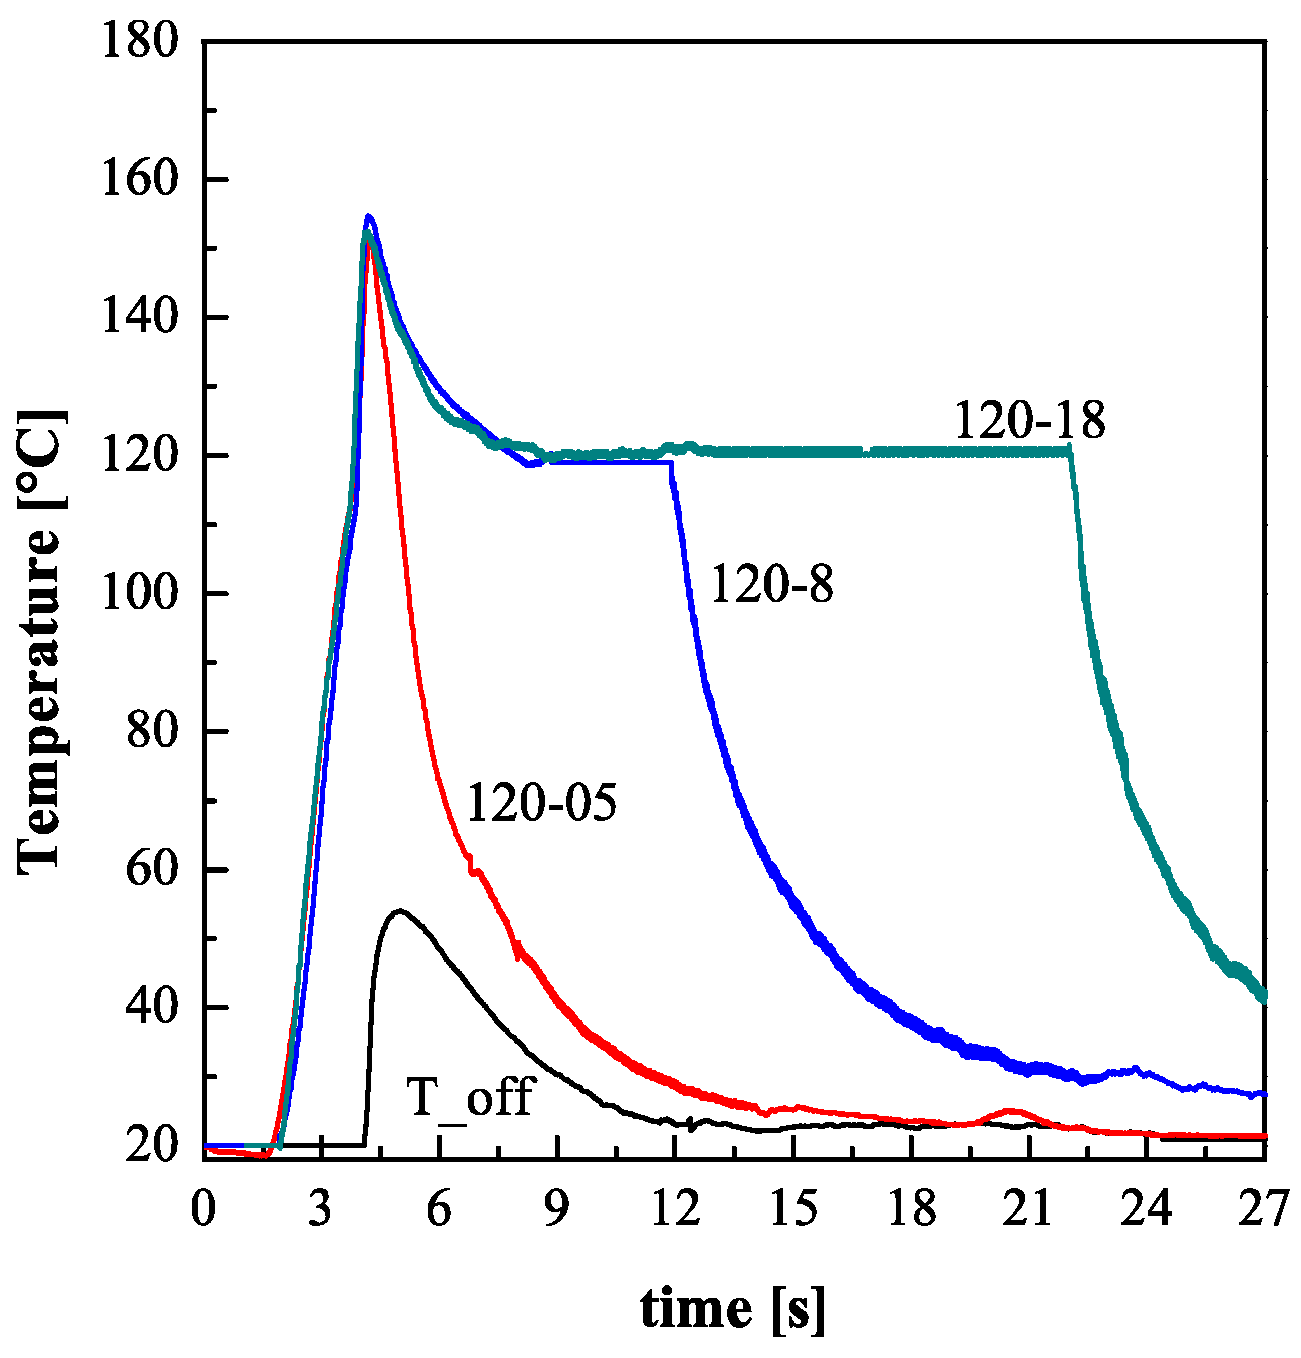
Table 1. During the injection molding tests, the heating device was supplied by a constant electrical power,
Pe. The heating device was activated for two seconds,
ta, before the local contact with the polymer in position P2, where pressure and temperature were measured. After that, the electrical power was supplied for additional heating times,
th, 0.5 s, 8 s and 18 s. The asymptotic temperature,
Tlevel, reached on the cavity surface when the heater is supplied with 7 W/cm
2, for longer heating time, is 120 °C. For comparison, a non-conditioned experiment, T_off, was performed without activating the heater (in this case
Tlevel, is the ejection temperature, 28 °C).
2.1. Sample Preparation
The specimens were cut in position P2 from the cross section of the sample and carefully polished with a predefined procedure [
9]. For the Atomic Force Microscopy (AFM) characterizations, an additional chemical etching procedure was carried out on the specimens in order to eliminate local micro deformation induced by the cutting procedures. In particular, the Basset’s etched procedure [
12,
23,
26] was adopted to prepare selected samples to the AFM analysis. A solution of potassium permanganate, in a mixture of 10:4:1 volumes of concentrated sulphuric acid, orthophosphoric acid and distilled water (1 g of potassium permanganate in 100 mL of mixture), was adopted as etchant. A 2 h period of etching at room temperature was generally sufficient to reveal the surface topography.
2.2. Optical Microscopy Tests
In order to gather information on sample morphology, cross section slices with 0.1 mm thickness were cut from injected samples by means of a Leica slit microtome in position P2. These samples were observed in Polarized Optical Microscopy (POM) with an optical microscope (model Olympus BX41) equipped with a digital camera by using a magnification level of 20X. Micrographs of the slices were taken so that flow direction was rotated of 45° with respect the analyzer direction.
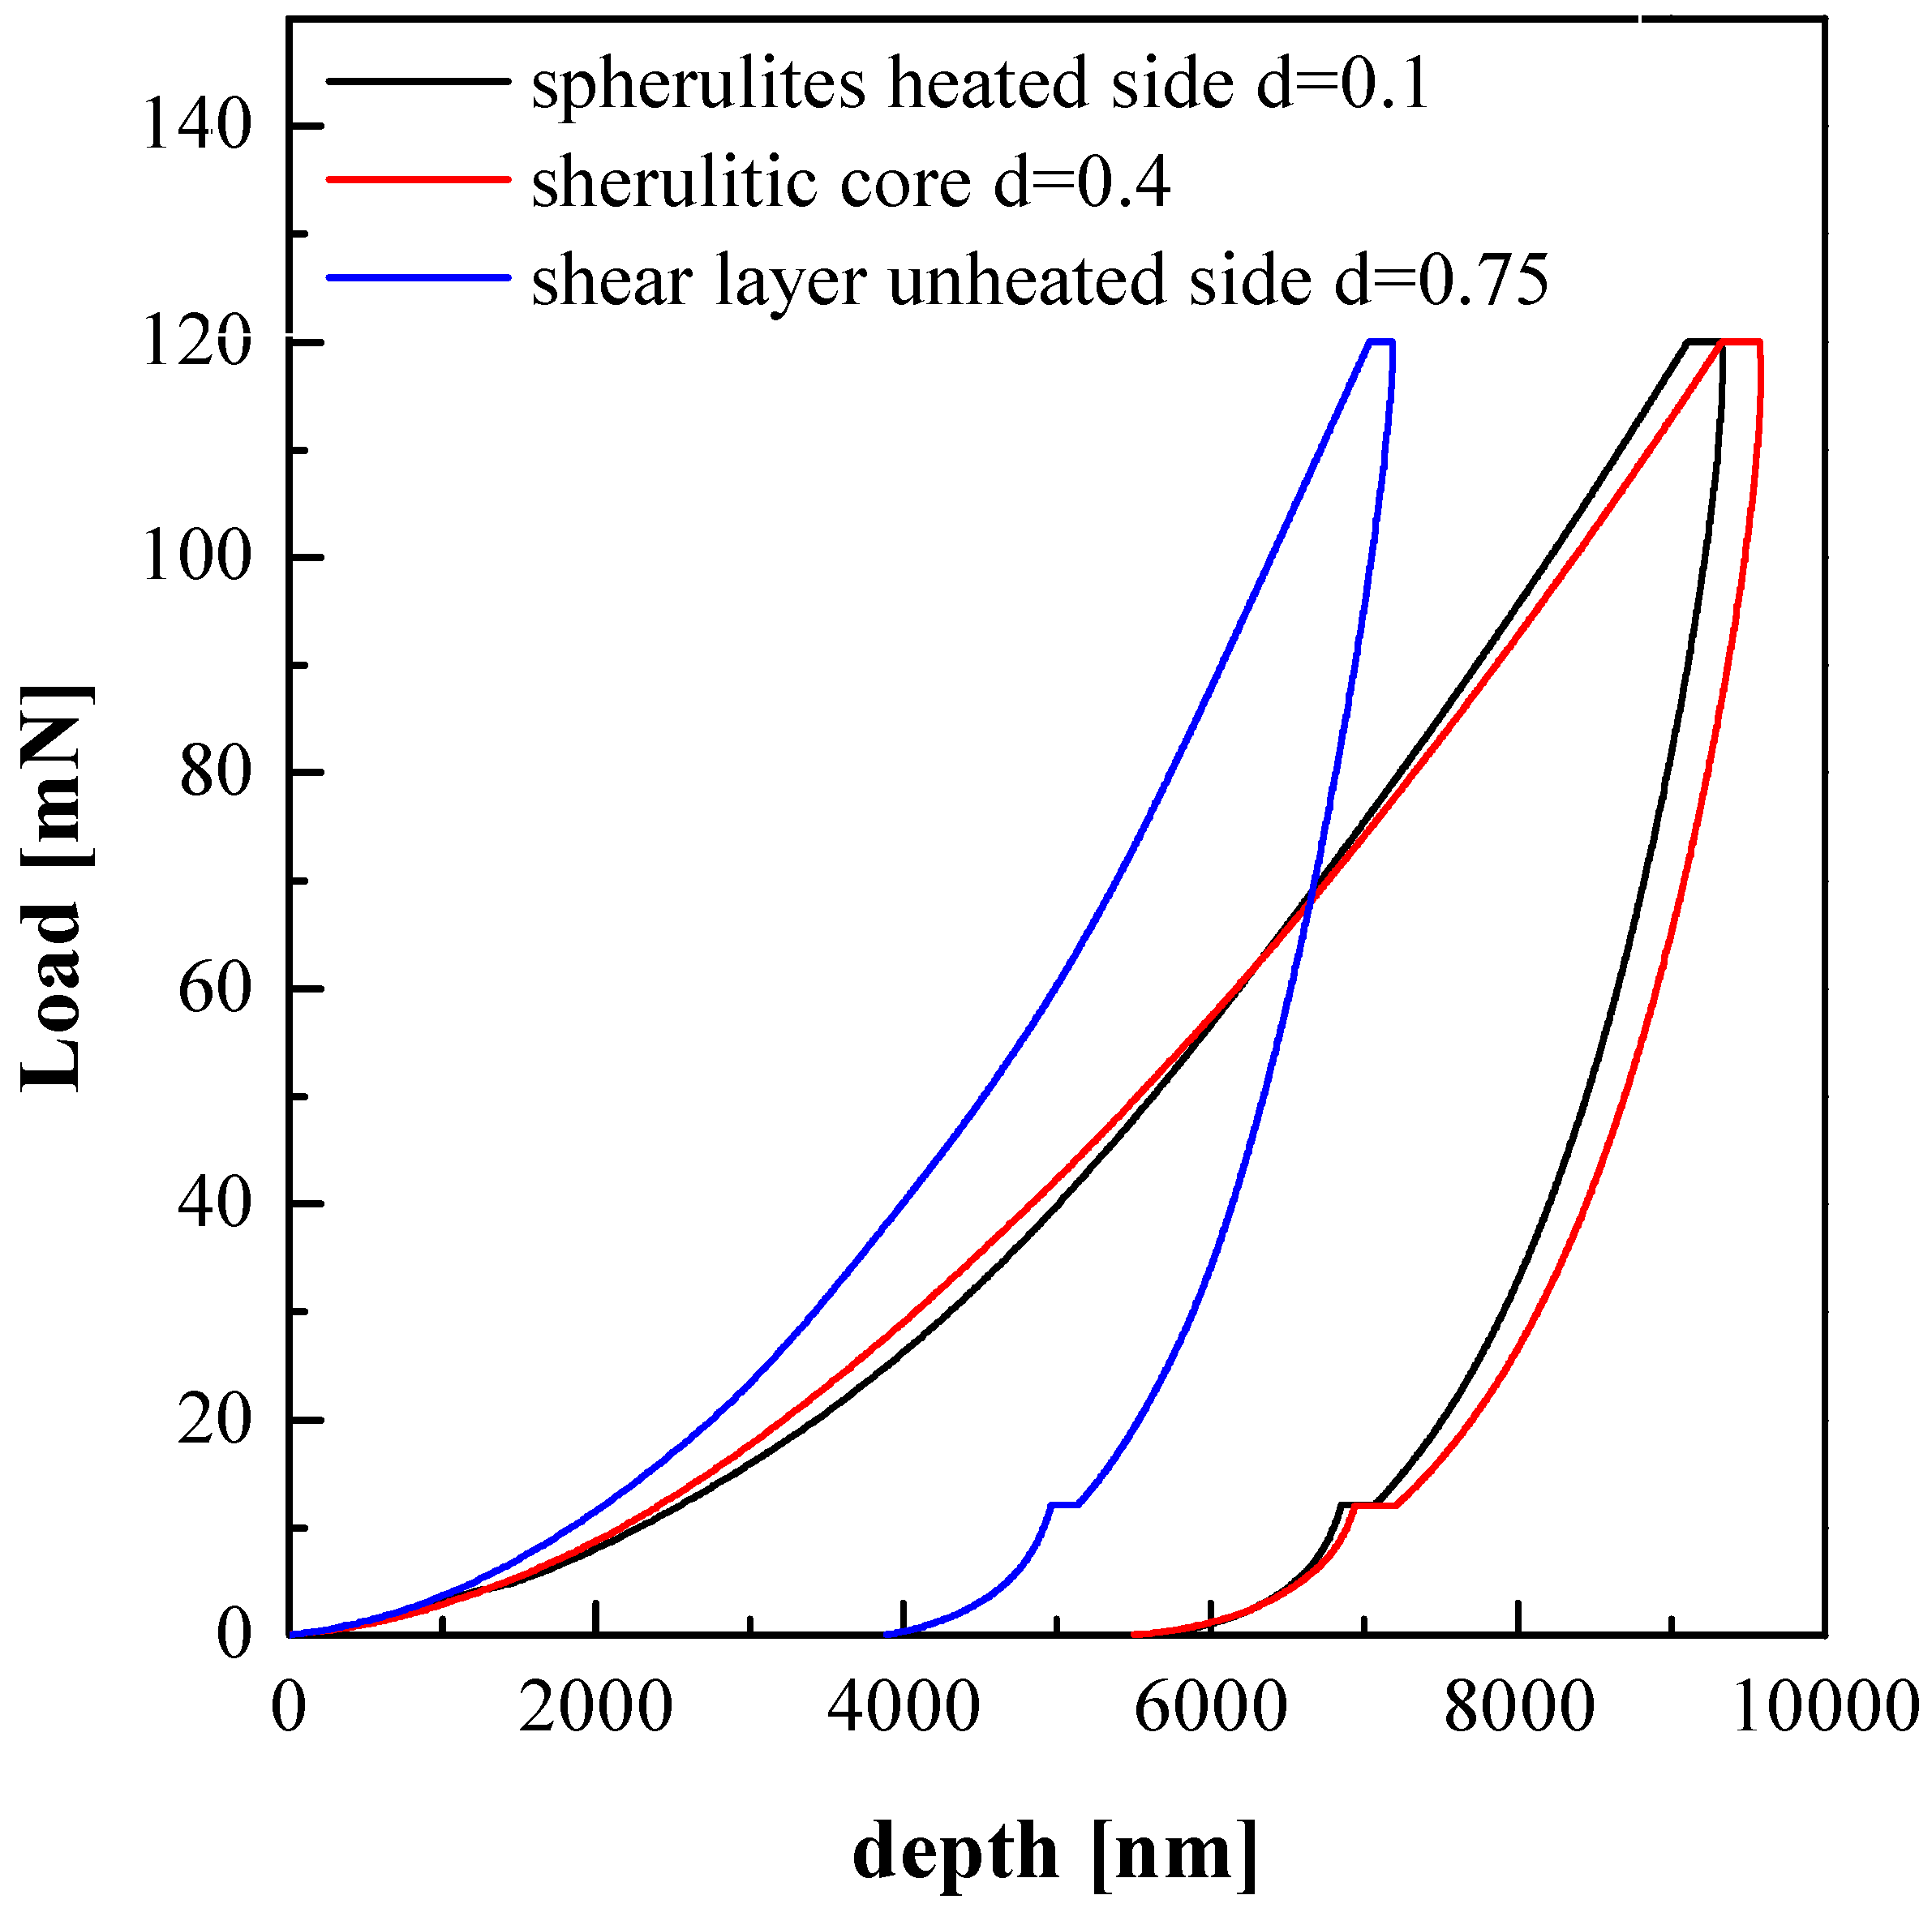
2.3. Indentation Tests
Indentation tests were performed with a Nano Test™ Platform (Micro Materials Ltd., Wrexham, UK). Tests were carried out with an initial load of 0.02 mN, a load rate of 1 mN/s and a maximum load of 120 mN held for 60 s. A three-sided Berkovich pyramidal diamond tip with a radius of about 100 μm was adopted to indent the surface of the sample. Elastic modulus were evaluated from each imprint, directly by Nano Test™ Platform software 4, according to the Oliver and Pharr method [
27].
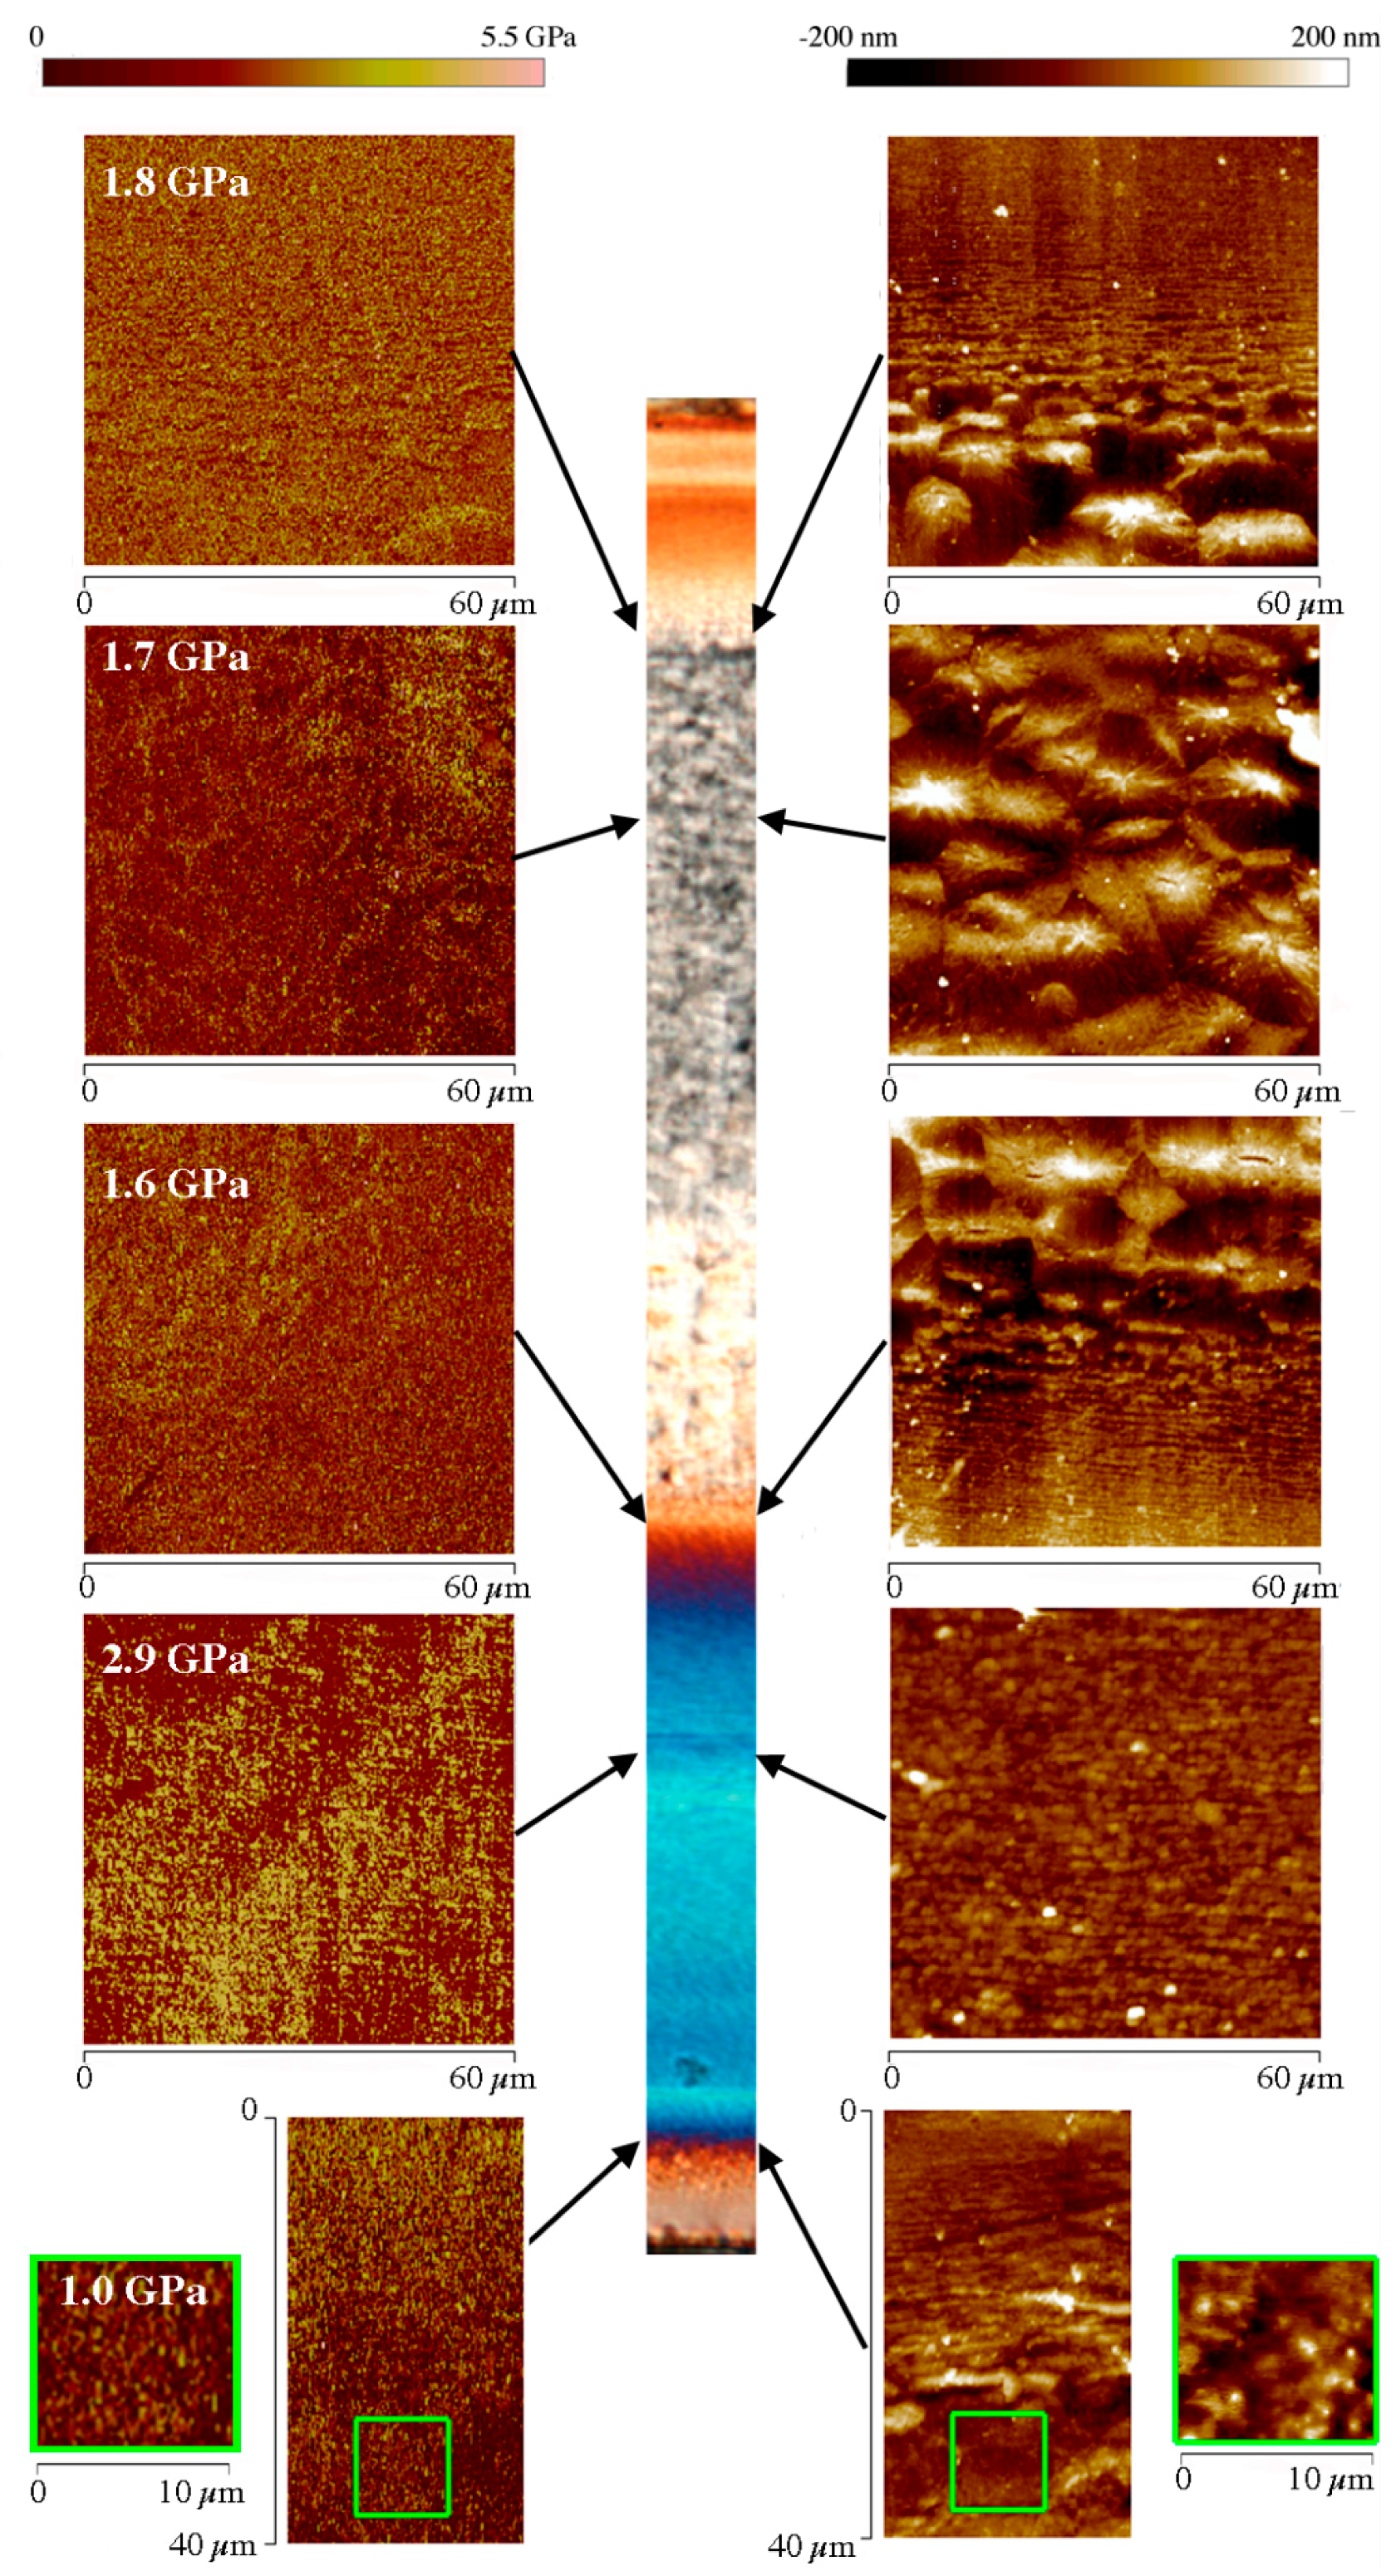
2.4. AFM Analysis
AFM analyses were performed by a NanoScope MultiMode V scanning probe microscope (Veeco, Santa Barbara, CA, USA) equipped with HarmoniX tool. Tests were performed with HMX probe silicon cantilevers (Bruker, Billerica, MA, USA) with nominal radii of c.a. 10 nm. The cantilever oscillation is composed by two different movements, torsional and vertical. These movements have different frequencies, in particular the amplitude frequency of torsional movement is higher than the tapping frequency [
28,
29]. The reconstruction of sample morphology is due to the vertical movements in standard tapping mode, whereas, the reconstruction of elastic modulus maps is due to the tip sample force interactions during the torsional movement [
28]. Lastly, the AFM elastic modulus distribution is obtained averaging the elastic moduli on windows of 20 × 20 μm by the Nanoscope software version 7.30.
HarmoniX measurements were done in air. Cantilevers were calibrated using a standard polystyrene/low density polyethylene (PS/LDPE) sample. The adopted vertical frequency was 44 kHz and the torsional frequency was 989 kHz. The cantilever vibration free amplitude was of 750 mV in air. The force level was modulated adopting the amplitude set point. The amplitude set point was used for feedback control, as a reference value; in particular ca. 60% of the free amplitude was selected. Imaging was performed with 0.5 Hz scan rates, considering 20 harmonics.
The calibration method reported by Gojzewski et al. [
4] allows evaluating the deflection sensitivity and cantilever spring constants that were 360.6 nm/V and 1.58 N/m respectively.
Image processing and data analysis were performed with the NanoScope software version 7.30 and NanoScope Analysis version 1.20. The NanoScope software gives elastic modulus maps by elaborating HarmoniX AFM imaging through Derjaguin-Muller-Toporov (DMT) model [
30].
4. Discussion
The mechanisms that govern the temperature evolution inside the polymer part during the molding process are: fountain flow, heat convection, heat diffusion, viscous and latent heat generation [
32]. Fountain flow occurs when the melt is forced, with elongational flow, outwards from the center of the flow front toward the mold wall. The fountain flow is recognized to be the main reason for the high level of molecular orientation found at the skin layer [
33,
34,
35]. It is also responsible for a temperature profile that is quite uniform along the thickness of the flow front. This situation changes quickly soon after the first contact of the polymer with the surface by the effect of the heat transfer with the wall.
The evolution of temperature distribution inside an asymmetrically heated sample is given by Equation (1) [
36], where convective contributions of the melt flow are not accounted for, or it could be neglected during the post-filling stages of the injection molding process. It considers a slab of thickness
s starting from uniform temperature
Ti (220 °C in the considered cases), with one surface held at constant temperature
T1 and the other surface at
T2 (120 °C and 28 °C, respectively).
where, α is the thermal diffusivity,
t is the time and
In order to take into account the heat of crystallization, the thermal diffusivity
α is corrected with the Stefan number,
Ste, according to Equation (3).
with:
where
Δh∞ is latent heat of crystallization,
Xc is the crystallinity and
Tf is the final temperature of the slab. For asymmetrical boundary conditions,
Tf is not constant along the slab thickness and depends on
s. The values of the parameters adopted for the calculation are reported in
Table 2.
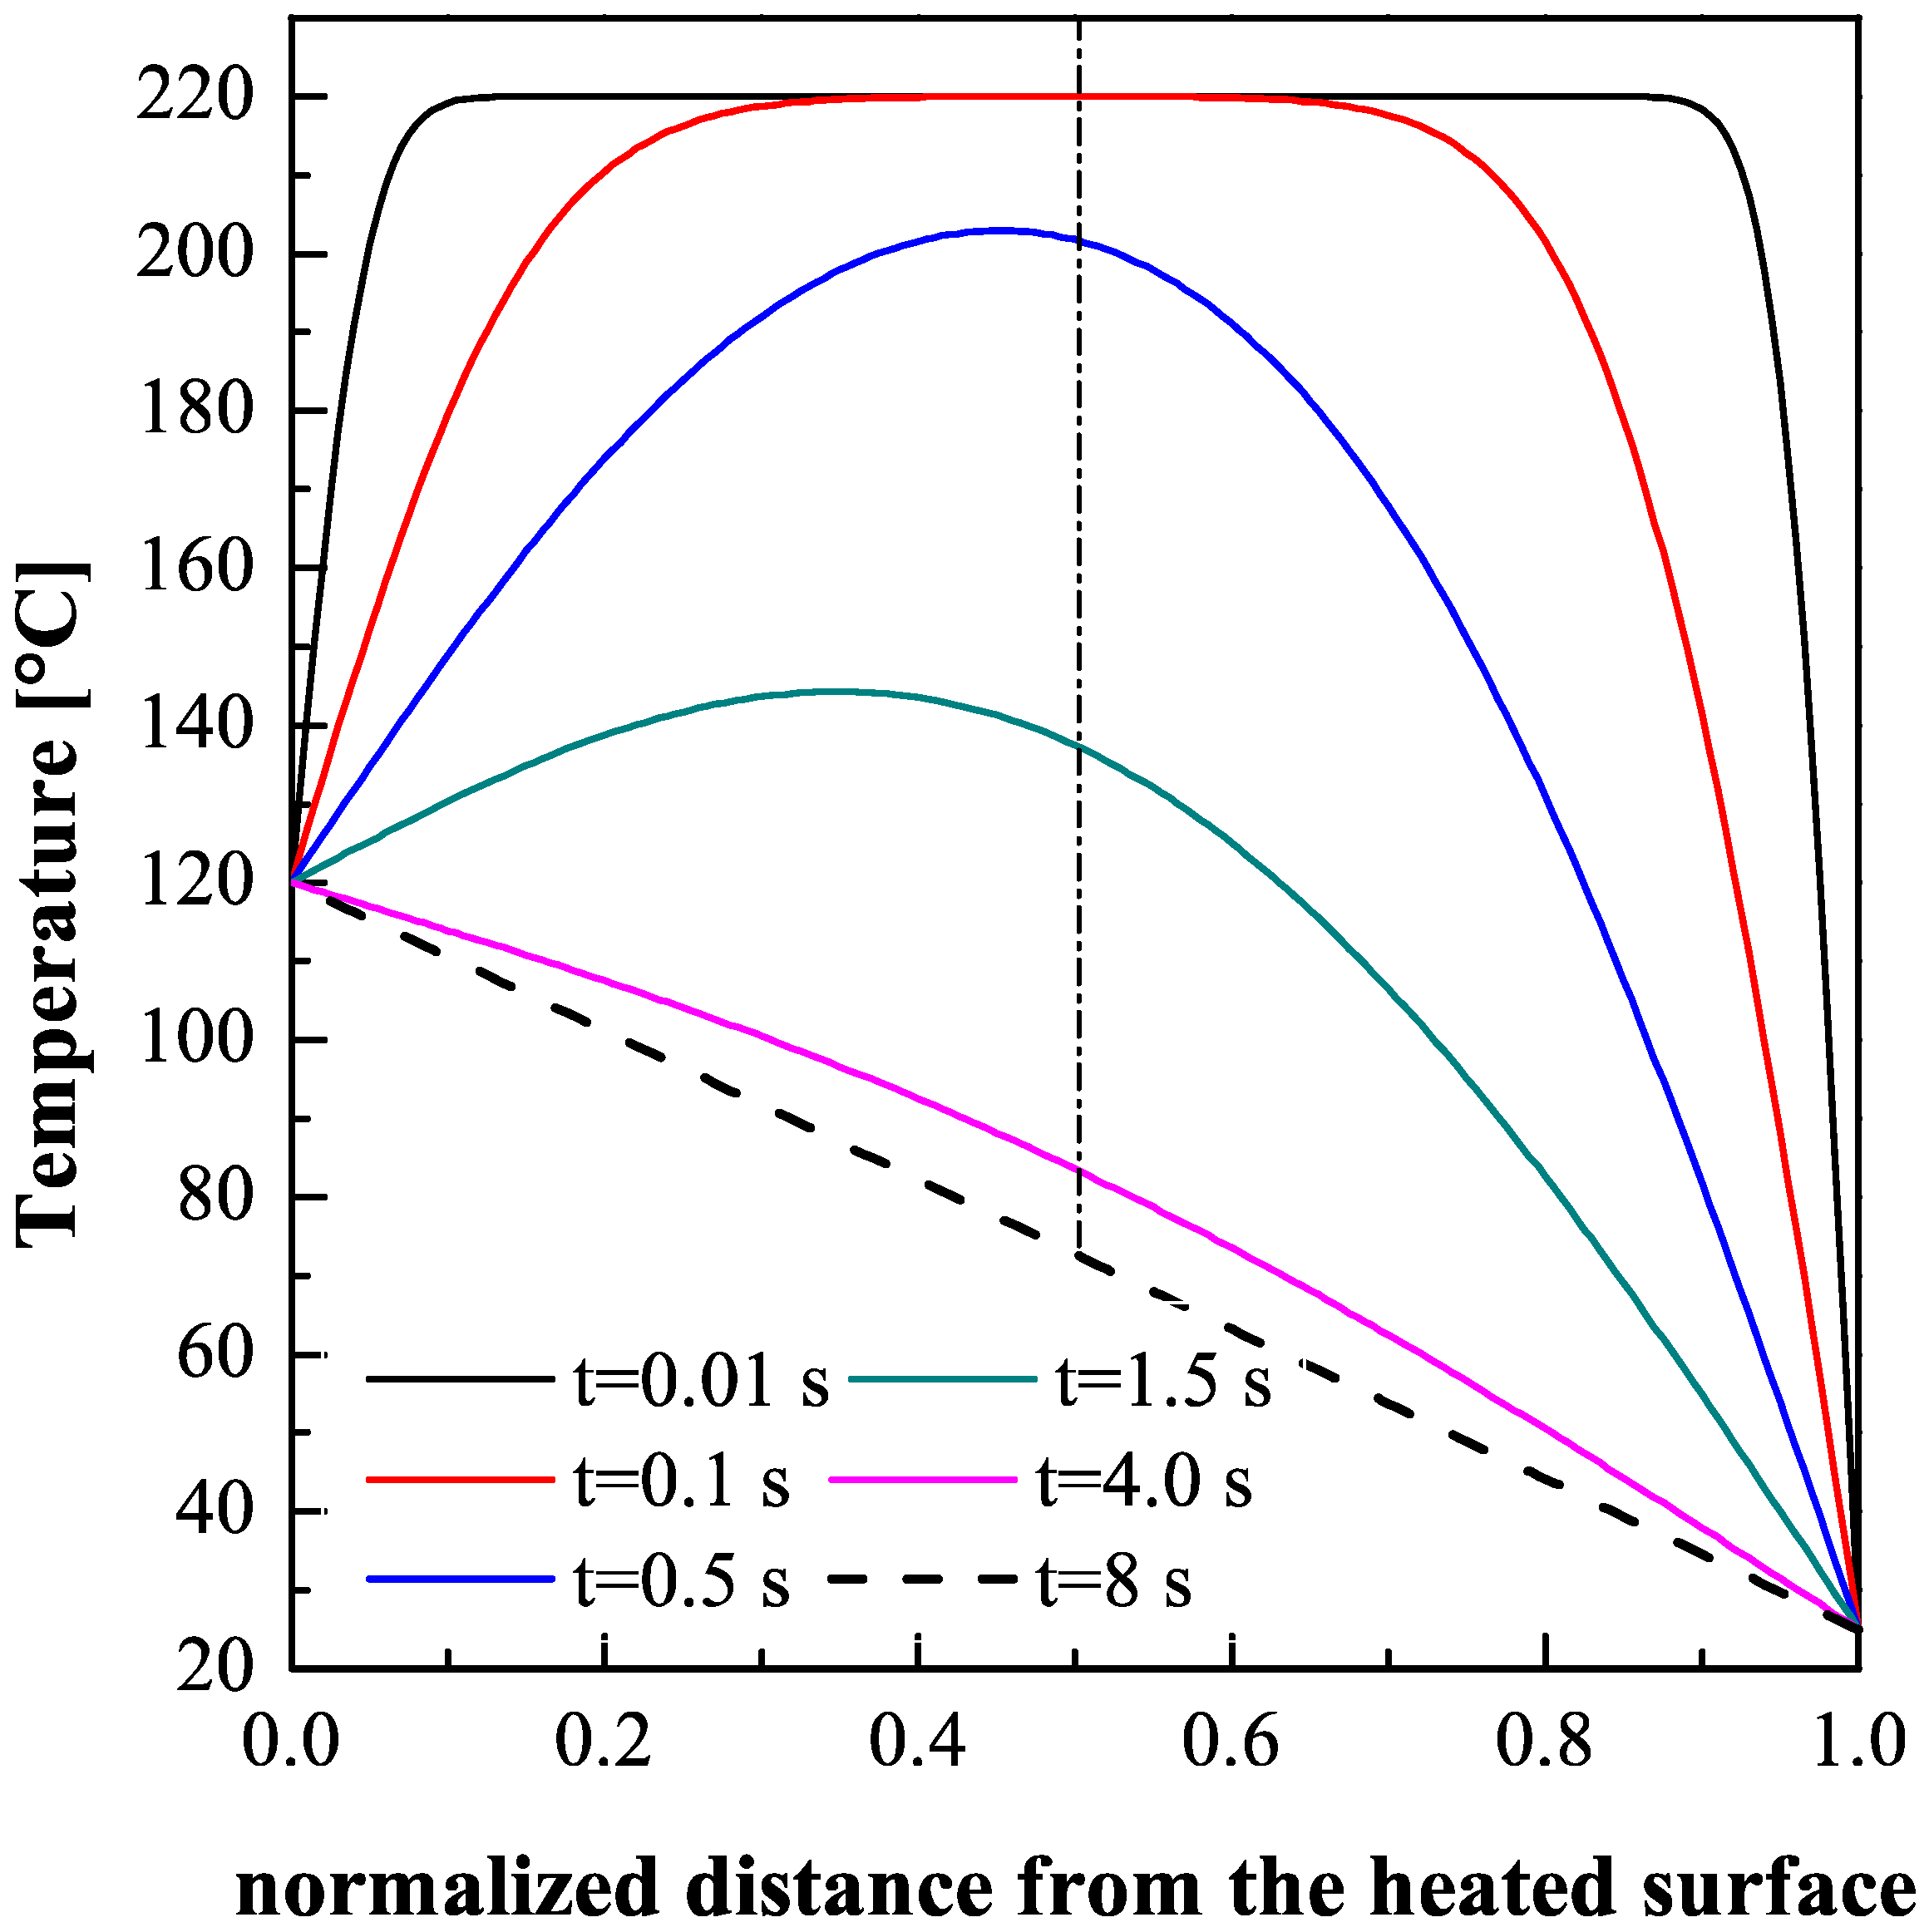
The evolutions of the temperature distribution along the sample thickness, calculated by the Equations (1)–(4) at different times, are reported in
Figure 10. The temperature distributions asymptotically approach the equilibrium distribution
Teq (the dotted line in
Figure 10).
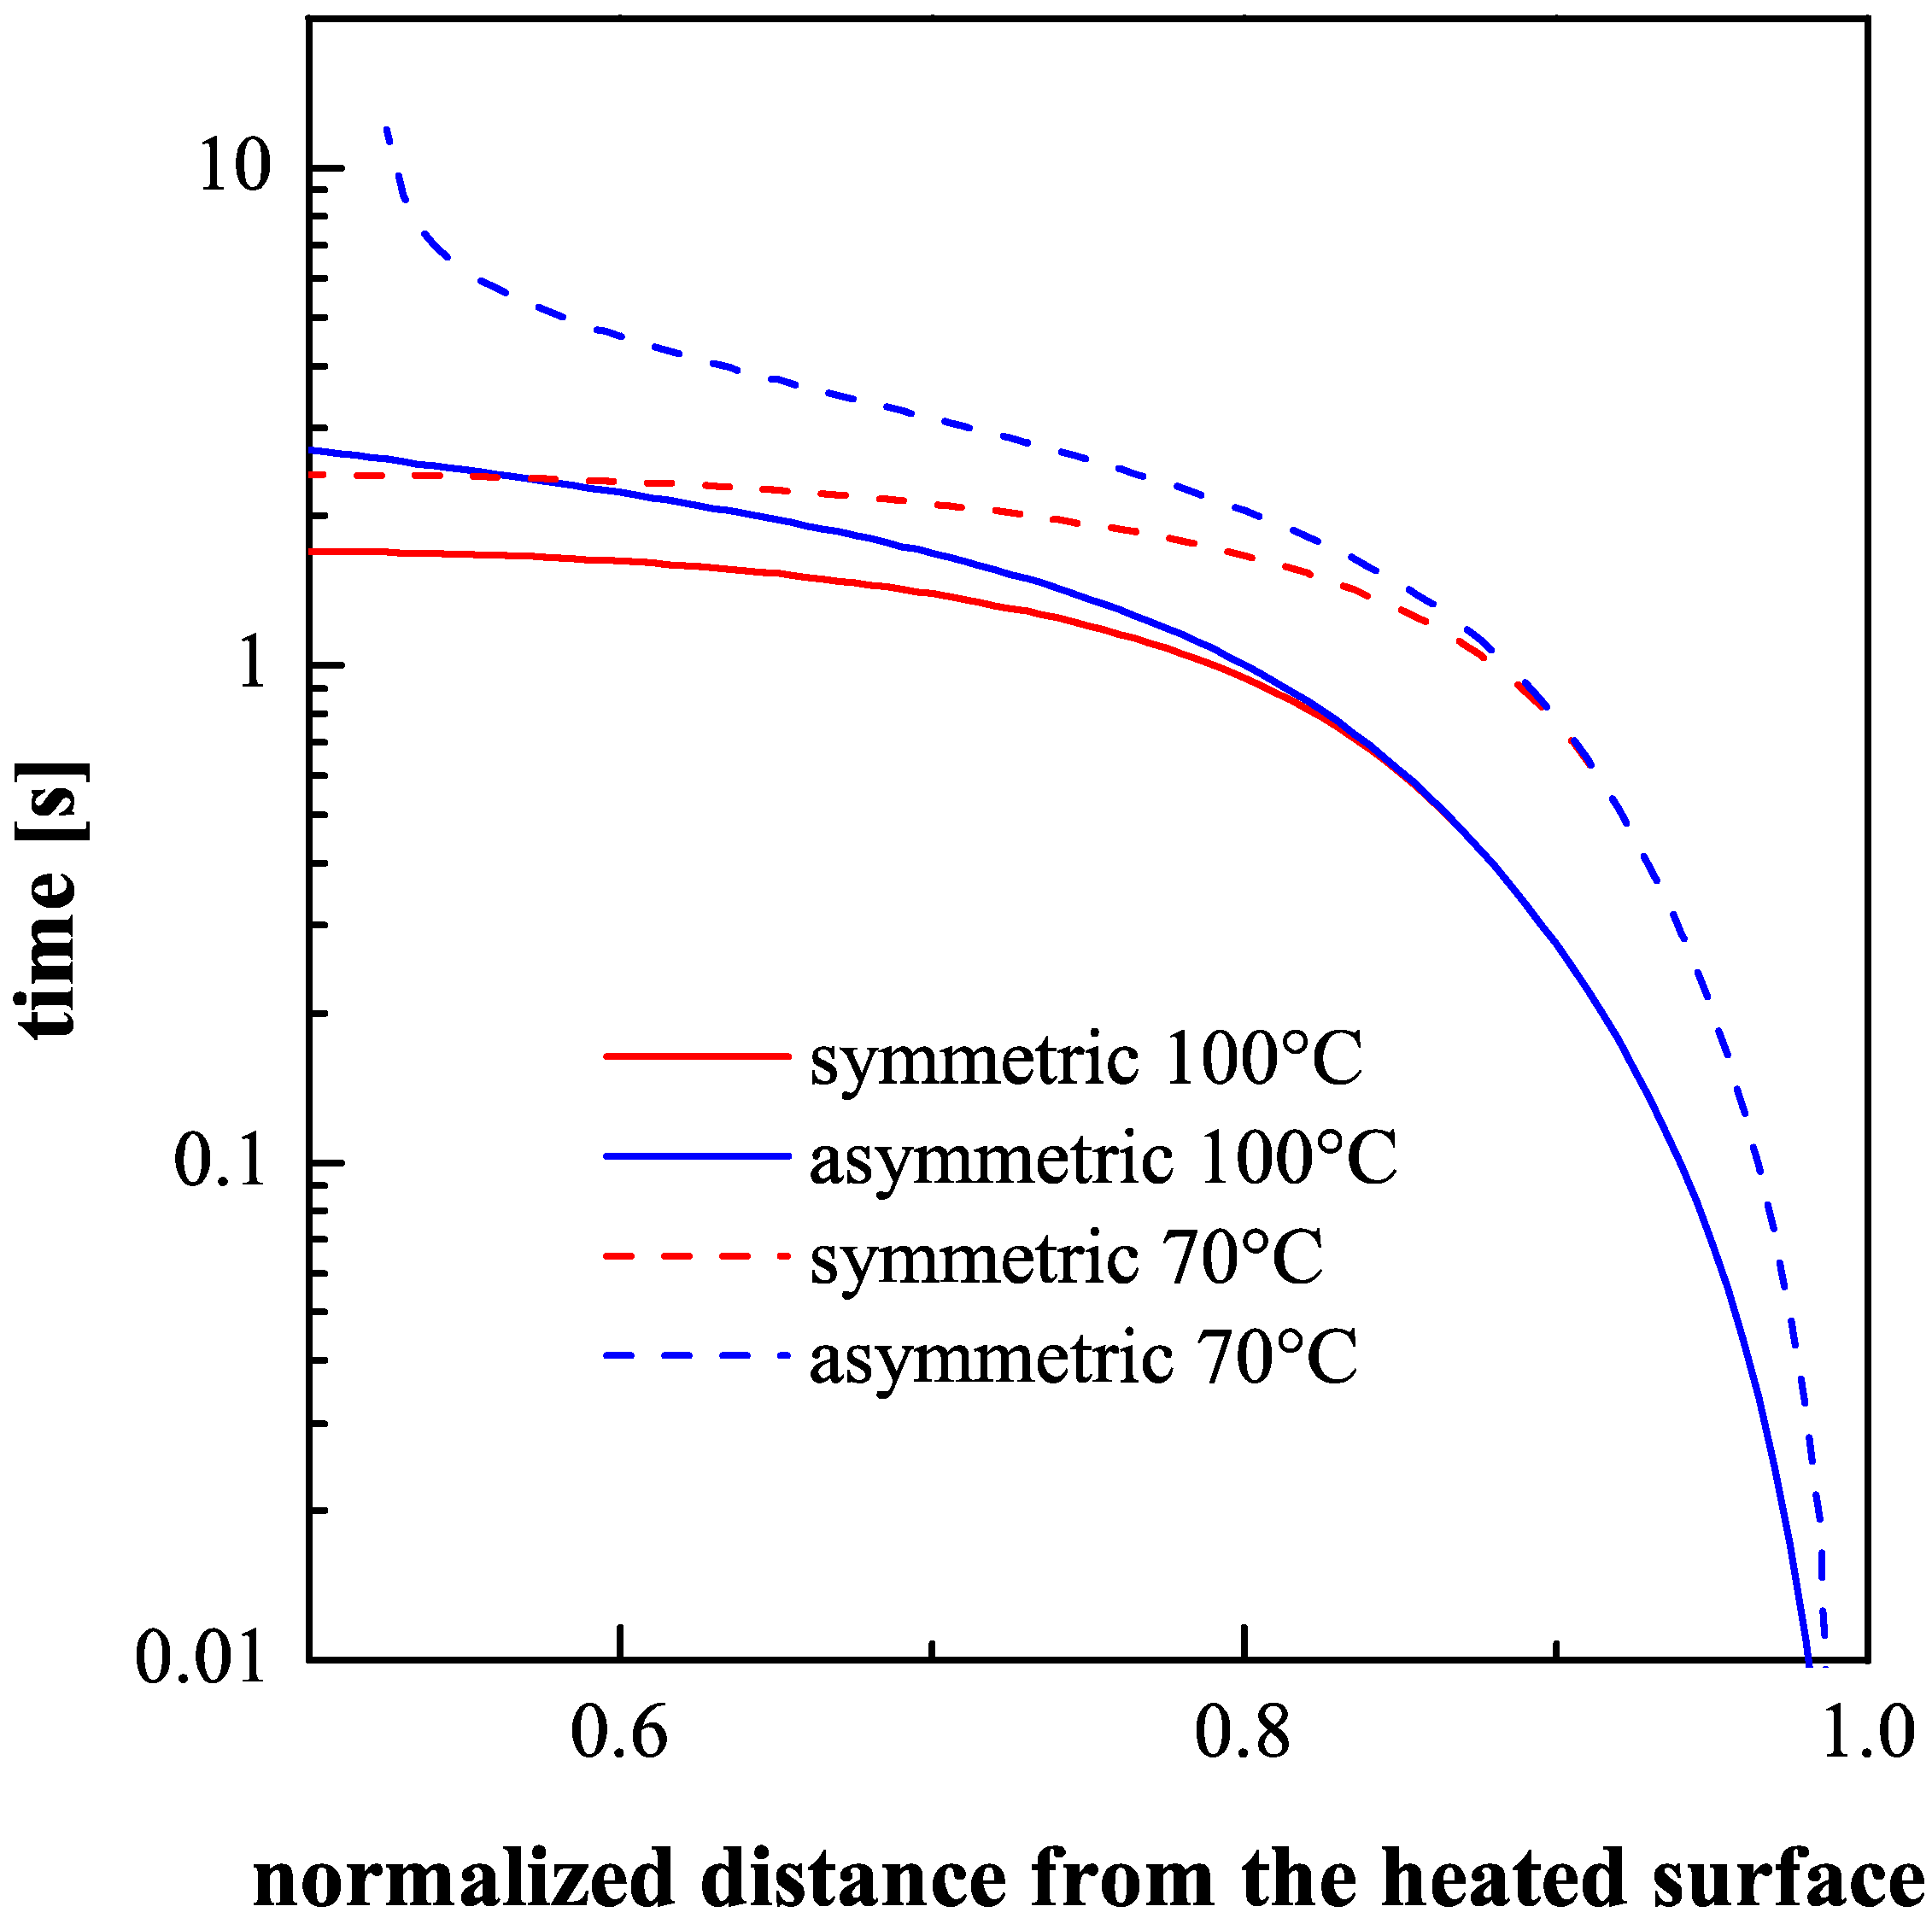
Figure 11 shows the time to cool down each layer in the temperature range 70–100 °C, that corresponds to the temperature range within which the iPP crystallization takes place. The time distributions (down to 70 °C and to 100 °C) are reported for both symmetric thermal conditions and asymmetric thermal conditions.
The morphology distributions depend on the molecular stretch, which is determined, essentially, by the filling flow and on the subsequent relaxation time that, in turn, depends on the temperature evolution. As reported above, the surface heater was held active for three different times (namely, 0.5 s, 8 s and 18 s) after the contact of the melt with the cavity in position P2. The time 0.5 s corresponds to the cavity filling time, 18 s corresponds to the dominant relaxation time at 150 °C evaluated under processing conditions [
37,
38] and 8 s corresponds to about the time needed to reduce the distance from the equilibrium temperature distribution by about 95 percent.
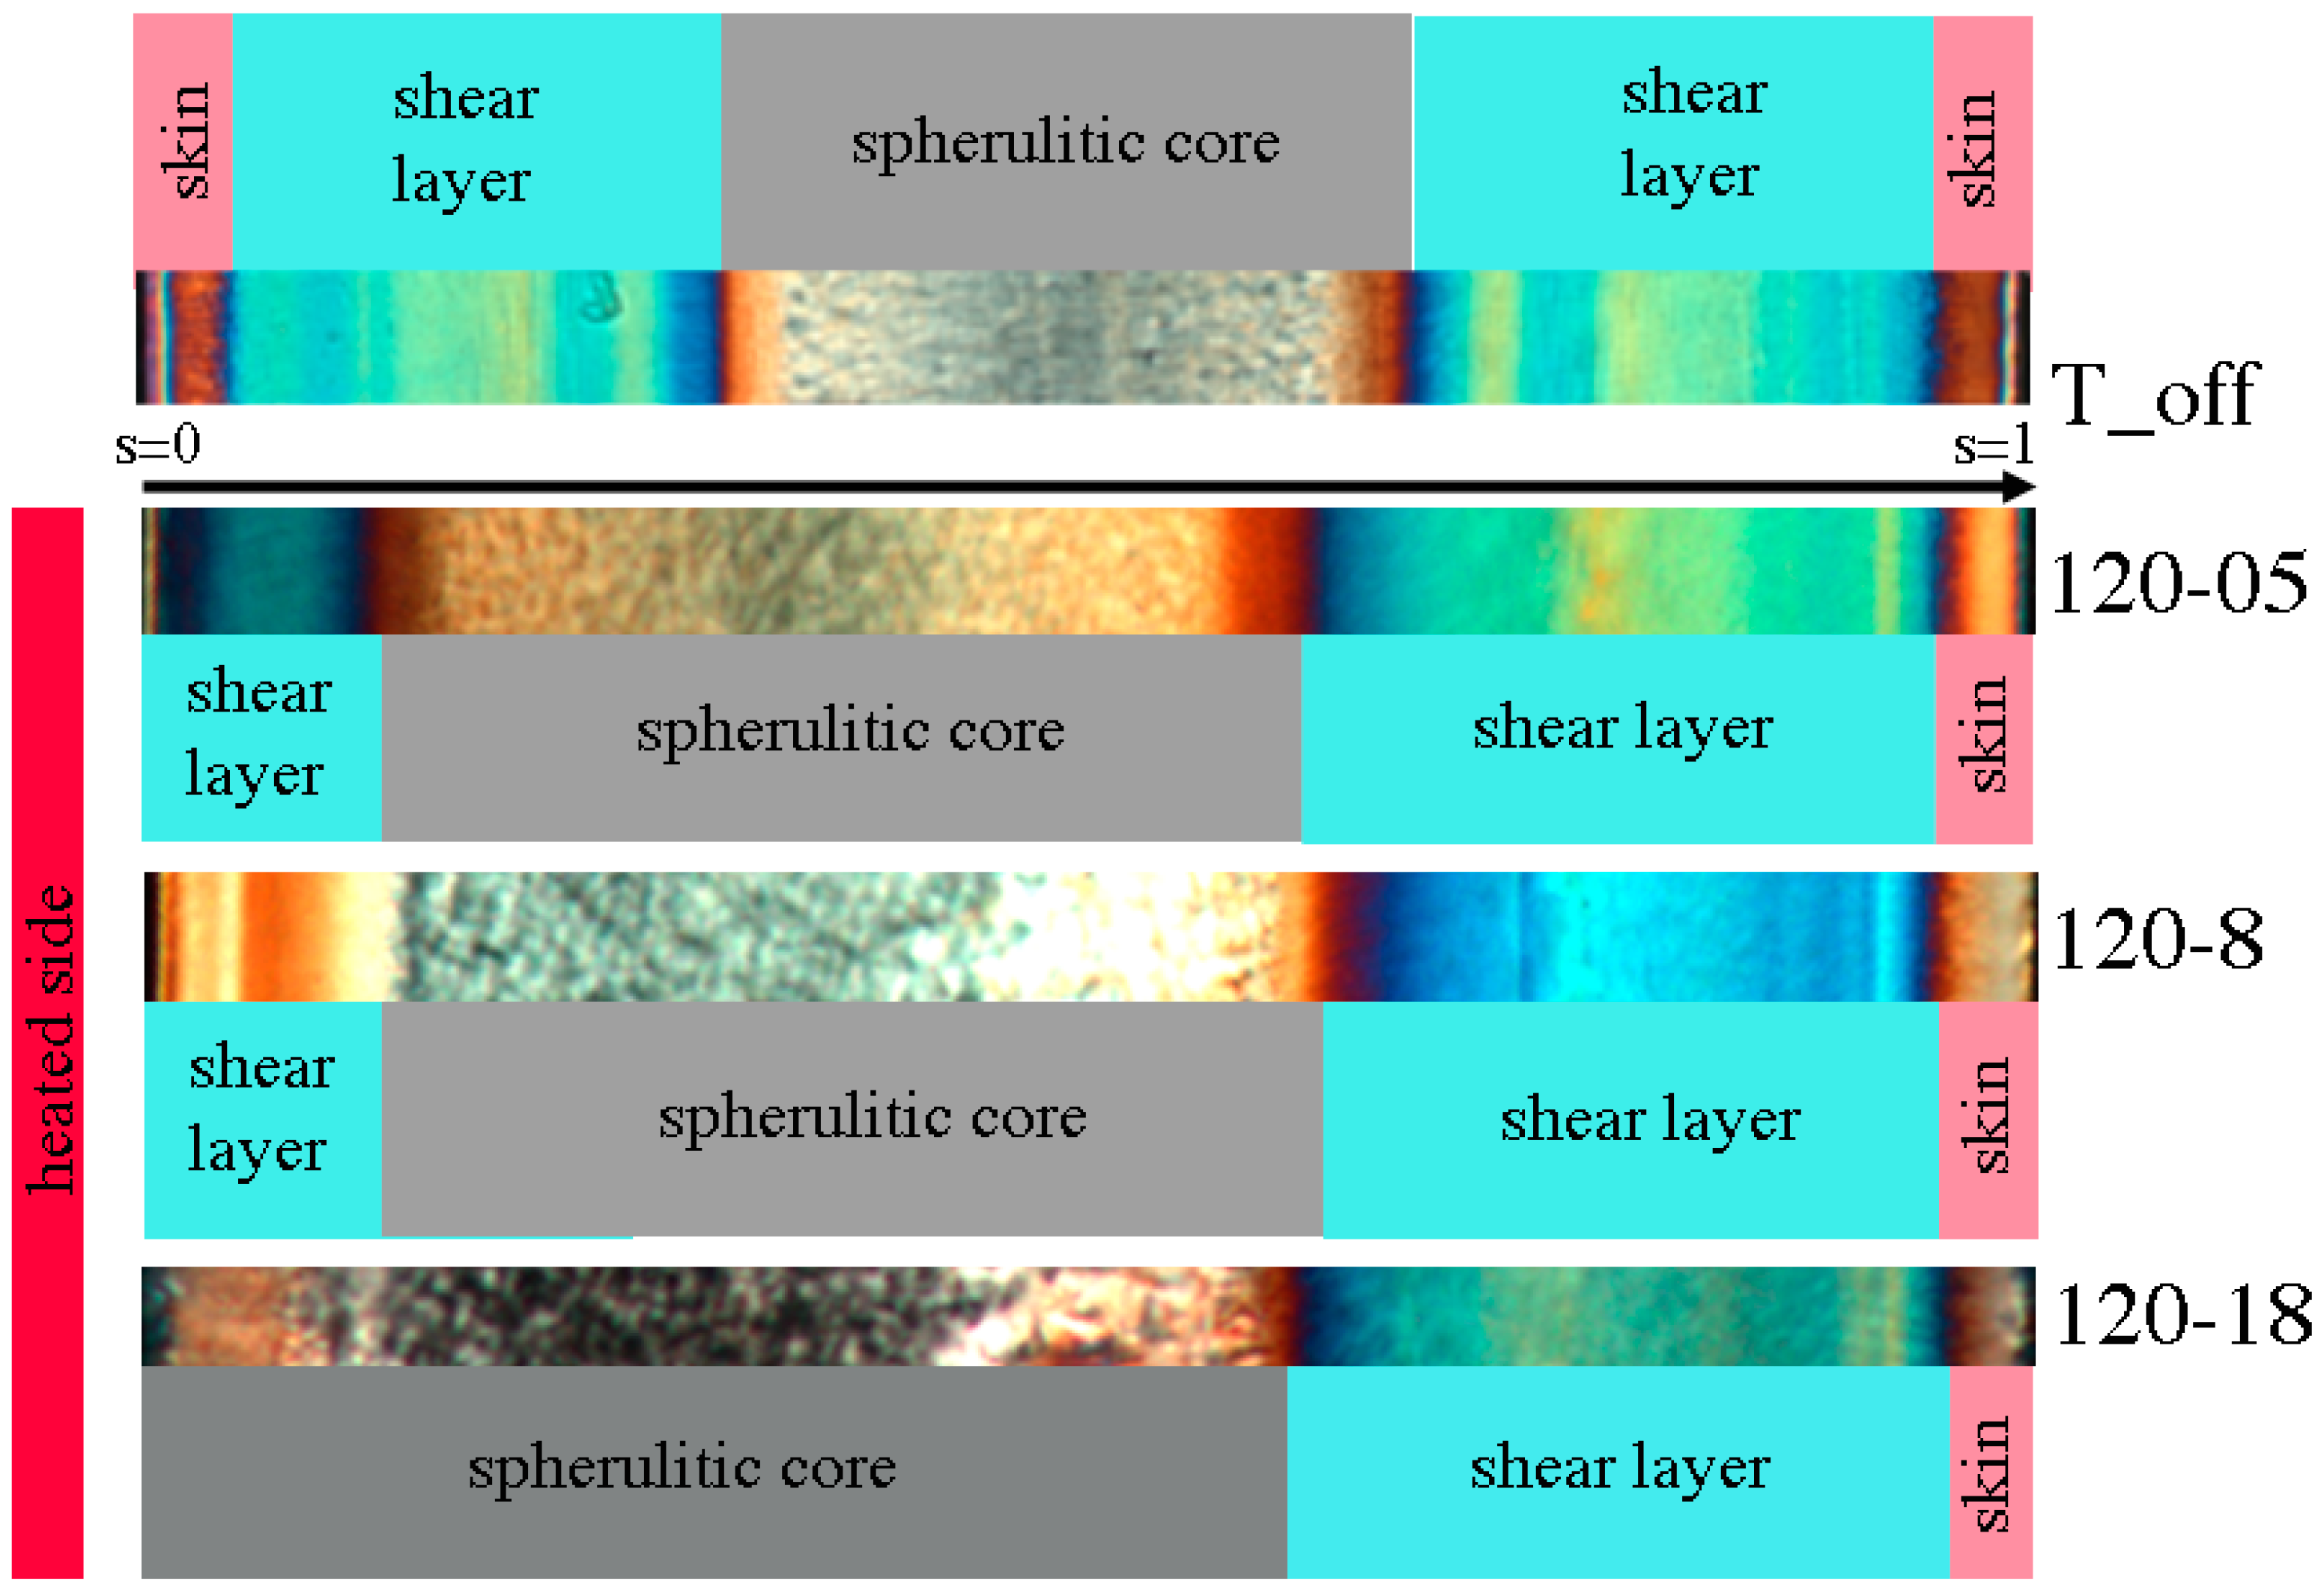
The thicknesses of the shear layers on the side held at 28 °C show a small dependence upon the heating time (
Figure 4). However, the asymmetric heating affects the evolution of temperature on the whole thickness.
Figure 10 shows that there is a significant thickness (of about 0.15 mm) on the unheated mold surface where the cooling time results essentially unaffected by the mold heating on the other side (
Figure 11). As expected, on this layer the morphologies of all samples correspond to that of the sample T_off, which experienced symmetrical cooling. Vice versa, the skin layer is not observed on the heated side where cooling rate, although high, does not achieve the values of the other side.
Deeper inside the unheated side, as shown in
Figure 11, the cooling time during asymmetric heating experiments becomes larger with respect to the symmetrical cooling. The packing flow in the sample core, because of the higher temperature, remains active for a time longer than in the symmetrical case. Consequently, the molecular stretch reaches values sufficient to achieve shear layer thicknesses slightly wider than the thickness of the shear layer of the T_off case.
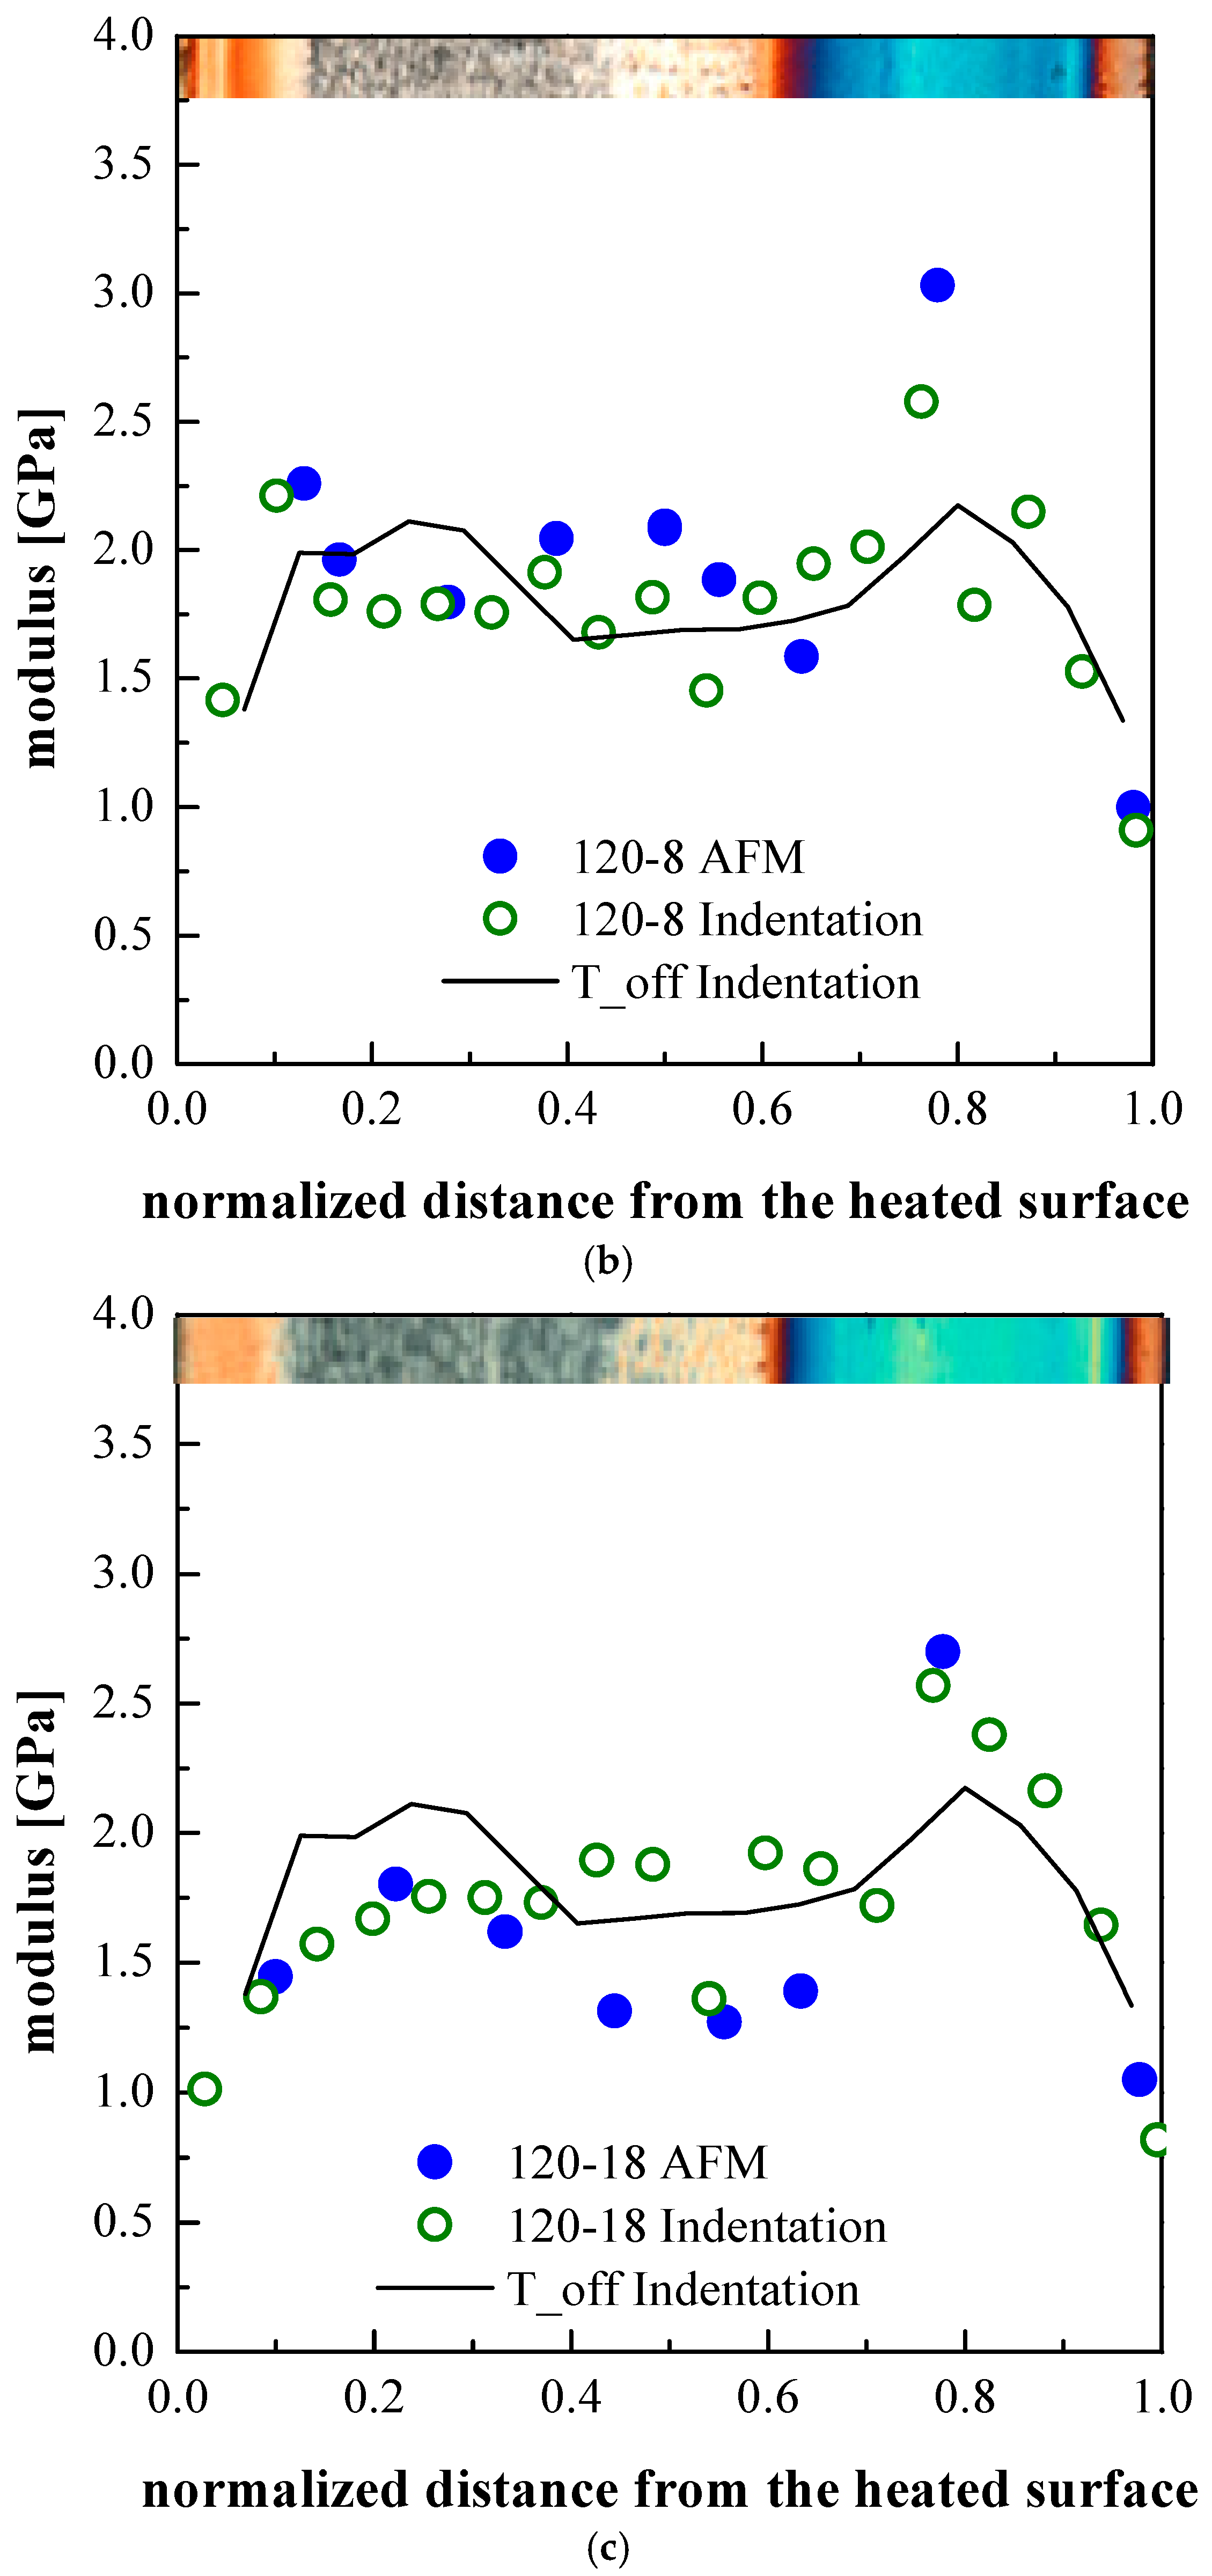
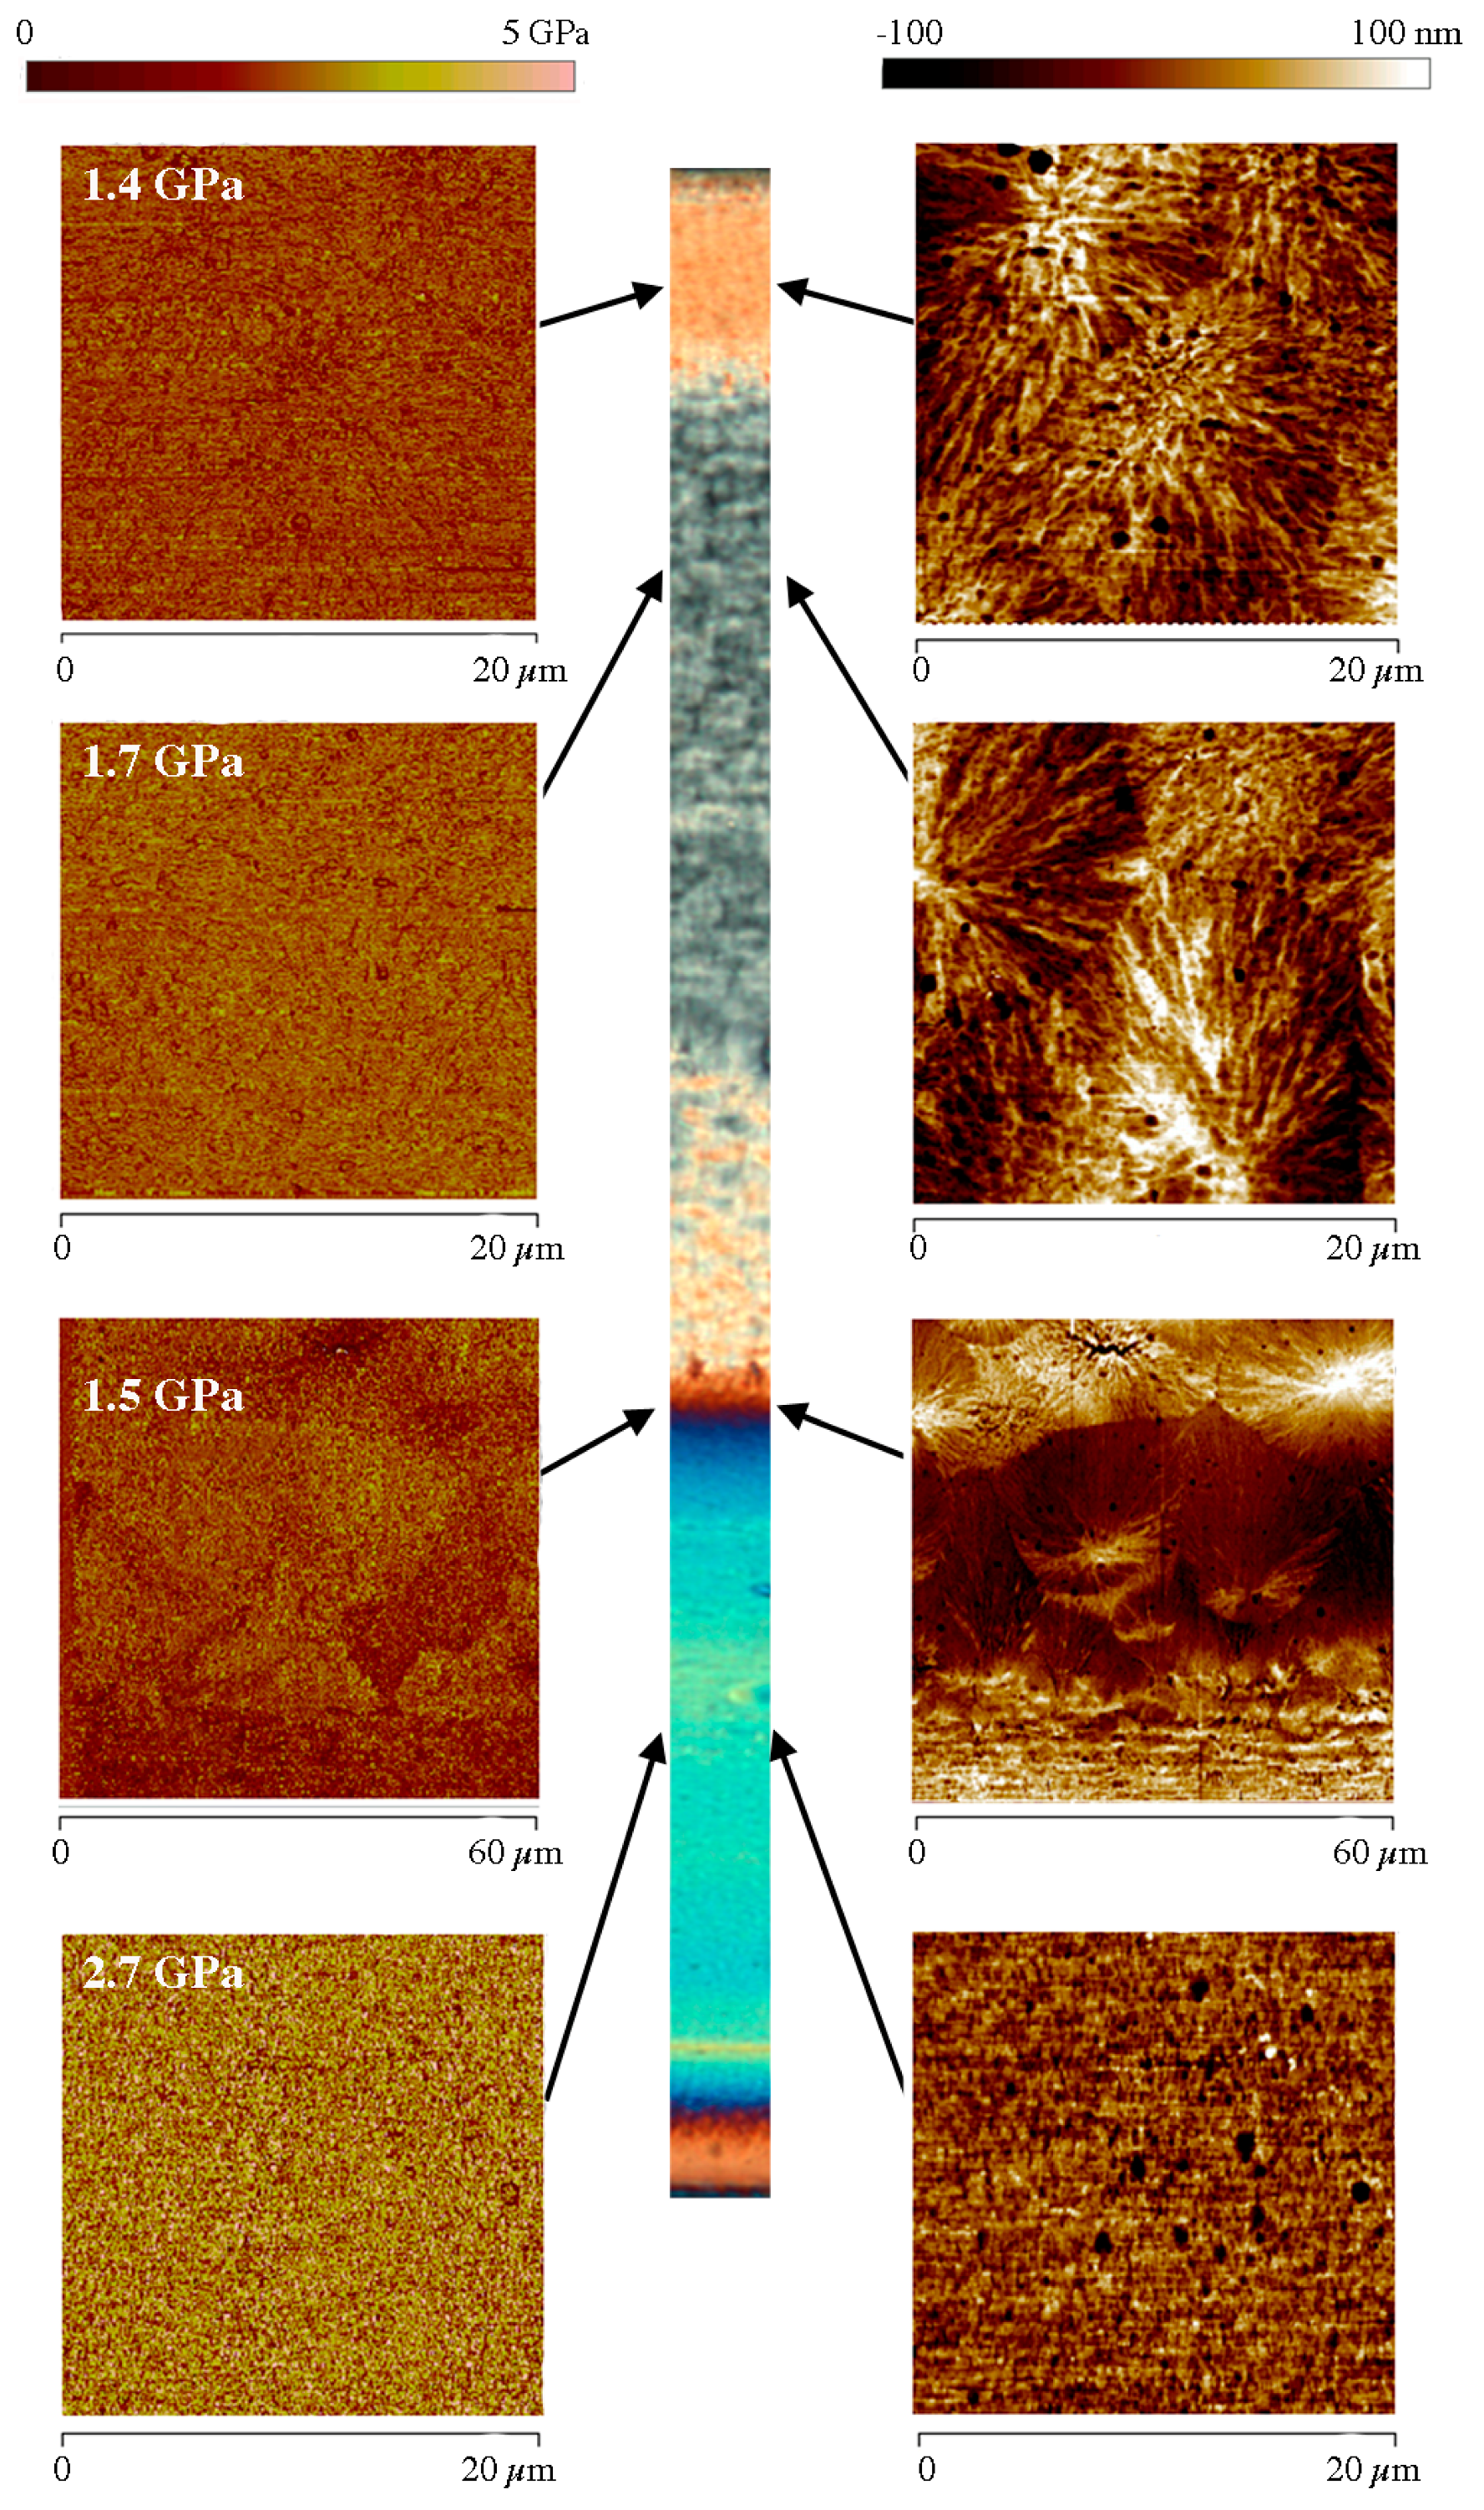
The micrographs reported in
Figure 8 show that the morphology at the heated side changes with the heating time. In particular, with 0.5 s heating time a small shear layer was detected, which becomes thinner with 8 s and disappears with 18 s heating time. A parallel growth of the spherulitic layer toward the surface takes place due to surface heating. These effects must be determined by the gradual relaxation of the molecular stretch inside the polymer, while it is still in the molten state. As a consequence, it can be concluded that at the heated surface the polymer crystallizes during the fast cooling stages which follow the shutdown of the heating device.
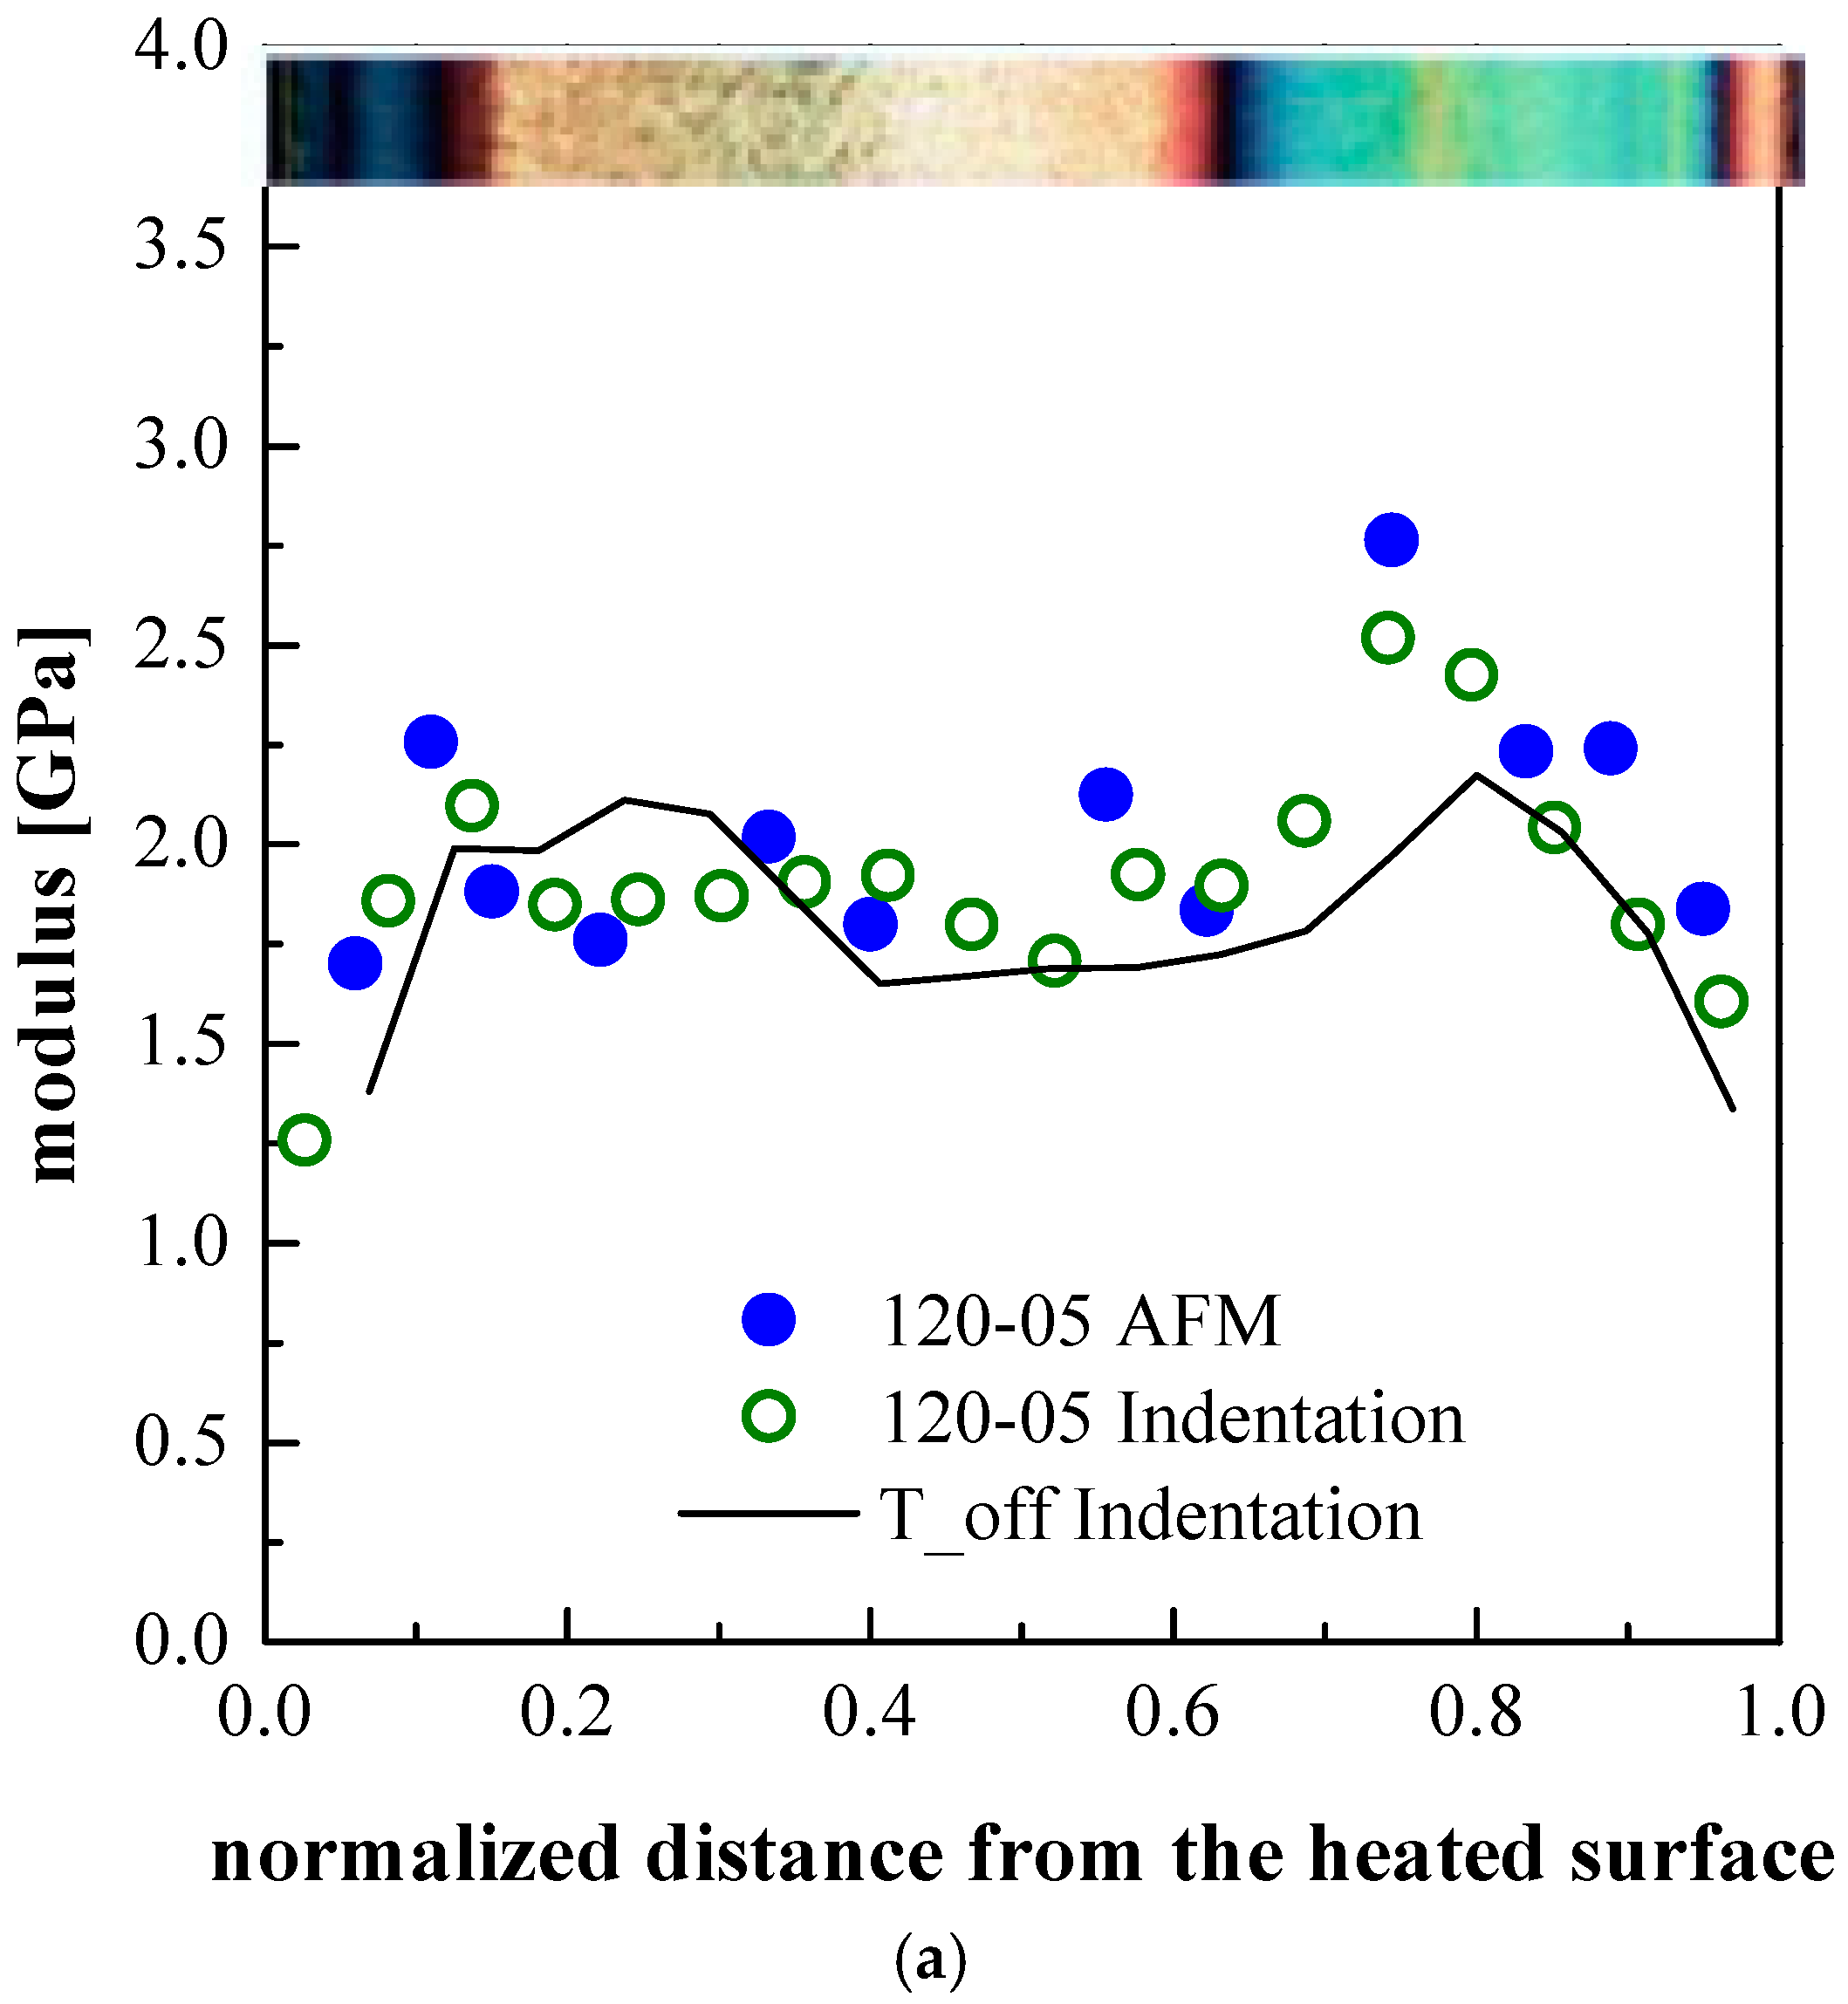
The final mechanical properties are determined by the local structure, which obviously depends upon the local molecular stretch and by the local structuring achieved during solidification. The structuring from a melt (where the molecules are randomly distributed and deeply entangled) to a crystalline structured solid is a kinetic process and the structuring level enhances if more time is available. The time available to the polymer for crystalline structuring increases as the cooling rate (through the crystallization and related phenomena) decreases, thus for a given molecular stretch, structuring improves as the distance from the cold surface increases. On the other hand, the intensity of the molecular stretch (mainly generated by the shear intensity during the cavity filling) increases from the sample center toward the sample surface. Applying such a reason to the whole cross section, the moduli are expected to increase with the distance from the surface, due to the cooling rate decrease. At the same time, they are expected to decrease with the distance from the surface, due to the stretch decrease. The combination of these two factors is consistent with a maximum in between the symmetry plane and the sample surface, as it can actually be observed in the
Figure 8 and
Figure 9.
In the T_off conditions, the maximum within the shear layer is located closer to the spherulitic layer rather than to the external border of the shear layer. The structuring is expected to be very poor at both surfaces of the sample because of the extremely high cooling rate. On approaching the surfaces, the modulus decreases especially where skin layers are observed. When the heating stage is active the position of the maximum of the elastic modulus, on the unheated side, ends up being essentially unaffected by the heating stage.
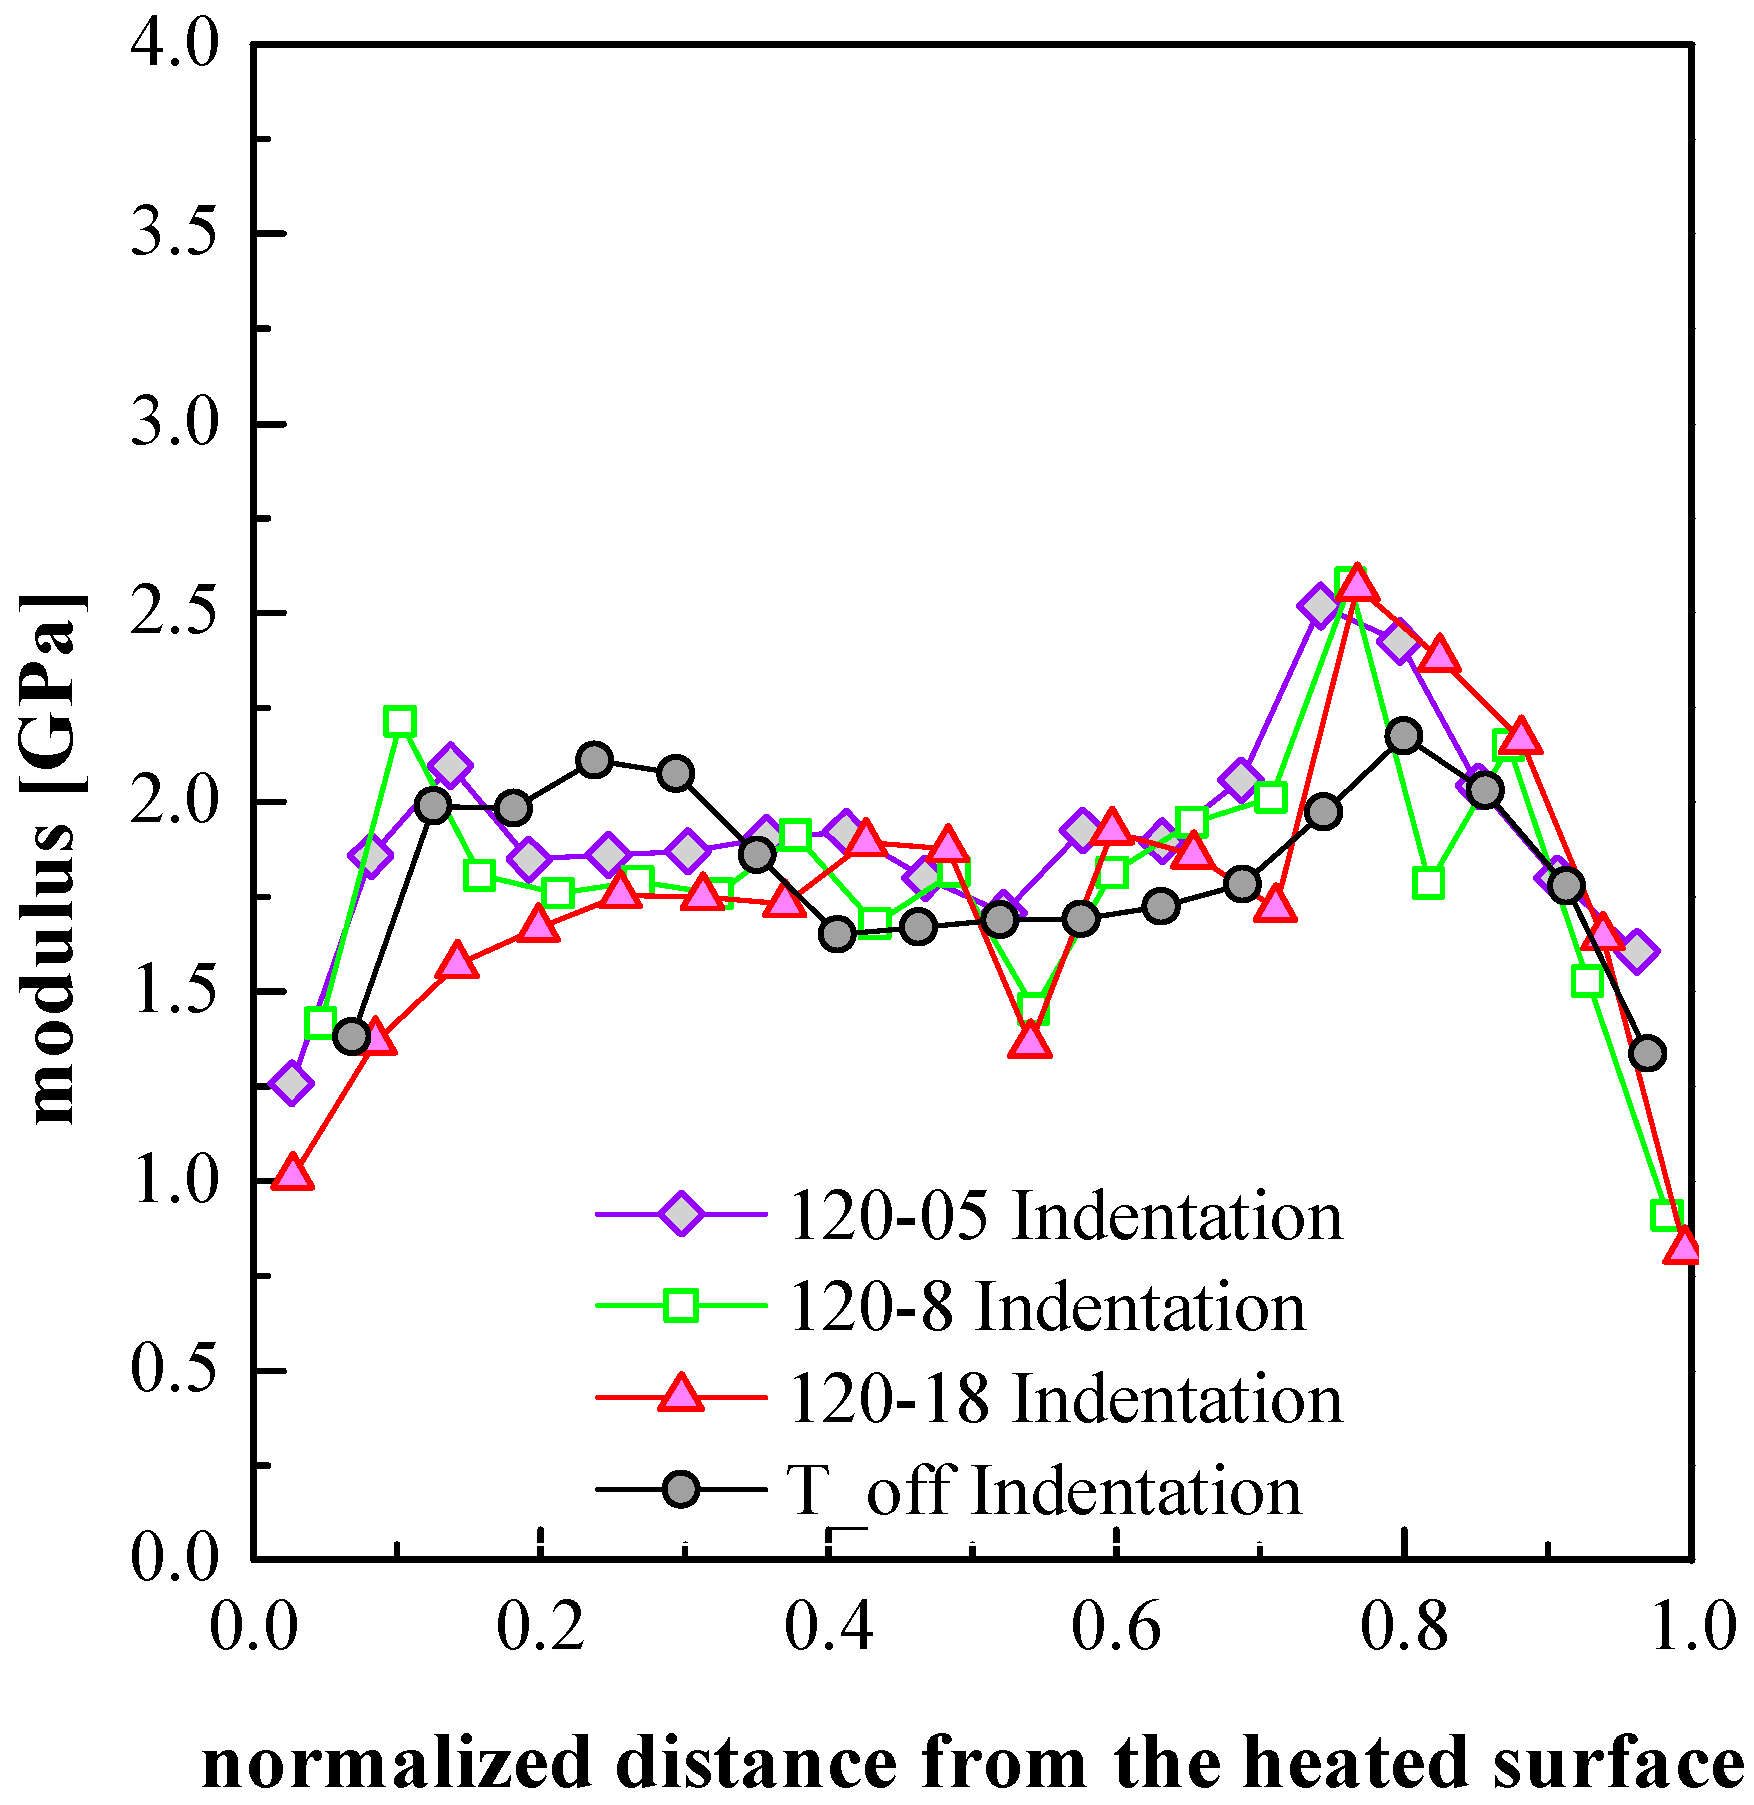
What has still to be discussed is the effect of the heating time on the values of the maximum of the modulus within the shear layers. It is not a surprise that the moduli within the two shear layers on the heated side (of the samples 120-05 and 120-8) follow similar paths (with clear small maxima) since both of those layers crystallize during the fast cooling which follows the shutdown of the heating device. The sample 120-18 does not show any maximum on the heated side since in this case the polymer chains have enough time to relax and the shear layer is not observed.
On the unheated side, it has to be considered that the three samples (120-05, 120-8, 120-18) experienced cooling histories that are very different one from the other. Furthermore, within each test, the cooling histories through the crystallization are a function of the distance from the surface, also within the shear layer. The temperature evolutions within the sample shown in
Figure 10 were calculated under the condition that the temperature on the heated side is held at 120 °C. However, for the sample 120-05 the heating was interrupted soon after the end of the filling, i.e., 0.5 s. At that time, the temperature distribution on the sample cross-section was already significantly different with respect to the symmetrical cooling case (see the temperature distribution at
t = 0.5 s, in
Figure 10). Furthermore, the sample surface will take a small but significant time to decrease to 28 °C, as shown in
Figure 2. As a consequence, the subsequent cooling through the crystallization on the unheated side will be slowed down. This determines a larger time for structuring and thus it justifies the increase (with respect to the symmetric case) of the maximum of the modulus inside the shear layer.
The other two samples, 120-8 and 120-18, undergo a first cooling toward the temperature of the dotted line in
Figure 10, and afterward their temperature remains essentially constant until the heating shutdown and then they undergo a second cooling to the mold temperature after the heating shutdown. At the end of the first cooling step the temperature becomes sufficiently small (45–60 °C at 0.6–0.8 mm distance from the heated wall) to assure that, in both conditions, the polymer crystallizes in the time available.
It is well known that crystallization temperature during cooling decreases with the increase of the cooling rate and increases by the effect of the flow, both effects increase toward the sample surface and partially compensate each other. The crystallization of the α-phase of polypropylene has a maximum rate at about 70 °C with a half crystallization time of about 2 s [
39,
40]. That time decreases of 1–2 orders of magnitude by the effect of the flow, as a consequence the α crystallization temperature in a shear layer has to take place in the interval 70–100 °C. The permanence time within that temperature interval determines the time available, during cooling, for structuring during solidification, which in its turn (for a given stretch) determines the material properties (the modulus in our case). The permanence times within that temperature interval can be evaluated from
Figure 11 also for the sample T_off. In particular,
Figure 11 refers only to the unheated side. The permanence times are only slightly dependent on the distance from the sample surface in the shear layer. However, in the internal zone of the shear layer, the permanence times in the crystallization temperature range for the samples 120-8 and 120-18 show values clearly larger than those calculated for the sample T_off. This is consistent with the findings related to the mechanical properties: the sample obtained with 120 °C mold surface temperature shows higher maximum values of elastic modulus in the shear layer of the unheated side with respect the shear layer of the T_off sample.
5. Conclusions
In this work, iPP samples were obtained by injection molding adopting a cavity with a surface kept at a high temperature for different time periods (0.5 s, 8 s and 18 s) during the process. Resulting molded samples have been mechanically characterized at different length-scales by indentation and AFM HarmoniX.
The asymmetry of the thermal conditions on the mold surface completely changes the classical skin-core structure shown by the samples. The three characteristic morphological layers, namely skin, shear and core layer are affected in a different way by external heating. The core layer, generally characterized by a spherulitic morphology with intermediate modulus, increases in thickness and moves up to the heated sample side. The shear layers show different behaviors with respect to the half-thickness position. The one closer to the heated side moves in the surface direction and gradually decreases its thickness up to completely disappear for 18 s heating time. On the opposite, the layer closer to the unheated surface slightly increases in dimension with respect to those formed in a symmetrically cooled sample. The skin layer, characterized by loosely structured crystalline elements, is practically unaffected on the unheated side, yet it disappears even for a very short heating time (0.5 s) on the heated side.
Higher values of the modulus were found in the shear layers (especially those close to the unheated side). Minimum and intermediate values were found in the skin and in the spherulitic layers, respectively.
The variations of the modulus were interpreted on the basis of variations of both the molecular stretch and the time available for molecular structuring: the cooling rate through the crystallization determines the time available and thus affects the level of structuring achieved inside the solid. The modulus increases with the increase of local structuring and molecular stretch.


