
Low Density Nanocellular Polymers Based on PMMA Produced by Gas Dissolution Foaming: Fabrication and Cellular Structure Characterization

Abstract
:
1. Introduction
2. Materials and Methods
2.1. Materials
2.2. Methods
2.2.1. Precursor Production
2.2.2. Foaming Tests
2.2.3. Amount of Gas Uptake
2.2.4. Density
2.2.5. Open Cell Content
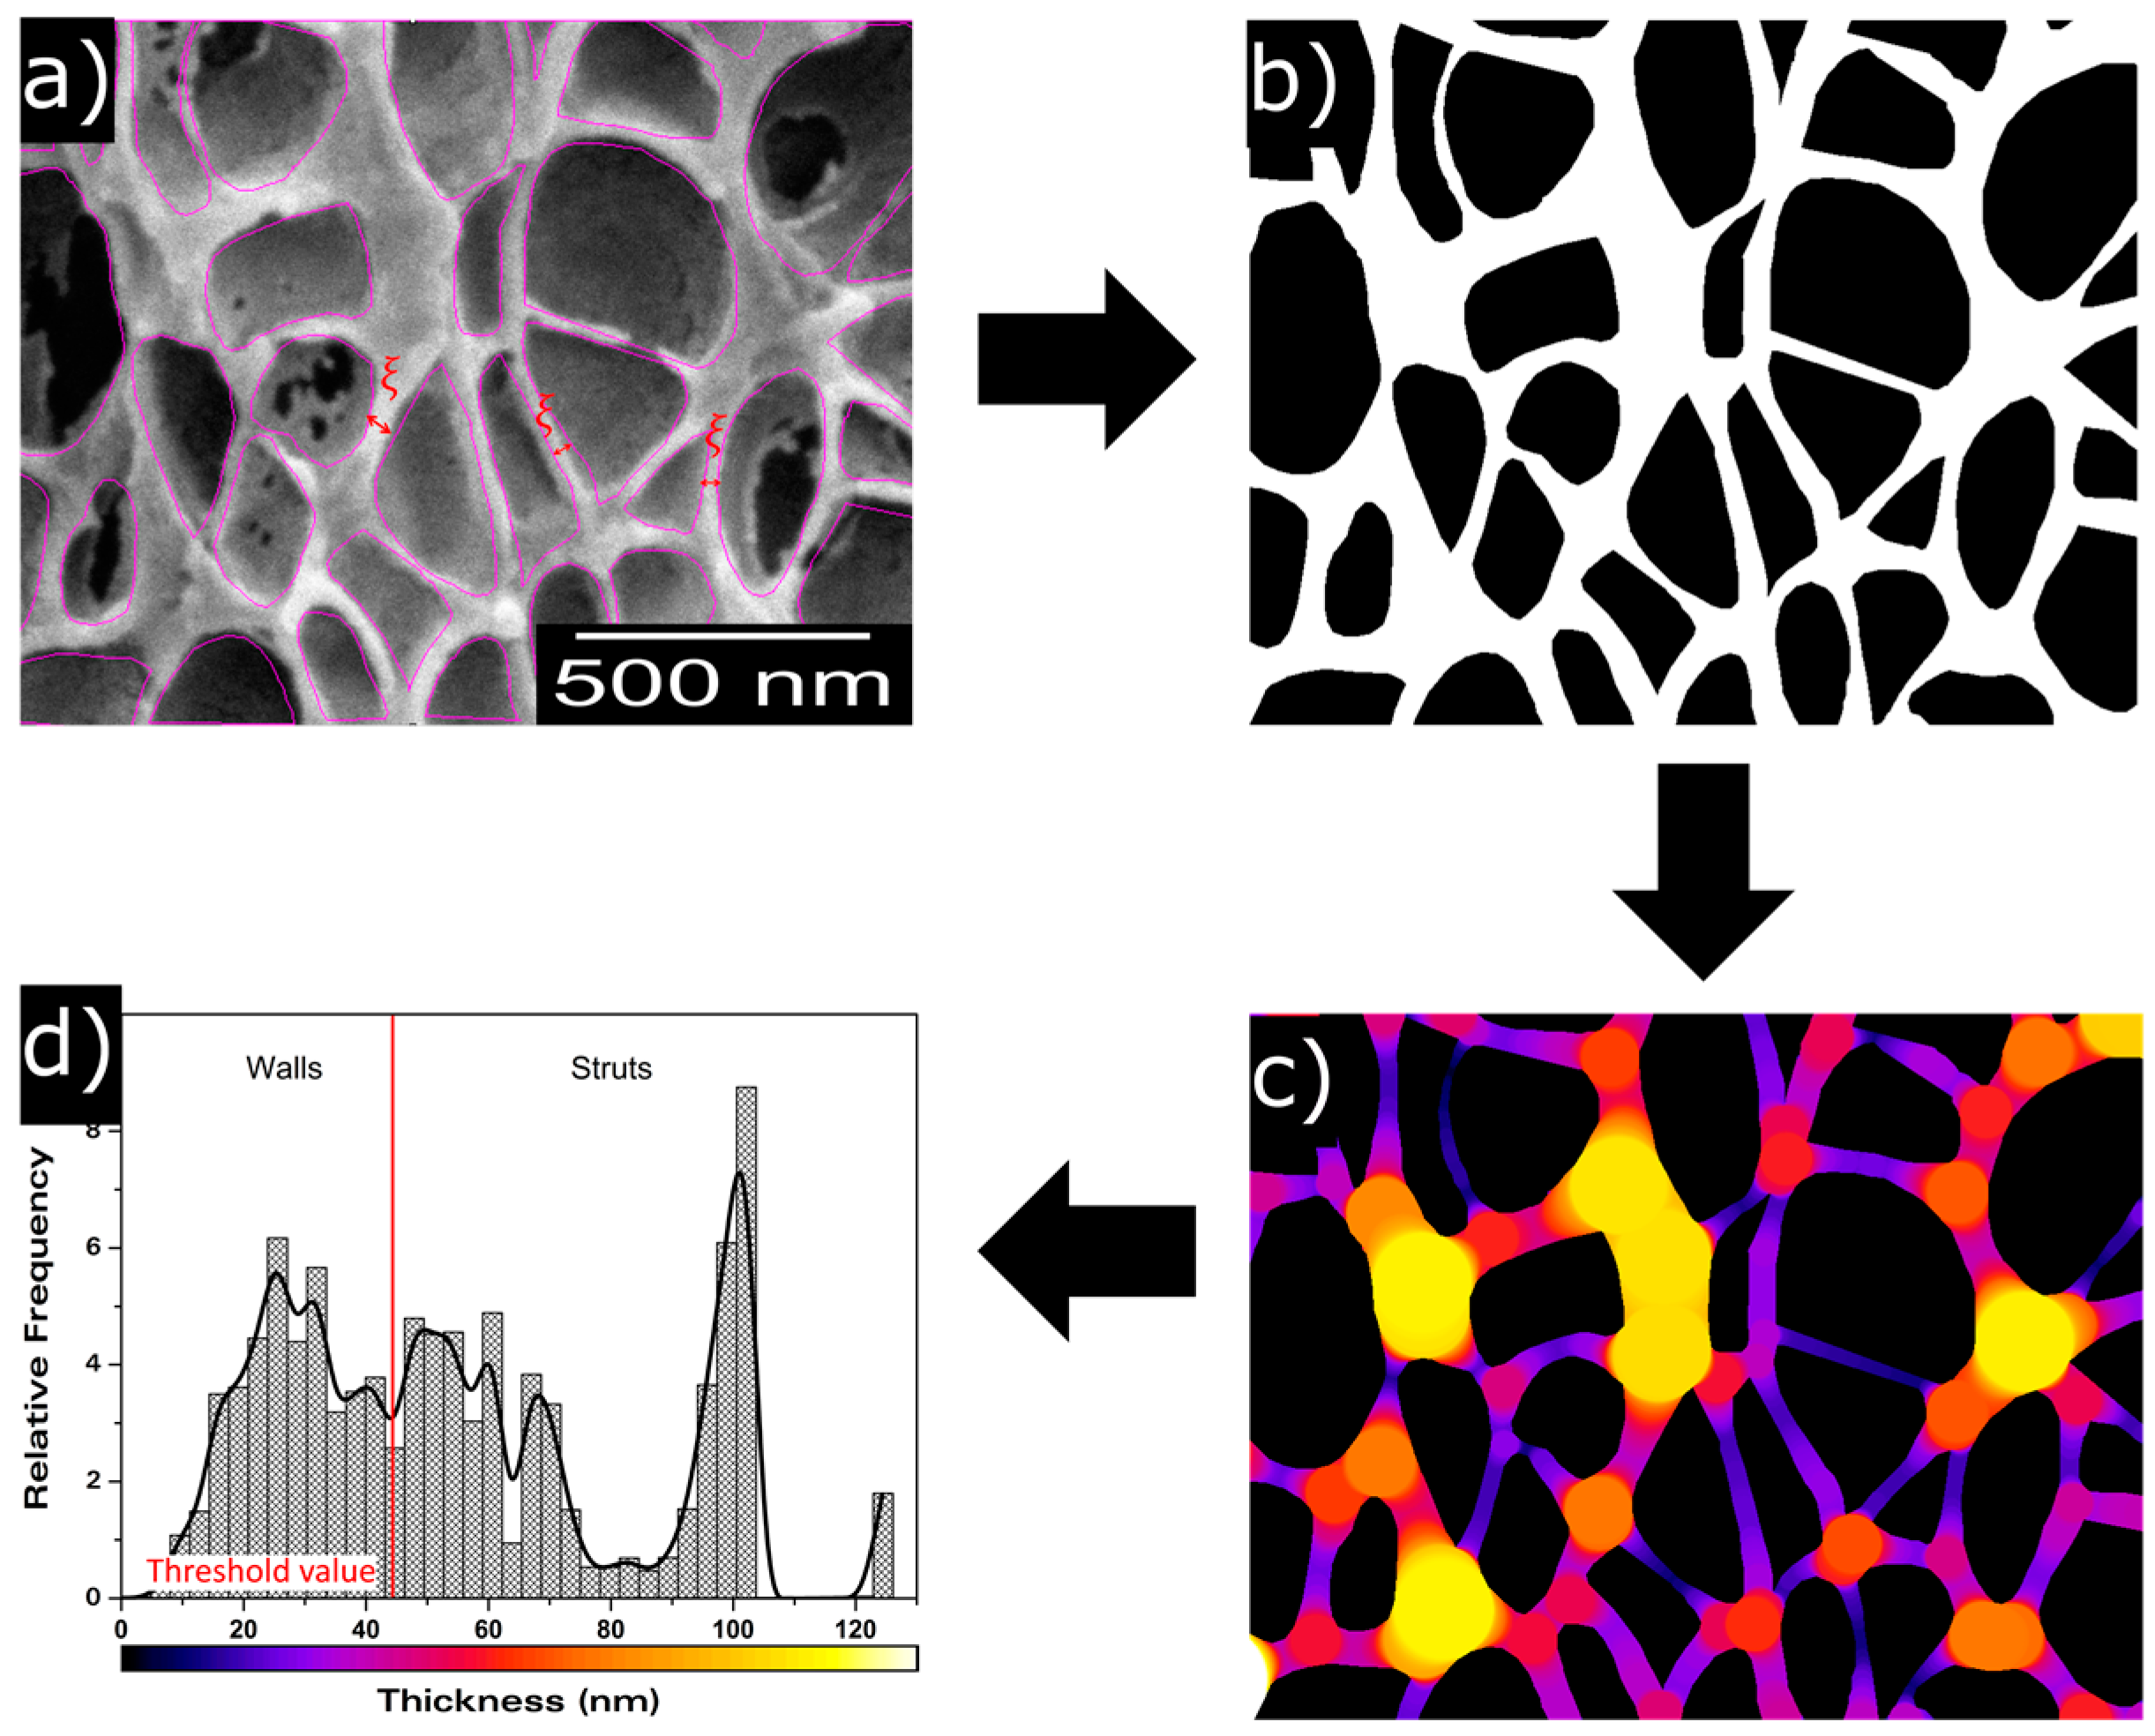
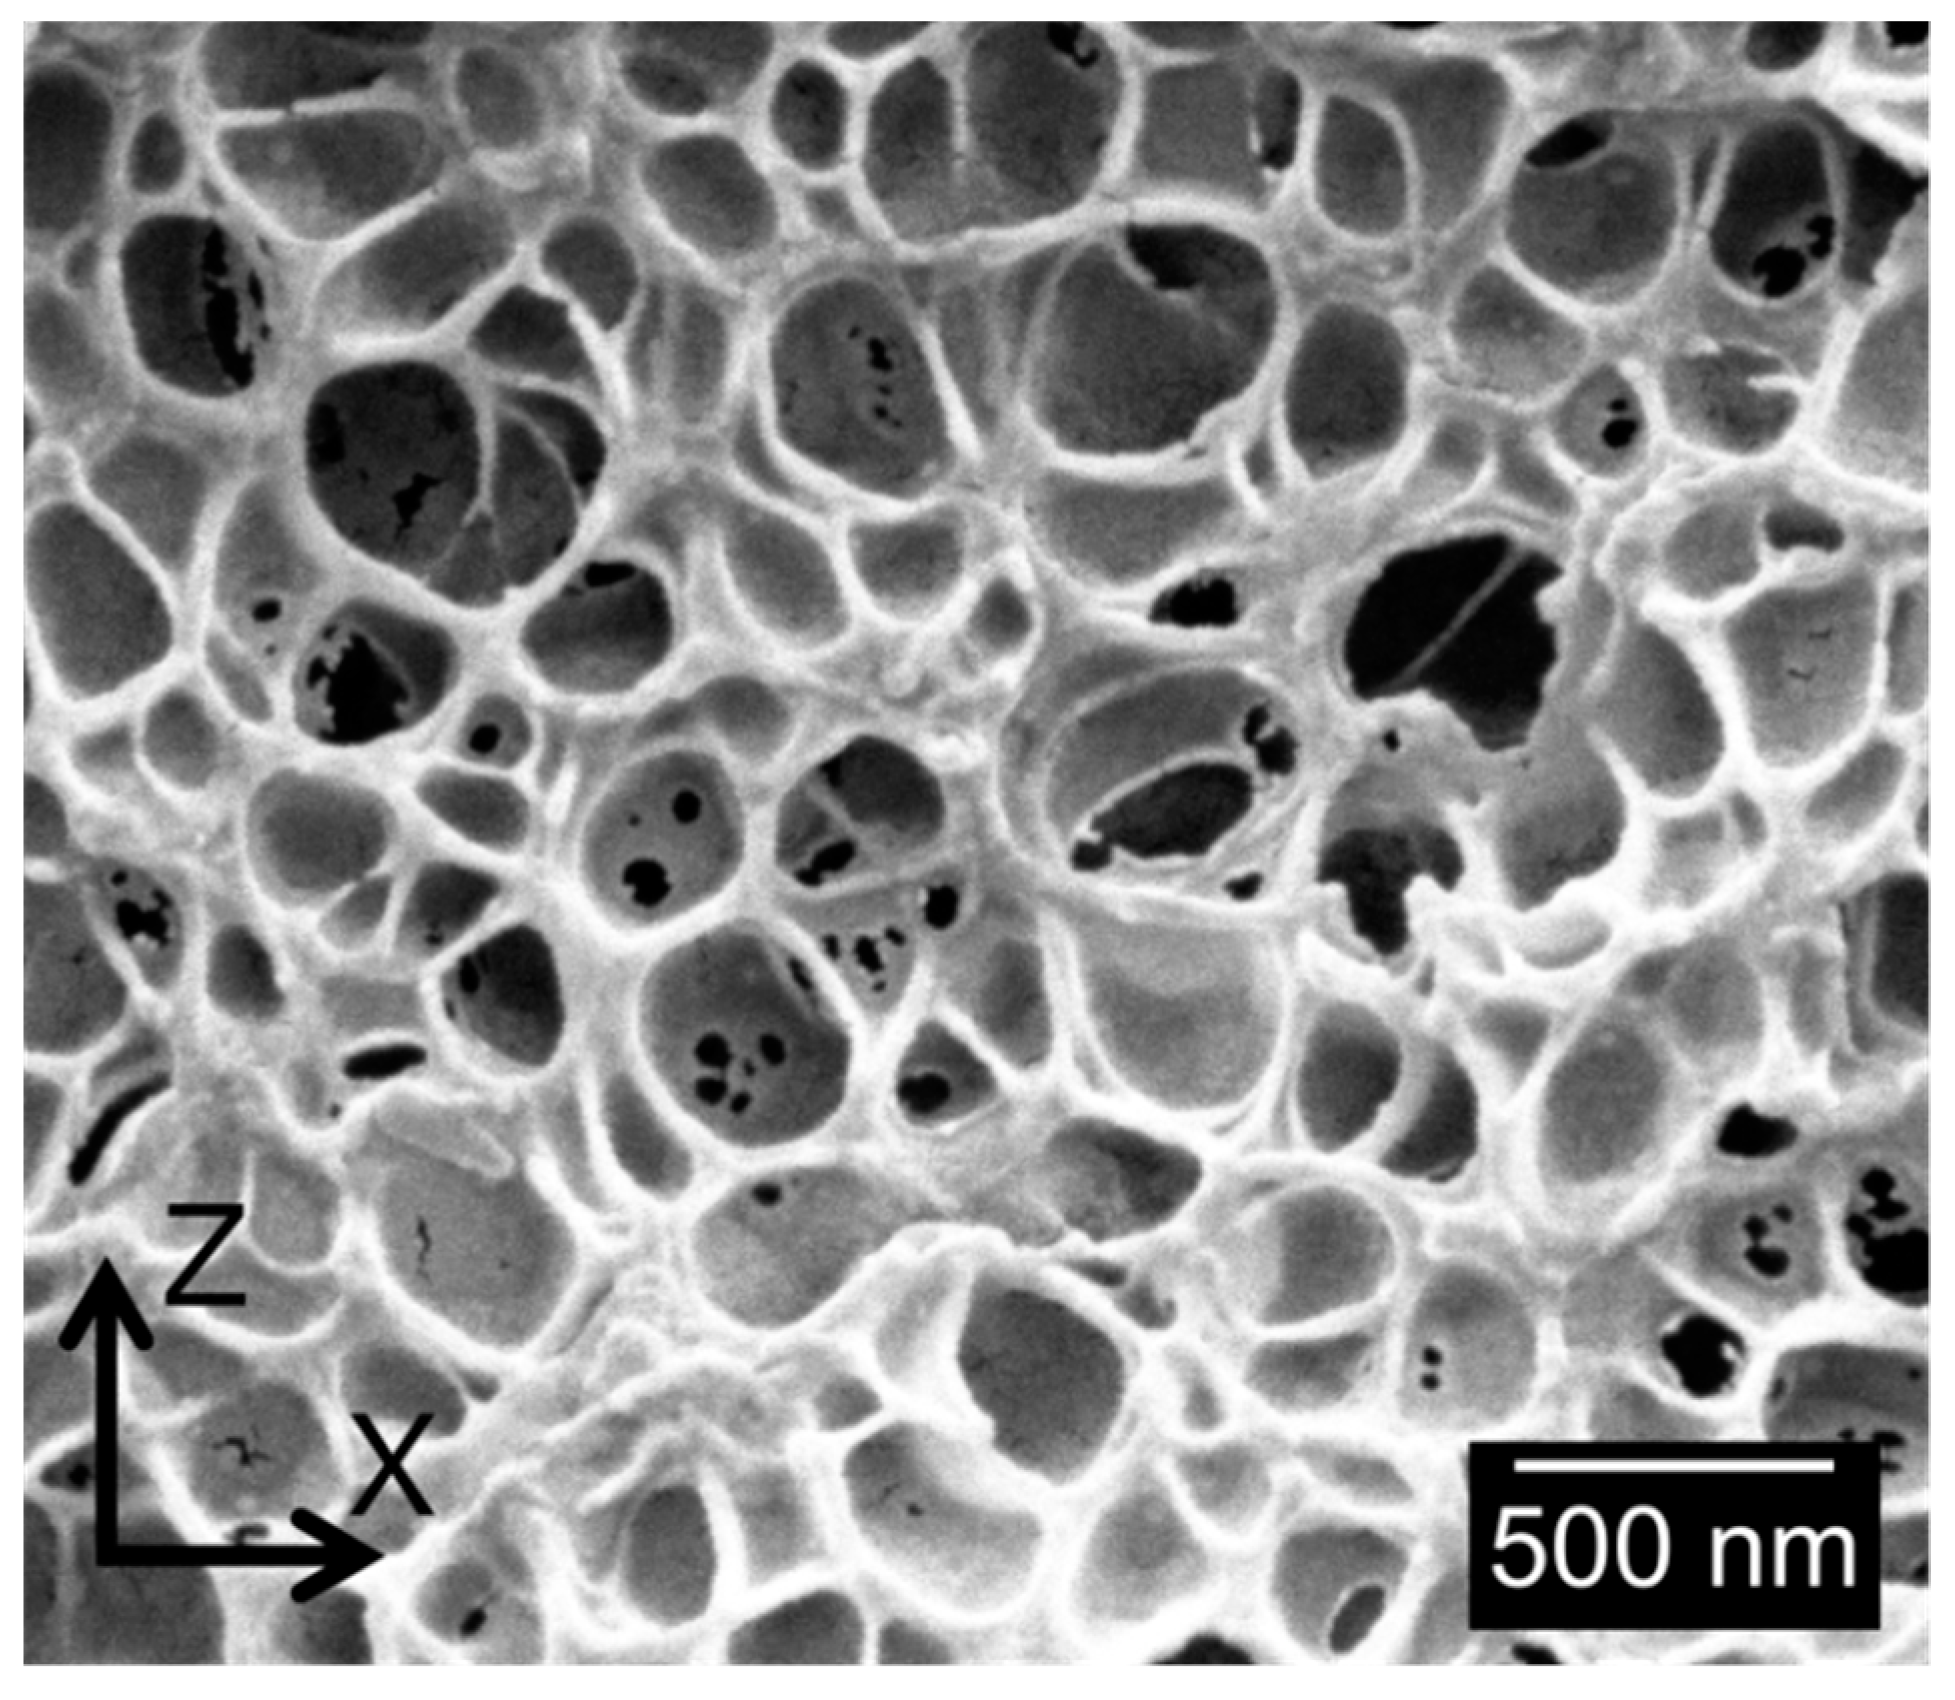
2.2.6. Scanning Electron Microscopy
2.2.7. Differential Scanning Calorimetry
3. Results
3.1. Influence of the Foaming Temperature and Time
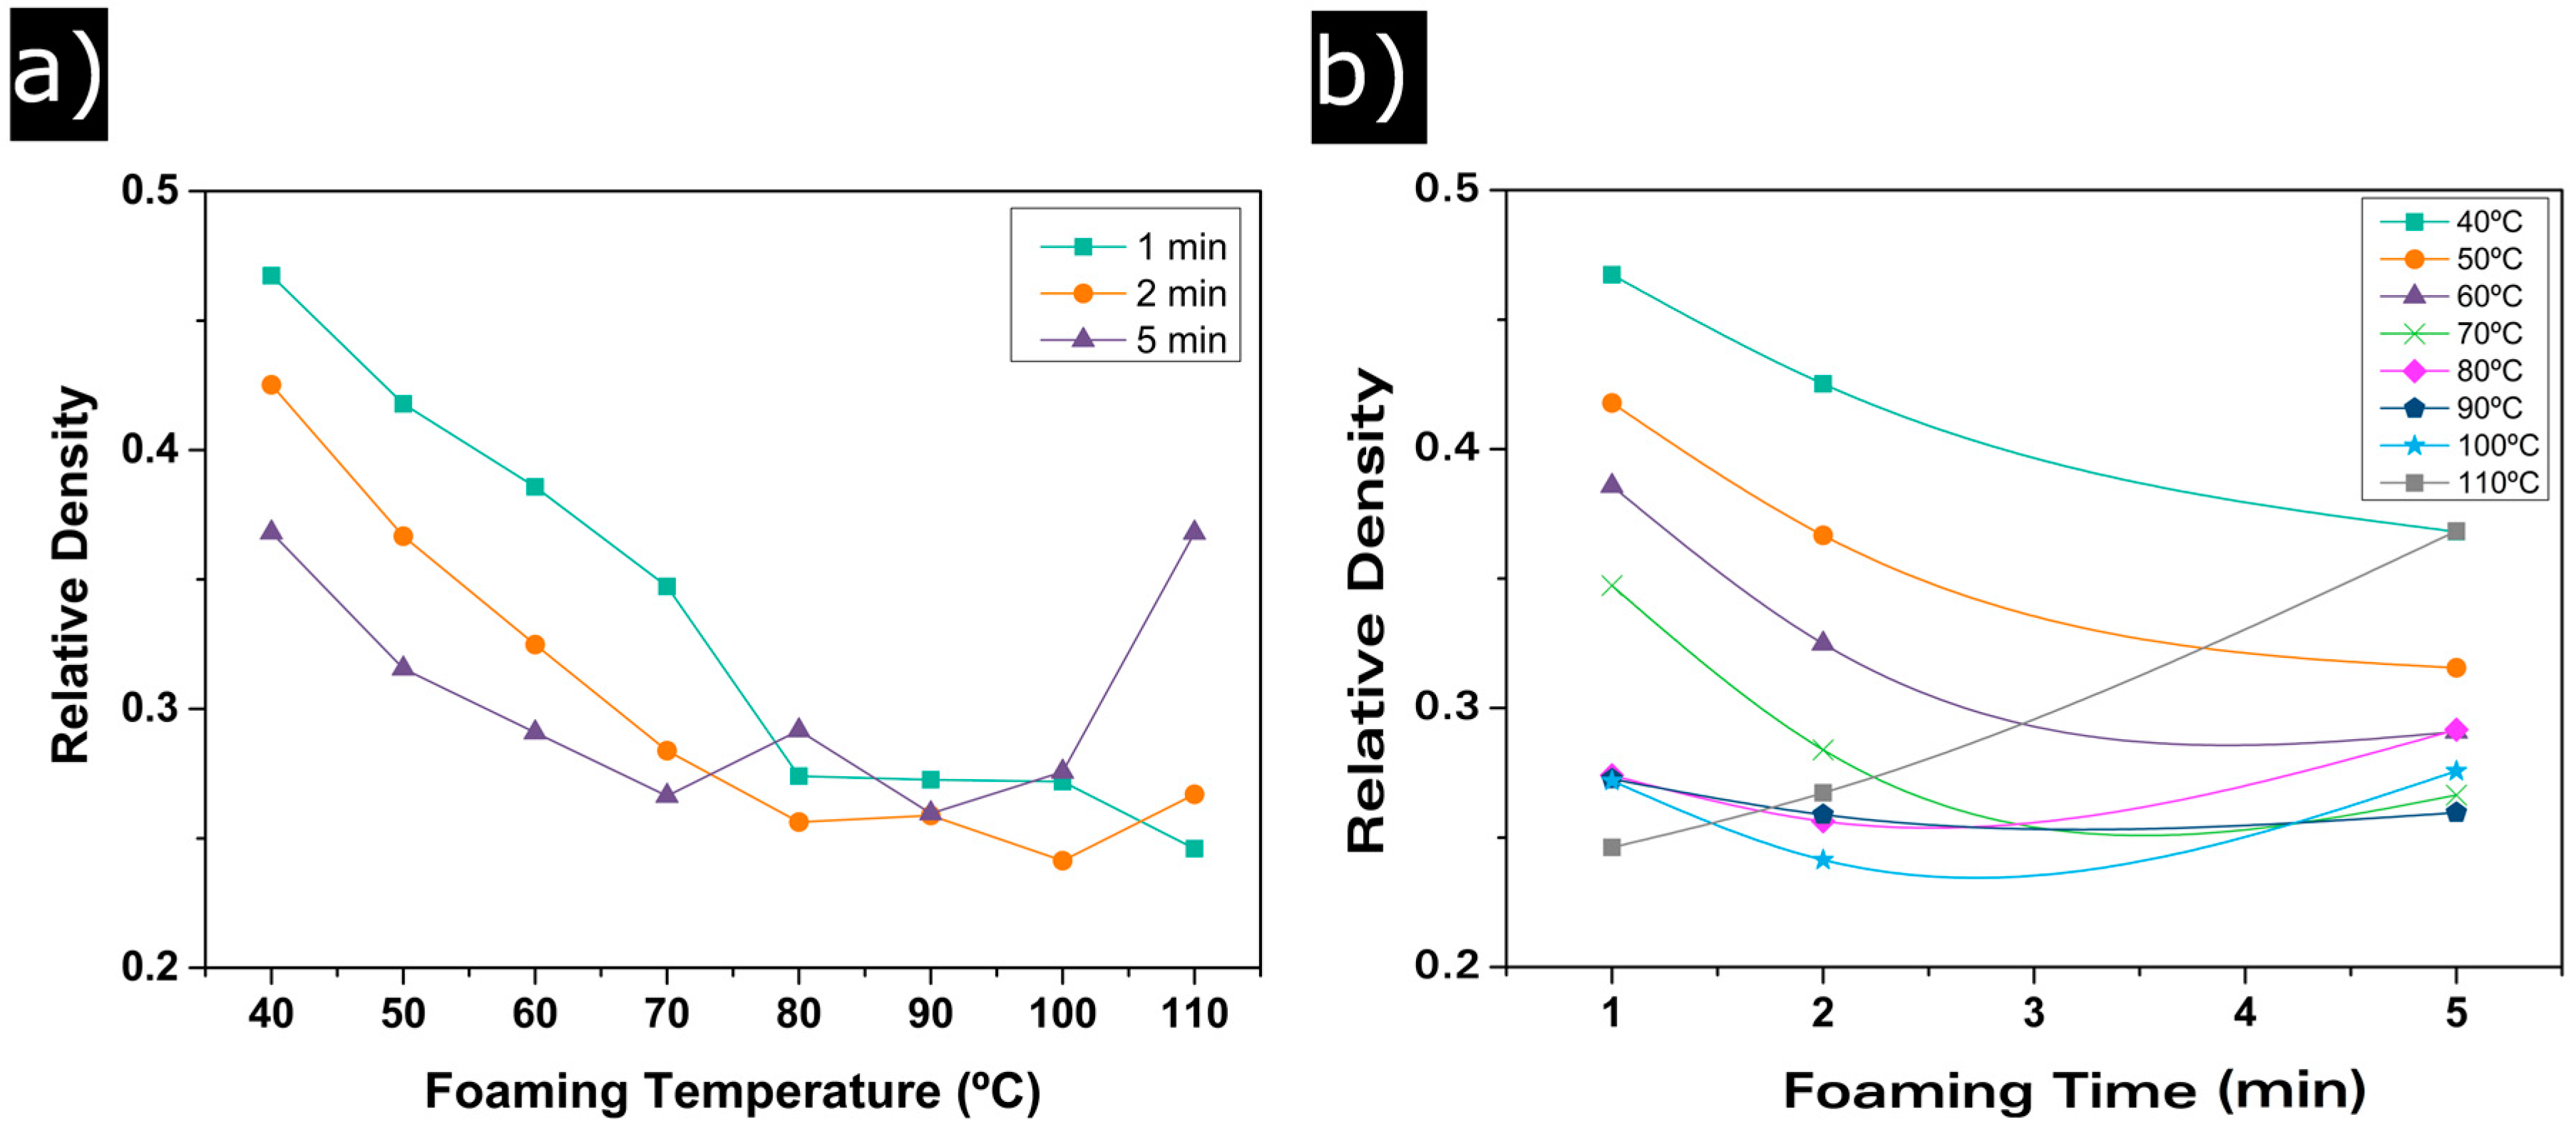
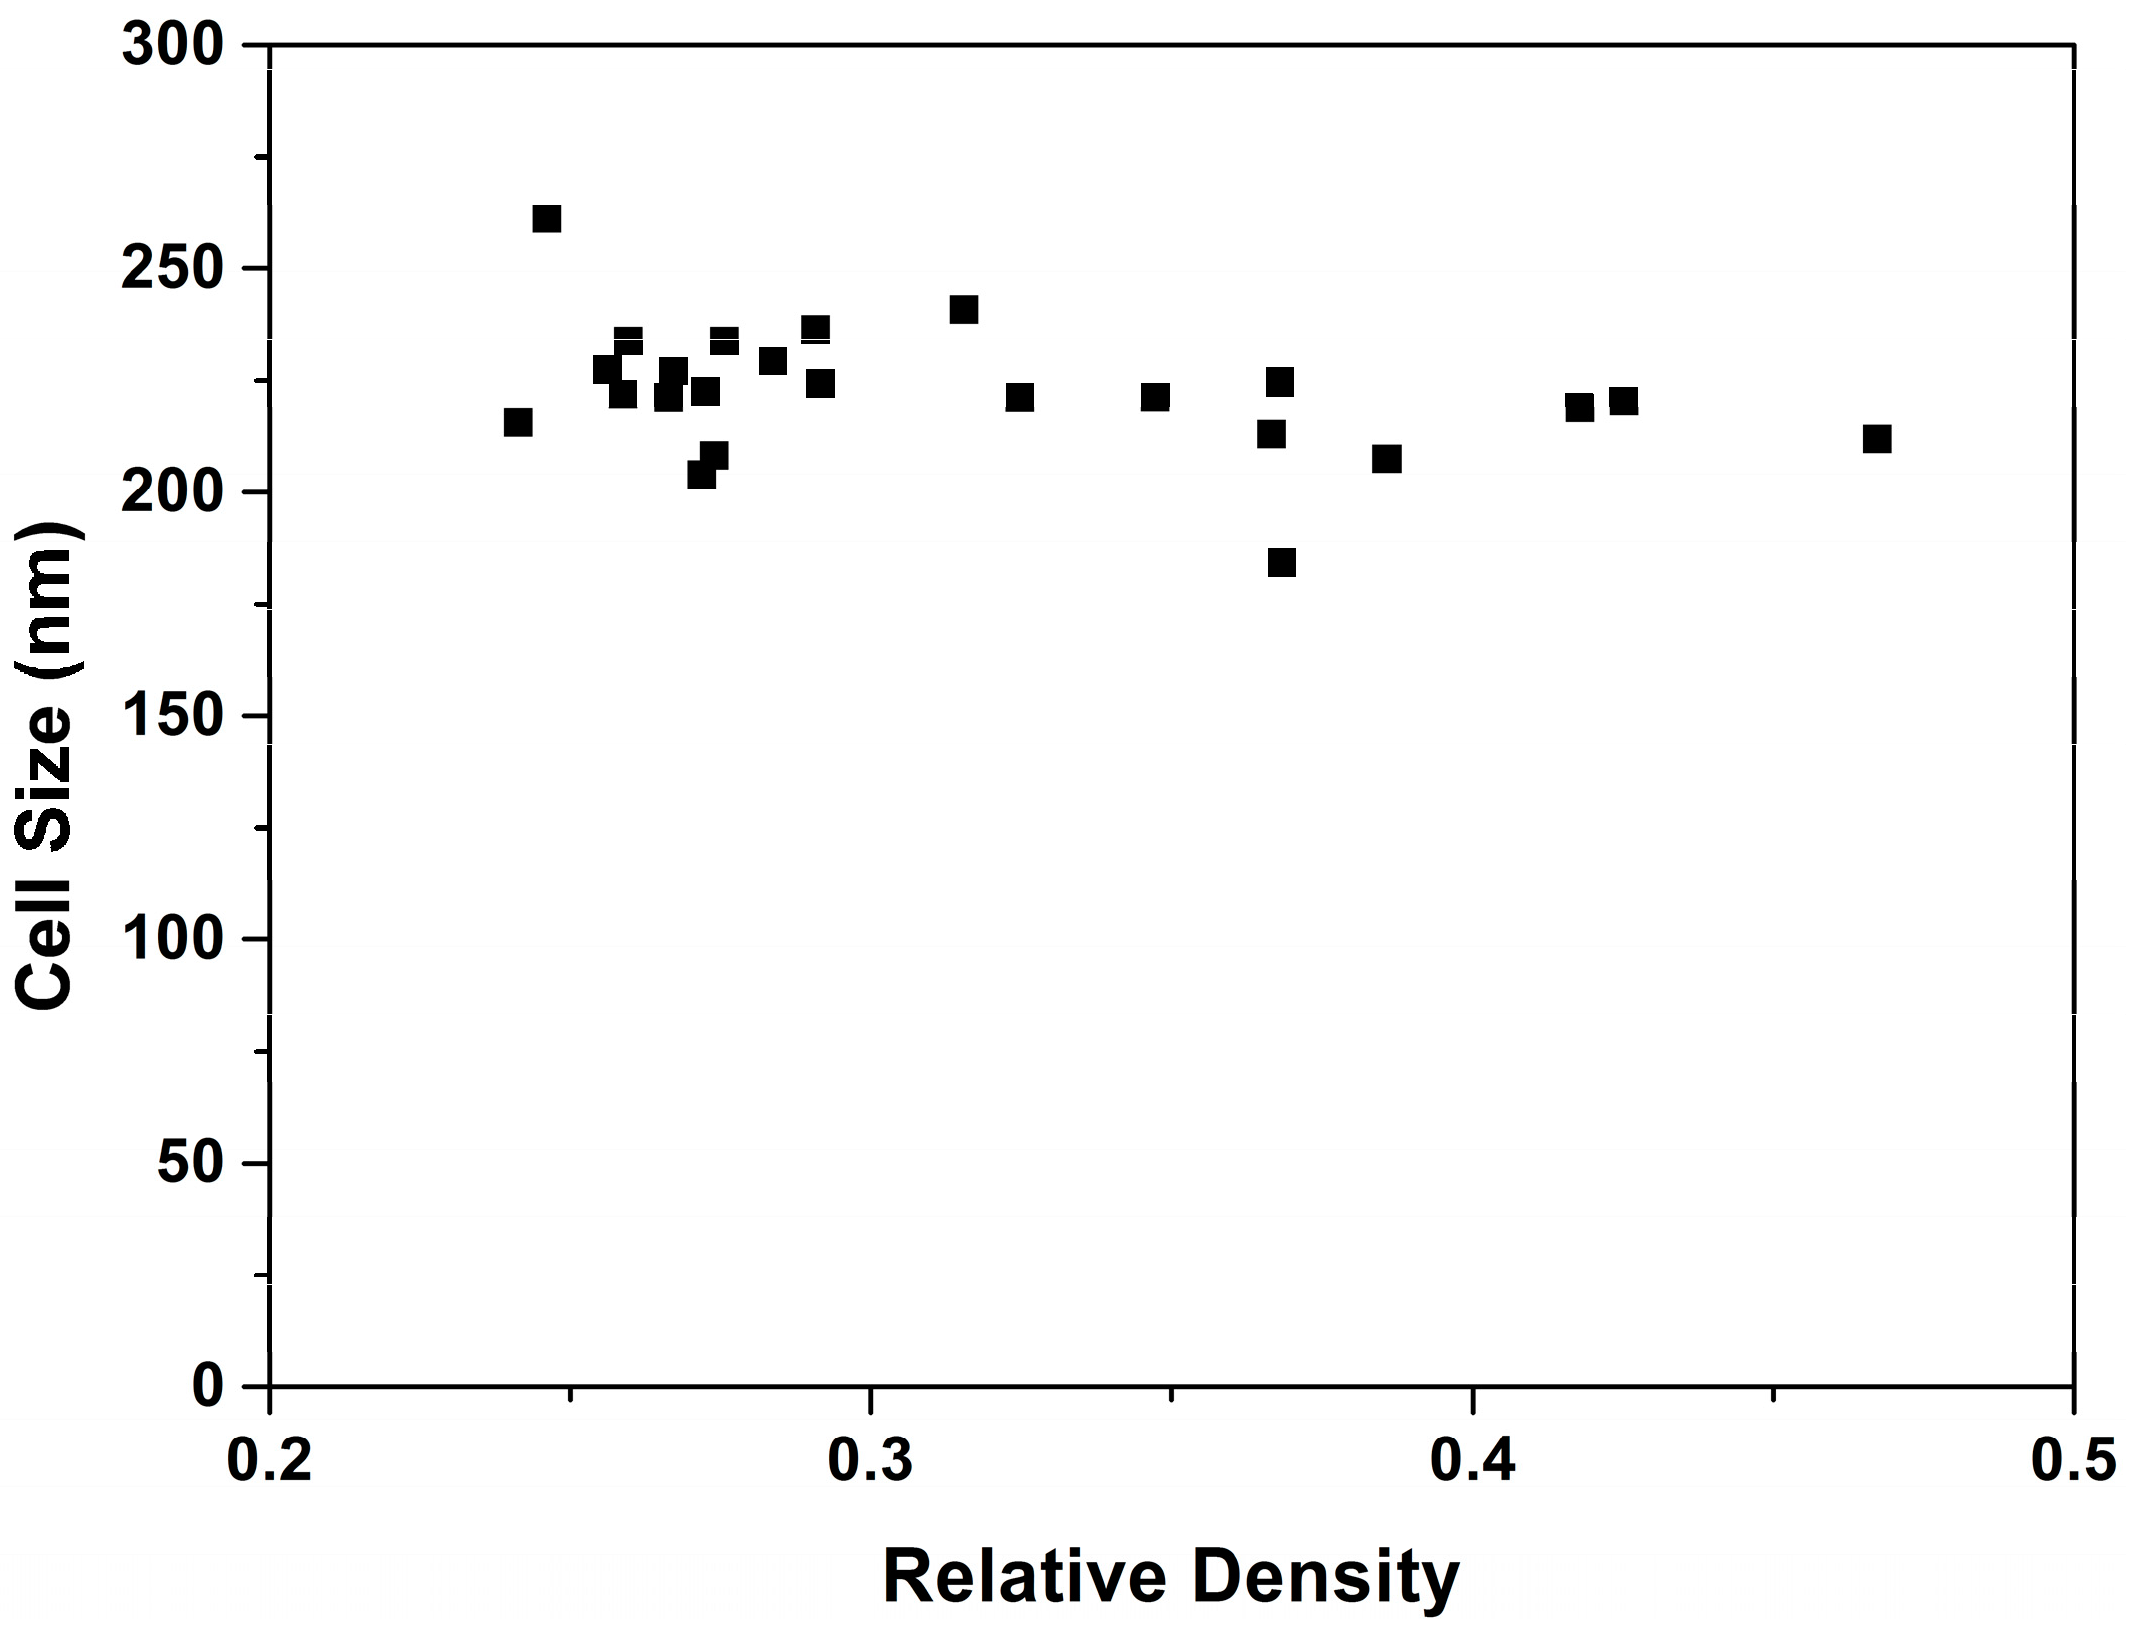
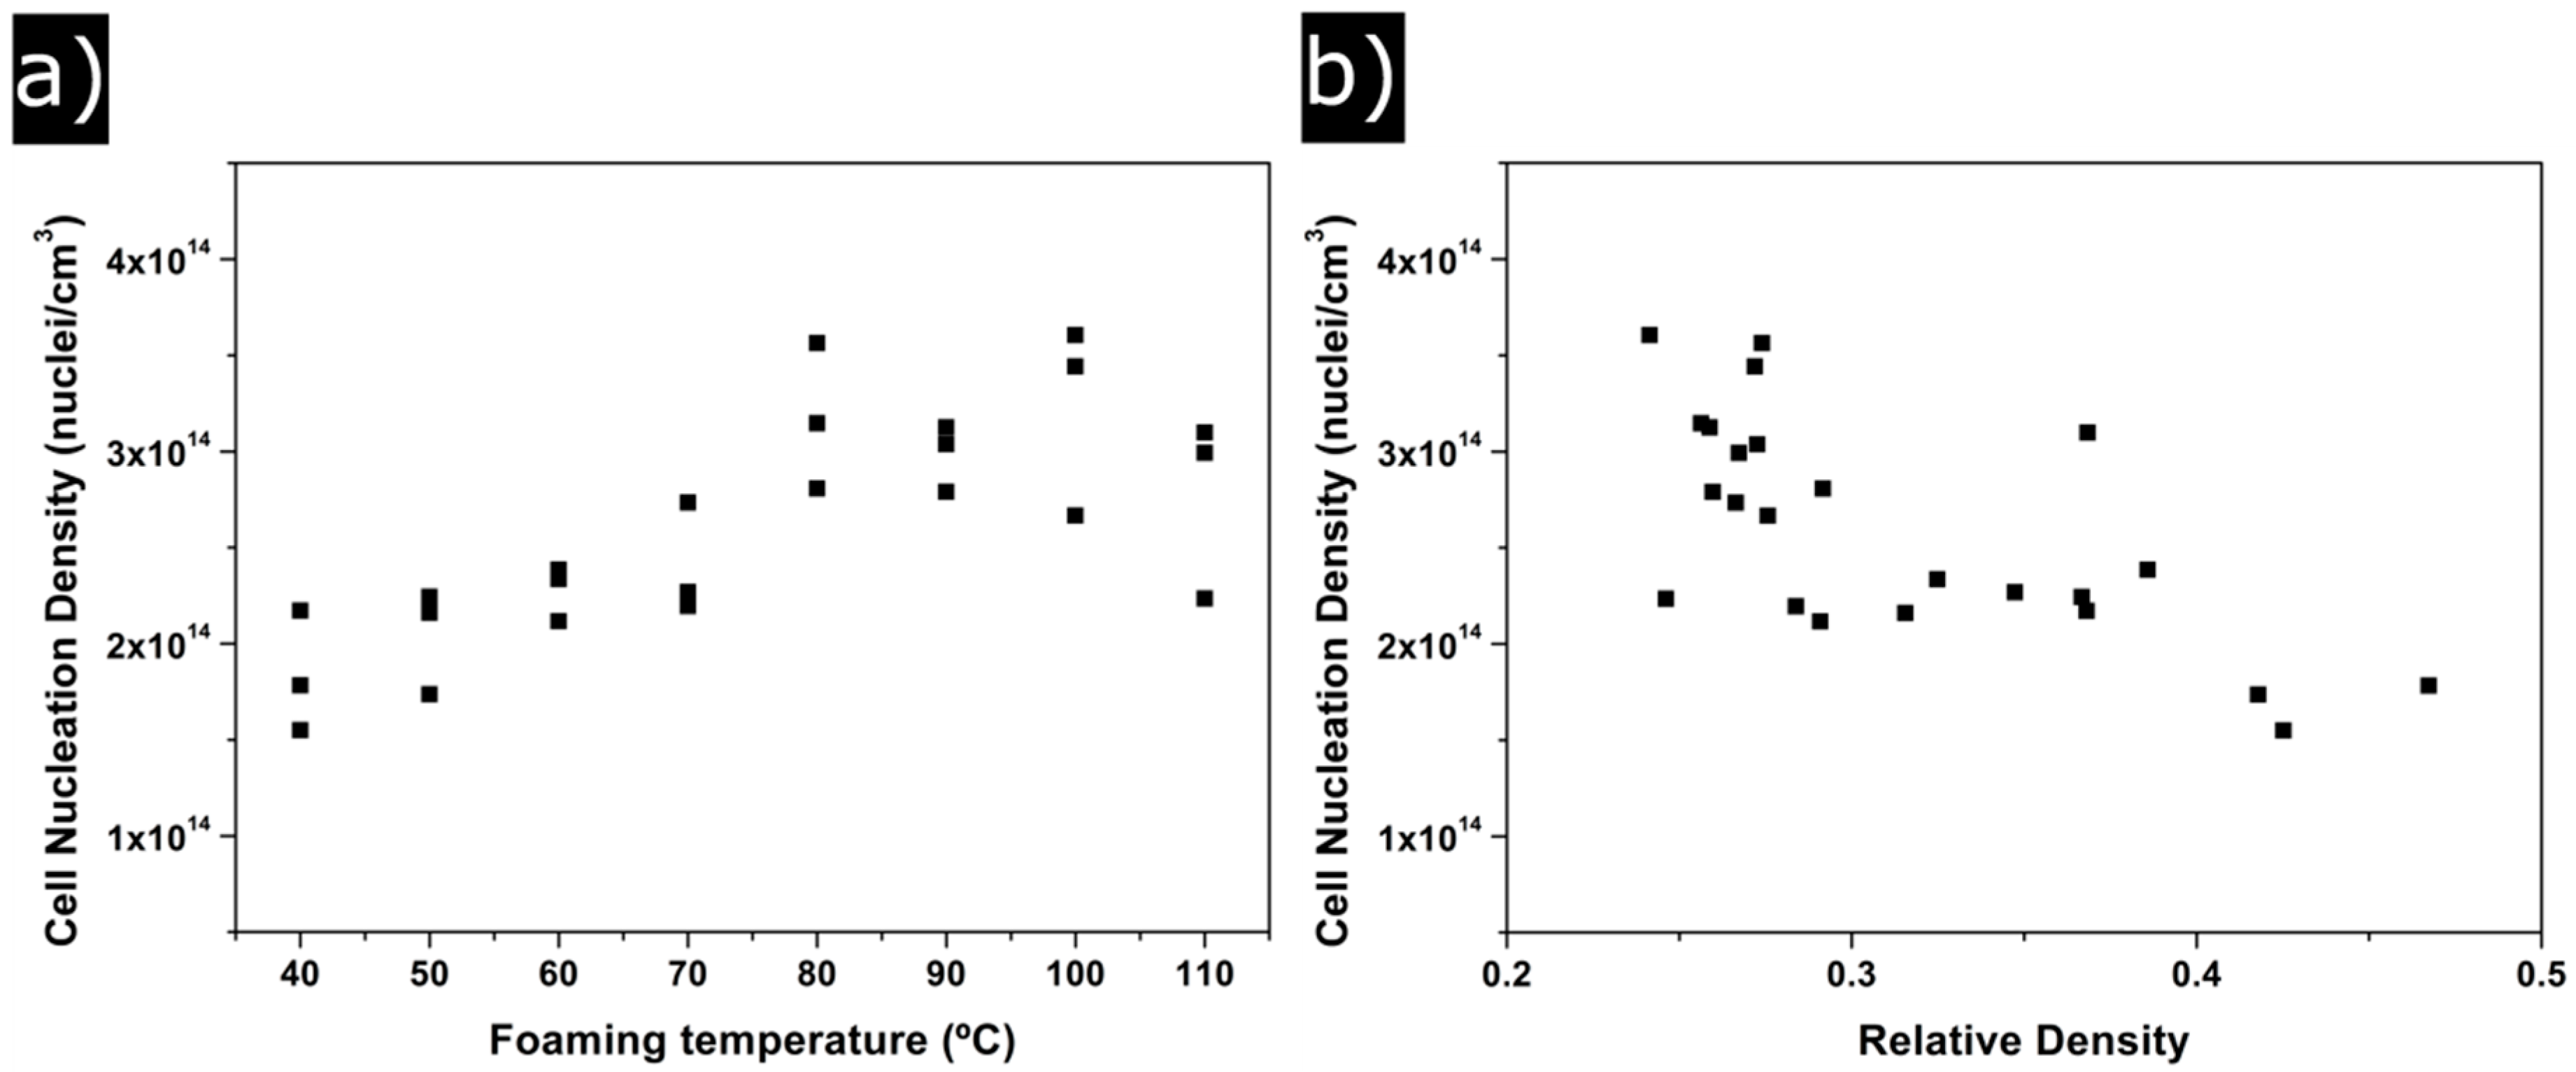
3.1.1. Relative Density
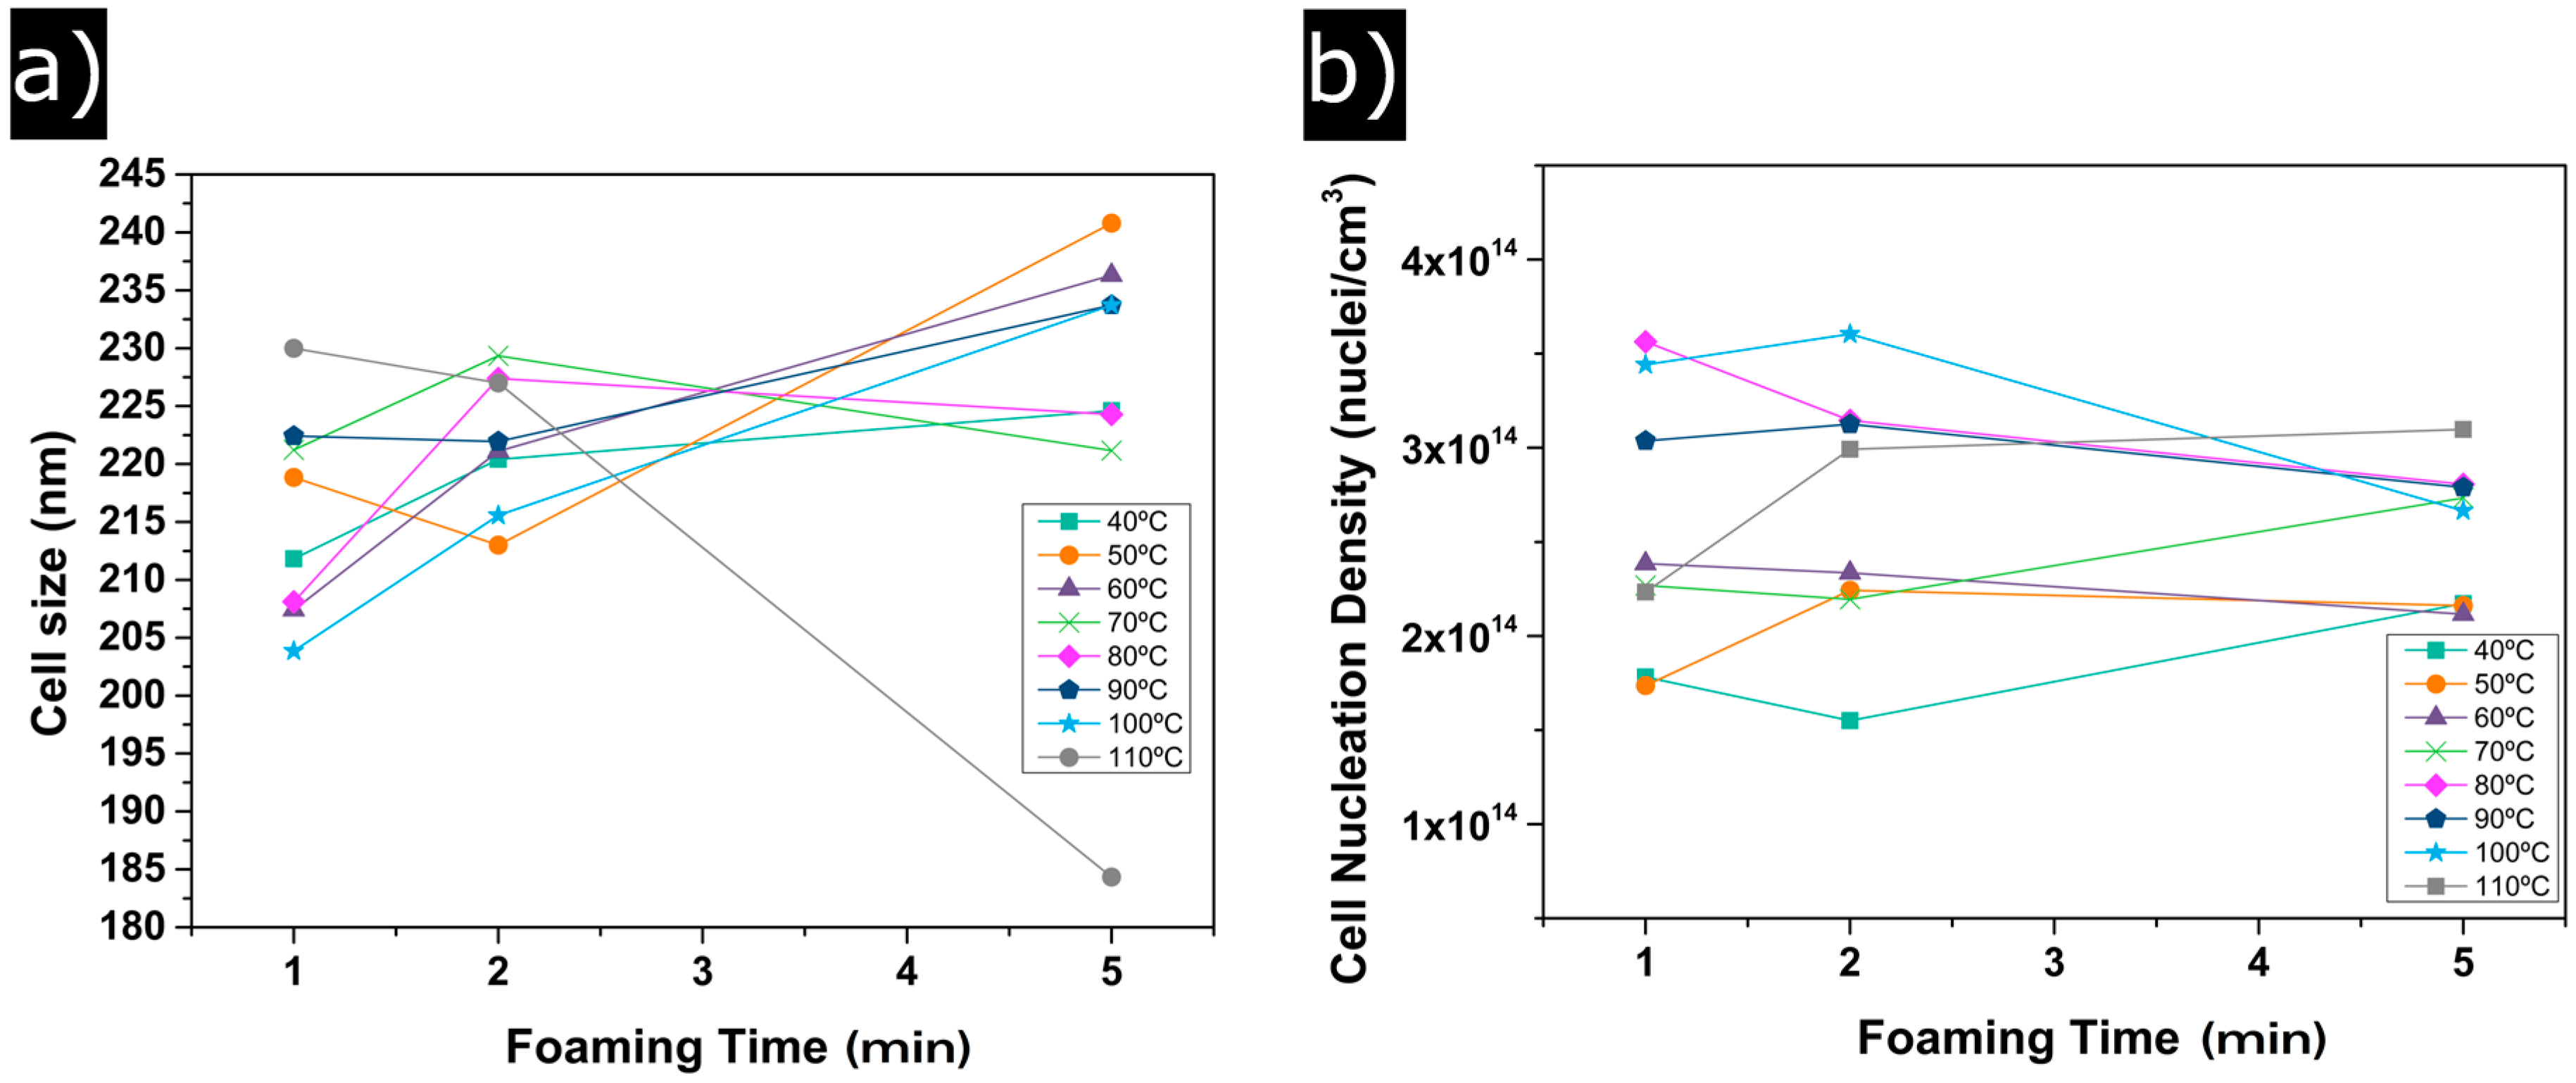
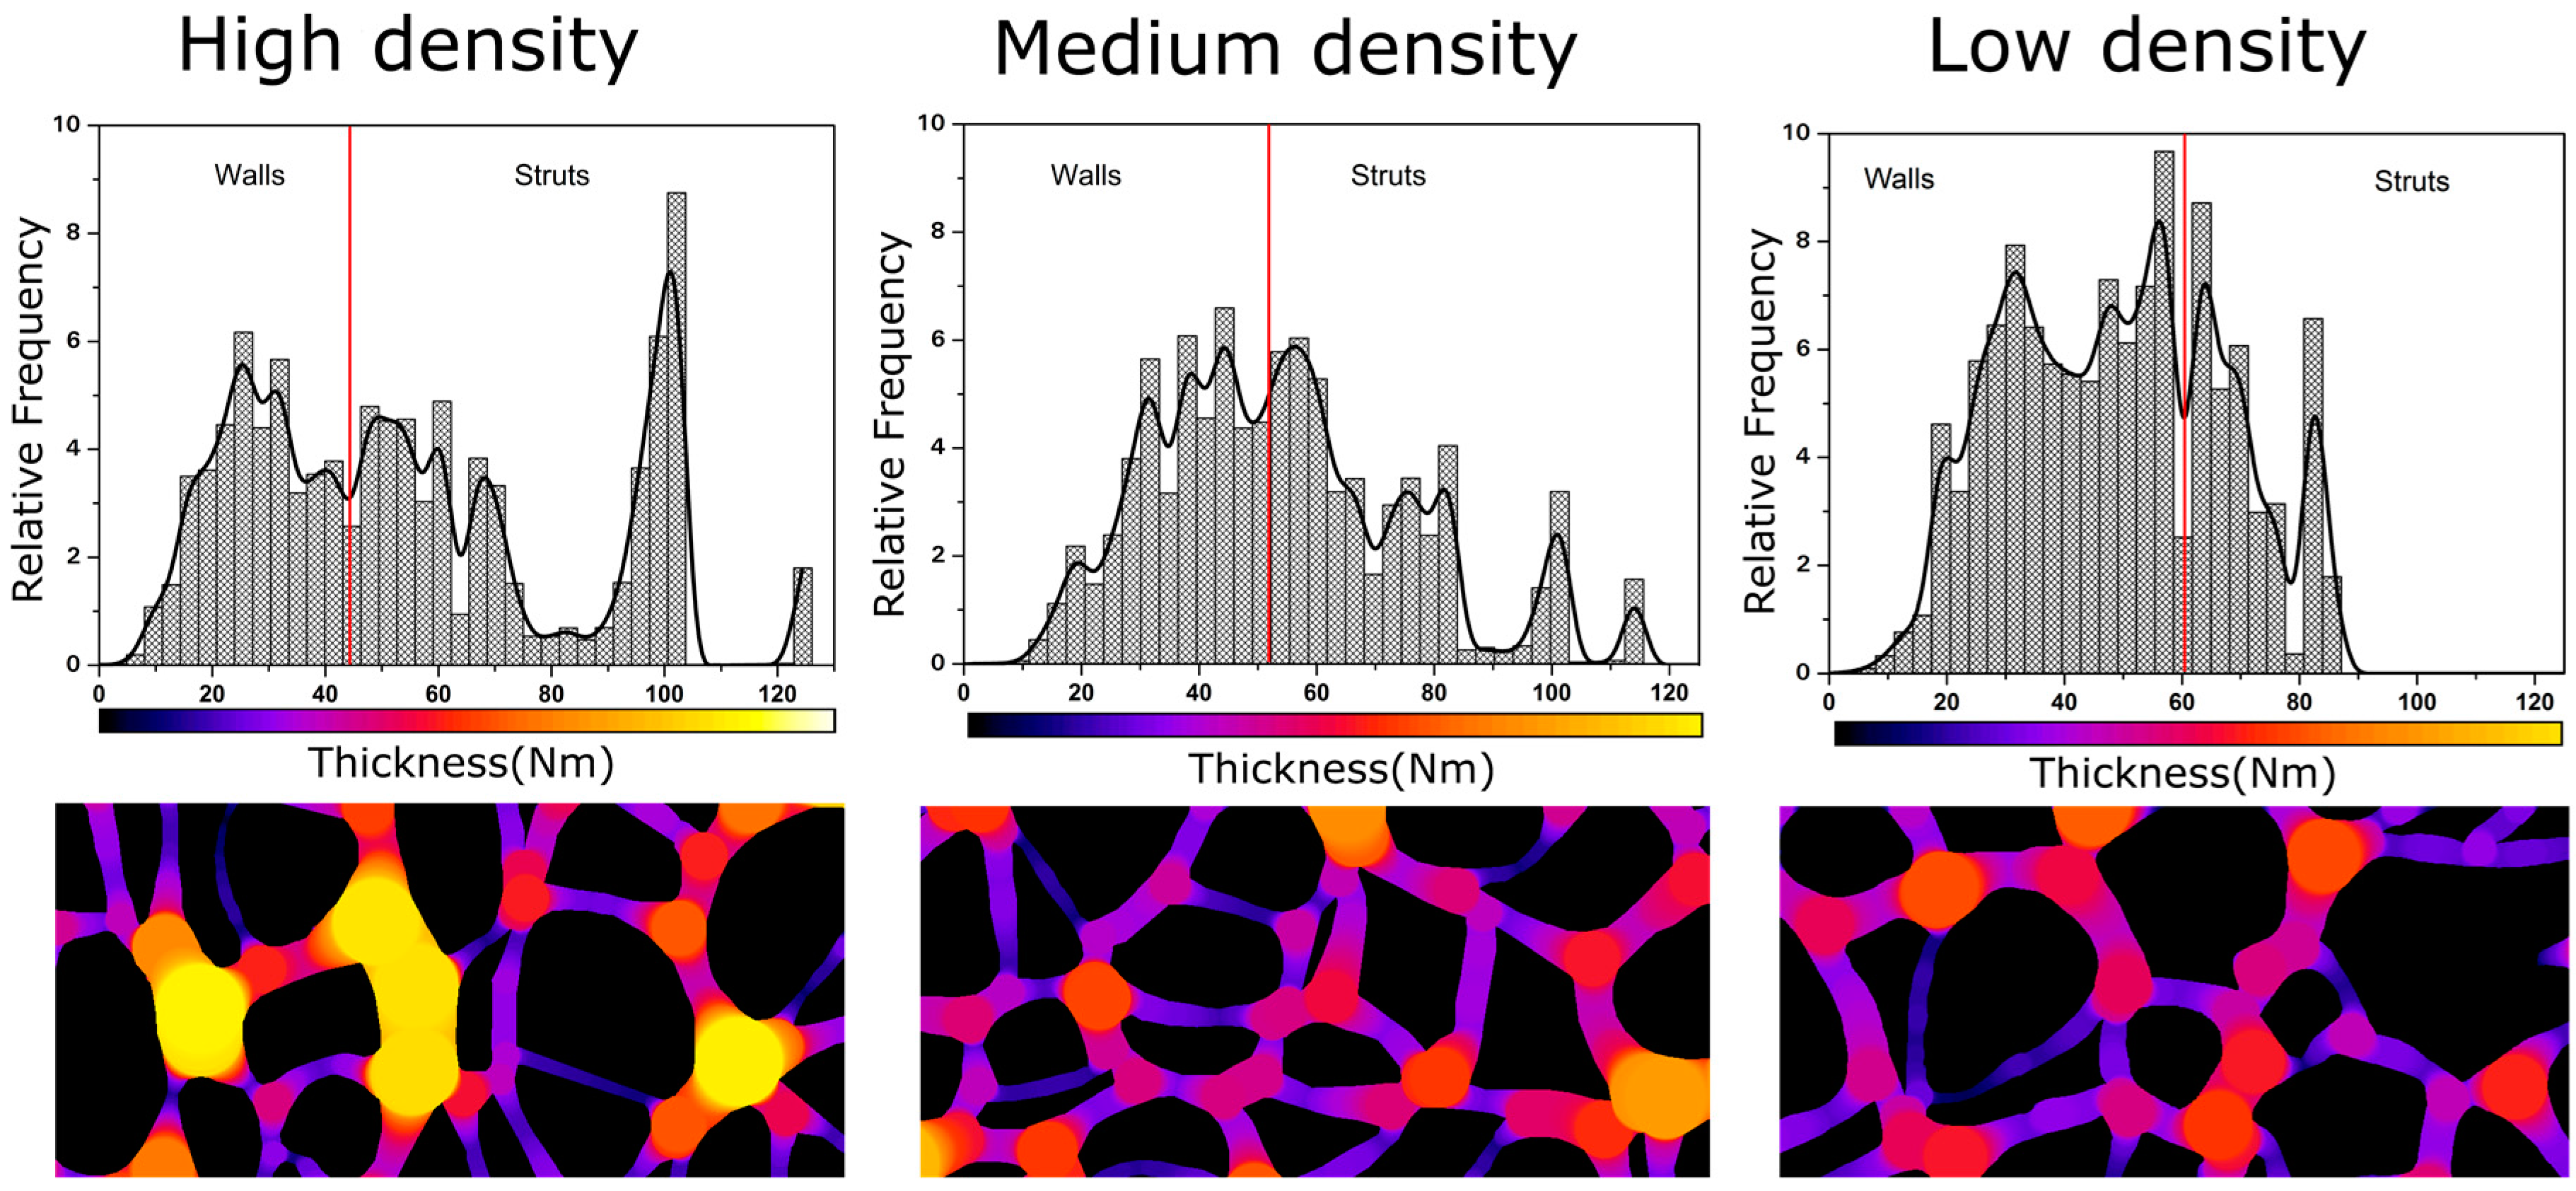
3.1.2. Cellular Structure
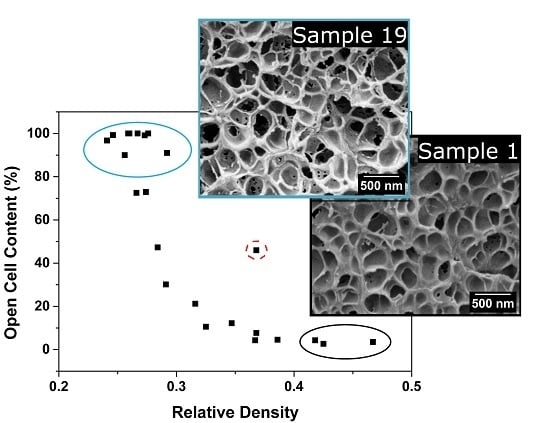
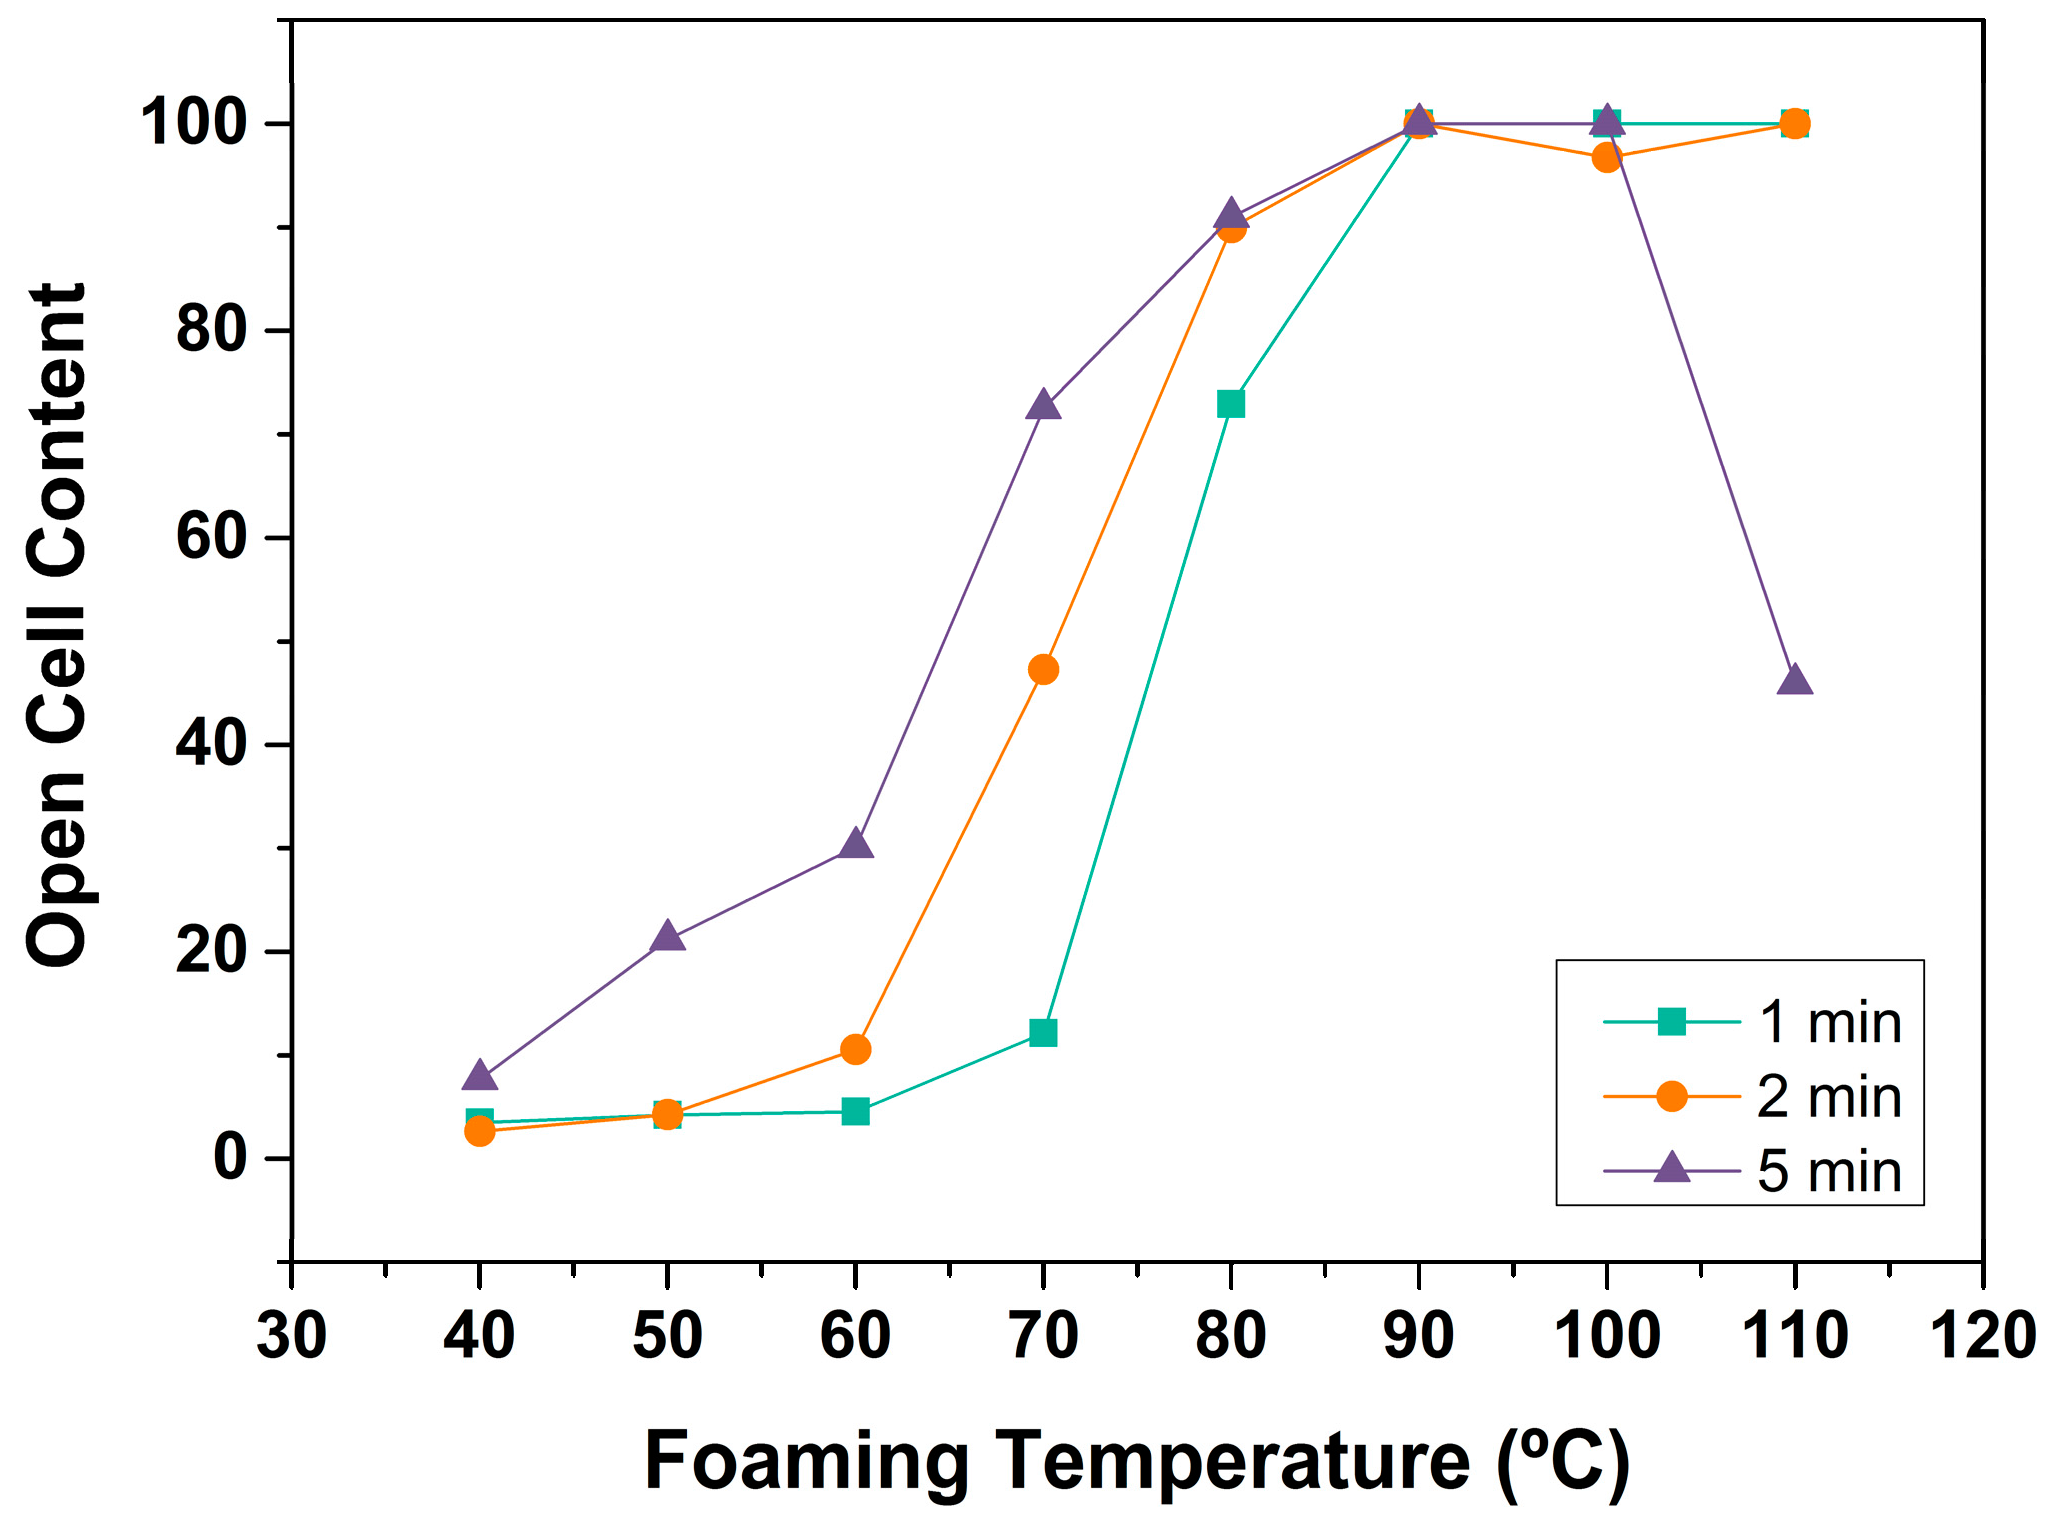
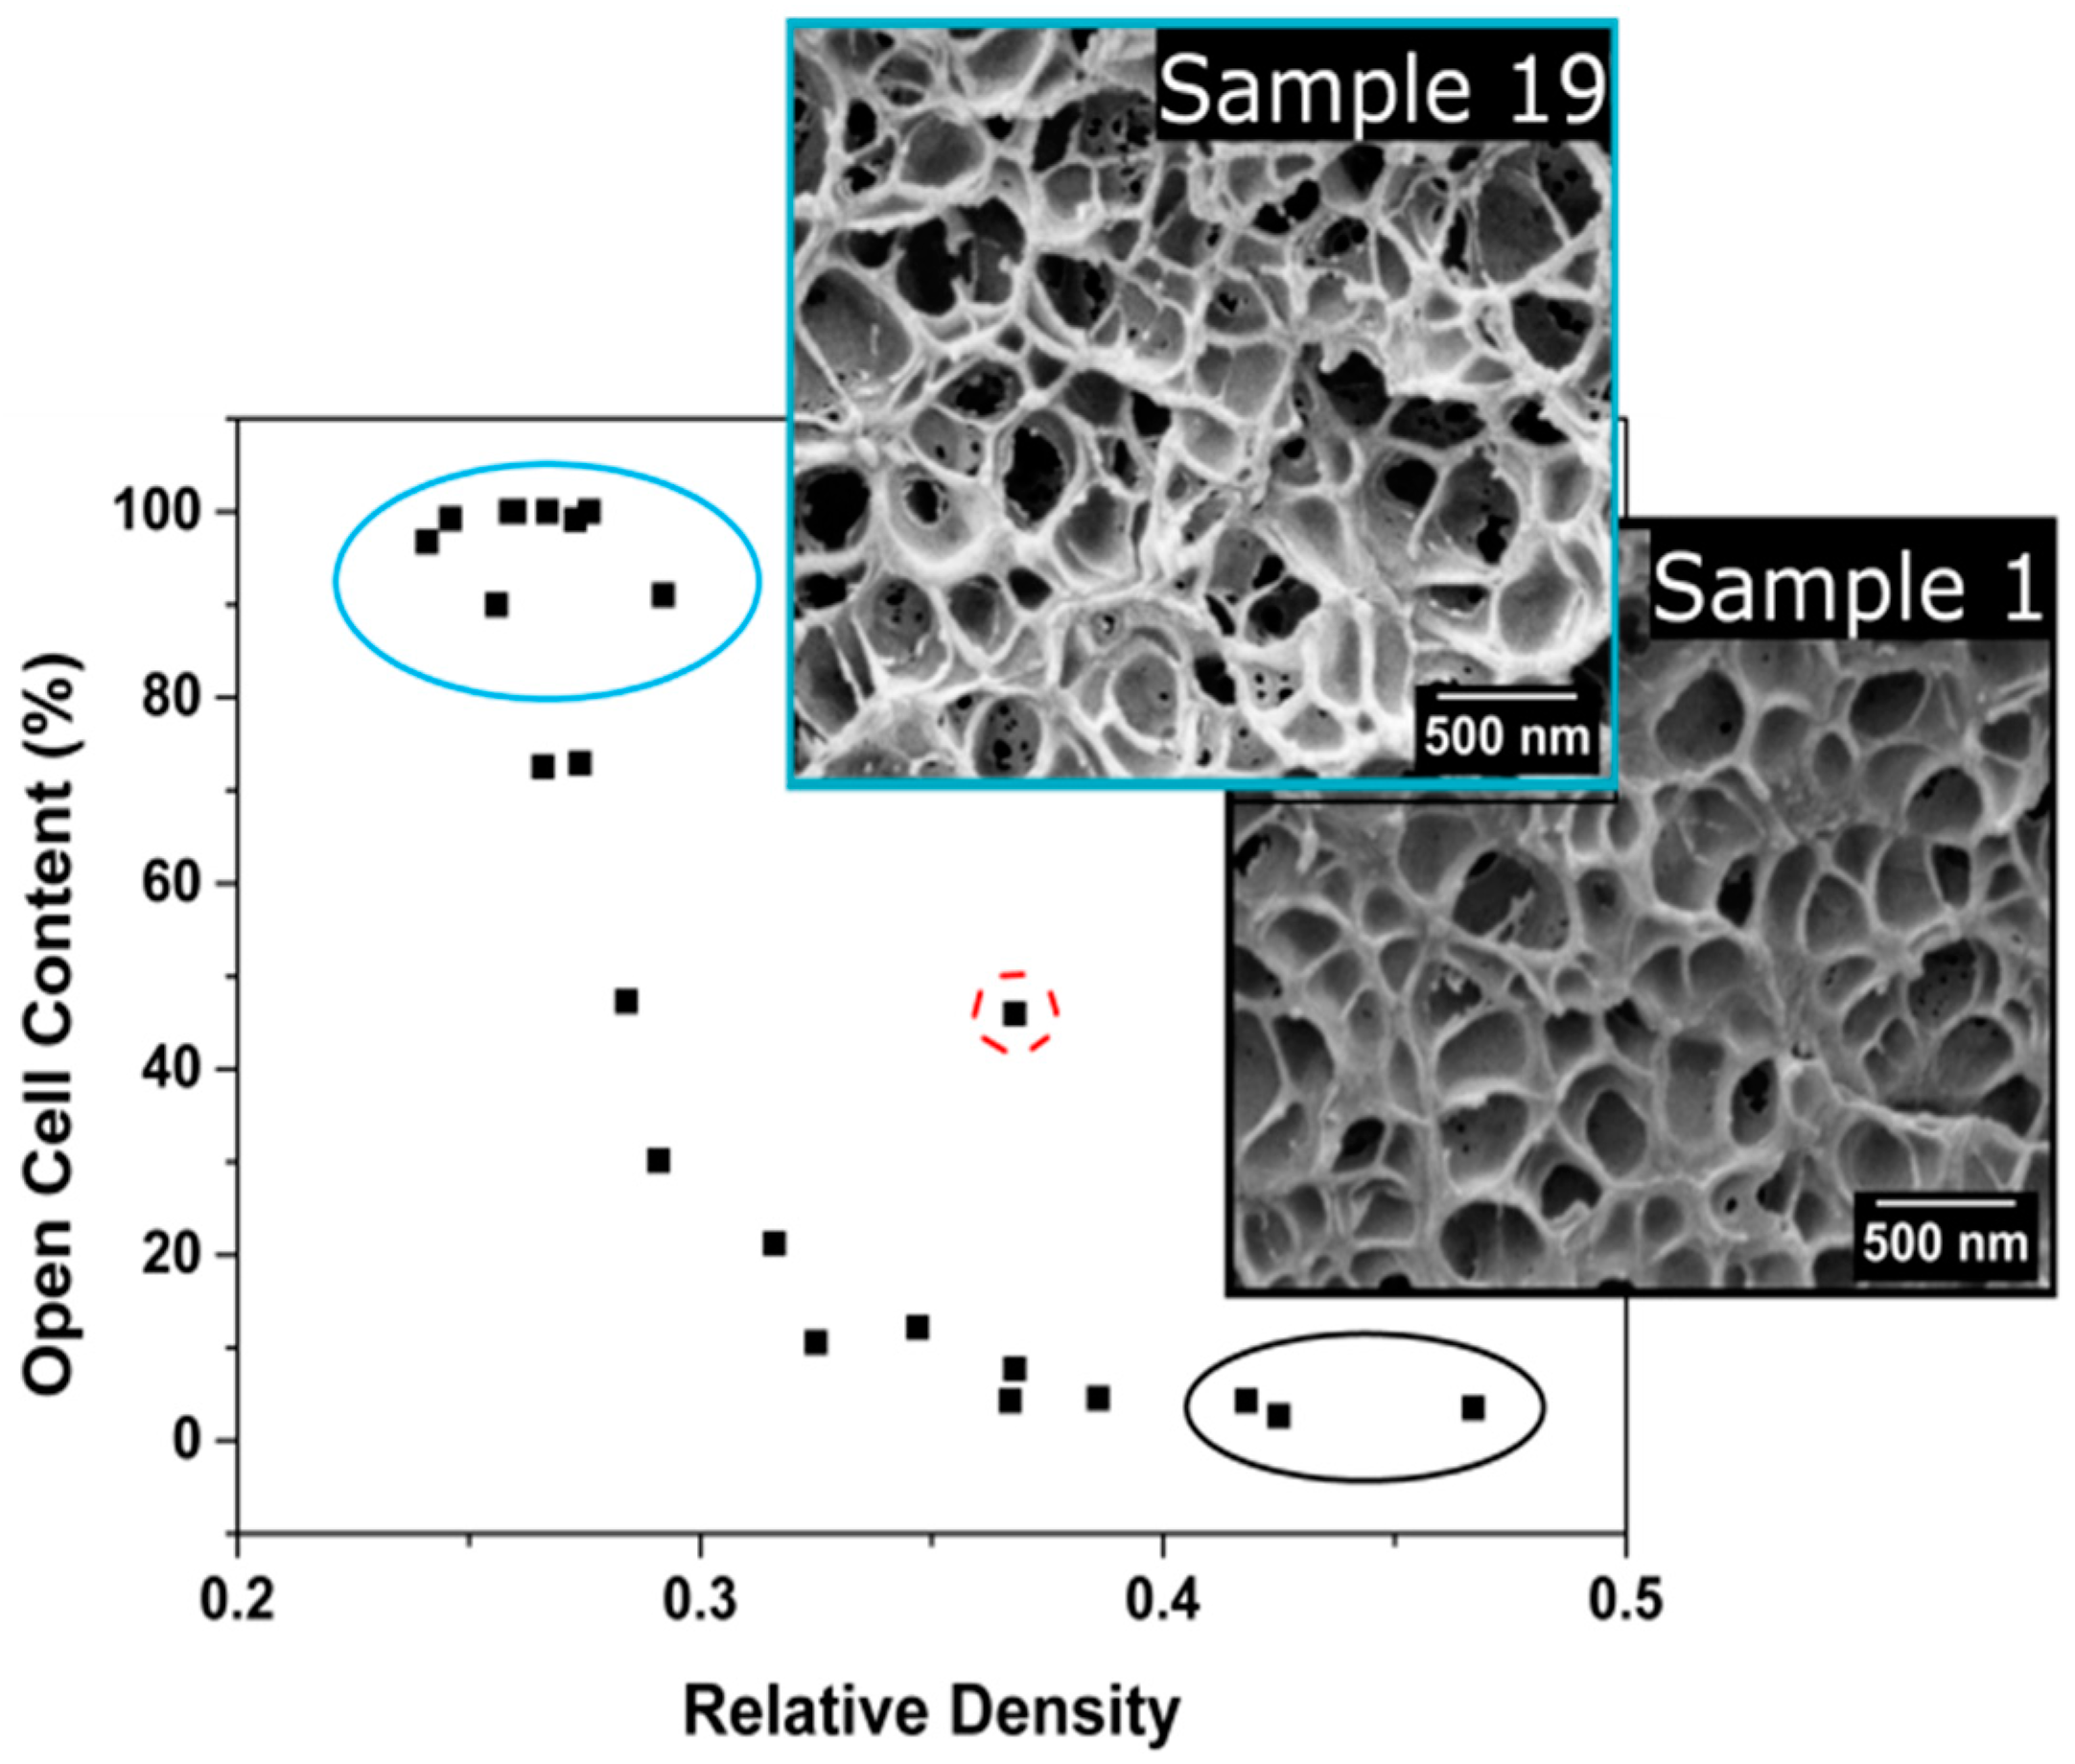
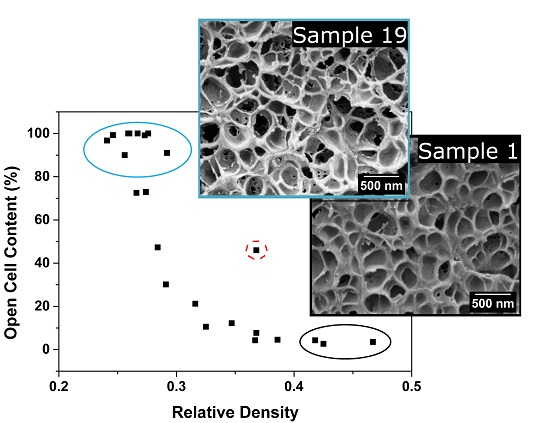
3.1.3. Open Cell Content
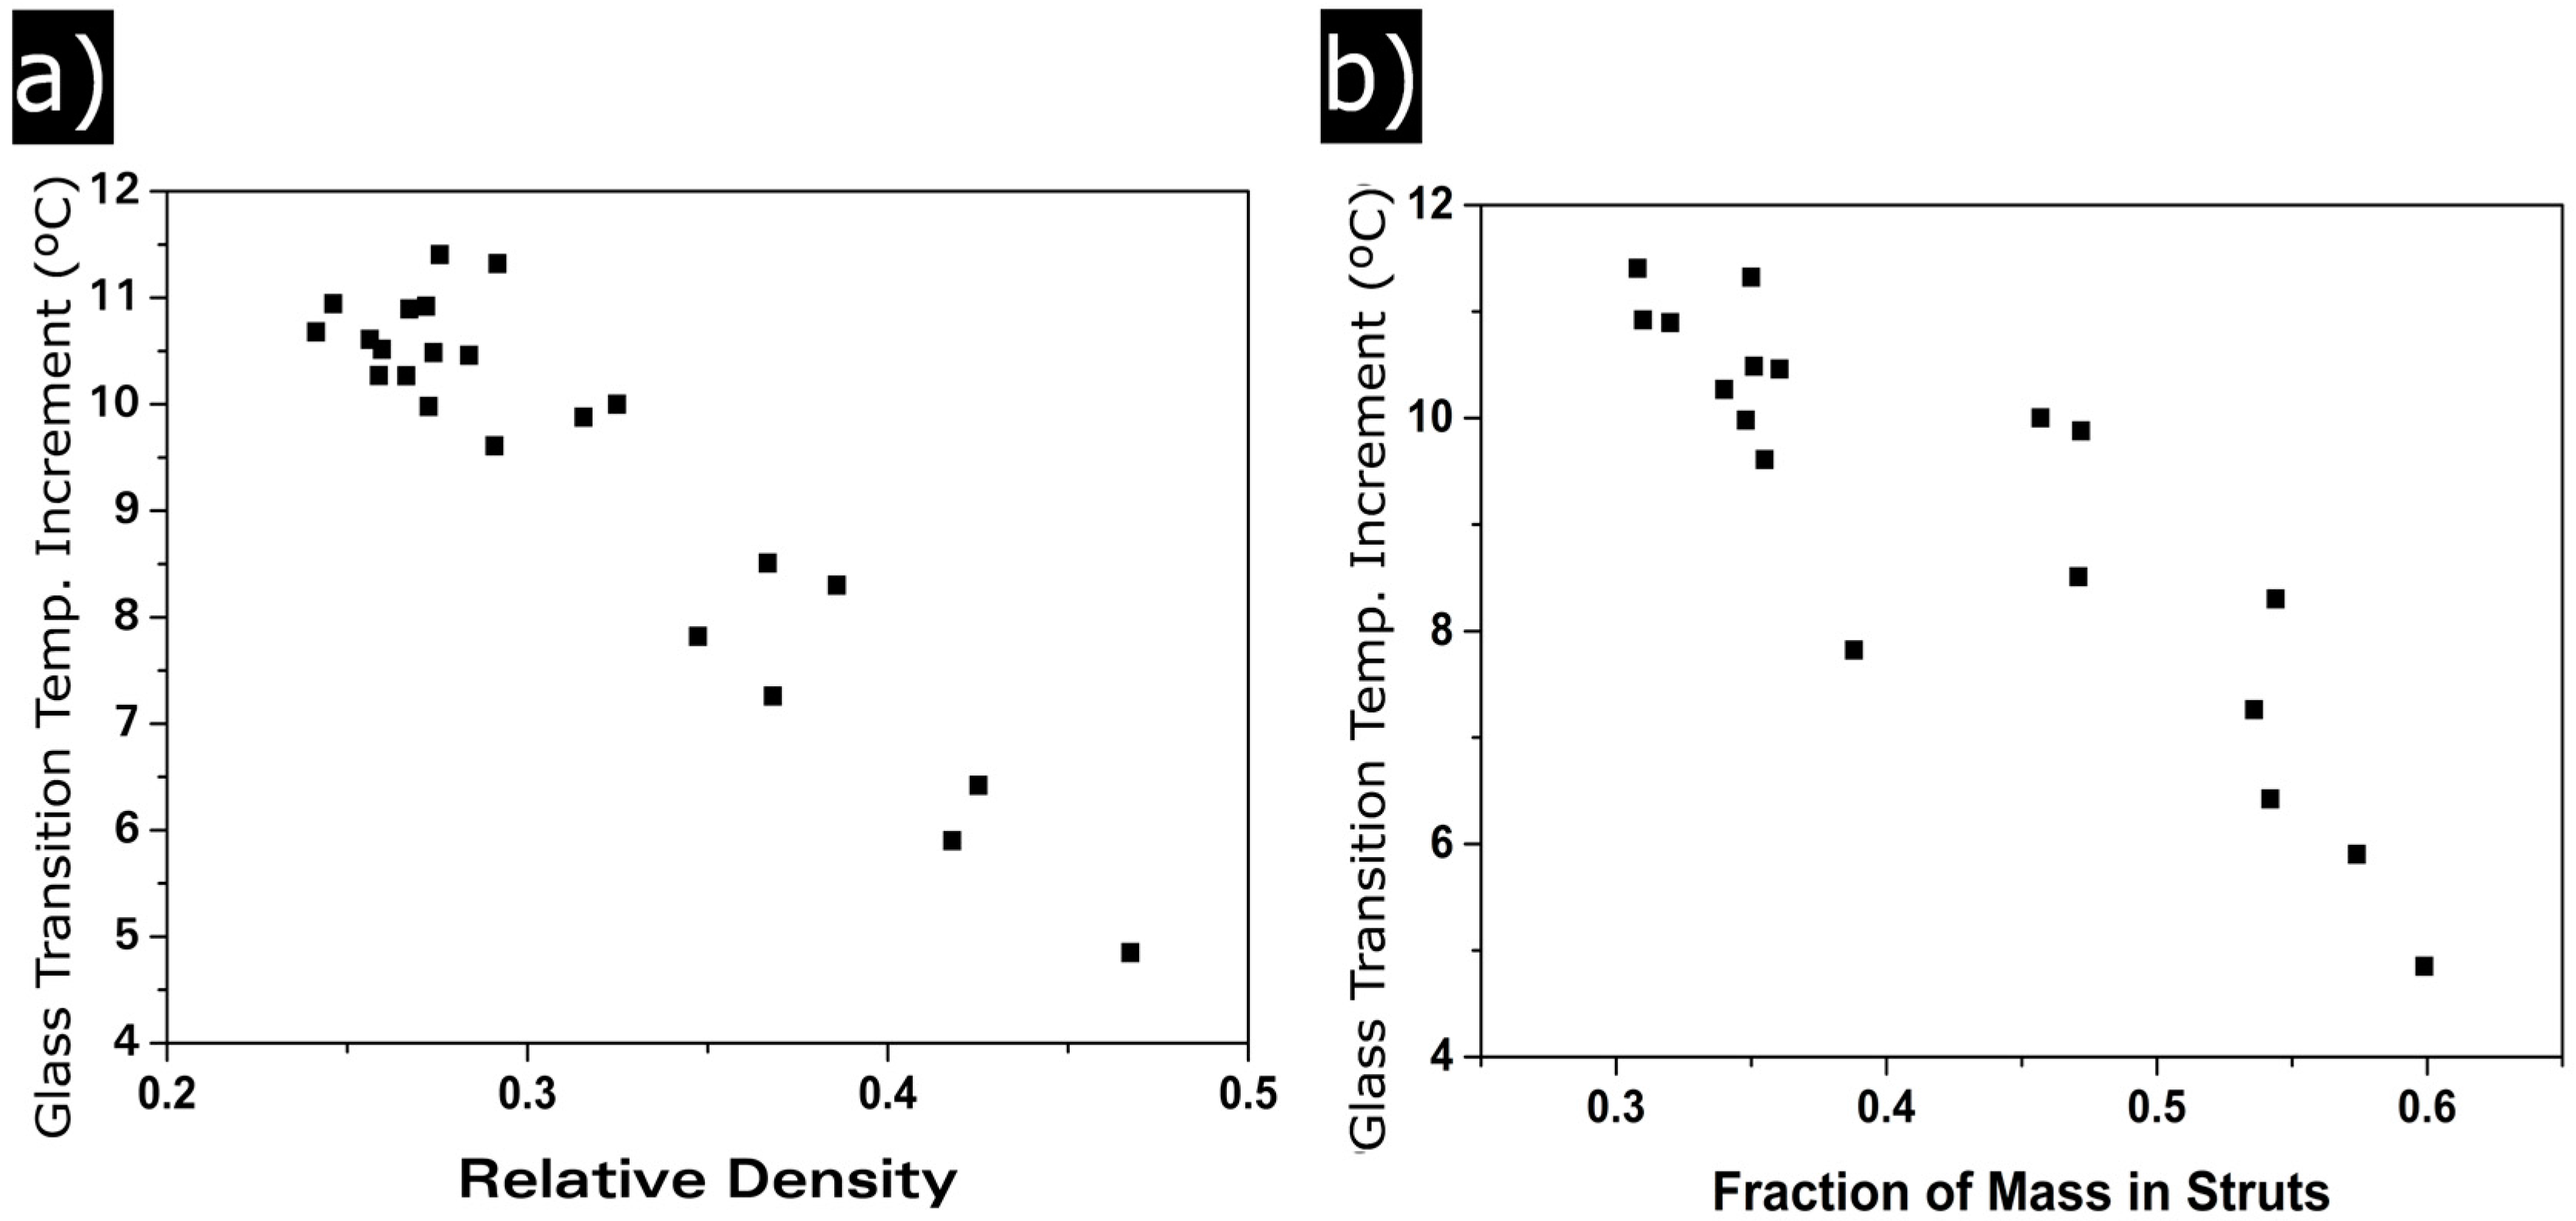
3.1.4. Glass Transition Temperature
4. Discussion
4.1. Gaseous Phase
Open Cell Content
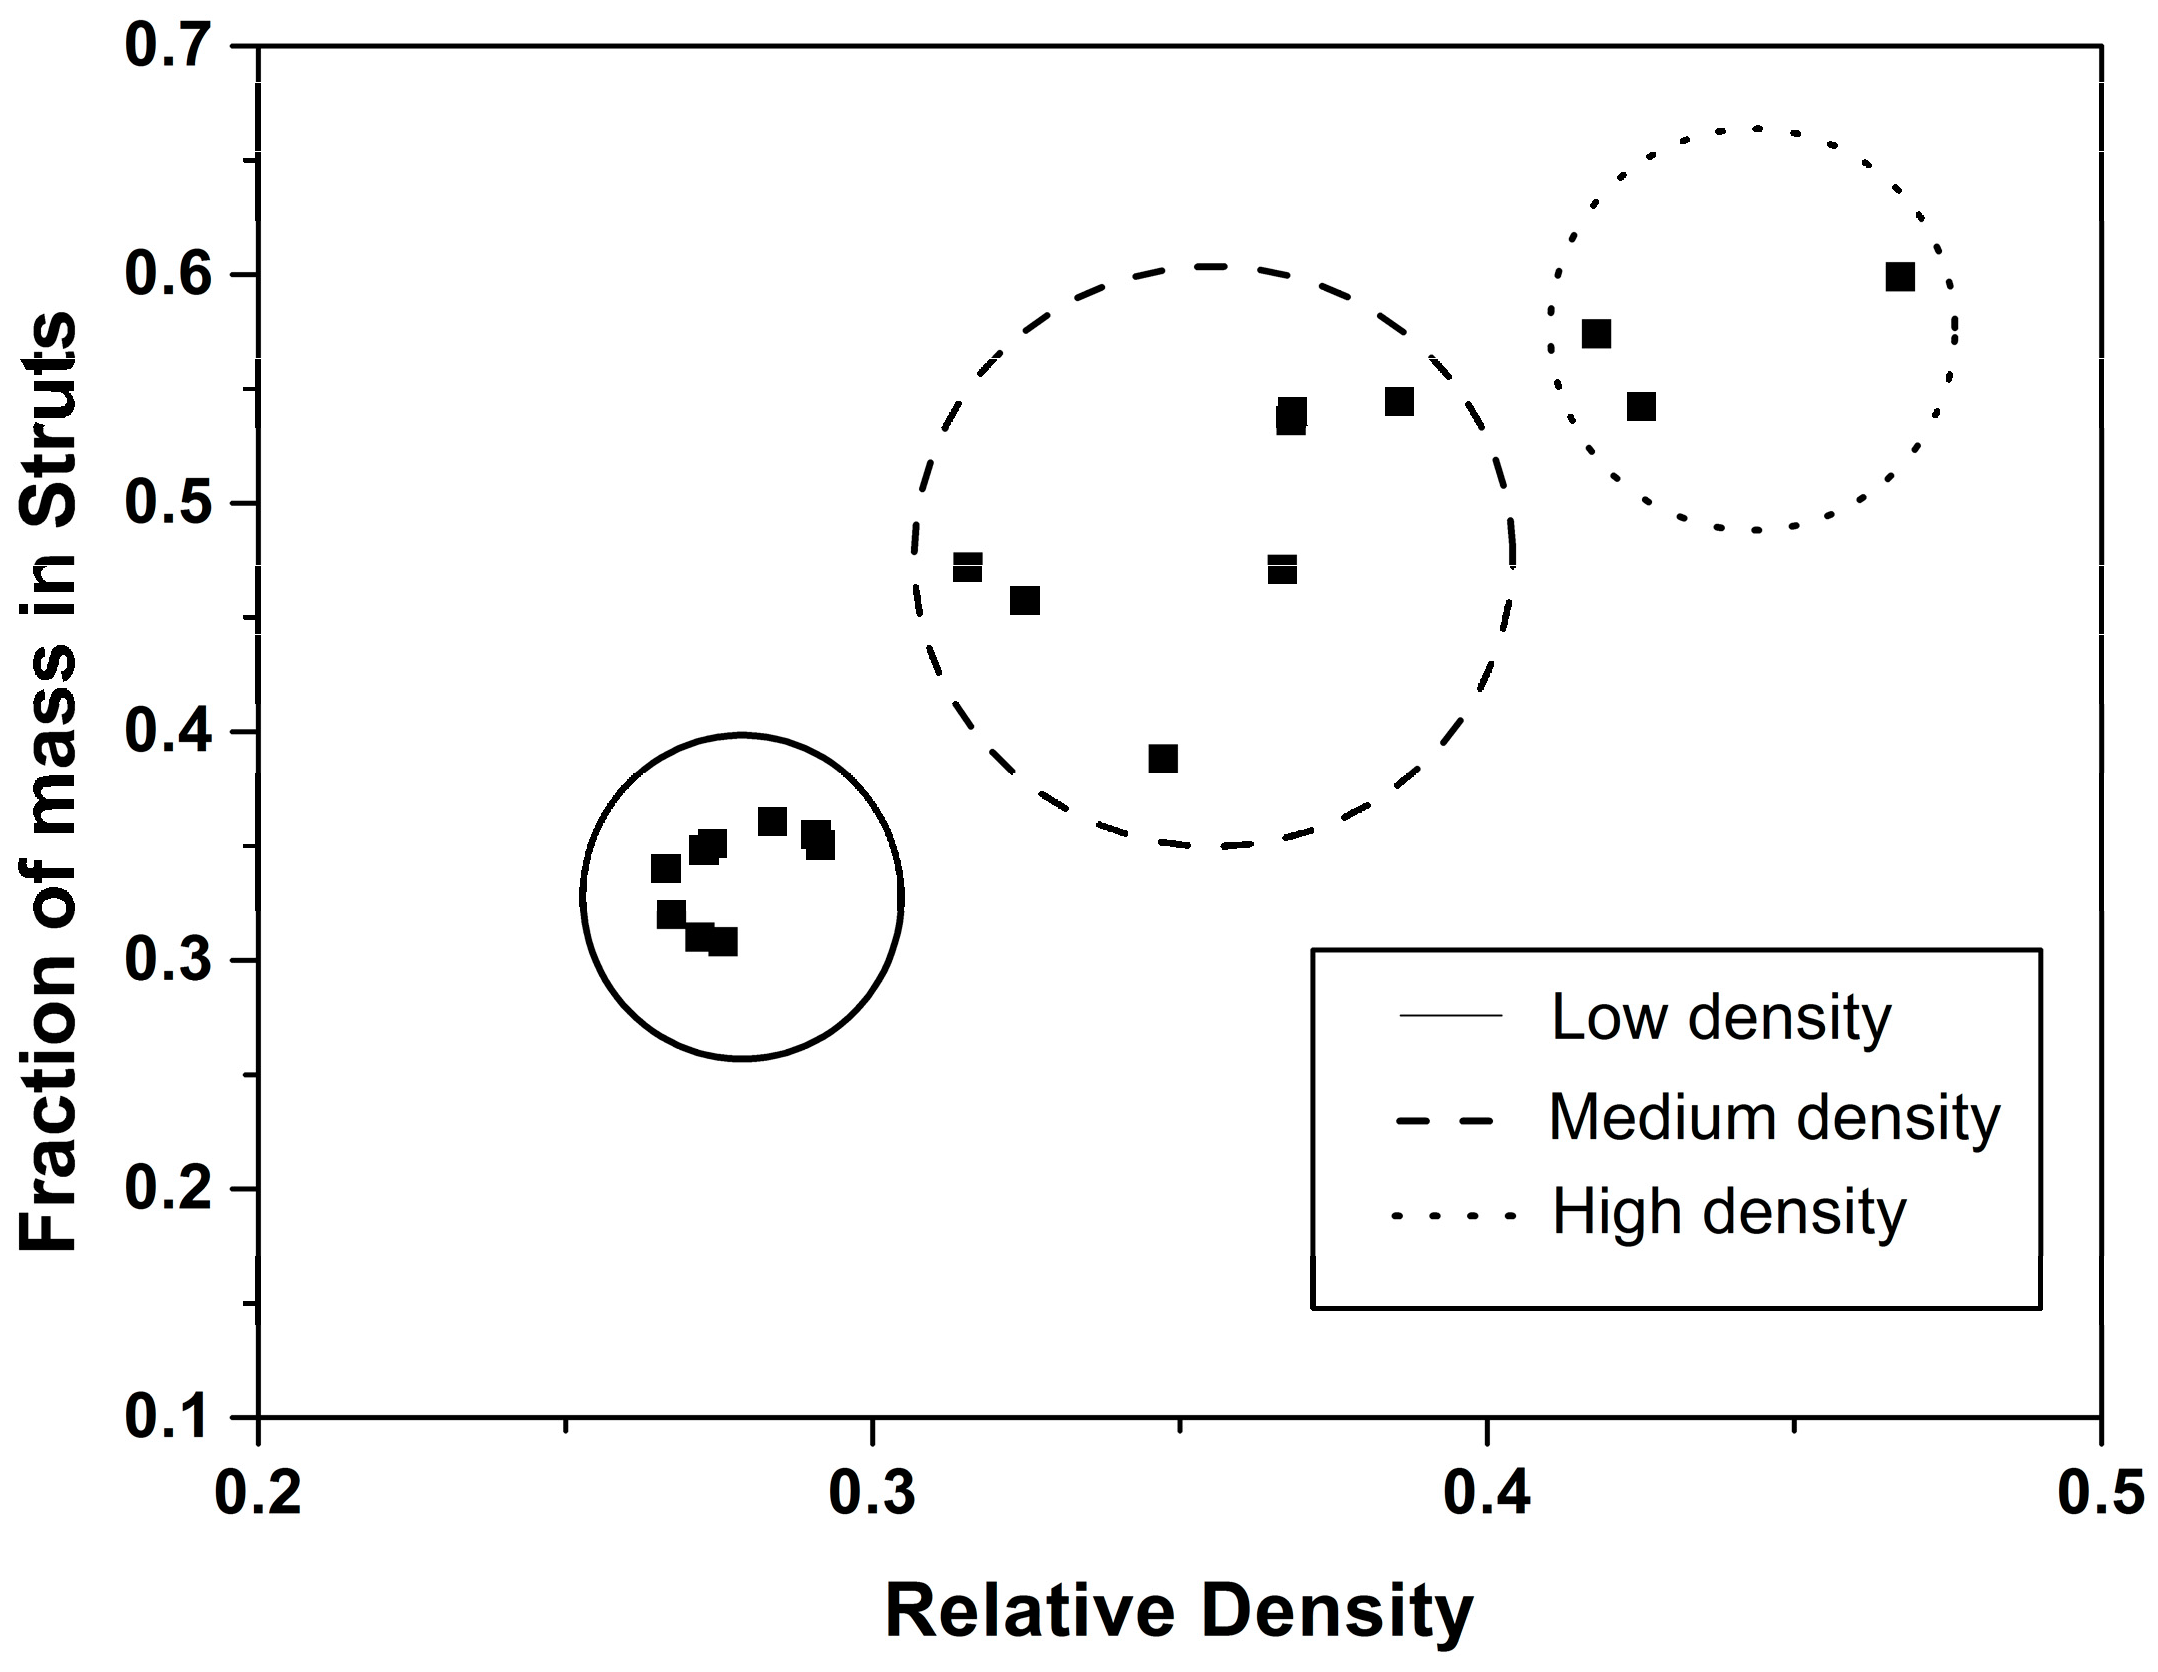
4.2. Solid Phase
Confinement Effect
5. Conclusions
Acknowledgments
Author Contributions
Conflicts of Interest
References
- Eaves, D. Handbook of Polymer Foams; Rapra Technology Limited: Shrewsbury, UK, 2004. [Google Scholar]
- Sun, H.; Mark, J.E. Preparation, characterization, and mechanical properties of some microcellular polysulfone foams. J. Appl. Polym. Sci. 2002, 86, 1692–1701. [Google Scholar] [CrossRef]
- Arora, K.A.; Lesser, A.J.; McCarthy, T.J. Preparation and characterization of microcellular polystyrene foams processed in supercritical carbon dioxide. Macromolecules 1998, 31, 4614–4620. [Google Scholar] [CrossRef]
- Kumar, V.; Weller, J.E. A process to produce microcellular PVC. Int. Polym. Process. 1993, 1, 73–80. [Google Scholar] [CrossRef]
- Parks, K.L.; Beckman, E.J. Genetration of microcellular polyurethane foams via polymerization in carbon dioxide. II: Foam formation and characterization. Polym. Eng. Sci. 1996, 36, 2417–2431. [Google Scholar] [CrossRef]
- Xing, Z.; Wu, G.; Huang, S.; Chen, S.; Zeng, H. Preparation of microcellular cross-linked polyethylene foams by a radiation and supercritical carbon dioxide approach. J. Supercrit. Fluids 2008, 47, 281–289. [Google Scholar] [CrossRef]
- Reglero Ruiz, J.A.; Viot, P.; Dumon, M. Microcellular foaming of polymethylmethacrylate in a batch supercritical CO2 process: Effect of microstructure on compression behavior. J. Appl. Polym. Sci. 2010, 118, 320–331. [Google Scholar] [CrossRef]
- Kumar, V.; Weller, J. Production of microcellular polycarbonate using carbon dioxide for bubble nucleation. J. Eng. Ind. 1994, 116, 413–420. [Google Scholar] [CrossRef]
- Shimbo, M.; Higashitani, I.; Miyano, Y. Mechanism of strength improvement of foamed plastics having fine cell. J. Cell. Plast. 2007, 43, 157–167. [Google Scholar] [CrossRef]
- Nadella, K.; Kumar, V. Tensile and flexural properties of solid-state microcellular ABS panels. Exp. Anal. Nano Eng. 2007, 765–766. [Google Scholar]
- Juntunen, R.P.; Kumar, V.; Weller, J.E.; Bezubic, W.P. Impact strength of high density microcellular poly(vinyl chloride) foams. J. Vinyl. Addit. Technol. 2000, 6, 93–99. [Google Scholar] [CrossRef]
- Collias, D.I.; Baird, D.G.; Borggreve, R.J. Impact toughening of polycarbonate by microcellular foaming. Polymer 1994, 35, 3978–3983. [Google Scholar] [CrossRef]
- Bureau, M.N. Fracture toughness of high density polycarbonate microcellular foams. J. Cell. Plast. 2006, 42, 229–240. [Google Scholar] [CrossRef]
- Kumar, V.; VanderWel, M.; Weller, J.; Seeler, K.A. Experimental characterization of the tensile behavior of microcellular polycarbonate foams. J. Eng. Mater. Technol. 1994, 116, 439. [Google Scholar] [CrossRef]
- Notario, B.; Pinto, J.; Rodriguez-Perez, M.A. Nanoporous polymeric materials: A new class of materials with enhanced properties. Prog. Mater. Sci. 2016, 78–79, 93–139. [Google Scholar] [CrossRef]
- Costeux, S. CO2-blown nanocellular foams. J. Appl. Polym. Sci. 2014, 131. [Google Scholar] [CrossRef]
- Miller, D.; Kumar, V. Microcellular and nanocellular solid-state polyetherimide (PEI) foams using sub-critical carbon dioxide II. Tensile and impact properties. Polymer 2011, 52, 2910–2919. [Google Scholar] [CrossRef]
- Notario, B.; Pinto, J.; Rodriguez-Perez, M.A. Towards a new generation of polymeric foams: PMMA nanocellular foams with enhanced physical properties. Polymer 2015, 63, 116–126. [Google Scholar] [CrossRef]
- Schmidt, D.; Raman, V.I.; Egger, C.; du Fresne, C.; Schädler, V. Templated cross-linking reactions for designing nanoporous materials. Mater. Sci. Eng. C 2007, 27, 1487–1490. [Google Scholar] [CrossRef]
- Notario, B.; Pinto, J.; Solorzano, E.; De Saja, J.A.; Dumon, M.; Rodriguez-Perez, M.A. Experimental validation of the Knudsen effect in nanocellular polymeric foams. Polymer 2015, 56, 57–67. [Google Scholar] [CrossRef]
- Gibson, L.J.; Ashby, M.F. Cellular Solids: Structure and Properties, 2nd ed.; Cambridge University Press: Cambridge, UK, 1997. [Google Scholar]
- Guo, H.; Nicolae, A.; Kumar, V. Solid-state poly(methyl methacrylate) (PMMA) nanofoams. Part II: Low-temperature solid-state process space using CO2 and the resulting morphologies. Polymer 2015, 70, 231–241. [Google Scholar] [CrossRef]
- Hedrick, J.L.; Carter, K.R.; Cha, H.J.; Hawker, C.J.; DiPietro, R.A.; Labadie, J.W.; Miller, R.D.; Russell, T.P.; Sanchez, M.I.; Volksen, W.; et al. High-temperature polyimide nanofoams for microelectronic applications. React. Funct. Polym. 1996, 30, 43–53. [Google Scholar] [CrossRef]
- Martini-Vvedensky, J.J.E.; Suh, N.N.P.; Waldman, F.F.A. Microcellular closed cell foams and their method of manufacture. US Patent 4,473,665, 25 September 1984. [Google Scholar]
- Zhou, C.; Vaccaro, N.; Sundarram, S.S.; Li, W. Fabrication and characterization of polyetherimide nanofoams using supercritical CO2. J. Cell. Plast. 2012, 48, 239–255. [Google Scholar] [CrossRef]
- Guo, H.; Kumar, V. Some thermodynamic and kinetic low-temperature properties of the PC-CO2 system and morphological characteristics of solid-state PC nanofoams produced with liquid CO2. Polymer 2015, 56, 46–56. [Google Scholar] [CrossRef]
- Pinto, J.; Dumon, M.; Pedros, M.; Reglero, J.; Rodriguez-Perez, M.A. Nanocellular CO2 foaming of PMMA assisted by block copolymer nanostructuration. Chem. Eng. J. 2014, 243, 428–435. [Google Scholar] [CrossRef]
- Costeux, S.; Khan, I.; Bunker, S.P.; Jeon, H.K. Experimental study and modeling of nanofoams formation from single phase acrylic copolymers. J. Cell. Plast. 2014, 51, 197–221. [Google Scholar] [CrossRef]
- Zhai, W.; Yu, J.; Wu, L.; Ma, W.; He, J. Heterogeneous nucleation uniformizing cell size distribution in microcellular nanocomposites foams. Polymer 2006, 47, 7580–7589. [Google Scholar] [CrossRef]
- Costeux, S.; Jeon, M.H.; Bunker, T.S.; Khan, I. Nanocellular foams from acrylic polymers: Experiments and modeling. Society of Plastics Engineers FOAMS, Barcelona, Spain, 11–12 September 2012.
- Guo, H.; Kumar, V. Solid-state poly(methyl methacrylate) (PMMA) nanofoams. Part I: Low-temperature CO2 sorption, diffusion, and the depression in PMMA glass transition. Polymer 2015, 57, 157–163. [Google Scholar] [CrossRef]
- Tang, M.; Du, T.-B.; Chen, Y.-P. Sorption and diffusion of supercritical carbon dioxide in polycarbonate. J. Supercrit. Fluids 2004, 28, 207–218. [Google Scholar] [CrossRef]
- Pinto, J.; Solorzano, E.; Rodriguez-Perez, M.A.; de Saja, J.A. Characterization of the cellular structure based on user-interactive image analysis procedures. J. Cell. Plast. 2013, 49, 555–575. [Google Scholar] [CrossRef]
- Kumar, V.; Suh, N.P. A process for making microcellular thermoplastic parts. Polym. Eng. Sci. 1990, 30, 1323–1329. [Google Scholar] [CrossRef]
- Pardo-Alonso, S.; Solórzano, E.; Brabant, L.; Vanderniepen, P.; Dierick, M.; Van Hoorebeke, L.; Rodríguez-Pérez, M.A. 3D Analysis of the progressive modification of the cellular architecture in polyurethane nanocomposite foams via X-ray microtomography. Eur. Polym. J. 2013, 49, 999–1006. [Google Scholar] [CrossRef]
- Reglero Ruiz, J.A.; Dumon, M.; Pinto, J.; Rodriguez-Pérez, M.A. Low-density nanocellular foams produced by high-pressure carbon dioxide. Macromol. Mater. Eng. 2011, 296, 752–759. [Google Scholar] [CrossRef]


| Sample | F. Time (min) | F. Temp. (°C) | N0 (1/cm3) | (nm) | SD/ | AR | ξ (nm) | fs | OC (%) | (°C) | (°C) | |
|---|---|---|---|---|---|---|---|---|---|---|---|---|
| 1 | 1 | 40 | 0.47 | 1.78 × 10¹⁴ | 212 | 0.45 | 1.24 | 26 | 0.60 | 4 | 4.9 | 0.1 |
| 2 | 2 | 40 | 0.43 | 1.55 × 10¹⁴ | 220 | 0.37 | 1.22 | 30 | 0.54 | 3 | 6.4 | 2.1 |
| 3 | 5 | 40 | 0.37 | 2.17 × 10¹⁴ | 225 | 0.39 | 1.26 | 24 | 0.54 | 8 | 7.3 | 0.7 |
| 4 | 1 | 50 | 0.42 | 1.74 × 10¹⁴ | 219 | 0.40 | 1.30 | 24 | 0.57 | 4 | 5.9 | 0.5 |
| 5 | 2 | 50 | 0.37 | 2.24 × 10¹⁴ | 213 | 0.41 | 1.32 | 26 | 0.47 | 4 | 8.5 | 0.8 |
| 6 | 5 | 50 | 0.32 | 2.16 × 10¹⁴ | 241 | 0.41 | 1.27 | 24 | 0.54 | 21 | 9.9 | 0.3 |
| 7 | 1 | 60 | 0.39 | 2.38 × 10¹⁴ | 207 | 0.42 | 1.21 | 26 | 0.46 | 5 | 8.3 | 1.6 |
| 8 | 2 | 60 | 0.33 | 2.34 × 10¹⁴ | 221 | 0.40 | 1.27 | 26 | 0.36 | 11 | 10.0 | −0.7 |
| 9 | 5 | 60 | 0.29 | 2.12 × 10¹⁴ | 236 | 0.47 | 1.26 | 23 | 0.38 | 30 | 9.6 | 1.4 |
| 10 | 1 | 70 | 0.35 | 2.27 × 10¹⁴ | 221 | 0.44 | 1.24 | 24 | 0.39 | 12 | 7.8 | 1.2 |
| 11 | 2 | 70 | 0.28 | 2.19 × 10¹⁴ | 229 | 0.46 | 1.20 | 30 | 0.36 | 47 | 10.5 | 1.5 |
| 12 | 5 | 70 | 0.27 | 2.73 × 10¹⁴ | 221 | 0.44 | 1.28 | 25 | 0.34 | 73 | 10.3 | 0.3 |
| 13 | 1 | 80 | 0.27 | 3.56 × 10¹⁴ | 208 | 0.45 | 1.21 | 23 | 0.35 | 73 | 10.5 | 0.7 |
| 14 | 2 | 80 | 0.26 | 3.15 × 10¹⁴ | 227 | 0.40 | 1.14 | 26 | 90 | 11.6 | 2.2 | |
| 15 | 5 | 80 | 0.29 | 2.81 × 10¹⁴ | 224 | 0.41 | 1.23 | 29 | 0.35 | 91 | 11.3 | 2.4 |
| 16 | 1 | 90 | 0.27 | 3.04 × 10¹⁴ | 222 | 0.40 | 1.12 | 29 | 0.35 | 99 | 10.0 | 0.5 |
| 17 | 2 | 90 | 0.26 | 3.13 × 10¹⁴ | 222 | 0.44 | 1.14 | 26 | 100 | 10.3 | 1.0 | |
| 18 | 5 | 90 | 0.26 | 2.79 × 10¹⁴ | 234 | 0.40 | 1.09 | 28 | 100 | 10.5 | 0.6 | |
| 19 | 1 | 100 | 0.27 | 3.44 × 10¹⁴ | 204 | 0.41 | 1.18 | 28 | 0.31 | 100 | 10.9 | 21.9 |
| 20 | 2 | 100 | 0.24 | 3.60 × 10¹⁴ | 216 | 0.46 | 1.03 | 26 | 97 | 10.7 | 2.5 | |
| 21 | 5 | 100 | 0.28 | 2.67 × 10¹⁴ | 234 | 0.43 | 1.16 | 29 | 0.308 | 100 | 11.4 | 1.1 |
| 22 | 1 | 110 | 0.25 | 2.23 × 10¹⁴ | 261 | 0.43 | 1.19 | 28 | 99 | 10.9 | 1.4 | |
| 23 | 2 | 110 | 0.27 | 2.99 × 10¹⁴ | 227 | 0.43 | 1.04 | 33 | 0.32 | 100 | 10.9 | 1.0 |
| 24 | 5 | 110 | 0.37 | 3.10 × 10¹⁴ | 184 | 0.40 | 1.17 | 36 | 0.54 | 46 | 4.9 | 2.0 |
© 2016 by the authors. Licensee MDPI, Basel, Switzerland. This article is an open access article distributed under the terms and conditions of the Creative Commons Attribution (CC-BY) license ( http://creativecommons.org/licenses/by/4.0/).
Share and Cite
Martín-de León, J.; Bernardo, V.; Rodríguez-Pérez, M.Á. Low Density Nanocellular Polymers Based on PMMA Produced by Gas Dissolution Foaming: Fabrication and Cellular Structure Characterization. Polymers 2016, 8, 265. https://doi.org/10.3390/polym8070265
Martín-de León J, Bernardo V, Rodríguez-Pérez MÁ. Low Density Nanocellular Polymers Based on PMMA Produced by Gas Dissolution Foaming: Fabrication and Cellular Structure Characterization. Polymers. 2016; 8(7):265. https://doi.org/10.3390/polym8070265
Chicago/Turabian StyleMartín-de León, Judith, Victoria Bernardo, and Miguel Ángel Rodríguez-Pérez. 2016. "Low Density Nanocellular Polymers Based on PMMA Produced by Gas Dissolution Foaming: Fabrication and Cellular Structure Characterization" Polymers 8, no. 7: 265. https://doi.org/10.3390/polym8070265