Article

Structural and Spectroscopic Characterization of A Nanosized Sulfated TiO2 Filler and of Nanocomposite Nafion Membranes

1
Department of Computer Science, University of Verona, Strada le Grazie 15, 37134 Verona, Italy
2
Department of Sciences, University of Basilicata, V.le dell’Ateneo Lucano 10, 85100 Potenza, Italy
3
Department of Chemistry, Sapienza University of Rome. P.le Aldo Moro 5, 00185 Rome, Italy
*
Author to whom correspondence should be addressed.
Polymers 2016, 8(3), 68; https://doi.org/10.3390/polym8030068
Submission received: 29 January 2016 / Revised: 19 February 2016 / Accepted: 23 February 2016 / Published: 1 March 2016
(This article belongs to the Special Issue Nano- and Microcomposites for Electrical Engineering Applications)

Abstract

:
A large number of nano-sized oxides have been studied in the literature as fillers for polymeric membranes, such as Nafion®. Superacidic sulfated oxides have been proposed and characterized. Once incorporated into polymer matrices, their beneficial effect on peculiar membrane properties has been demonstrated. The alteration of physical-chemical properties of composite membranes has roots in the intermolecular interaction between the inorganic filler surface groups and the polymer chains. In the attempt to tackle this fundamental issue, here we discuss, by a multi-technique approach, the properties of a nanosized sulfated titania material as a candidate filler for Nafion membranes. The results of a systematic study carried out by synchrotron X-ray diffraction, transmission electron microscopy, thermogravimetry, Raman and infrared spectroscopies are presented and discussed to get novel insights about the structural features, molecular properties, and morphological characteristics of sulphated TiO2 nanopowders and composite Nafion membranes containing different amount of sulfated TiO2 nanoparticles (2%, 5%, 7% w/w).

Graphical Abstract

1. Introduction

Among the different polymer electrolytes proposed as proton exchange membranes (PEM) for fuel cell (FC) applications, one of the best choices is represented by perfluorinated polymers, such as Dupont’s Nafion®, due to their high proton conductivity and the excellent mechanical and chemical stability. Unfortunately, ionic conduction of Nafion is strongly dependent on the membrane hydration, and a sharp decrease in conductivity is observed at working temperatures above 80–100 °C due to dehydration and polymer structure relaxation. An upgrade of the Nafion properties in critical conditions (high temperature, low relative humidity) can be achieved by loading the pristine Nafion with hydrophilic inorganic acids, which can both act as a water reservoir, into the polymer matrix (thus increasing the membrane water uptake) and, in virtue of their acidity, provide additional pathways for proton hopping inside the polymer. Among the inorganic acids, sulfated transition-metal oxides have become the subject of intensive studies, due to the high stability and extraordinary acidity of some of these compounds, as, for instance, sulfated zirconium oxide [1,2,3], sulfated tin oxide [4,5], and sulfated titanium oxide [6]. The latter has been widely studied in the past as a catalyst and as a proton conductor [7,8]. Recently, sulfated titania nanoparticles have been added to various polymers to form composite membranes with improved thermal and mechanical properties and enhanced proton conductivity [9].
This work reports on the results of a multi-technique characterization of nanosized sulfated TiO2 powders obtained through a direct one-step synthesis and their incorporation as fillers in Nafion-based polymer electrolytes. To the best of our knowledge, the inclusion of one-step synthesized S-TiO2 in Nafion membranes has never been reported before, with the exception of our recent work where water dynamics inside S-TiO2-added Nafion membranes were investigated by NMR spectroscopy [10]. In the present paper, structural features, molecular properties, as well as morphological characteristics of TiO2 nanopowders, both before and after the incorporation in Nafion membranes, have been investigated by a variety of advanced techniques, such as synchrotron X-ray diffraction (XRD), transmission electron microscopy (TEM), thermogravimetry (TGA), and vibrational spectroscopies (both Raman scattering and infrared absorption), paying particular attention to the effects caused by their exposure to a high humidity. Finally, the homogeneity degree of both structure and morphology of composite Nafion membranes with different amounts of sulfated TiO2 nanoparticles (2%, 5%, 7% w/w) has been probed in the micrometric scale by Raman mapping. Our goal is to illustrate how the incorporation of sulfated nanostructured titania into Nafion membranes alters the local environment of the ionic and hydrophobic domains of the membranes in terms of bonding and molecular interactions.

2. Materials and Methods

Sulfated titania (S-TiO2) was obtained through a one-step sol-gel procedure by adapting the synthesis proposed by Swaminathan and co-workers [11]. A solution of titanium isopropoxide in 2-propanol was used as Ti source and an aqueous sulfuric acid solution was adopted for both hydrolysis and sulfating processes. H2SO4 (0.5 M; 6.4 mL) was added to a mixture of 12.5 mL of titanium(IV) isopropoxide (Sigma-Aldrich, St. Louis, MO, USA) and 100 mL of 2-propanol (Sigma-Aldrich, St. Louis, MO, USA) with vigorous stirring. After 2 h, the solution was filtered, then calcined for 3 h at 400 °C to obtain an inorganic powder. Plain and composite Nafion membranes were prepared according to a solvent-casting procedure already reported in a previous work [3]. A proper dispersion of commercial Nafion (5 wt % in water/alcohol, E.W. 1100, Ion Power, GmbH) was treated with N,N-dimethylacetamide at 80 °C in order to replace the solvents. As for the composite membranes, the inorganic powder was added to the final Nafion solution and stirred to homogenize the dispersion. Filler concentrations of 2%, 5%, and 7% w/w of S-TiO2 with respect to Nafion content were chosen. Each mixture was casted on a Petri dish and dried at 100 °C to obtain self-standing membranes. After that, dry membranes were hot-pressed at 175 °C and 50 atm for 15 min in order to improve their thermo-mechanical properties. They were finally activated by immersion in a boiling solution of hydrogen peroxide (3%), sulfuric acid (0.5 M), and water. All of the membrane samples were stored in distilled water after preparation. Membrane samples are labeled here as N for plain Nafion and as nTiO2-S (n = 2, 5, 7) for composite Nafion membranes filled by different nominal amounts of sulfated inorganic powder. Table 1 summarizes the samples investigated in this work and the acronyms used to identify them.
Synchrotron X-ray diffraction experiments were carried out at the ELETTRA synchrotron radiation source (MCX beamline) on capillarized S-TiO2 powders. An X-ray wavelength of 1.204 Å has been used in a diffractometer equipped with a four-circle Huber goniometer (2θ precision better than 0.0001°) in full circle configuration. The diffraction spectra were recorded in the 15–67 degree 2-theta (2θ) range, with a step size of 0.01 degrees and a time per step of two seconds. The structural refinement has been carried out by the GSAS code [12] starting from the anatase polymorphic lattice of TiO2 [13].
Transmission electron microscopy measurements were performed by a FEI G2 20 HR-TEM instrument equipped with a LaB6 electron beam source and two 2D flat cameras (low-resolution and high-resolution). Samples have been suspended in acetone in an ultrasonic bath and dispersed on copper holey carbon film grids for observation.
Thermal properties of the powders were evaluated by means of thermogravimetric analysis (TGA) performed in air flux (60 mL·min−1) at a heating rate of 5 °C·min−1 with a TGA/SDTA 851 Mettler-Toledo (Greifensee, Switzerland). In order to investigate the hydro-thermal stability of the synthesized oxide, TGA measurements were performed on both pristine and hydrolyzed powders, these latter obtained according to the following protocol. S-TiO2 powder was dispersed in boiling water (1 mL of water for 1 mg of powder) under vigorous stirring for 1 h, filtered, and washed three times with cold water, and finally calcined at 400 °C for 3 h.
Vibrational characterization of both sulfated titania nanopowders and composite membranes was carried out by means of FT-IR and Raman spectroscopy measurements. FT-IR spectra were obtained at room temperature, using a JASCO spectrometer (FT/IR-660 plus, JASCO, Easton, MD, USA) equipped with a Tri-Glycine-Sulfate (TGS) detector, either in attenuated total reflection (ATR) configuration (using a germanium crystal for both kinds of samples, spectral range between 4000 and 900 cm−1), or in transmission configuration in KBr pellets. All of the IR spectra were recorded with a resolution of 4 cm−1, and a polystyrene film was used as reference for wavenumber calibration. In order to allow for a better comparison between different samples, a proper baseline has been carefully subtracted from each FT-IR spectrum. Prior to the measurement each membrane was dried in vacuum for 30 min to avoid the occurrence of spectral differences between the samples due to a different hydration degree.
Micro-Raman spectroscopy measurements were carried out in backscattering geometry at room temperature using, in turn, two different Horiba-Jobin Yvon micro-sampling spectrometers (Horiba, Kyoto, Japan): a LABRAM HR, consisting of a single monochromator, for spectra detection extended to a very high wavenumber region and a triple-axis monochromator (model T64000) in order to probe the spectral region below 200 cm−1 down to a few wavenumbers from the laser excitation line. The single monochromator spectrometer was equipped with a He–Ne laser as excitation source (632.8 nm) and a notch filter for the Rayleigh line cut-off. The scattered radiation was dispersed by a removable diffraction grating having 600 or 1800 lines/mm and detected at the spectrograph output by a multichannel device, a CCD with 1024 × 256 pixels, cooled by liquid nitrogen, and with its maximum efficiency occurring in the red region. The spectral resolution was about 1 cm−1/pixel when the 1800 lines/mm grating was used, while the spectral limit on the side of low wavenumbers, due to the notch filter, was about 200 cm−1. In order to investigate the low-wavenumber spectral region, the triple-axis monochromator, set in double subtractive/single configuration, and equipped with holographic gratings having 1800 lines/mm, was exploited. For most measurements carried out by means of this spectrometer, the excitation source was the 514.5-nm line of a mixed Ar-Kr ion gas laser. The scattered radiation detection was ensured by a multichannel detector an open-electrode CCD, consisting of a matrix of 1024 × 256 pixels, cooled by liquid nitrogen, whose maximum efficiency occurred in the green/yellow region. In these conditions the spectral resolution was about 0.4 cm−1/pixel. Both micro-Raman setups were coupled to a camera which allowed for the exploration and selection of the sample region worth to be measured. Independently of the spectrometer used to carry out the Raman measurements, the spectra were obtained by focusing the laser beam onto a spot of about 2 μm in size through a long-working distance 50× objective, with medium numerical aperture (N.A. = 0.5), or through a 80× objective with high numerical aperture (N.A. = 0.9). The laser power at the samples surface was kept below 5 mW. All the spectra were calibrated in wavenumber using the emission lines of an Ar spectral lamp. In order to verify the spectra reproducibility over the sample surface, repeated micro-Raman spectra were carried out under the same experimental conditions from different points of the investigated sample. The recorded spectra were processed to remove artifacts due to cosmic rays, while the luminescence background, consisting of a continuous line, underlying the overall Raman spectrum and having both the shape and the intensity dependent of the probed sample region, was subtracted before starting the analysis of the experimental data.

3. Results and Discussion

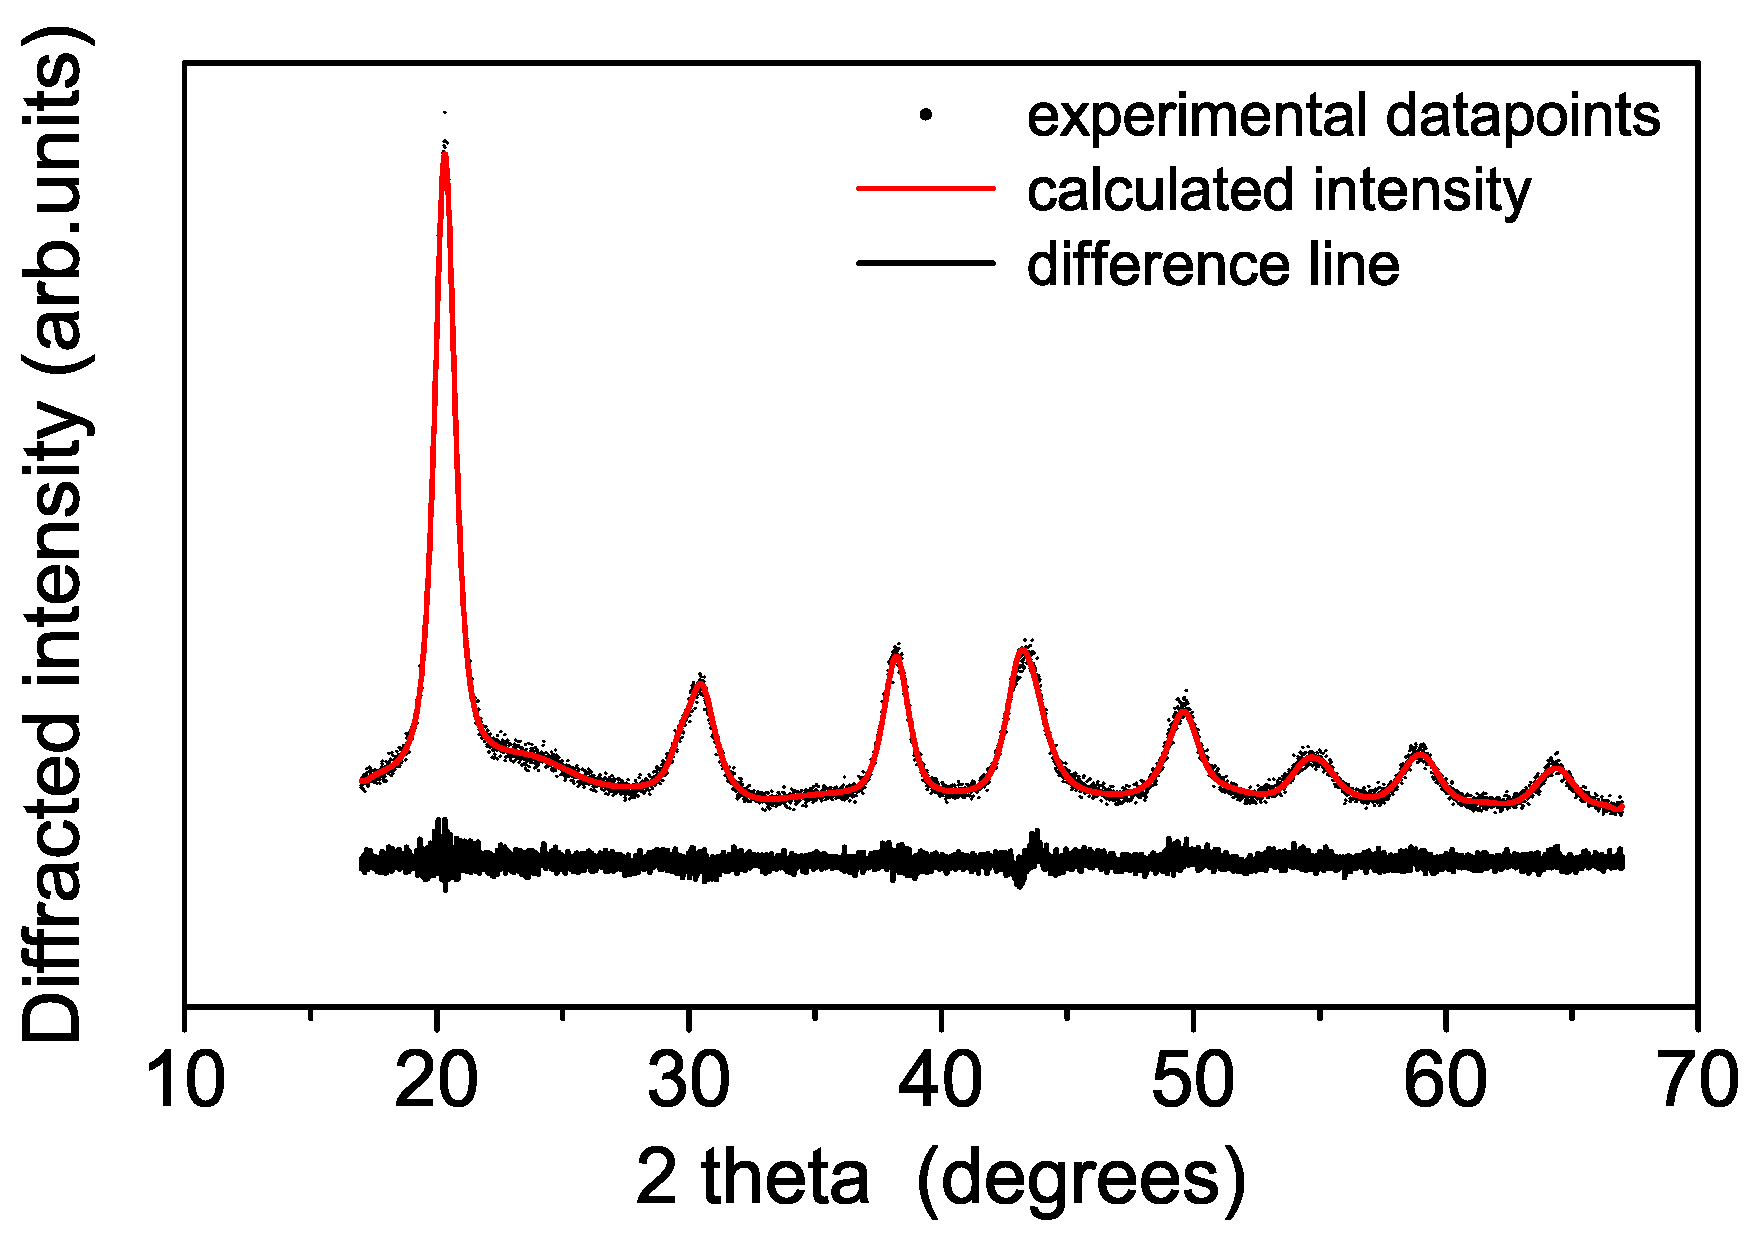
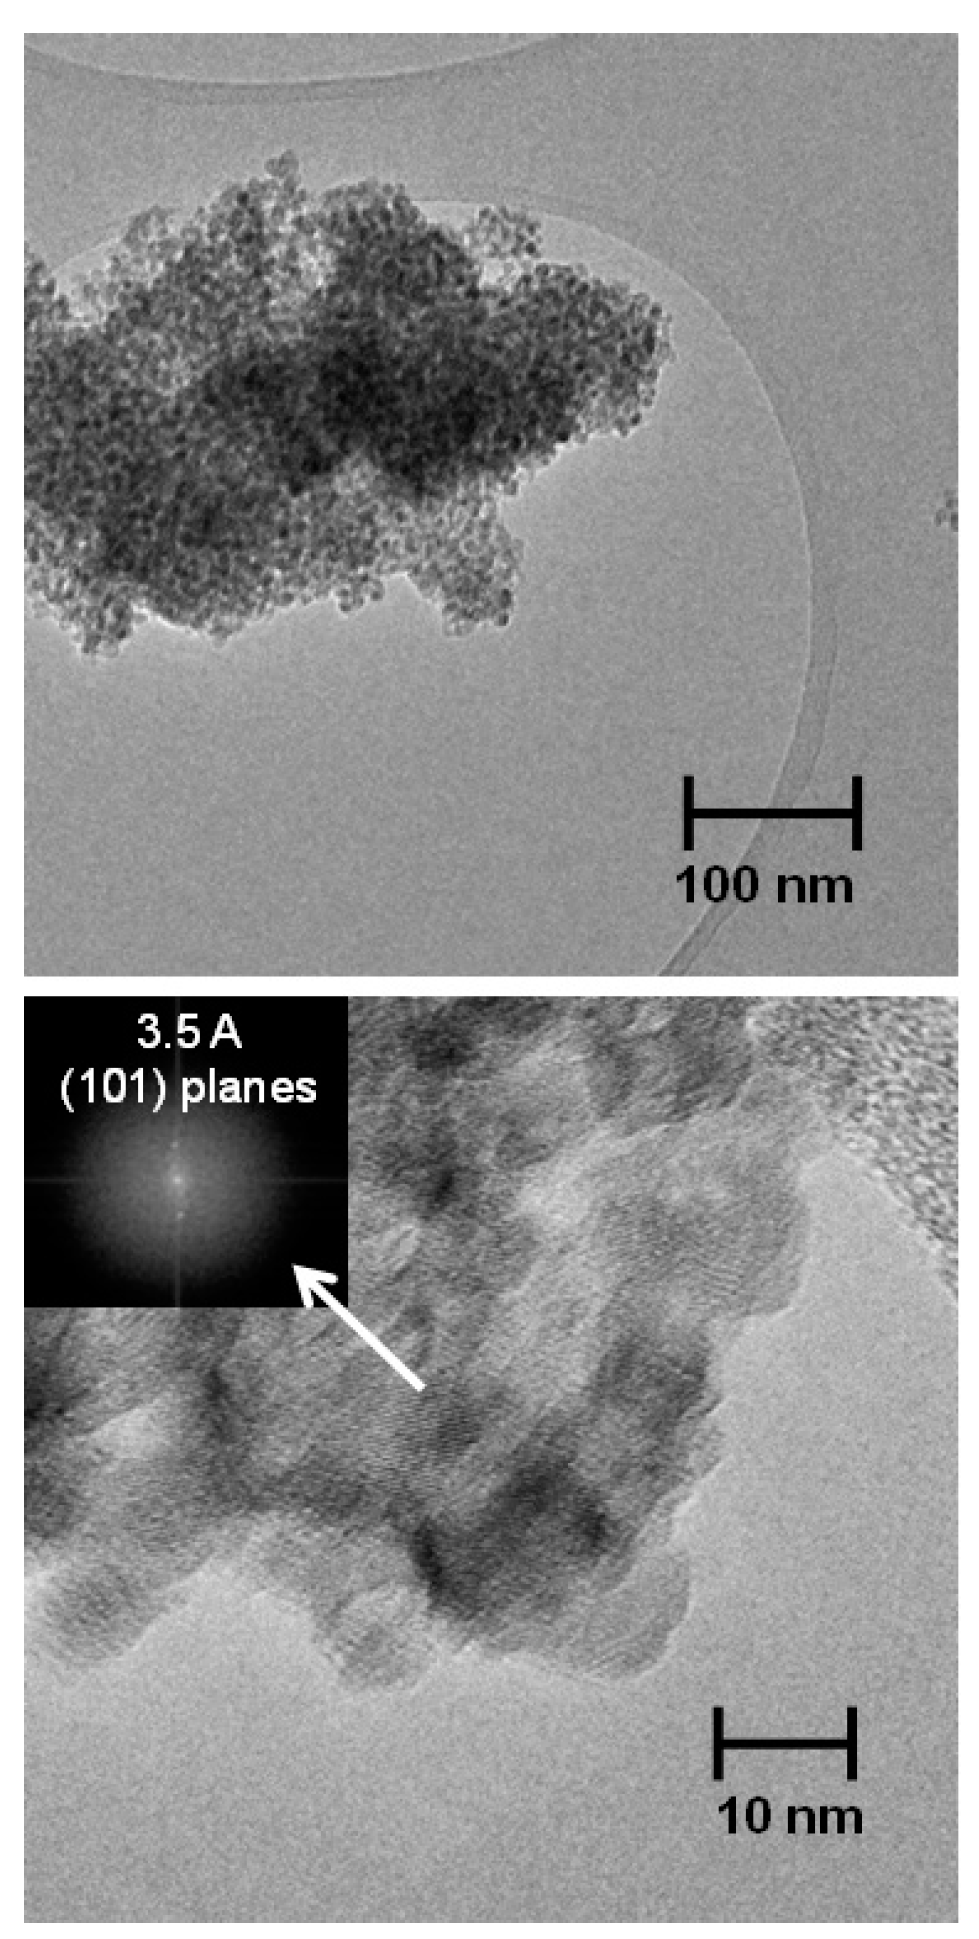
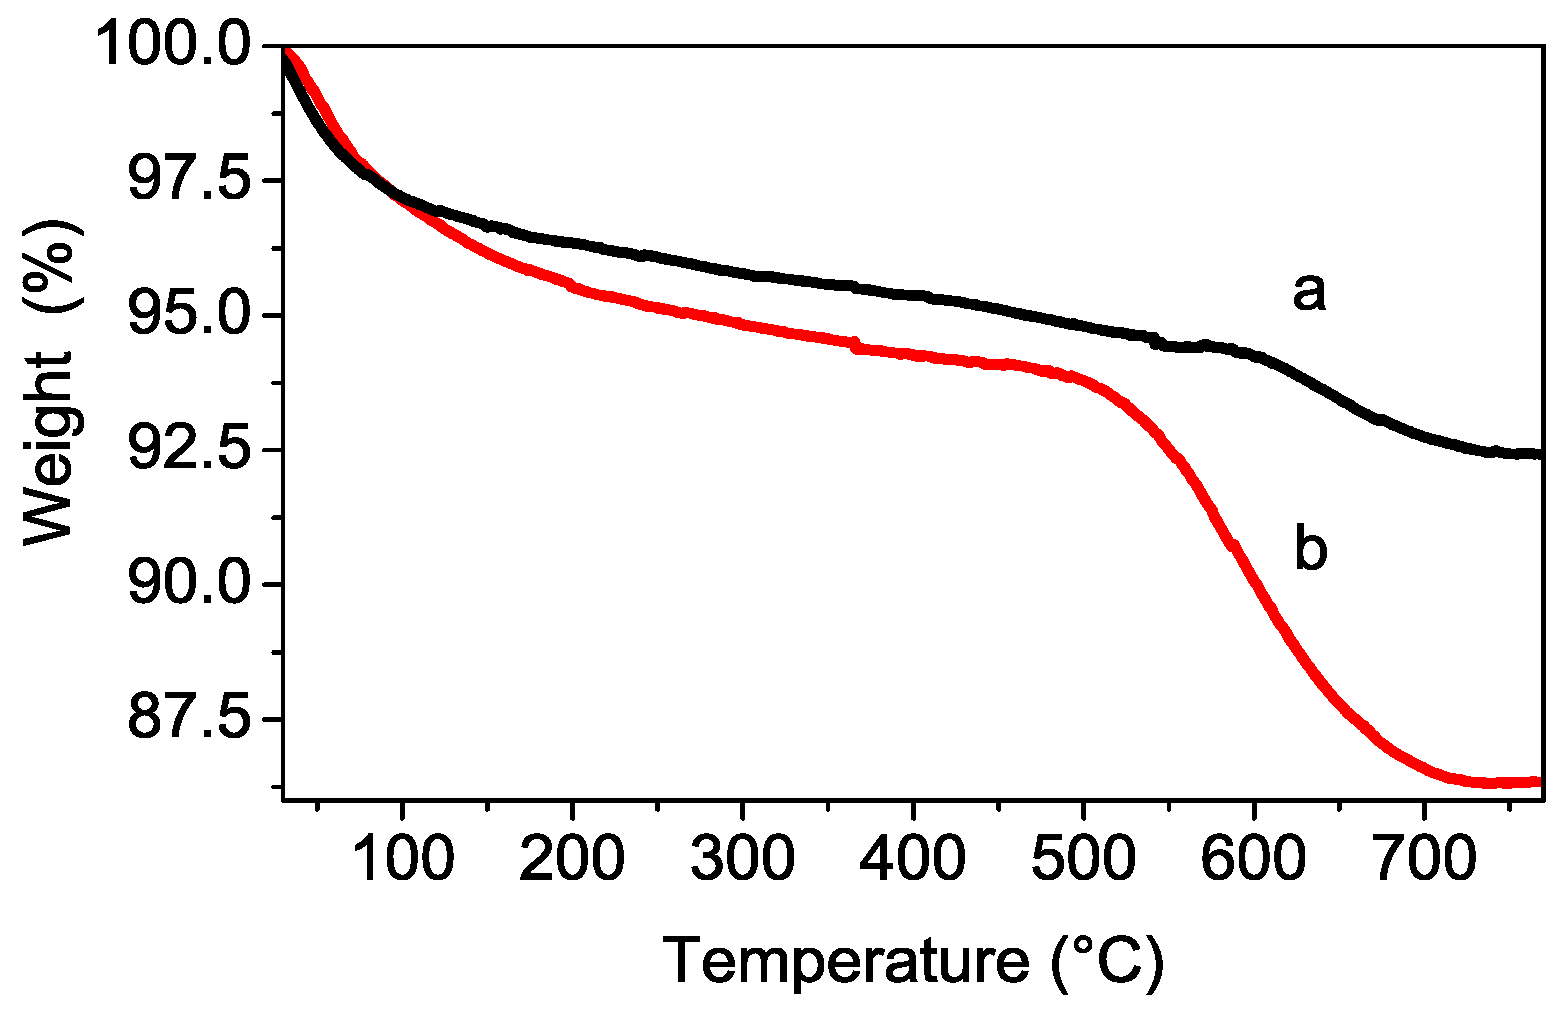
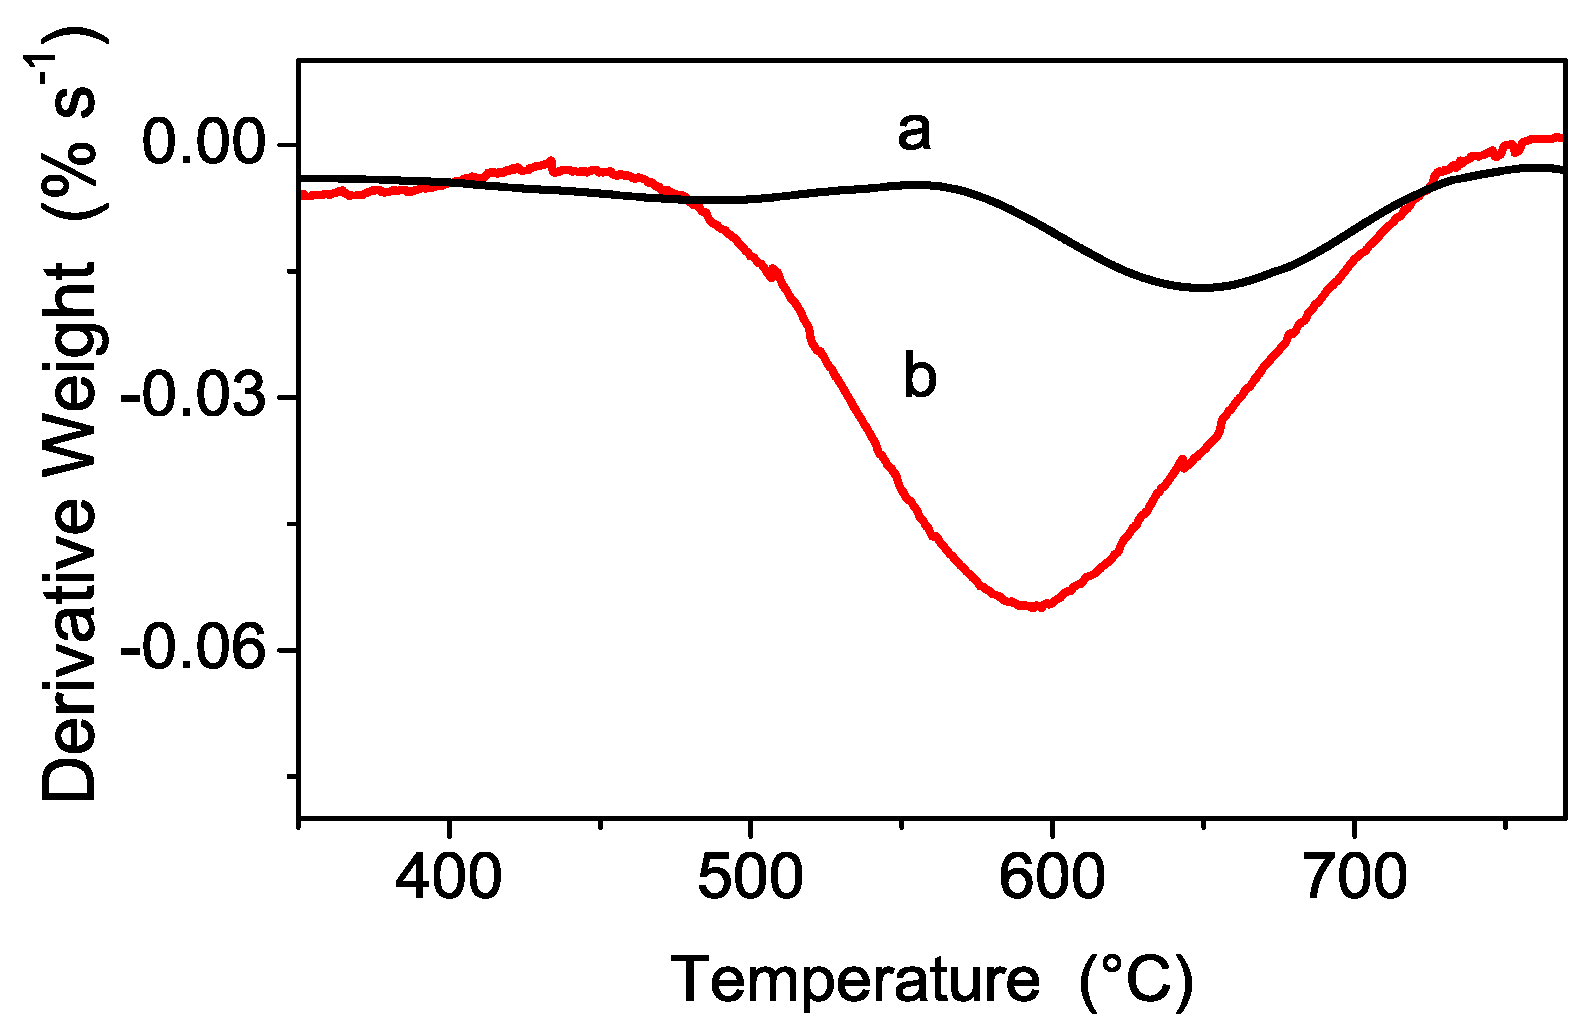
3.1. Structural and Thermal Characterization of the Sulfated Powders

A typical diffraction pattern of the synthesized powders recorded at the synchrotron radiation source is shown in the Figure 1. The synthesized material consists of nanosized nanoparticles of anatase as confirmed by synchrotron diffraction. The Rietveld refinement suggests a slightly deformed trigonal anatase lattice with crystal parameters of a = 3.791 Å and c = 9.439 Å to be compared to a = 3.784 Å and c = 9.514 Å literature values, respectively (convergence parameters Rwp = 4.9% RF2 = 1.0%, DWd = 1.74) [13,14]. Occupancies and Debye-Waller factors have been fixed in the refinement (x(Ti) = x(O) = 1; B(O) = 2.0; and B(Ti) = 1.0). The refined crystal structure is in a satisfactory agreement with literature data, e.g., the atomic site position of oxygen (x = 0.926) to be compared with that of [13,15,16]. The undulations of the background suggest the presence also of minor content of nanosized particles with TiO2-B structure [17,18,19]. The final crystallite size obtained by size-strain analysis suggests a diameter of about 10.1 ± 0.6 nm.
The morphology of the S-TiO2 ceramic material has been investigated by TEM: two typical micrographs at different magnifications are presented in Figure 2. The low magnification TEM image highlights a highly homogeneous sample constituted by nanometric round-shaped particles of very similar size. The powder is morphologically very pure: apparently no contaminations by larger particles, chunks, or other morphologies can be observed. The size distribution obtained by analyzing 10 micrographs and more than 500 particles by using the ImageJ software [20,21] indicates a mean diameter of about 7.6 ± 2.5 nm in fair good agreement with the value derived from XRD size-strain analysis (10.1 ± 0.6 nm). High-resolution TEM imaging confirms the uniform morphology of the nanoparticles and evidences their crystalline nature, too. Diffraction fringes have been observed throughout the entire sample and the corresponding Fast Fourier Transform (FTT) pattern easily indexed to the crystal lattice planes of anatase TiO2 [13].
The thermal response of S-TiO2 is reported in Figure 3: in addition to the pristine S-TiO2 material, a second sample has also been studied by TG, namely hydrolyzed-S-TiO2. The latter sample has been obtained by a drastic hydrolysis treatment after the standard synthesis, as reported in the experimental section, in order to highlight eventual losses of weakly bonded and physisorbed sulfate surface groups. Both pristine (red curve) and hydrolyzed (black curve) samples present two main weight losses. The first loss, starting just above room temperature until about 500 °C, can be ascribed to removal of water and surficial OH anions, while the second main loss, occurring above 500 °C, is due to thermal decomposition of SO42− groups. It is worth noticing that a high sulfation degree is detected in pristine S-TiO2 powder (i.e., ca. 8%) confirming the effectiveness of the synthetic route. Moreover, a certain extent of sulfation is retained after the severe hydrothermal stability test. Indeed, a weight loss of about 2% is observed for the hydrolyzed sample above 500 °C.
Derivative thermal gravimetric (DTG) curves of pristine and hydrolyzed powders are reported in Figure 4 in the 300–750 °C temperature region in order to better highlight the different thermal processes of sulfate decomposition occurring in the two samples. A shift of the derivative peak minimum towards higher temperature occurs when moving from pristine (ca. 600 °C, red curve) to hydrolyzed (ca. 650 °C, black curve) powder. This shift can be explained by assuming the presence of differently-bonded sulfate species: the weakly bonded ones, decomposing at lower temperature, are hydrolyzed, whereas the more strongly-bonded sulfate species are retained even at higher temperature as evidenced by their DTG response.

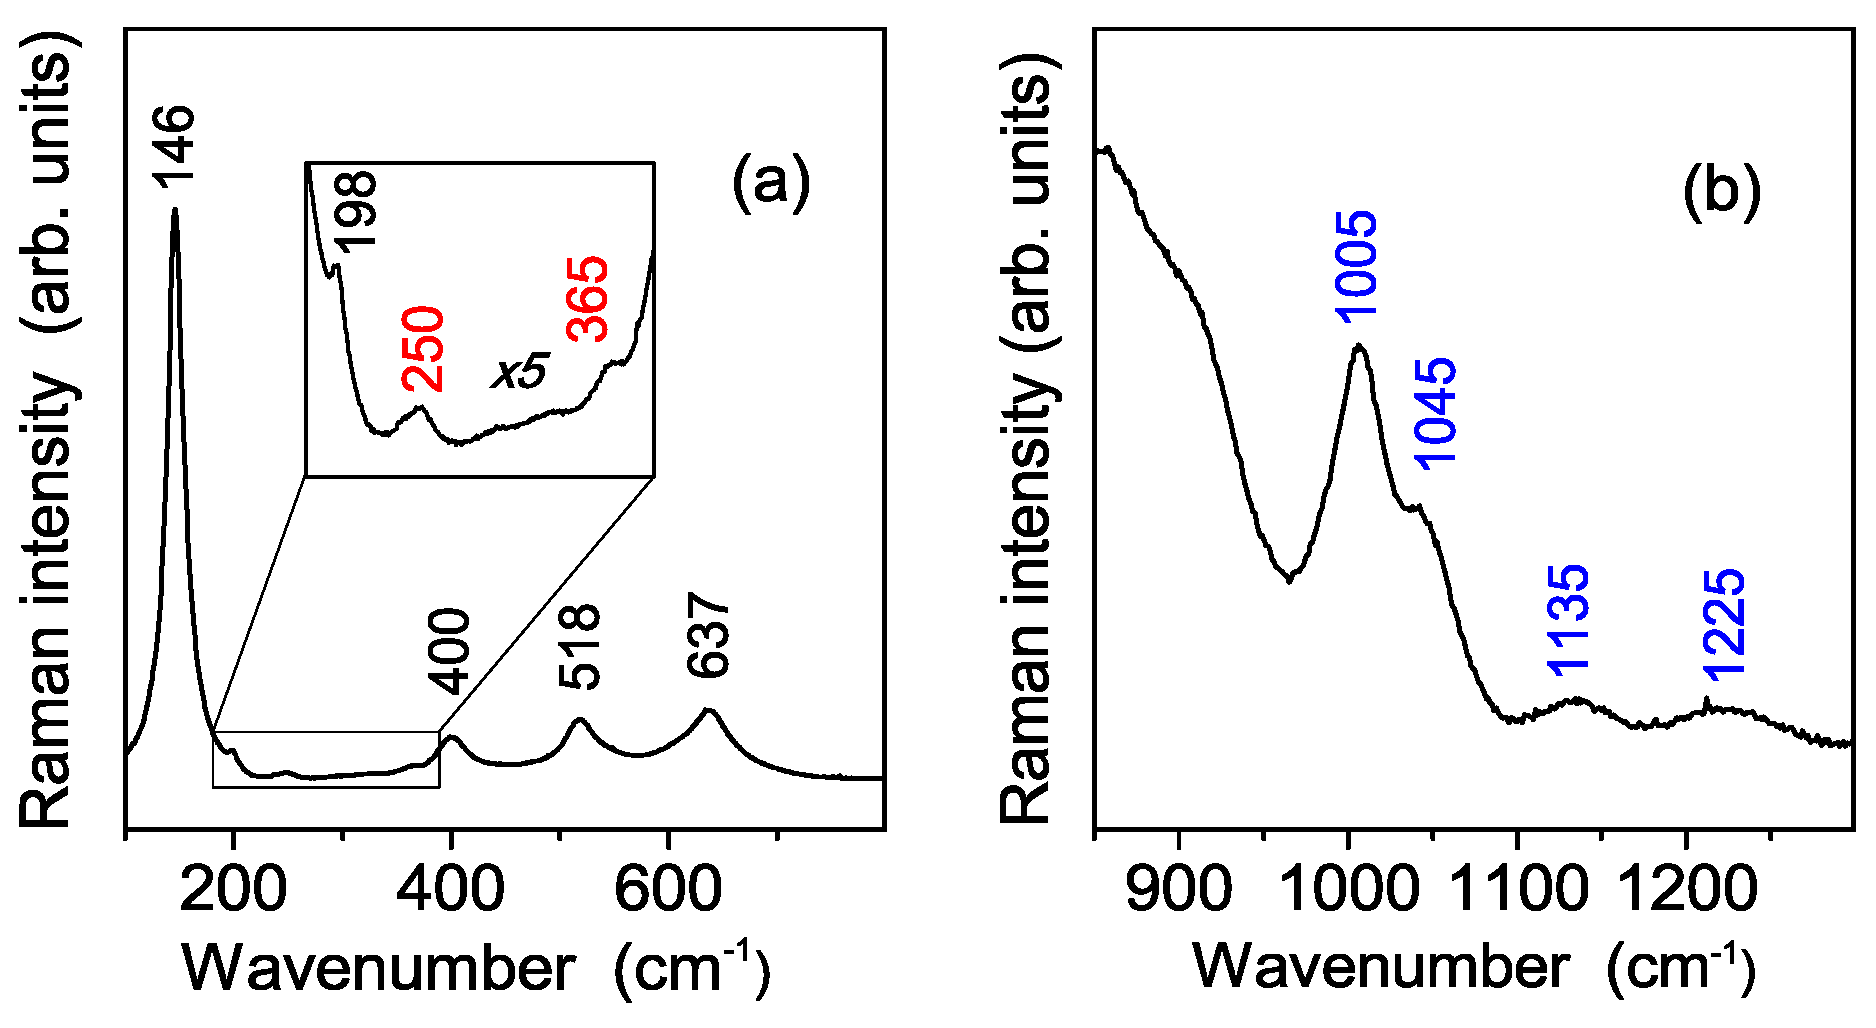
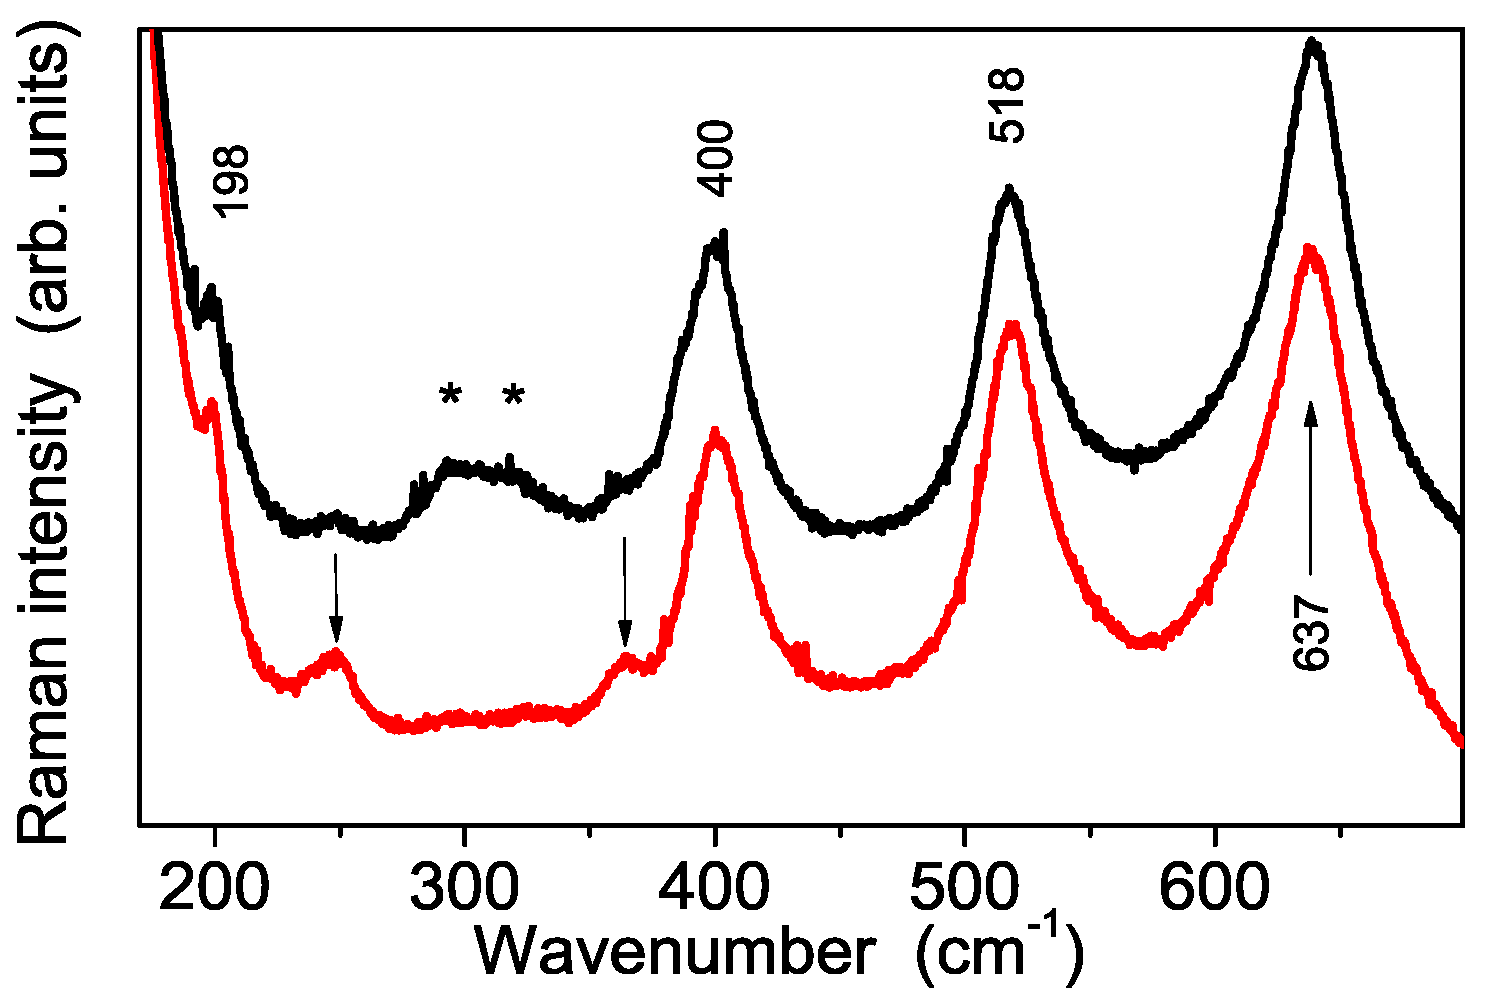
3.2. Vibrational Characterization of the Synthesized Powders

The vibrational characterization of the synthesized sample was carried out both by Raman and Infrared absorption spectroscopy. A typical Raman spectrum of the S-TiO2 powder carried out in the low wavenumber region is shown in the Figure 5a. This spectrum consists of several Raman bands, having quite different spectral amplitude. At first sight it looks very similar to that of nanocrystalline anatase TiO2 reported in literature [22], thus indicating that this titania phase is the paramount component of the synthesized powders. However, a deeper insight also reveals the occurrence of some weak Raman modes besides the five ones of anatase TiO2, which suggest the presence of a second minor component, probably related to a TiO2-B phase, as revealed by the x-ray diffraction results. Therefore, in order to discuss in depth the Raman spectrum measured from the synthesized nanopowders, we shall refer to both of these crystalline titania phases.
Crystalline anatase TiO2 has a tetragonal structure which belongs to the space group D4h19 (I41/amd). Among them six modes are Raman active (1 A1g, 2 B1g and 3 Eg). In micro-crystalline TiO2 anatase they occur at about 143 cm−1 (Eg), 198 cm−1 (Eg), 395 cm−1 (B2g), 512 cm−1 (A1g), 518 cm−1 (B1g), 639 cm−1 (Eg) [23]. All of these vibrational modes are present in the spectrum of S-TiO2 powders (see Figure 5a), although slightly shifted in wavenumber with respect to single crystal due to the nanocrystalline character of our powders. On the other hand, TiO2-B phase is characterized by four formula units per unit cell and, thus, a total of 36 vibrations, among which 12 Ag and 6 Bg are Raman active modes [24,25]. However, only two TiO2-B modes are unambigously observed in S-TiO2 Raman spectra, respectively at about 250 and 365 cm−1 (see Figure 5a, quoted in red). The missing peaks of this titania phase are probably hidden under the much stronger ones due to anatase. As for the Raman spectra of the S-TiO2 powder recorded in the higher wavenumber region, Figure 5b shows the spectral features related to sulfate functionalization: the peak at about 1005 cm−1, is assigned to the stretching mode ν1 of the SO42− groups, while the three bands (one of which occurring at about 1045 cm−1 and two weaker at about 1135 and 1225 cm−1) are associated to the splitting of the ν3 mode of the SO42− units. The splitting, due to a lowering of the free SO42− anion symmetry, suggests the formation of bidentate sulfate groups coordinated to TiO2 nano-particles [26]. Raman spectroscopy therefore confirms that the sample consists of a predominant phase, i.e. anatase, and a minor component, i.e., TiO2-B, in fair agreement with X-ray diffraction results. Moreover, it clearly reveals the sulphated functionalization of the synthesized powders.
The vibrational spectrum of sulfate groups of the S-TiO2 powder was also detected by ATR FT-IR spectroscopy. Figure 6a clearly shows the occurrence of the ν1 vibrational mode at about 1000 cm−1 and the three ν3 modes at about 1047, 1136 and 1224 cm−1, respectively. The number and position of these modes fairly correlate with the above Raman spectroscopy findings, as well as with the observations of Arata and Hino [27] who attributed them to bidentate sulfate coordination at the titania surface.
In order to investigate the nanopowder interaction with water, and, at the same time, to simulate the condition of a Nafion membrane in a working fuel cell, samples were stored in a high relative humidity (RH) environment (close to 100% RH) for at least 12 h. The FT-IR spectra recorded on the powder after the exposure to moisture, shown in Figure 6b, shows evidence of remarkable changes of the spectral features with regard to both their number and their relative intensity. In particular, the disappearance of the mode at about 1224 cm−1 indicates a different arrangement of SO42− groups in presence of a higher water content, which turns out to promote the switch from a bidentate coordination to a monodentate one of the same groups inside S-TiO2 nanoparticles. This change of the sulfate coordination suggests the occurrence of an interaction mechanism between S-TiO2 and water molecules similar to that proposed by Bolis et al. for sulfated ZnO2 [27]. Similar changes on vibrational spectrum of S-TiO2 powders exposed to high relative humidity are observed by Raman spectroscopy, which in addition reveals the occurrence of an extra peak at 981 cm−1 (Figure 7). This is attributed to the stretching vibrational mode of a quasi-isolated SO42− ion [28,29], which is not detected by IR spectroscopy for symmetry reasons. The Raman spectrum evolution is in accordance with TGA results obtained on the sample before and after the hydrolysis. Therefore, the picture emerging from both Raman and TGA measurements is the following: due the hydrolysis treatment a part of the sulfate groups is released, and, in a high RH environment, this part of sulfate groups shows the spectrum typical of isolated SO42−. Moreover, the sulfate ions having a monodentate coordination in the high RH conditions most probably represent the remaining fraction after the hydrolysis treatment.

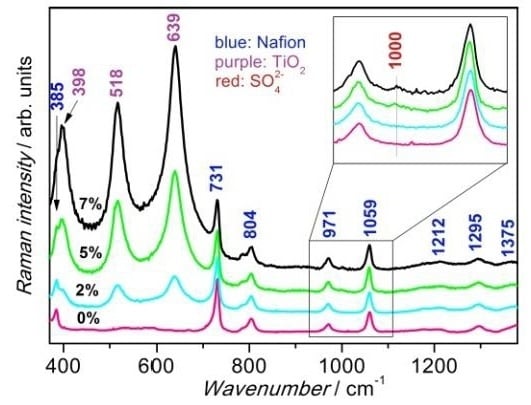
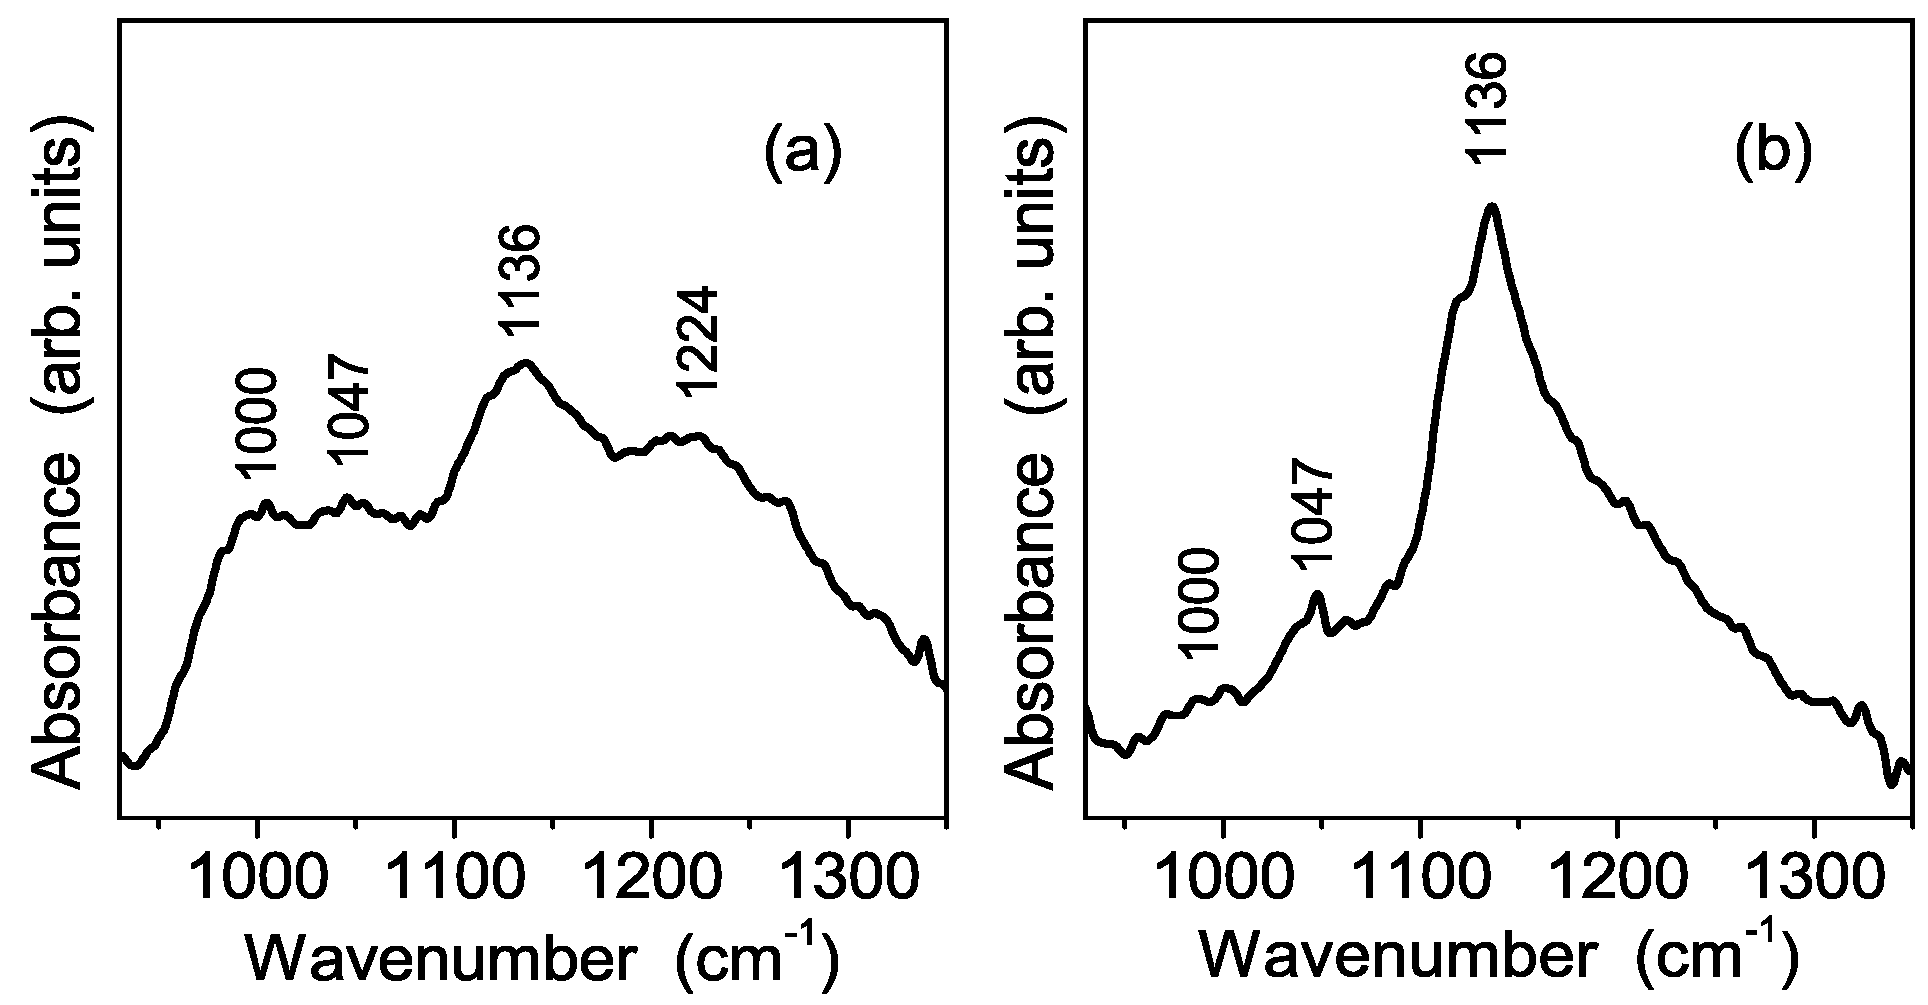
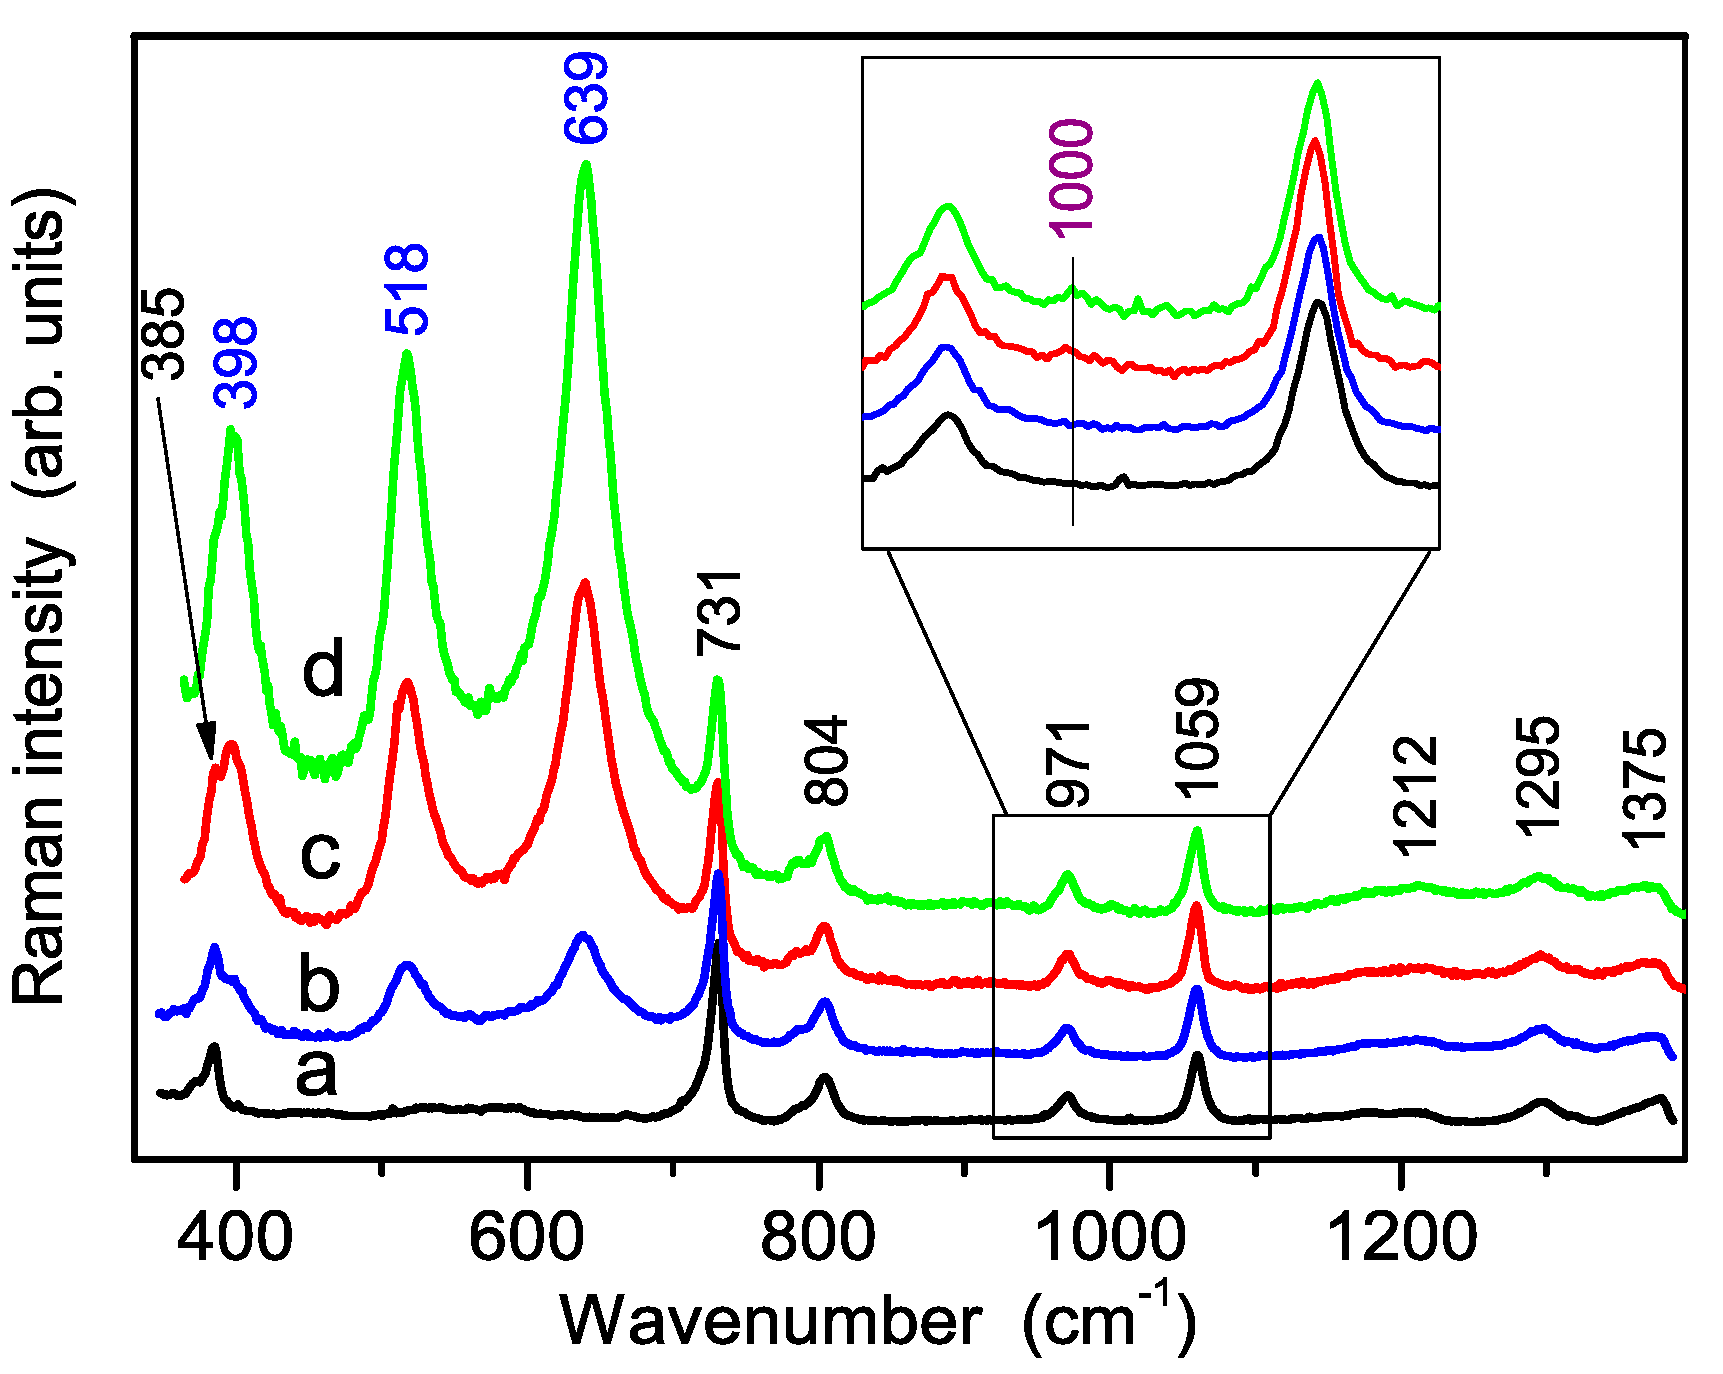
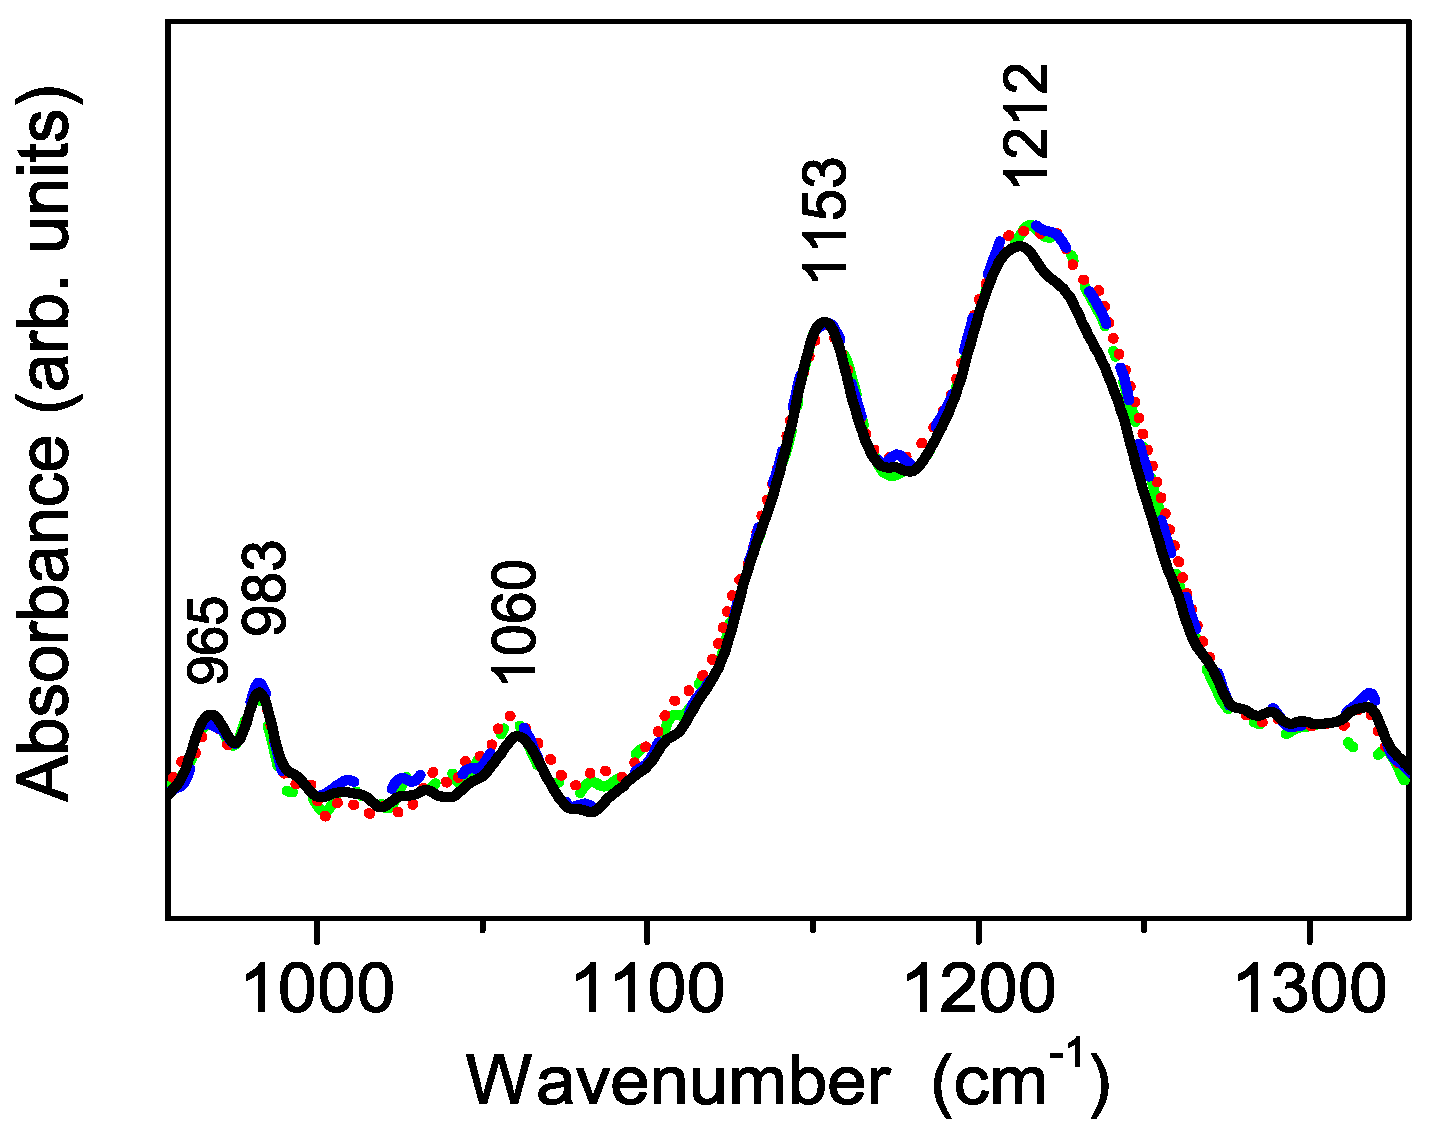
3.3. Vibrational Characterization of Composite Membranes

The vibrational properties of Nafion membranes (pure and composite with three different amounts of filler) were also investigated. The related Raman spectra, observed in the wavenumber region above 380 cm−1, are reported in Figure 8. All of the samples show the characteristic bands of Nafion at about 385 cm−1 [δ(CF2], 731 cm−1 [ns(CF2)], 804 cm−1 [n(C–S)], 971 cm−1 [ns(C–S)], 1059 cm−1 [ns(SO3)], 1212 cm−1 [nas(CF2)], 1295 cm−1 [n(C–C)] and 1375 cm−1 [ns(C–C)] [30]. No significant shift of the Nafion peaks was detected in composite membranes with respect to the pure one. Likewise, the peaks of TiO2 anatase incorporated within the composite membranes spectra occur at the same wavenumbers as in the S-TiO2 powder. Moreover, a spatial inhomogeneity, over the scale of 10 μm, of the S-TiO2 distribution within the membranes, was present in all the nanocomposite samples, so that the spectra reported in Figure 8 should be considered as the representative spectra of the three composite membranes.
As for the Raman spectrum of sulfate groups, shown after proper magnification in the inset of Figure 8, a weak peak occurring at about 1000 cm−1 is clearly observed in composite membranes heavily loaded by S-TiO2 (i.e., with 5% and 7% w/w), thus confirming the persistence of sulfate groups in composite samples after the powder incorporation. Moreover, the comparison between the Raman spectra carried out in the low wavenumber region from S-TiO2 nanopowders and from composite membranes, see Figure 9, indicates the occurrence of an important phase rearrangement of the TiO2 component incorporated into the Nafion membrane, which results in a remarkable decrease of the TiO2-B phase, while the anatase one seems to be unaffected.
The FT-IR ATR spectra of pure and loaded Nafion show five main peaks (Figure 10), all related to Nafion membrane, at about 965, 983, 1060, 1153, and 1212 cm−1, respectively. They turn out in good agreement with the assignments reported in the literature [31]. A small, but systematic, spectral difference is observed for all the loaded samples at about 1220 cm−1.
In principle the origin of the observed difference in the spectral shape in this region might be related either to a rearrangement of the Nafion local structure (and thus of its vibrational properties) due to the powder incorporation or, in alternative, to a contribution of the S-TiO2 sulfate peak at 1224 cm−1. However, in the latter case, one should expect to observe an additional change in the spectrum of the composite membrane near 1136 cm−1, related to the sulfate peak observed in powders with intensity even higher than that of the peak at 1220 cm−1 (see Figure 6). Unfortunately, this is not the case, so the spectral change is likewise due to a change in the Nafion local structure within the composite membrane, thus suggesting an interaction effect between filler and Nafion.

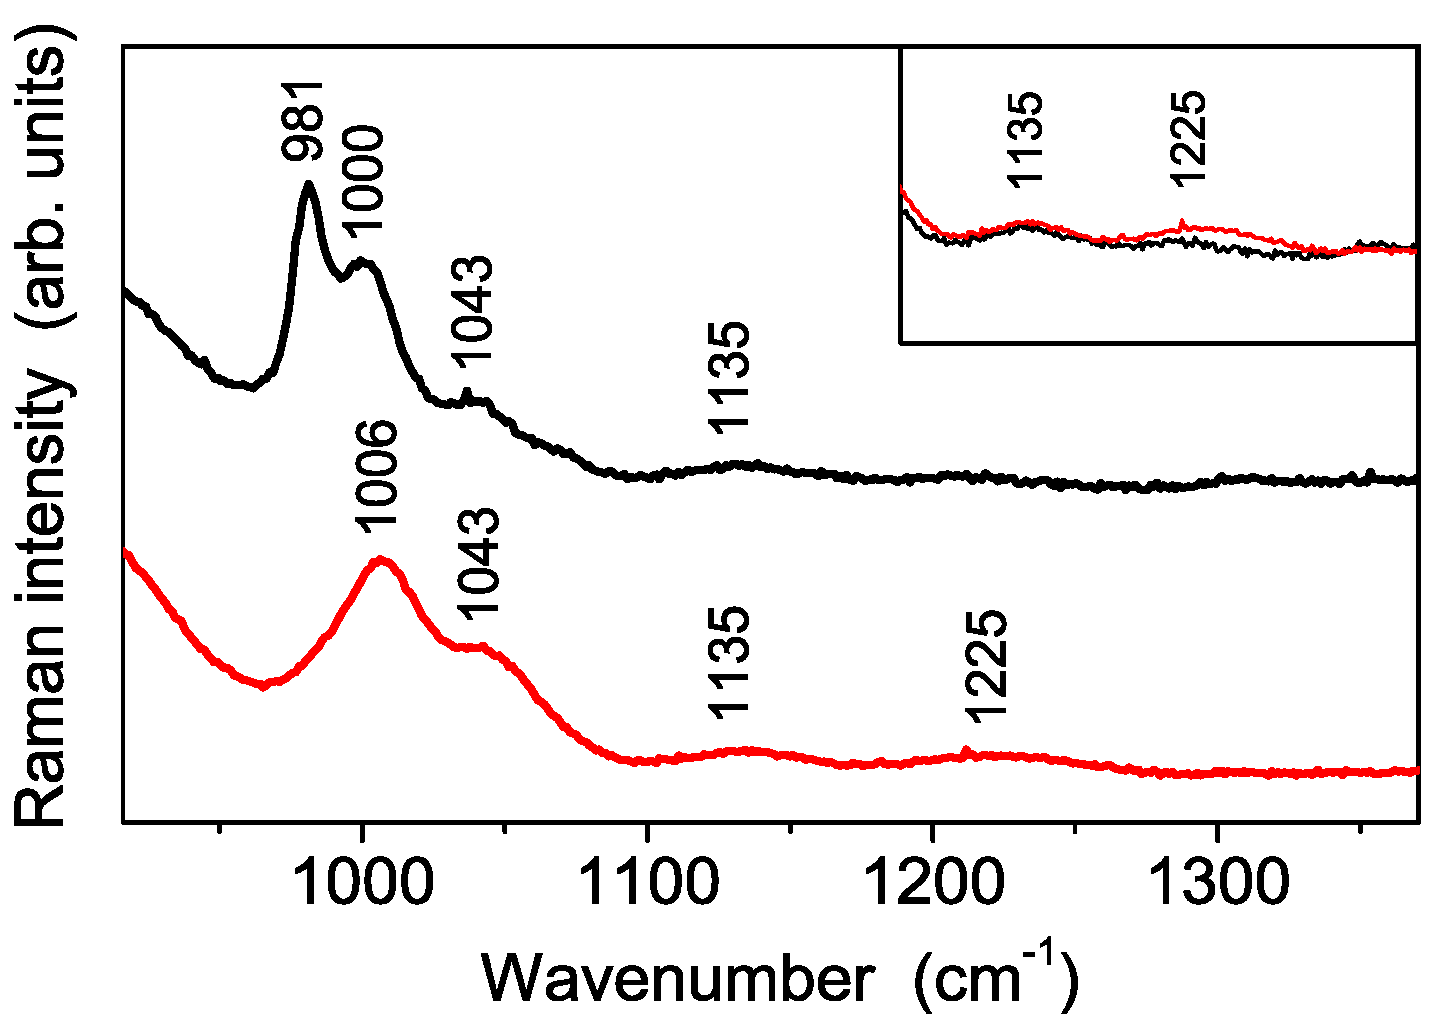
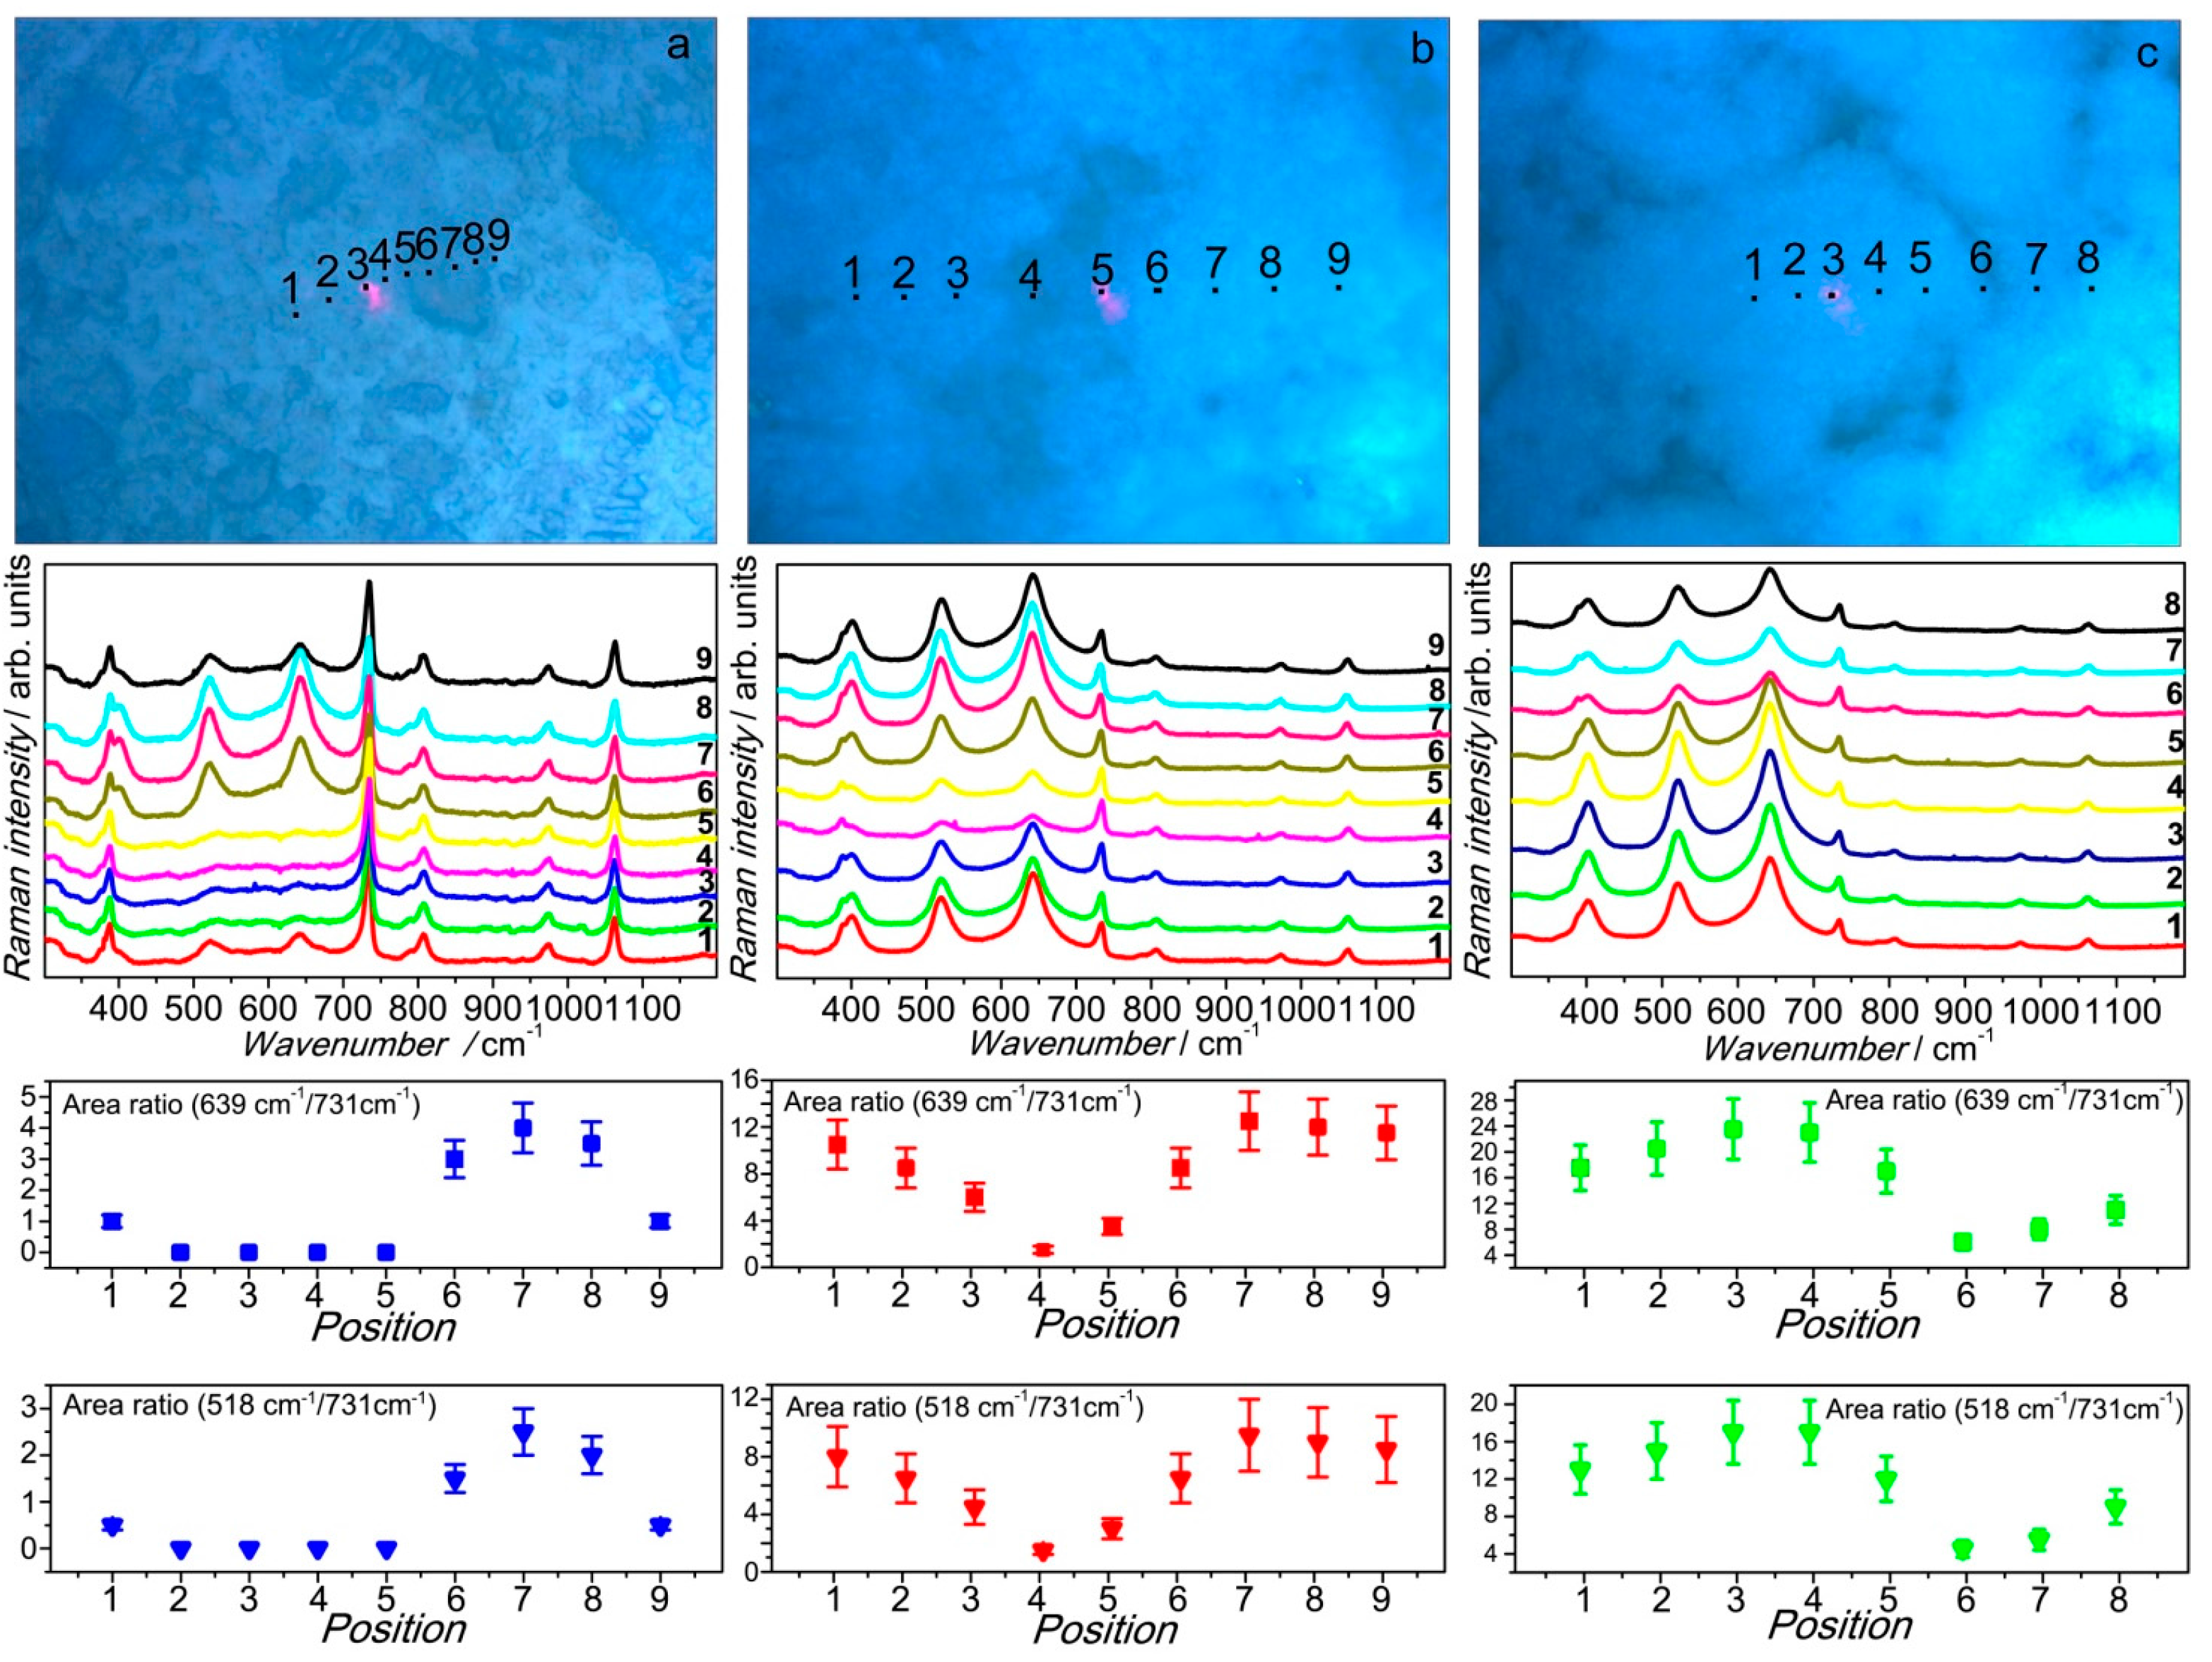
3.4. Membrane Morphology Related Raman Mapping

Optical microscopy images of the composite membranes revealed the non-homogeneous nature of the systems on the micrometric scale. In fact, while pure Nafion looks homogenous, the filler distribution inside the Nafion membranes turns out to not be uniform independently of the incorporated amount since it originates morphologically, unlike regions inside the polymer matrix. Raman micro-spectroscopy allows for the analysis of the different micro-region in the membranes surface in order to probe the S-TiO2 distribution. The results of this hand-made Raman mapping, carried out from the three investigated composite membrane, are cumulatively reported in Figure 11.
Raman spectra, displayed in the three middle panels of this composite figure, were taken step-by-step, moving along a straight line on the surface of the three composite samples, respectively, from the regions serially numbered in the top panels of the figure. The obtained spectra were fitted with Lorentzian curves in order to estimate the weight of each spectral component. Afterwards, the intensity (I) ratios between the membrane peak at about 731 cm−1 and each of the two S-TiO2 peaks at about 639 and 518 cm−1, respectively, were determined. The choice to exploit the area of two powder peaks, in order to derive the intensity ratios, allowed to obtain two independent checks of the fitting procedure validity. The results of this analysis revealed a quite sharp correspondence between the morphology characteristics of the composite membranes and their S-TiO2 content, both the intensity ratios I639/I731 and I518/I731 showing the same behavior. In particular, for the two samples with higher filler content (5% and 7%) the brighter circular zones are richer in S-TiO2, while the surrounding areas have a lower filler amount. In contrast, in the case of the membrane loaded with 2% of filler, the filler-dense regions look darker, due to a different image contrast. Moreover, it was possible to assess that in the case of 2-TiO2-S a part of the membrane remained almost filler-free while, for the higher S-TiO2 percentages, the filler was present in the whole membrane surface, although not homogeneously distributed.

4. Conclusions

This paper presents and discusses the results of systematic investigations, carried out by means of a multi-techniques approach, on sulfated TiO2 nano-powders synthesized via a novel one-step method and three composite Nafion-based membranes, obtained by the incorporation of different amounts of these S-TiO2 powder. Both X-rays diffraction and Raman scattering measurements of sulfated nanopowders indicated the formation of an almost pure titania anatase phase with only a minor amount of TiO2-B phase, typical of nanometric samples. TEM microscopy revealed that the powders obtained through the one-step synthesis are composed by spherical nanoparticles with an average dimension of about 8 nm and a very sharp size distribution. Moreover, vibrational spectroscopy (Raman scattering and FT-IR ATR) allowed the analysis of the sulfate functionalization of the nanopowders either as synthesized or after the exposure to water vapor. The powder functionalization by sulfate groups was also confirmed by TGA analysis, and turn out to be still present even after a severe hydrothermal stability test. This is a crucial condition in order to exploit the use of the powder in presence of a high relative humidity environment, as it occurs in a working proton-conducting membrane fuel cell. The functionalization persistence was confirmed also after the S-TiO2 incorporation inside the Nafion membrane. Evidence of an interaction effect between the filler and the host polymeric network was revealed by FTIR spectroscopy for each one of the filler percentages explored, with a partial rearrangement of the Nafion local structure due to the powder incorporation. The inclusion of the inorganic fillers during the recast procedure induces at microscopic level the formation of zones with different S-TiO2 concentration inside the polymer matrix, although, at least for the case of 5% and 7% filler inclusion, sulfated titania seems to be present over the whole membrane surface. In the case of 2% S-TiO2 membrane, the surface structure consists of filler-rich regions, in form of islands, separated by areas of almost pure Nafion. This structural arrangement does not easily provide any proton percolation path, which in contrast requires a continuous filler presence, as it occurs for membranes loaded with higher inclusion content. Therefore, if the percolation mechanism is the predominant way for protons to conduct, a higher resistance would be expected for the 2% membrane compared to the 5% and 7% ones. Future investigations will be focused on the membranes’ electrochemical behavior, in the aim to verify this hypothesis and, possibly, highlight the influence of hydration on their conduction properties.

Acknowledgments

This work has been performed in the framework of the NAMEDPEM Project “Advanced nanocomposite membranes and innovative electrocatalysts for durable polymer electrolyte membrane fuel cells” (PRIN 2010-2011, project 2010CYTWAW), funded by the Italian MIUR (Ministry of Instruction, University and Research).

Author Contributions

Stefania Panero and Gino Mariotto conceived and designed the experiments; Sergio Brutti and Valentina Allodi performed the experiments (XRD, vibrational spectroscopies, electron microscopy); Valentina Allodi and Marco Giarola analyzed the data; Mirko Sgambetterra and Maria Assunta Navarra synthesized materials, prepared samples and took care of thermogravimetric analyses; Gino Mariotto, Stefania Panero, Sergio Brutti and Maria Assunta Navarra revised data analysis and discussion of results; Valentina Allodi and Gino Mariotto wrote the paper.

Conflicts of Interest

The authors declare no conflict of interest. The founding sponsors had no role in the design of the study; in the collection, analyses, or interpretation of data; in the writing of the manuscript, and in the decision to publish the results.

References

  1. Giffin, G.A.; Piga, M.; Lavina, S.; Navarra, M.A.; D’Epifanio, A.; Scrosati, B.; di Noto, V. Characterization of sulfated-zirconia/Nafion composite membranes for proton exchange membrane fuel cells. J. Power Sources 2012, 198, 66–75. [Google Scholar] [CrossRef]
  2. Tominaka, S.; Akiyama, N.; Croce, F.; Momma, T.; Scrosati, B.; Osaka, T. Sulfated zirconia nanoparticles as a proton conductor for fuel cell electrodes. J. Power Sources 2008, 185, 656–663. [Google Scholar] [CrossRef]
  3. Navarra, M.A.; Croce, F.; Scrosati, B. New, high temperature superacid zirconia-doped Nafion™ composite membranes. J. Mater. Chem. 2007, 17, 3210–3215. [Google Scholar] [CrossRef]
  4. Scipioni, R.; Gazzoli, D.; Teocoli, F.; Palumbo, O.; Paolone, A.; Ibris, N.; Brutti, S.; Navarra, M.A. Preparation and characterization of nanocomposite polymer membranes containing functionalized SnO2 additives. Membranes 2014, 4, 123–142. [Google Scholar] [CrossRef] [PubMed]
  5. Brutti, S.; Scipioni, R.; Navarra, M.A.; Panero, S.; Allodi, V.; Giarola, M.; Mariotto, G. SnO2-Nafion® nanocomposite polymer electrolytes for fuel cell applications. Int. J. Nanotechnol. 2014, 11, 882–896. [Google Scholar] [CrossRef]
  6. Sgambetterra, M.; Panero, S.; Hassoun, J.; Navarra, M.A. Hybrid membranes based on sulfated titania nanoparticles as low cost proton conductors. Ionics 2013, 19, 1203–1206. [Google Scholar] [CrossRef]
  7. Colón, G.; Hidalgo, M.C.; Munuera, G.; Ferino, I.; Cutrufello, M.G.; Navío, J.A. Structural and surface approach to the enhanced photocatalytic activity of sulfated TiO2 photocatalyst. Appl. Catal. B 2006, 63, 45–59. [Google Scholar] [CrossRef]
  8. Sakai, T.; Kajitani, S.; Hamagami, S.J.; Oda, H.; Matsuka, M.; Matsumoto, H.; Ishihara, T. Proton conduction properties of hydrous sulfated nano-titania synthesized by hydrolysis of titanyl sulfate. Solid State Ionics 2010, 181, 1746–1749. [Google Scholar] [CrossRef]
  9. Aslan, A.; Bozkurt, A. An investigation of proton conductivity of nanocomposite membranes based on sulfated nano-titania and polymer. Solid State Ionics 2013, 239, 21–27. [Google Scholar] [CrossRef]
  10. Nicotera, I.; Kosma, V.; Simari, C.; Ranieri, G.A.; Sgambetterra, M.; Panero, S.; Navarra, M.A. An NMR study on the molecular dynamic and exchange effects in composite Nafion/sulfated titania membranes for PEMFCs. Int. J. Hydrogen. Energ. 2015, 40, 14651–14660. [Google Scholar] [CrossRef]
  11. Krishnakumar, B.; Velmurugan, R.; Swaminathan, M. TiO2-SO42− as a novel solid acid catalyst for highly efficient, solvent free and easy synthesis of chalcones under microwave irradiation. Catal. Commun. 2011, 12, 375–379. [Google Scholar] [CrossRef]
  12. Larson, A.C.; Von Dreele, R.B. General Structure Analysis System (GSAS); Los Alamos National Laboratory Report LAUR: Los Alamos, NM, USA, 1994. [Google Scholar]
  13. Banfield, J.F.; Veblen, R. Conversion of perovskite to anatase and TiO2(B): A TEM study and the use of fundamental building blocks for understanding relationships among the TiO2 minerals. Am. Miner. 1992, 77, 545–557. [Google Scholar]
  14. Young, R.A. The Rietveld Method; Oxford University Press: London, UK, 1993. [Google Scholar]
  15. Cromer, D.T.; Herrington, K. The structures of anatase and rutile. J. Am. Chem. Soc. 1955, 77, 4708–4709. [Google Scholar] [CrossRef]
  16. Kavan, L.; Grätzel, M.; Gilbert, S.E.; Klemenz, C.; Scheel, H.J. Electrochemical and photoelectrochemical investigation of single-crystal anatase. J. Am. Chem. Soc. 1996, 118, 6716–6726. [Google Scholar] [CrossRef]
  17. Liu, Z.; Andreev, Y.; G. Armstrong, A.R.; Brutti, S.; Ren, Y.; Bruce, P.G. Nanostructured TiO2(B): The effect of size and shape on anode properties for Li-ion batteries. Progr. Nat. Sci. 2013, 23, 235–244. [Google Scholar] [CrossRef]
  18. Beuvier, T.; Richard-Plouet, M.; Brohan, L. Accurate methods for quantifying the relative ratio of anatase and TiO2(B) nanoparticles. J. Phys. Chem. C 2009, 113, 13703–13706. [Google Scholar] [CrossRef]
  19. Gentili, V.; Brutti, S.; Hardwick, L.J.; Armstrong, A.R.; Panero, S.; Bruce, P.G. Lithium insertion into anatase nanotubes. Chem. Mater. 2012, 24, 4468–4476. [Google Scholar] [CrossRef]
  20. Abramoff, M.D.; Magalhaes, P.J.; Ram, S.J. Image processing with Image. J. Biophotonics. Int. 2004, 11, 36–42. [Google Scholar]
  21. Rasband, W.S. Image J.; National Institutes of Health: Bethesda, MD, USA, 1997. [Google Scholar]
  22. Bersani, D.; Lottici, P.P.; Ding, X.-Z. Phonon confinement effects in the Raman scattering by TiO2 nanocrystals. Appl. Phys. Letts 1998, 82, 73–75. [Google Scholar] [CrossRef]
  23. Giarola, M.; Sanson, A.; Monti, F.; Mariotto, G.; Bettinelli, M.; Speghini, A.; Salviulo, G. Vibrational dynamics of anatase TiO2: Polarized Raman spectroscopy and ab initio calculations. Phys. Rev. B 2010, 81. [Google Scholar] [CrossRef]
  24. Ben Yahia, M.; Lemoigno, F.; Beuvier, T.; Filhol, J.; Richard-Plouet, M.; Brohan, L.; Doublet, M.-L. Updated references for the structural, electronic, and vibrational properties of TiO2(B) bulk using first-principles density functional theory calculations. J. Chem. Phys. 2009, 130, 204501. [Google Scholar] [CrossRef] [PubMed]
  25. Kobayashi, M.; Petrykin, V.V.; Kakihana, M. One-step synthesis of TiO2(B) nanoparticles from a water-soluble titanium complex. Chem. Mater. 2007, 19, 5373–5376. [Google Scholar] [CrossRef]
  26. Nakamoto, K. Infrared and raman spectra of inorganic and coordination compounds. In Handbook of Vibrational Spectroscopy; J. Wiley&Sons: New York, NY, USA, 1986. [Google Scholar]
  27. Arata, K.; Hino, M. Preparation of superacids by metal-oxides and their cathalitic action. Mater. Chem. Phys. 1990, 26, 213–237. [Google Scholar] [CrossRef]
  28. Bolis, V.; Magnavacca, G.; Cerrato, G.; Morterra, C. Surface heterogeneity on hydrophilic and hydrophobic silicas: Water and alcohols as probes for H-bonding and dispersion forces. Langmuir 1997, 13, 888–894. [Google Scholar] [CrossRef]
  29. Myhre, C.E.L.; Christensen, D.H.; Nicolaisen, F.M.; Nielsen, C.J. Spectroscopic study of aqueous H2SO4 at different temperatures and compositions: Variations in dissociation and optical properties. J. Phys. Chem. A 2003, 107, 1979–1991. [Google Scholar] [CrossRef]
  30. Gruger, A.; Régis, A.; Schmatko, T.; Colomban, P. Nanostructure of Nafion (R) membranes at different states of hydration—An IR and Raman study. Vibr. Spectrosc. 2001, 26, 215–225. [Google Scholar] [CrossRef]
  31. Kunimatsu, K.; Bae, B.; Miyatake, K.; Uchida, H.; Watanabe, M. ATR-FTIR study of water in Nafion membrane combined with proton conductivity measurements during hydration/dehydration cycle. J. Phys. Chem. B 2011, 115, 4315–4321. [Google Scholar] [CrossRef] [PubMed]
Figure 1. Synchrotron diffraction patters of the synthesized samples fitted by Rietveld method using the GSAS software.
Polymers 08 00068 g001
Figure 2. Transmission electron micrographs of the synthesized powders. In the inset of the bottom micrograph a FFT pattern of the periodic arrangement of the crystal planes is shown with an indexing for the trigonal anatase lattice.
Polymers 08 00068 g002
Figure 3. TGA of hydrolyzed (a) and pristine (b) powders.
Polymers 08 00068 g003
Figure 4. DTG curves of hydrolyzed (a) and pristine (b) powders.
Polymers 08 00068 g004
Figure 5. Experimental Raman spectra of the synthesized sample showing typical features of TiO2 (panel a) and of sulfate group SO42− (panel b). The details about the spectra detection are provided in the text.
Polymers 08 00068 g005
Figure 6. FT-IR ATR spectra of the synthesized sample showing typical features of the sulfate group SO42− recorded before (panel a) and after (panel b) the storage in high relative humidity environment. The details about the spectra detection are provided in the text.
Polymers 08 00068 g006
Figure 7. Raman spectra of the synthesized sample before (red) and after (black) the storage in high humidity environment. Inset: direct comparison of the 1225 cm−1 peak intensity.
Polymers 08 00068 g007
Figure 8. Experimental Raman spectra, carried out in the high wavenumber region, of pure Nafion membrane (a) and of three composite membranes with increasing amounts of TiO2 nanopowders: 2% (b) 5% (c) and 7% (d). The inset report the spectra of SO42− groups in the region 950–1090 cm−1 after proper magnification.
Polymers 08 00068 g008
Figure 9. Experimental Raman spectra carried out in the low wavenumber region on S-TiO2 nanopowder sample (red trace) and on nanocomposite membrane loaded by 7% w/w of S-TiO2 (black trace). The two arrows indicate the TiO2-B phase modes at about 250 and 310 cm−1, respectively, while the pair of stars (*) labels the Nafion peaks at about 292 cm−1 (t(CF2)) and 310 cm−1, assigned to the t(CF2) mode [25].
Polymers 08 00068 g009
Figure 10. FT-IR ATR spectra of the pure Nafion (black line) and loaded composite n-TiO2-S-N (n = 2, 5, 7) membranes showing small, but significant, differences in the spectral region near 1220 cm−1. For the details refer to the text.
Polymers 08 00068 g010
Figure 11. Raman mapping of the three composite membranes: 2-TiO2-S (a) 5-TiO2-S (b) and 7-TiO2-S (c). For each sample, the upper panel shows the optical microscopy image, the middle one the Raman spectra in the different samples. The red spot observed in the optical images is the laser beam, whose size is of the order of 1 micron.
Polymers 08 00068 g011
Table 1. Plain Nafion and composite Nafion membranes investigated in this work.
SampleFillerFiller content (wt %)Sample acronym
Plain NafionNone0N
Composite NafionSuperacid S-TiO222-TiO2-S
Composite NafionSuperacid S-TiO255-TiO2-S
Composite NafionSuperacid S-TiO277-TiO2-S

