1. Introduction
Chronic osteomyelitis, an osseous infection, causes severe recurrent inflammation, hastens the presence of necrotic bone and sequestrum, and can lead to other serious complications if left untreated. It is commonly caused by pathogenic microorganisms, which can adhere to and even invade mammalian cells. However, drug-resistant pathogens such as methicillin-resistant
Staphylococcus aureus (MRSA) and multidrug-resistant (MDR) mycobacteria, have developed the ability to persist in intracellular locations.[
1] Many antibiotic families are hydrophilic or exhibit low intracellular retention, which hinders their effectiveness because they are unable to penetrate cells.[
2] Furthermore, chronic osteomyelitis is intrinsically resistant to antibiotic treatment, even when caused by bacteria that are not among the drug-resistant strains, mainly because they frequently form biofilms on necrotic bone and foreign bodies, making them up to 800-fold less susceptible to antibiotics than planktonic forms [
3].
Glycopeptide antibiotics, such as vancomycin (VCM), a tricyclic glycosylated nonribosomal peptide, act against Gram-positive bacteria. This family of antibiotics is used as a last resort for the treatment of drug-resistant bacteria. VCM acts by inhibiting cell wall synthesis in Gram-positive bacteria, and prevents cross-linking between any cell wall polymers that do manage to form.
Instead of looking for new antibiotics, research on the treatment of chronic osteomyelitis has turned toward new delivery systems. Nanocarriers [
1,
4,
5], such as liposomes and nanoparticles, offer high intracellular penetration and the potential for effective intracellular antibacterial activity over extended time periods. Zakeri-Milani
et al. improved the intestinal permeation of VCM by using VCM-loaded poly(lactide-
co-glycolide) (PLGA) nanoparticles [
6]. VCM solid lipid nanoparticles, adjuvanted with linoleic acid, exhibited higher antibacterial activity than VCM towards both susceptible and resistant bacteria [
7]. The biggest limitations associated with most nanocarriers are poor release profiles, with some having an initial burst phase in which most of the drug is lost, or weak antibacterial activities that require the use of very high antibiotic concentrations. Until now, no studies have been published on the application of VCM-loaded
N-trimethyl chitosan (TMC) nanoparticles for intracellular infections, or on detailed evaluations of the properties of the TMC polymer nanoparticle material, which could overcome limitations associated with other materials.
In the present study, with the aim to increase the sustained effectiveness of intracellular antibiotics, VCM-loaded TMC nanoparticles were prepared by single ionic complexation. Dynamic light scattering (DLS), transmission electron microscopy (TEM), and atomic force microscopy (AFM) were performed to characterize the test formulations. Dialysis was performed to evaluate the drug release, which was measured by reverse-phase high performance liquid chromatography (HPLC).
In vitro cytology examining alkaline phosphatase (ALP) activity, cell uptake ability, proliferative ability, and the effect on antibacterial activity, including minimum inhibitory concentration (MIC), half maximal inhibitory concentration (IC50), diameter of inhibition zone (DIZ), and turbidimetric (TB) assay were also analyzed for the nanoparticles (
Scheme 1).
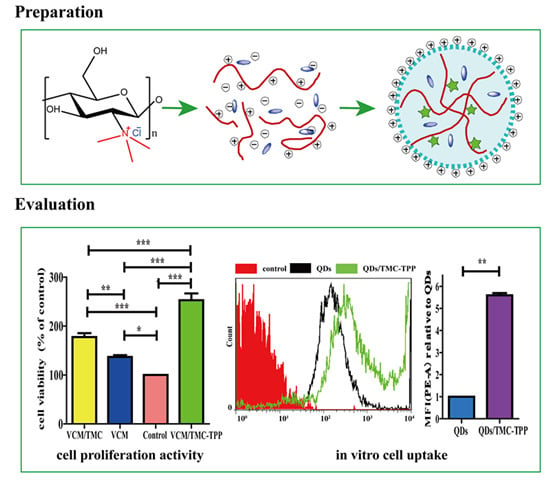
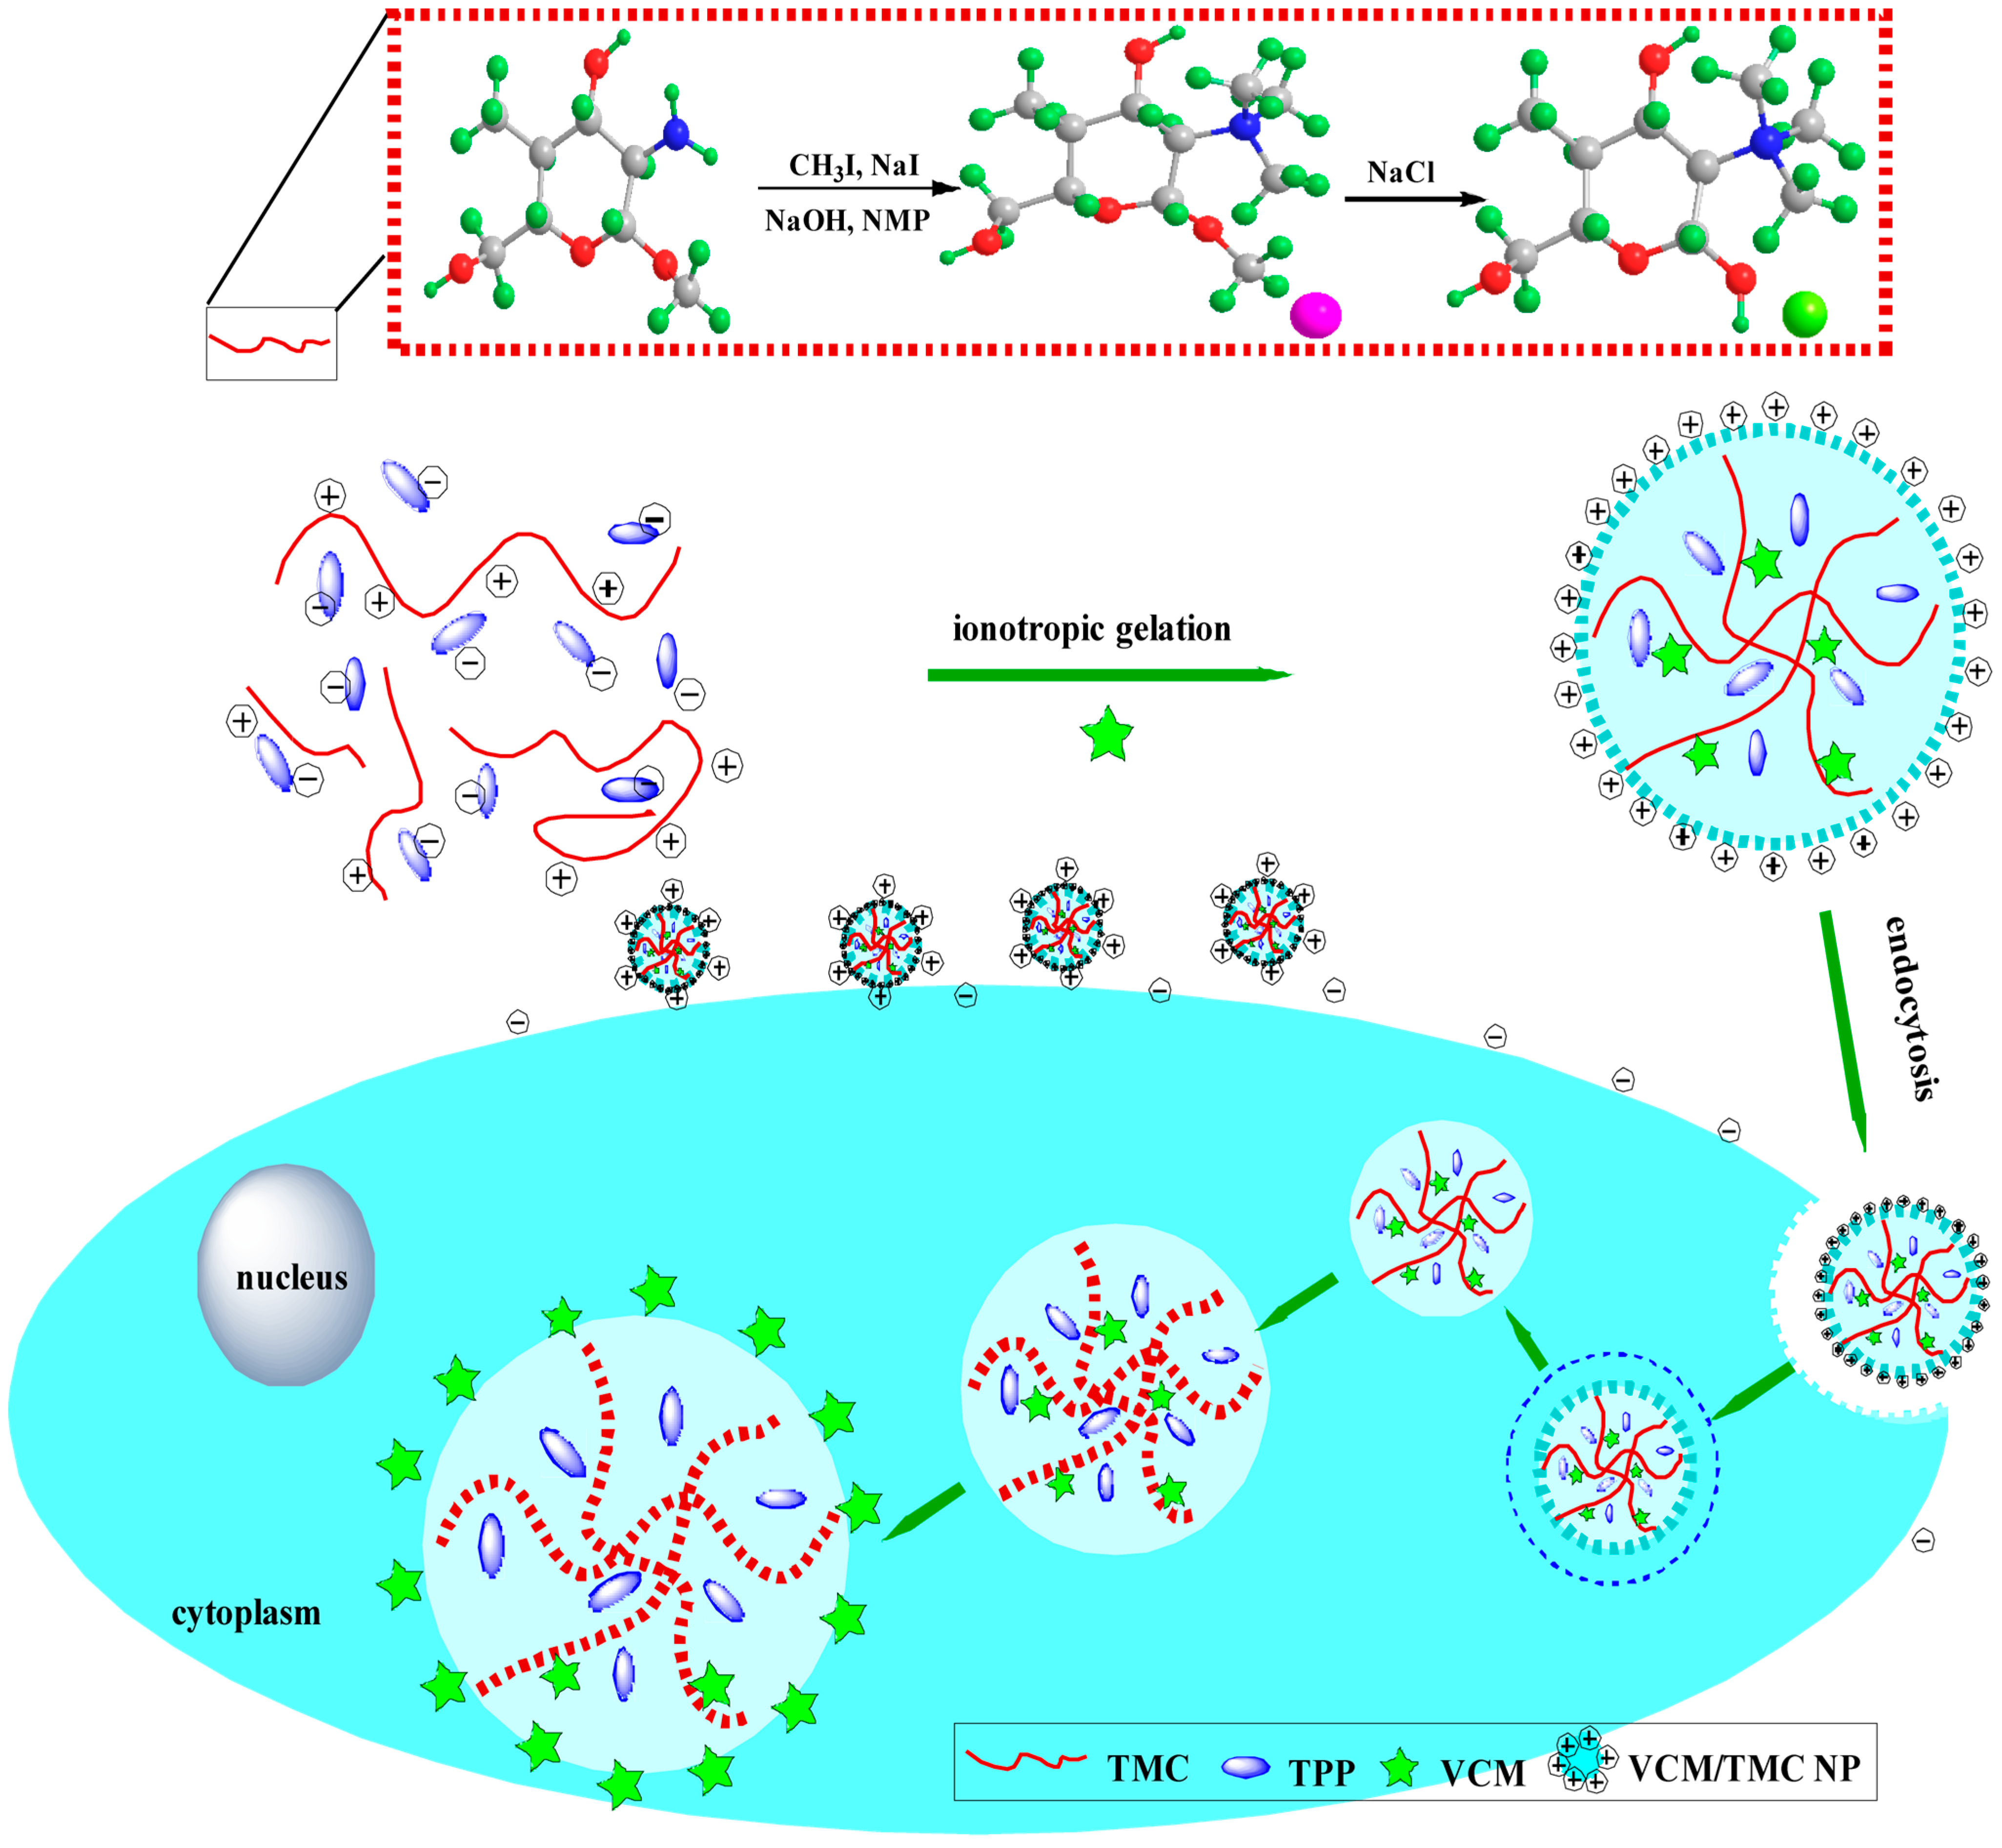
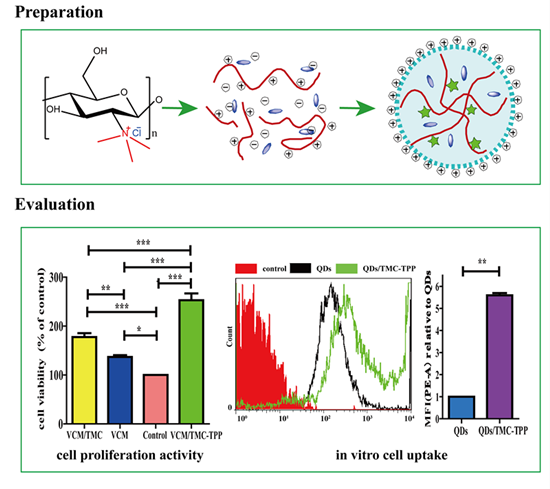
Scheme 1.
A schematic diagram showing the formation of TMC polymer and VCM-loaded TMC nanoparticles, and the interaction between nanoparticles and cells during the uptake process. NMP, N-methylpyrrolidone; TMC, N-trimethyl chitosan; TPP, sodium tripolyphosphate; VCM, vancomycin; NP, nanoparticle.
Scheme 1.
A schematic diagram showing the formation of TMC polymer and VCM-loaded TMC nanoparticles, and the interaction between nanoparticles and cells during the uptake process. NMP, N-methylpyrrolidone; TMC, N-trimethyl chitosan; TPP, sodium tripolyphosphate; VCM, vancomycin; NP, nanoparticle.
2. Experimental Section
2.1. Materials
Vancomycin hydrochloride (VCM-HCl) was supplied by Dalian Meilun Biotech Co., Ltd. (Dalian, China). Chitosan (600 K) was obtained from Zhejiang Golden-Shell Biochemical Co., Ltd. (Zhejiang, China). N-(2-hydroxyethyl) piperazine-N′-(2-ethanesulphonic acid) (Hepes) and sodium tripolyphosphate (TPP) were purchased from Aladdin (Shanghai, China). N-methylpyrrolidone (NMP), sodium iodide, and iodomethane were purchased from Shanghai Sinopharm Chemical Reagent Company (Shanghai, China). Spectra/Por dialysis tubing (MWCO 2 kDa) (Spectrum Labs, Inc., New York, NY, USA) was used as received. Beyotime Institute of Biotechnology (Zhejiang, China) supplied the Cytotoxicity Assay Kit and all cell culture reagents. Carboxy-CdSe/ZnS quantum dots (QDs, water-soluble red fluorescent) were purchased from Beijing Zhongke Wu Yuan Biotechnology Co., Ltd. (Beijing, China). Methanol (HPLC grade) was purchased from Fisher Chemical (Suzhou, China). Other reagents and chemicals were of analytical reagent grade, unless indicated otherwise.
2.2. High-Performance Liquid Chromatography Analysis
Reverse-phase high performance liquid chromatography (HPLC, UltiMate3000, Dionex, Sunnyvale, CA, USA) was used to determine the antibiotic concentration of VCM. Briefly, chromatography was performed on a C18 analytical column (Agilent, Foster City, CA, USA, 4.6 mm × 250 mm) at 37 °C, with a flow rate of 0.7 mL/min. The mobile phase consisted of methanol and potassium dihydrogen phosphate buffer (0.025 mol/L, pH 3.2) mixed at a ratio of 20:80 (v/v). The peaks were identified via UV absorbance at 230 nm and the injection volume was 20 μL. The calibration curves exhibited linear behavior (R2 = 0.9998) over the concentration range of 5–100 μg/mL, and were fit to the linear equation of A = 0.7948C + 0.0761.
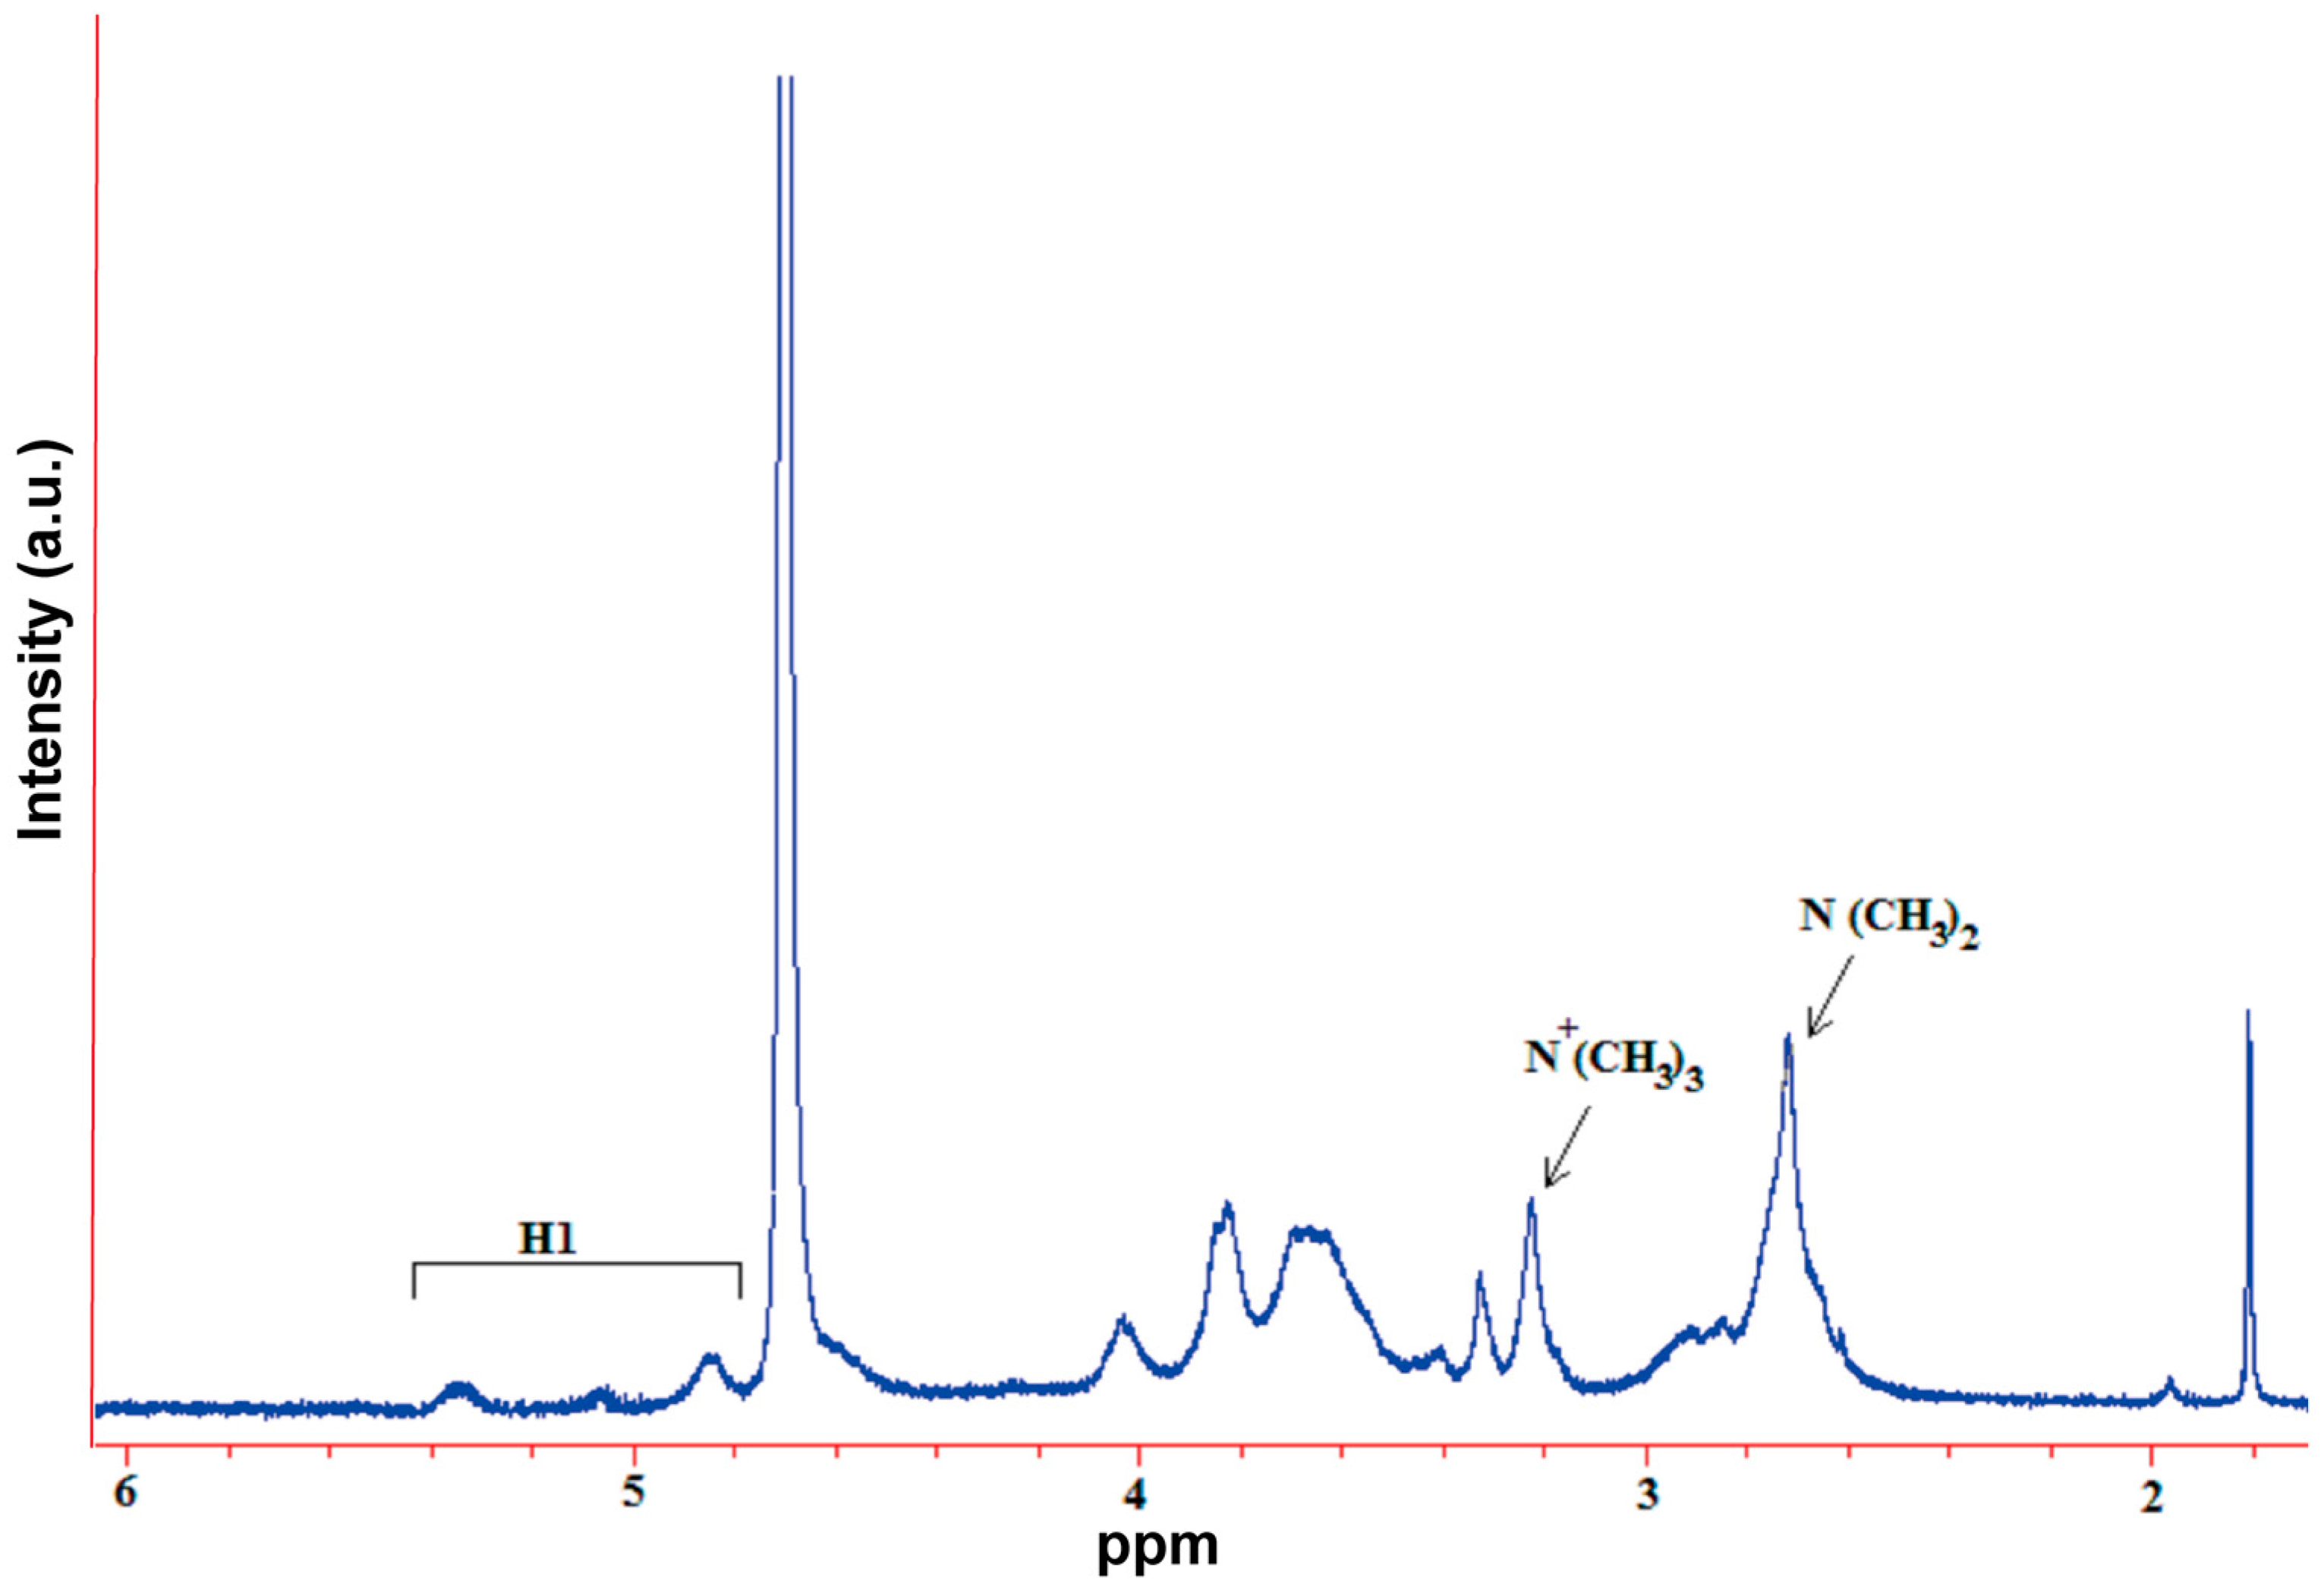
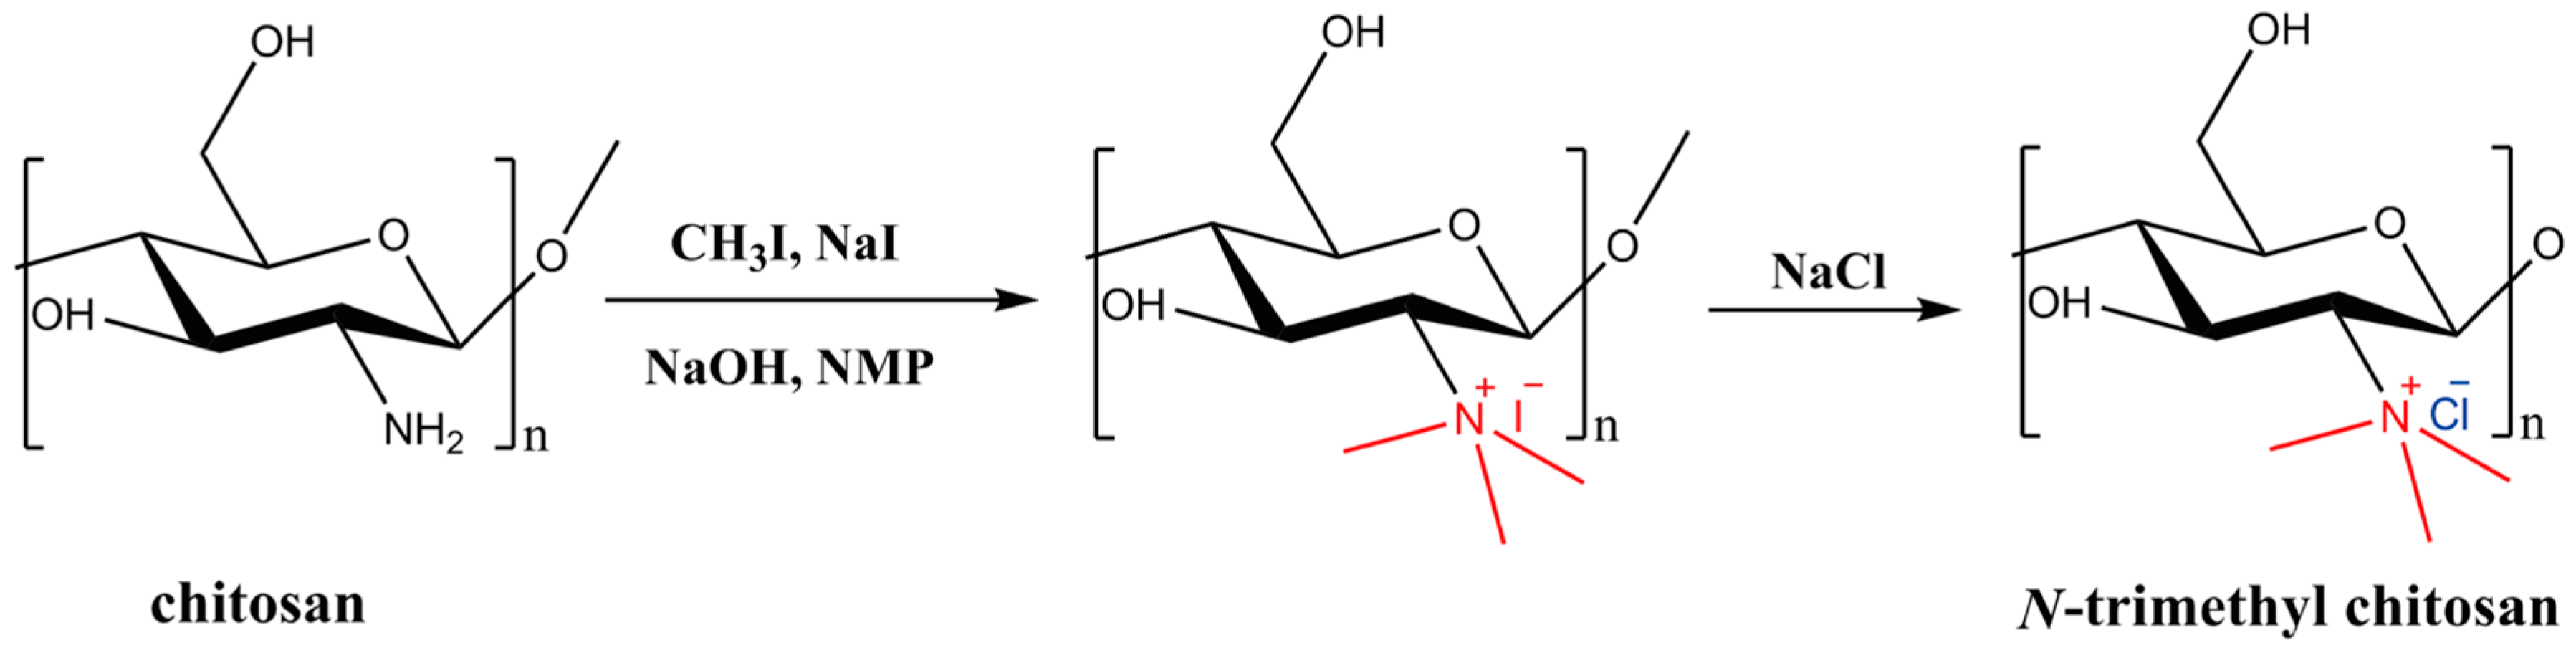
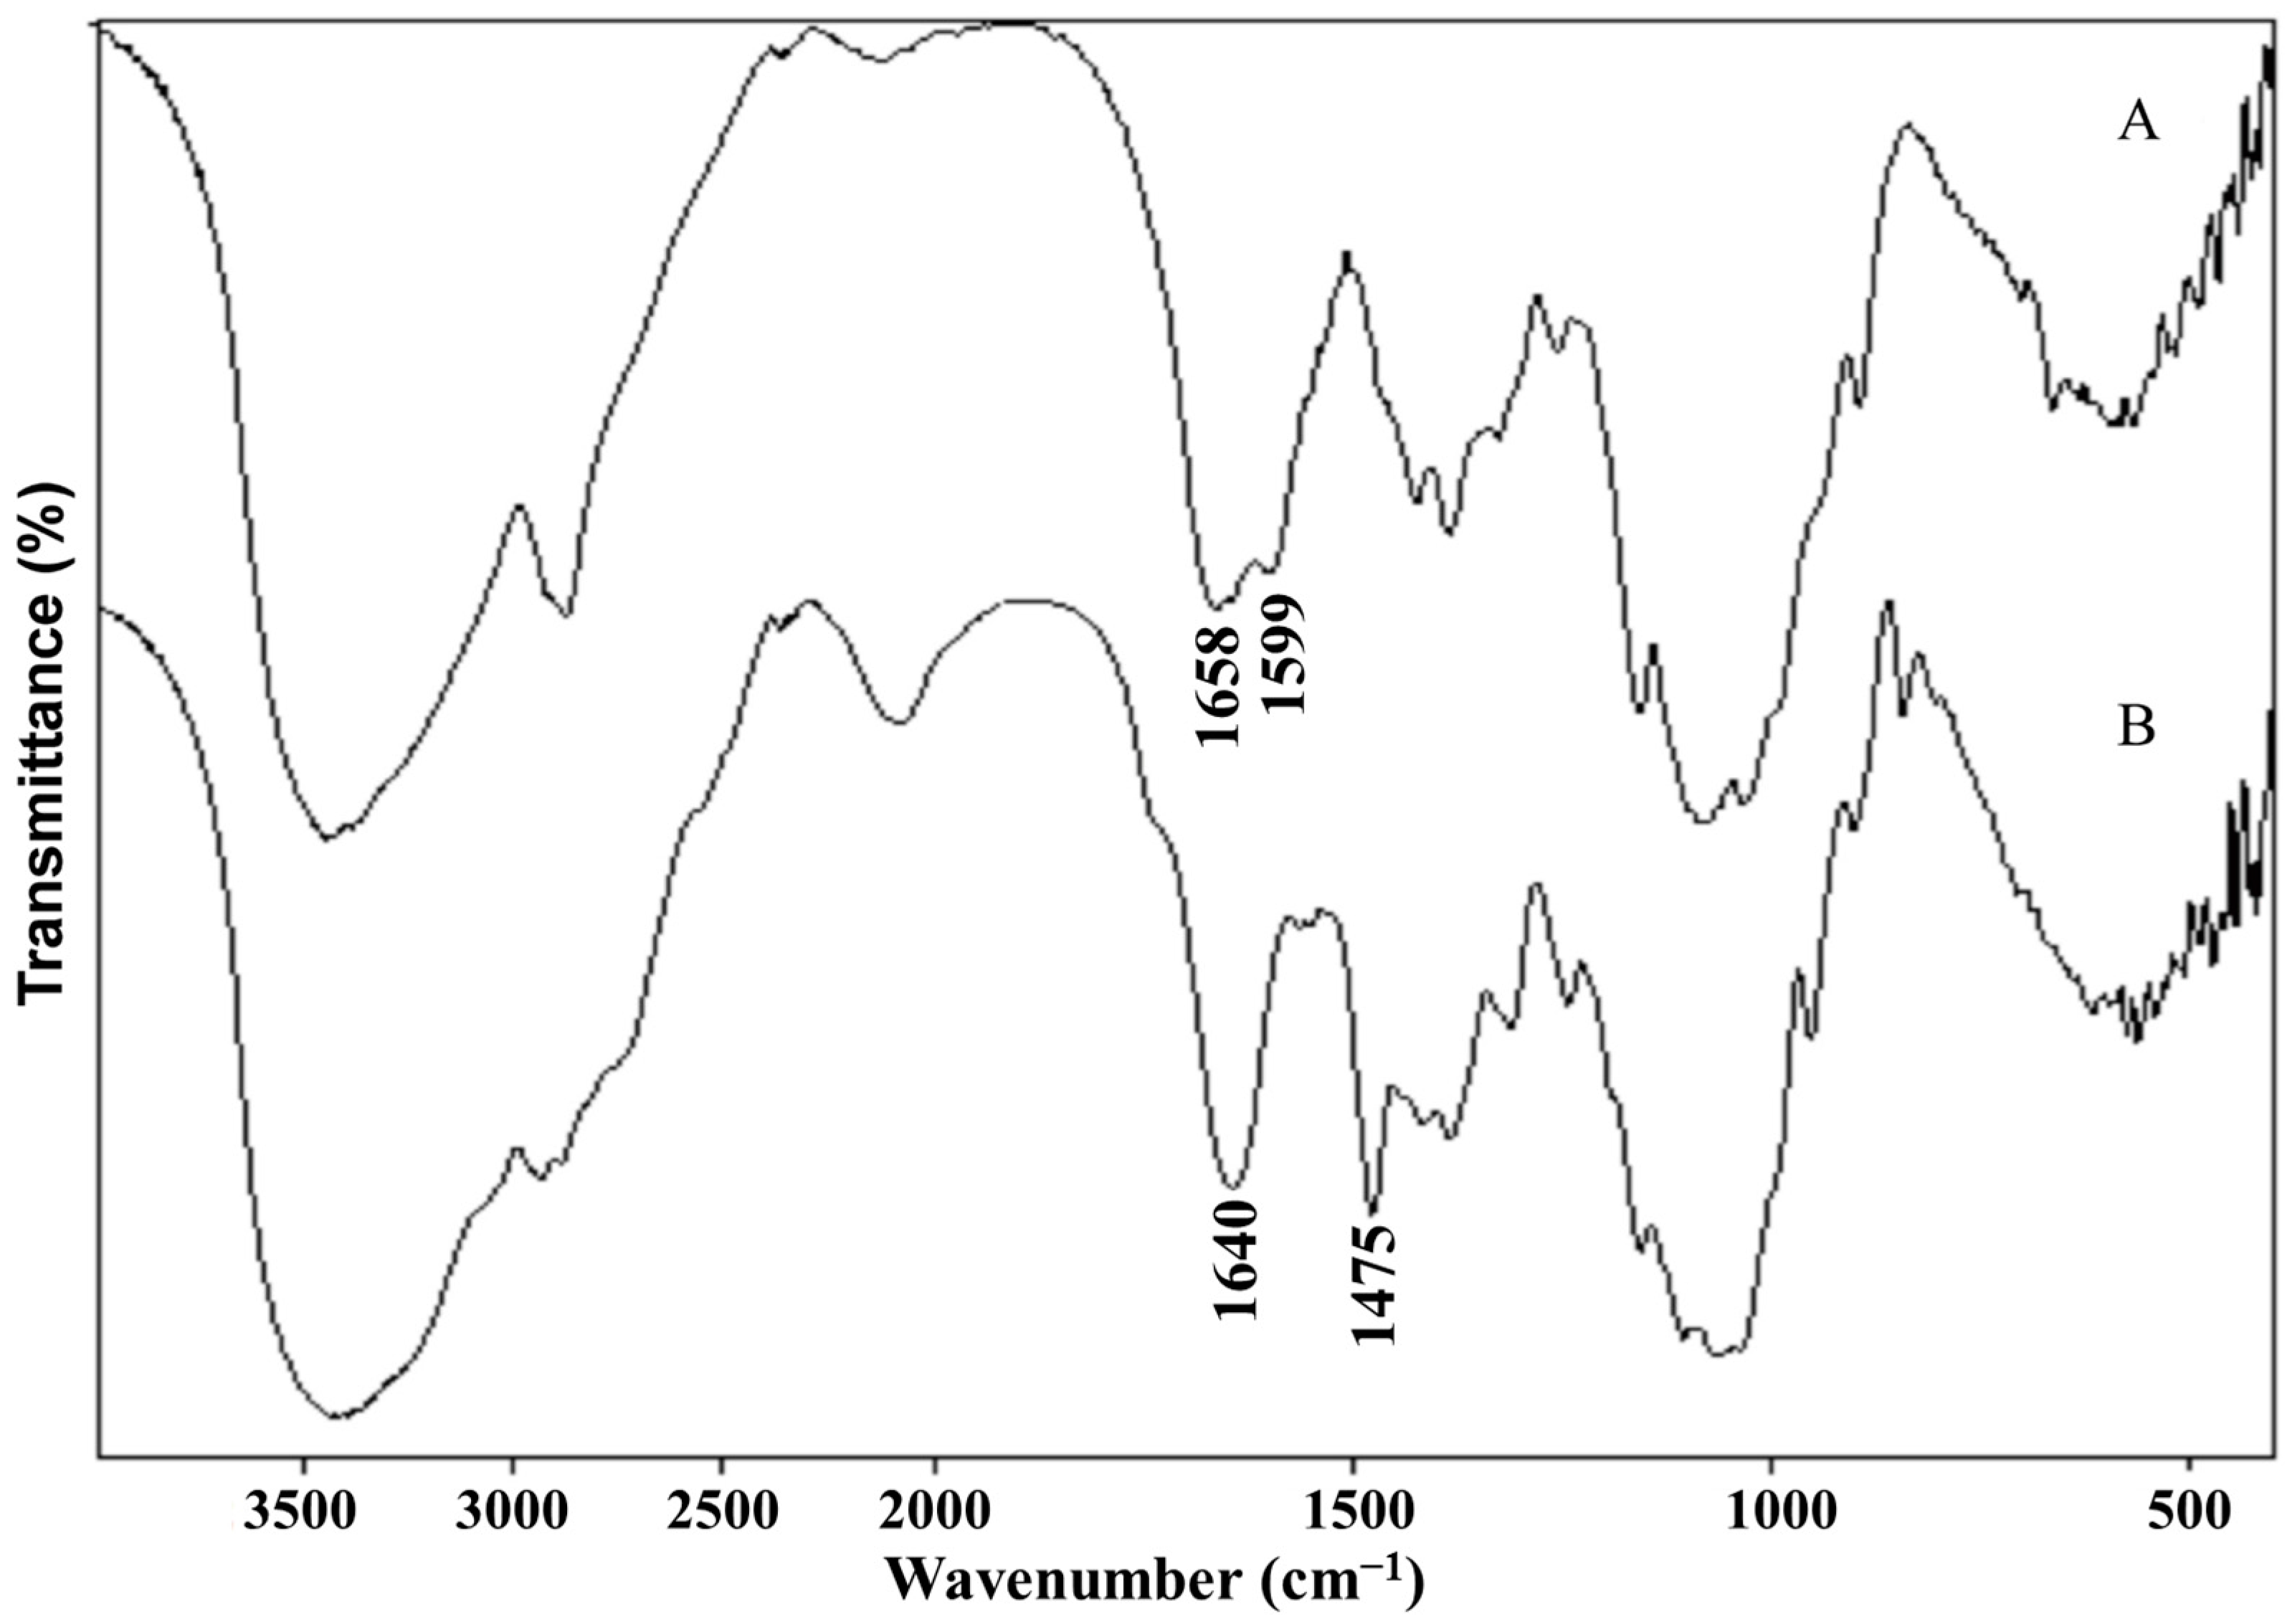
2.3. Synthesis and Characterization of N-Trimethyl Chitosan (TMC)
A mixture of chitosan (2 g) and NMP (80 mL) were stirred at room temperature overnight. Sodium iodide (4.8 g) and 15% NaOH solution (11 mL) were added and stirred at 60 °C for 20 min, following which iodomethane (12 mL) was added. After 2 h of reaction, 15% NaOH solution (11 mL) and iodomethane (6 mL) were added to the reaction mixture. The reaction was continued for 2 h. The reaction mixture was then cooled and poured into ethanol (600 mL). The precipitate was filtered and dissolved in 10% NaCl solution (30 mL), which was then poured into ethanol (150 mL). The precipitate was filtered and dissolved in ultrapure water (16 mL), and subsequently dialyzed with deionized water for two days and lyophilized. The purified TMC was analyzed by Fourier transform infrared spectroscopy (FT-IR, Spectrum One, PerkinElmer, Foster City, CA, USA), with the sample embedded in KBr pellets, and proton nuclear magnetic resonance spectroscopy (1H NMR, DMX-400, Bruker, Rheinstetten, Germany) with the sample dissolved in D2O.
2.4. Preparation of TMC Nanoparticles
Simple ionic complexation was used to prepare both plain TMC nanoparticles and VCM-loaded TMC nanoparticles. For a 10 mL batch of nanoparticles, a TPP solution (1 mg/mL, serving as a physical crosslinker) was added to a solution of TMC (1 mg/mL, dissolved in Hepes pH 7.4) at a drop rate of 6 mL/h, under continuous stirring (200 rpm), to a final TMC:TPP weight ratio of 10:1.8. At this point, the solution became opalescent and uniform in appearance. After 1.5 h of stirring, the nanoparticle suspension was collected by centrifugation (10 min, 12,000 g) and re-suspended in water. VCM-loaded TMC nanoparticles were prepared in the same way as non-loaded TMC nanoparticles, by co-dissolving the antibiotic (1 mg) in the TMC solution. Solid preparations of nanoparticle powder were prepared by freeze-drying the nanoparticle solutions.
2.5. Characterization of VCM/TMC Nanoparticles
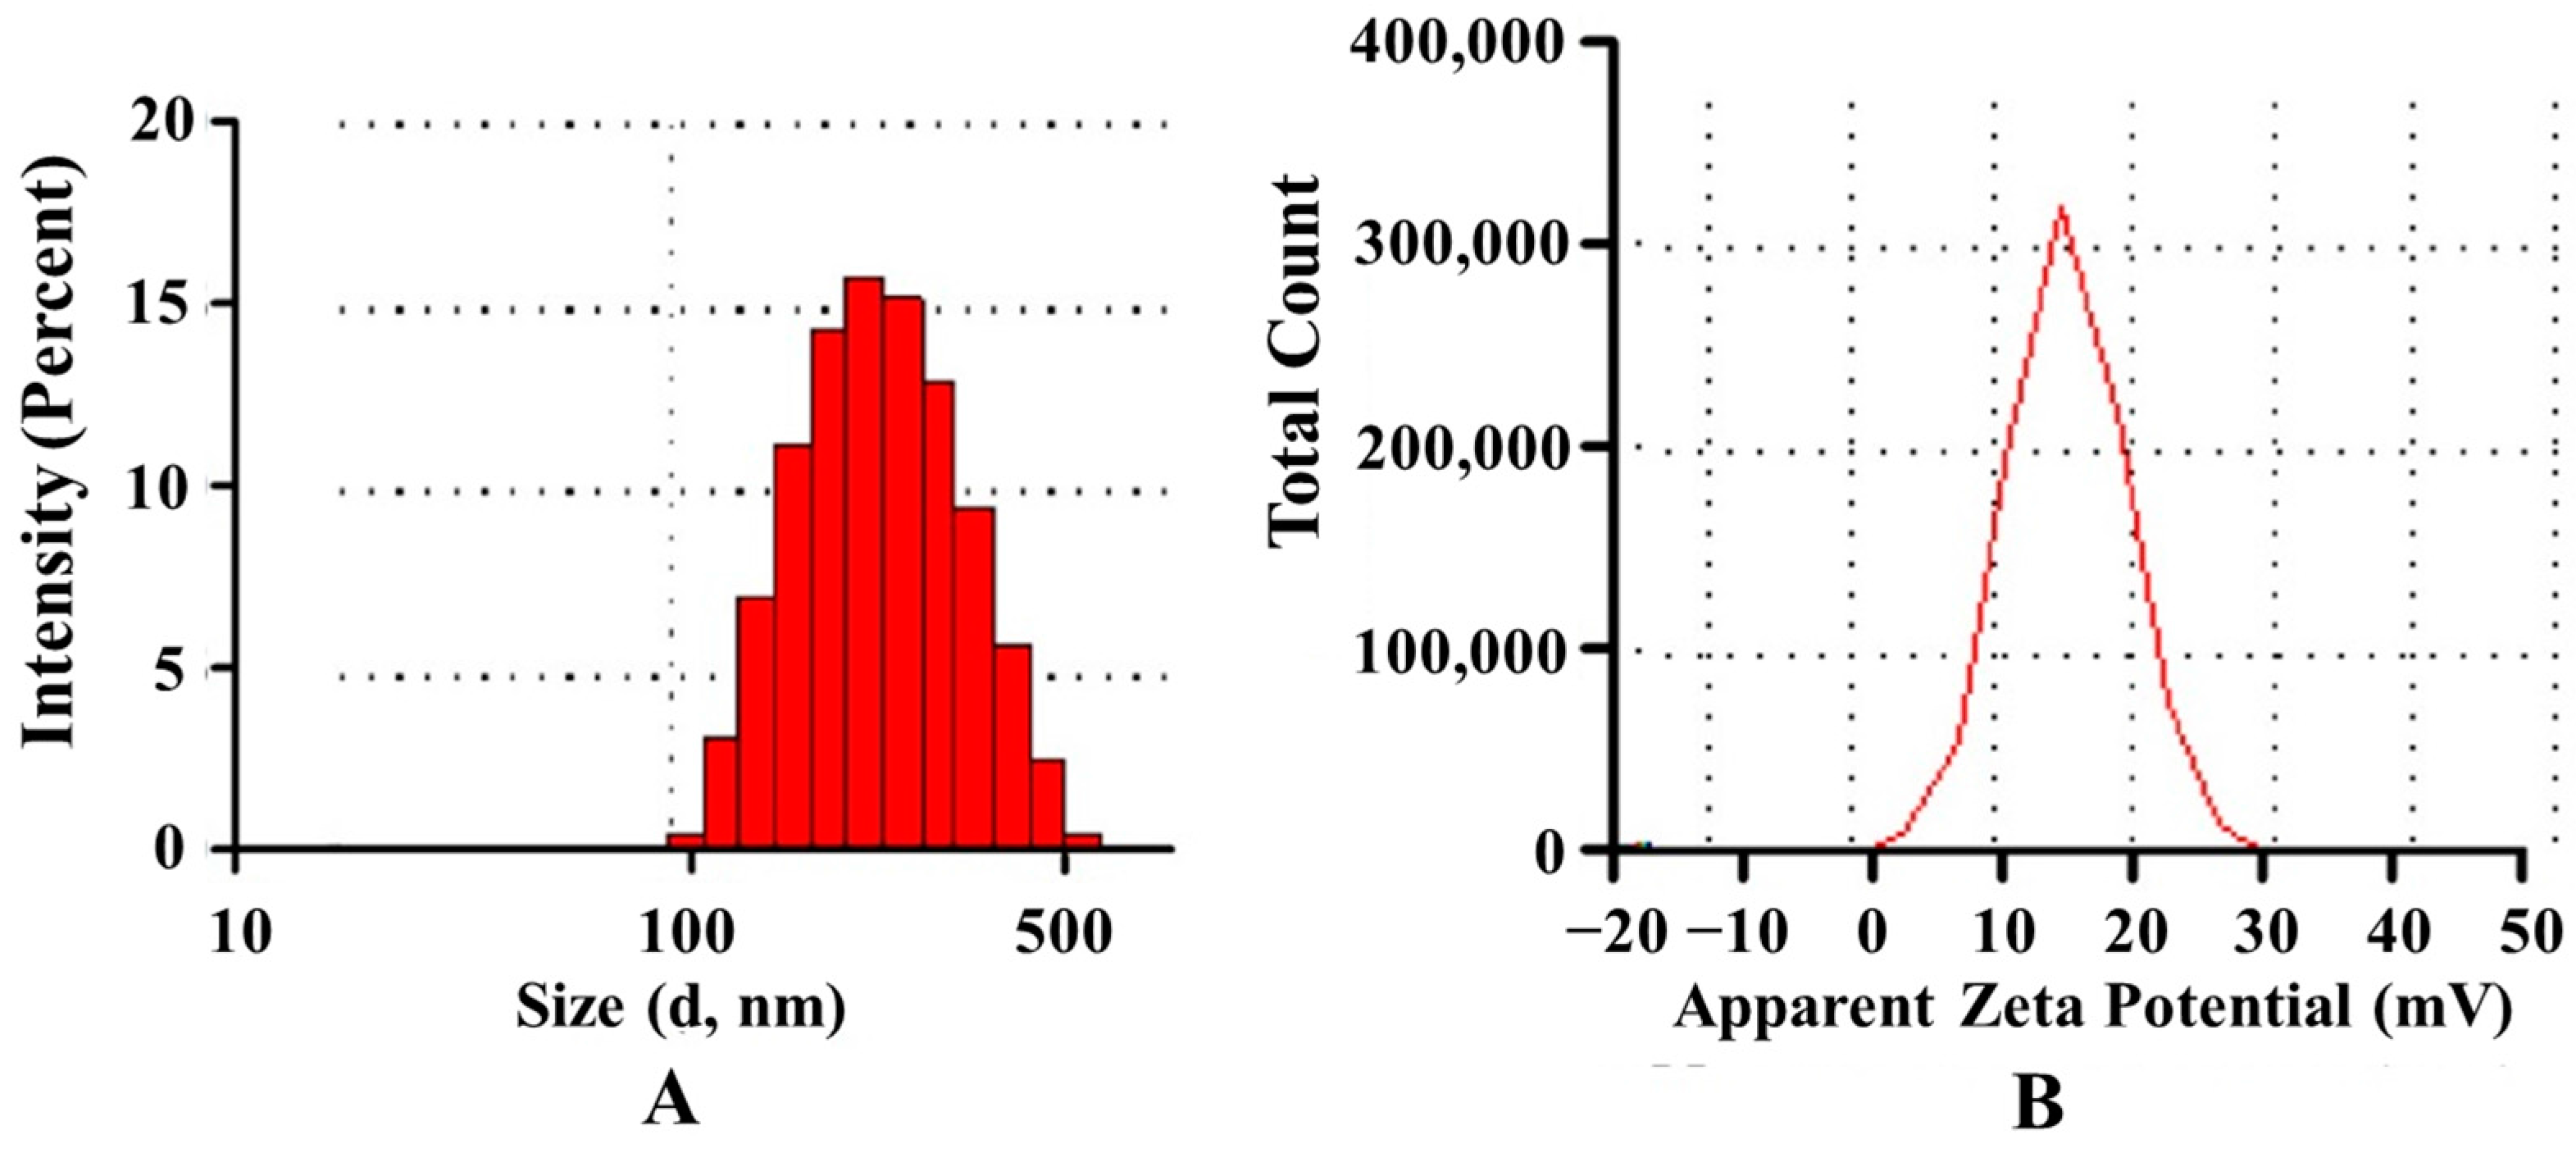
2.5.1. Particle Size and Zeta Potential
Particle size, size distribution and zeta potential of the prepared nanoparticles were measured on a Malvern Zetasizer Nano ZS90 (Malvern Instruments Ltd., Malvern, UK). The particle size distribution was reported as the polydispersity index (PDI).
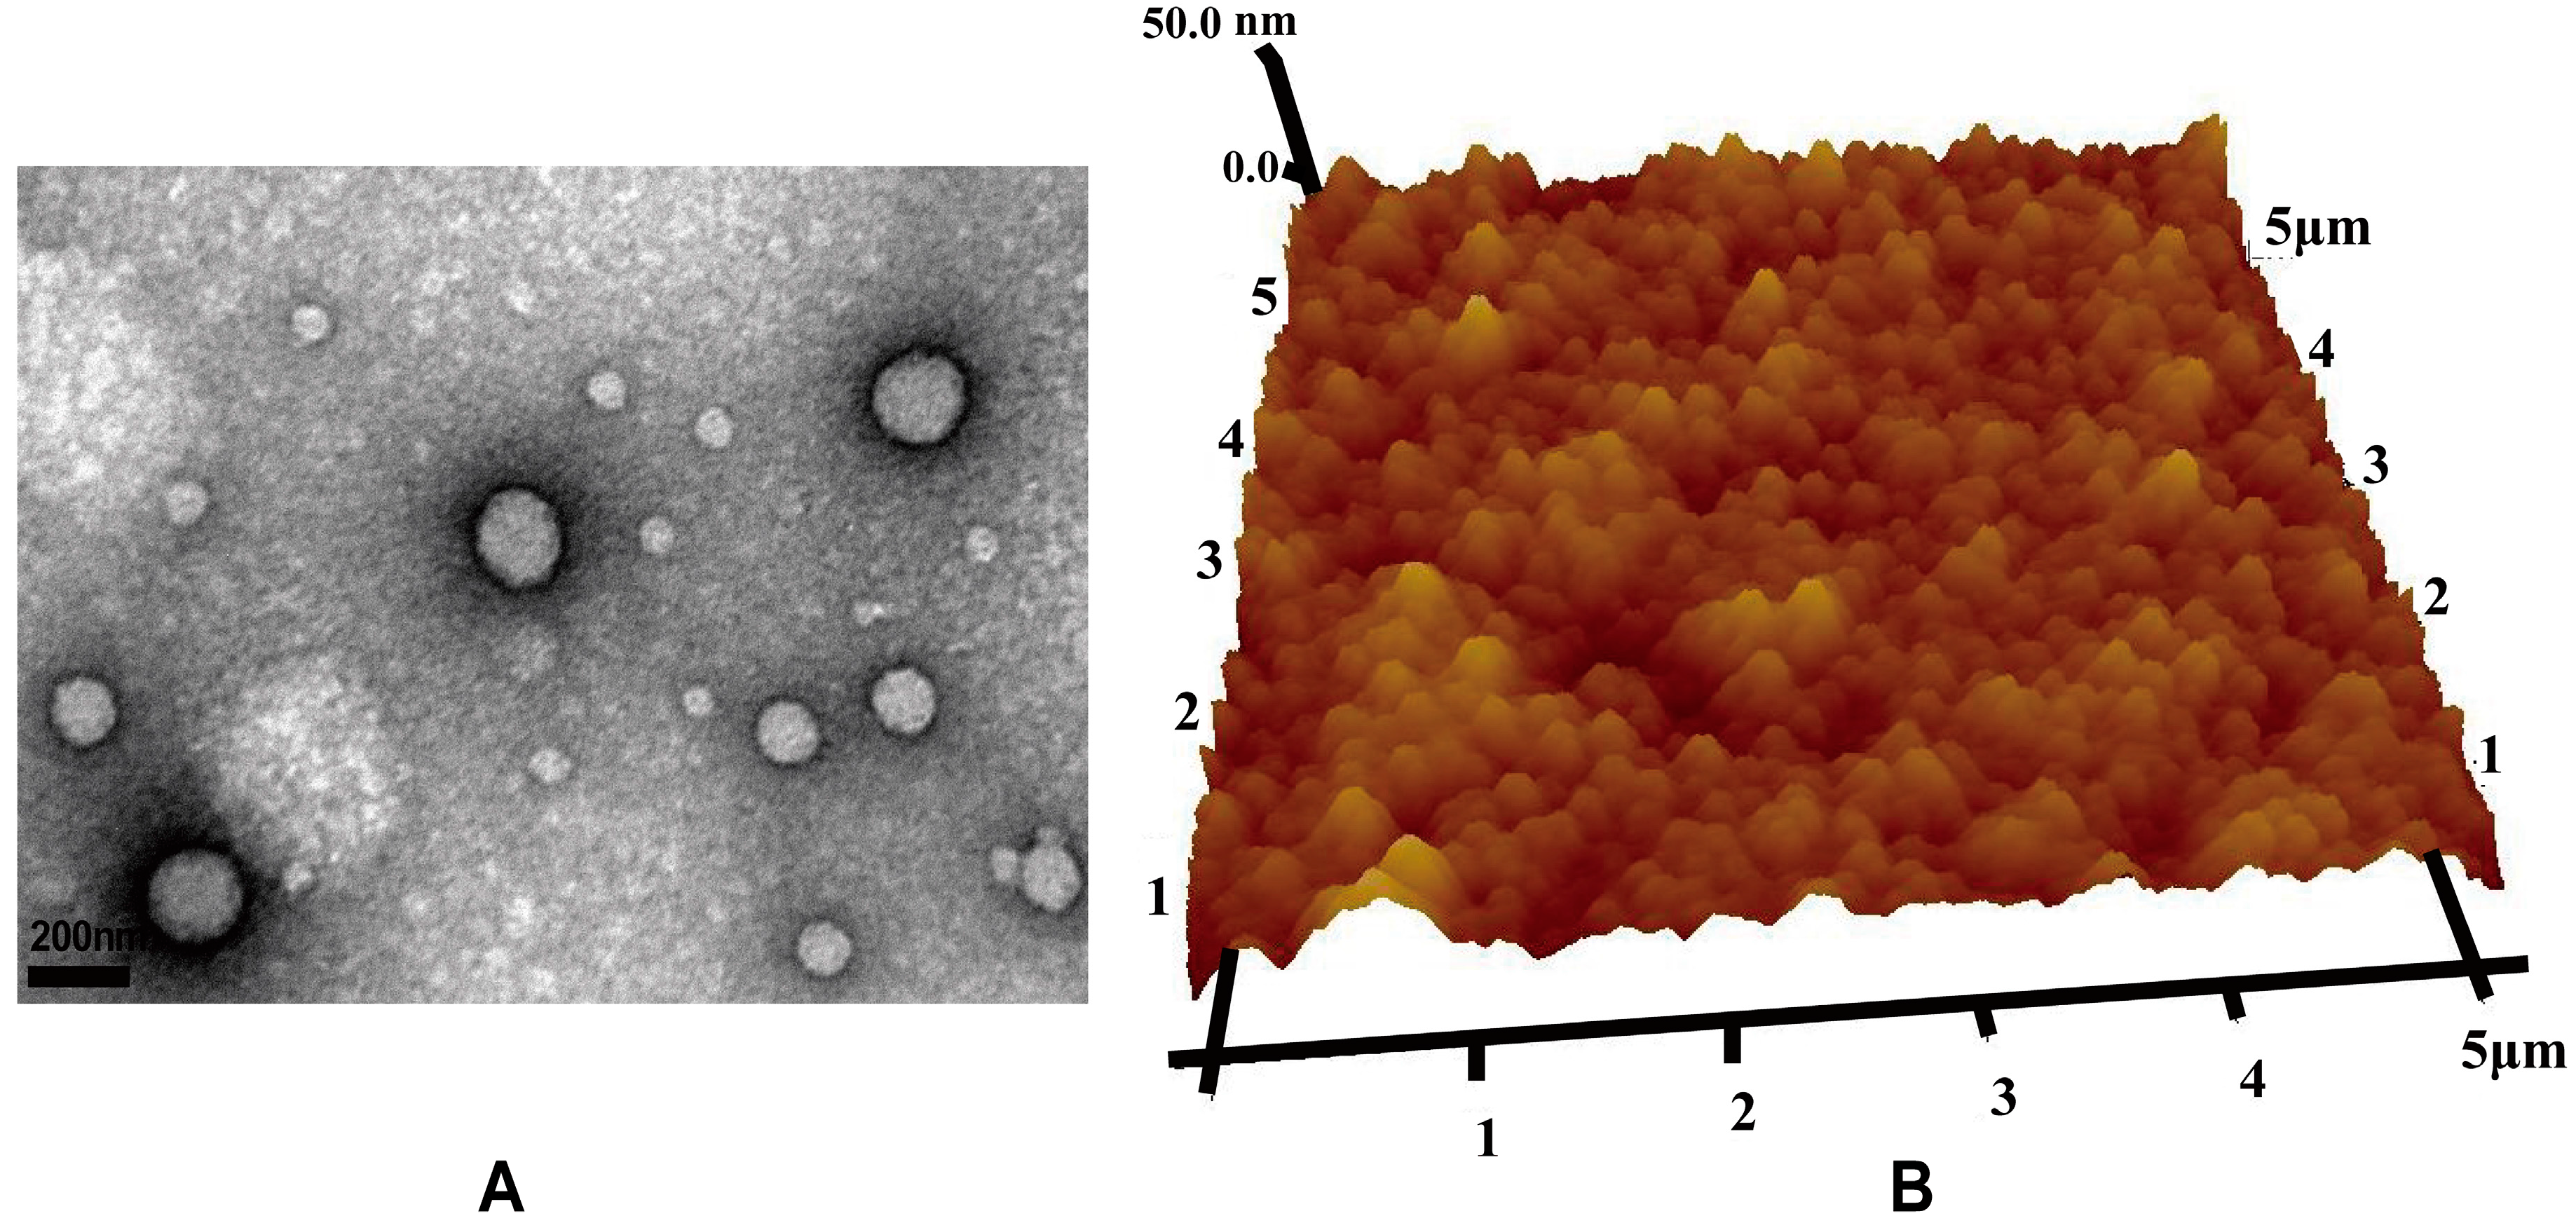
2.5.2. Nanoparticle Visualization
The morphology of the nanoparticles was observed via TEM (JEOL2010F, Jeol, Tokyo, Japan). TEM samples were prepared by placing a drop of nanoparticle suspension onto a 200-mesh carbon-coated copper grid. The excess aqueous solution was removed by blotting with filter paper after 2 min. Nanoparticles were also visualized with AFM (Dimension 3100 V, Veeco Instruments Inc., New York, NY, USA) in contact mode, where the samples were prepared by depositing a drop of the VCM/TMC nanoparticle solution onto a glass slide and allowing it to dry.
2.6. Drug Loading
The drug loading and loading efficiency of the VCM/TMC nanoparticles was determined as follows: 400 μL of VCM/TMC nanoparticle suspension were placed in an Amicon Ultra 10K centrifugal filter (Millipore, Eschborn, Germany), and subjected to centrifugation at 10,000
g for 10 min at room temperature. The filtrate was collected and injected into the HPLC apparatus, and the VCM content was quantified by comparison to a standard curve. Each batch of samples was measured in triplicate. The loading efficiency and the drug loading were calculated according to Equations (1) and (2), respectively, as follows:
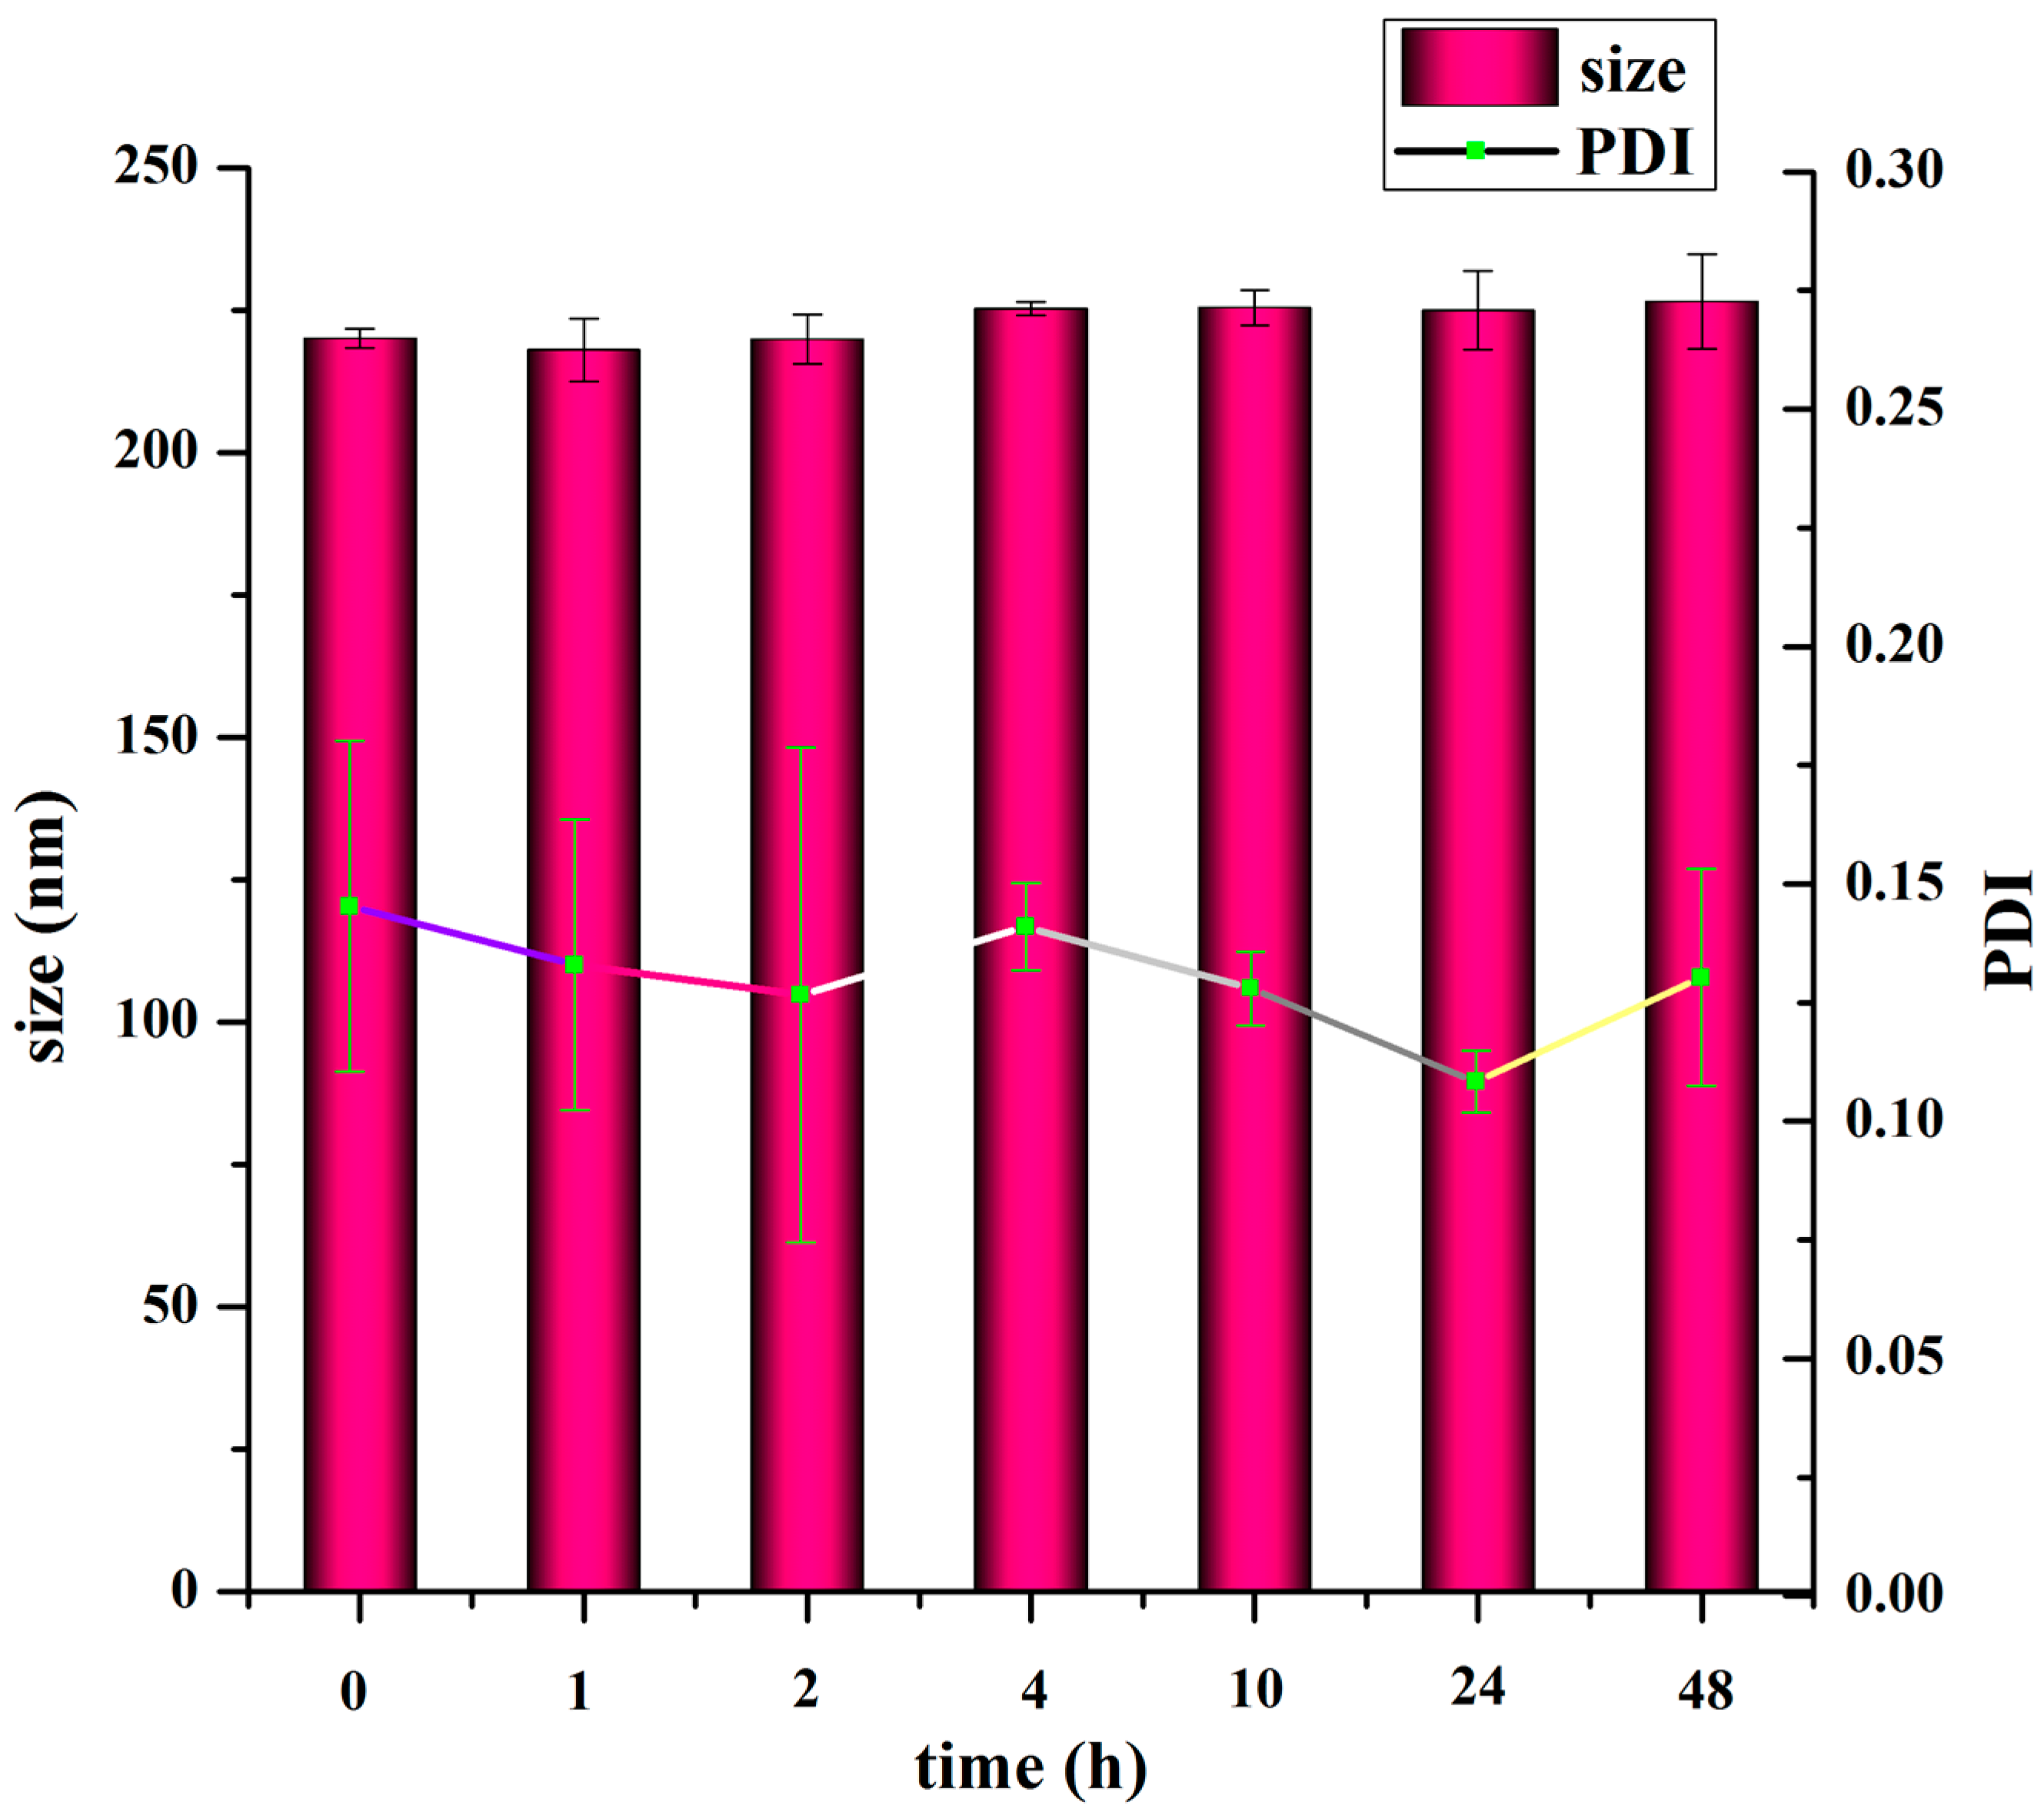
2.7. In Vitro Stability of TMC Nanoparticles
To measure the colloidal stability of the nanoparticles, the nanoparticle suspension was diluted in 5 mM Hepes (pH 7.4) to obtain the appropriate TMC concentration. The nanoparticles were stored at 37 °C and their size and PDI were measured after 1, 2, 4, 10, 24 and 48 h.
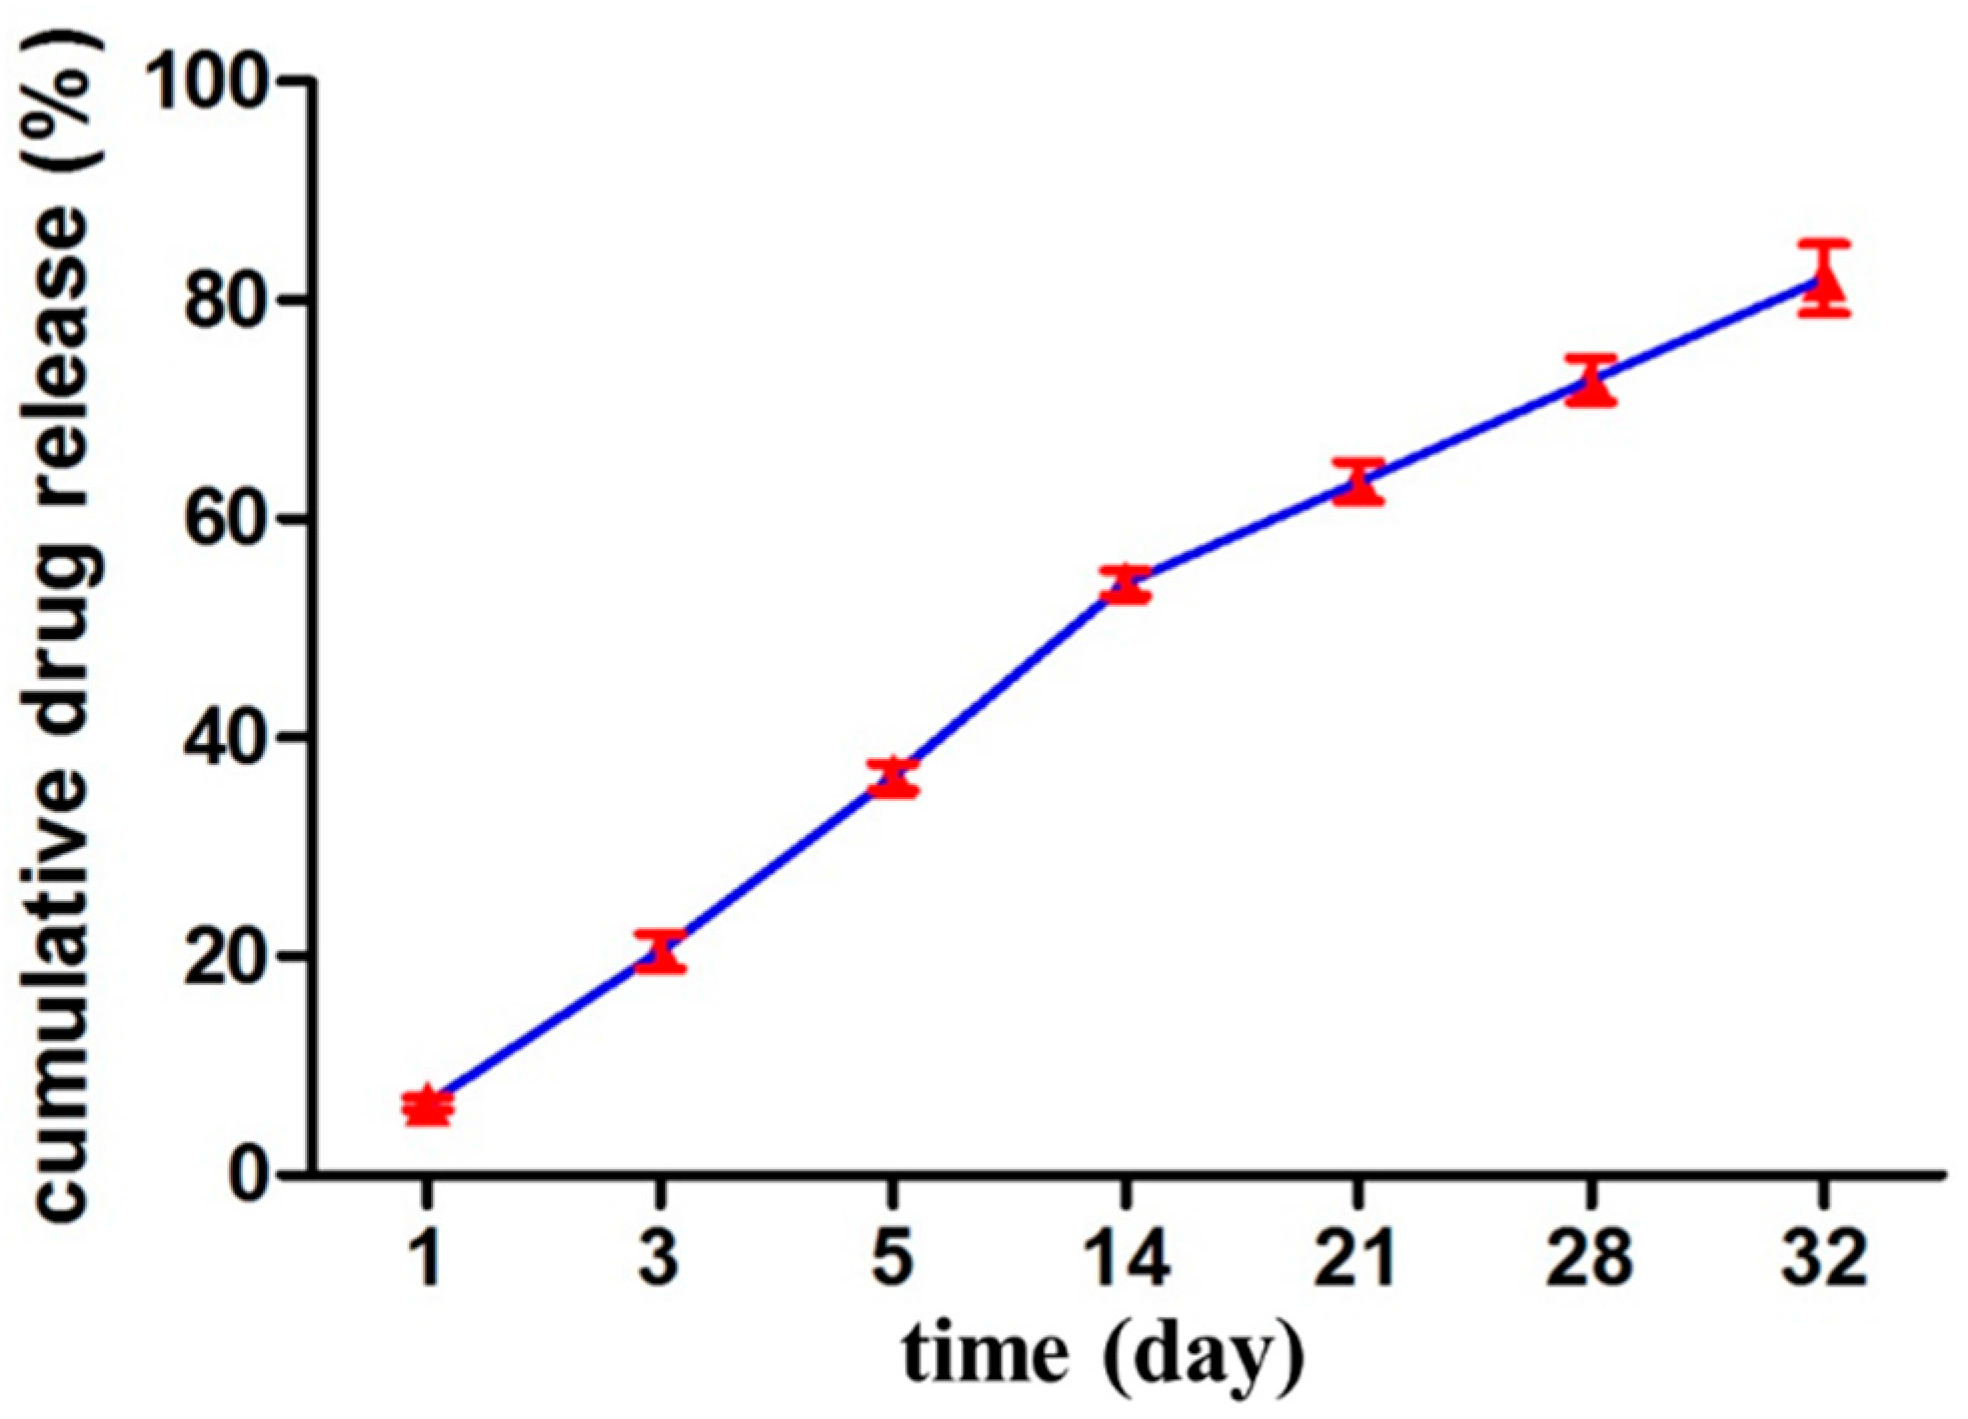
2.8. In Vitro Drug Release Study and Kinetic Modeling
The release of drug from the nanoparticles was measured in PBS (pH 7.4), using equilibrium dialysis. 1 milliliter of VCM/TMC nanoparticle dispersion was placed in cylindrical tubing and suspended in 4 mL of PBS (pH 7.4) in a flotation dialysis device (5 mL, 2 kDa MWCO, Sangon Biotech Co., Ltd, Shanghai, China). The temperature of the system was maintained at 37 ± 2 °C with a rotation speed of 100 rpm (Thermostatic water bath oscillators, Jiangsu Huanyu Scientific Institute, WHY-2, JiangSu, China). 400 microliter of the buffer solution was sampled periodically at predetermined intervals and was replaced with the same volume of fresh PBS (pH 7.4). The amount of released drug was then determined by HPLC and calculated as cumulative percent release. Sink conditions were maintained for the release study and the experiments were performed in triplicate.
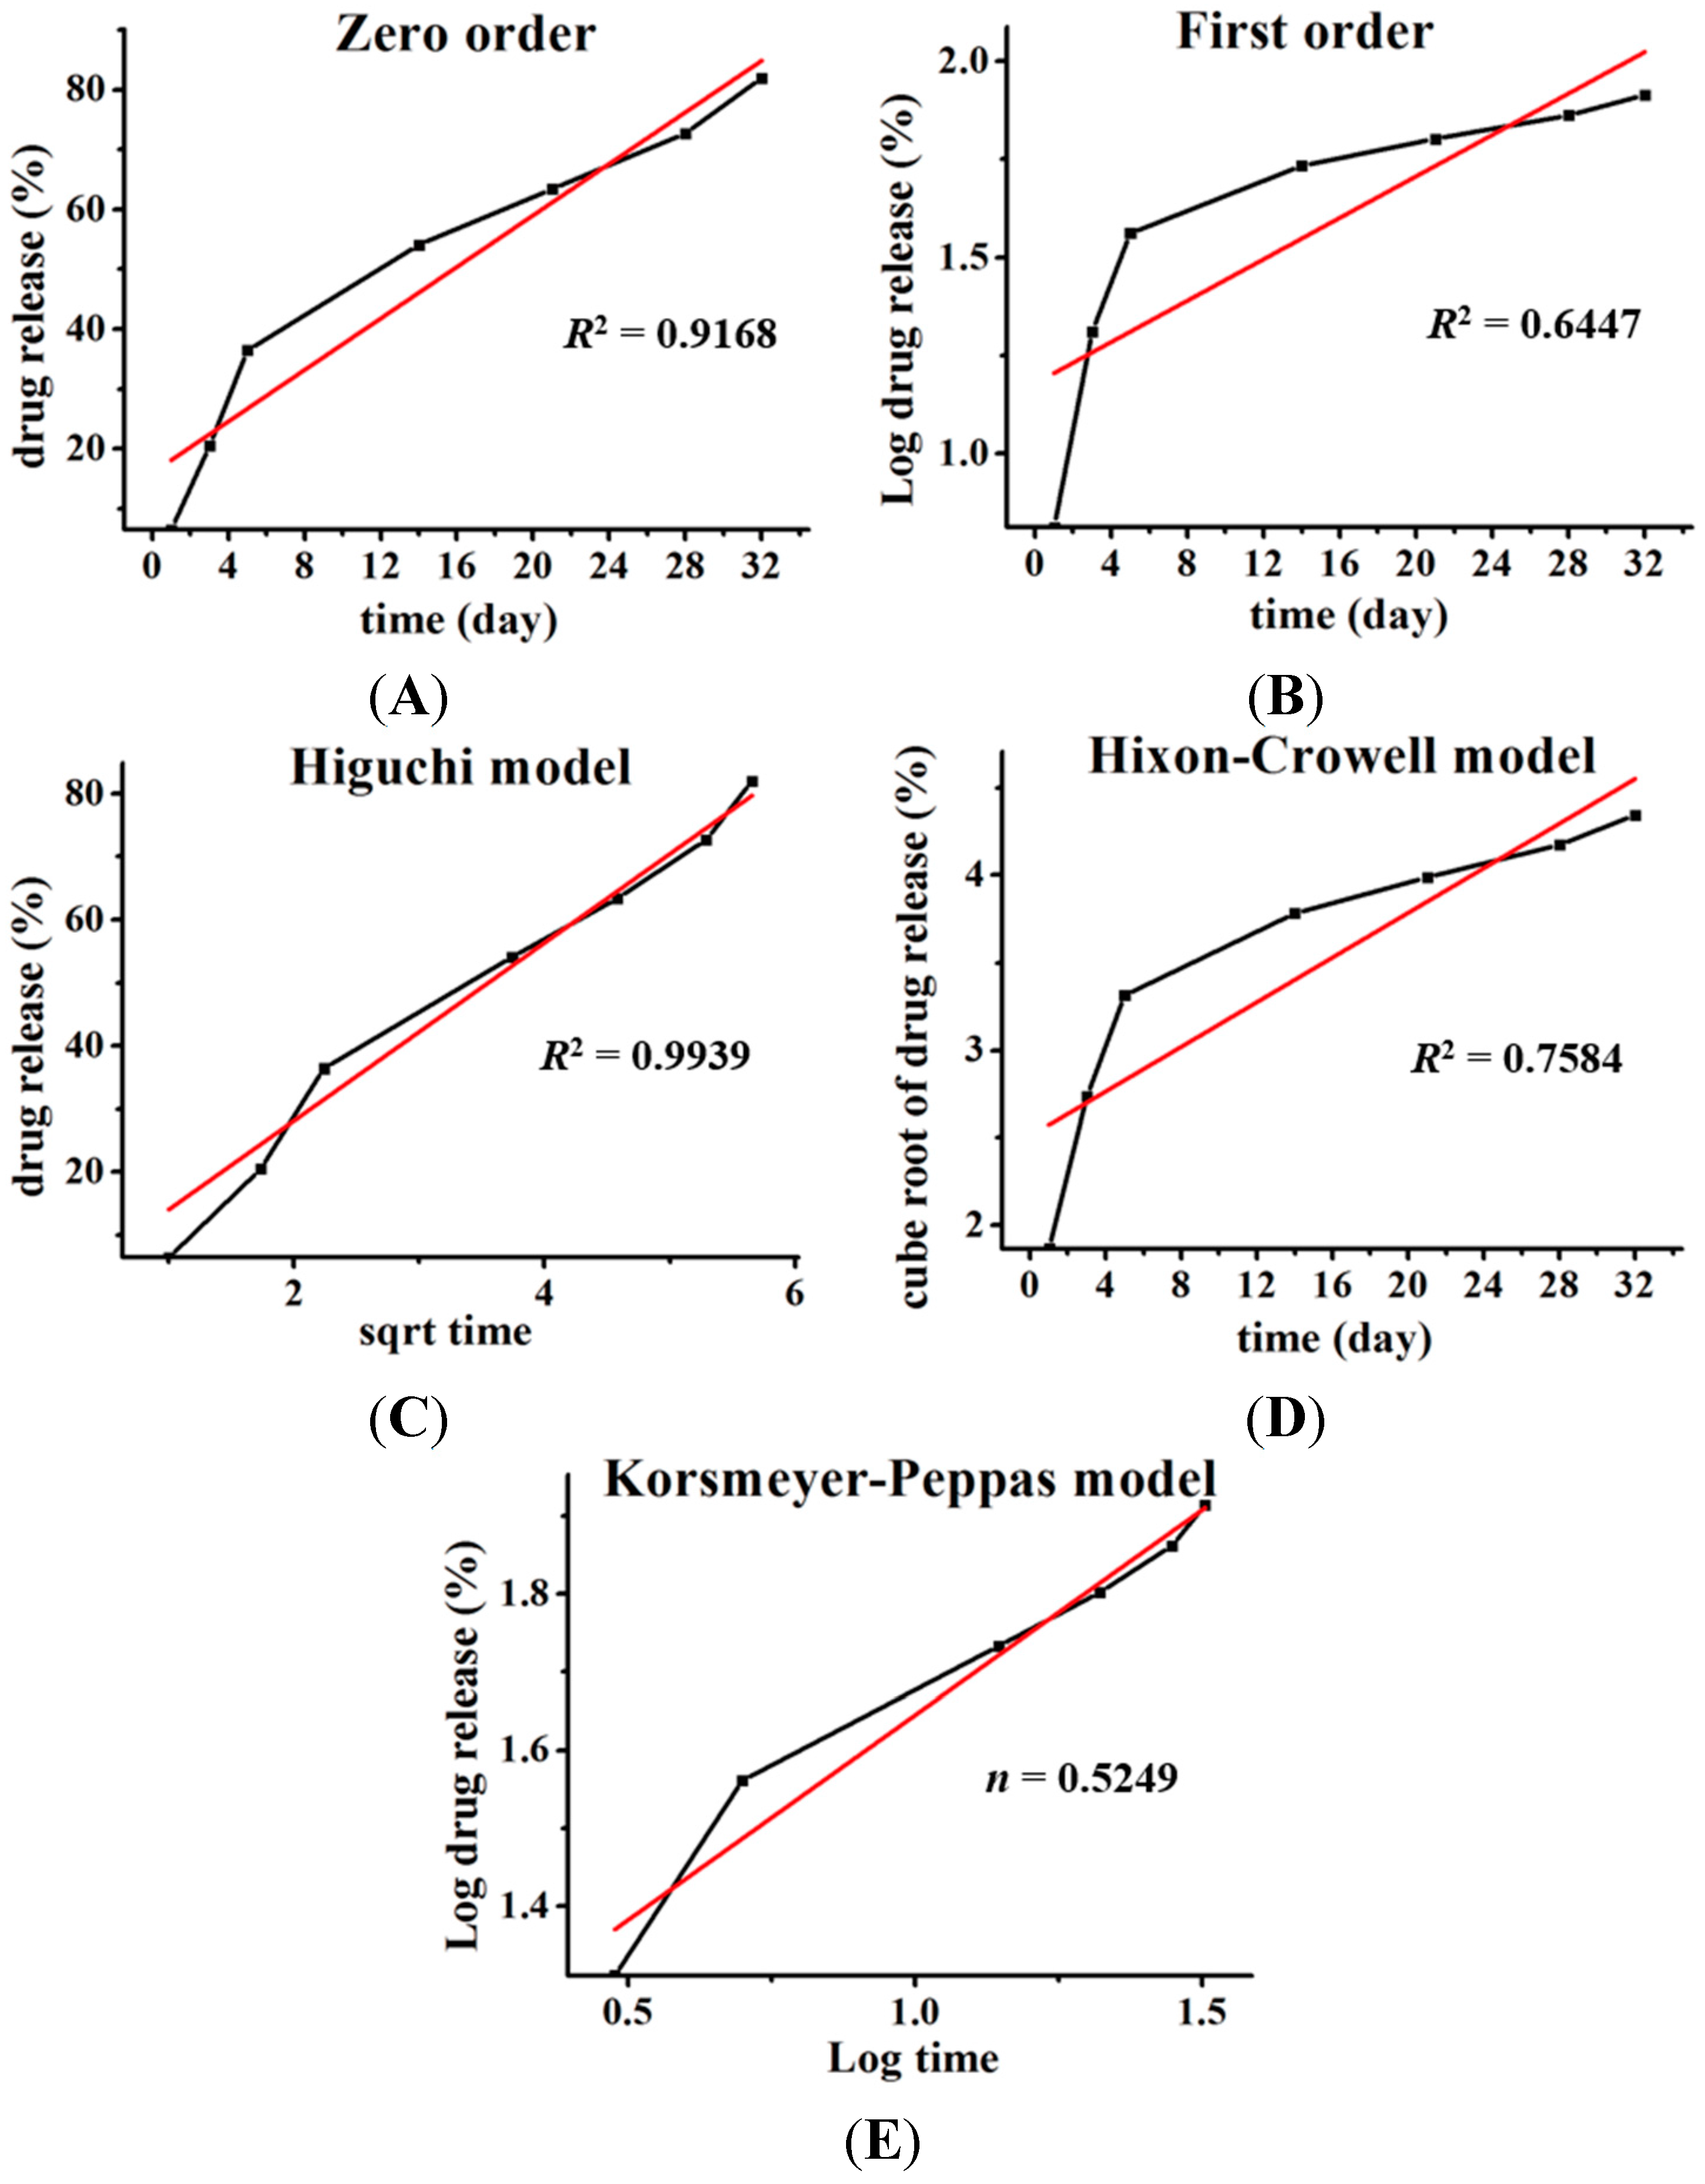
To propose a release mechanism, the data obtained from
in vitro drug release studies were plotted and fitted to the following kinetic models: zero order, first order, Higuchi, and Hixson-Crowell. The best fit was evaluated by calculating the correlation coefficient. Additionally, to understand the release mechanism, the release data were fitted to the Korsmeyer–Peppas model (
Mt/
M∞ = K
tn), where,
Mt/
M∞ is fraction of drug released at time
t, K is the rate constant and the exponent “n” represents the drug transport mechanism and can be used to evaluate the mechanism of diffusion [
8].
2.9. In Vitro Cellular Study
2.9.1. Cell Line and Culture Media
A mouse osteoblast (OB) cell line was obtained as a gift from the Experimental Animal Center of Zhejiang University (Zhejiang, China) and used as received. Cells were cultured in Dulbecco’s Modified Eagle’s Medium (DMEM, GIBCO, New York, NY, USA), supplemented with 10% (v/v) heat-inactivated fetal bovine serum (FBS), 100 units/mL penicillin and 100 units/mL streptomycin, and incubated in 5% CO2 at 37 °C and 95% relative humidity.
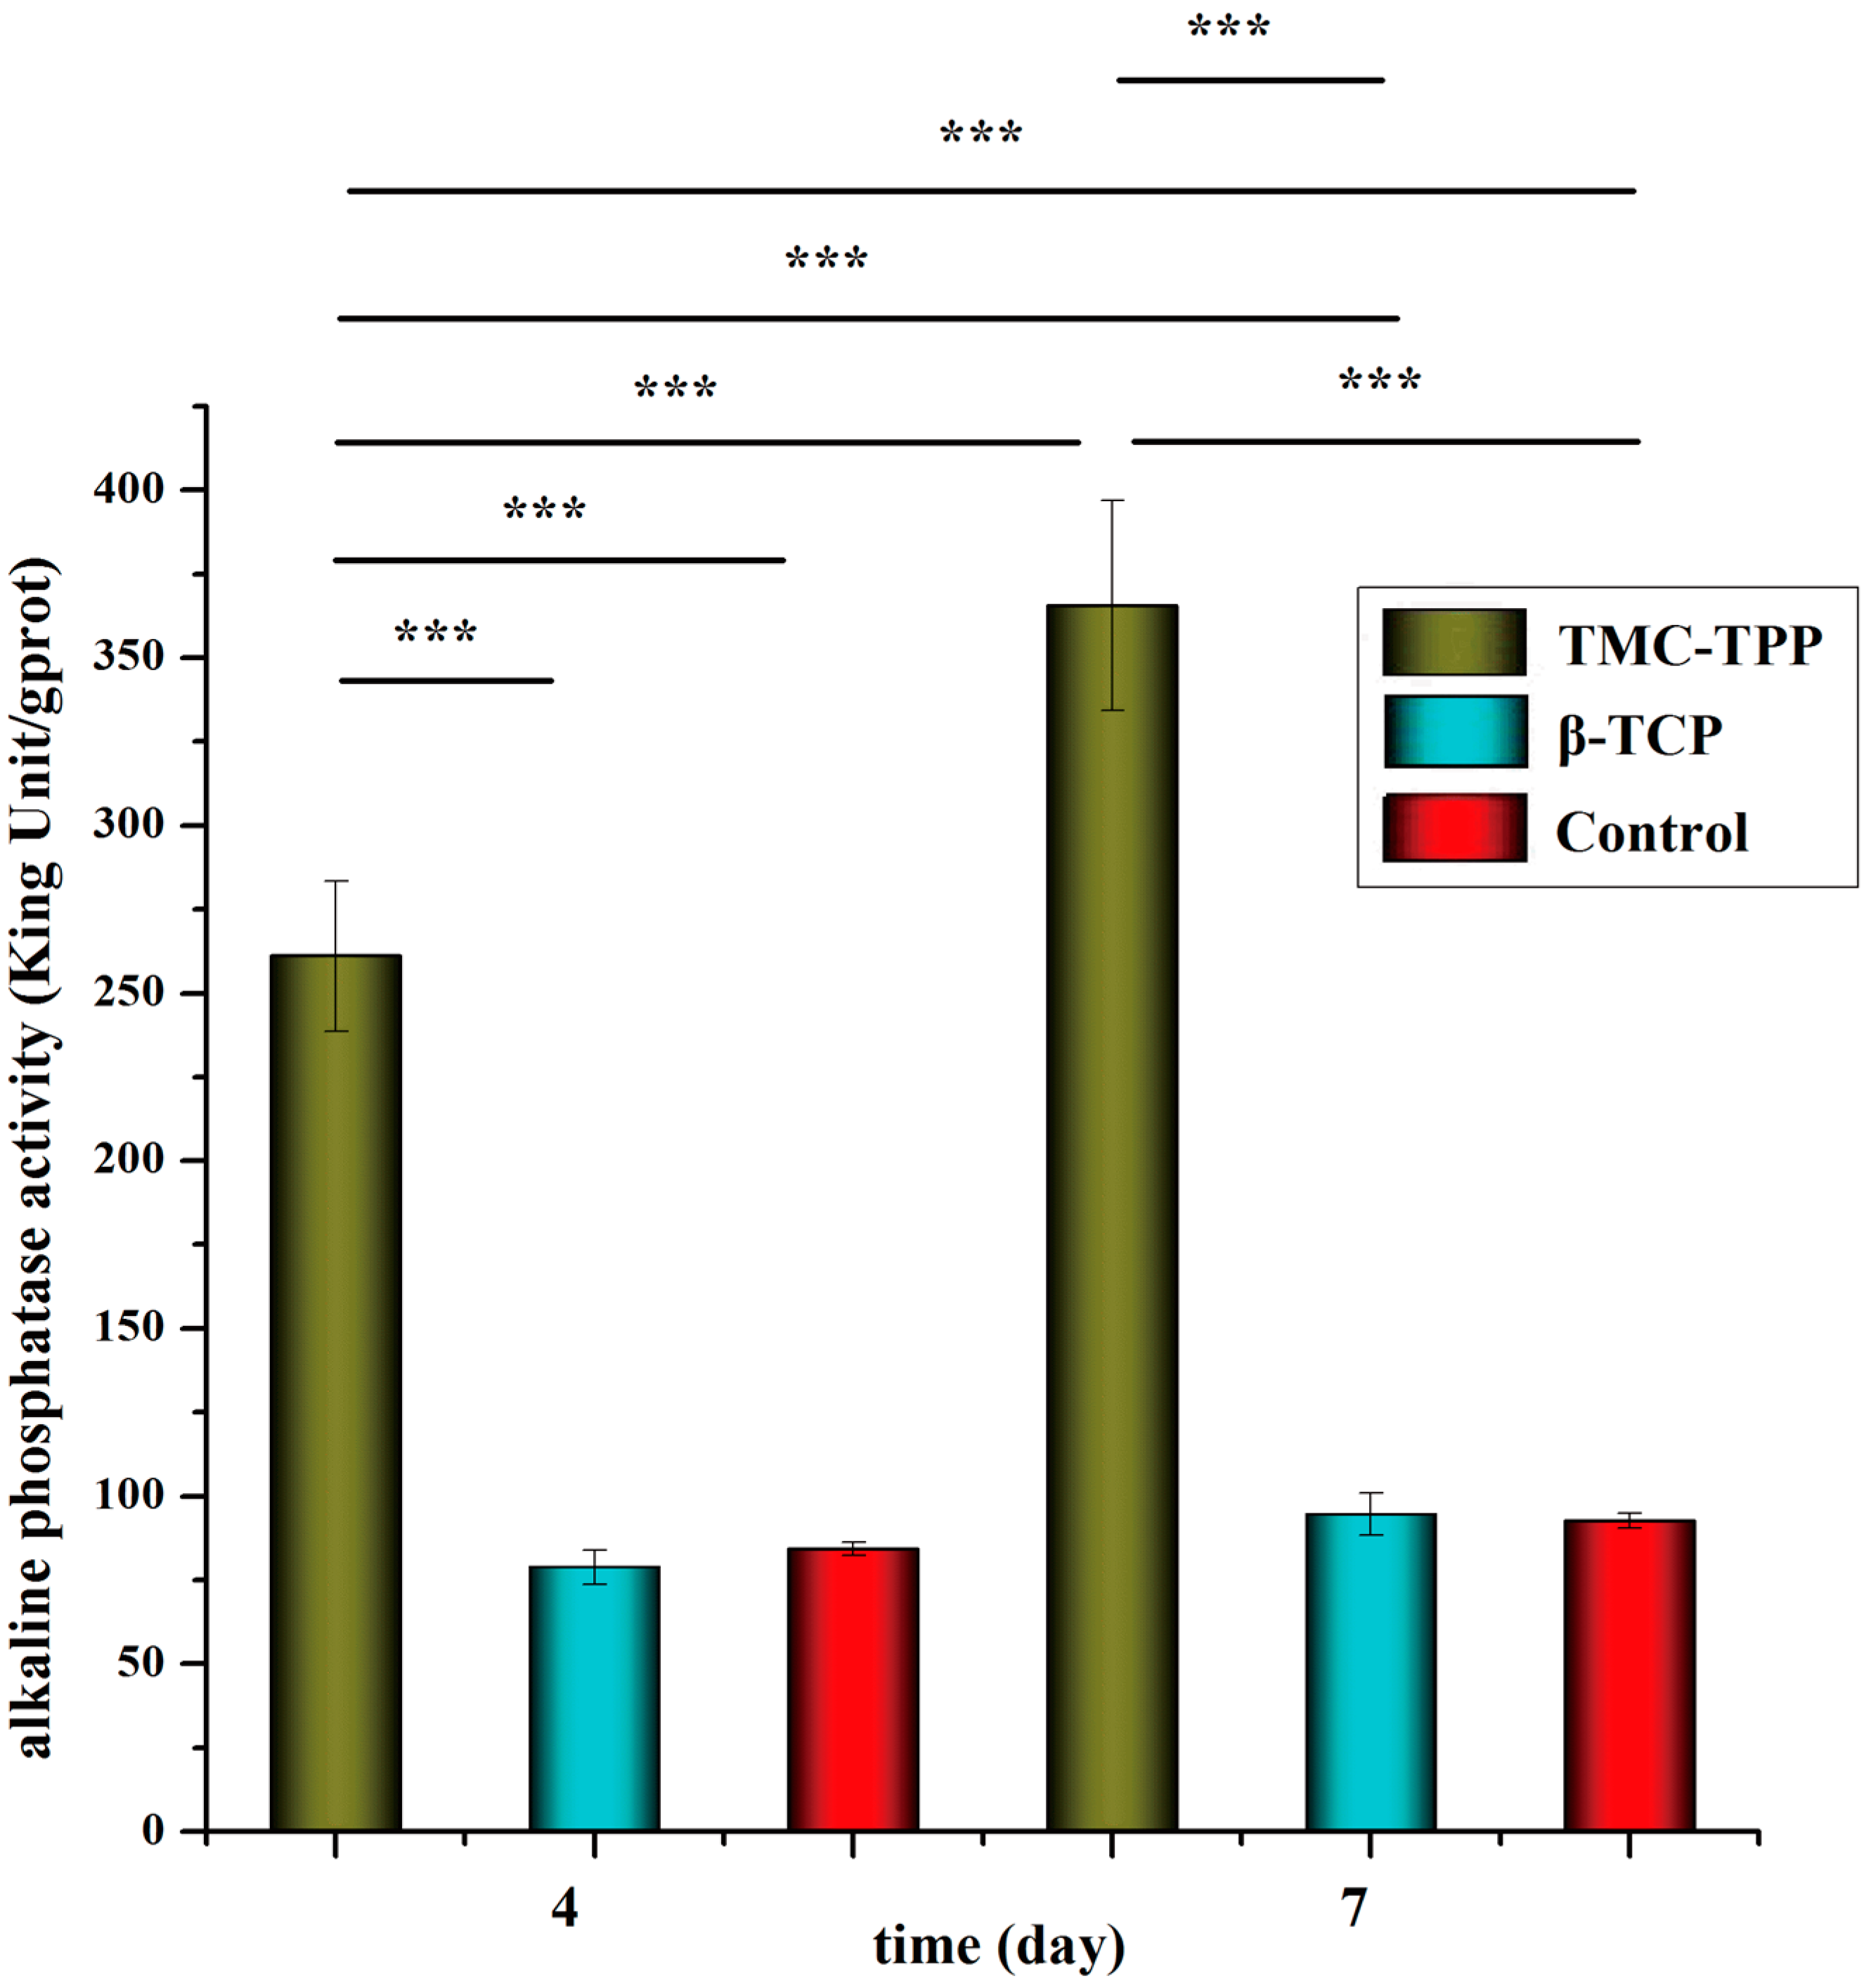
2.9.2. Alkaline Phosphatase Activity
Alkaline phosphatase (ALP) activity was measured to assess cell differentiation using an Alkaline Phosphatase Assay Kit (Nanjing Jiancheng Bioengineering Institute, Nanjing, China) and BCA (bicinchoninic acid) Protein Assay Kit (Beyotime Institute of Biotechnology, Shanghai, China), according to the manufacturers’ specifications. In brief, OBs were placed in a 24-well plate at a seeding density of (4.0 × 10⁴)–(5.0 × 10⁴) per well. After incubation overnight, cells were exposed to 1 mg/mL plain TMC nanoparticles (TMC-TPP) or β-tricalcium phosphate (β-TCP) suspension (dissolved in sterilized water) and incubated for four or seven days. The osteogenic medium was changed once every three days. At pre-determined time intervals, cell lysates were obtained by removing the medium, washing the cells with PBS (pH 7.4), and incubating cells with 1% Triton X-100 for 1.5 h. Each determination was standardized with respect to total protein, which was measured by BCA protein assay.
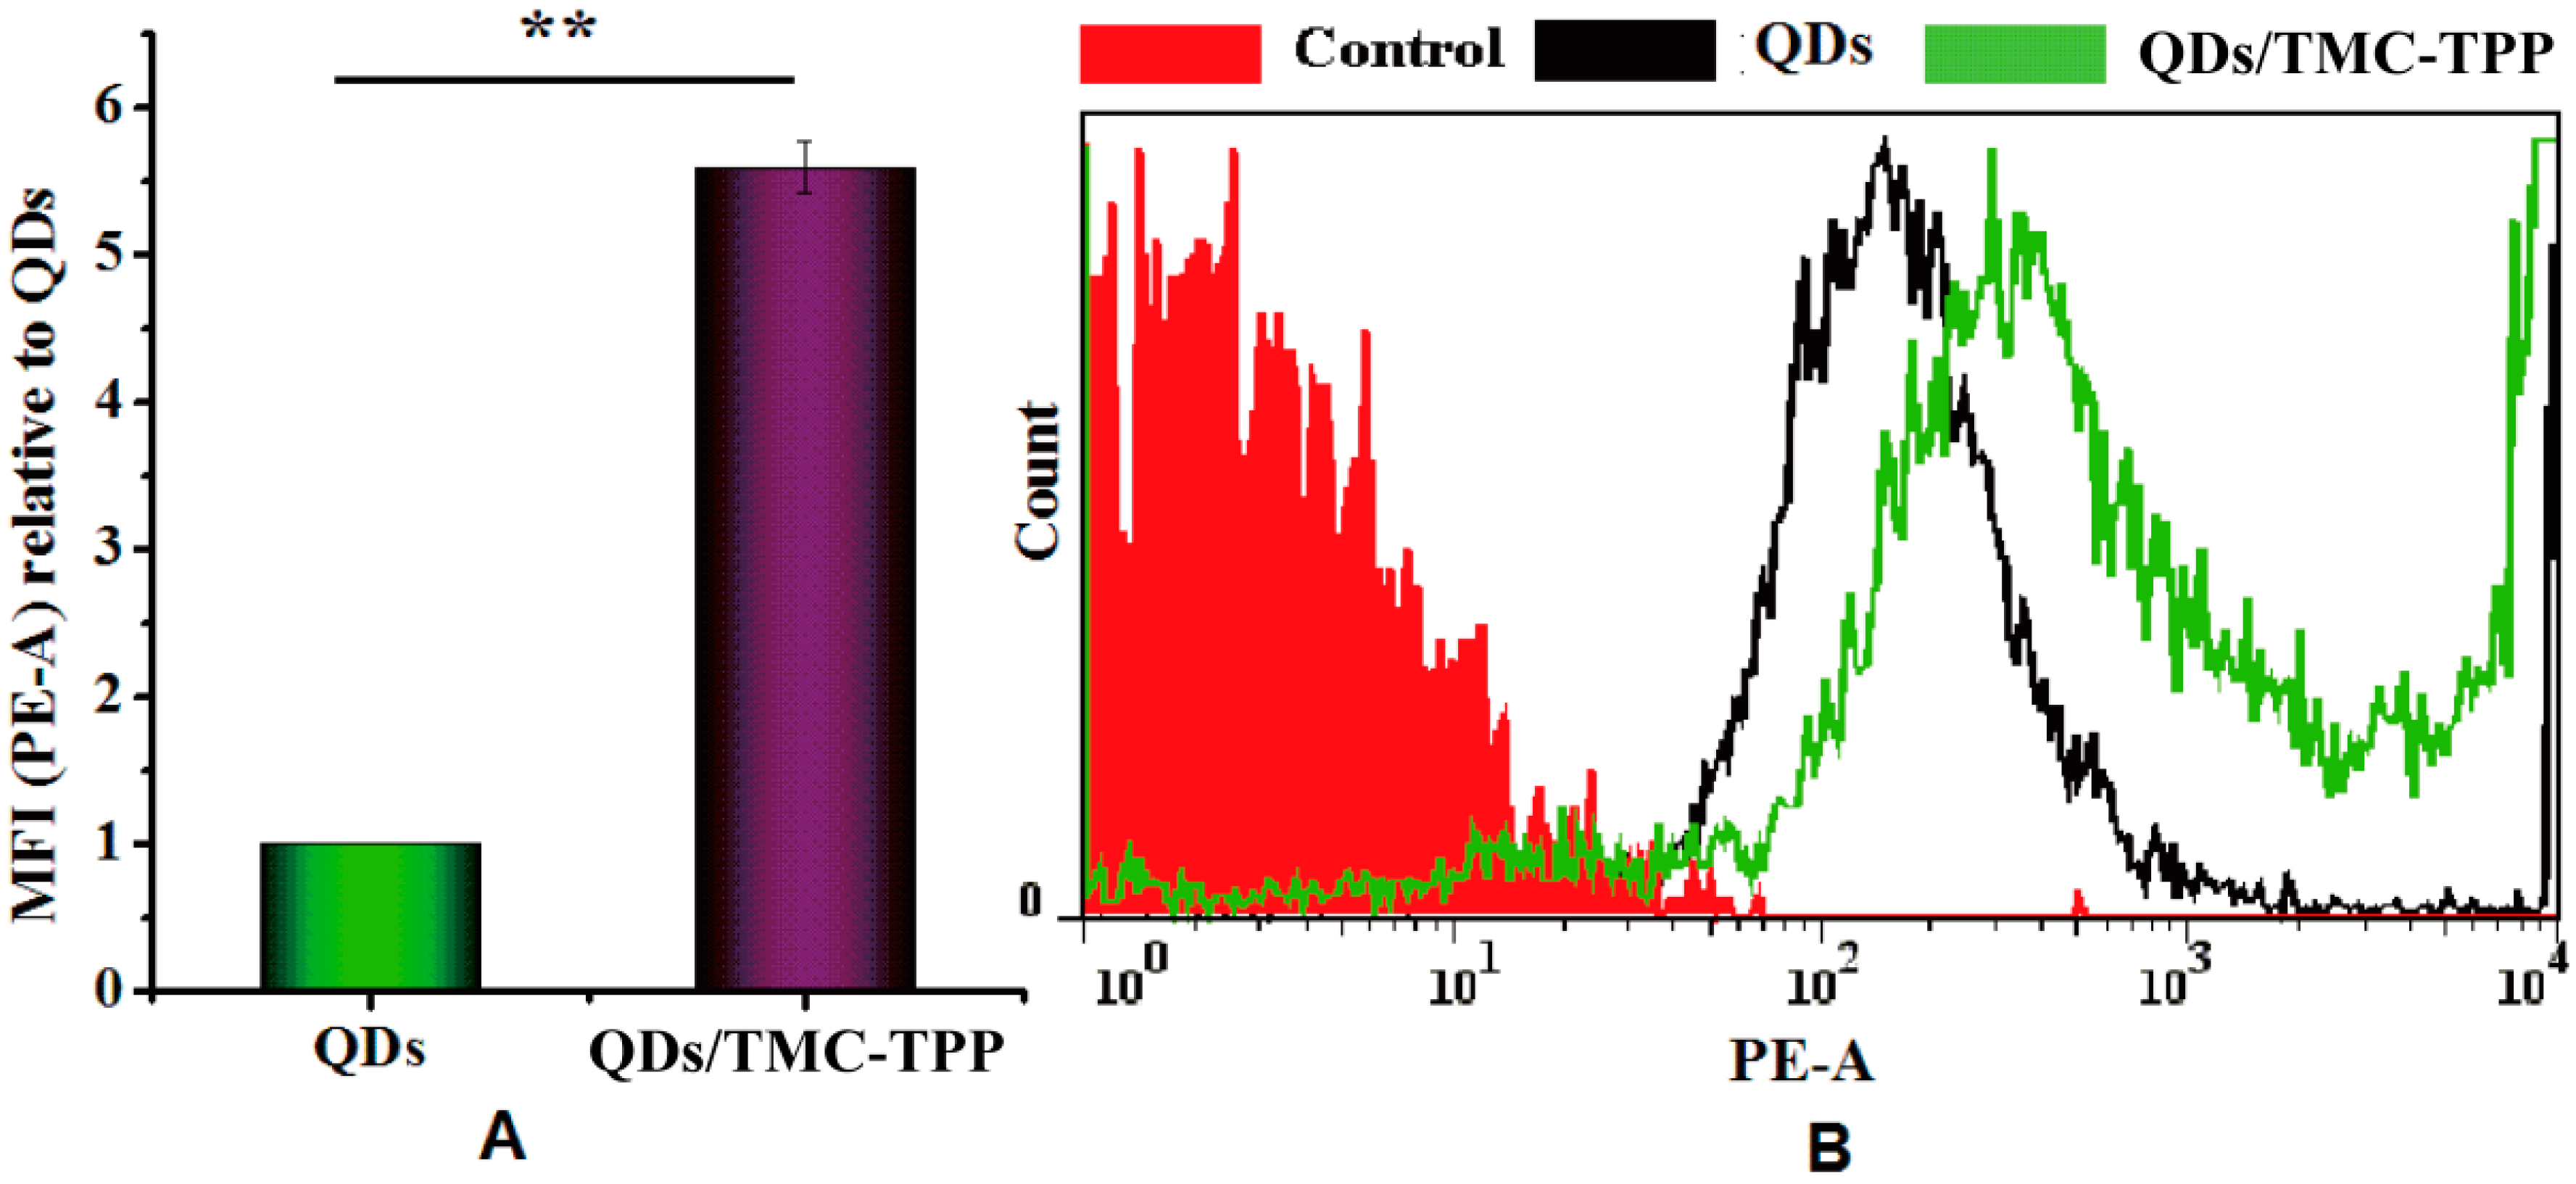
2.9.3. Cell Uptake Study
Water-soluble red fluorescent QDs were used as a model drug and the QDs/TMC-TPP nanocomplexes were formed as described previously, and its cellular uptake was compared with free QDs that were dissolved in PBS (pH 7.4). OBs were seeded in a six-well plate at a density of 5 × 10⁵ cells/well. After incubating and reaching 70%–80% confluency, the cells were washed three times with PBS (pH 7.4), and then exposed for 4 h in the dark at 37 °C to FBS-free DMEM (650 μL) containing 100 μL of QDs/TMC-TPP nanocomplexes or free QDs. Non-drug-treated groups were used as controls. Following treatment, the cells were washed twice with PBS (pH 7.4), detached with trypsin, resuspended in DMEM with FBS, and immediately collected for analysis via flow cytometry (BD Biosciences, San Jose, CA, USA). For each sample, 10,000 events were recorded in the flow cytometer. All samples were measured in triplicate.
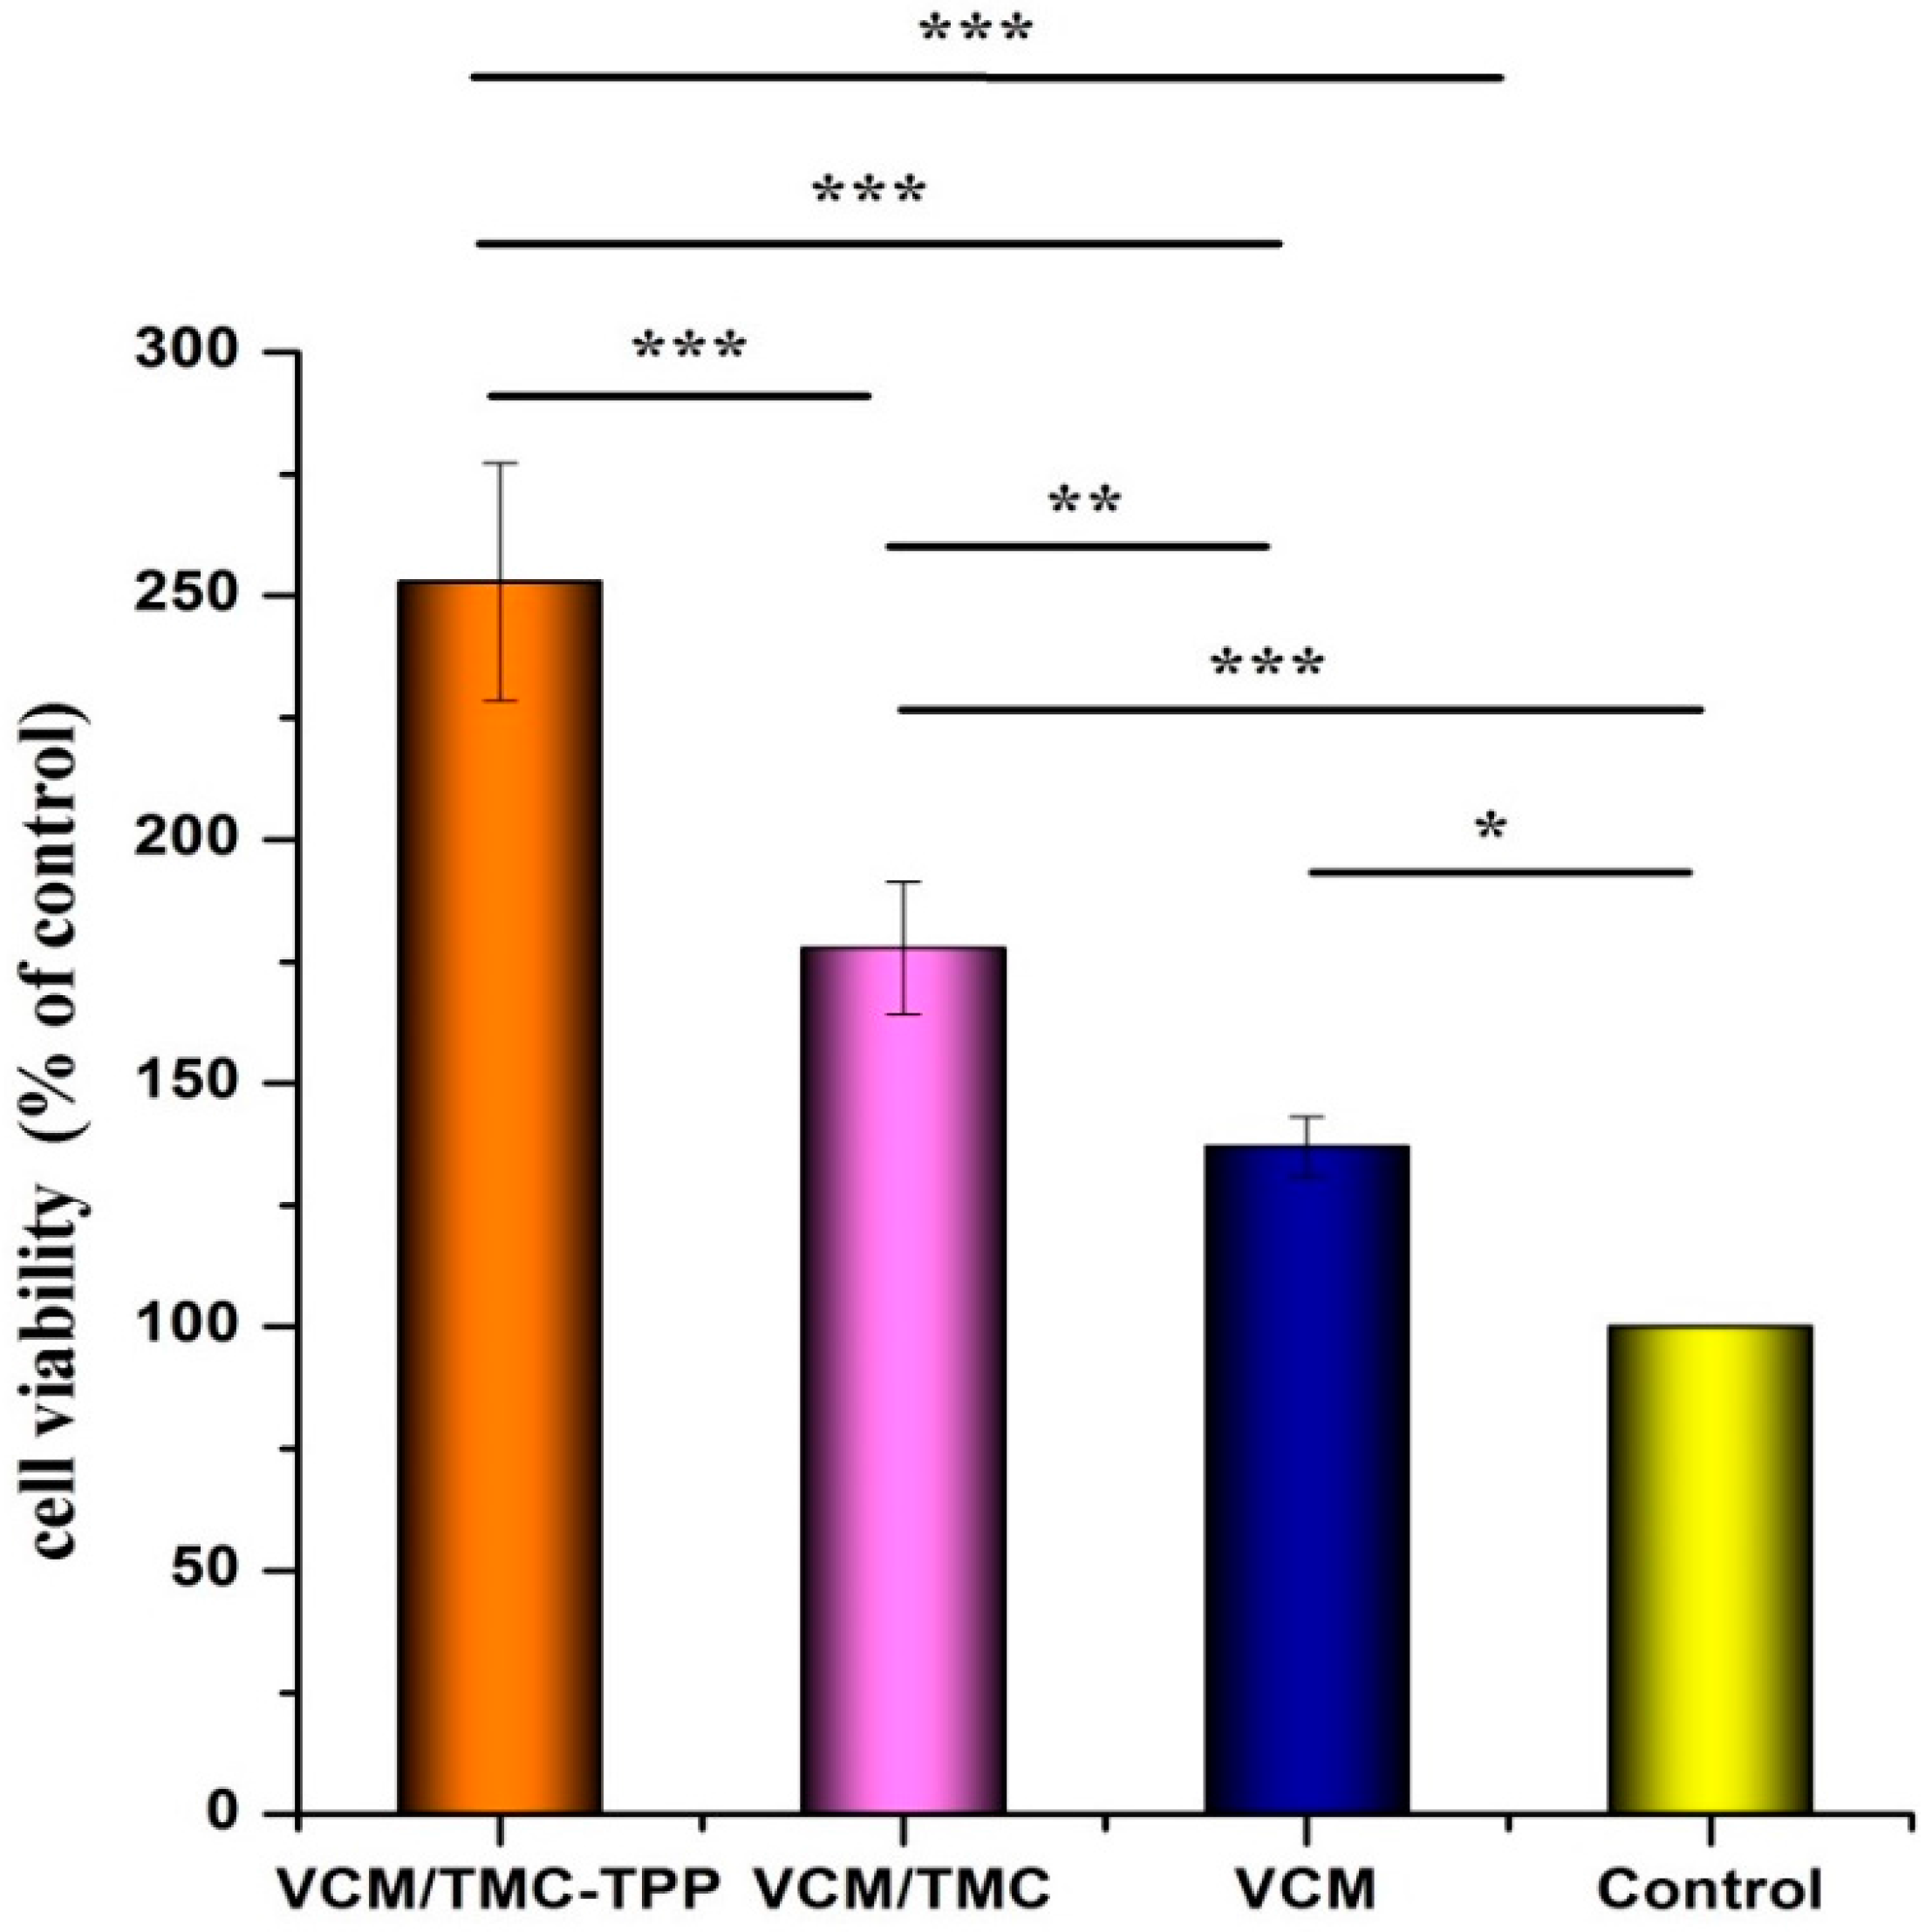
2.9.4. Cell Proliferation
The influence of VCM/TMC nanoparticles on the proliferation of OBs was evaluated in vitro by MTT (3-(4,5-dimethylthiazol-2-yl)-2,5-diphenyltetrazolium bromide) assay. This assay was also performed on VCM/TMC solution and VCM solution, where both solutes were dissolved in sterilized water. Briefly, exponentially growing cells were seeded in a 96-well plate at a seeding density of (4.0 × 10³)–(5.0 × 10³) cells per well, and cultured for 24 h. The cells were treated with various samples containing the same drug concentration of 0.1 mg/mL. Control wells were treated with equivalent volumes of drug-free medium. After 10 h, 10 μL MTT (5 mg/mL, dissolved in MTT assay solvent) was added to each well and the cells were further incubated for 4 h. After incubation, 100 μL of formazan dissolution buffer was added to each well to dissolve the MTT formazan crystals. The plates were shaken for 5 min and their absorbance was measured at 570 nm using a microplate reader. The experiments were repeated five times, and the results were expressed as a percentage viability of the control cells.
2.10. Ex Vivo Antibacterial Analysis
2.10.1. Bacterial Culture
The bacterial strain used in this study was the Gram-positive Staphylococcus aureus (S. aureus, ATCC 6538), which was purchased from Shanghai BioRc Co., Ltd. (Shanghai, China). S. aureus was cultured in LB (lysogeny broth 10 g of tryptone, 5 g of yeast extract and 10 g of NaCl per liter) on a shaker at 37 °C overnight until the optical density (OD) at 600 nm reached 0.5, indicating that the bacterial content reached approximately 108 colony forming units (CFU)/mL. For preparing the solid plate, an additional 25 g of agar per liter was added to LB liquid medium and all of the test bacterial groups were incubated in biochemical incubator (SHP-250, Shanghai Senxin Science Instrument Co., Ltd., Shanghai, China) with an atmosphere of 5% carbon dioxide at 37 °C.
2.10.2. Minimum Inhibitory Concentration Test
The LB broth microdilution method was used to determine the lowest concentration of VCM/TMC nanoparticles that can inhibit the growth of S. aureus, and two control groups were maintained for each test batch, including an antibiotic control (containing drugs and LB broth without inoculum) and a bacterial control (containing the LB broth and inoculum). 2 milliliter of prepared VCM/TMC nanoparticles and VCM solution, at concentrations of 6.25, 12.5, 25, 50, 60, 70, 80 and 90 μg/mL, were added to the test tubes with 100 μL bacterial suspension (containing approximately 1 × 10⁶ CFU/mL). After culturing at 37 °C for 24 h, the turbidity was visually assessed by eye and a UV-VIS spectrometer at 600 nm, and the MIC values were interpreted as the point at which there was no development of turbidity. All samples were examined in triplicate.
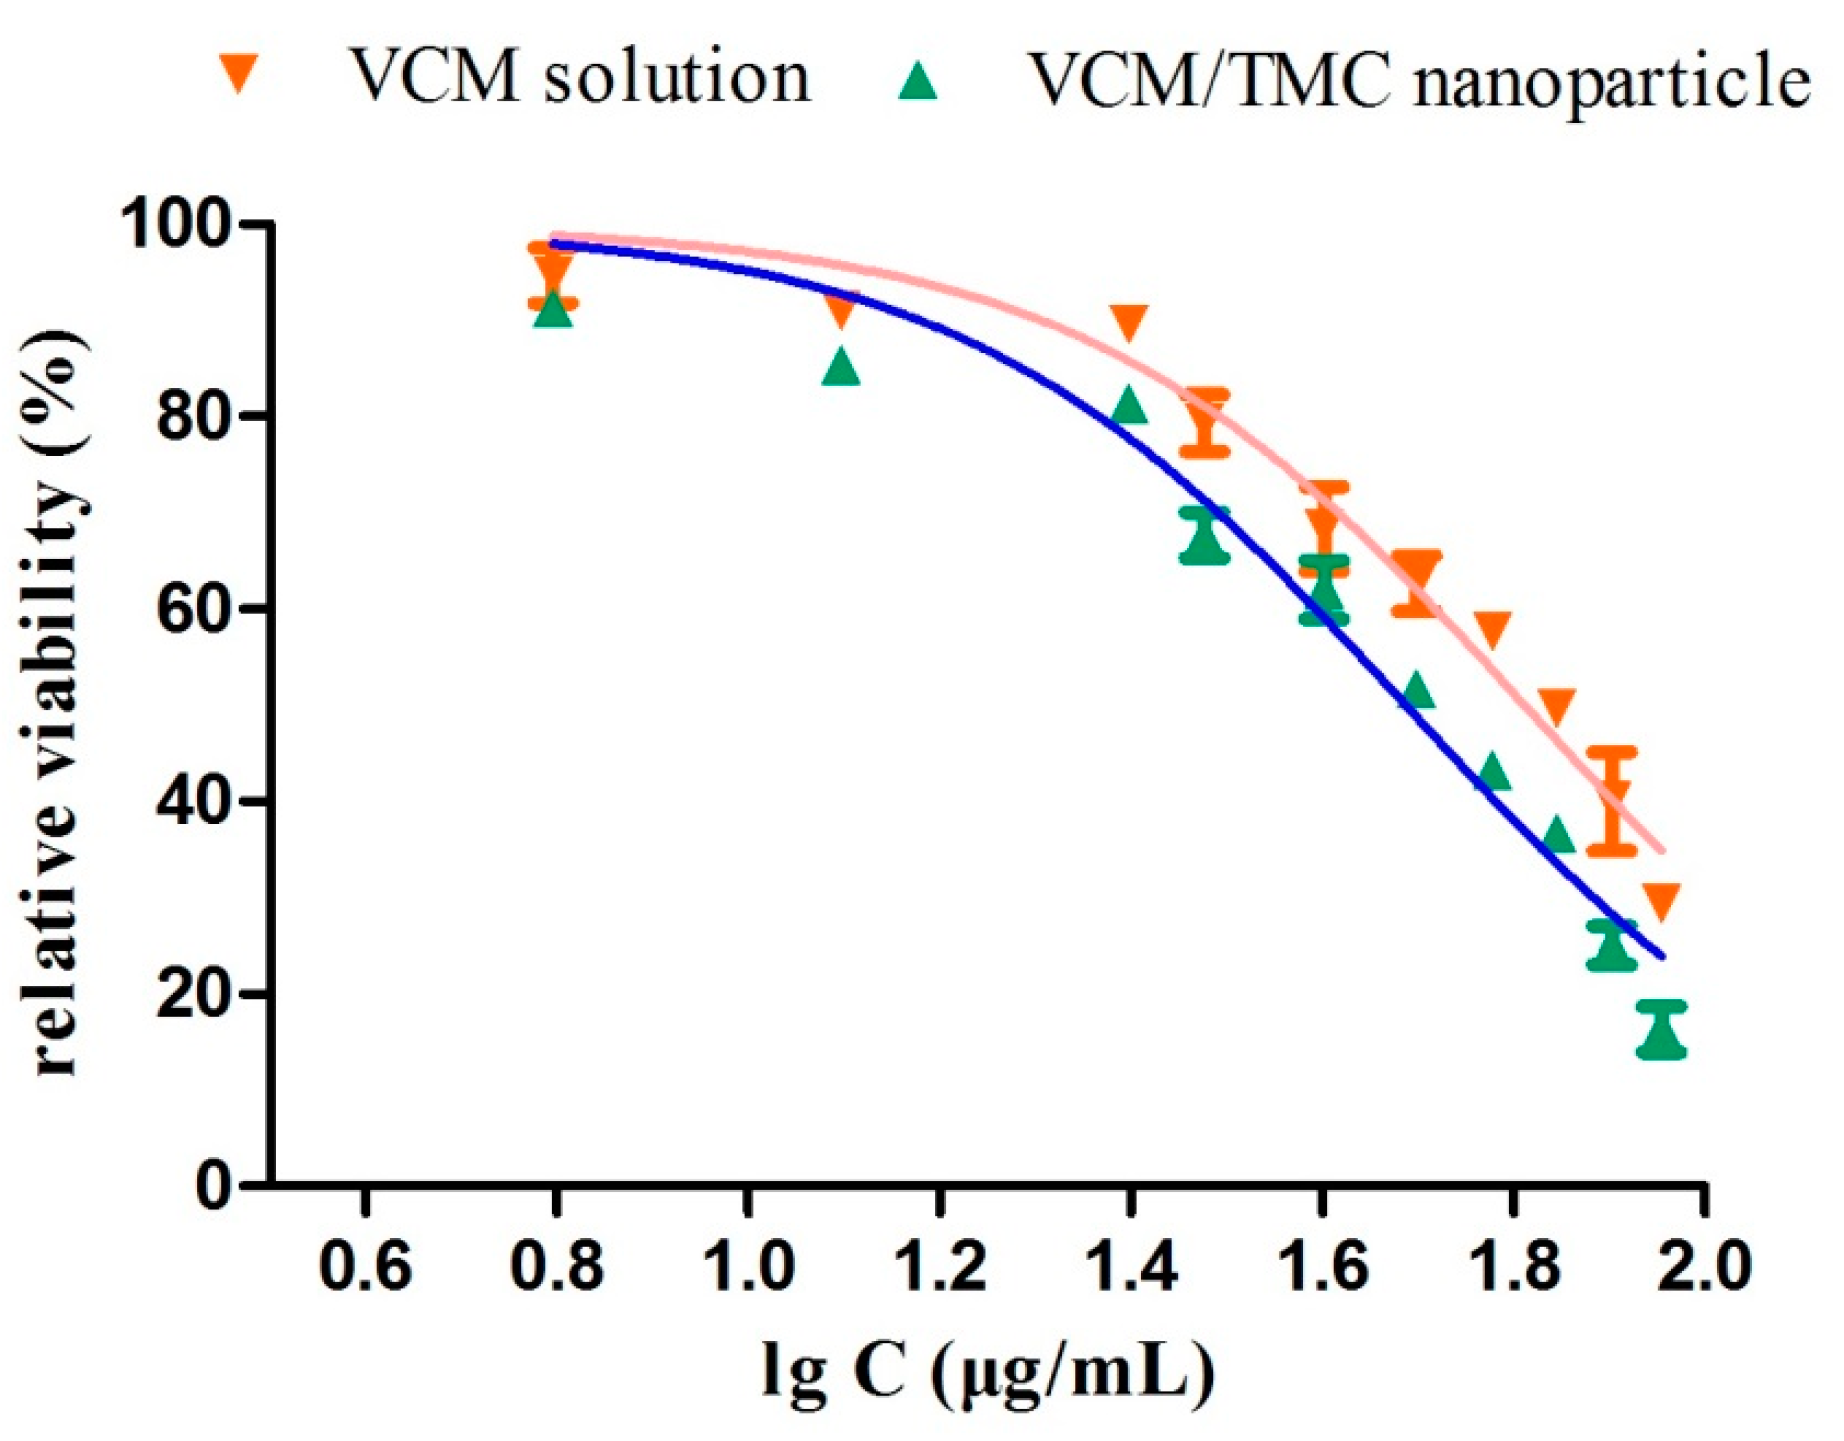
2.10.3. Half Maximal Inhibitory Concentration (IC50) Test
The half maximal inhibitory concentration (IC50) of the VCM/TMC nanoparticles was determined via a solid culture CFU assay, in which a plate without nanoparticles was used as negative control. Briefly, a 100-μL aliquot of the standardized inoculum (2 × 10⁶ CFU/mL) was mixed with 2 mL of a series of concentrations of VCM/TMC nanoparticles or VCM solution (6.25, 12.5, 25, 30, 40, 50, 60, 70, 80 and 90 μg/mL), incubated for 24 h at 37 °C, and then 25 μL of the prepared mixtures were spread on LB solid sugar plates. By calculating and comparing the reliable value of CFU with the control, we determined the IC50 values for each sample. Each assay was repeated in triplicate.
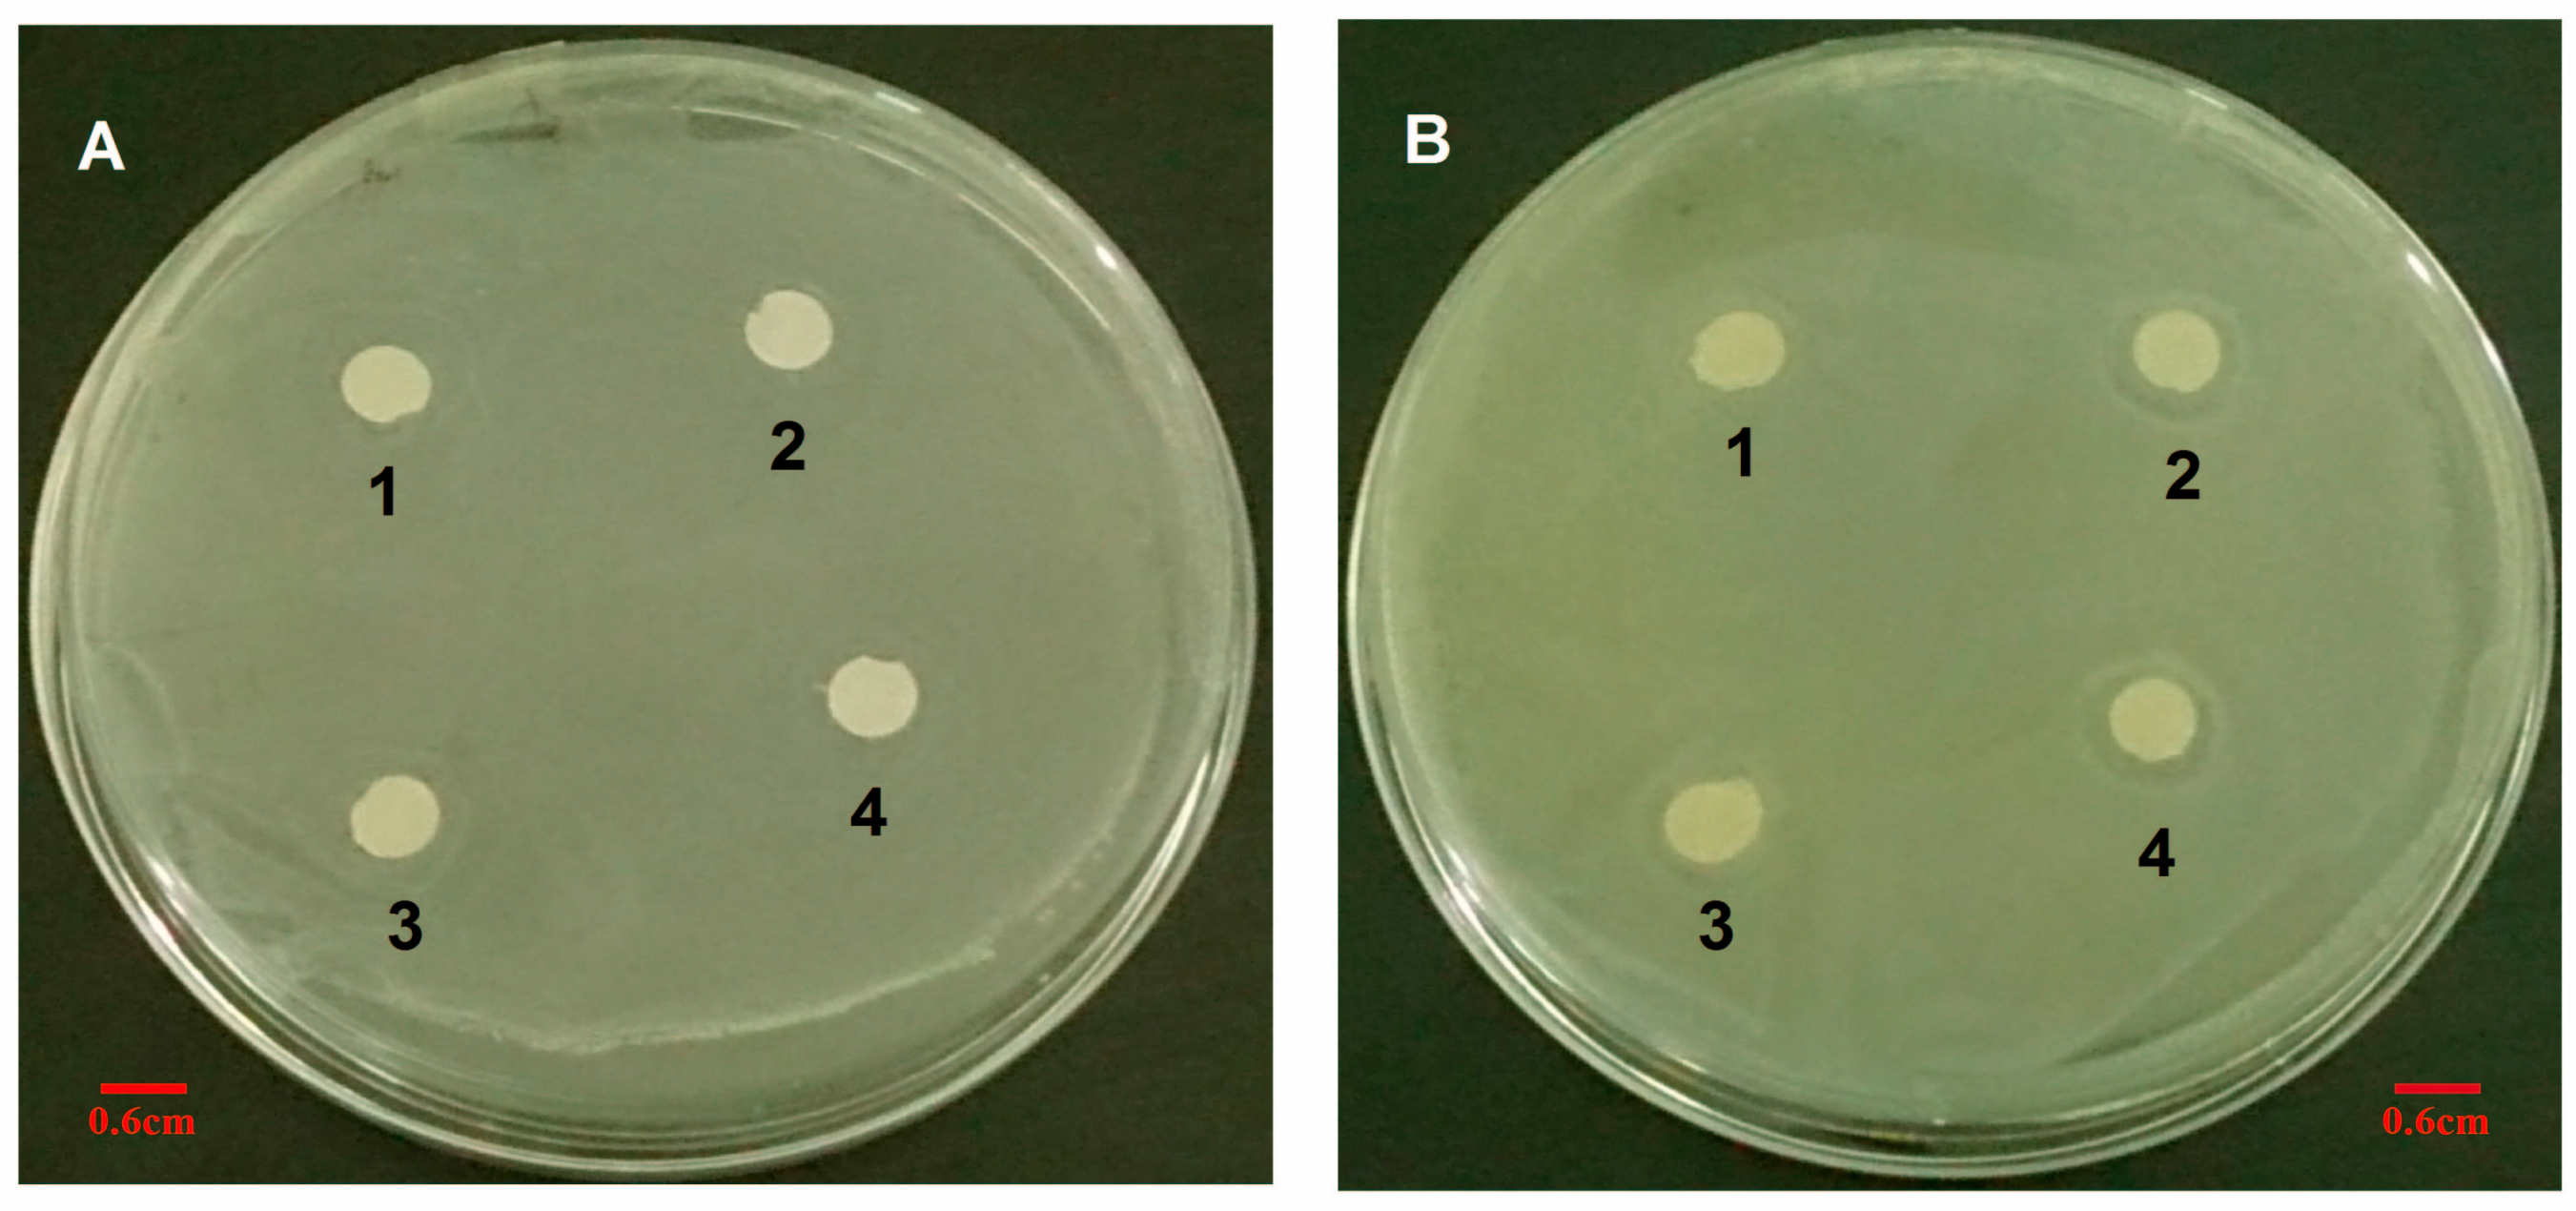
2.10.4. The Diameter of Inhibition Zone Test
To ensure the susceptibility of S. aureus to VCM/TMC nanoparticles, we measured zones of growth inhibition by the agar disk diffusion assay. Briefly, sterile filter discs (6 mm in diameter) were impregnated with 100 μL of VCM/TMC nanoparticle solution (50, 60, 70 and 80 μg/mL), VCM solution (50, 60, 70 and 80 μg/mL) or PBS (pH 7.4) control solution for about 30 min, and then plated on the surface of LB agar plates, in which approximately 106 CFU of S. aureus were previously inoculated (each plate contained four paper discs). After incubation for 24 h at 37 °C, the DIZ, in which there was no visible bacterial growth, was determined as an average of four measurements, in four perpendicular directions, using a vernier caliper. All tests were performed in triplicate.
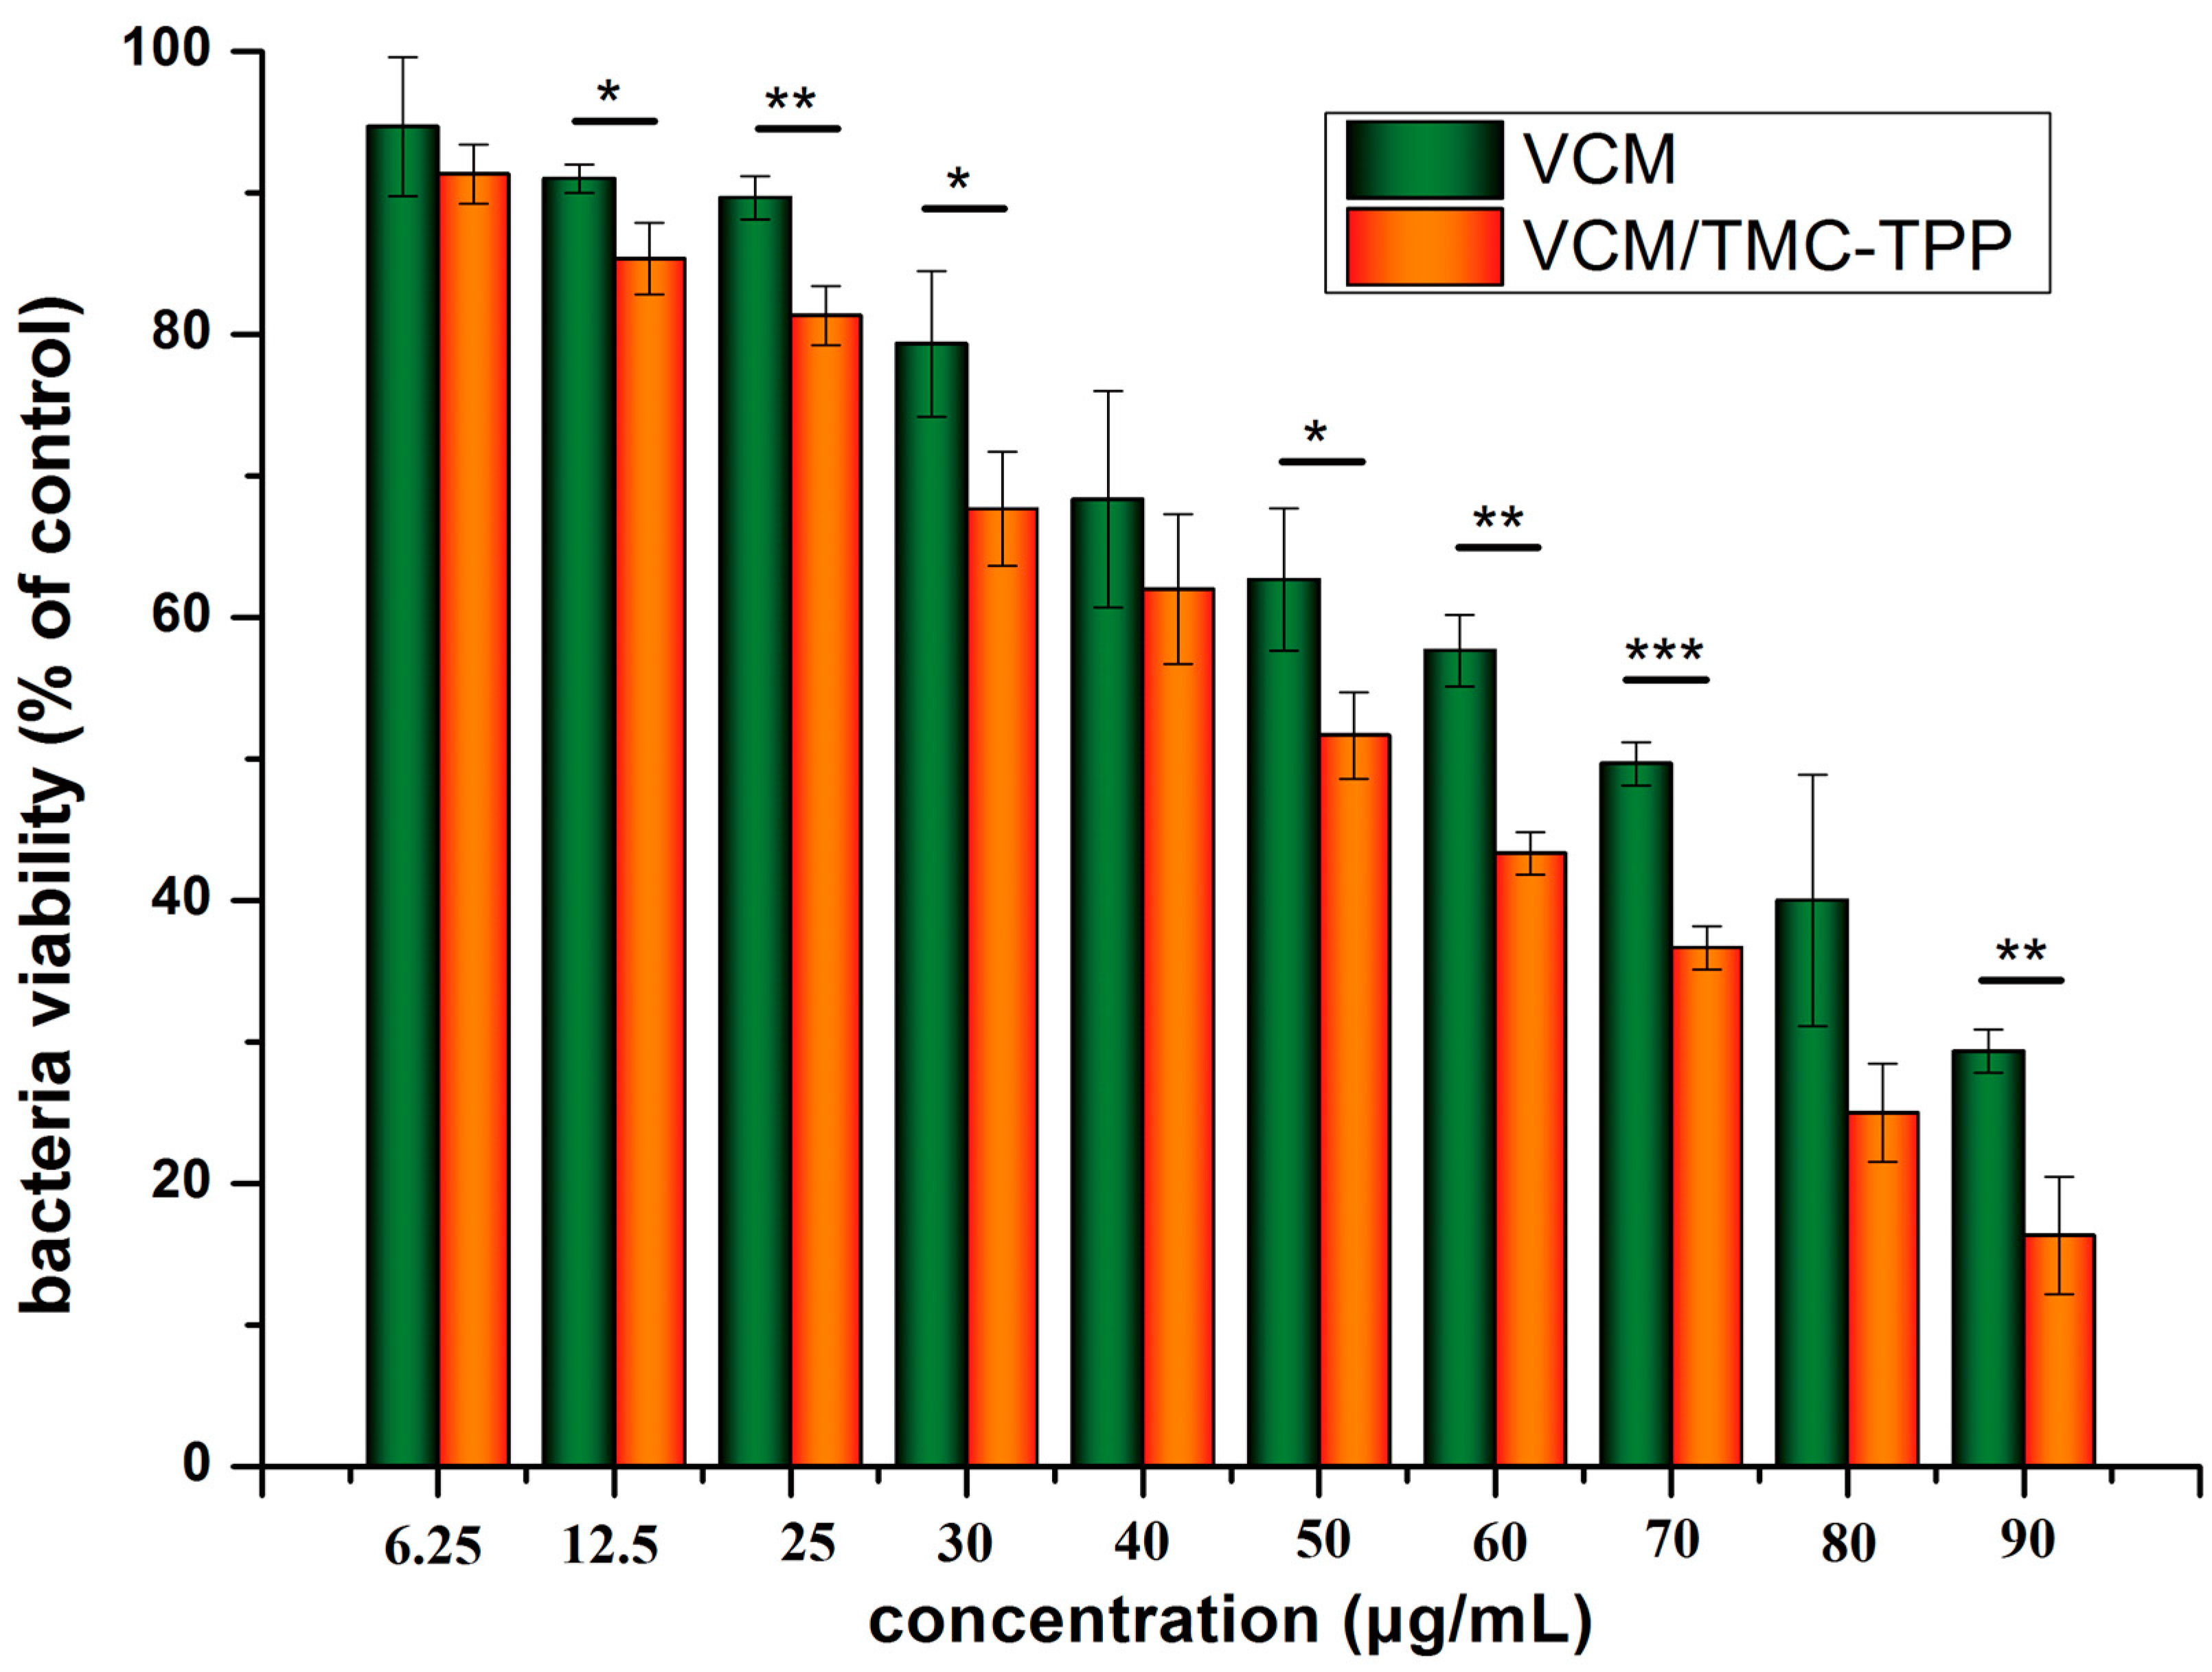
2.10.5. Turbidimetric Assay
The TB assay was used to determine the antibacterial effects of VCM/TMC nanoparticles against the growth and proliferation of
S. aureus. LB broth alone was used as a blank and samples without drug were used as the control group. As mentioned above, 200 μL of the bacteria, at a density of (4.0 × 10
5)–(5.0 × 10
5) CFU/mL, were mixed with 20 μL of nanoparticles or VCM solution at concentrations of 6.25, 12.5, 25, 30, 40, 50, 60, 70, 80 and 90 μg/mL, and placed in 96 well plates. After culturing for 24 h, a microplate reader (XMARK, Bio-Rad, Hercules, CA, USA) was used to measure the OD at 600 nm and the results were described as a percentage of bacterial viability, which was calculated as follows:
Each concentration was repeated four times.
2.11. Statistical Analysis
Statistical analysis was performed using the software program GraphPad Prism 5 (GraphPad Software Inc., La Jolla, CA, USA). Data are presented as mean ± standard deviation (SD) for all results. Statistical significance was determined either by a paired t test or a one-way analysis of variance (ANOVA) with Bonferroni’s or Dunnett’s post hoc tests, depending on the experimental setup. A value of p < 0.05 (two-tailed) was considered to be statistically significant.
4. Conclusions
This work has demonstrated that rationally designed antibiotic VCM-loaded TMC nanoparticles can be readily prepared using ionic complexation, with high drug loading capacity and steady, continued release. After treatment with TMC-TPP, OBs exhibit high ALP activity. The nanoparticles were efficiently taken up into OBs, showing that they can be useful nanocarriers for the intracellular delivery of various antibiotics. OBs exposed to VCM/TMC nanoparticles exhibited very high cell proliferative ability, more easily establishing a desired cell population. Furthermore, the results of MIC, IC50, DIZ and TB assays, all indicate the excellent antibacterial activity of VCM/TMC nanoparticles against the Gram-positive S. aureus, thus making it a novel antibacterial candidate substance for the treatment of bacterial infections. In summary, the VCM/TMC nanoparticles are effective intracellular drug carriers owing to their positively charged surface, suitable size distribution, sustained release profiles, good cell uptake activity, ability to induce OB proliferation and excellent antibacterial activity. These nanoparticles thus can be a promising strategy to treat intracellular infections such as chronic osteomyelitis.
In addition, our further work is currently in progress to use poly-(trimethylene carbonate) (PTMC), a kind of surface-eroding biodegradable material [
23], which is fully biocompatible [
24], and exhibits an ideal sustained, zero order release profile and also promotes bone regeneration [
25], to prepare VCM/TMC nanoparticle-loaded PTMC local drug delivery system, with a view to treating chronic osteomyelitis that is caused by intracellular infections in human patients.


