
Interval Analysis: A New Tool for the Characterization of an Epoxy-Amine/Aluminum System

Abstract
:
1. Introduction
2. Experimental Section
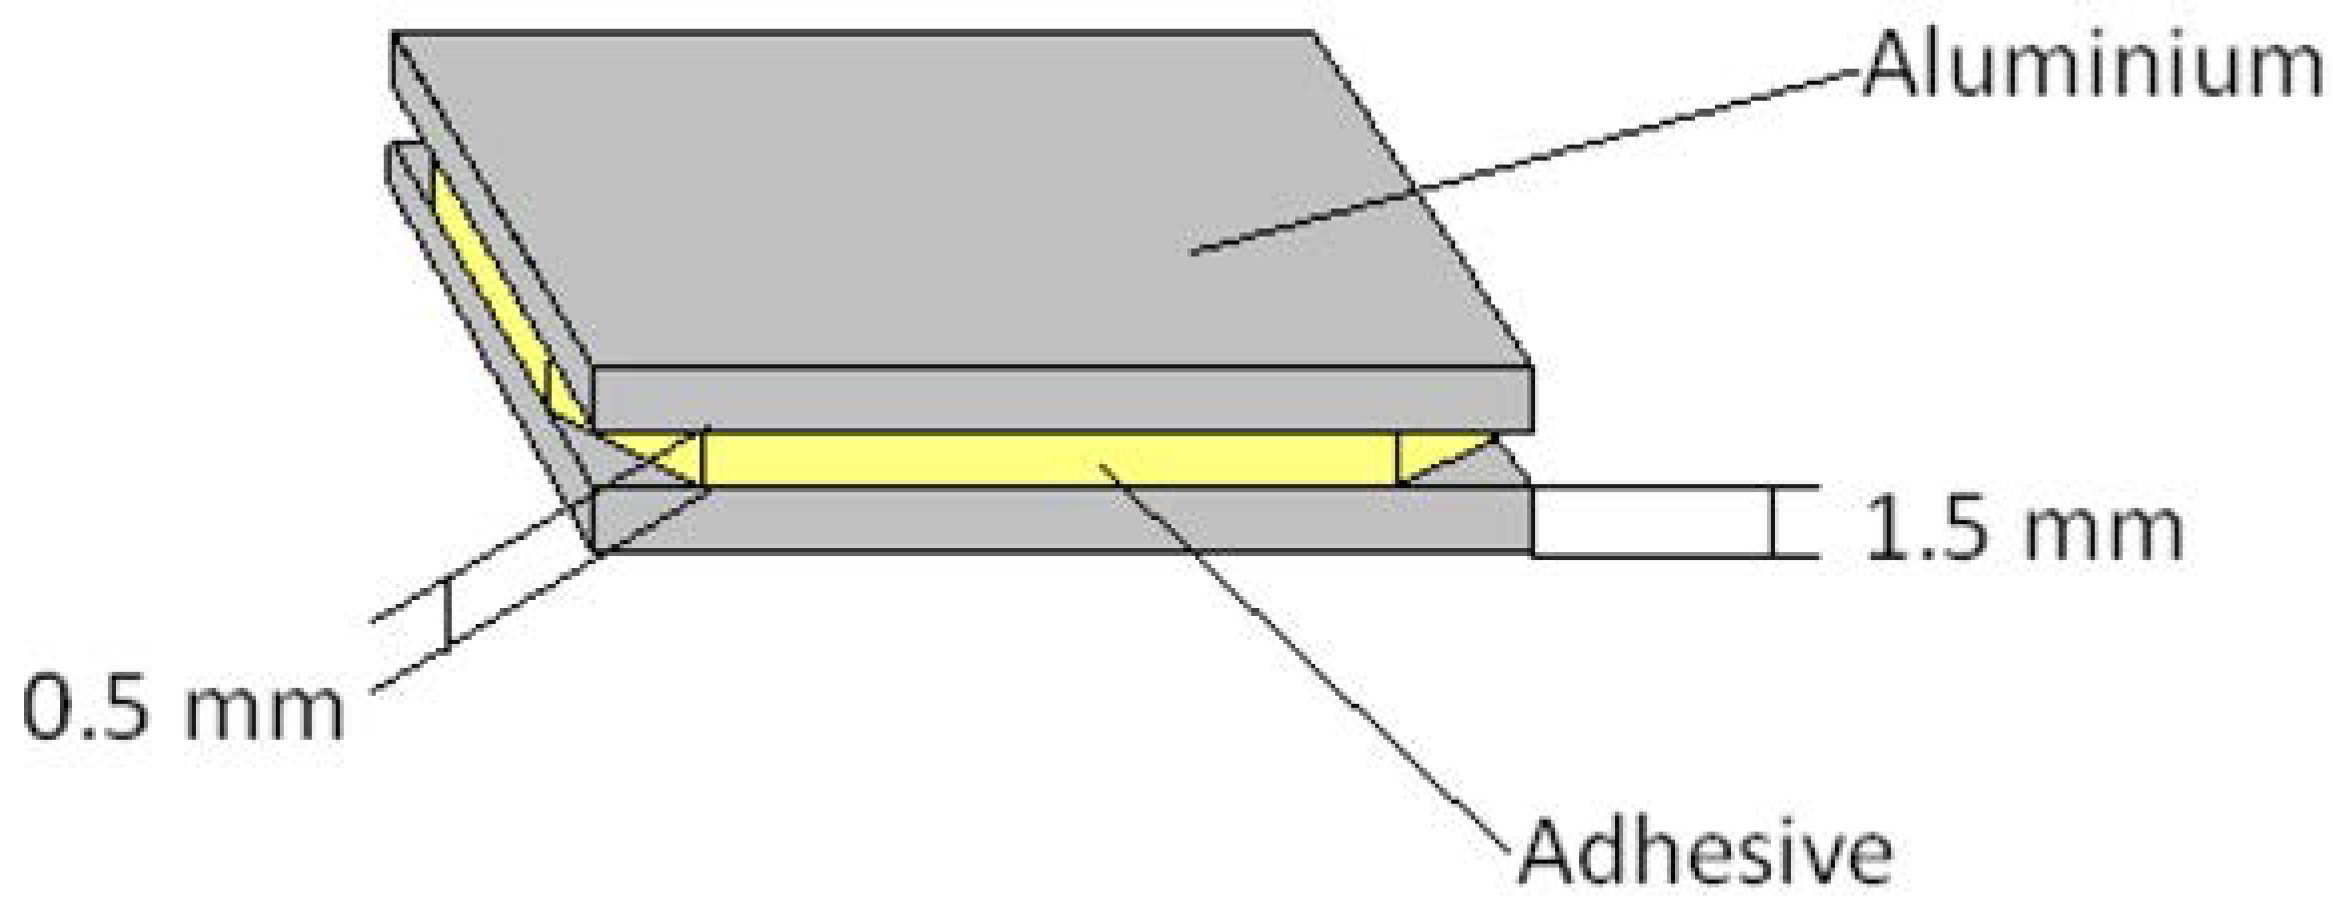
2.1. Materials

2.2. DSC: Differential Scanning Calorimetry
2.3. Dielectric Spectroscopy
2.4. Modeling Using Interval Analysis
- -
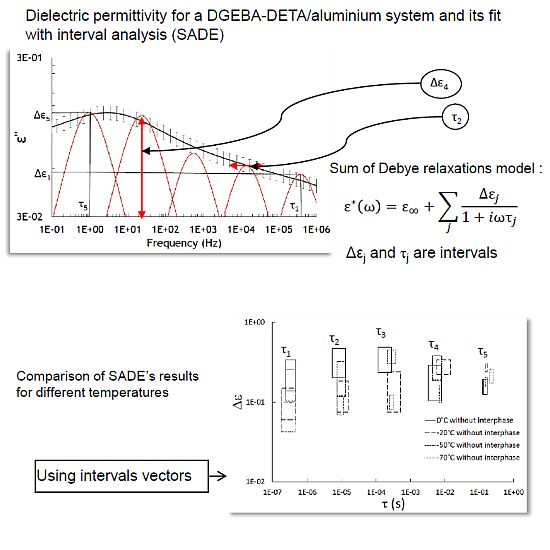
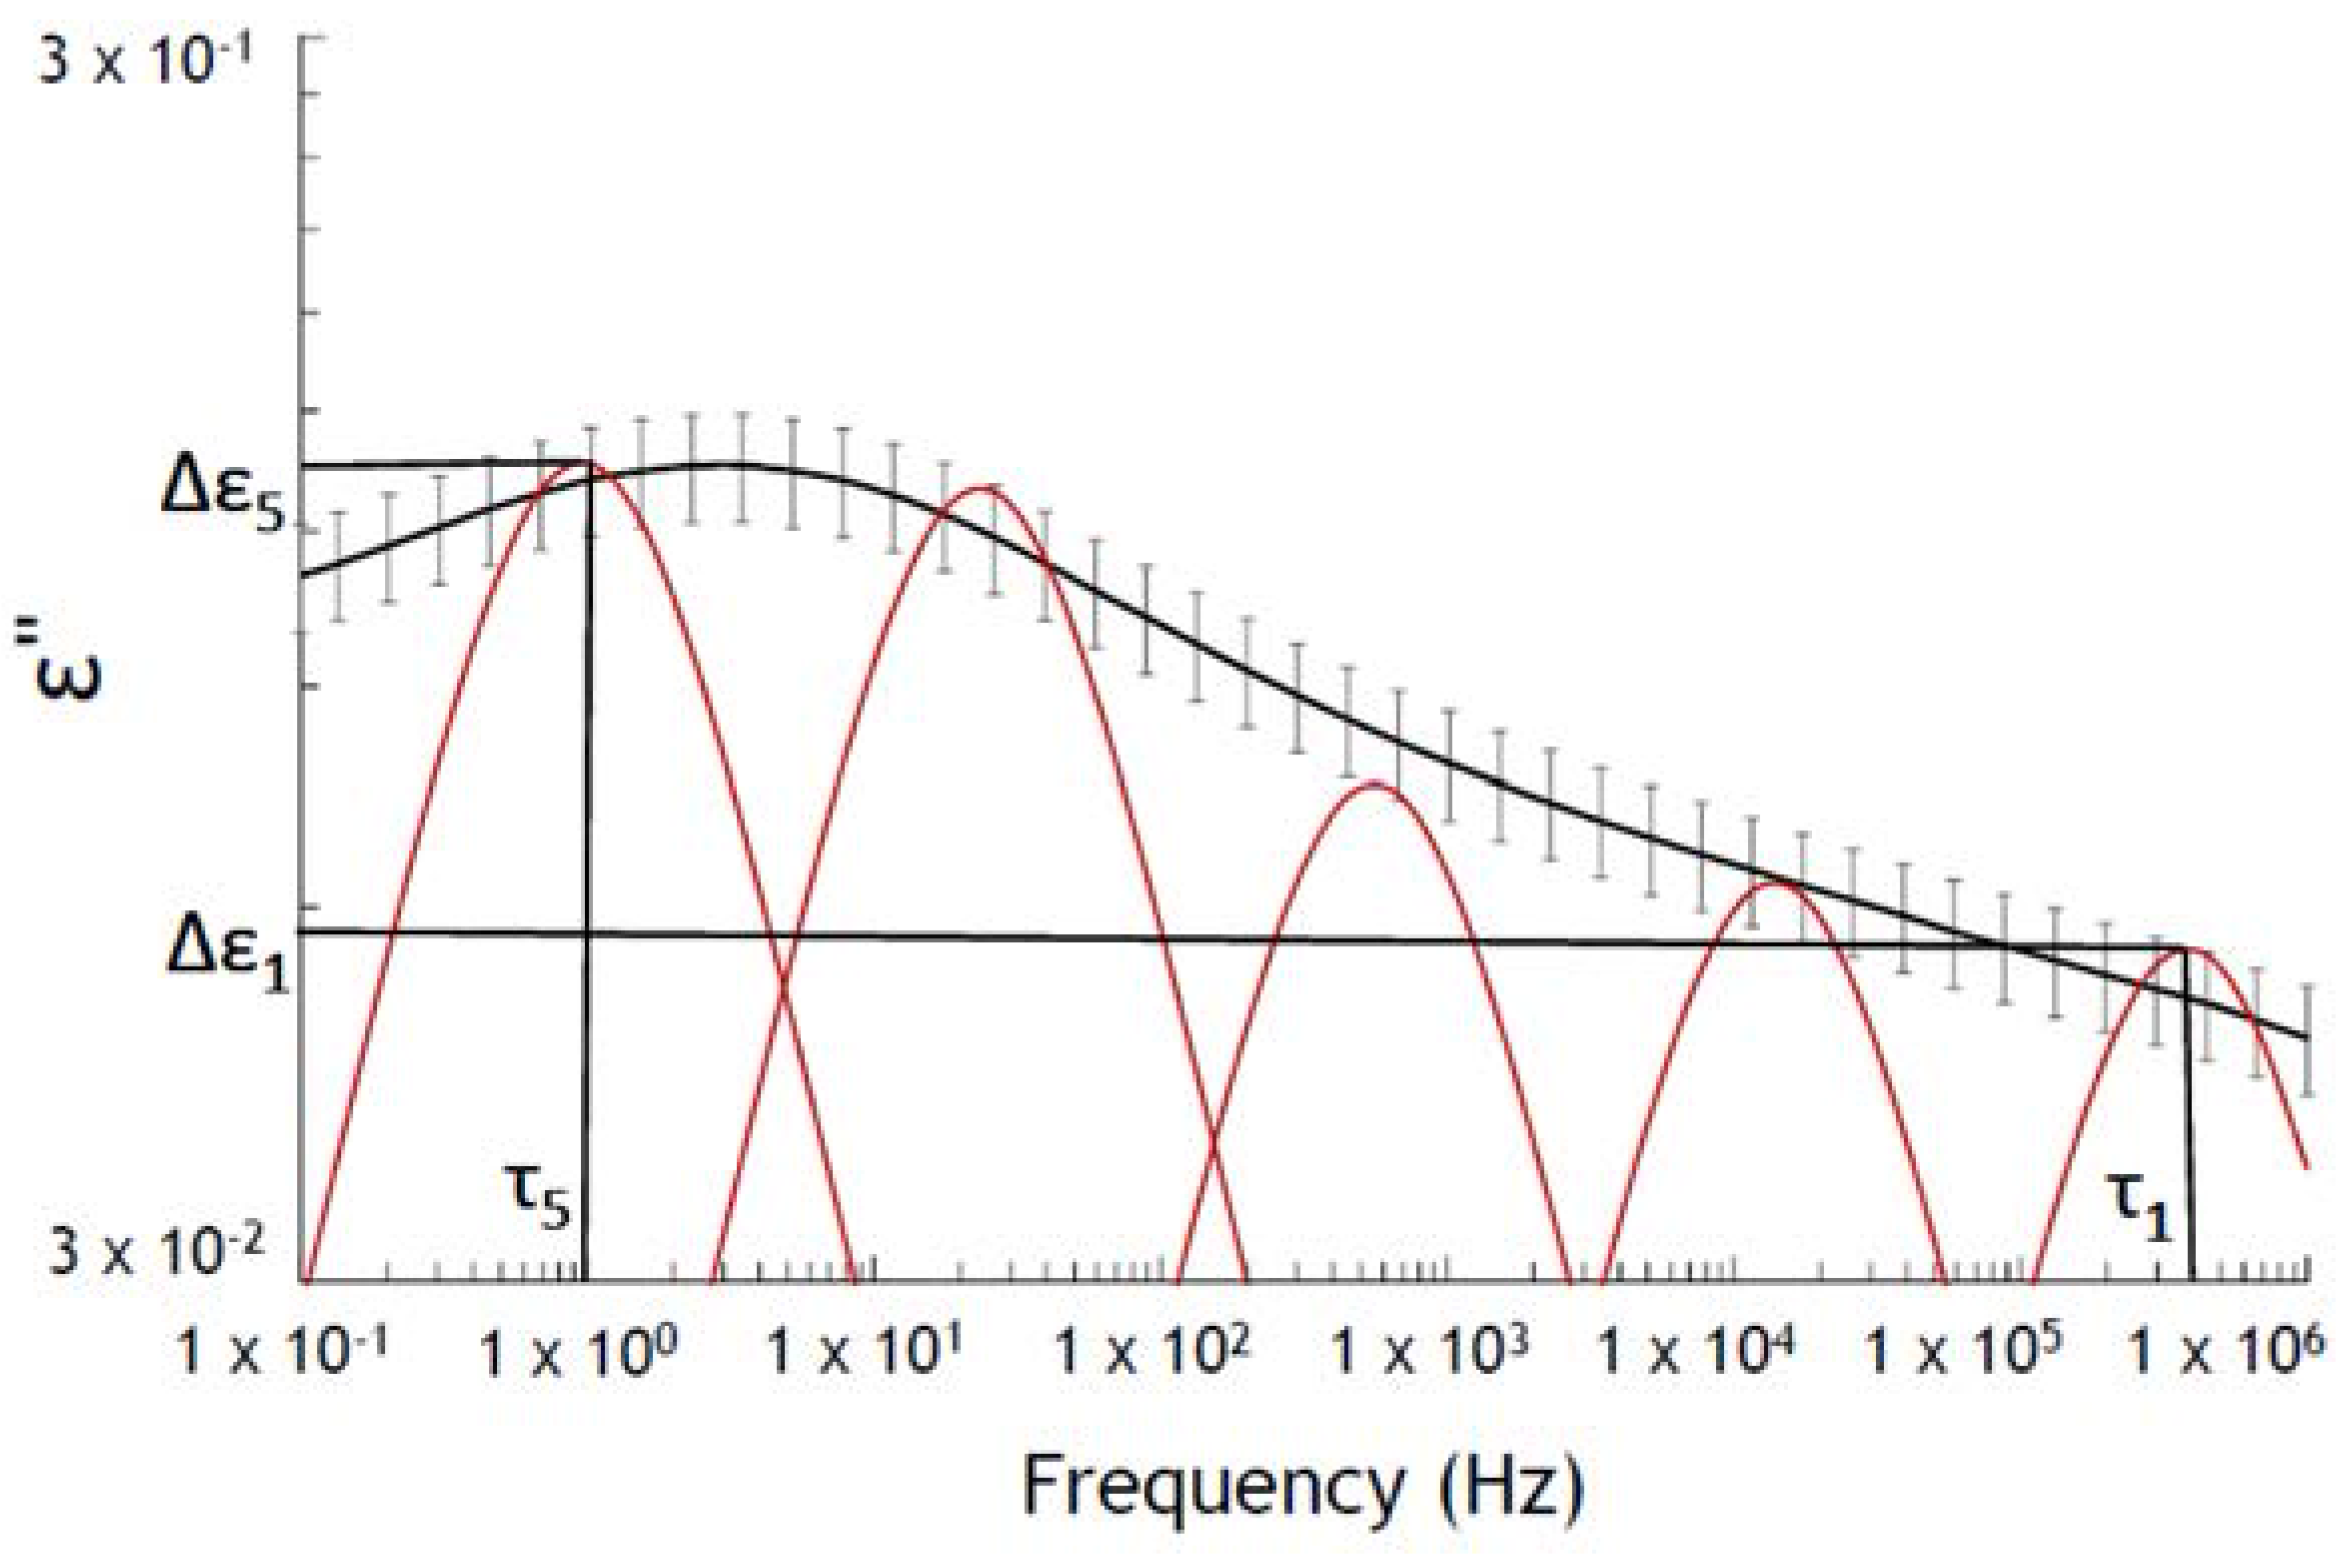
- Traditionally, Havriliak–Negami model [7] is used to fit the complex permittivity (ε∗) as a function of frequency (ω):where α: peak broadening, β: peak asymmetry, εs is the static permittivity , ε∞ is the optical dielectric constant and τ is the relaxation time.Harviliak–Negami gave information about relaxation peak broadening, cooperative effects, heterogeneities, . . .
- -
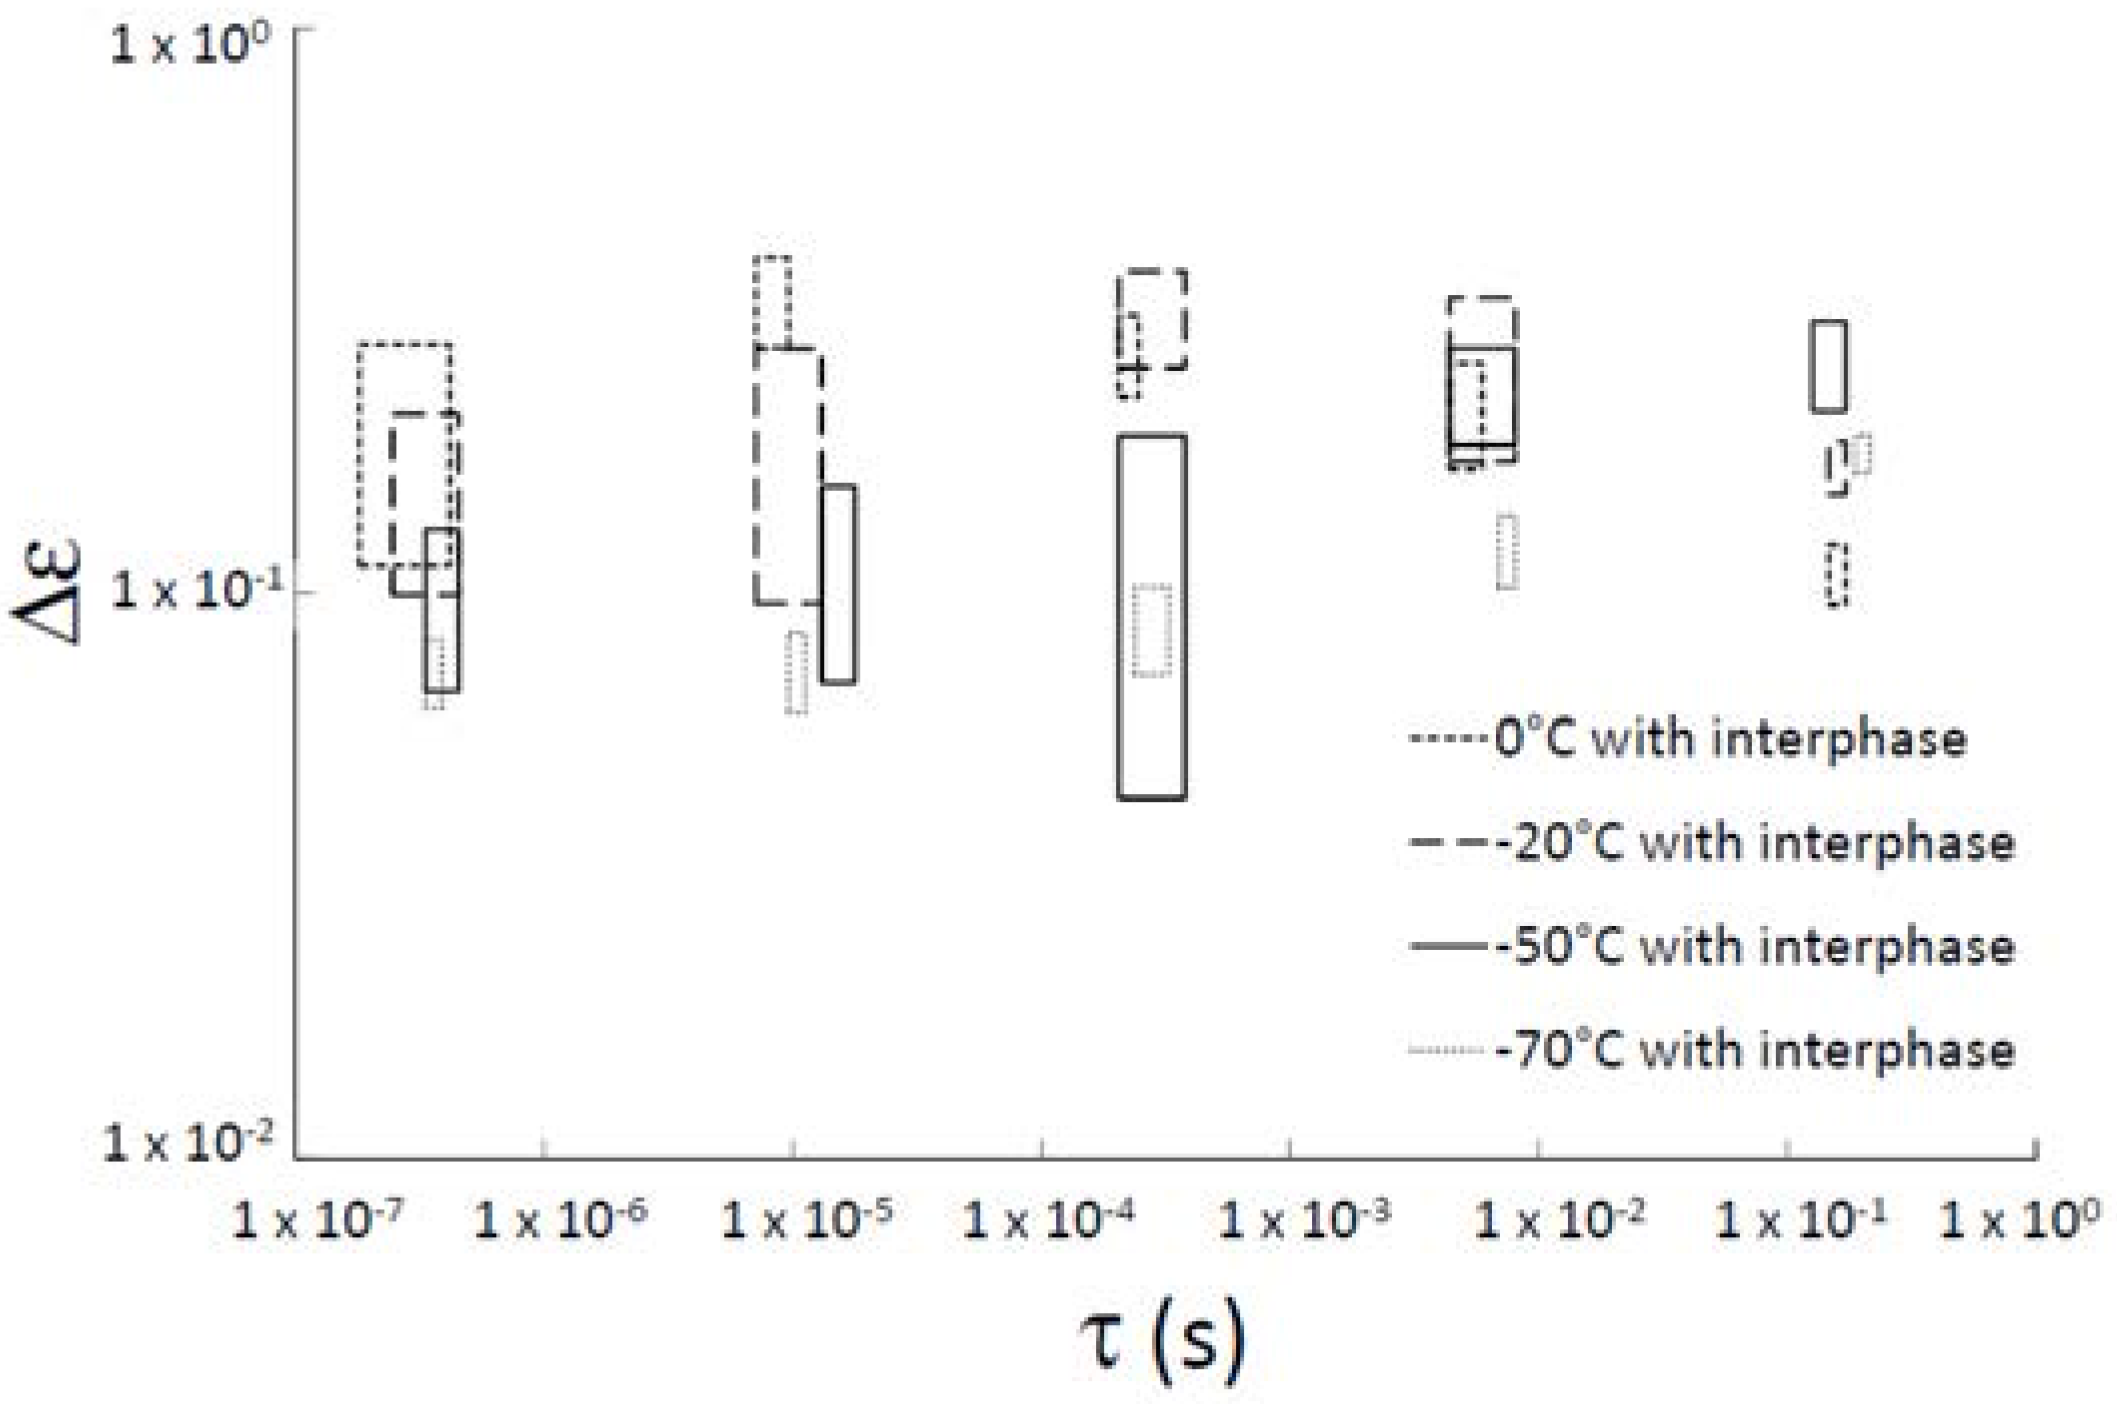
- ∆εj is related to the intensity of the relaxations found by SADE (SADE is freely available on the website of Maëlenn Aufray (http://maelenn.aufray.free.fr). SADE is protected by copyright ©2006 Brochier, and is distributed under the terms of the GNU general license.) and τj is related to the position of the relaxation.

Input data:
| Output results :
|
3. Results and Discussion


| Parameters | Intervals |
|---|---|
| ∆ε∞ | [3.08, 3.22] |
| σDC | [3.75 × 10⁻¹³, 5.70 × 10⁻¹³] |
| ∆ε1 | [0.05, 0.15] |
| τ1 (s) | [1.28 × 10⁻⁷, 4.70 × 10⁻⁷] |
| ∆ε2 | [0.06, 0.19] |
| τ2 (s) | [4.53 × 10⁻⁶, 1.65 × 10⁻⁵] |
| ∆ε3 | [0.05, 0.25] |
| τ 3 (s) | [0.20 × 10⁻⁴, 0.58 × 10⁻⁴] |
| ∆ε4 | [0.18, 0.36] |
| τ4 (s) | [0.56 × 10⁻³, 1.49 × 10⁻²] |
| ∆ε5 | [0.14, 0.23] |
| τ5 (s) | [0.17, 0.28] |


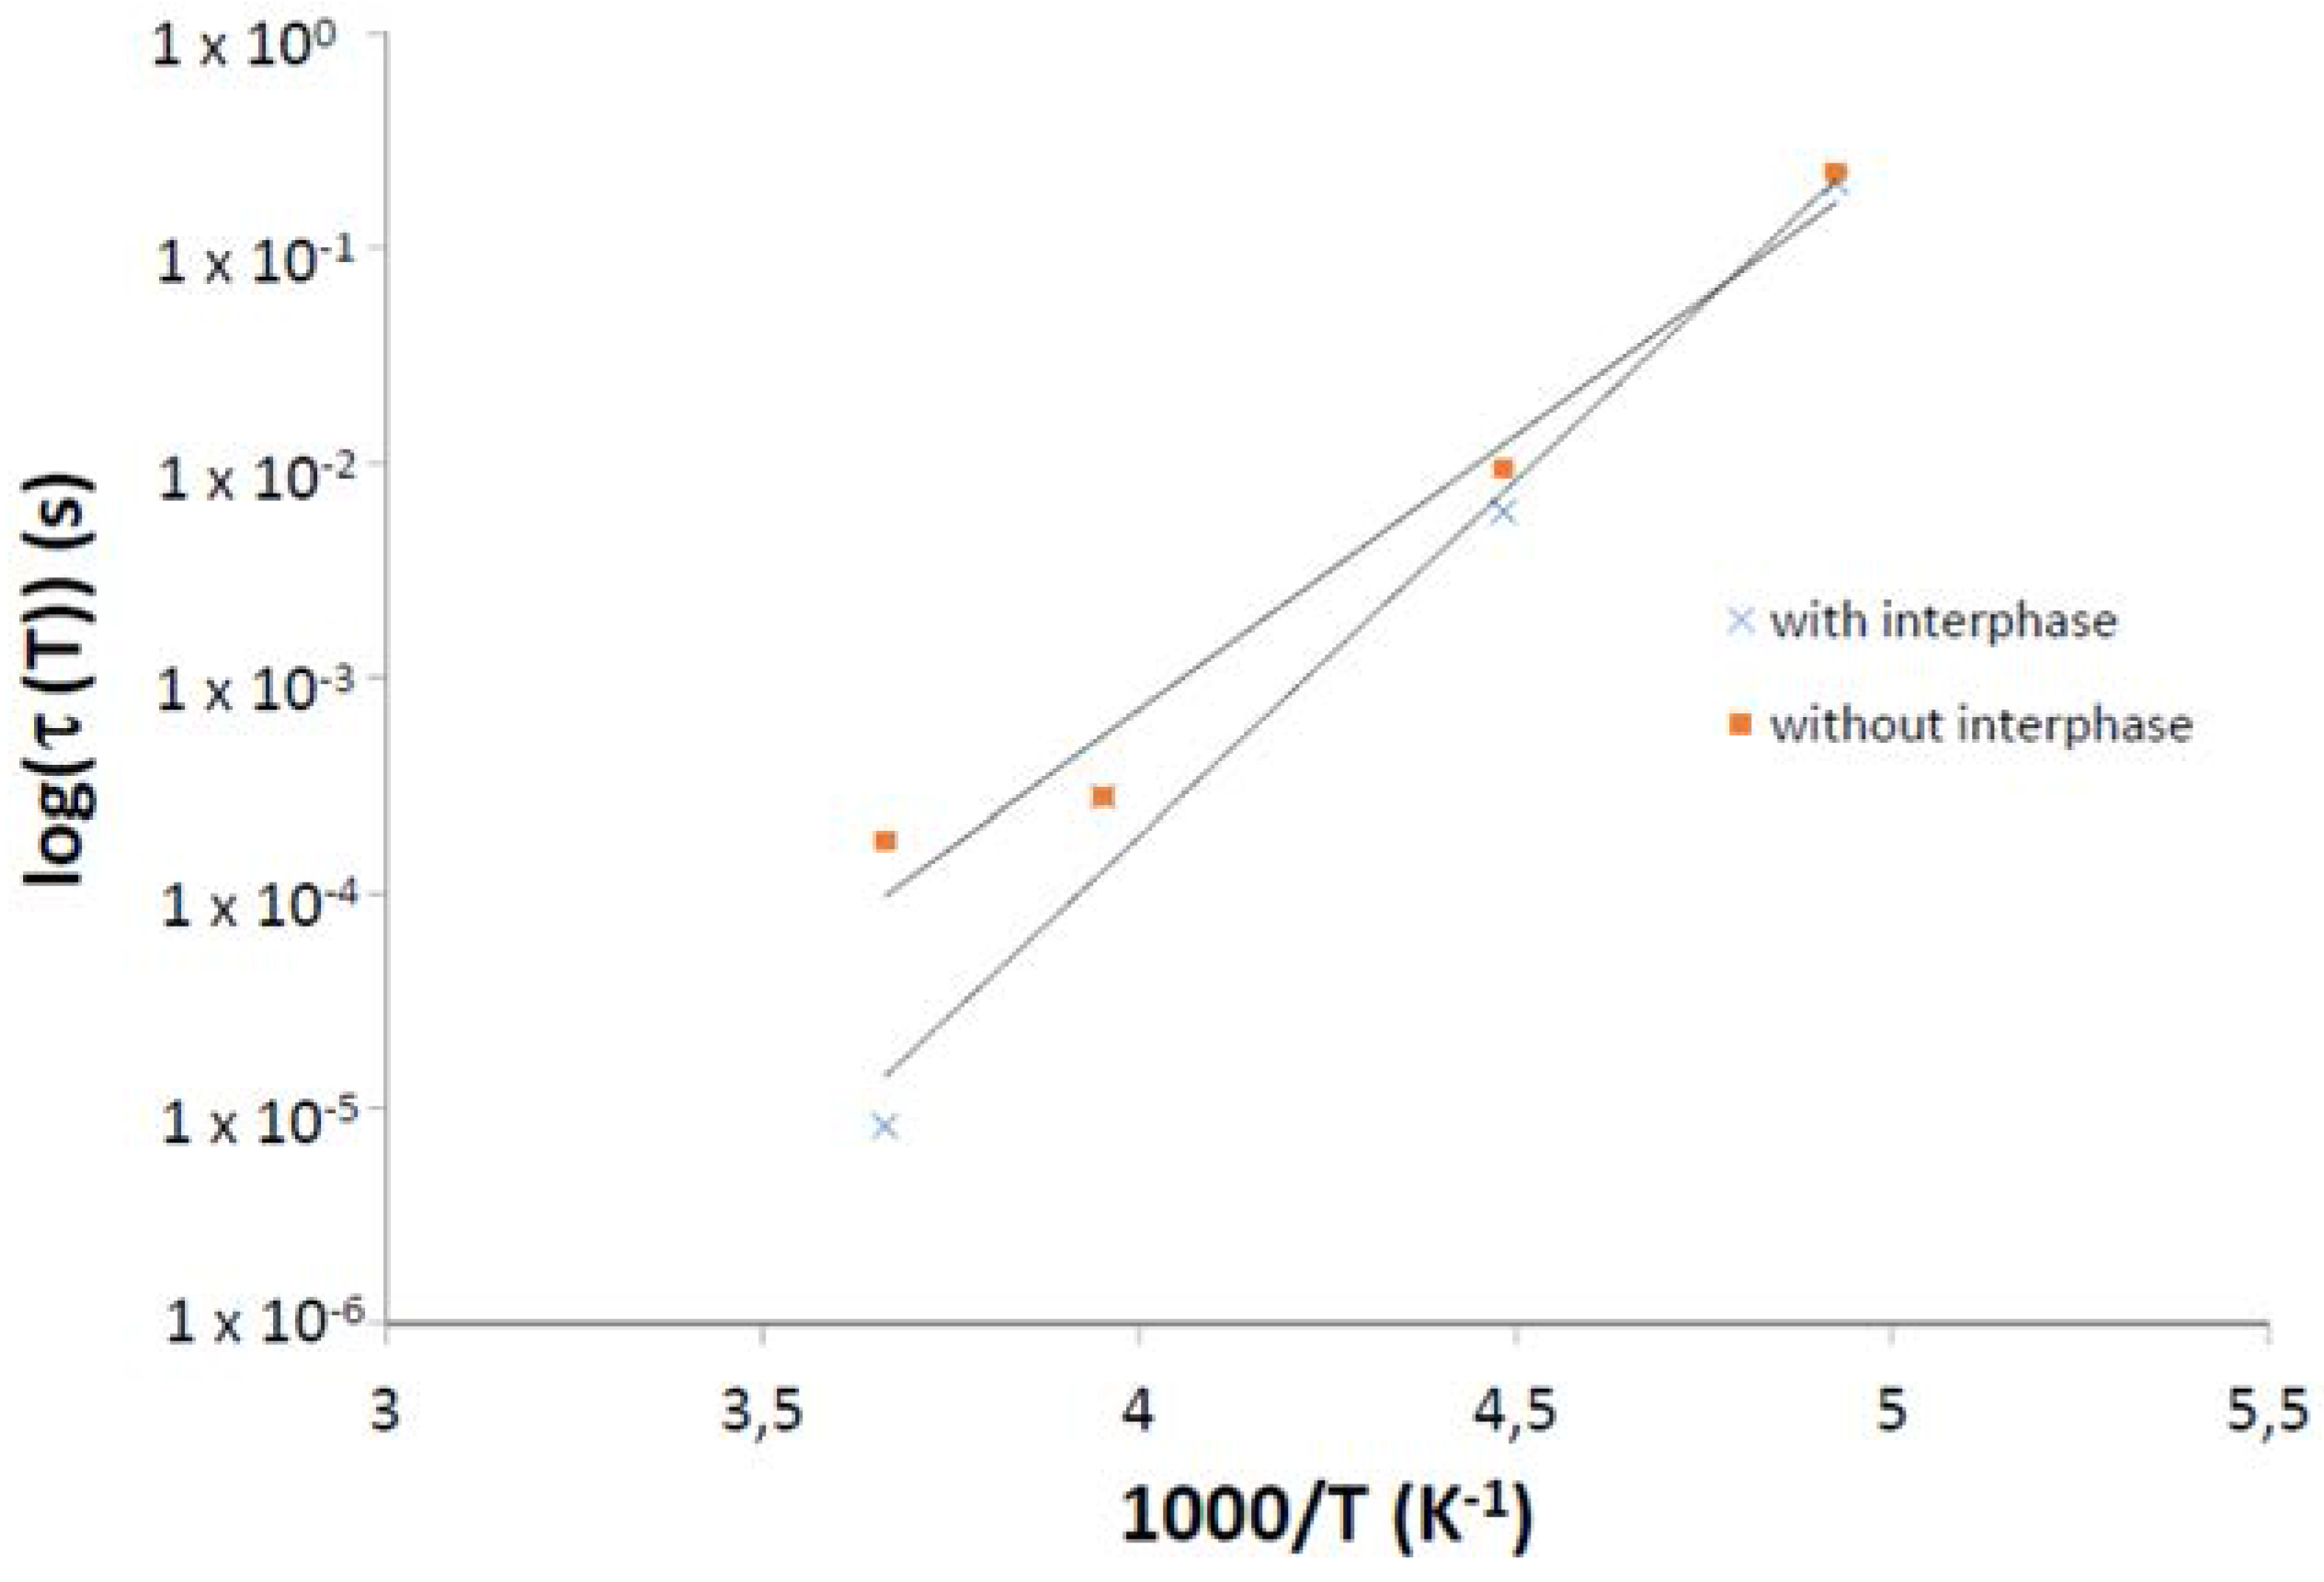
| Sample | τ0 (s) | Ea (kJ·mol−1) |
|---|---|---|
| without interphase | 4.32 × 10⁻¹⁴ | 5.88 |
| with interphase | 1.10 × 10⁻¹⁷ | 7.61 |
4. Conclusions
Acknowledgments
Author Contributions
Conflicts of Interest
References
- Possart, W.; Kruger, J.; Wehlack, C.; Muller, U.; Petersen, C.; Bactavatchalou, R.; Meiser, A. Formation and structure of epoxy network interphases at the contact to native metal surfaces. C. R. Chim. 2006, 9, 60–79. [Google Scholar] [CrossRef]
- Roche, A.; Bouchet, J.; Bentadjine, S. Formation of epoxy-diamine/metal interphases. Int. J. Adhes. Adhes. 2002, 22, 431–441. [Google Scholar] [CrossRef]
- Barthes-Labrousse, M.G. Mechanisms of formation of the interphase in epoxy-amine/aluminium joints. J. Adhes. 2012, 88, 699–719. [Google Scholar] [CrossRef]
- Safavi-Ardebili, V.; Sinclair, A.; Spelt, J. Experimental investigation of the interphase in an epoxy-aluminum system. J. Adhes. 1997, 62, 93–111. [Google Scholar] [CrossRef]
- Brochier, A.; Aufray, M.; Possart, W. Dielectric spectra analysis: Reliable parameter estimation using interval analysis. In Materials with Complex Behaviour—Modelling, Simulation, Testing, and Applications; Springer: Berlin, Germany, 2010; pp. 99–123. [Google Scholar]
- Casalini, R. Influence of the glass transition on the secondary relaxation of an epoxy resin. Phys. Rev. B 1997, 56, 3016–3021. [Google Scholar] [CrossRef]
- Havriliak, S.; Negami, S. A complex plane representation of dielectric and mechanical relaxation processes in some polymers. Polymer 1967, 8, 161–210. [Google Scholar] [CrossRef]
- Debye, P. Polar Molecules; Lancaster Press: Lancaster, PA, USA, 1929. [Google Scholar]
- Casalini, R.; Fioretto, D.; Livi, A.; Lucchesi, M.; Rolla, P. Influence of the glass transition on the secondary relaxation of an epoxy resin. Phys. Rev. B 1997, 56, 3016–3021. [Google Scholar] [CrossRef]
- Heijboer, J. Torsion pendulum in the investigation of polymers. Polym. Eng. Sci. 1979, 19, 664–675. [Google Scholar] [CrossRef]
- Williams, J.G. The beta relaxation in epoxy resin-based networks. J. Appl. Polym. Sci. 1979, 23, 3433–3444. [Google Scholar] [CrossRef]
- Couderc, H.; Frechette, M.; David, E.; Savoie, S. Study of dielectric relaxation of epoxy composites containing micro and nano particles. IEEE Trans. Dielectr. Electr. Insul. 2013, 20, 592–600. [Google Scholar] [CrossRef]
- Aufray, M.; Brochier, A.; Possart, W. Interval analysis applied to dielectric spectroscopy: A guaranteed parameter estimation. In Proceedings of the 16th IFAC Symposium on System Identification, Brussels, Belgium, 11–13 July 2012; pp. 458–463.
- Hamciuc, C.; Serbezeanu, D.; Carja, I.D.; Vlad-Bubulac, T.; Musteata, V.E.; Forrat Perez, V.; Guillem Lopez, C.; Lopez Buendia, A. Effect of DOPO units and of polydimethylsiloxane segments on the properties of epoxy resins. J. Mater. Sci. 2013, 48, 8520–8529. [Google Scholar] [CrossRef]
© 2015 by the authors; licensee MDPI, Basel, Switzerland. This article is an open access article distributed under the terms and conditions of the Creative Commons Attribution license (http://creativecommons.org/licenses/by/4.0/).
Share and Cite
Pomes-Hadda, M.; Aufray, M.; Diaham, S. Interval Analysis: A New Tool for the Characterization of an Epoxy-Amine/Aluminum System. Polymers 2015, 7, 644-654. https://doi.org/10.3390/polym7040644
Pomes-Hadda M, Aufray M, Diaham S. Interval Analysis: A New Tool for the Characterization of an Epoxy-Amine/Aluminum System. Polymers. 2015; 7(4):644-654. https://doi.org/10.3390/polym7040644
Chicago/Turabian StylePomes-Hadda, Mickaël, Maëlenn Aufray, and Sombel Diaham. 2015. "Interval Analysis: A New Tool for the Characterization of an Epoxy-Amine/Aluminum System" Polymers 7, no. 4: 644-654. https://doi.org/10.3390/polym7040644