Article

Biopolymer Electrolyte Based on Derivatives of Cellulose from Kenaf Bast Fiber

by
Mohd Saiful Asmal Rani
1,
Siti Rudhziah
1,2,
Azizan Ahmad
3 and
Nor Sabirin Mohamed
4,*
1
Institute of Graduate Studies, University of Malaya, 50603 Kuala Lumpur, Malaysia
2
Centre of Foundation Studies, Universiti Teknologi MARA, 42300 Bandar Puncak Alam, Selangor Darul Ehsan, Malaysia
3
School of Chemistry Science and Food Technology, Faculty of Science and Technology, Universiti Kebangsaan Malaysia, 43600 Bangi, Selangor Darul Ehsan, Malaysia
4
Centre for Foundation Studies in Science, University of Malaya, 50603 Kuala Lumpur, Malaysia
*
Author to whom correspondence should be addressed.
Polymers 2014, 6(9), 2371-2385; https://doi.org/10.3390/polym6092371
Submission received: 23 June 2014 / Revised: 20 August 2014 / Accepted: 10 September 2014 / Published: 19 September 2014
(This article belongs to the Collection Polysaccharides)

Abstract

:
A cellulose derivative, carboxymethyl cellulose (CMC), was synthesized by the reaction of cellulose from kenaf bast fiber with monochloroacetic acid. A series of biopolymer electrolytes comprised of the synthesized CMC and ammonium acetate (CH3COONH4) were prepared by the solution-casting technique. The biopolymer-based electrolyte films were characterized by Fourier Transform Infrared spectroscopy to investigate the formation of the CMC–CH3COONH4 complexes. Electrochemical impedance spectroscopy was conducted to obtain their ionic conductivities. The highest conductivity at ambient temperature of 5.77 × 10⁻⁴ S cm−1 was obtained for the electrolyte film containing 20 wt% of CH3COONH4. The biopolymer electrolyte film also exhibited electrochemical stability up to 2.5 V. These results indicated that the biopolymer electrolyte has great potential for applications to electrochemical devices, such as proton batteries and solar cells.

Graphical Abstract

1. Introduction

Over the last four decades, polymer electrolytes (PEs) have attracted researchers’ attention all over the world. PEs play an important role in solid state ionics due to their unique properties, such as the ease of fabrication into a thin film with a large surface area to give a high energy density, the ability to accommodate a wide range of ionic salt doping compositions, good electrode-electrolyte contact and high ionic conductivity [1]. The PE materials have been studied due to the possibility of their application in a variety of electrochemical devices, such as batteries, electrochromic displays and fuel cells [2]. Since the earliest breakthrough of polymer-salt complexes by Fenton et al. [3], Wright [4] and continued by Armand et al. [5], there has been a plethora of research focusing on solvent-free PEs. However, synthetic polymers that are commonly used as hosts face disadvantages, such as high cost and not being environmentally “green”. As an alternative way to obtain polymer hosts with a lower cost, in an environmentally-friendly manner and with good chemical and physical properties, natural polymers, such as cellulose and its derivatives, have been investigated. Carboxymethyl cellulose (CMC) is one type of cellulose derivative that has good film forming properties, can form a transparent film and possesses high mechanical strength [6]. CMC is a natural anionic polysaccharide, which is widely used in many industrial sectors, including food, textiles, paper, adhesives, paints, pharmaceuticals, cosmetics and mineral processing. It is a natural organic polymer that is non-toxic, renewable, available in abundance, biocompatible and biodegradable [7]. It contains a hydrophobic polysaccharide backbone and many hydrophilic carboxyl groups; hence, showing amphiphilic characteristic. Figure 1 shows the molecular structure of carboxymethyl cellulose (CMC).
Figure 1. The molecular structure of carboxymethyl cellulose (CMC).
Polymers 06 02371 g001
In general, cellulose is made up of glucose rings connected by –C(1)–O–C(4) ether bonds, known as β-1,4 glycosidic linkages, with extensive intramolecular hydrogen [8,9]. However, the properties of CMC depend on the degree of substitution (DS) of the hydroxyl group, which takes part in the substitution reaction in the cellulose, respectively, as well as the purity, molecular weight and crystallinity [10]. In this work, CMC was derived from cellulose obtained from kenaf fiber. The DS of the synthesized CMC is expected to be higher than that of commercial CMCs. This means that the CMC will have a higher number of oxygens, thus providing more active sites for coordination with the cations of the doping salt, resulting in a higher conductivity value. The structural, morphological, electrical properties and electrochemical stability window of CMC synthesized using cellulose from kenaf bast fiber added with ammonium acetate (CH3COONH4) biopolymer electrolytes (BPEs) have been investigated. The DS of CMC obtained from kenaf bast fiber was also determined. Novel BPEs from kenaf fiber with good properties have been obtained. To the best of the authors’ knowledge, there has been no work on proton conducting BPEs based on CMC from kenaf fiber reported in the literature. It is hoped that these BPEs can be used as alternative electrolytes in order to sustain a green world in the future.

2. Experimental Section

2.1. Synthesis of Cellulose

Cellulose was prepared from raw kenaf bast (Hibiscus cannabinus) fiber. Firstly, kenaf fiber was blended into small pieces and then treated with a 4% NaOH solution at 90 °C for 3 h under mechanical stirring. This treatment was repeated three times, and the fibers were filtered and washed with distilled water. The fiber was later bleached in a solution consisting of equal parts of acetate buffer (solution of NaOH and acetic acid in distilled water), aqueous sodium chlorite and distilled water. Treatment was repeated three times and was performed at 90 °C for 4 h under mechanical stirring. Then, the bleached fibers was filtered, washed with distilled water and dried at room temperature. The significance of the alkali treatment was to eliminate the alkali-soluble components, while the bleaching treatment was conducted to remove the residual lignin. Figure 2 shows photographs of the kenaf fiber, the fiber after alkali treatment and lignin-free cellulose.
Figure 2. Photographs of (a) kenaf fiber; (b) fiber after alkali treatment; and (c) lignin-free cellulose.
Polymers 06 02371 g002

2.2. Synthesis of Carboxymethyl Cellulose from Cellulose Fiber

Five grams of lignin-free cellulose were mixed with 100 mL of isopropanol in 500-mL conical flask. The conical flask was in a water bath. Then, NaOH solution was poured into the conical flask, drop by drop, and stirred for 15 min. Next, a solution of monochloroacetic acid and isopropanol was added into the conical flask. The mixtures were heated, stirred and etherified for another 4 h. Later, 7% of ethanol was added into the mixtures and heated for another one hour. Lastly, the CMC obtained was washed with 7%, 8% and 9% of ethanol solutions and dried at ambient temperature.

2.3. Preparation of CMC-Based Biopolymer Electrolytes

The solution casting technique was employed to obtain films with various amounts of ammonium salt concentration (10–40 wt%). Pure CMC film without ammonium salt was also prepared as a control. In a clean beaker, weighted amounts of CMC powder and CH3COONH4 crystals were dissolved in 40 mL of 1% acetic acid solution at room temperature. Complete dissolution was achieved after several hours of stirring at room temperature using a magnetic stirrer. The final clear solution was then poured into separate Petri dishes and left to dry at room temperature to form highly translucent thin films. BPE films were transferred to a desiccator for further drying prior to characterization. Figure 3 illustrates the photograph of the transparent film CMC–CH3COONH4 biopolymer electrolyte (BPE).
Figure 3. Photograph of the transparent film CMC–CH3COONH4 biopolymer electrolyte (BPE).
Polymers 06 02371 g003

2.4. Characterization

2.4.1. Degree of Substitution (DS) Determination

The titration method was used to determine the DS of the synthesized CMC. The first step was to change the substituent COONa to COOH. Three grams of Na–CMC were suspended in 80% of ethanol, and 20 mL hydrochloric acid (37% concentration) were added to the mixture. The mixture was stirred for 30 min, and after that, the solid was then filtered and rinsed with 70%–90% ethanol. CMC–H was then obtained. Next, about 0.5 g of CMC–H was immersed in 100 mL of distilled water in a conical flask and stirred. Twenty five milliliters of 0.3 M NaOH were later poured into the flask and heated for 15 min. Next, the mixture was titrated with 0.3 M hydrochloric acid, with phenolphthalein as an indicator.

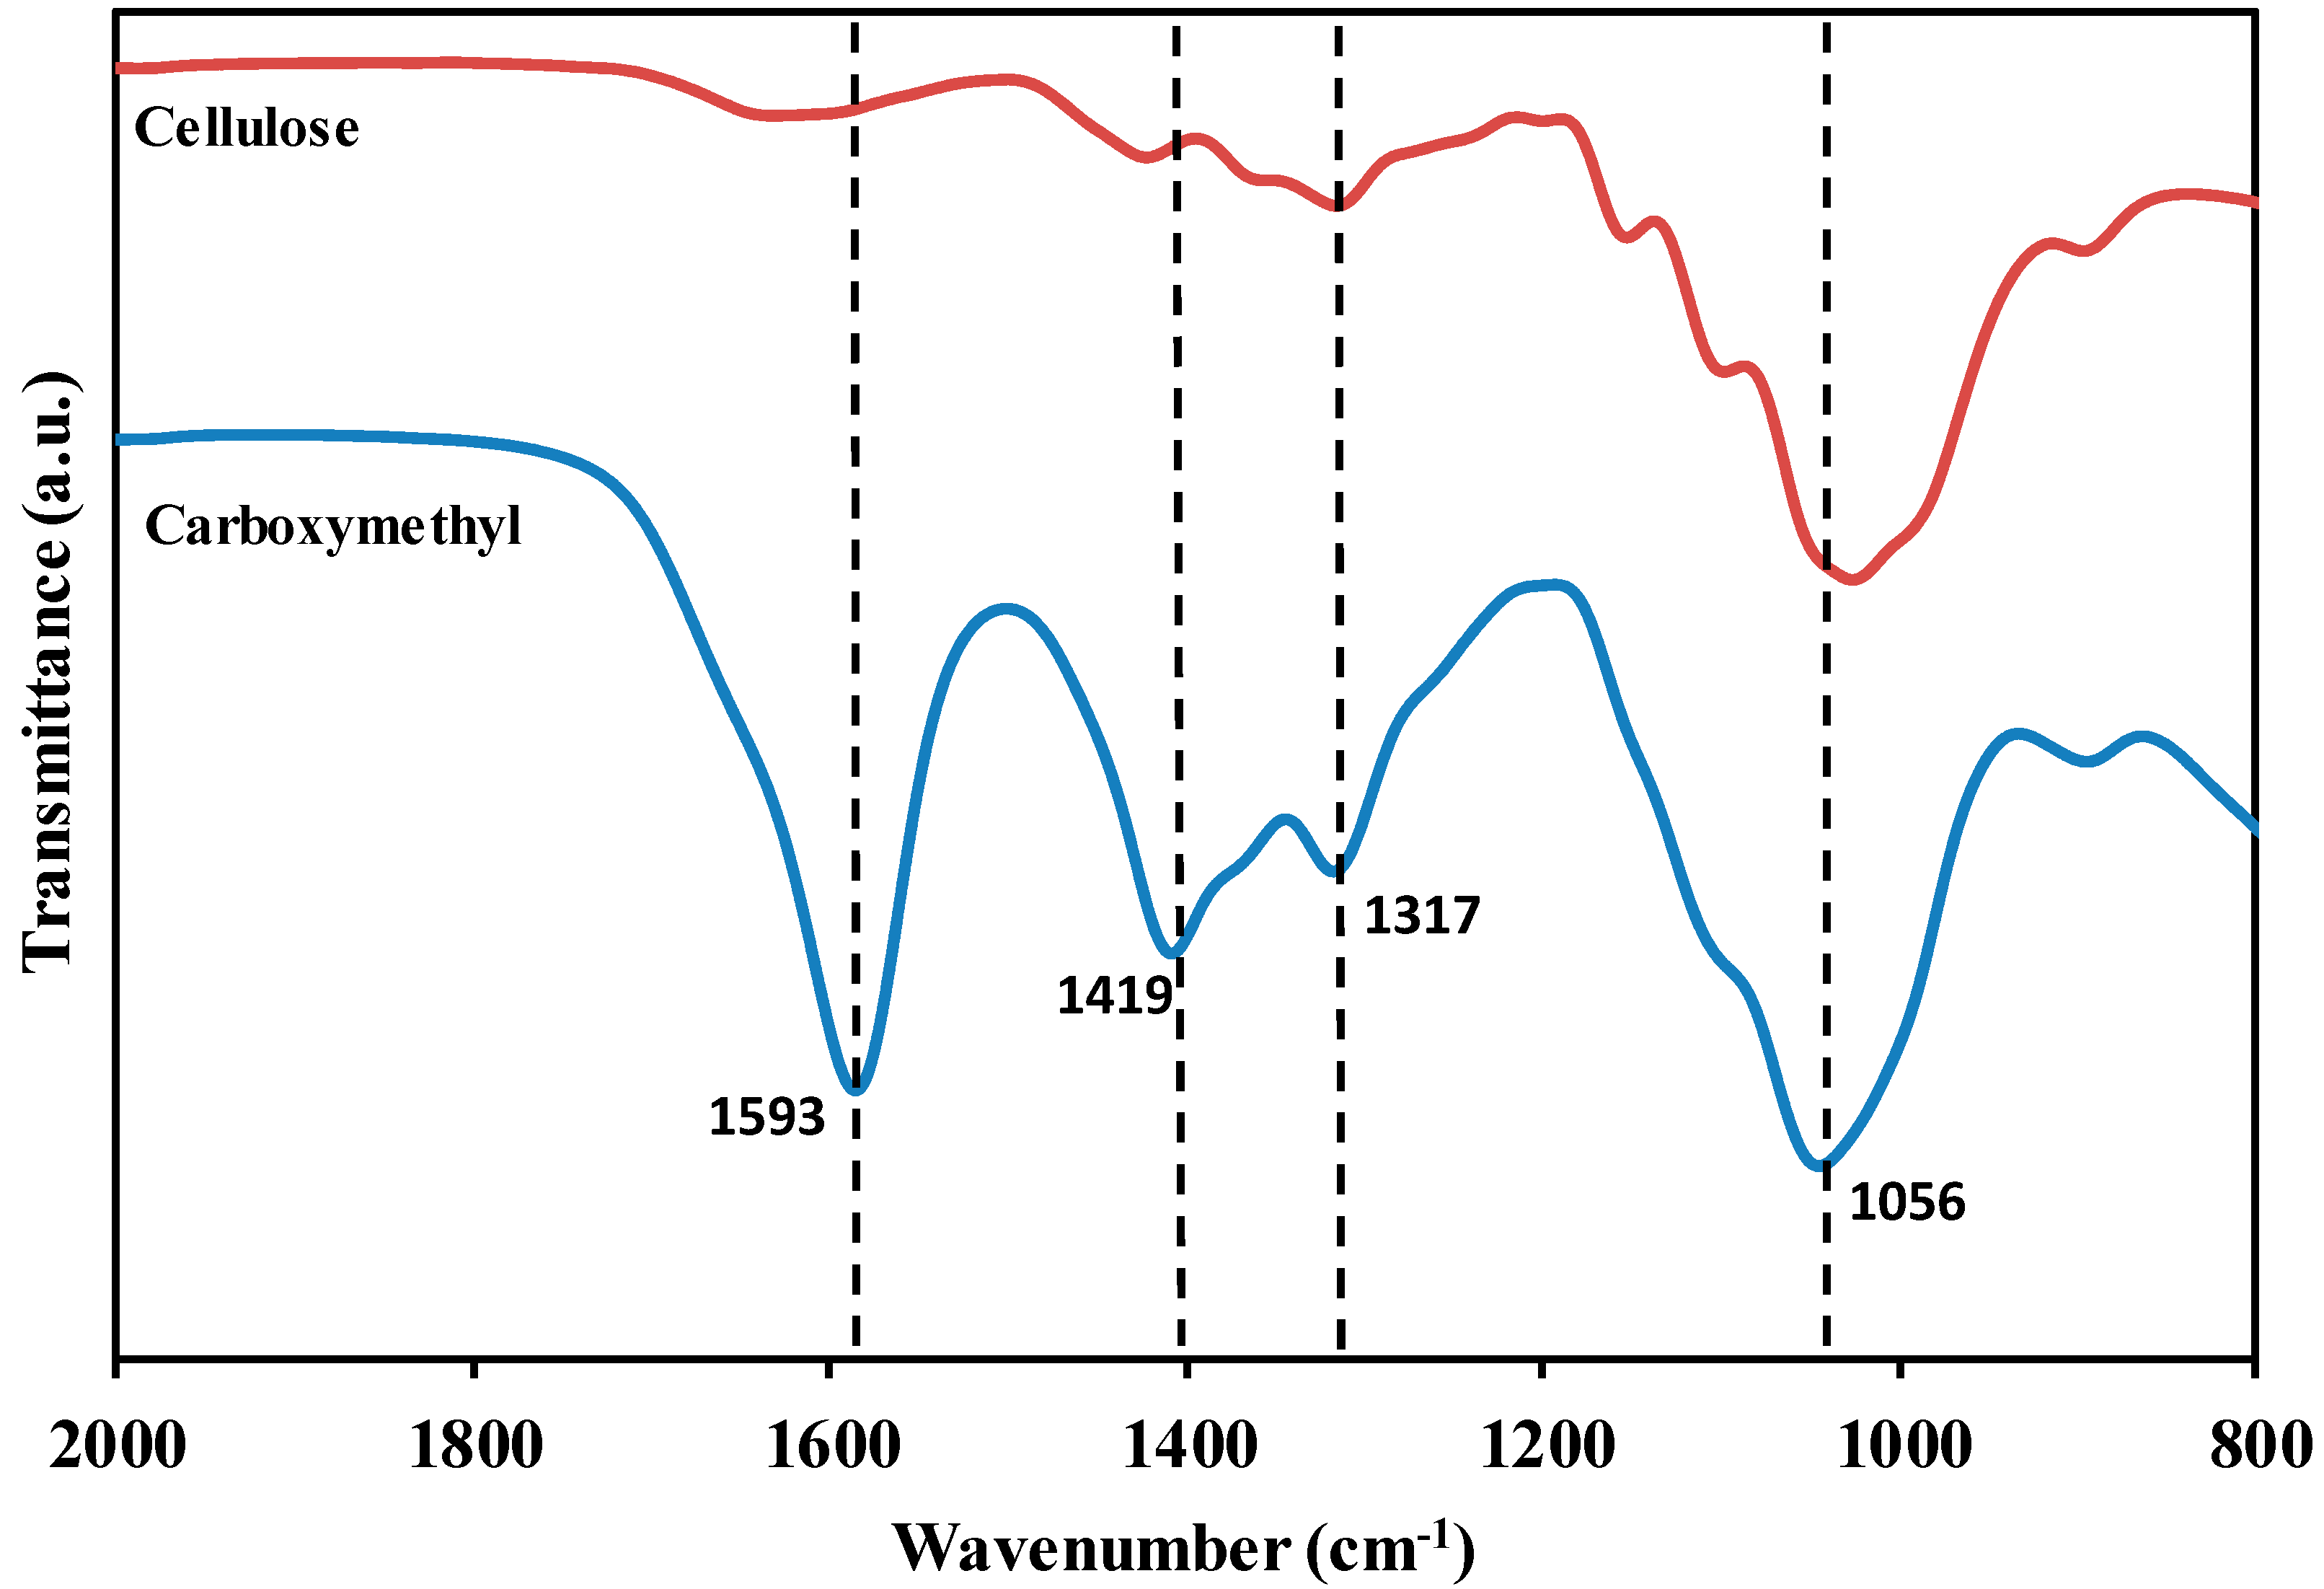
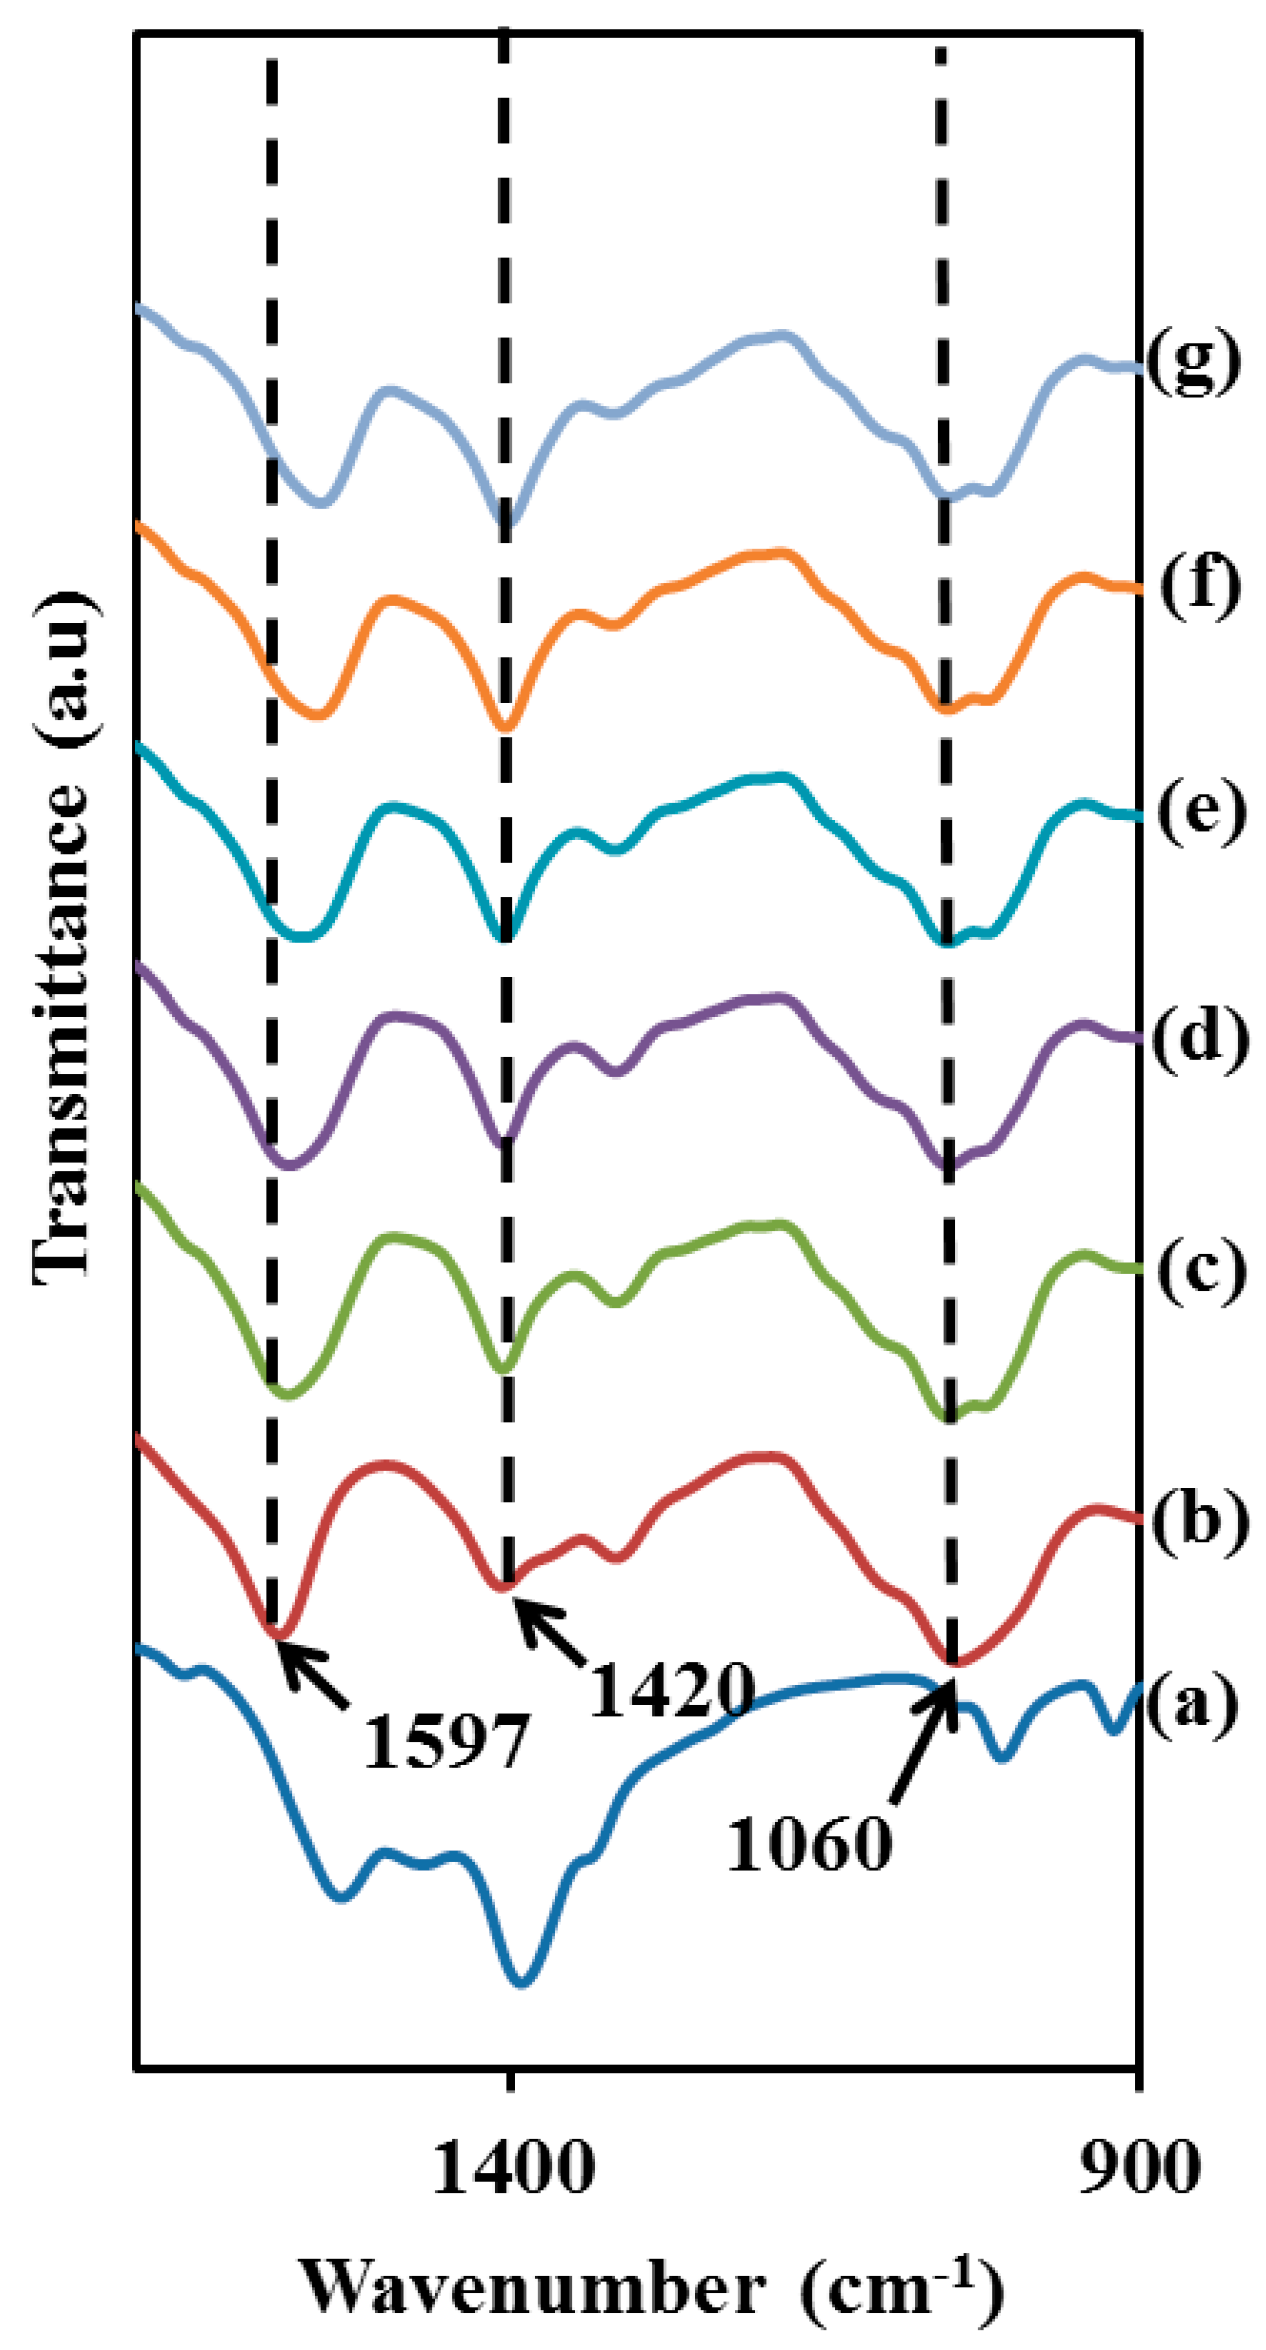
2.4.2. Fourier Transform Infrared Spectroscopy (FTIR)

The Fourier transform infrared spectroscopy (FTIR) measurement was performed by using a Perkin Elmer Frontier FTIR spectrometer (Waltham, MA, USA) equipped with attenuated total reflection. The sample was placed on top of a diamond surface with a pressure arm applying force onto the sample, and infrared light was passed through the BPE film. FTIR spectra were recorded in the spectra range from 4000 to 500 cm−1 at a resolution of 2 cm−1 with a scan rate of 4 at room temperature. The FTIR data were recorded in the transmittance mode.

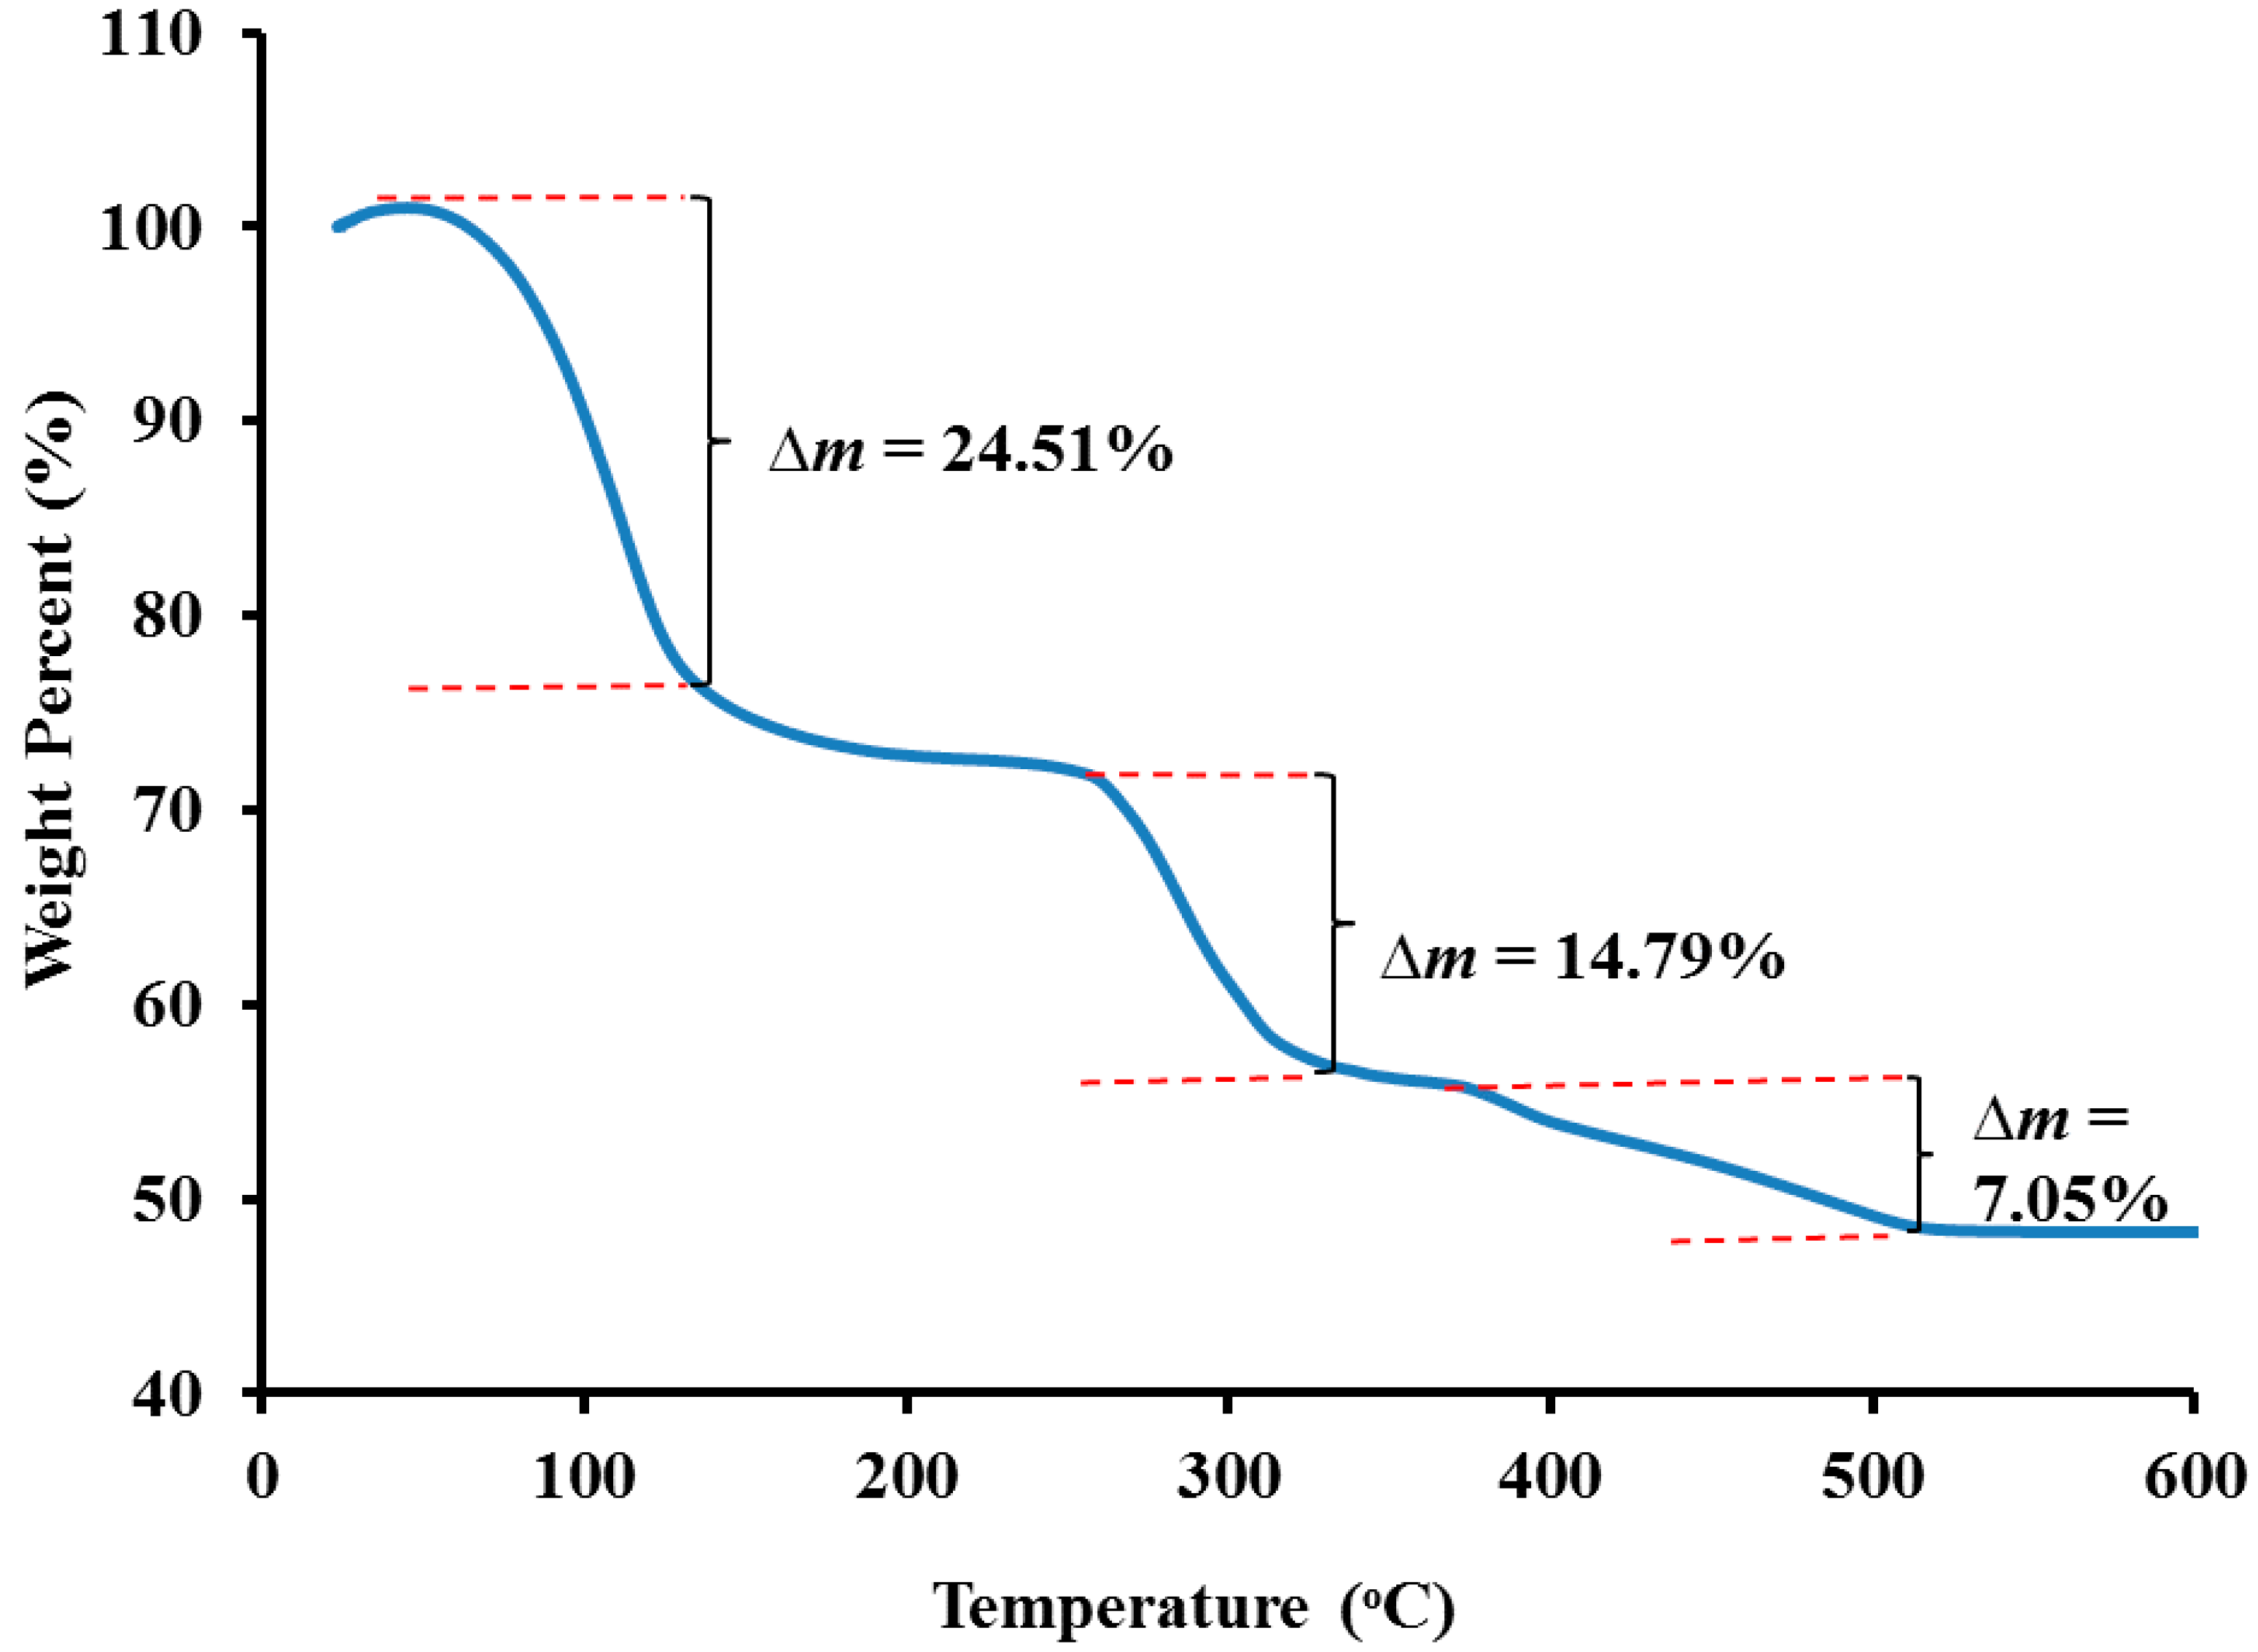
2.4.3. Thermogravimetric Analysis

The thermal study was carried out from ambient temperature up to 600 °C at a heating rate of 10 °C min−1 by using a Setaram EVO Labsys thermal analyzer (Caluire, France) in argon atmosphere. The first run was done up to 100 °C to remove absorbed water, and the second and third runs were performed up to 600 °C.

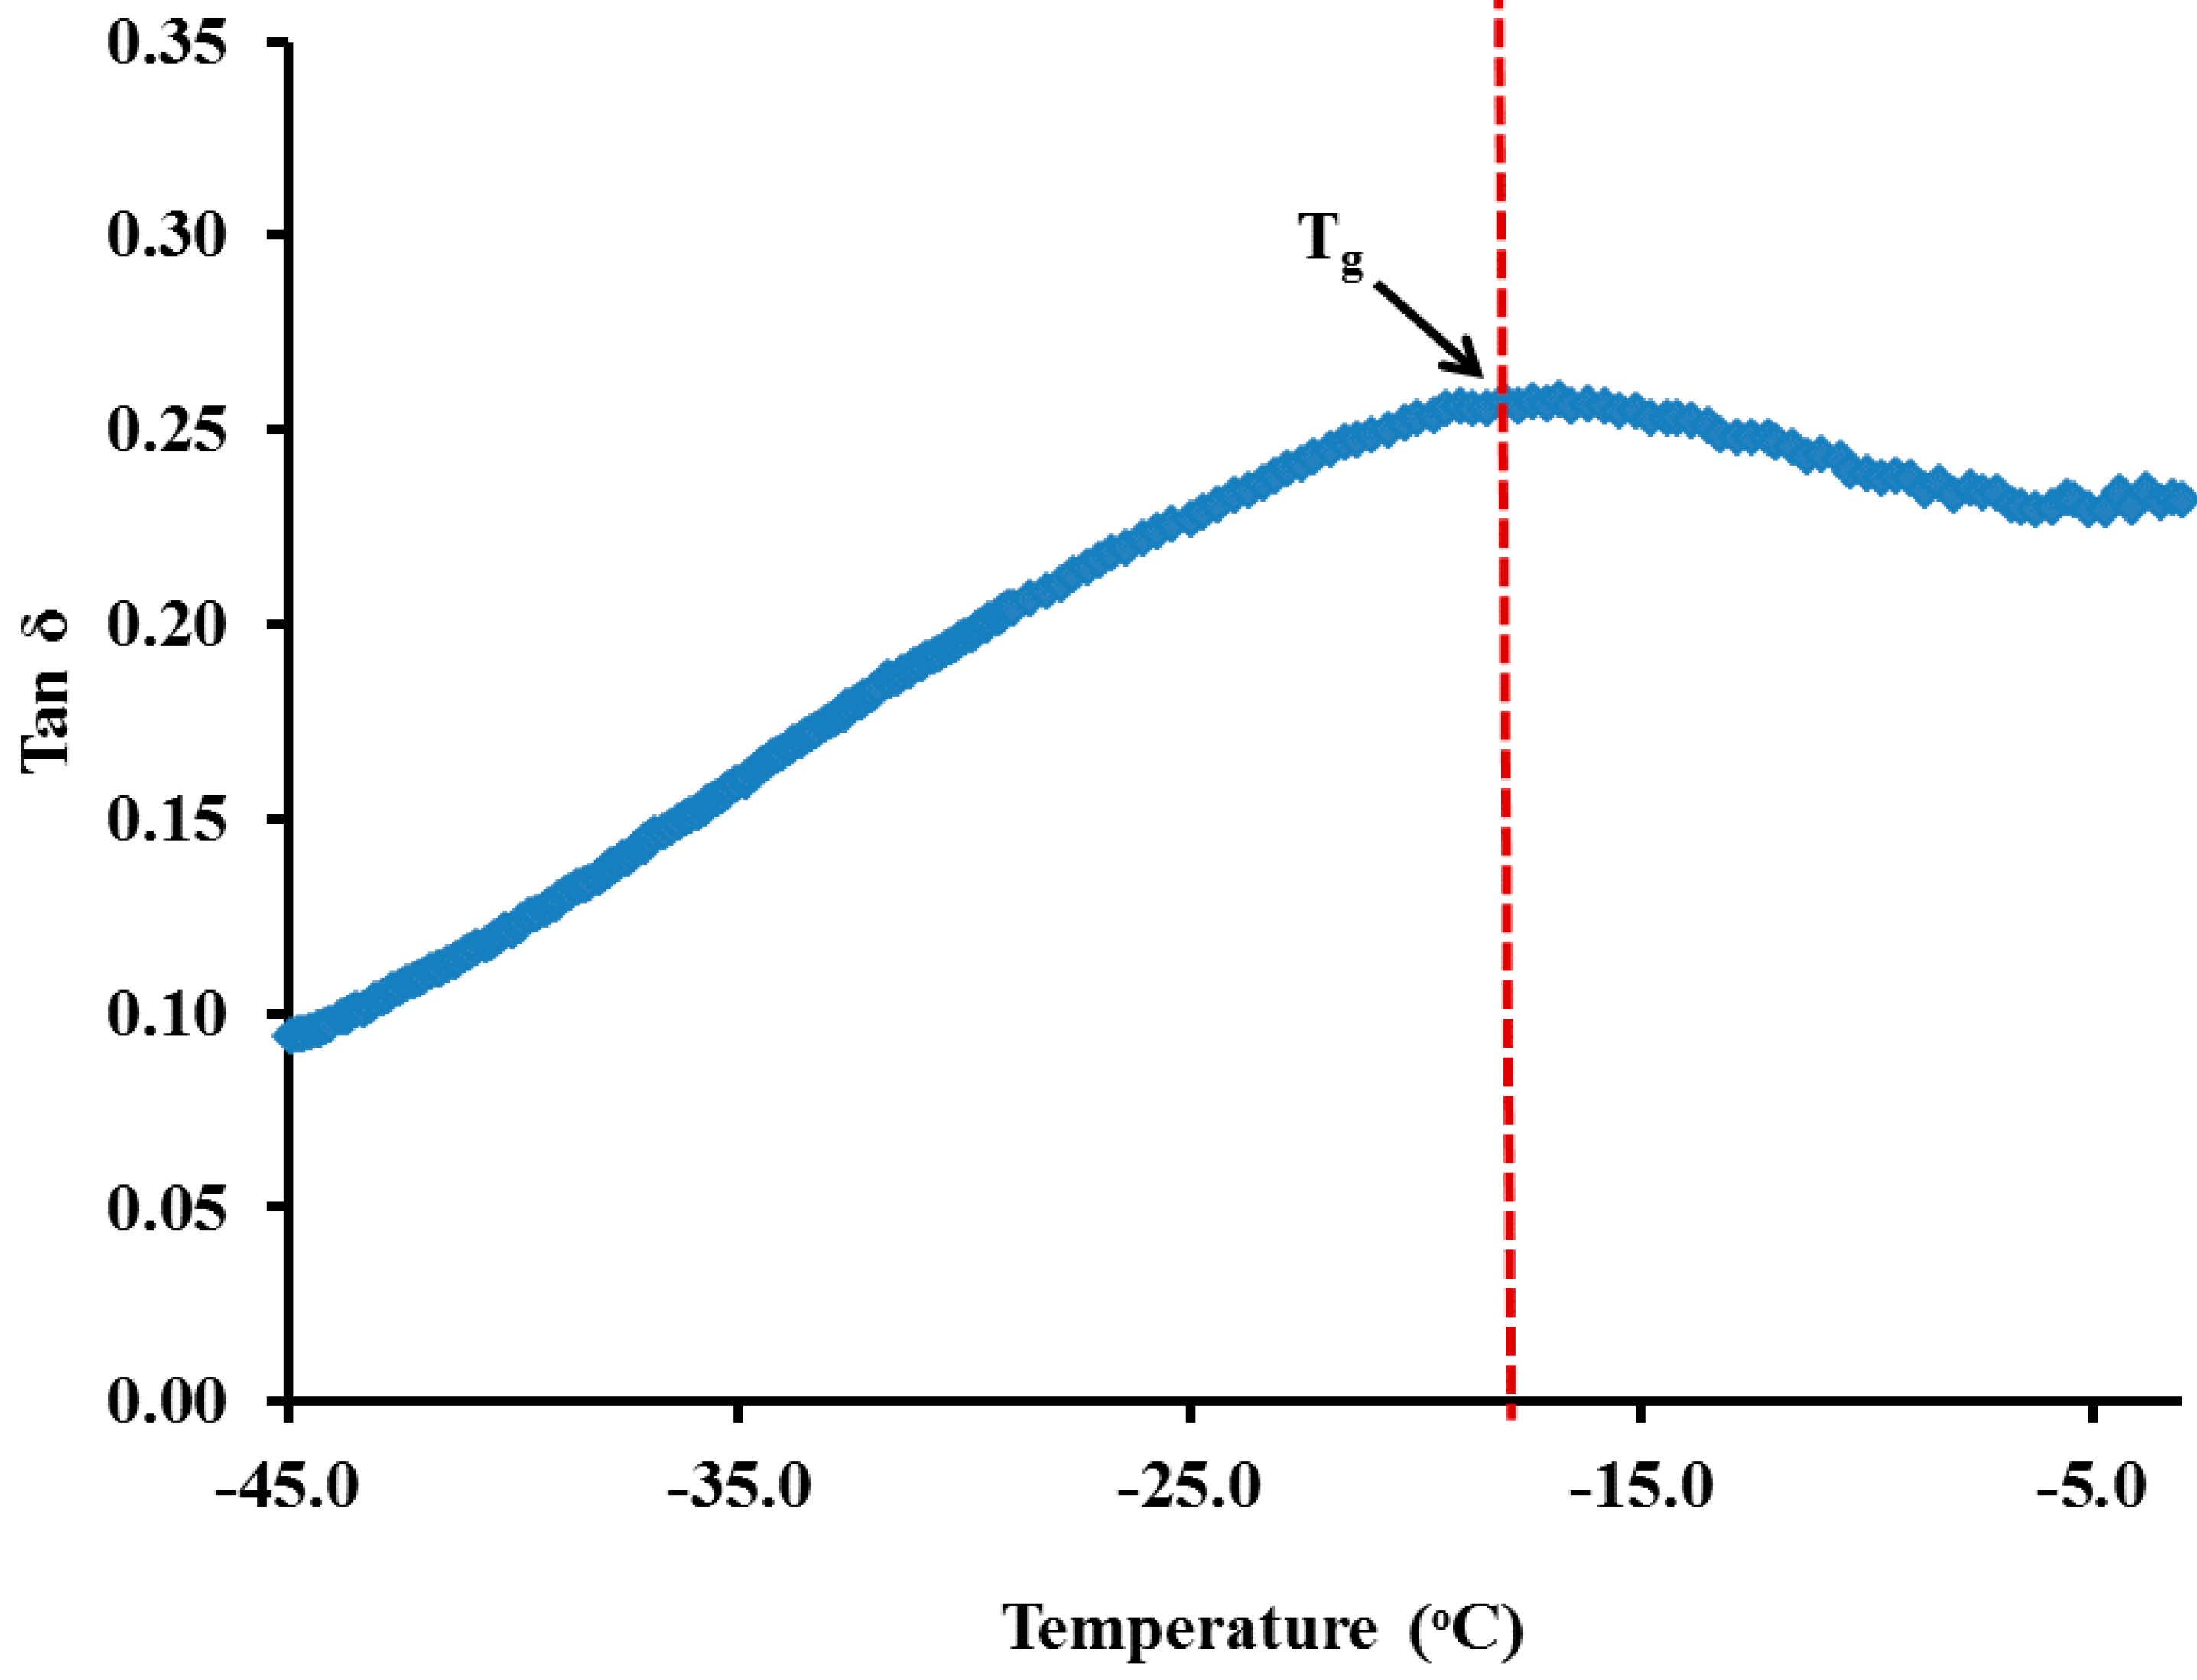
2.4.4. Dynamic Mechanical Analyzer (DMA)

The glass transition temperature of the CMC film was determined by using a Perkin Elmer DMA 800 instrument (Waltham, MA, USA). The analysis was done in tension mode. The sample used was of 2 cm in length and 1 cm in width. The thickness of the sample was 0.028 cm. The temperature range was from −45 °C to 50 °C at a heating rate of 1 °C min−1 at a frequency of 1 Hz. Liquid nitrogen was supplied to the instrument in order to start the analysis with a low temperature.

2.4.5. Impedance Spectroscopic Study

The impedance study was performed by using a Solartron 1260 impedance/gain phase analyzer (Kingston on Thames, UK) for a frequency ranging from 10 to 4 MHz. Impedance spectroscopy measurement was performed to determine the ionic conductivity of BPE films over a temperature range from 30 to 80 °C. The films were sandwiched between two stainless steel electrodes of a diameter of 2.0 cm under spring pressure.

2.4.6. Scanning Electron Microscope (SEM)

Scanning electron microscope (SEM) micrographs of samples were obtained using a Zeiss EVO MA10 scanning electron microscope (Oberkochen, Germany) at 500× magnification with a 10-kV electron beam. The BPE sample was coated with gold using a sputter coating machine for 90 s before the analysis.

2.4.7. Linear Sweep Voltammetry

The electrochemical stability window of the BPEs was measured using the technique of linear sweep voltammetry (LSV), which was performed on a Wonatech ZIVE MP2 multichannel electrochemical workstation (Seoul, Korea). The LSV was carried out using stainless steel electrodes at a scanning rate of 1 mV·s−1 from 0 to 4 V.

3. Results and Discussion

3.1. Carboxymethyl Cellulose

The degree of substitution (DS) was determined to identify the quality and properties of CMC, as well as the purity, molecular weight and crystallinity [10]. Methods, like the acid-wash, the conductometric and the coulometric methods [11], can be applied in order to determine the degree of substitution of CMC. CMC was obtained at a DS range of 0.5 to 2.9 [12]. In this work, the DS was determined by using acid-wash method and was calculated using the Equation:
Degree of substitution (D S abs ) =  162 × % CM [ 5900 ( 58 × % CM ) ]
where carboxymethyl content, (% CM) is given by Equations (1) and (2):
(% CM) =  [ ( V 0 V n ) M × 0.059 × 100 ] m
In Equation (2), V0 is the amount of hydrochloric acid used to titrate the blank solution, Vn is the amount of hydrochloric acid used to titrate samples, M is the molar concentration of hydrochloric acid used and m is the sample amount. The value of 162 g·mol−1 is the molar mass of the anhydroglucopyranose unit (AGU), and 58 g·mol−1 is the molar mass of –CH2COOH [12]. The DS value obtained for CMC from kenaf fiber was 1.49. According to Eyler et al. [11], the determination of the DS affects the properties of CMC as a polymer host. It not only influences the solubility of CMC molecules, but also affects the solution characteristics. The DS value obtained in this work is higher compared to those of the commercial CMCs available on the market, which are around 0.7 to 1.2. Meanwhile, the commercially available CMCs are synthetic polymers that are unfavorable for sustaining environmental friendliness. The use of CMC from kenaf fiber may be able to reduce the use synthetic polymers.
Figure 4 shows the IR-spectrum of white cellulose and modified cellulose, CMC from 800 to 2000 cm−1. The absorption bands at 1593 cm−1, 1408 cm−1 and 1317 cm−1 are assigned to asymmetrical COO stretching, symmetrical stretching and C–H bending, respectively. The appearance of these bands confirms the formation of CMC [9,13].
Thermal gravity analysis (TGA) was carried out on the synthesized CMC, and the result is presented in Figure 5. Two distinct weight losses are observed. The first weight loss is about 24.51% in the temperature range of 30 and 135 °C. The initial weight loss is due to the presence of moisture in the sample. A similar observation has been reported by Lam et al. [14]. This is because biopolymer tends to absorb moisture from its surroundings [15]. The second weight loss is 14.79% in the temperature range of 250 to 323 °C due to the loss of COO from the polysaccharide [9]. The final loss of 7.05% is observed in the temperature range of 373 to 511 °C, representing the degradation of the remaining material into carbon residues. This result reveals that the CMC can be used as host PEs at ambient temperature and moderate temperatures (250 °C), which are suitable for applications in electrochemical devices, such as in solar cells or batteries.
Figure 4. IR spectra of cellulose and CMC in the region between 2000 and 800 cm−1.
Polymers 06 02371 g004
Figure 5. TGA curve of the pure CMC from kenaf bast fibers.
Polymers 06 02371 g005
The thermal properties of CMC film were also analyzed using DMA. Figure 6 depicts the damping curves (tan δ) for CMC film. The damping curve presented in Figure 6 shows the main relaxation process in the amorphous region of CMC. As the temperature increases, damping increases to a maximum before decreasing with a further increase in the temperature. The temperature corresponding to the peak of the curve is attributed to the Tg. From the curve, the glass transition of CMC film is −18.0 °C.
Figure 6. DMA spectrum for the pure CMC biopolymer film.
Polymers 06 02371 g006

3.2. Carboxymethyl Cellulose-Based Polymer Electrolyte

Depicted in Figure 7 are the FTIR spectra of CH3COONH4, pure CMC and CMC doped with CH3COONH4 (10–40 wt%). The characteristic absorption band at 3315 cm−1 can be attributed to OH stretching. The small hump at 2946 cm−1 was ascribed to C–H stretching [16]. Upon the addition of 20 wt% CH3COONH4, it can be observed that the carboxyl group (C=O) at 1597 cm−1 has shifted to a lower wavenumber (1586 cm−1), which suggests the interaction of the (C=O) moiety in CMC with the H+ of the (NH4+) substructure in CH3COONH4. This phenomenon can be related to the lone pair of electrons that attract the salt molecule of CH3COONH4 to the system [2]. The concentration of H+ increases when the composition of CH3COONH4 increases; therefore, more electrons are withdrawn toward C=O to form hydrogen bonding, which leads to the shifted of band from 1585 to 1559 cm−1. However, as the CH3COONH4 concentration increases more than 20 wt%, there is a resulting decrease in conductivity. This is because the addition of higher concentrations of CH3COONH4 causes the ions to recombine to form neutral ion pairs [17]. The vibration value found at 1420 cm−1 corresponds to the presence of N-H deformation in CH3COONH4; however, this band overlapped the O–H band, as reported by Kamarudin et al. [18]. Lastly, the intense band around 1060 cm−1 was reported to be related to the C–O–C stretch, causing a shift to a lower wavenumber [19], signifying the characteristics of the polysaccharide skeleton.
Figure 7. IR spectra of: (a) CH3COONH4; (b) pure CMC; (c) CMC–CH3COONH4 10 wt%; (d) CMC–CH3COONH4 20 wt%; (e) CMC–CH3COONH4 30 wt%; and (f) CMC–CH3COONH4 40 wt% in the region between 4000 and 550 cm−1.
Polymers 06 02371 g007

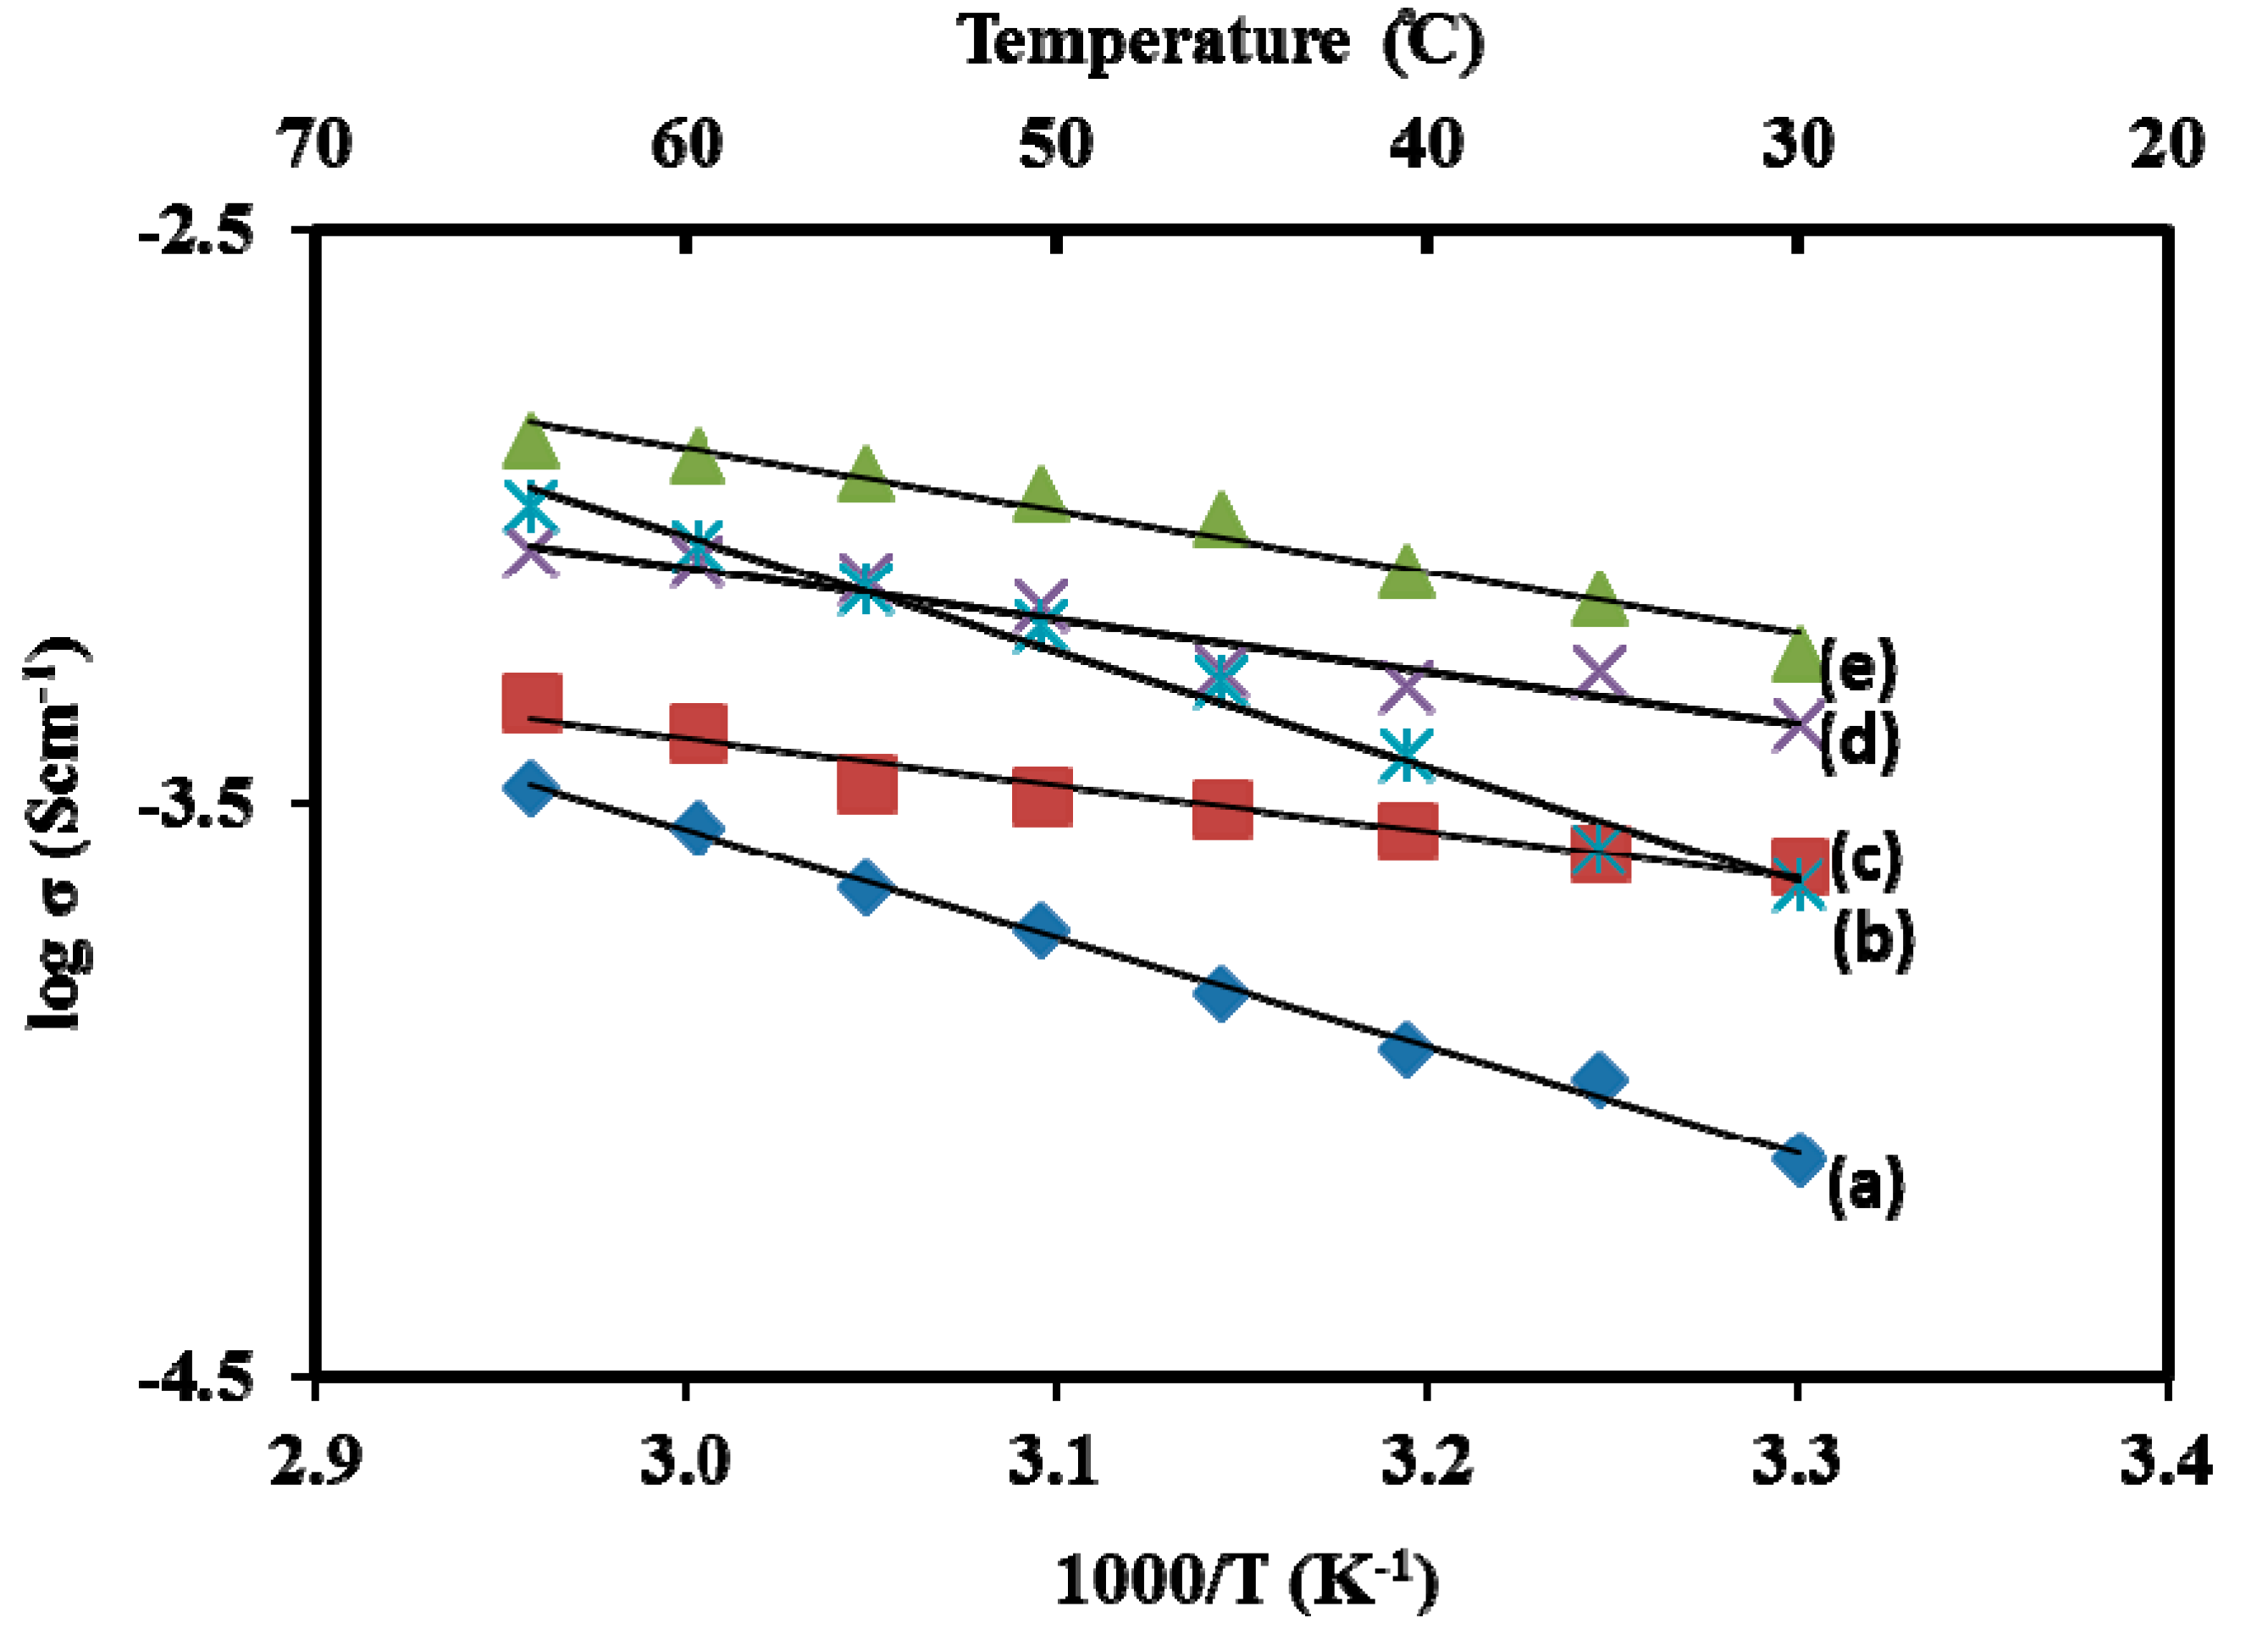
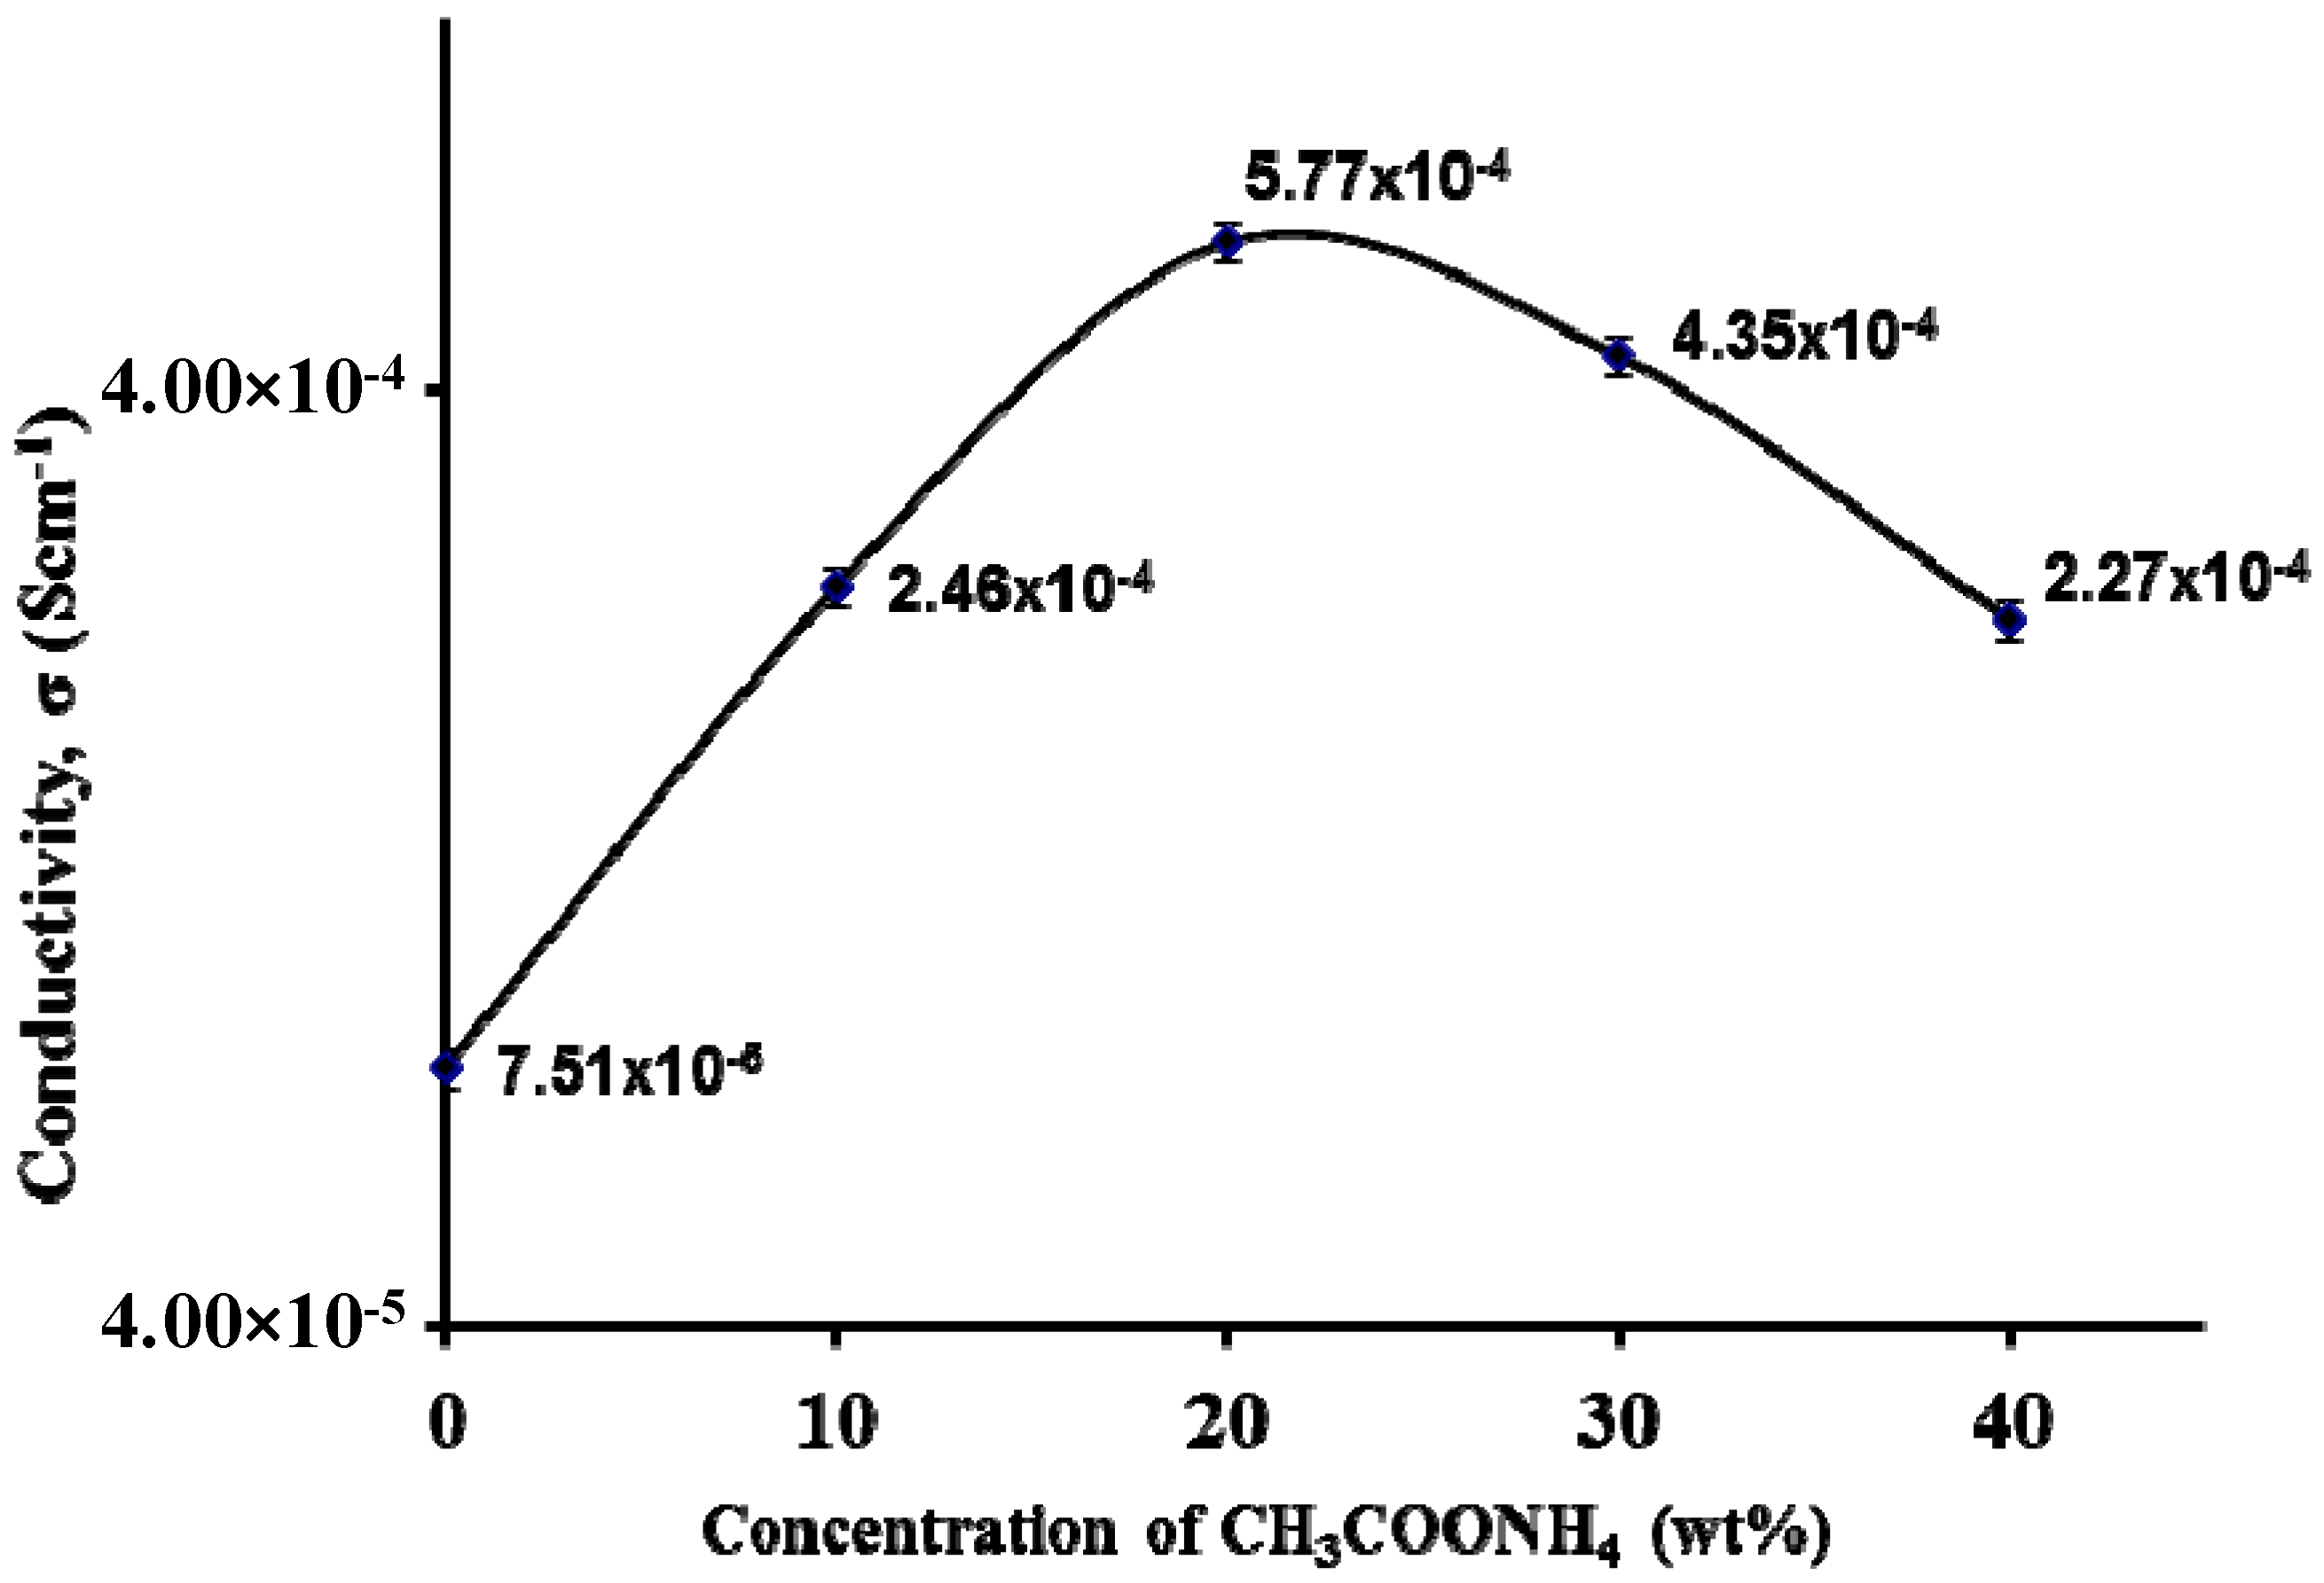
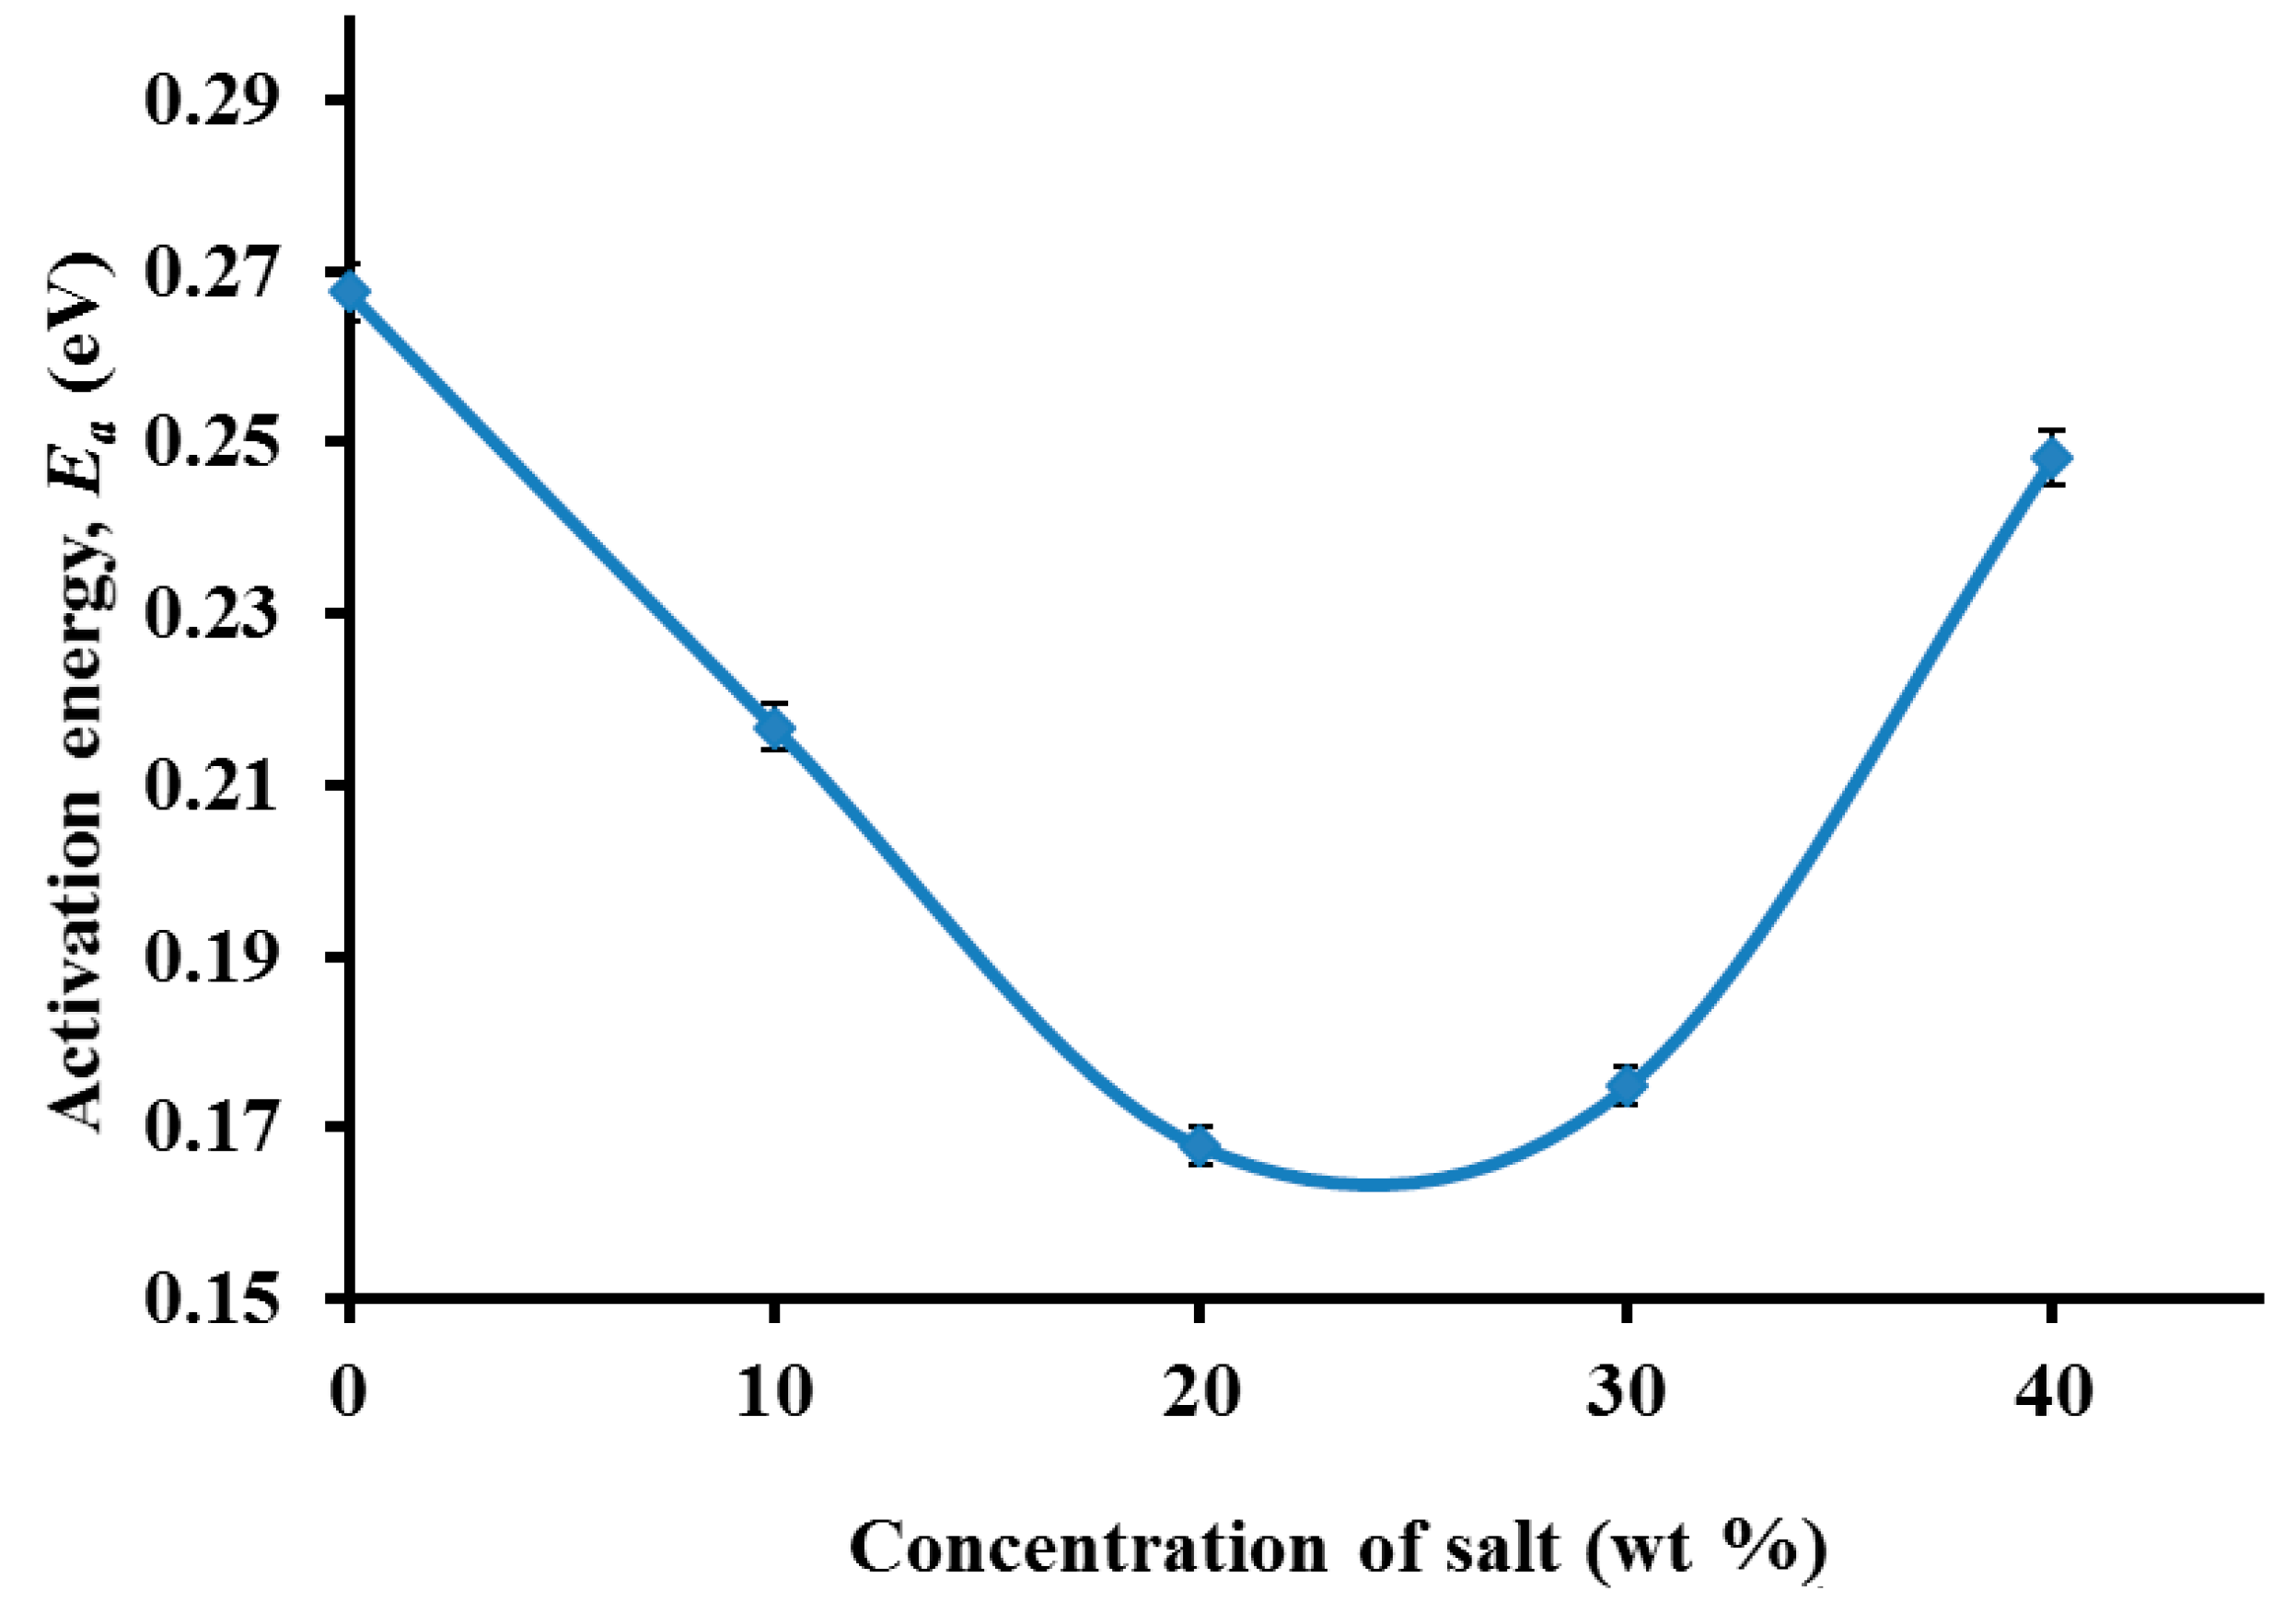
3.3. Impedance Study

Figure 8 reveals the graph for conductivity against the concentration of CH3COONH4 at ambient temperature (303 K). The conductivity was calculated using:
σ = t R b A
where A is the area of electrode–electrolyte contact in cm2, t is the thickness of the sample in cm and Rb is the bulk resistance, which can be obtained by plotting the negative imaginary impedance, −Zi, versus the real part, Zr, of the impedance.
As expected, the addition of the CH3COONH4 ionic dopant shows a significant effect on the conductivity of the CMC–CH3COONH4 biopolymer system. From Figure 8, it is noted that the conductivity starts to increase from 10 wt% until 20 wt% of CH3COONH4. The ionic conductivity increase for this natural BPE system with increasing salt concentration can be associated with an increase in the number of mobile ions [20]. In the CMC–CH3COONH4 biopolymer system, the CH3COONH4 interacted with the carboxyl anion groups of the CMC host. Therefore, ion hopping and exchange can take place at more sites; see Figure 8. As the salt composition increases, more protons (H+) are supplied, due to the dissociation of the ionic dopant. Meanwhile, the conductivity of CMC obtained was found to be higher compared to those prepared by using commercial CMC. According to Chai et al. [21], the highest conductivity achieved was 2.11 × 10⁻⁵ S cm−1. Upon the addition of more than 20 wt% CH3COONH4, the conductivity of the biopolymer decreases. The decrement of conductivity can be explained due to the increase of the dipole interaction between the proton (H+) and the CMC–CH3COONH4 medium. The conductivity decrement may also be due to the aggregation of ions, which reduces the number of charge carriers and limits the mobility of ions [21,22]. For further understanding of the ionic conductivity mechanism, the ionic conductivity of the biopolymer systems was measured at elevated temperatures ranging from 303 to 338 K. The schematic diagram of CMC interaction with CH3COONH4 via (N–H4+) is shown in Figure 9.
Figure 8. Ambient temperature ionic conductivity of CMC–CH3COONH4.
Polymers 06 02371 g008
Figure 9. Schematic diagram of CMC interaction with CH3COONH4 via (N–H4+).
Polymers 06 02371 g009
Figure 10 shows the plot of log conductivity, σ against 1000/T, for the samples with 0 wt% to 40 wt% of CH3COONH4. The regression values of the plots are approximated to one, indicating that the temperature dependence of the ionic conductivity for all samples is linear and obeys Arrhenius’ rule [23]. This relation implies that the conductivity is thermally assisted.
Figure 10. Temperature dependence of ionic conductivity of: (a) pure CMC; (b) 40 wt% of CH3COONH4; (c) 10 wt% of CH3COONH4; (d) 30 wt% of CH3COONH4; and (e) 20 wt% of CH3COONH4.
Polymers 06 02371 g010
The activation energy, Ea, was also calculated from the slope of the plots in Figure 11 by using:
E a = [ ln ( σ σ 0 ) k T ]
Figure 11. Activation energy vs. concentration of salt.
Polymers 06 02371 g011
It can be observed that the trend of Ea, as shown in Figure 10, is the inverse of the conductivity trend shown in Figure 8. According to Selvasekarapandian et al. [2], when the CH3COONH4 concentration increases, the barrier, known as the band gap for proton transport to pass through, is reduced; thus, Ea decreases. Samples with lower Ea provide a smaller band gap, which allows the conducting ions to move more easily as a free ion-like state, hence increase the ionic conductivity of the samples [1]. Besides that, this phenomenon is also related to the conduction process, in which lower Ea is required for the migration of ions in a highly conducting sample, 20 wt% CH3COONH4, as shown in Figure 8. Since the migration of ions is tremendously affected by the polymer segmental motion, an electrolyte with a lower value of Ea facilitates ionic movement, which then increases conductivity [24].

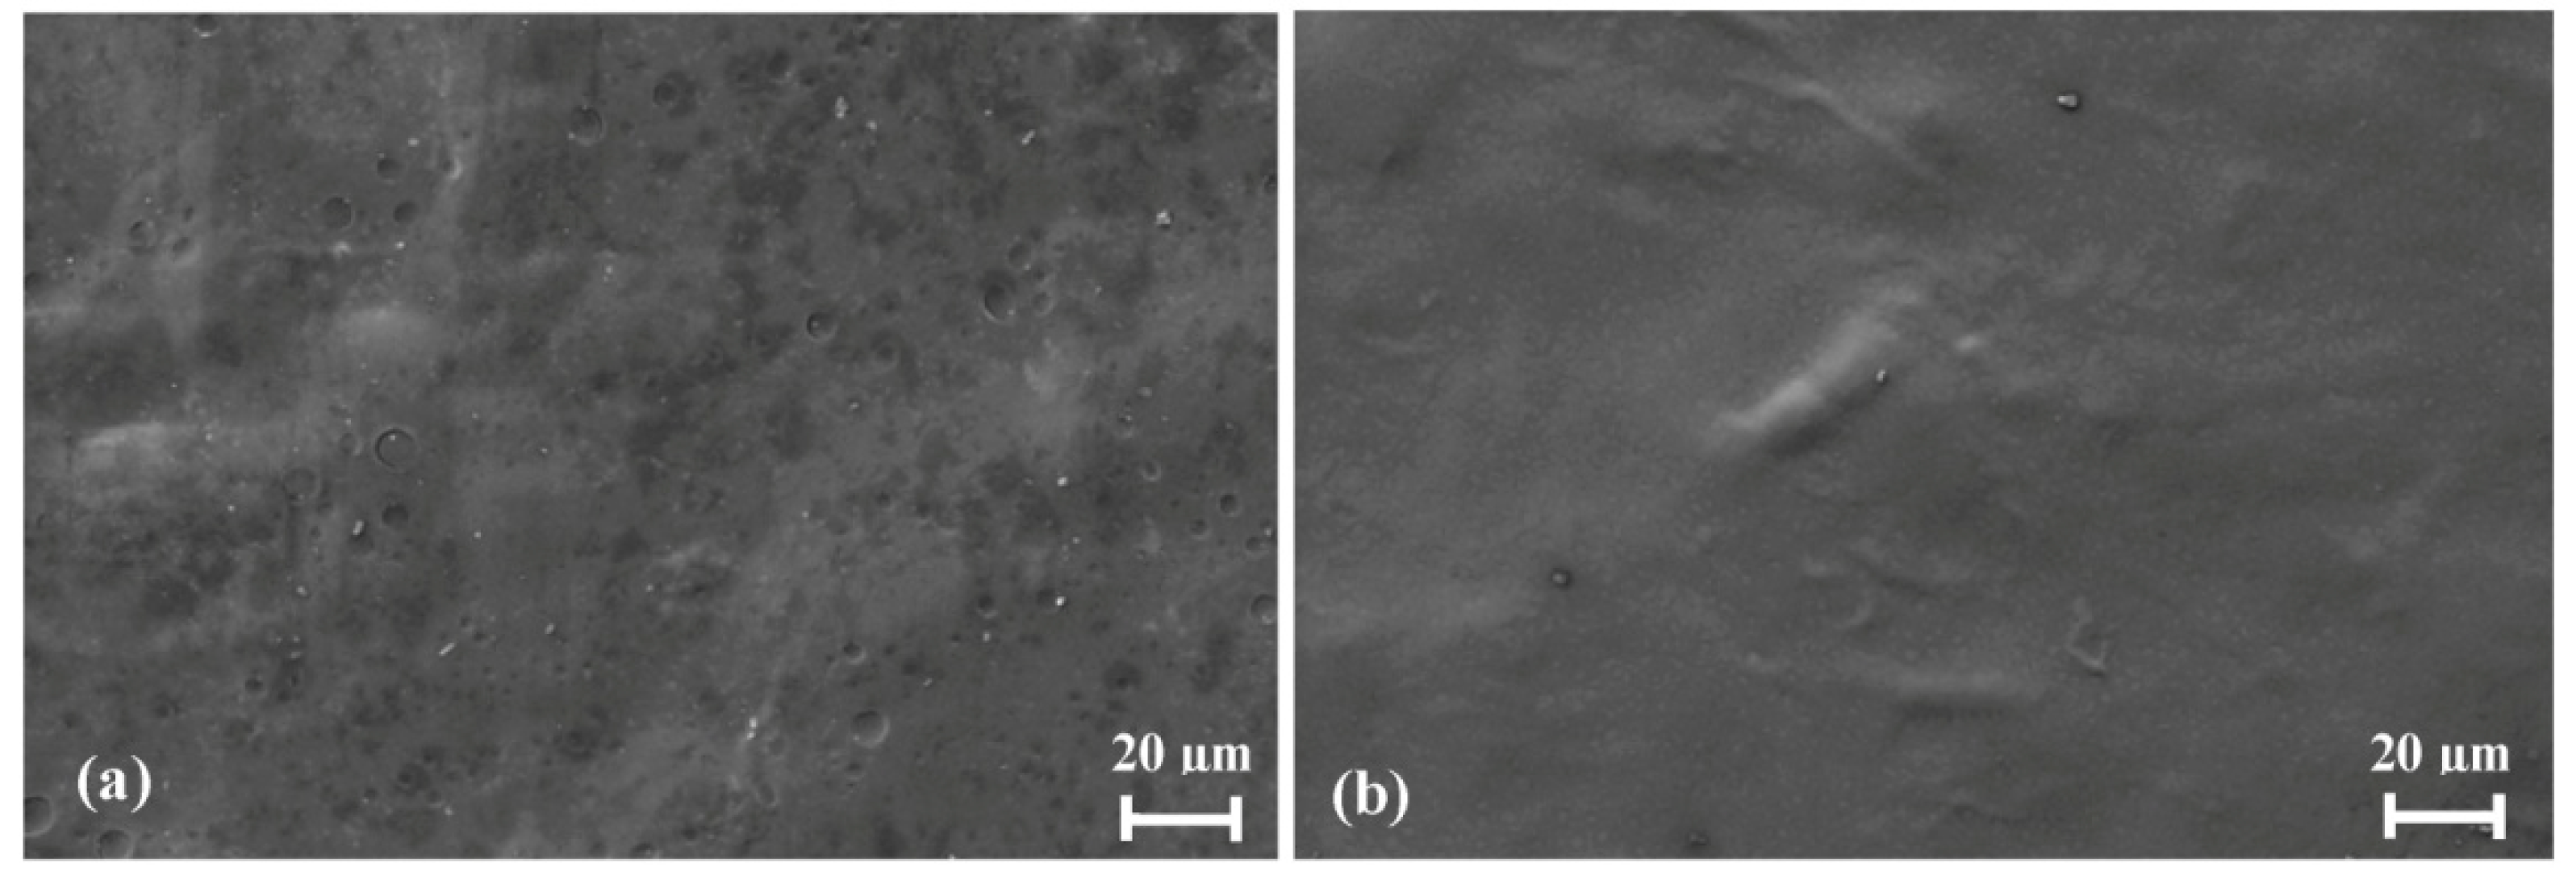
3.4. Morphological Studies

SEM micrographs of pure CMC and CMC–CH3COONH4 films at 300 K are depicted in Figure 12. Pure CMC film shows a rough surface, indicating the presence of semi-crystalline region in the CMC film. When CH3COONH4 is complexed with CMC, the film becomes more amorphous; see Figure 12b. This gives an indication of the increase of amorphicity region in the film. This may be another reason for the increase of conductivity, which is noticed in EIS. The amorphous region helps the migration of ions in the BPEs, hence increasing the conductivity by one magnitude order. The decrease of surface roughness upon the addition of CH3COONH4 could also help to enhance the contact at the electrolyte–electrode interface [25].
Figure 12. SEM micrograph of (a) pure CMC and (b) CMC with 20 wt% CH3COONH4.
Polymers 06 02371 g012

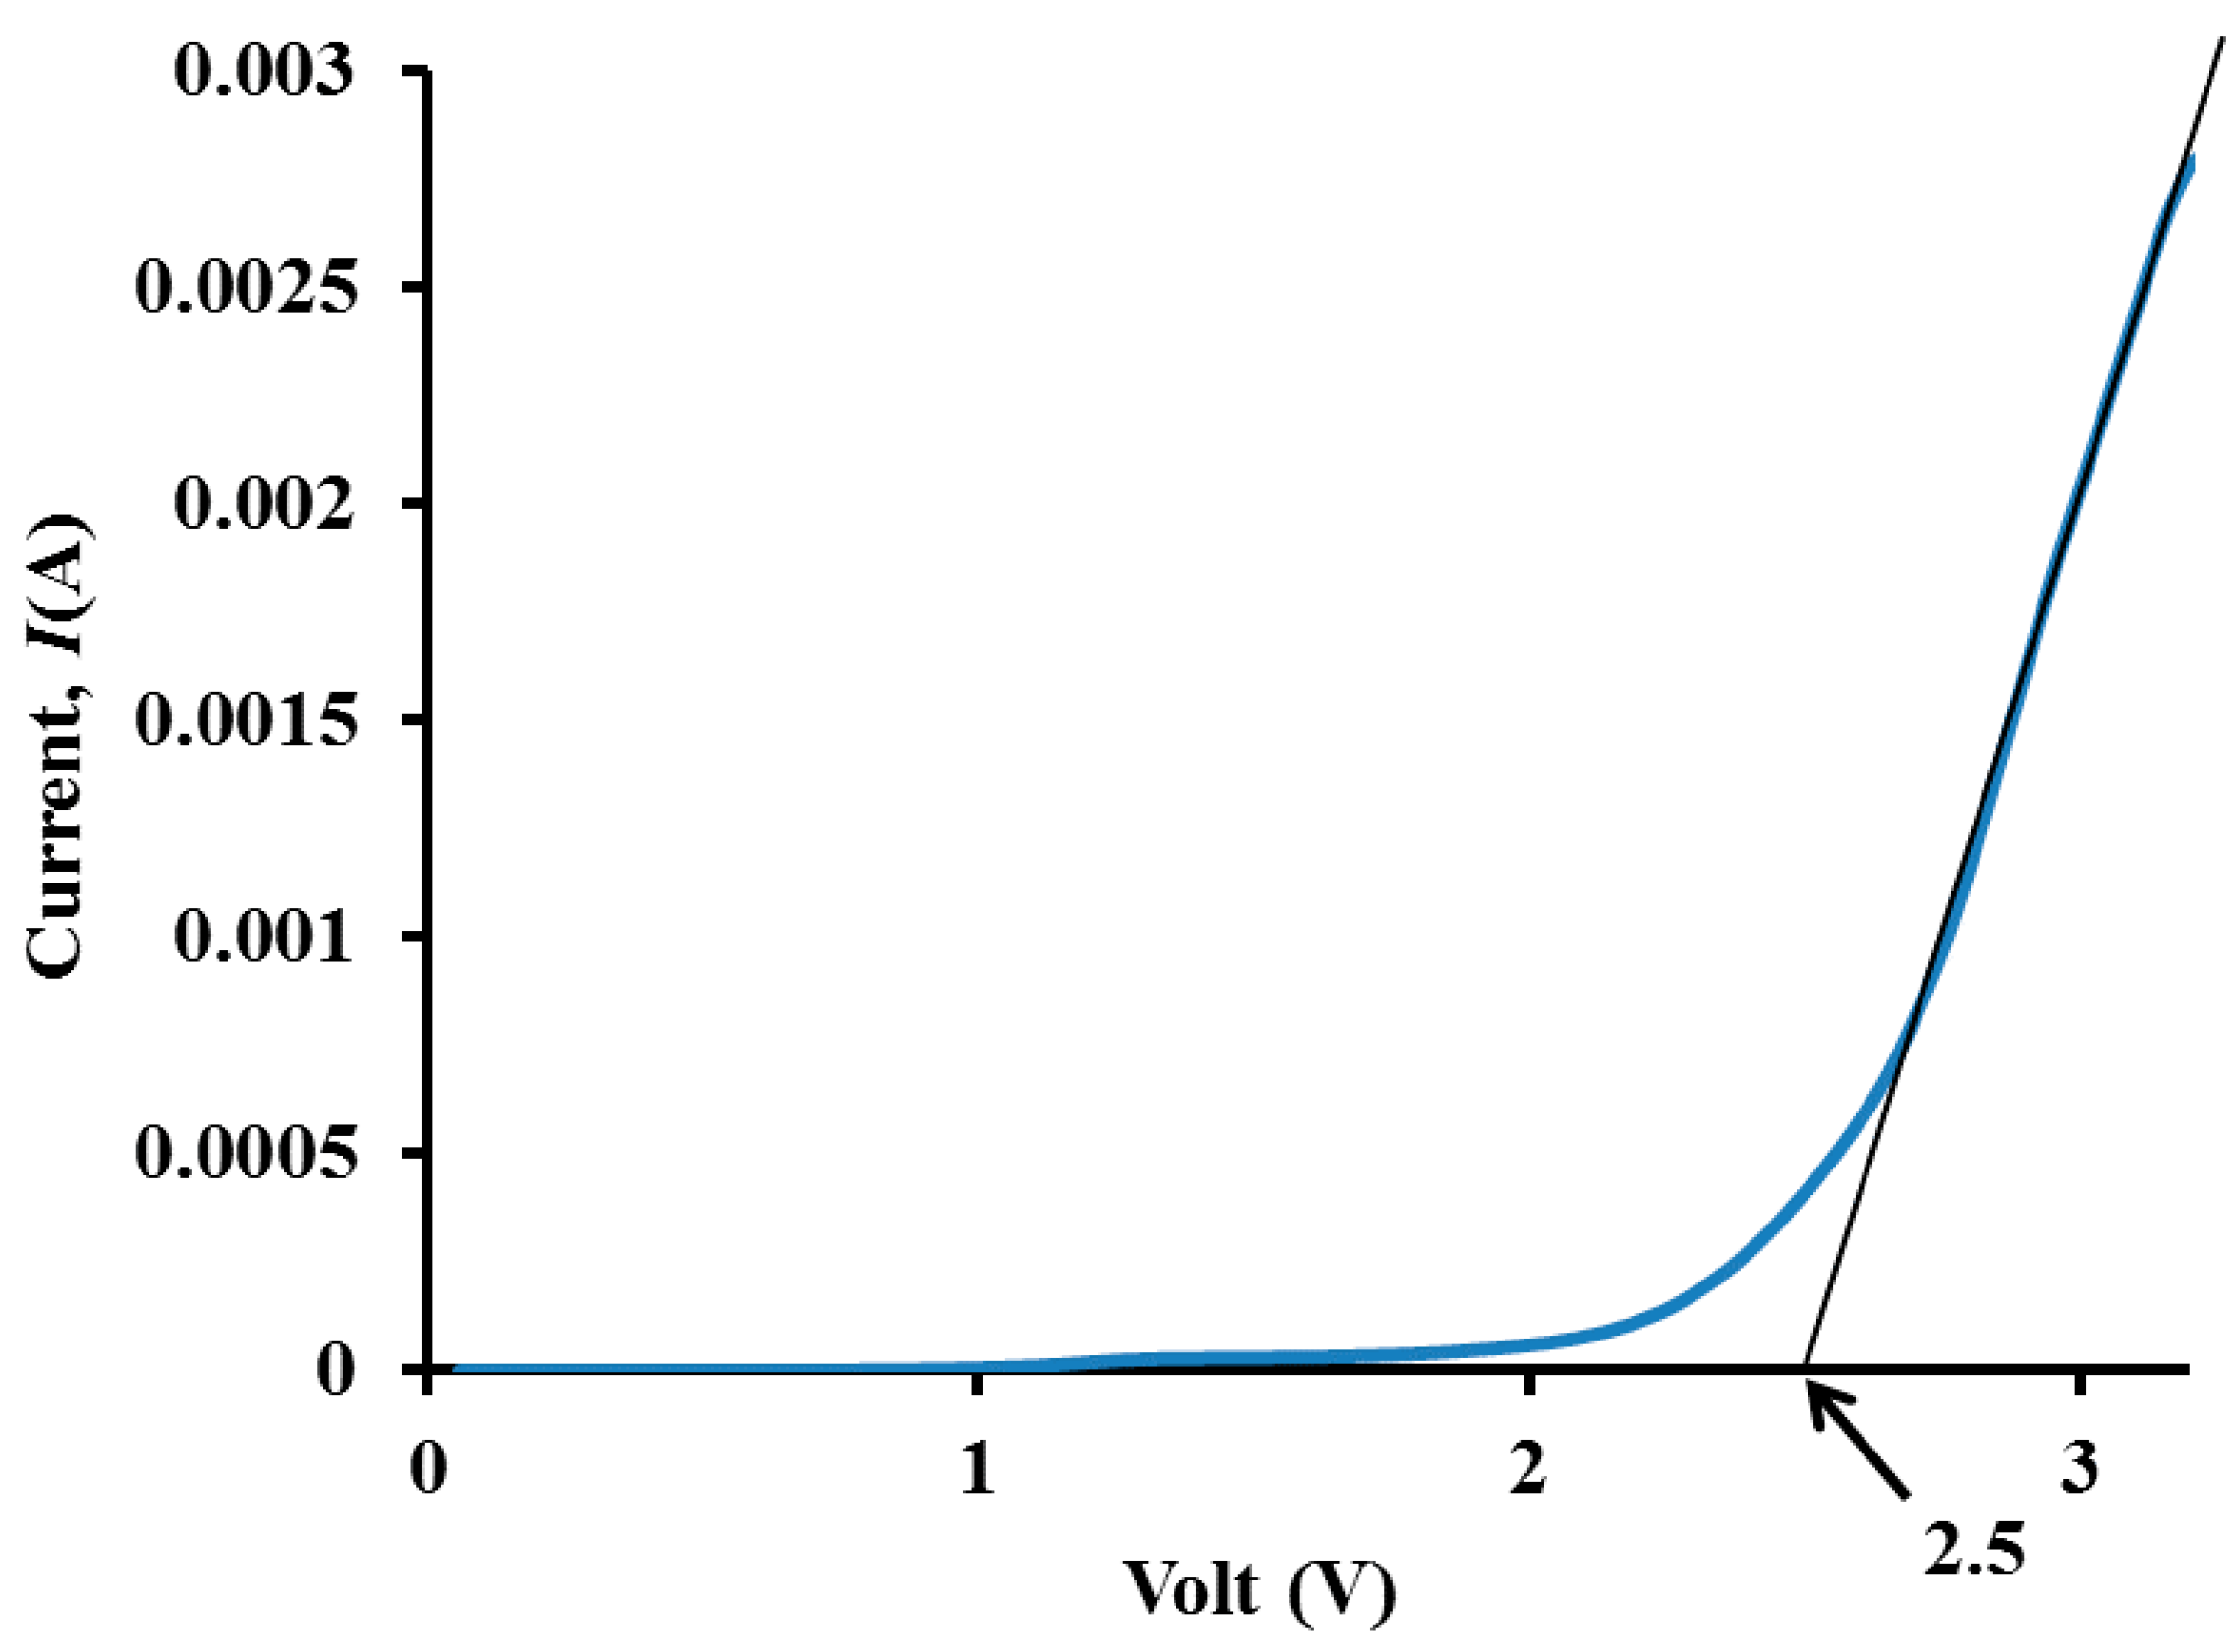
3.5. Electrochemical Stability Determination

As shown in Figure 8, the CMC doped with 20 wt% of CH3COONH4 shows the highest ionic conductivity, of the order of 10−4·S·cm−1. This system was then subjected to an electrochemical stability window investigation by using linear sweep voltammetry (LSV), and the voltammogram is shown in Figure 13.
It can be observed that the onset current of biopolymer occurs at 2.5 V at ambient temperature. The onset current is assumed to be the BPE’s breakdown voltage. The current increases gradually when the electrode potential is greater than 2.5 V. This amount of voltage is good enough to allow the use of this biopolymer for the fabrication of protonic batteries, since the electrochemical window standard of a protonic battery is about ~1 V [26,27]. The result obtained in this present study is better than that reported by Ng and Mohamad, who observed that the onset current for EC plasticized chitosan–NH4NO3 polymer electrolyte film is only 1.80 V [27]. Besides that, the BPE sample in this study showed a wider electrochemical stability window than that reported by Samsudin et al. [17], who used synthetic CMC. They obtained electrochemical stability up to 1.38 V.
Figure 13. Linear sweep voltammetry curve for the biopolymer film of CMC–20% CH3COONH4.
Polymers 06 02371 g013

4. Conclusions

Carboxymethyl cellulose has been successfully synthesized and used as a host for proton conducting polymer electrolytes. The best conductivity value of 5.77 × 10⁻⁴·S·cm−1 was obtained for the system containing 20 wt% of CH3COONH4 at ambient temperature. FTIR spectroscopy provides insight into the possible coordination interaction between CMC and CH3COONH4, and additionally, the ionic species in the biopolymer electrolyte has been well established as proton (H+). The addition of CH3COONH4 increases the film’s amorphicity, besides reducing the pores on pure CMC, which could help to enhance the contact at the electrolyte-electrode interface. Linear sweep voltammetry results showed that the BPE electrochemical stability is achieved up to ~2.5 V and suitable for electrochemical device applications.

Acknowledgments

Mohd Saiful Asmal Rani would like to thank the Ministry of Higher Education for awarding him the postgraduate study. Financial support from the University of Malaya (Research Grant RG255-13AFR) is also gratefully acknowledged.

Author Contributions

All listed authors contributed to this work. Mohd Saiful Asmal Rani was responsible for the preparation of the biopolymer film, analyzing the data as well as writing this manuscript; Siti Rudhziah did the synthesis and modification of cellulose. Azizan Ahmad and Nor Sabirin Mohamed propose some constructive explanations and suggestions about the analysis as well as the revisions of this manuscript.

Conflicts of Interest

The authors declare no conflict of interest.

References

  1. Chandra, S.; Chandra, A. Solid state ionics: Materials aspect. In Proceedings of National Academy of Sciences India Section; Springer: Berlin, Germany, 1994; pp. 141–181. [Google Scholar]
  2. Selvasekarapandian, S.; Baskaran, R.; Hema, M. Complex AC impedance, transference number and vibrational spectroscopy studies of proton conducting PVAc–NH4SCN polymer electrolytes. Phys. B Condens. Matter 2005, 357, 412–419. [Google Scholar]
  3. Fenton, D.E.; Parker, J.M.; Wright, P.V. Complexes of alkali metal ions with poly (ethylene oxide). Polymer 1973, 14. [Google Scholar] [CrossRef]
  4. Wright, P.V. Electrical conductivity in ionic complexes of poly (ethylene oxide). Br. Polym. J. 1975, 7, 319–327. [Google Scholar] [CrossRef]
  5. Armand, M.B.; Chabagno, J.M.; Duclot, M.J. Poly-ethers as solid electrolytes. In Proceedings of the Second International Meeting on Solid Electrolytes, St. Andrews, Scotland, UK, 20–22 September 1978.
  6. Huang, H.; He, P.; Hu, N.; Zeng, Y. Electrochemical and electrocatalytic properties of myoglobin and haemoglobin incorporated in carboxymethyl cellulose films. Bioelectrochemistry 2003, 61, 29–38. [Google Scholar] [CrossRef] [PubMed]
  7. Adinugraha, M.P.; Marseno, D.W.; Haryadi. Synthesis and characterization of sodium carboxymethylcellulose from cavendish banana pseudo stem (Musa cavendishii LAMBERT). Carbohydr. Polym. 2005, 62, 164–169. [Google Scholar]
  8. Cuba-Chiem, L.T.; Huynh, L.; Ralston, J.; Beattie, D.A. In situ particle film ATR–FTIR studies of CMC adsorption on talc: The effect of ionic strength and multivalent metal ions. Miner. Eng. 2008, 21, 1013–1019. [Google Scholar] [CrossRef]
  9. Biswal, D.R.; Singh, R.P. Characterisation of carboxymethyl cellulose and polyacrylamide graft copolymer. Carbohydr. Polym. 2004, 57, 379–387. [Google Scholar] [CrossRef]
  10. Kurita, K. Controlled functionalization of the polysaccharide chitin. Prog. Polym. Sci. 2001, 26, 1921–1971. [Google Scholar] [CrossRef]
  11. Eyler, R.W.; Klug, E.D.; Diephuis, F. Determination of degree of substitution of sodium carboxymethylcellulose. Anal. Chem. 1947, 19, 24–27. [Google Scholar] [CrossRef]
  12. Seoud, O.A.E.; Nawaz, H.; Arêas, E.P.G. Chemistry and applications of polysaccharide solutions in strong electrolytes/dipolar aprotic solvents: An overview. Molecules 2013, 18, 1270–1313. [Google Scholar] [CrossRef] [PubMed]
  13. Pushpamalar, V.; Langford, S.J.; Ahmad, M.; Lim, Y.Y. Optimization of reaction conditions for preparing carboxymethyl cellulose from sago waste. Carbohydr. Polym. 2006, 64, 312–318. [Google Scholar] [CrossRef]
  14. Lam, E.; Leung, A.C.W.; Liu, Y.; Majid, E.; Hrapovic, S.; Male, K.B.; Luong, J.H.T. Green strategy guided by Raman spectroscopy for the synthesis of ammonium carboxylated nanocrystalline cellulose and the recovery of byproducts. J. ACS Sustain. Chem. Eng. 2013, 1, 278–283. [Google Scholar] [CrossRef]
  15. Kargarzadeh, H.; Ahmad, I.; Abdullah, I.; Dufresne, A.; Zainudin, S.Y.; Sheltami, R.M. Effects of hydrolysis conditions on the morphology, crystallinity, and thermal stability of cellulose nanocrystals extracted from kenaf bast fibers. Cellulose 2012, 19, 855–866. [Google Scholar] [CrossRef]
  16. Sain, M.; Panthapulakkal, S. Bioprocess preparation of wheat straw fibres and their characterization. Ind. Crops Prod. 2006, 2, 1–8. [Google Scholar] [CrossRef]
  17. Samsudin, A.S.; Lai, H.M.; Isa, M.I.N. Biopolymer materials based carboxymethyl cellulose as a proton conducting biopolymer electrolyte for application in rechargeable proton battery. Electrochim. Acta 2014, 129, 1–13. [Google Scholar] [CrossRef]
  18. Kamarudin, K.H.; Isa, M.I.N. Structural and DC ionic conductivity studies of carboxy methylcellulose doped with ammonium nitrate as solid polymer electrolytes. Int. J. Phys. Sci. 2013, 8, 1581–1587. [Google Scholar]
  19. Anuar, N.K.; Zainal, N.; Mohamed, N.S.; Subban, R.H.Y. Studies of poly (ethyl methacrylate) complexed with ammonium trifluoromethanesulfonate. Adv. Mater. Res. 2012, 501, 19–23. [Google Scholar] [CrossRef]
  20. Ramya, C.S.; Selvasekarapandian, S.; Savitha, T.; Hirankumar, G.; Angelo, P.C. Vibrational and impedance spectroscopic study on PVP–NH4SCN based polymer electrolytes. Phys. B Condens. Matter 2007, 393, 11–17. [Google Scholar] [CrossRef]
  21. Chai, M.N.; Isa, M.I.N. Carboxyl methylcellulose solid polymer electrolytes: Ionic conductivity and dielectric study. J. Curr. Eng. Res. 2011, 3, 23–27. [Google Scholar]
  22. Selvasekarapandian, S.; Hirankumar, G.; Kawamura, J.; Kuwata, N.; Hattori, T. H solid state NMR studies on the proton conducting polymer electrolytes. Mater. Lett. 2005, 59, 2741–2745. [Google Scholar] [CrossRef]
  23. Khiar, A.S.A.; Puteh, R.; Arof, A.K. Conductivity studies of a chitosan-based polymer electrolyte. Phys. B Condens. Matter 2006, 373, 23–27. [Google Scholar] [CrossRef]
  24. Samsudin, A.S.; Isa, M.I.N. Structural and ionic transport study on CMC doped NH4Br: A new types of biopolymer electrolytes. J. Appl. Sci. 2012, 12, 174–179. [Google Scholar] [CrossRef]
  25. Singh, P.K.; Bhattacharya, B. Present scenario of solid state photoelectrochemical solar cell and dye sensitized solar cell using PEO-based polymer electrolytes. In Dye-Sensitized Solar Cells and Solar Cell Performance; Travino, M.R., Ed.; Nova Science Publishers: Hauppauge, NY, USA, 2011; Chapter 10; pp. 235–266. [Google Scholar]
  26. Pratap, R.; Singh, B.; Chandra, S. Polymeric rechargeable solid state proton battery. J. Power Sources 2006, 161, 702–706. [Google Scholar] [CrossRef]
  27. Ng, L.S.; Mohamad, A.A. Effect of temperature on the performance of proton batteries based on chitosan–NH4NO3–EC membrane. J. Membr. Sci. 2008, 325, 653–657. [Google Scholar] [CrossRef]

