Flexural Behavior of RC Members Using Externally Bonded Aluminum-Glass Fiber Composite Beams

Abstract
:1. Introduction
2. Experimental Program
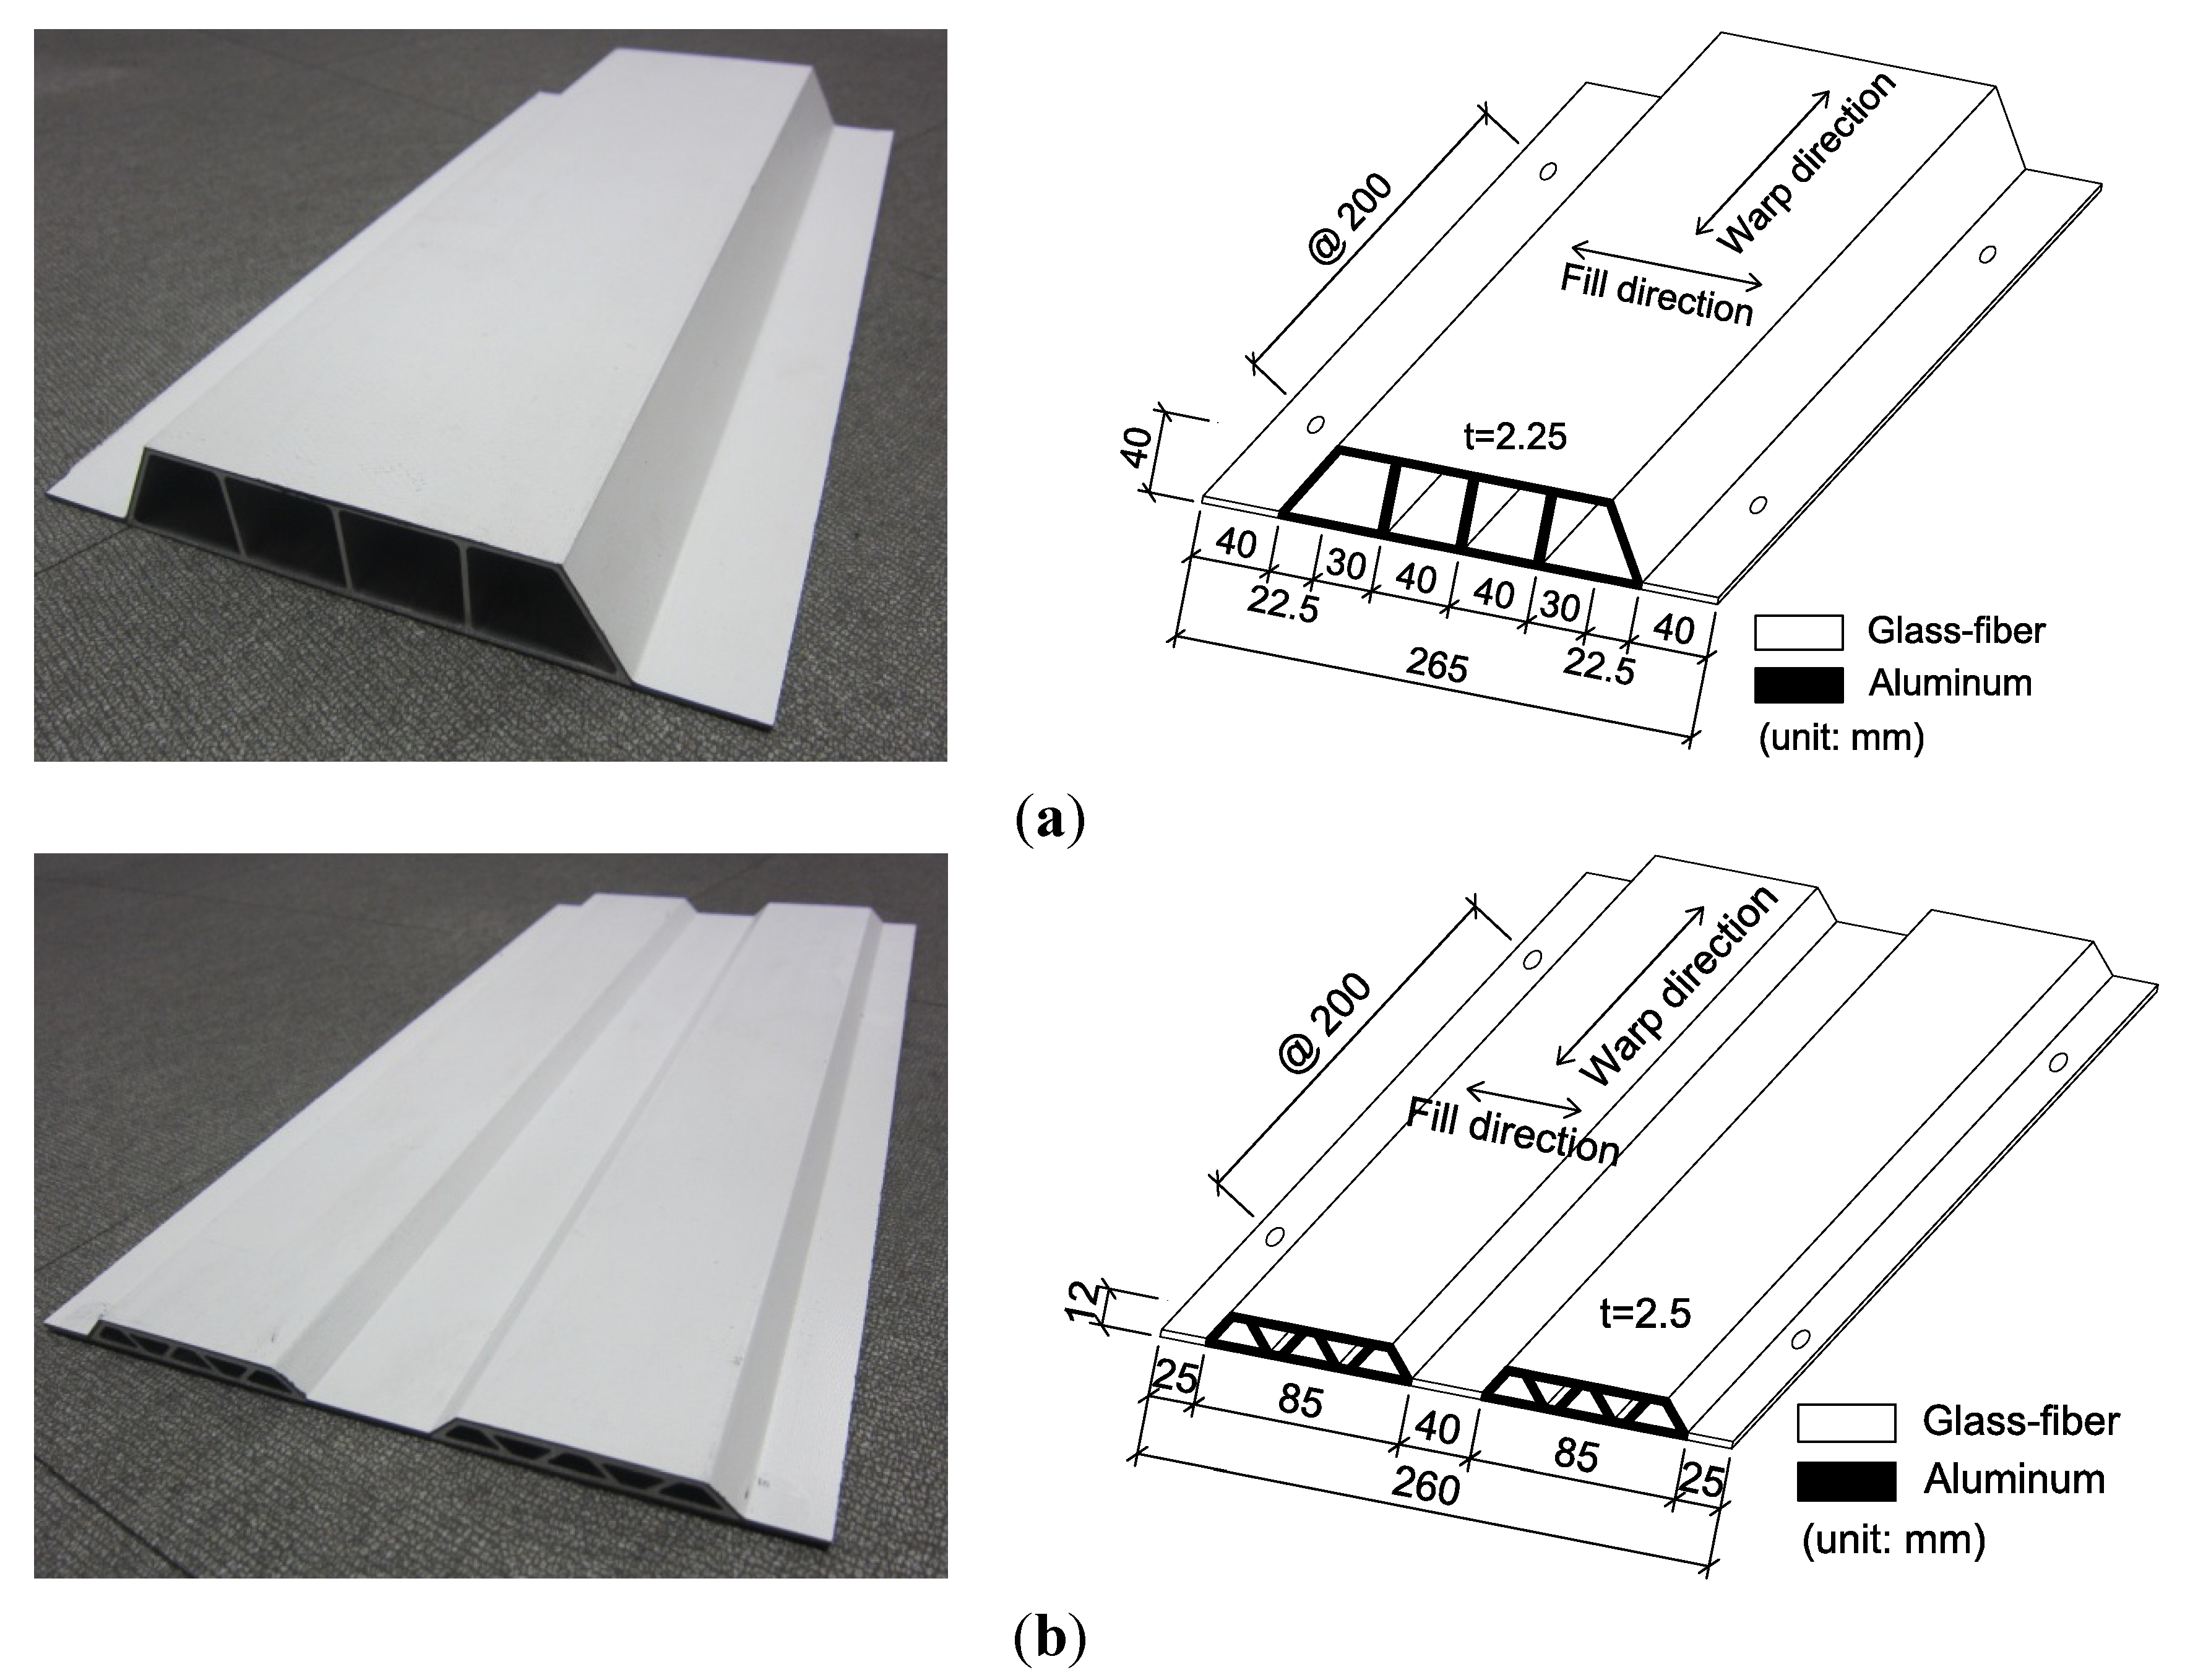
2.1. Aluminum-Glass Fiber Composite (AGC) Beam for Strengthening


| Materials | Tensile strength (MPa) | Ultimate strain | Modulus of elasticity (GPa) |
|---|---|---|---|
| CoV | CoV | CoV | |
| Aluminum alloy 6063 T6 | 275 5.8% | 0.053 6.1% | 71.5 3.1% |
| Glass-fiber of W40-F60 | 246 10.3% | 0.017 9.2% | 14.7 4.5% |
| Glass-fiber of W80-F20 | 496 9.5% | 0.016 11.1% | 31.0 5.2% |
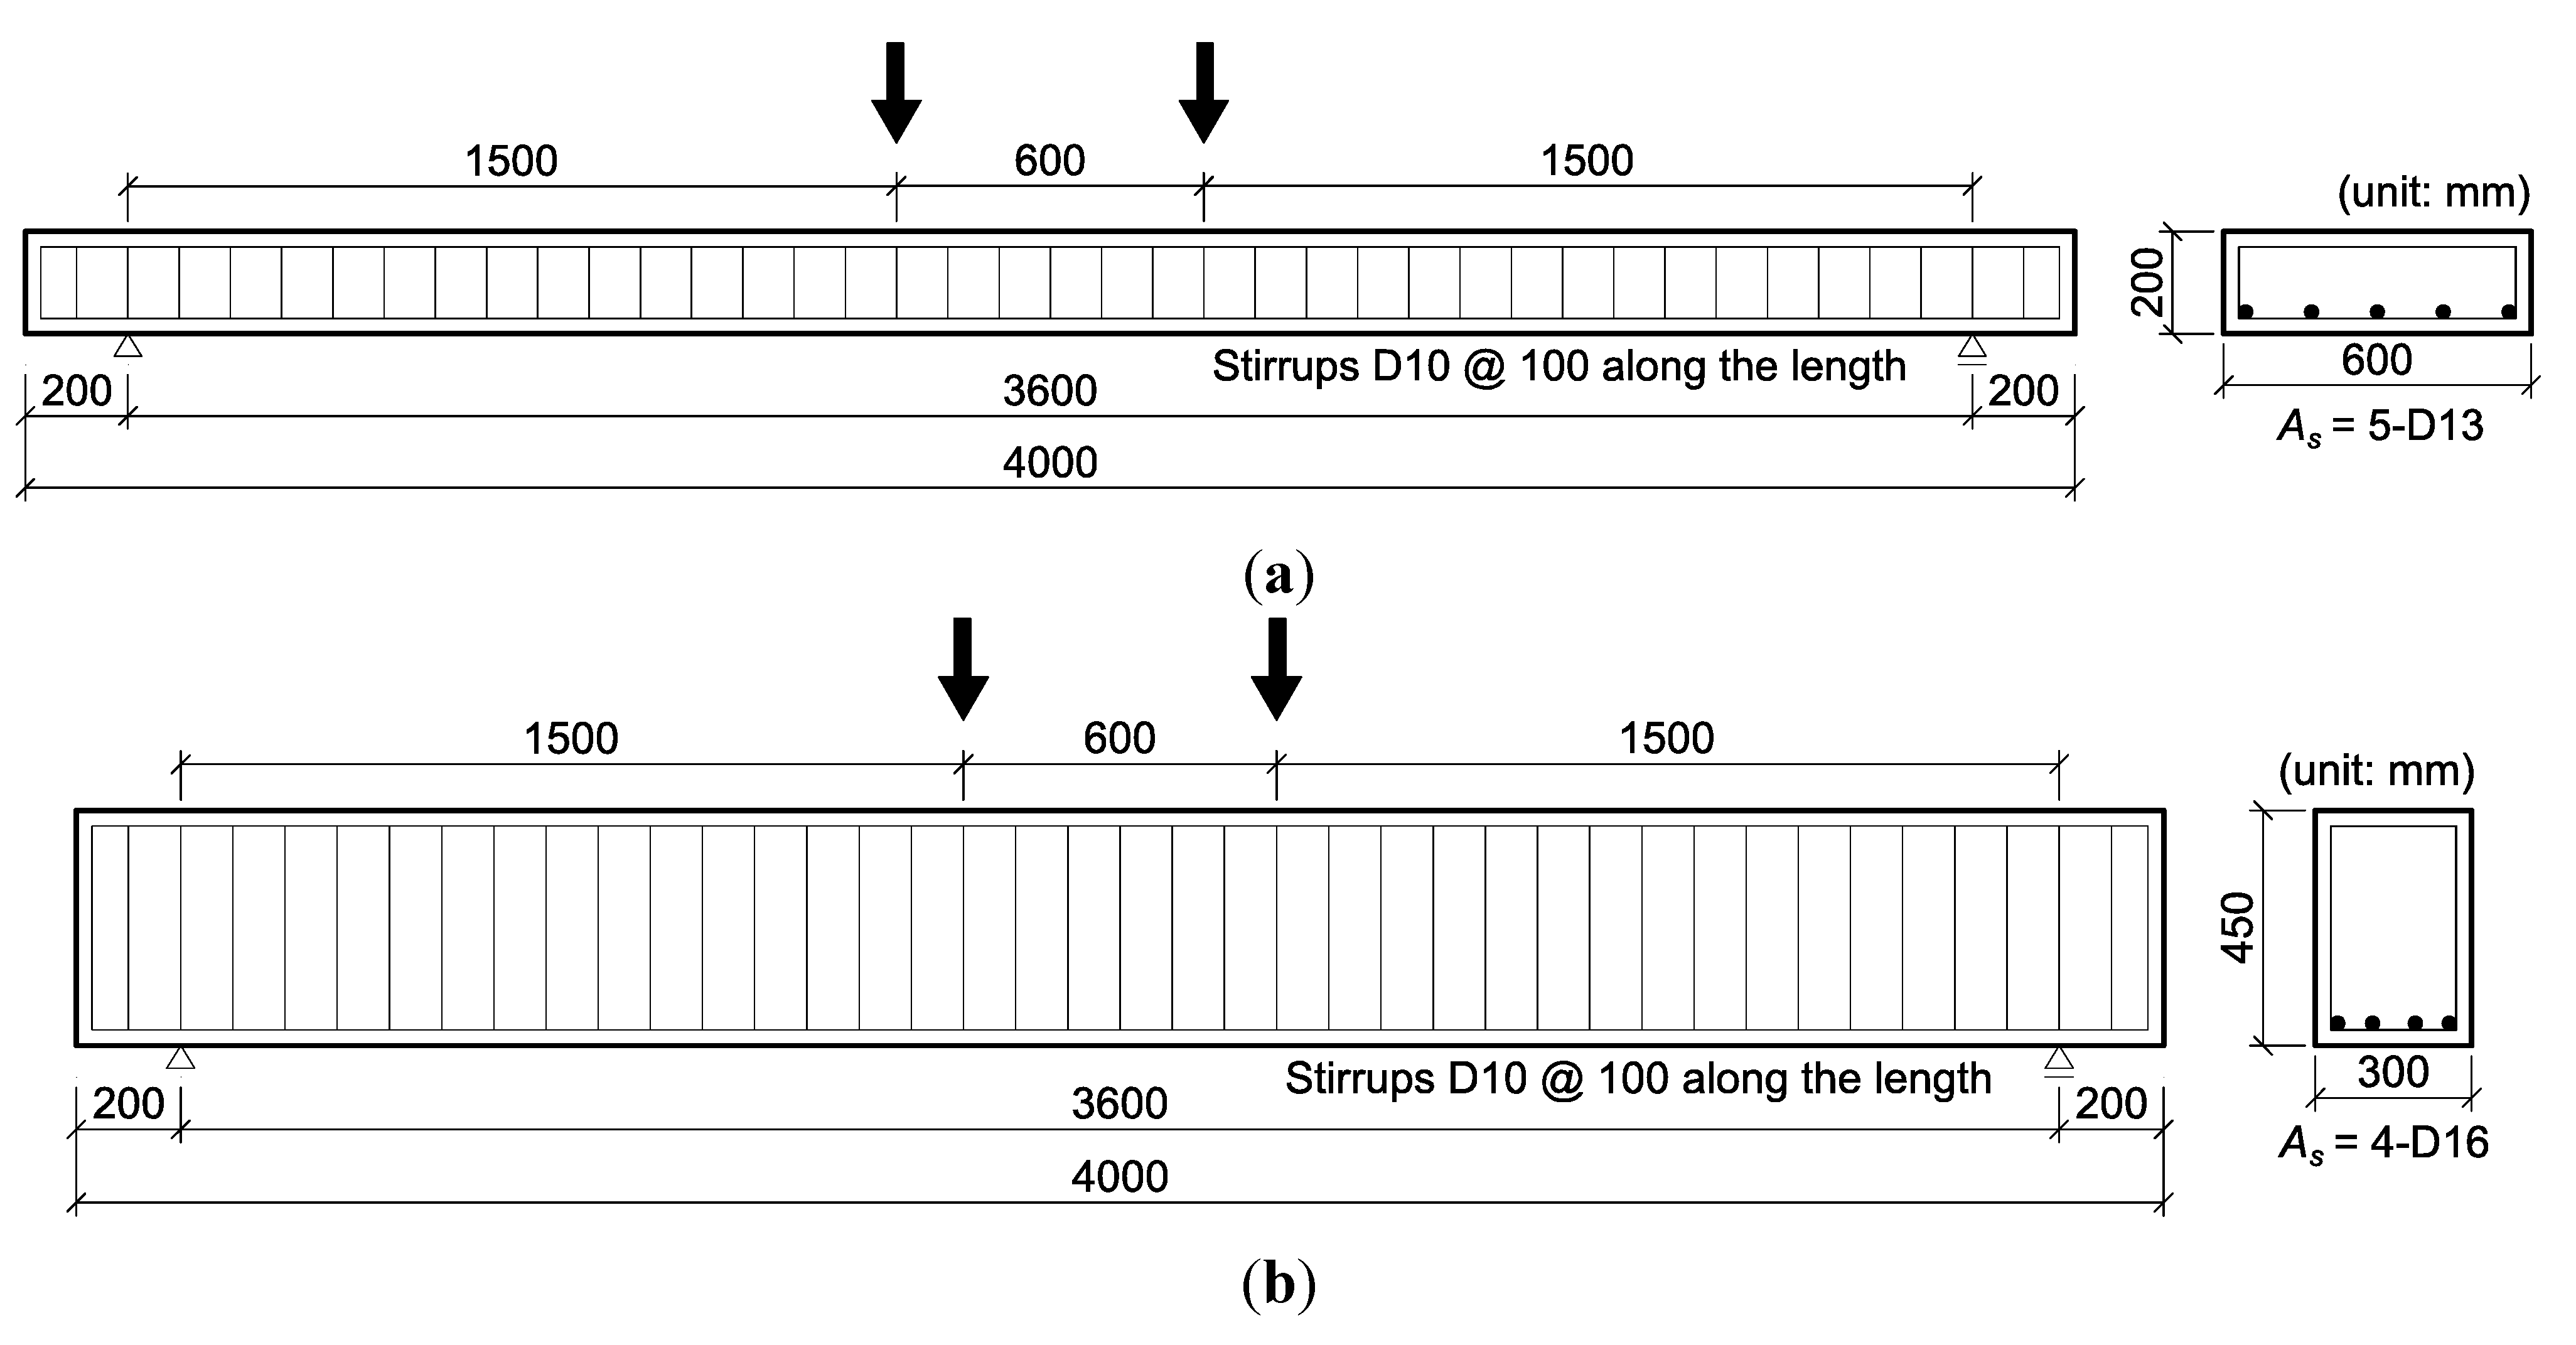
2.2. Description of Specimens

| Group | Specimen | Glass fiber type | AGC beam type | Fastener |
|---|---|---|---|---|
| Slab group (Group I) | I-Ref | – | – | – |
| I-G8-A | W80-F20 | A | Installation | |
| I-G8-B | W80-F20 | B | Installation | |
| I-G4-A | W40-F60 | A | Installation | |
| I-G4-B | W40-F60 | B | Installation | |
| I-G4-A-NF | W40-F60 | A | No installation | |
| I-G4-B-NF | W40-F60 | B | No installation | |
| Beam group (Group II) | II-Ref | – | – | – |
| II-G8-A | W80-F20 | A | Installation | |
| II-G8-B | W80-F20 | B | Installation | |
| II-G4-A | W40-F60 | A | Installation | |
| II-G4-B | W40-F60 | B | Installation | |
| II-G4-A-NF | W40-F60 | A | No installation | |
| II-G4-B-NF | W40-F60 | B | No installation |
2.3. Material Properties
| Reinforcements | Yield strength (MPa) | Tensile strength (MPa) |
|---|---|---|
| CoV | CoV | |
| D10 (diameter of 9.53 mm) | 518 2.4% | 616 3.5% |
| D13 (diameter of 12.7 mm) | 494 1.2% | 610 2.1% |
| D16 (diameter of 15.9 mm) | 506 1.8% | 608 1.7% |
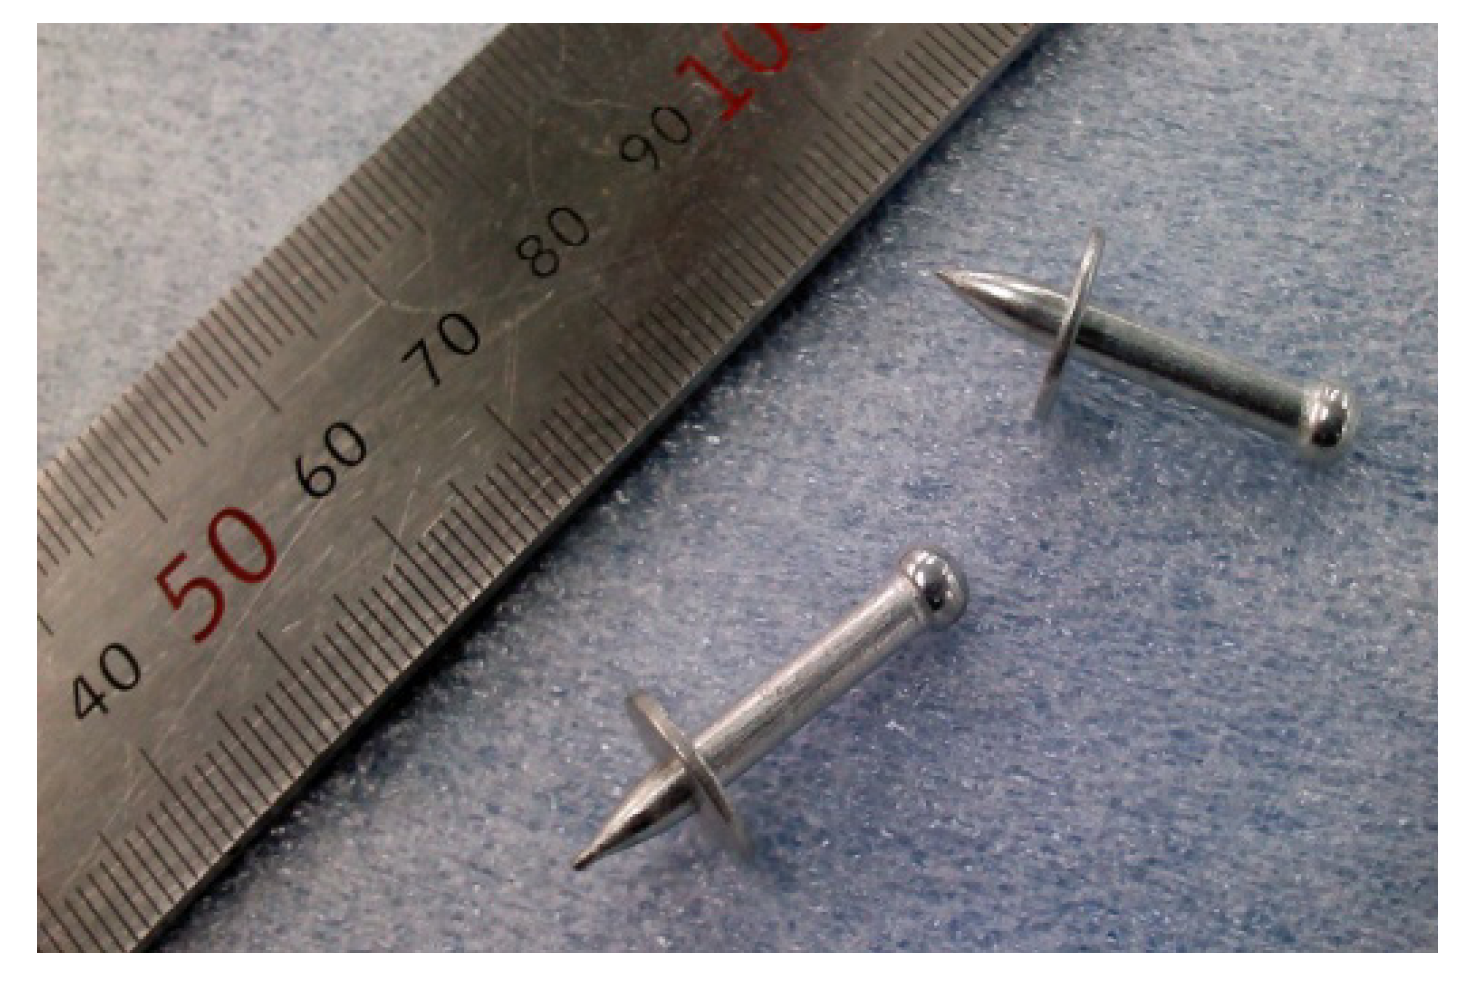
2.4. Strengthening Technique
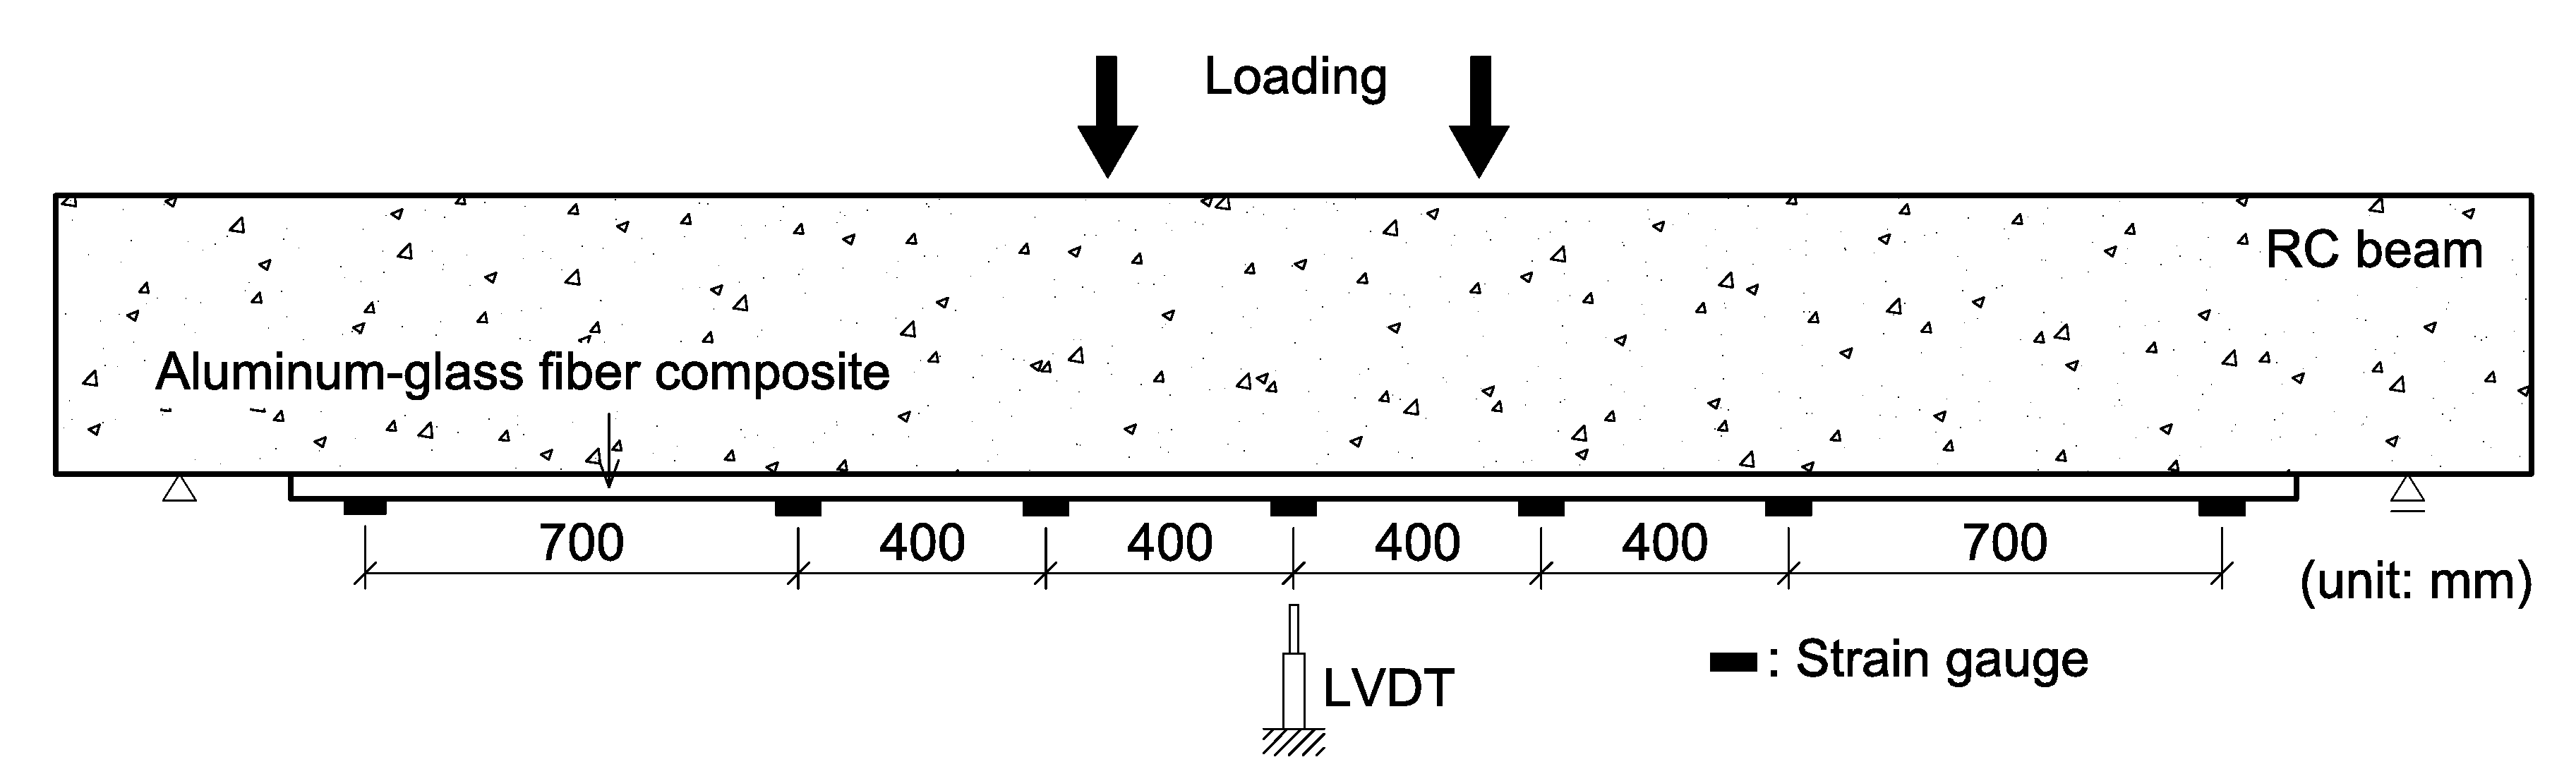
2.5. Test Setup and Instrumentation
3. Test Results
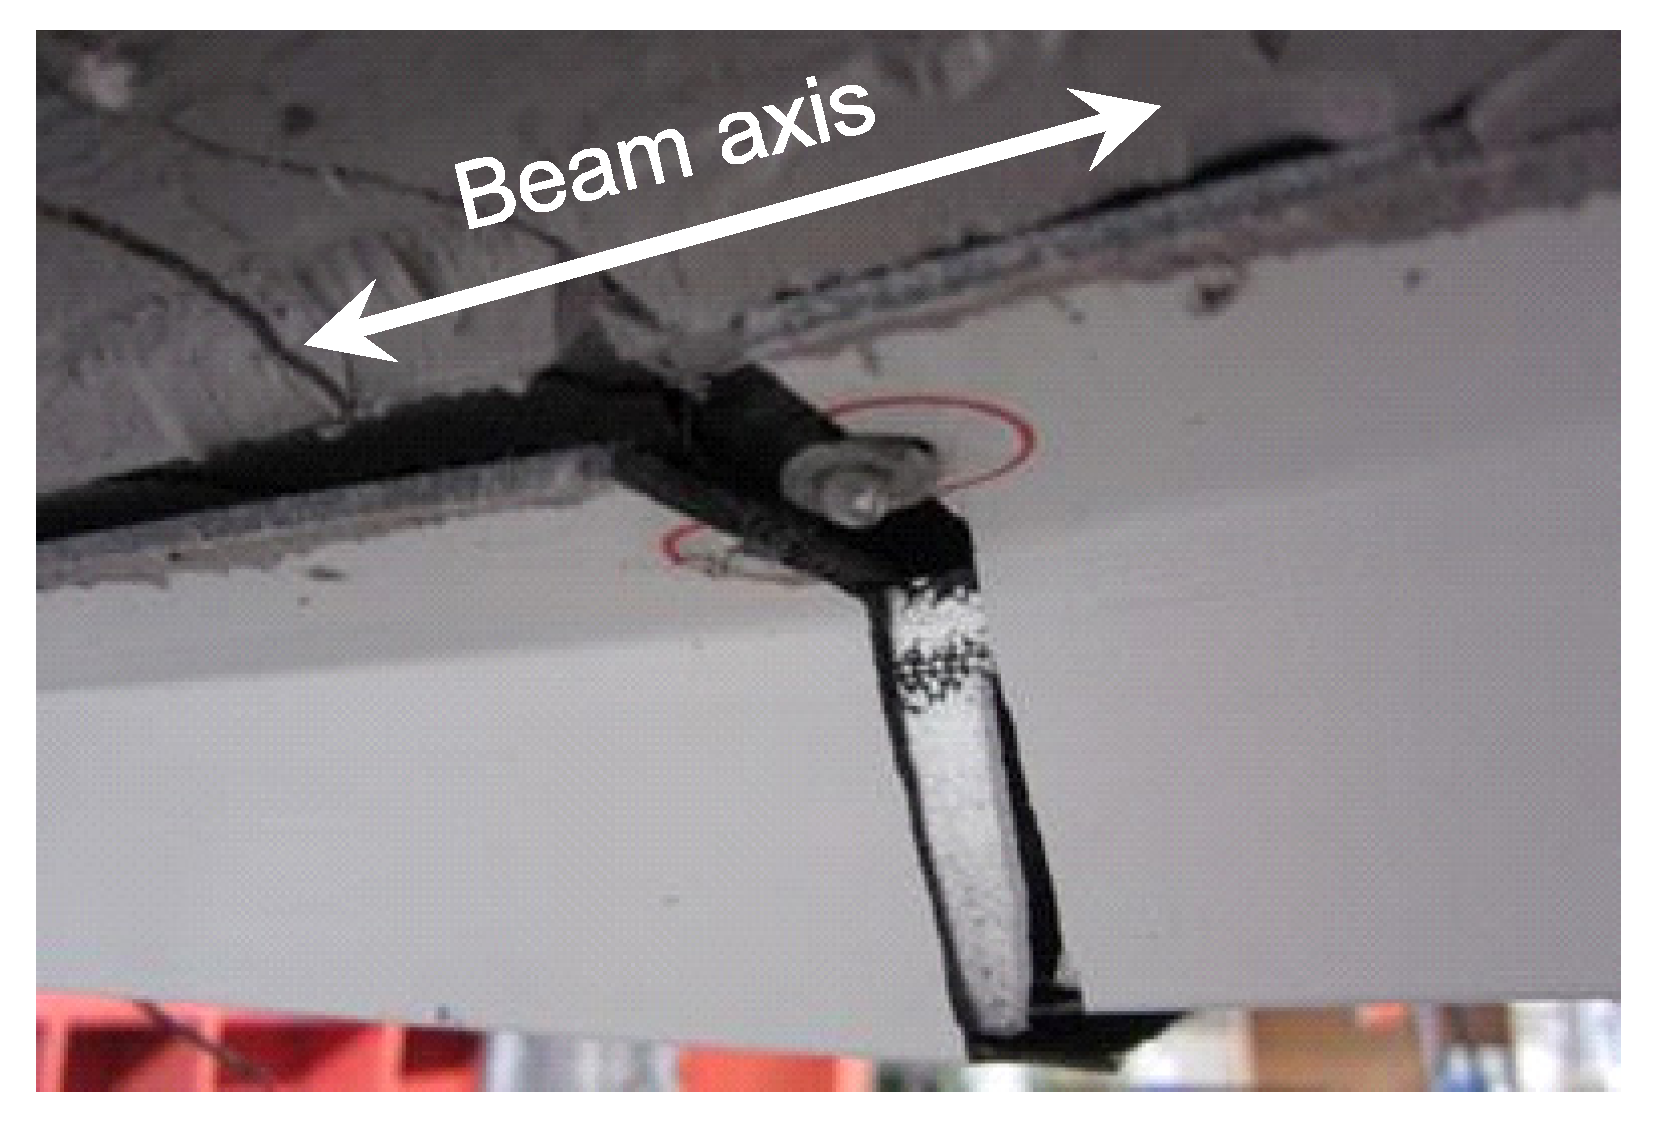
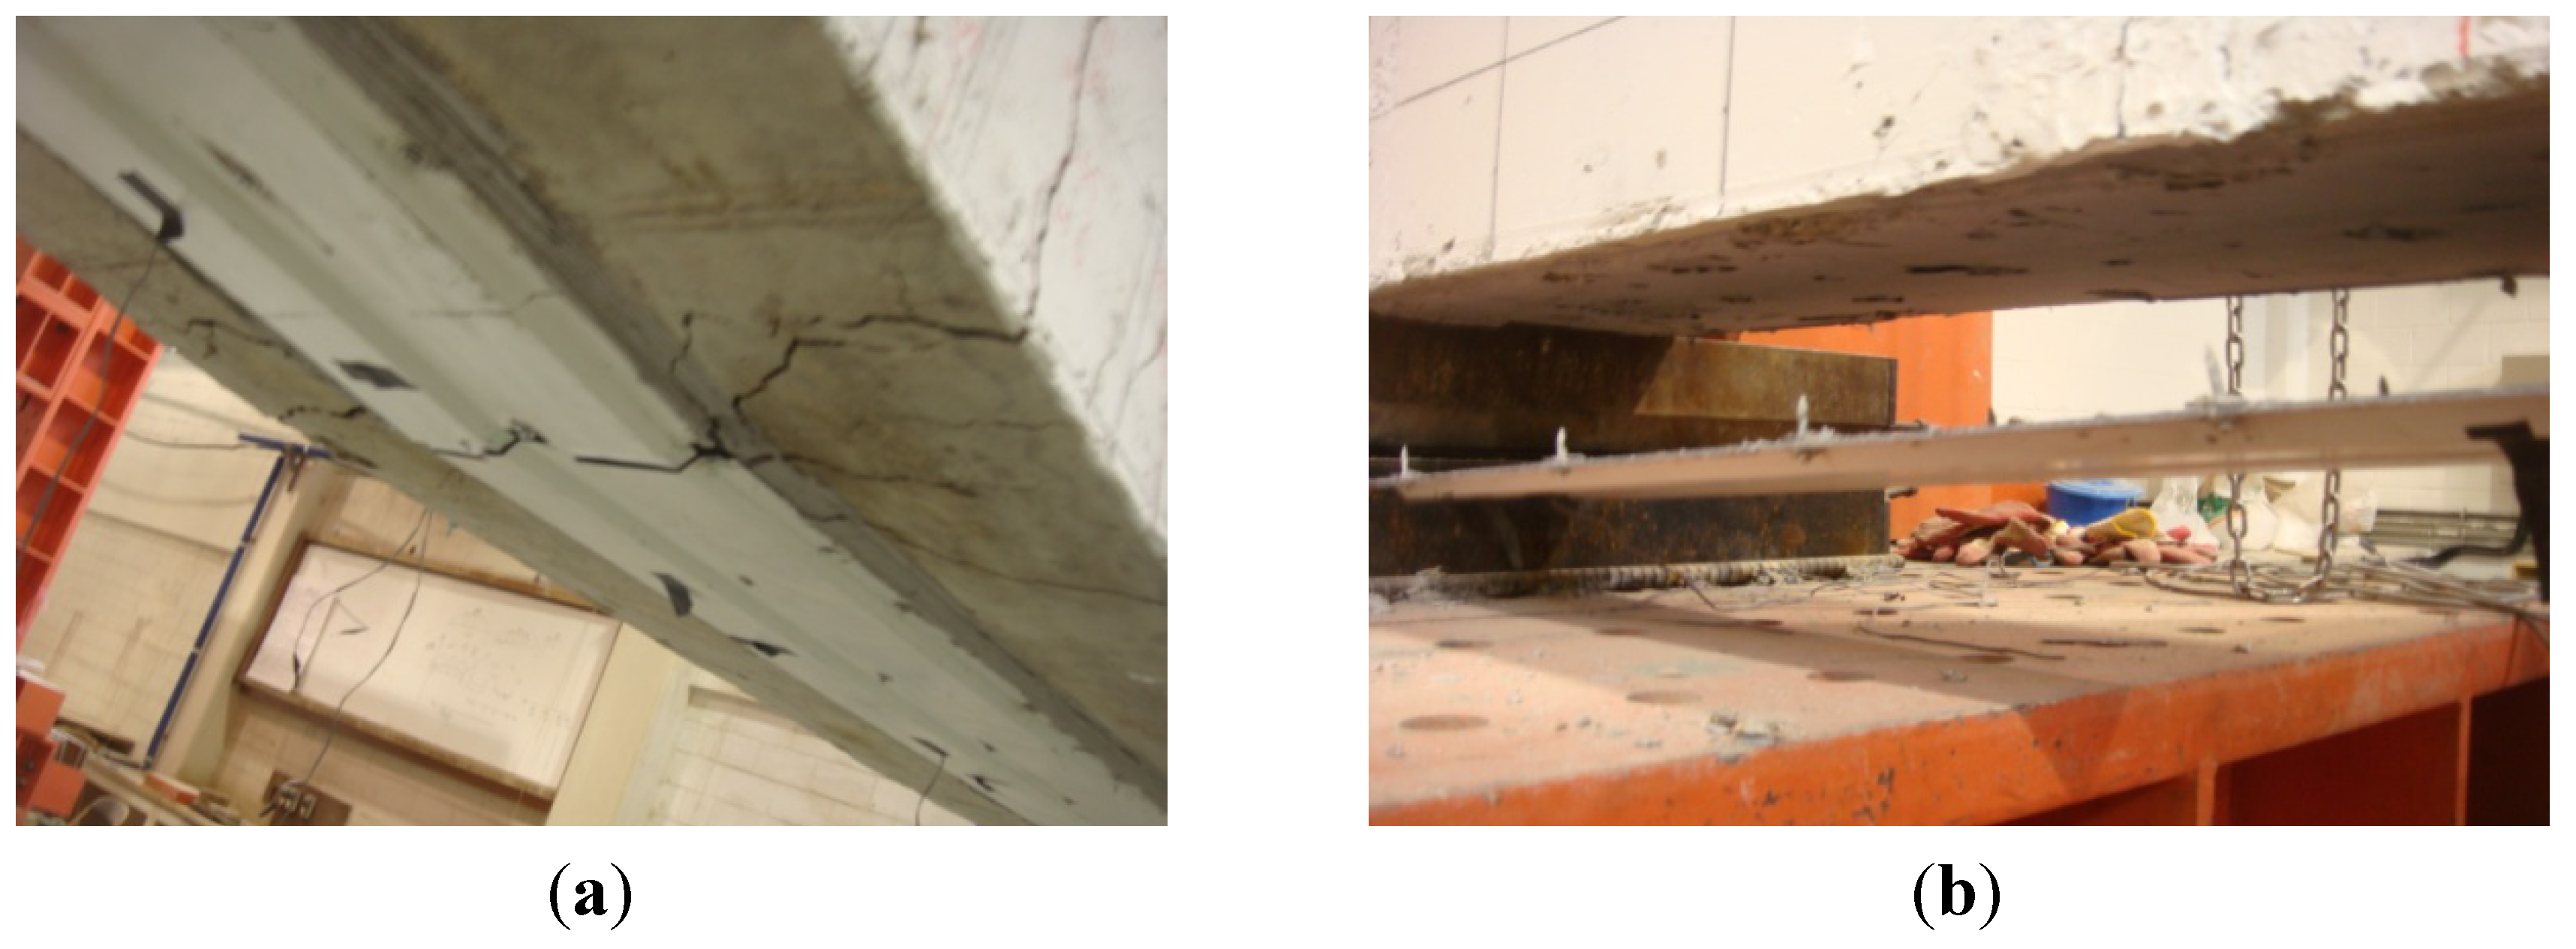
3.1. General Behavior and Failure Mode
| Specimen | Pcr(kN) | Py(kN) | Ppeak(kN) | Increase for Pcr | Increase for Py | Increase for Ppeak | δy(mm) | δpeak(mm) | δpeak/δy | Failure Mode |
|---|---|---|---|---|---|---|---|---|---|---|
| Slab group | ||||||||||
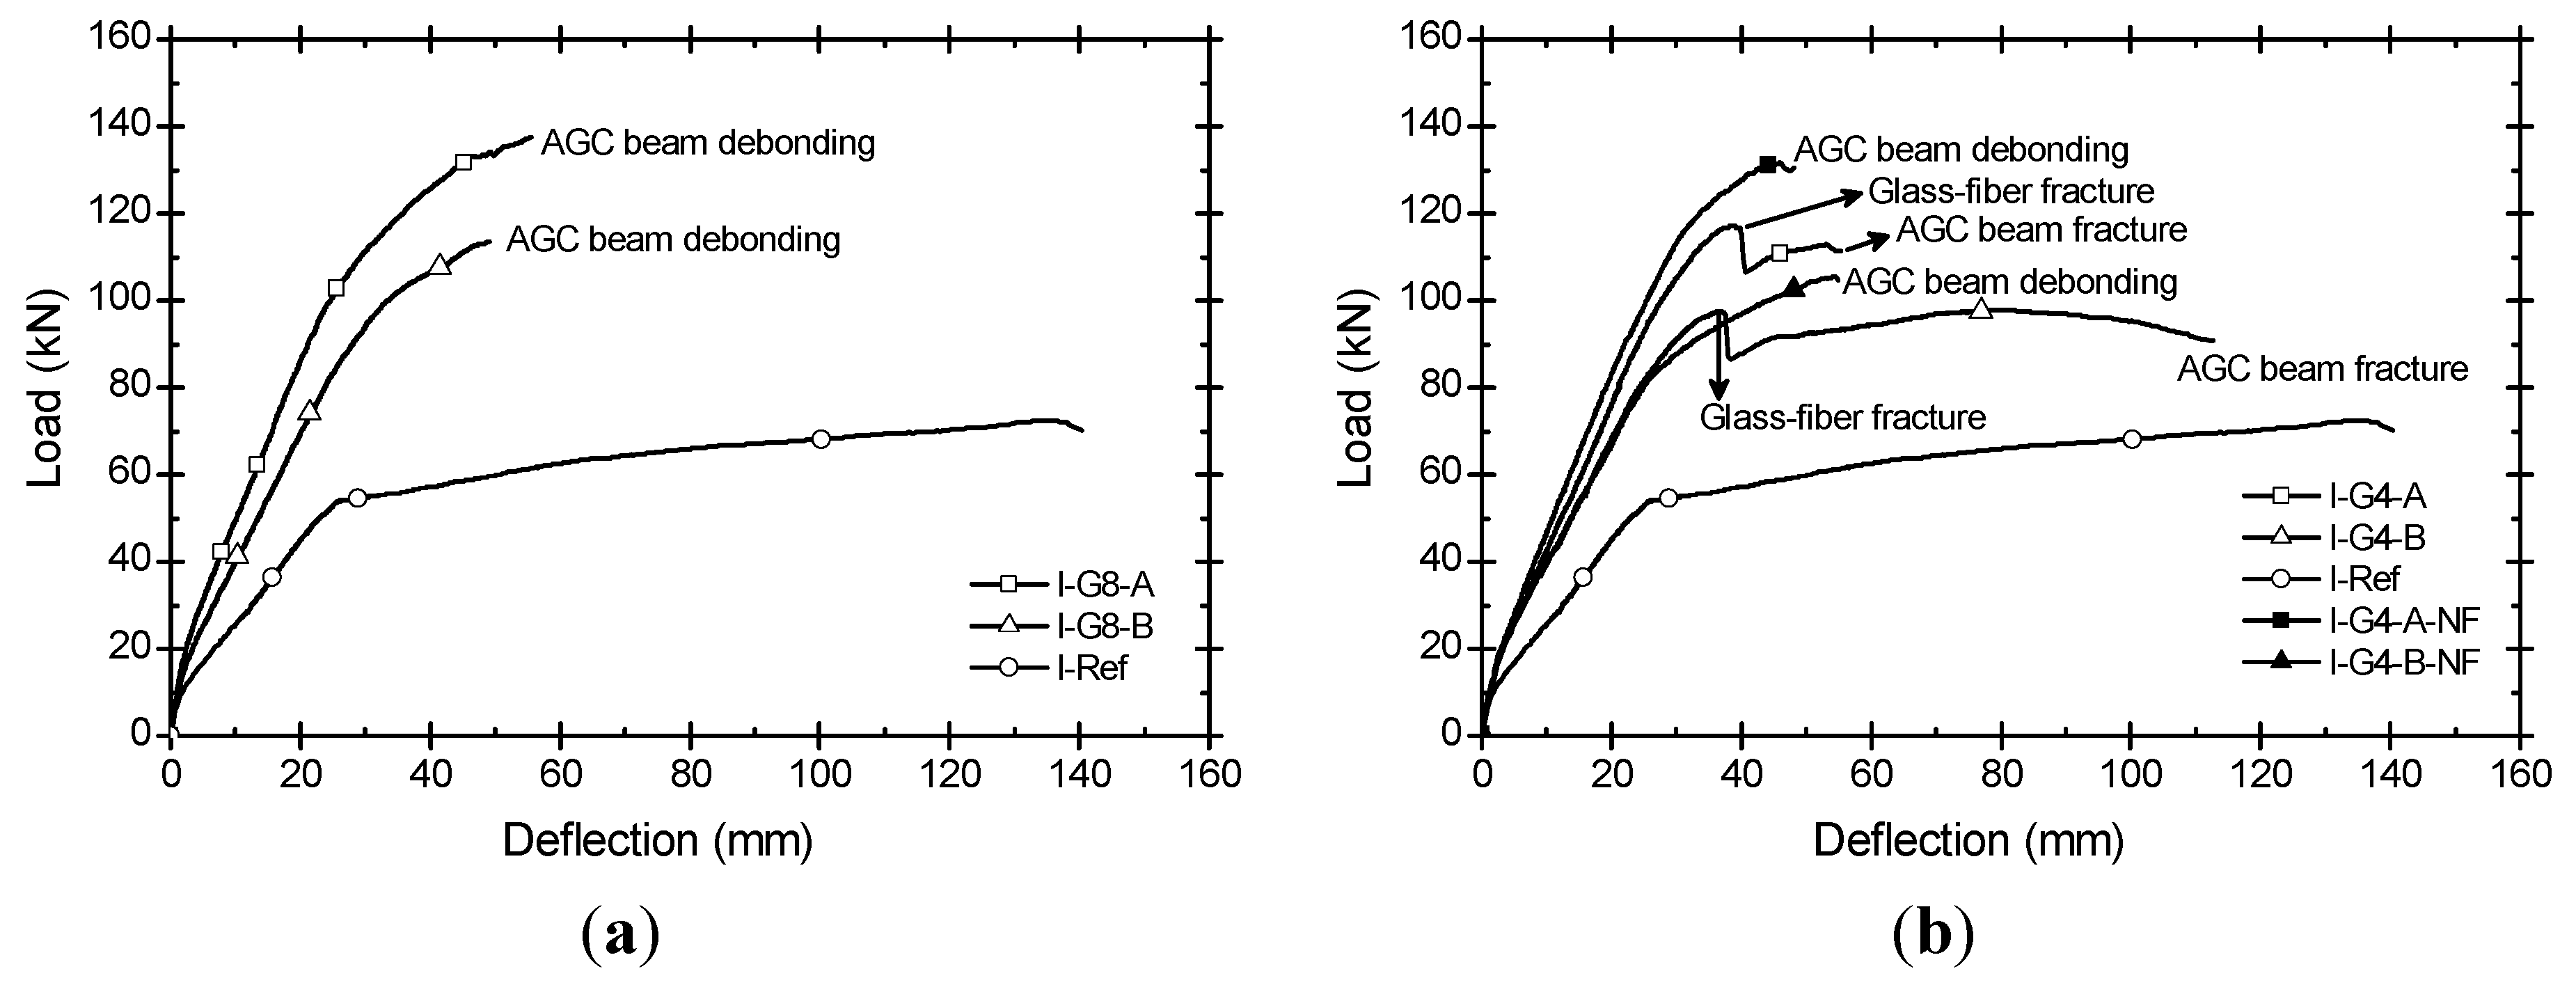
| I-Ref | 7.0 | 53.9 | 72.4 | – | – | – | 26.0 | 136.0 | 5.23 | Flexure |
| I-G8-A | 18.4 | 100.6 | 137.4 | 1.63 | 0.87 | 0.90 | 24.9 | 55.5 | 2.23 | Debonding |
| I-G8-B | 13.9 | 101.2 | 113.7 | 0.99 | 0.88 | 0.57 | 34.4 | 49.2 | 1.43 | Debonding |
| I-G4-A | 13.2 | 111.4 | 117.4 | 0.89 | 1.07 | 0.62 | 33.2 | 38.6 | 1.16 | Fracture |
| I-G4-B | 13.9 | 93.5 | 97.9 | 0.99 | 0.73 | 0.35 | 31.6 | 79.3 | 2.51 | Fracture |
| I-G4-A-NF | 16.5 | 119.6 | 131.6 | 1.36 | 1.22 | 0.82 | 33.4 | 46.1 | 1.38 | Debonding |
| I-G4-B-NF | 13.8 | 82.6 | 105.5 | 0.97 | 0.53 | 0.46 | 26.3 | 54.4 | 2.07 | Debonding |
| Beam group | ||||||||||
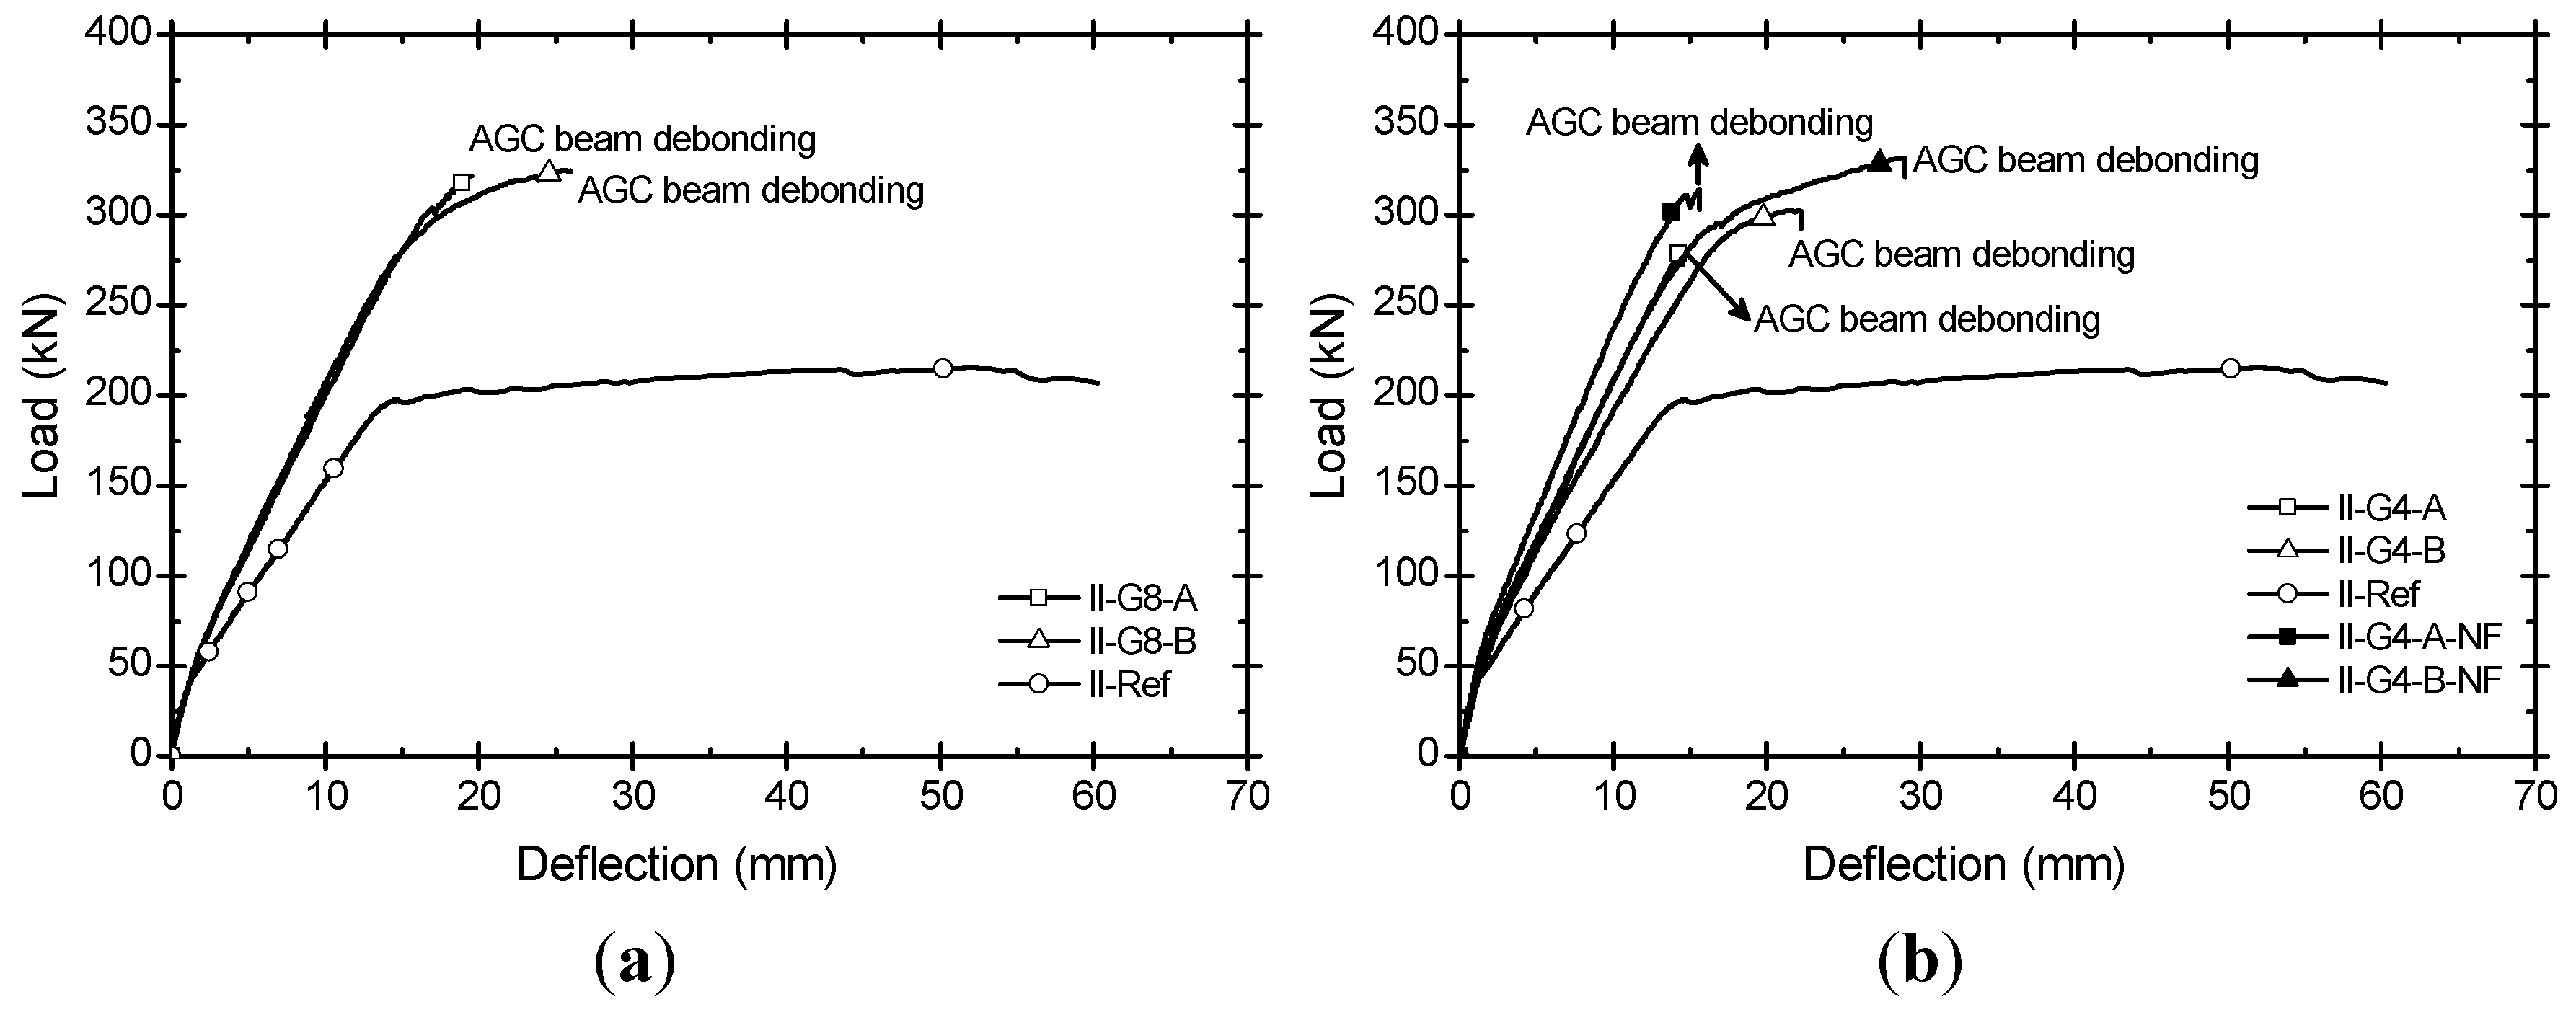
| II- Ref | 37.2 | 197.2 | 215.3 | – | – | – | 14.8 | 52.3 | 3.53 | Flexure |
| II-G8-A | 50.0 | 304.0 | 321.7 | 0.34 | 0.54 | 0.49 | 17.0 | 19.5 | 1.15 | Debonding |
| II-G8-B | 40.8 | 298.8 | 324.6 | 0.10 | 0.52 | 0.51 | 17.3 | 25.5 | 1.47 | Debonding |
| II-G4-A | 56.7 | – | 282.1 | 0.52 | – | 0.31 | – | 14.6 | – | Debonding |
| II-G4-B | 43.9 | 284.4 | 302.7 | 0.18 | 0.44 | 0.41 | 16.9 | 22.2 | 1.31 | Debonding |
| II-G4-A-NF | 58.5 | – | 314.0 | 0.57 | – | 0.46 | – | 15.6 | – | Debonding |
| II-G4-B-NF | 59.1 | 291.6 | 331.8 | 0.59 | 0.48 | 0.54 | 16.2 | 29.0 | 1.79 | Debonding |
3.2. Load-Deflection Response

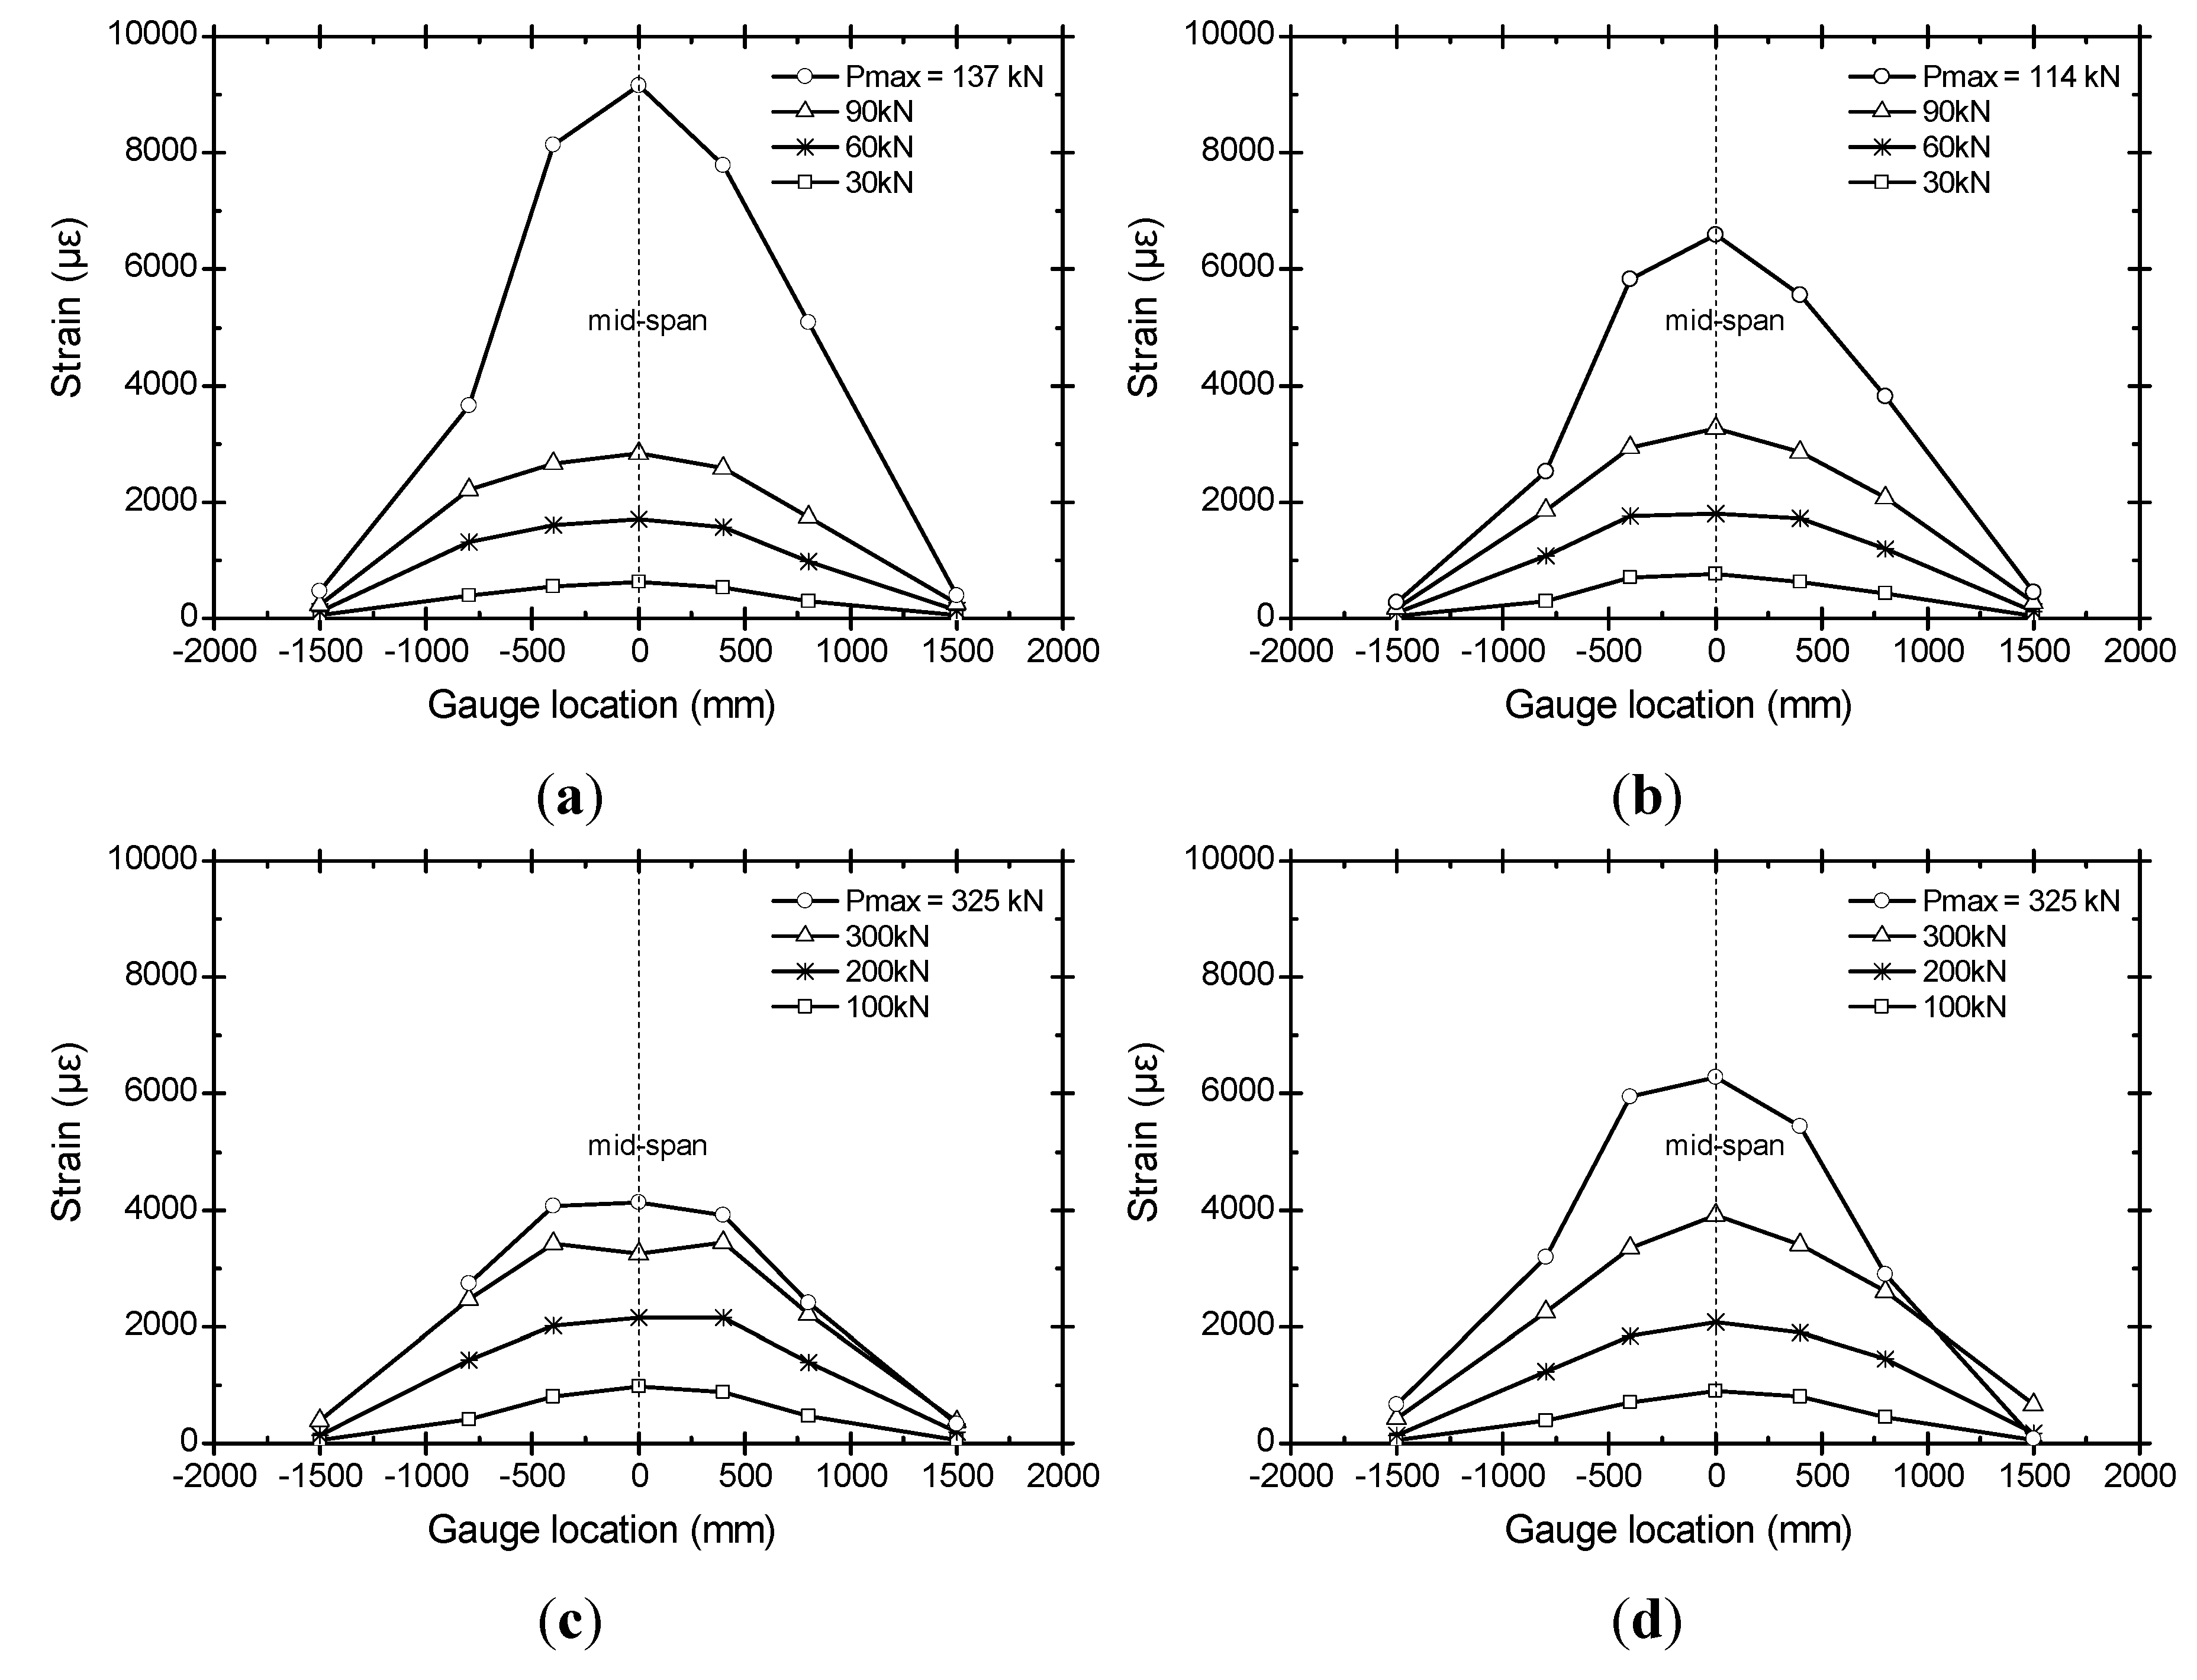
3.3. Strain Distribution of AGC Beam
3.4. Effect of AGC Beam Type, Glass-Fiber Array and Fastener

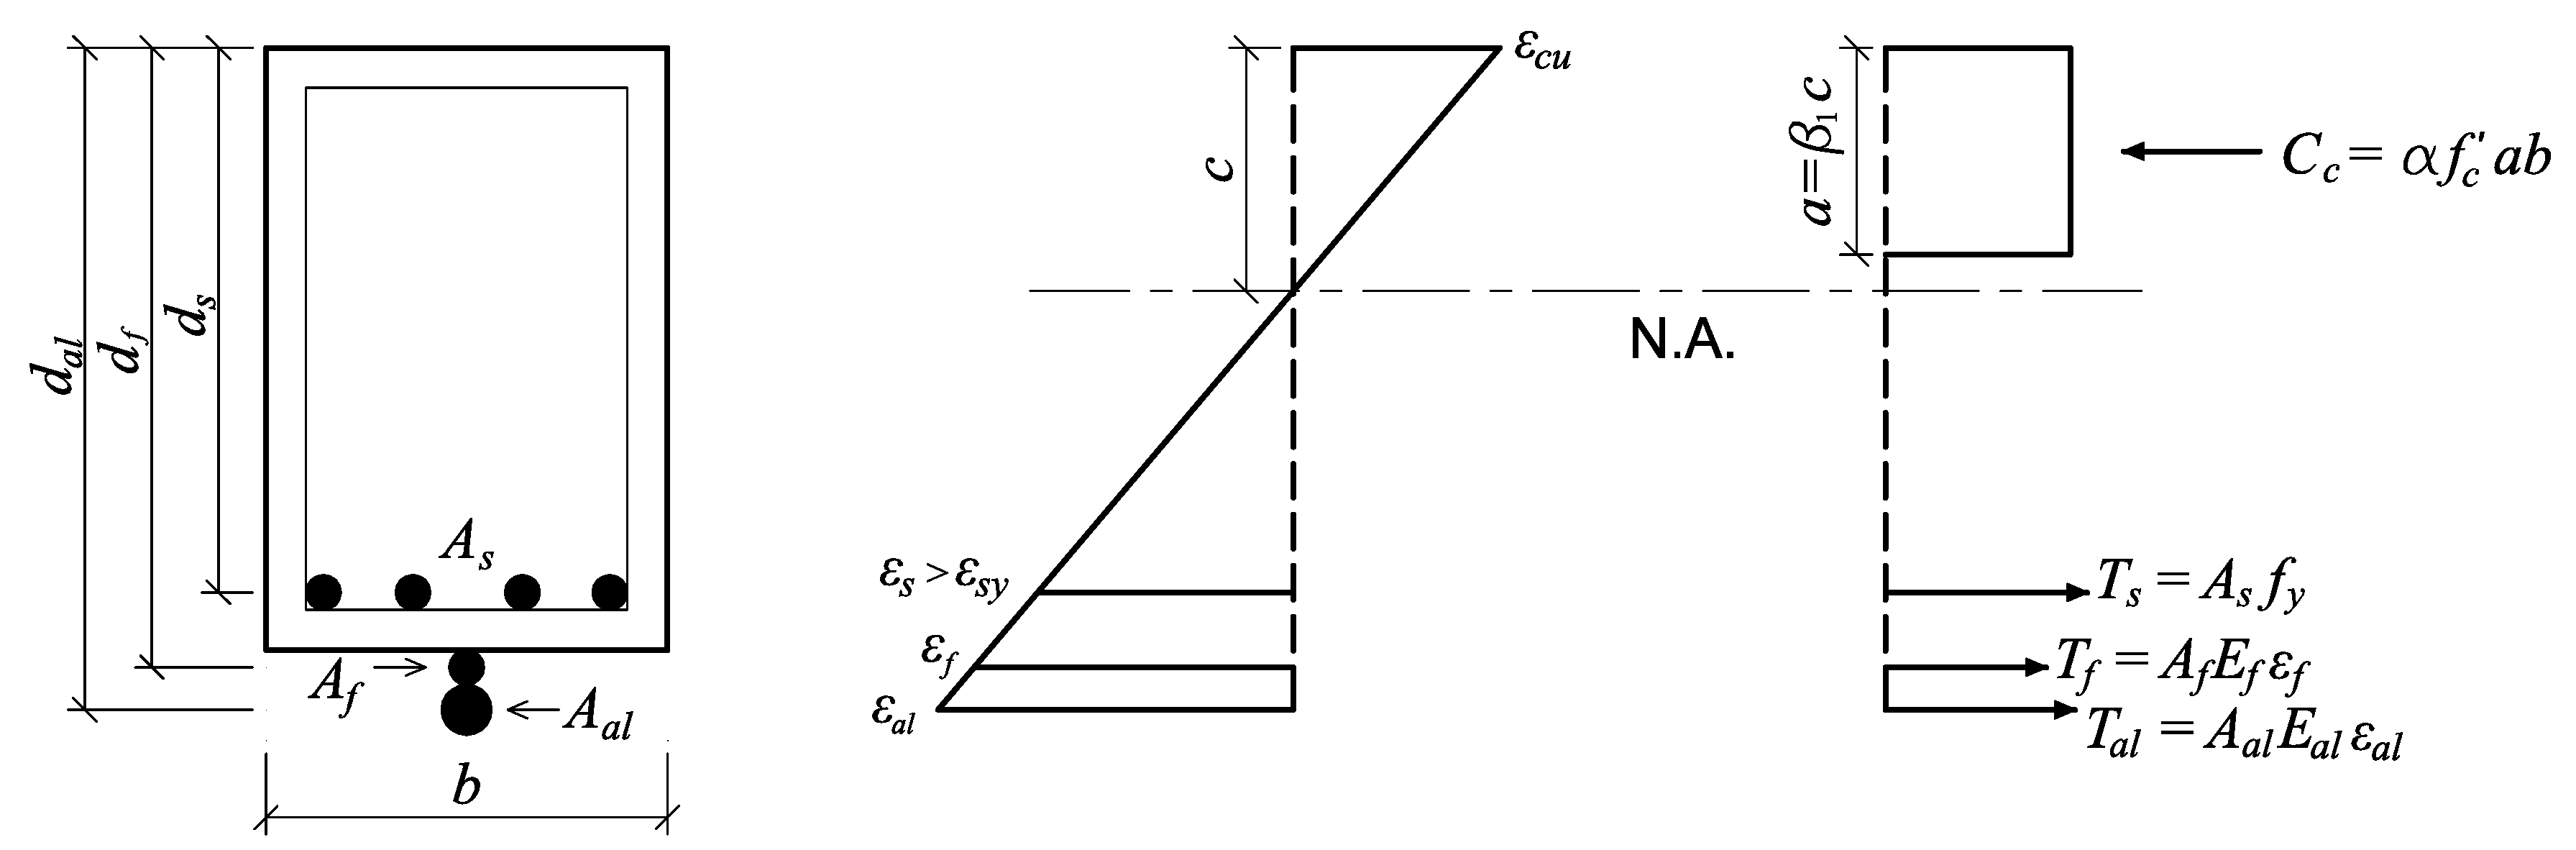
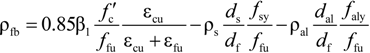
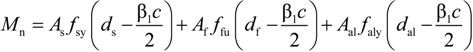
4. Analysis Model for Moment Capacity
4.1. Assumptions
- (i)
- the bending section before and after bending deformation remains plane;
- (ii)
- the strain distribution at the section is linear from the extreme compressive fiber to the AGC beam attached at the bottom (that is, the epoxy adhesive between the beam bottom and the top of the AGC beam perfectly transmits the shear stress.);
- (iii)
- the tensile strength of concrete is neglected;
- (iv)
- elasto-perfectly plastic behavior is applied to the internal reinforcements and the aluminum inside the AGC beam;
- (v)
- the glass-fiber of the AGC beam has a constant modulus of elasticity until it reaches ultimate strength; and
- (vi)
- the effective depth of the AGC beam is from the extreme surface of the concrete to the AGC beam’s centroid.
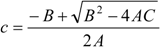
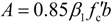
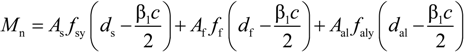
4.2. Analysis Model at Ultimate


5. Conclusions
- The AGC beam increased the load carrying capacities of initial crack load, yield load, and peak load. However, the failures for the tested specimens showed different local and global failure modes, including the fracture of the AGC beam and debonding from the RC member prior to the ultimate load. In particular, the debonding failure of the AGC beam occurred in most beam specimens of Group II. The enhancement of epoxy bonding strength is needed to prevent premature failure such as debonding.
- The AGC beam of the A-type enhanced the flexural stiffness (or strength) more efficiently in slab specimens than in beam specimens. On the other hand, the AGC beam of B-type was better suited for beam specimens than for slab specimens. However, more consideration for ductility in both of A-type and B-type is required for further work.
- Comparing AGC beams of W80-F20 with W40-F60, the former worked for flexural stiffness or strength more effectively than the latter, but the difference was not significant.
- The use of fasteners should be considered carefully since fastener installation could lead to fracture of the AGC beam due to stress concentration.
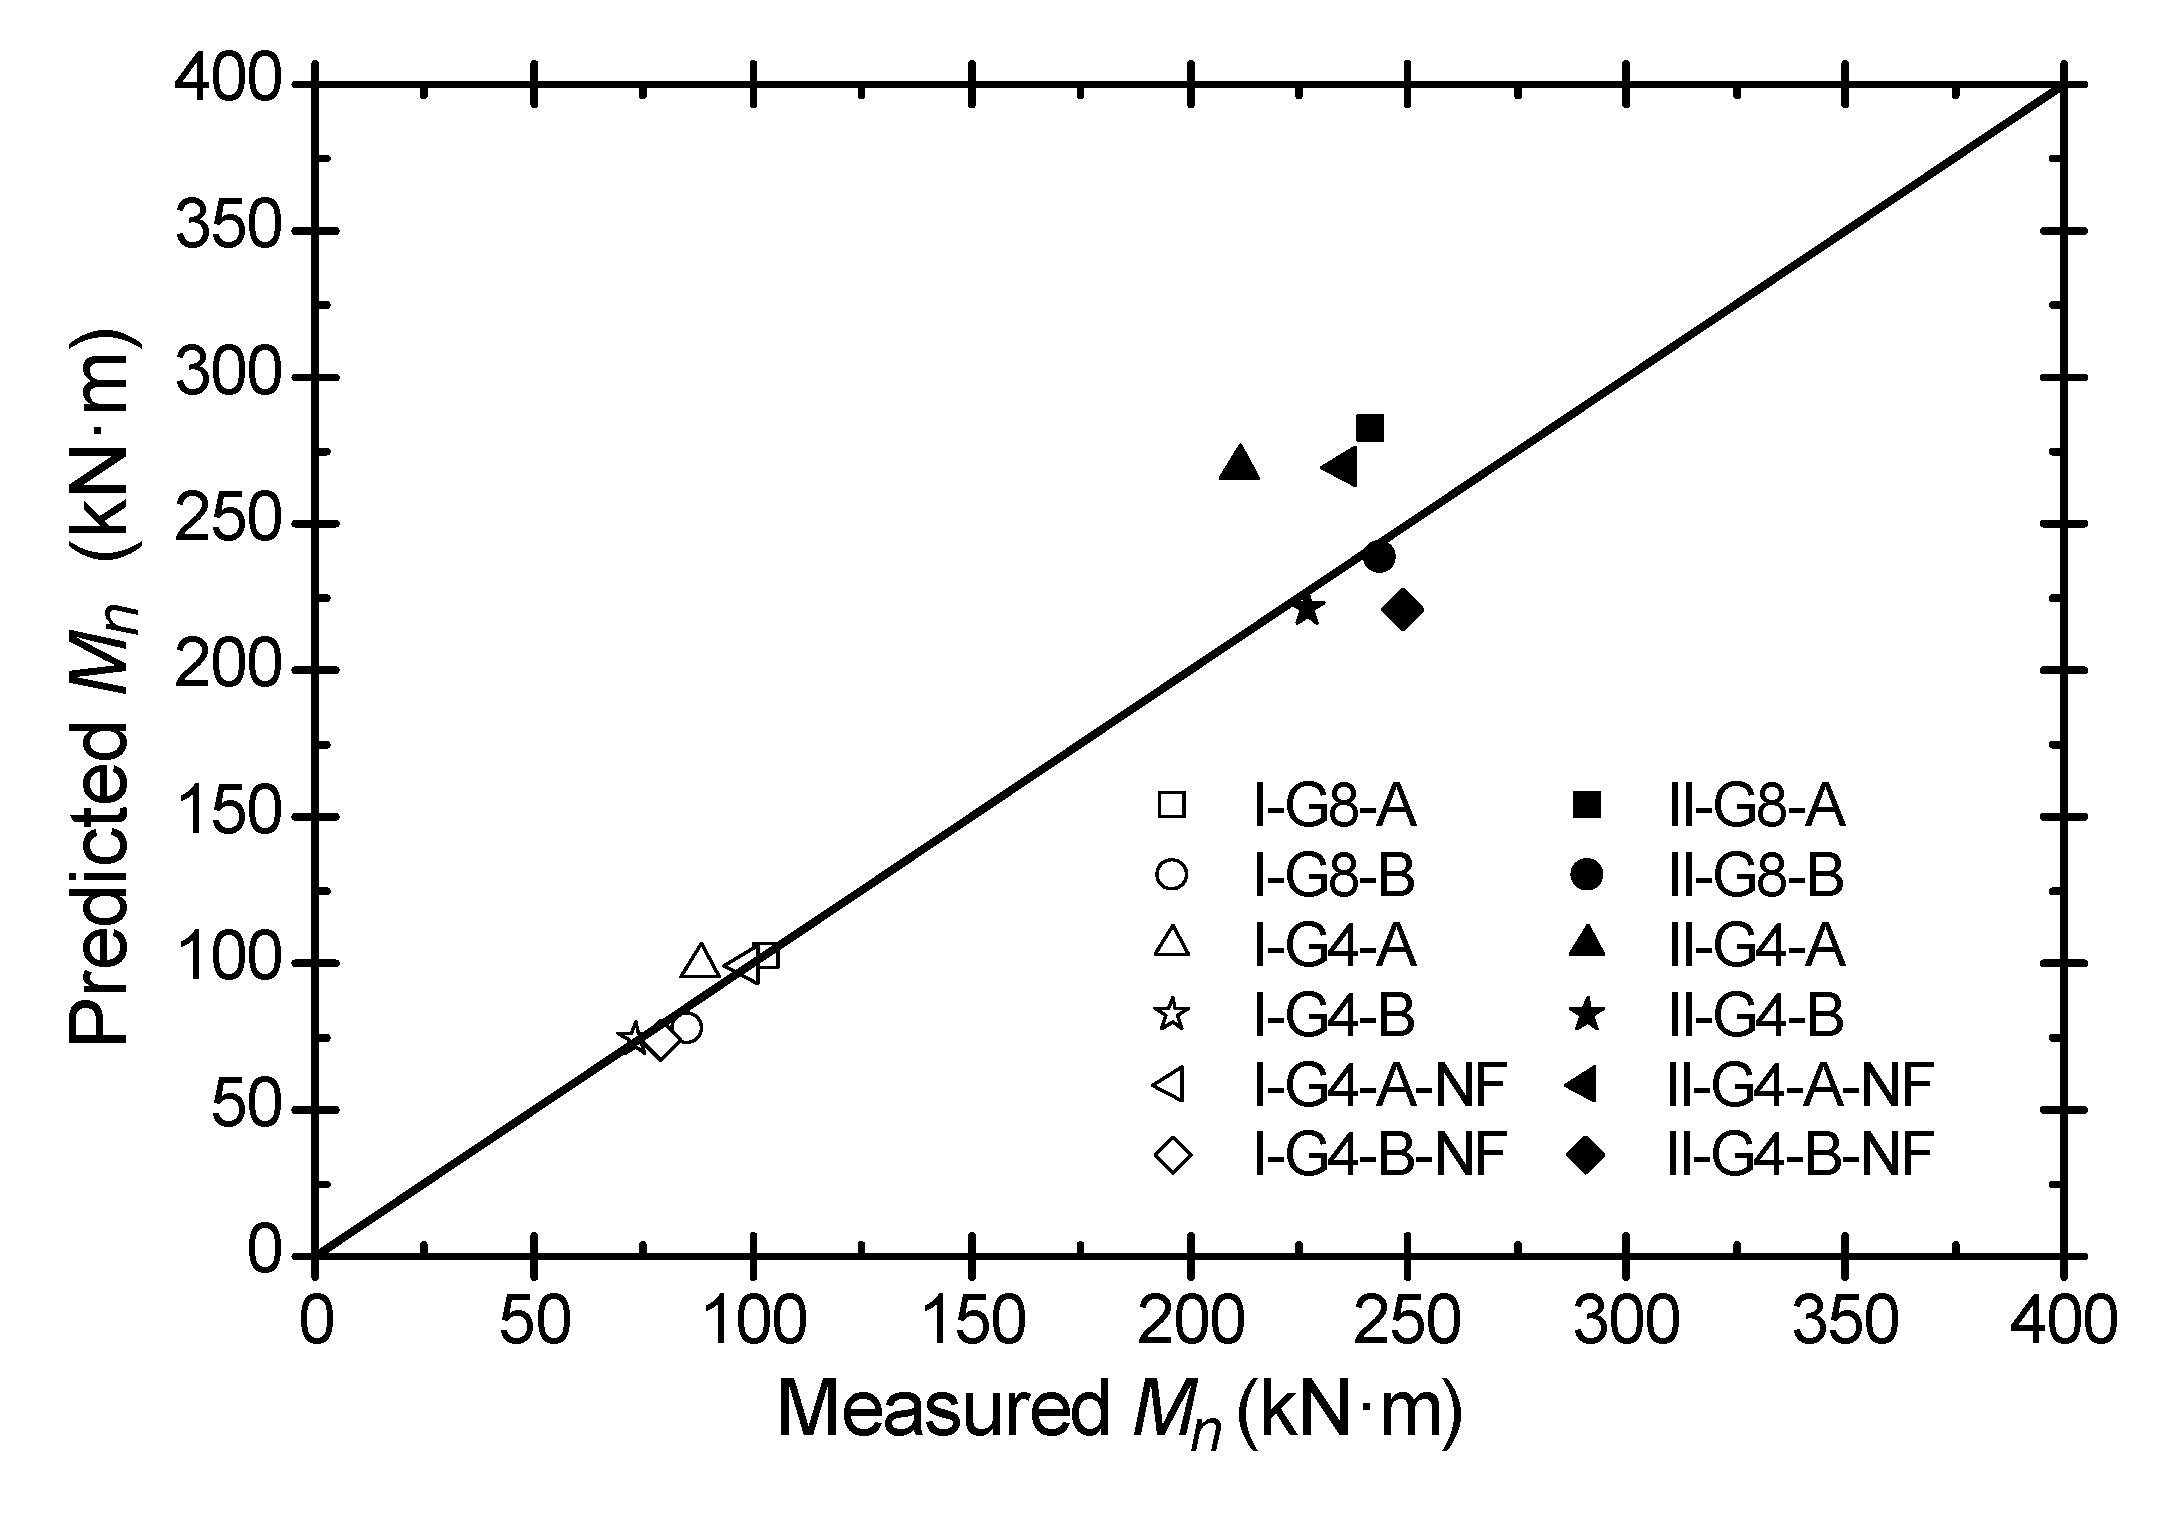
- The proposed analysis method provided excellent agreement between the experimental and analytical load-carrying capacities of the specimens, even though certain assumptions had to be made for predicting moment capacity.
- The fasteners used in the form of nails do not seem to be ideal or practical. A better solution would be the use of a U-anchorage so that the inclined shear cracking would not precipitate the debonding of the AGC beam.
Acknowledgments
Conflicts of Interest
References
- Su, R.K.L.; Zhu, Y. Experimental and numerical studies of external steel plates strengthened reinforced concrete coupling beams. Eng. Struct. 2005, 27, 1537–1550. [Google Scholar]
- Arslan, G.; Sevuk, F.; Ekiz, I. Steel plate contribution to load-carrying capacity of retrofitted RC beams. Constr. Build. Mater. 2008, 22, 143–153. [Google Scholar] [CrossRef]
- Barnes, R.A.; Baglin, P.S.; Mays, G.C.; Subedi, N.K. External steel plate systems for the shear strengthening of reinforced concrete beams. Eng. Struct. 2001, 23, 1162–1176. [Google Scholar] [CrossRef]
- Sudedi, N.K.; Baglin, P.S. External plate reinforcement for concrete beams. J. Struct. Eng. 1998, 124, 1490–1495. [Google Scholar] [CrossRef]
- Ahmed, M.; Oehlers, D.J.; Bradford, M.A. Retrofitting reinforced concrete beams by bolting steel plates to their sides. Part 1: Behavior and experiments. Struct. Eng. Mech. 2000, 10, 211–226. [Google Scholar] [CrossRef]
- Smith, S.T.; Bradford, M.A.; Oehlers, D.J. Local buckling of side plated reinforced concrete beams. II: Experimental study. J. Struct. Eng. 1999, 125, 635–643. [Google Scholar] [CrossRef]
- Su, R.K.L.; Siu, W.H.; Smith, W.T. Effects of bolt-plate arrangements on steel plate strengthened reinforced concrete beams. Eng. Struct. 2010, 32, 1769–1778. [Google Scholar] [CrossRef]
- Toutanji, H.; Deng, Y. Comparison between organic and inorganic matrices for RC beams strengthened with carbon fiber sheets. J. Compos. Constr. 2007, 11, 507–513. [Google Scholar] [CrossRef]
- Toutanji, H.; Zhao, L.; Zhang, Y. Flexural behavior of reinforced concrete beams externally strengthened with CFRP sheets bonded with an inorganic matrix. Eng. Struct. 2006, 28, 557–566. [Google Scholar] [CrossRef]
- Triantafillou, T.C.; Plevris, N. Strengthening of RC beams with epoxy bonded fiber composite materials. Mater. Struct. 1992, 25, 201–211. [Google Scholar] [CrossRef]
- Attari, N.; Amziane, S.; Chemrouk, M. Flexural strengthening of concrete beams using CFRP, GFRP and hybrid FRP sheets. Constr. Build. Mater. 2012, 37, 746–757. [Google Scholar] [CrossRef]
- Balsamo, A.; Nardone, F.; Iovinella, I.; Ceroni, F.; Pecce, M. Flexural strengthening of concrete beams with EB-FRP, SRP and SRCM: Experimental investigation. Compos. B 2013, 46, 91–101. [Google Scholar] [CrossRef]
- Etman, E.E.; Beedy, A.W. Experimental programme and analytical study of bond stress distributions on a composite plate bonded to a reinforced concrete beam. Cem. Concr. Compos. 2000, 22, 281–291. [Google Scholar] [CrossRef]
- Lee, H.K.; Hausmann, L.R. Structural repair and strengthening of damaged RC beams with sprayed FRP. Compos. Struct. 2004, 63, 201–209. [Google Scholar] [CrossRef]
- Lee, J.M.; Burgoyne, C.J. Experimental study of influence of bond on flexural behavior of concrete beams pretensioned with aramid fiber reinforced plastics. ACI Struct. J. 1999, 96, 377–385. [Google Scholar]
- Maaddawy, T.E.; Soudki, K. Strengthening of reinforced concrete slabs with mechanically-anchored unbonded FRP system. Constr. Build. Mater. 2008, 22, 444–455. [Google Scholar] [CrossRef]
- Bank, L.C. Mechanically-fastened FRP (MF-FRP): A viable alternative for strengthening RC members. In Proceedings of the Second International Conference on FRP Composites in Civil Engineering (CICE 2004), Adelaide, Australia, 8–10 December 2004; pp. 3–15.
- Woo, S.-K.; Nam, J.-W.; Kim, J.-H.J.; Han, S.-H.; Byun, K.J. Suggestion of flexural capacity evaluation and prediction of prestressed CFRP strengthened design. Eng. Struct. 2008, 30, 3751–3763. [Google Scholar] [CrossRef]
- Xue, W.; Tan, Y.; Zeng, L. Experimental studies of concrete beams strengthened with prestressed CFRP laminates. PCI J. 2008, 53, 70–85. [Google Scholar]
- Xue, W.; Tan, Y.; Zeng, L. Flexural response predictions of reinforced concrete beams strengthened with prestressed CFRP plates. Compos. Struct. 2010, 92, 612–622. [Google Scholar] [CrossRef]
- Dias, S.J.E.; Barros, J.A.O. Performance of reinforced concrete T beams strengthened in shear with NSM CFRP laminates. Eng. Struct. 2010, 32, 373–384. [Google Scholar] [CrossRef]
- Ha, G.-J.; Kim, Y.-Y.; Cho, C.-G. Groove and embedding techniques using CFRP trapezoidal bars for strengthening of concrete structures. Eng. Struct. 2008, 30, 1067–1078. [Google Scholar] [CrossRef]
- Hassan, T.; Rizkalla, S. Investigation of bond in concrete structures strengthened with near surface mounted carbon fiber reinforced polymer strips. J. Compos. Constr. 2003, 7, 248–257. [Google Scholar] [CrossRef]
- Choi, Y.; Park, I.H.; Kang, S.G.; Cho, C.G. Strengthening of RC slabs with symmetric openings using GFRP composite beams. Polymers 2013, 5, 1352–1361. [Google Scholar] [CrossRef]
- Moon, D.Y.; Sim, J.S.; Oh, H.S. Detailing considerations on RC beams strengthened with CFRP bars embedded in mortar overlay. Constr. Build. Mater. 2007, 21, 1636–1646. [Google Scholar] [CrossRef]
- Ombres, L. Flexural analysis of reinforced concrete beams strengthened with a cement based high strength composite materials. Compos. Struct. 2010, 94, 143–155. [Google Scholar] [CrossRef]
- Ann, K.Y.; Cho, C.G. Constitutive behavior and finite element analysis of FRP composite and concrete members. Materials 2013, 6, 3978–3988. [Google Scholar] [CrossRef]
- Si-Larbi, A.; Agbossou, A.; Ferrier, E.; Michel, L. Strengthening RC beams with composite fiber cement plate reinforced by prestressed FRP rods: Experimental and numerical analysis. Compos. Struct. 2012, 94, 830–838. [Google Scholar] [CrossRef]
- Khalifa, A.; Alkhrdaji, T.; Nanni, A.; Lansburg, S. Anchorage of surface mounted FRP reinforcement. Concr. Int. Des. Constr. 1999, 21, 49–54. [Google Scholar]
- American Concrete Institute (ACI) 318 Committee. Building Code Requirements for Structural Concrete (ACI 318-11) and Commentary (ACI 318R-11); American Concrete Institute (ACI) 318 Committee: Farmington Hills, MI, USA, 2011; Chapter 10; pp. 136–137. [Google Scholar]
© 2014 by the authors; licensee MDPI, Basel, Switzerland. This article is an open access article distributed under the terms and conditions of the Creative Commons Attribution license (http://creativecommons.org/licenses/by/3.0/).
Share and Cite
Hong, K.-N.; Cho, C.-G.; Lee, S.-H.; Park, Y. Flexural Behavior of RC Members Using Externally Bonded Aluminum-Glass Fiber Composite Beams. Polymers 2014, 6, 667-685. https://doi.org/10.3390/polym6030667
Hong K-N, Cho C-G, Lee S-H, Park Y. Flexural Behavior of RC Members Using Externally Bonded Aluminum-Glass Fiber Composite Beams. Polymers. 2014; 6(3):667-685. https://doi.org/10.3390/polym6030667
Chicago/Turabian StyleHong, Ki-Nam, Chang-Geun Cho, Swoo-Heon Lee, and Yeonho Park. 2014. "Flexural Behavior of RC Members Using Externally Bonded Aluminum-Glass Fiber Composite Beams" Polymers 6, no. 3: 667-685. https://doi.org/10.3390/polym6030667