Threshold Particle Diameters in Miniemulsion Reversible-Deactivation Radical Polymerization


Abstract
: Various types of controlled/living radical polymerizations, or using the IUPAC recommended term, reversible-deactivation radical polymerization (RDRP), conducted inside nano-sized reaction loci are considered in a unified manner, based on the polymerization rate expression, Rp = kp[M]K[Interm]/[Trap]. Unique miniemulsion polymerization kinetics of RDRP are elucidated on the basis of the following two factors: (1) A high single molecule concentration in a nano-sized particle; and (2) a significant statistical concentration variation among particles. The characteristic particle diameters below which the polymerization rate start to deviate significantly (1) from the corresponding bulk polymerization, and (2) from the estimate using the average concentrations, can be estimated by using simple equations. For stable-radical-mediated polymerization (SRMP) and atom-transfer radical polymerization (ATRP), an acceleration window is predicted for the particle diameter range, . For reversible-addition-fragmentation chain-transfer polymerization (RAFT), degenerative-transfer radical polymerization (DTRP) and also for the conventional nonliving radical polymerization, a significant rate increase occurs for . On the other hand, for the polymerization rate is suppressed because of a large statistical variation of monomer concentration among particles.1. Introduction
With the advent of reversible-deactivation radical polymerization (RDRP), the characteristics of living polymerization can be introduced to radical polymerization, creating novel possibilities to produce well-defined polymers, such as narrow distributed, end-functionalized, block, star, and dendritic polymers. A significant number of papers are being published these days for various types of RDRPs. The RDRPs include stable-radical-mediated polymerization (SRMP) such as nitroxide-mediated polymerization, atom-transfer radical polymerization (ATRP), reversible-addition-fragmentation chain-transfer polymerization (RAFT), and degenerative-transfer radical polymerization (DTRP). The experimental and theoretical investigations conducted for these types of RDRPs in bulk [1,2] and also in a dispersed system [3-5] have been summarized in review articles.
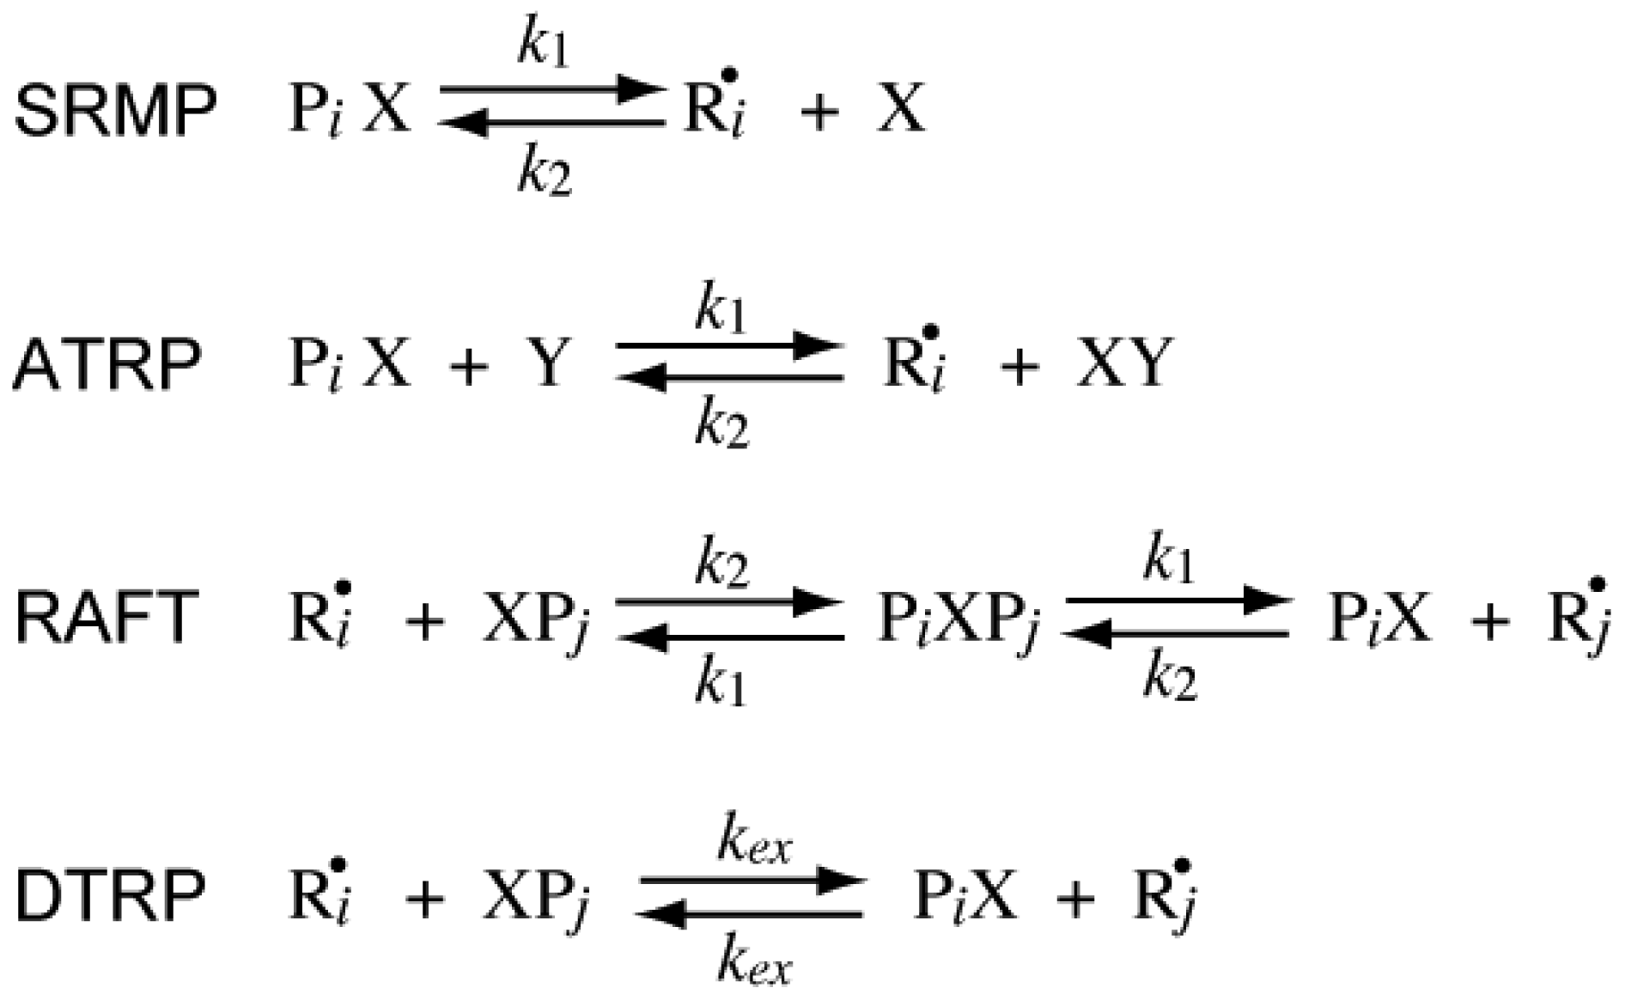
The reversible deactivation reactions for various types of RDRPs are shown in Figure 1. In SRMP and ATRP, an active radical is protected from termination reactions by reversible capping with a trapping agent, reducing the frequency of bimolecular termination. On the other hand, in RAFT it is not required to reduce the frequency of bimolecular termination, and the pseudo-livingness is attained if an active radical is transferred to a large number of chains before finally being stopped by bimolecular termination. The DTRP could be considered as a special case of RAFT with k1→∞. In an ideal DTRP, the polymerization rate is the same as the conventional nonliving free radical polymerization without using the chain transfer agent.
When the conventional nonliving free-radical polymerization is conducted in a dispersed system, typically for Dp < 100 nm, the polymerization rate increases significantly by reducing the particle size. Fundamental knowledge on how the particle size changes the polymerization rate in comparison with the corresponding bulk polymerization is important for the development of emulsion polymerization processes of RDRPs.
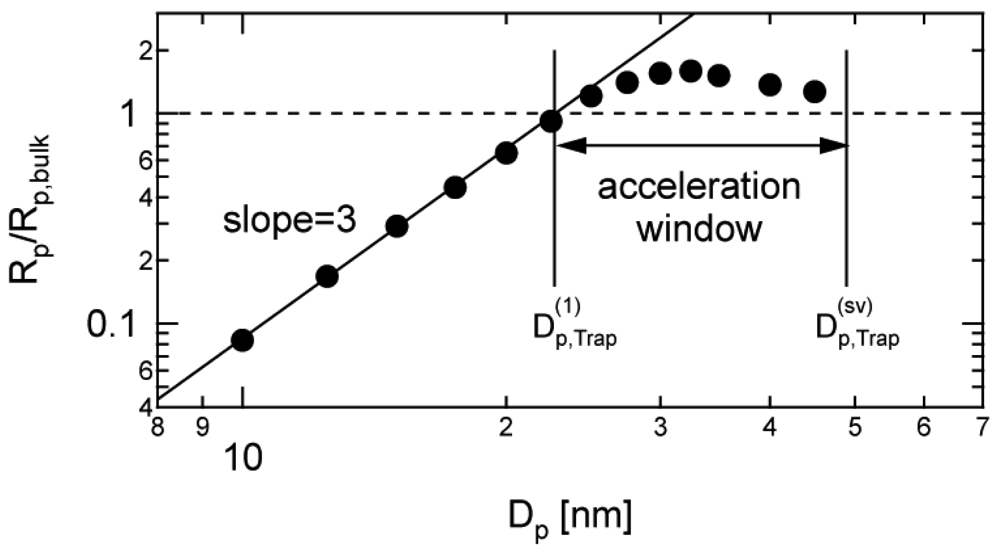
In RDRPs, there are important characteristic particle diameters in miniemulsion polymerization below or above which the polymerization rate changes with the particle size. For SRMP and ATRP, theoretical calculation results have shown that a particle size region may exist in which the polymerization rate is larger than bulk polymerization [6-14], which was named the acceleration window [10]. Figure 2 shows a typical example. As shown in the figure, there are two important threshold diameters in this reaction system, represented in this article by and .
In RAFT, it is known that the rate retardation occurs by increasing the RAFT concentration. Monteiro and Brouwer [15] proposed a cross-termination between propagating and adduct radical, i.e., between R• and PXP. This intermediate termination model usually leads to a large value of k1, namely, a very small intermediate time, t̅PXP = 1/k1. On the other hand, Barner-Kowollik et al. [16] attributed the retardation to the slow fragmentation of adduct radicals (slow fragmentation model), and a small k1-value that could be about 106 times smaller than the intermediate termination model might be obtained even for the same set of experimental data for a bulk polymerization [17,18]. It is very difficult to discriminate these two types of models only from the bulk polymerization data [19,20].
On the other hand, these two types of models can be discriminated in a straightforward manner by using the miniemulsion polymerization. The IT model leads to show that the polymerization rate increases significantly for Dp smaller than , while with the SF model the polymerization rate is essentially unchanged with the particle size [9,13,21]. Recently, this simple discrimination method is applied experimentally [22], and concluded that the IT model applies for the dithiobenzoate mediated styrene polymerization.
The threshold diameter below which the polymerization rate increases significantly by reducing the particle size , for DTRP and the conventional nonliving free-radical polymerization, where the intermediate PXP does not exist, can also be determined similarly with [21].
Another characteristic particle diameter may exist for RAFT, together with DTRP and the conventional nonliving free-radical polymerization (FRP), below which the miniemulsion polymerization rate may become smaller than that predicted by using the average concentrations [23].
In this article, all of the above characteristic particle diameters for various types of RDRPs are represented by simple equations in a unified manner, based on the characteristic polymerization rate expression for the RDRPs, Rp = kp[M]K[Interm]/[Trap].
2. Polymerization Rate Expression
2.1. Bulk Polymerization Rate
The rate of free-radical polymerization (FRP), including the RDRP, is represented by:
For the calculation of the polymerization rate, Equation (1) is convenient to use. On the other hand, because Equation (1) does not involve concentrations of characteristic components shown in Figure 1, Equation (1) is not suitable for the prediction and control of the RDRPs, based on the reaction mechanism. Unique representation of Rp for RDRP, Rp = kp[M]K[Interm]/[Trap] can be obtained as follows [13].
In order for the pseudo-living condition to be valid, the deactivation rate Rdeact must be much larger than the bimolecular termination of active radicals Rt, i.e., Rdeact ≫ Rt. If not, a large amount of dead polymer chains are formed. Similarly, if the initiation reaction RI is involved, the activation reaction in RDRP Ract must be much larger than RI, i.e., Ract ≫ RI.
As long as the active period is short enough, the polymerization rate is given by the product of the radical generation rate (RRG) and the average number of monomeric units added during a single active period (Lν).
Equation (2) is usually valid also for the conventional nonliving FRP, where RRG = RI and Lν is equal to the kinetic chain length, ν. In RDRP, the active period is much shorter than the conventional nonliving FRP because of the fast deactivation reaction, and the validity of Equation (2) is guaranteed.
For RDRPs, RRG and Lν are represented by:
For instance, RRG = k1[PX] and Lν = kp[M]/(k2[X]) in SRMP. In general, the polymerization rate of RDRP is given by:
The terms, K, [Interm], and [Trap] used in Equation (5) are summarized for SRMP, ATRP, and RAFT in Table 1. For ATRP, Equation (5) was already shown in [2].
Validity of Equation (5) to SRMP, ATRP, and RAFT was confirmed by using various kinetic parameters [13].
Equation (5) may appear that the termination reaction does not affect the polymerization rate, but it is not so. For example, in SRMP and ATRP, a single termination event leaves two additional trapping agents, leading to the increase of [Trap], resulting in a smaller polymerization rate. For TEMPO-mediated styrene polymerization, it is known that the active radical concentration is represented by [24,25]. This equation conforms to Equation (5), provided RI is not too small. The quantitative discussion on this problem can be found in [26,27].
2.2. Polymerization Rate in Dispersed Systems
The polymerization rate of the ith polymerization loci, Rp, i is given by:
The overall polymerization rate is given by:
In Equation (8), N is the total number of reaction loci, and V represents the total volume of the reaction loci, i.e., .
For instance, considering SRMP, RRG is the radical generation rate through the activation reaction, and RRG,i = k1[PX]i. On the other hand, Lν,i is the average number of monomeric units added during a single active period, and therefore, given by:
Note that the chains are formed only during the active period, and therefore, the trapping agent concentration must be that during the active period. The difference of [Trap]Act,i and [Trap]i is important in miniemulsion SRMP and ATRP. In SRMP and ATRP, [Interm] ≫ [Trap], and therefore, the number of trapping agents in a particle could be very small, and in a small reaction locus, there may exist a long time period for which no active radicals exist. When the activation reaction occurs to generate a radical, one trapping agent is formed. This difference of one molecule of trapping agent could be important in a nano-sized particle.
In general, the polymerization rate in dispersed system is given by:
Note for SRMP and RAFT, Ki is simply a constant, and K does not have to be included inside the brackets, 〈 〉.
In the conventional theoretical treatment, the average concentrations are used. When the average concentrations are used without accounting for the statistical variation of concentrations:
Theoretically, the average concentration approximation applies to the following two cases: (1) Negligible statistical concentration variation among particles; (2) The numerator terms, Ki, [M]i, and [Interm]i have statistical variation among particles, but there are no correlations with other terms.
For example, suppose the statistical variation of [Interm]i is significant but the variations of Ki, [M]i, and [Trap]i are negligible, the average method given by Equation (12) still works. On the other hand, if both [M]i and [Interm]i have correlation and statistical variation, Equation (12) cannot be used. Another case where Equation (12) is invalid is the cases where the statistical variation of [Trap]i that exists in the denominator is significant. This is because of a simple mathematical principle, i.e., the average of the inverse is always larger than the inverse of the average [10,13,14].
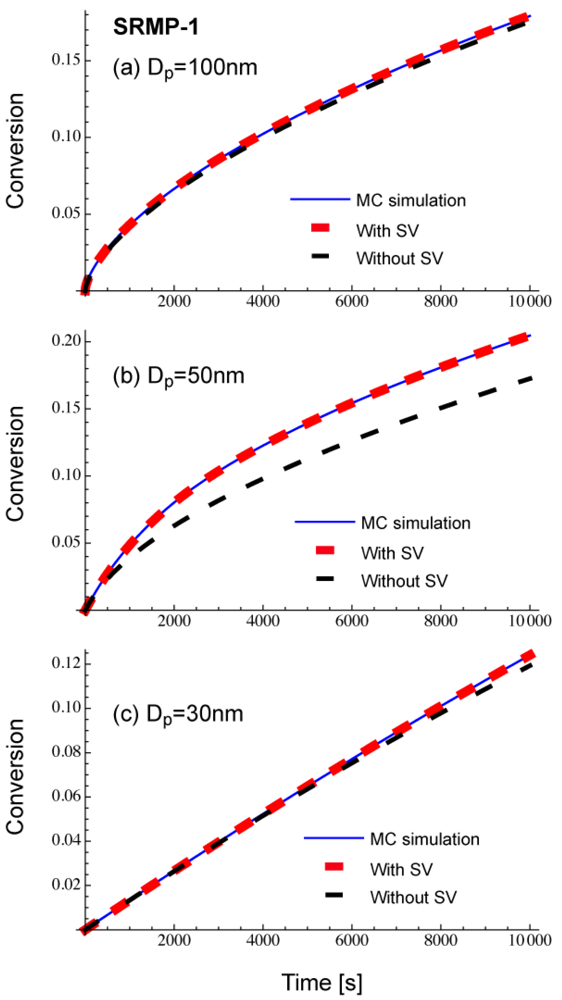
Figure 3 shows comparison of Equations (11) and (12), with the Monte Carlo (MC) simulation result for a miniemulsion polymerization of SRMP. Uniform particles are assumed for the calculation. The set of parameters is named SRPM-1, and the parameters are: k1 = 2 × 10⁻³ s−1, k2 = 1 × 10⁸ L mol −1 s−1, kp = 2 × 10³ L mol −1 s−1, kt = 1 × 10⁸ L mol −1 s−1, [M]0 = 8 mol L −1, [PX]0 = 0.04 mol L −1, and [X]0 = 0. This condition is the same as that for SFRP-1 used in [13], and more detailed kinetic behavior in bulk and miniemulsion polymerization can be found therein. Note that the termination rate constant, kt is defined by Rt = kt[R•]2, not Rt = 2kt[R•]2. The MC calculation method used in this article is described in [9]. When applying Equations (11) and (12), [M]i, [PX]i, and [X]i are determined by the MC simulation, and the monomer conversion to polymer, x is obtained by the integration of Equations (11) and (12).
As shown in Figure 3, Equation (11) that accounts for the statistical variation agrees completely with the MC simulation results. On the other hand, when Equation (12) that does not account for the statistical variation of concentrations is used, clear deviation is observed for Dp = 50 nm, while the prediction from Equation (12) could be a reasonable approximation for Dp = 100 nm and 30 nm. Figure 3 shows there exists a particle size region for an SRMP in which the statistical variation among particles is vital. This region corresponds to the acceleration window observed for SRMP and ATRP [10,13,14].
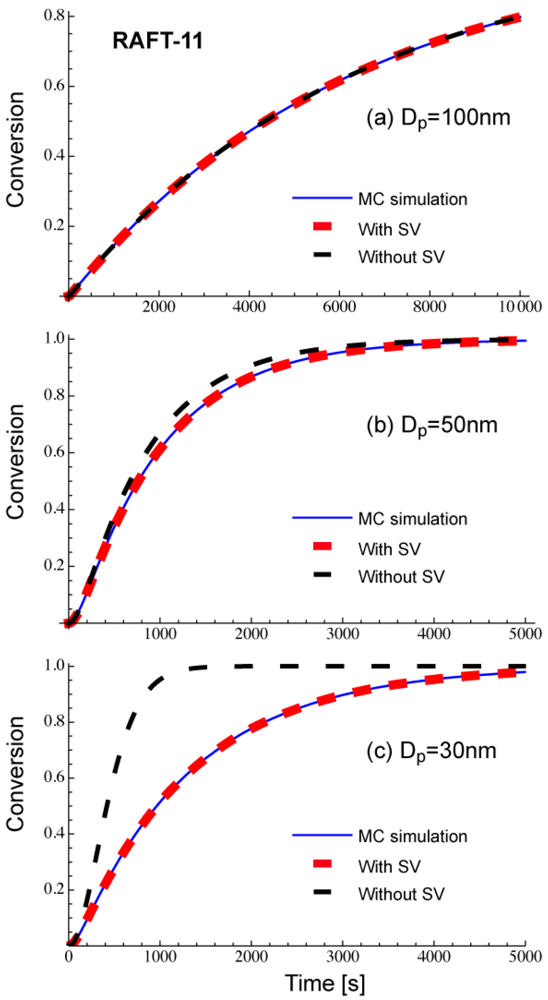
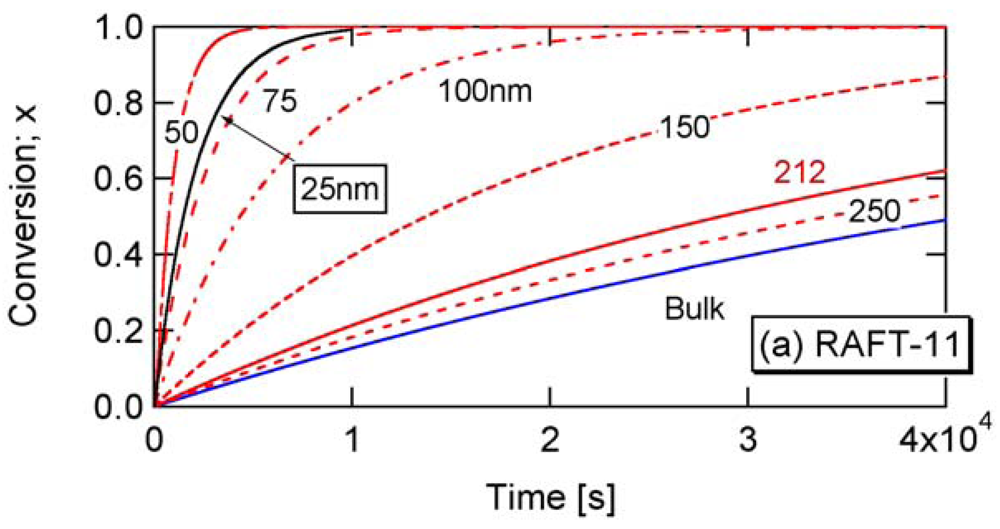
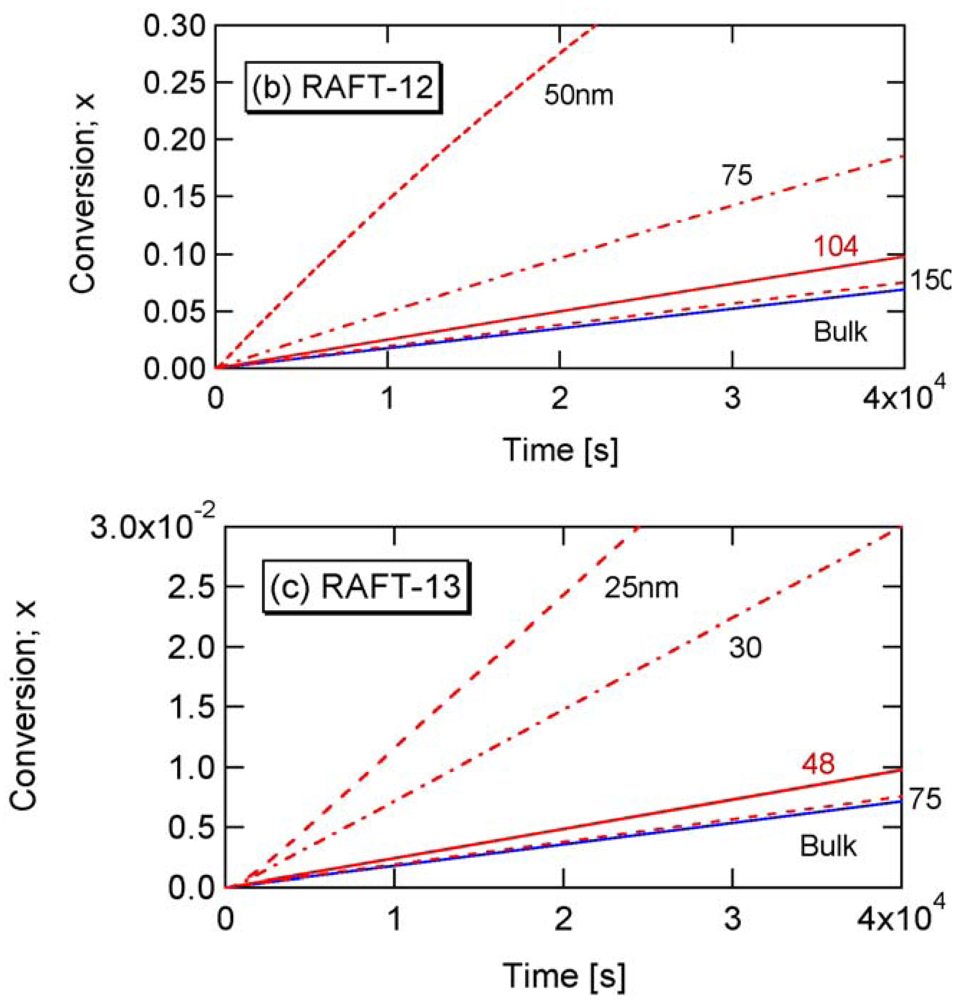
Figure 4 shows comparison of Equations (11) and (12), with the Monte Carlo (MC) simulation results for a miniemulsion polymerization of RAFT. The kinetic parameters used here are RAFT-11 shown in Table 2. The characteristics of parameters used are discussed in Section 3.2. Again, Equation (11) that accounts for the statistical variation of the concentrations of the components among particles agrees perfectly with the MC simulation results. The average concentration method represented by Equation (12) shows clear deviation for smaller particle sizes. For Dp = 30 nm, use of the average concentrations leads to overestimate the polymerization rate very significantly.
The characteristic particle diameter below which the effect of statistical variation becomes significant will be represented by , and simple equations to determine the -values will be presented later in Section 4. For SRMP and ATRP, corresponds to Dp,Fluct in the earlier publications [10,13,14]. On the other hand, however, before discussing the statistical variation effect, consider a much simpler problem, that the concentration of a single molecule may become very high in a nano-sized reaction locus.
3. Effect of High Single-Molecule Concentration inside Small Polymerization Locus
Basically, even when a reaction medium is separated into small reaction loci, the concentration does not change. However, this statement requires a premise that each reaction locus contains a large number of molecules. When the number of molecules of a given component in a reaction locus is small, the statistical variation becomes significant, and the concentration is not the same for all reaction loci. When the volume of reaction locus is further decreased, some reaction loci contain only a single molecule of a component, while the other loci do not contain the component at all. The reaction loci that contain a single molecule may show unusually high concentration compared with the bulk system.
This is the reason for showing extremely high polymerization rate in the zero-one kinetics [28] of conventional emulsion polymerization. Some polymer particles contain a single radical, while the others not, but the particles having a radical shows an unusually high radical concentration, leading to a high polymerization rate. Table 3 shows the concentration of a single molecule in a particle. The radical concentration of [R•] = 3.18 × 10⁻⁶ mol L−1 for Dp = 100 nm could be significantly higher than that in bulk polymerization.
Conventionally, the rate increase in emulsion polymerization is explained by the segregation of radicals, i.e., by separating radicals into different particles, the termination reactions between the radicals located in different particles are prohibited and the apparent (overall) termination rate constant decreases, leading to a higher radical concentration. However, remarkable rate increase is observed when the zero-one kinetics is valid, and one can practically estimate the particle size below which a significant rate increase is observed for the conventional nonliving FRP, based on the high single-molecule concentration effect, as shown in the appendix of [21].
Now, look at the fundamental polymerization rate expression, Equation (5). For SRMP and ATRP, [Trap] ≪ [Interm], and [Trap] in a small particle may become larger than that in bulk. Because the denominator term, [Trap] becomes larger, it is expected that the polymerization rate becomes smaller when the particle size is decreased. On the other hand, for many RAFT systems, [Interm] ≪ [Trap], and [Interm] in a small particle may become larger than that in bulk. Because [Interm] is a numerator term, it is expected that the polymerization rate becomes larger by making the particle size smaller.
3.1. Cases with [Trap] ≪ [Interm]—SRMP and ATRP
For the cases with [Trap] ≪ [Interm], the concentration of a single trapping agent in a small particle may become larger than in the corresponding bulk polymerization. Therefore, Equation (5) states that the polymerization rate may become smaller than in bulk polymerization.
SRMP and ATRP fall into this category. In the reversible reactions shown in Figure 1, when an active radical is generated by the activation reaction, one trapping agent always coexists. If the exit of this trapping agent is neglected, at least one trapping agent always exists during the active period. On the other hand, when this trapping agent exits from the particle, the polymerization is not controlled, and usual free-radical polymerization occurs. However, in the present discussion, I consider the cases where RDRP is well controlled.
The concentration of a single molecule in a particle with diameter Dp is given by , where NA is the Avogadro constant. When this concentration is equal to the trapping agent concentration in the corresponding bulk polymerization, the polymerization rate would be equal to that in bulk polymerization, given all the other conditions are the same. The particle size below which the polymerization rate becomes smaller than in the corresponding bulk polymerization, is given by:
The lower limit of the acceleration window shown in Figure 2 was determined by using Equation (13). The equation to determine the upper limit of the acceleration window, will be introduced in Section 4.1.
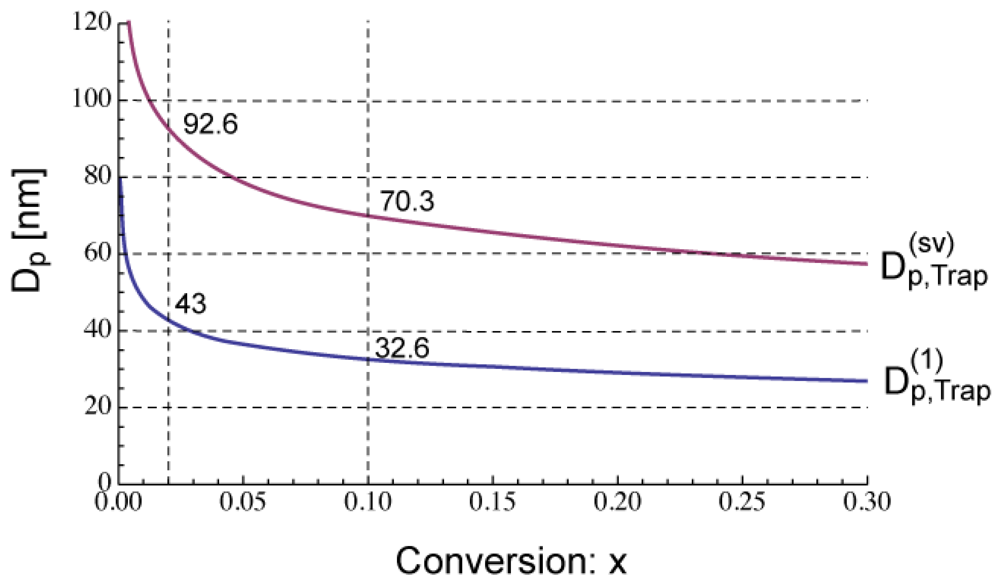
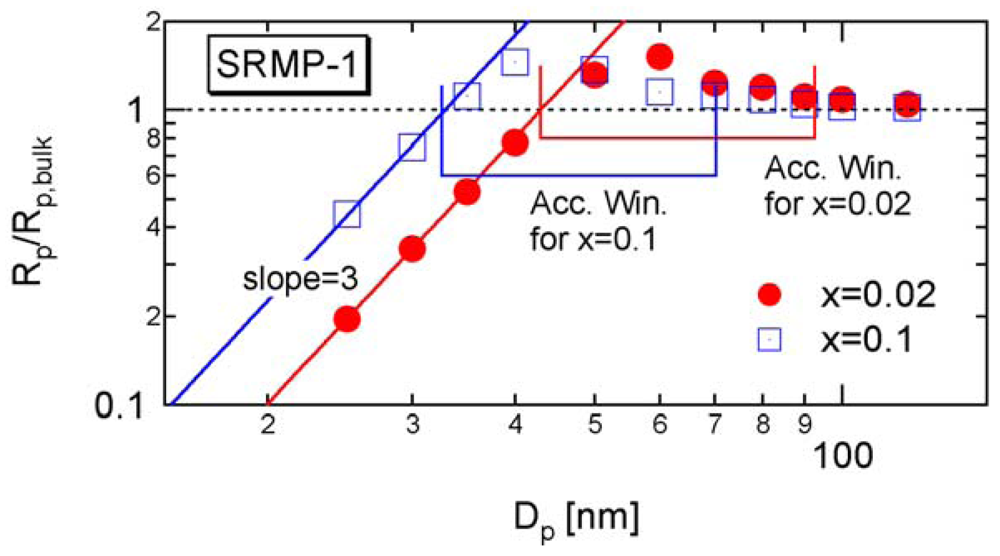
Figure 5 shows the calculated development of during polymerization under the condition SRMP-1, whose conversion development was shown in Figure 3. The -value decreases because [Trap]bulk increases with time. In Figure 5, the -value whose equation will be shown in Section 4.1 is also shown. The acceleration window at conversion, x = 0.02 is predicted to be Dp = 43–92.6 nm, and that at x = 0.1 is Dp = 32.6–70.3 nm.
Figure 6 shows the miniemulsion polymerization rate of SRMP-1 at x = 0.02 and 0.1 for various particle diameter, Dp. The polymerization rate was calculated by the MC simulation as follows. The concentrations at x = 0.02 and 0.1 in each particle are first determined by the MC simulation, and then Equation (11) is used to obtain the polymerization rate, Rp. The lower limit of the acceleration window, agrees perfectly. Because the concentration of a single trapping agent is in inverse proportion to .
Excellent agreement of with the lower limit of the acceleration window for other SRMP conditions can also be found in [10,13], and for ATRP in [13,14].
3.2. Cases with [Interm] ≪ [Trap]—RAFT
For the cases with [Interm] ≪ [Trap], the concentration of a single intermediate molecule in a small particle may become larger than in the corresponding bulk polymerization. Therefore, Equation (5) states that the polymerization rate may become larger than in bulk polymerization, given all other terms are essentially the same. Many RAFT polymerization systems may fall into this category.
Suppose that the average number of radicals in a particle for the conventional nonliving FRP using the same monomer but without using RAFT agent is given by n̅. In the case of RAFT polymerization, the active radical experiences deactivation-activation cycle shown in Figure 1 repeatedly, and therefore, the sum of the numbers of R• and PXP would be, at least approximately, equal to n̅, i.e., n̅ = n̅R• + n̅PXP.
The time fraction of the active period during the deactivation-activation cycle, ϕA is given by:
Using the ϕA-value, the average number of the intermediate molecule in a particle, n̅PXP is represented by t̅PXP = n̅(1 – ϕA). Therefore, the effective intermediate concentration in a particle with diameter Dp is given by . When this PXP concentration is larger than in the corresponding bulk polymerization, the polymerization rate is larger than in bulk polymerization. The particle size below which the polymerization rate becomes larger than in the corresponding bulk polymerization, is given by:
Strictly, the particle size dependency of n̅ needs to be accounted for. However, because the drastic increase in the polymerization rate by decreasing the particle size is observed, essentially for the zero-one condition in the conventional nonliving FRP where the time fraction in which more than one radical exists in a particle can be neglected. To roughly estimate the -value, one can use the n̅-value of the zero-one condition for the corresponding nonliving FRP. For example, if the exit of a radical from the particle can be neglected, n̅ = 0.5 can be used. Because the acceleration normally starts to be observed slightly before the system reaches the zero-one condition, use of n̅-value of the zero-one condition underestimate the -value. However, considering the experimental errors, this estimate would provide a useful pointer for the design of RAFT miniemulsion polymerization processes.
The parameters shown in Table 2 in Section 2.2 are used in the present RAFT investigation. RAFT-11 is a typical example of the intermediate termination (IT) model that involves cross-termination between a propagating R• and an intermediate adduct radical PXP, whose rate constant is represented by kct. For RAFT-12 and -13, k1 is made smaller, and the average intermediate time t̅PXP becomes larger. A larger frequency of cross-termination is expected for RAFT-12 and -13. On the other hand, RAFT-01 is a typical example of the slow fragmentation (SF) model, and it takes as large as t̅PXP = 1/k1 = 2 s for a PXP molecule to generate a radical. These parameters are used also in the earlier articles [13,21], and detailed kinetic behavior of these reaction conditions can be found therein. As shown in Figure 2 of [22], the model discrimination of RAFT-11 and RAFT-01 based on the bulk polymerization data is difficult.
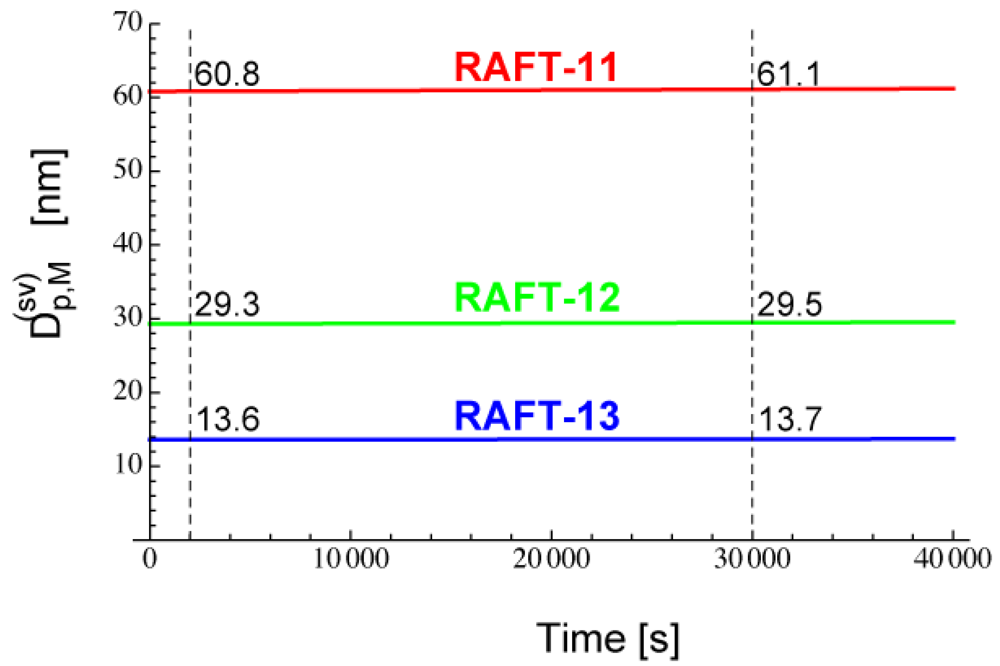
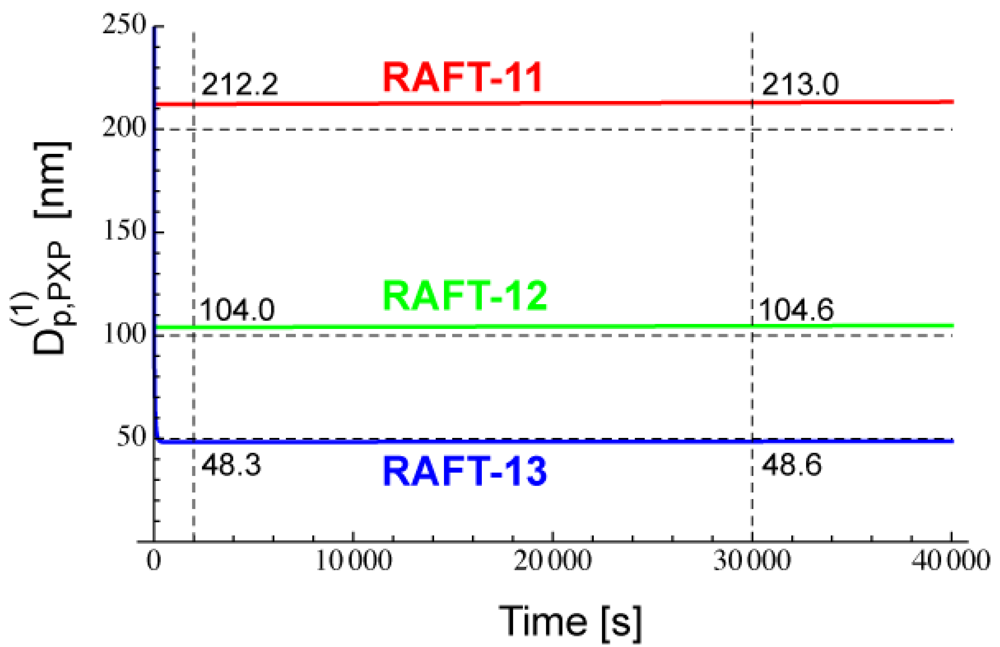
Figure 7 shows the calculated -values for RAFT-11, -12, and -13. The -value reaches a nearly constant value in a very short period of time, because [PXP]bulk reaches an equilibrium rapidly.
Figure 8 shows the conversion development of the RAFT miniemulsion polymerization with various particle sizes for RAFT-11, -12, and -13. Significant acceleration is observed for . Note that the polymerization rate of Dp = 25 nm in RAFT-11 is smaller than that for Dp = 50 nm. This is due to the statistical variation effect, which will be discussed in detail in Section 4.2.
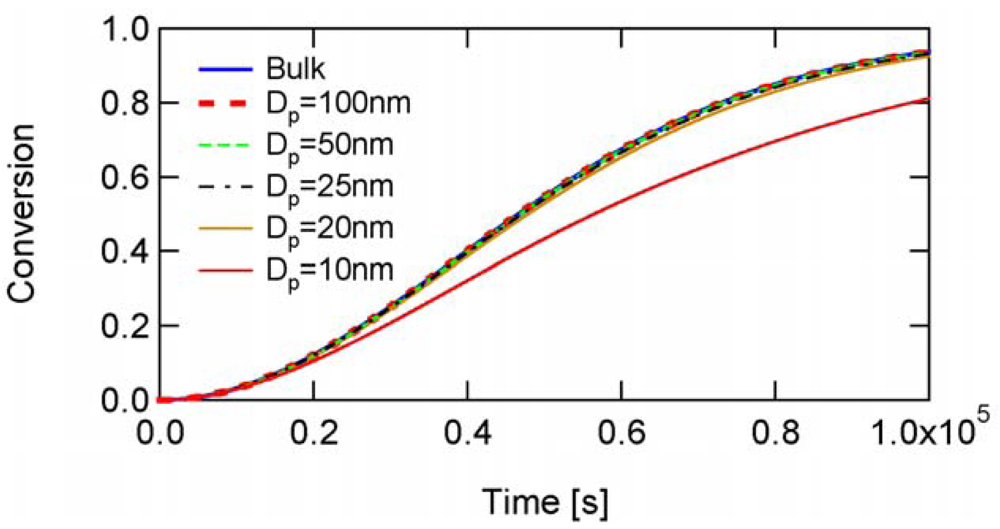
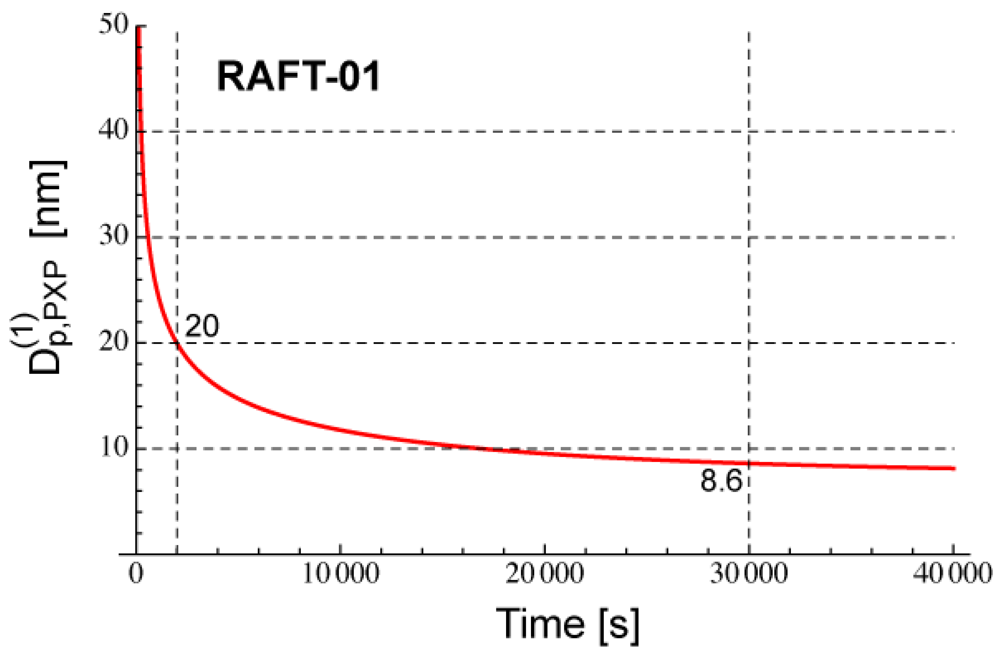
Figure 9 shows the calculated development of RAFT-01, which is a typical example of the SF model without the cross-termination. In this case, k1 is very small and t̅PXP is large enough, therefore, PXP molecules are accumulated during polymerization. [PXP]bulk is not small enough, and therefore, -value is too small for the real miniemulsion polymerization.
Figure 10 shows the conversion development of the RAFT miniemulsion polymerization with various particle sizes for RAFT-01. The polymerization rate is essentially unchanged down to Dp = 20 nm. At Dp = 10 nm on the other hand, the polymerization rate slows down rather than the acceleration. As will be discussed in Section 4.2, this deceleration is due to the statistical variation effect.
Equation (15) was developed on the basis of the intermediate concentration, using Equation (5) as the fundamental rate expression. On the other hand, if one focuses the attention to the active radical concentration, by using Equation (1) as the fundamental rate expression, one obtains the following representation of the threshold diameter, which is equivalent to Equation (15).
The derivation of Equation (16) is shown in the appendix of [21]. Equation (16) is useful especially for DTRP and conventional nonliving FRP, where the intermediate molecule is not involved.
4. Effect of Large Statistical Concentration Variation among Polymerization Loci
As discussed in Section 2.2, the statistical variation of the component molecules in a particle must be accounted for, and Equation (11) needs to be used. The use of the average concentrations, i.e. Equation (12) may underestimate the polymerization rate, as shown in Figure 3(b), or overestimate as in the cases of Figure 4(b,c).
For the cases with [Trap] ≪ [Interm], the statistical variation of the trapping agent concentration in a particle may not be neglected. Because [Trap] resides in the denominator in the rate expression shown by Equation (11), the use of the average concentrations leads to underestimate the polymerization rate. This is due to a simple mathematical relationship, 1/〈[Trap]Act,i〉 ≤ 〈1/[Trap]Act,i〉. For the cases with [Interm]≪[Trap], the statistical variation of the intermediate concentration in a particle may not be neglected. On the other hand, however, if [Interm] is the only term to fluctuate, the average concentration still applies because [Interm] resides in the numerator of Equation (11). On the other hand, if the fluctuation of [Interm] correlates, for example, with [M], the statistical variation must be accounted for.
4.1. Cases with [Trap] ≪ [Interm]—SRMP and ATRP
In usual SRMP and ATRP, the relationship [Trap] ≪ [Interm] holds, and therefore, the polymerization could be accelerated because of the statistical variation of [Trap]. If [Trap] is the only term to have significant fluctuation, Equation (11) reduces to:
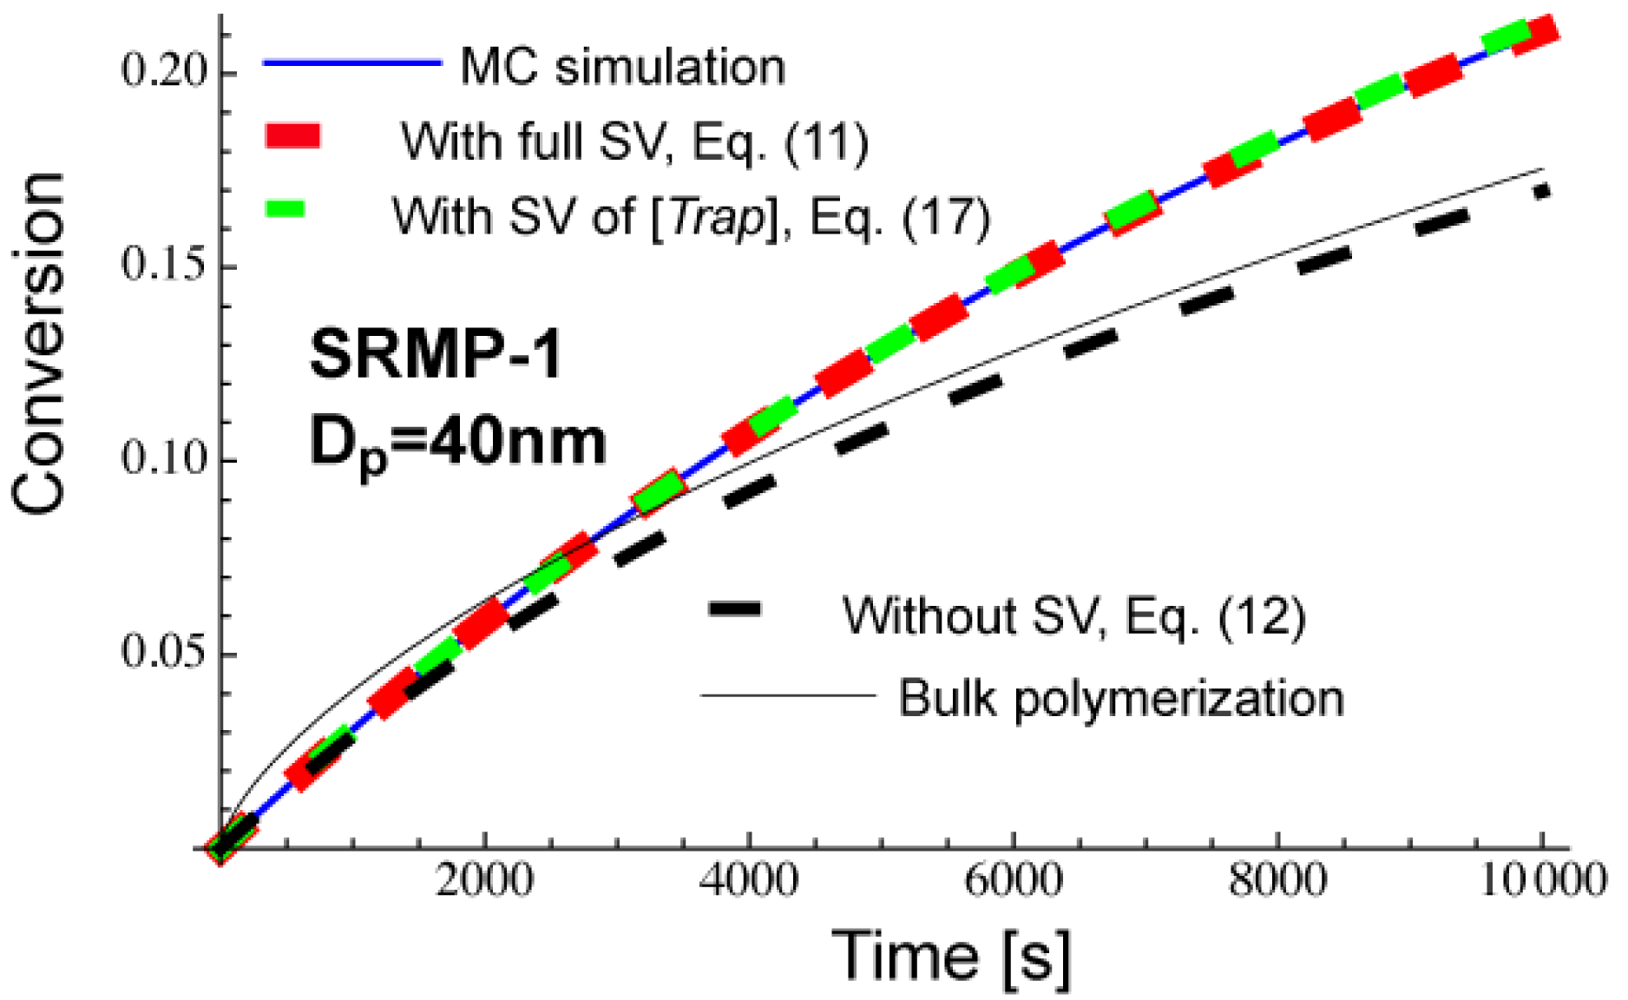
Figure 11 shows calculated conversion development of a miniemulsion polymerization, SRMP-1 with Dp = 40 nm. The parameters used are the same as for Figures 3 and 5, and can be found in the text before Figure 3. Equation (11) that accounts for the full statistical variation of all components agrees completely with the MC simulation results. Equation (17) that accounts for only the statistical variation of [Trap]Act,i agrees very well with the MC, and it can be concluded that the fluctuation of [Trap]Act,i is dominant in the present reaction system.
As was shown in Figure 5, Dp = 40 nm is smaller than at the earlier stage of polymerization, and therefore, the miniemulsion polymerization shows lower conversion than in bulk in the beginning of polymerization, as shown in Figure 11. On the other hand, Dp = 40 nm stays in an acceleration window of Figure 5, and the polymerization is faster for the miniemulsion polymerization in the later stage of polymerization. The use of average concentrations, Equation (12) shows smaller polymerization rate than in bulk. This is because 〈[Trap]Act,i〉 > [Trap]bulk, as was discussed earlier [10,14]. On the other hand, when the effect of bimolecular termination is significant in bulk polymerization, Rp,NoSV given by Equation (12) may show a faster polymerization rate than the corresponding bulk polymerization [14].
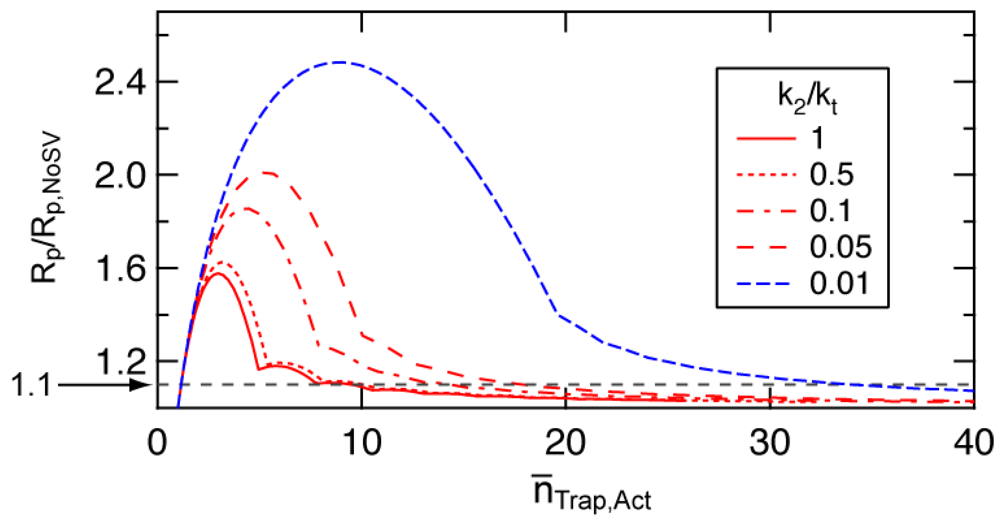
The degree of rate increase due to the fluctuation in [Trap]Act,i changes with the number distribution of the trapping agents among particles. The statistical variation would become significant when the average number of trapping agents in a particle is small. To determine an approximate value of the average number of trapping agents in a particle, below which the statistical variation effect to increase the polymerization rate becomes significant, a simple model for the approximate distribution was proposed [10]. Figure 12 shows the acceleration ratio, i.e. the polymerization rate accounting for the statistical variation (Rp) is divided by that estimated by neglecting the statistical variation (Rp,NoSV). Rp corresponds to the rate represented by Equation (17), and Rp,NoSV corresponds to Equation (12). The simplified model used for the calculation is elucidated in [10]. The x-ordinate in Figure 12 is the average number of trapping agents in a particle during active period, n̅TraP,Act.
Figure 12 shows that the acceleration due to the statistical variation of the trapping agents becomes significant when the average number of trapping agents in a particle is smaller than a certain number, The -value is a function of the ratio between the deactivation rate constant and termination rate constant, k2/kt. In SRMP and ATRP, the number of trapping agents increases by the bimolecular termination. A single bimolecular termination leads to form two extra trapping agents in a particle. Smaller k2/kt means bimolecular termination is significant, forming a larger number of trapping agents faster. Significant bimolecular termination is not suitable for the controlled RDRP, however, k2/kt-value as small as 1.24 × 10⁻³ is reported for 2,2,5-trimethyl-4-phenyl-3-azahexane-3-oxy (TIPNO)/styrene system [29]. Figure 12 shows that the acceleration is significant for smaller k 2/kt-values.
Assuming about 10% increase in polymerization is considered significant (Rp/Rp,NoSV = 1.1 shown by a broken line in Figure 12), -value is about 10 for k2/kt > 0.5, and is about 20 for k2/kt around 0.05. The -value larger than 30 is needed for k2/kt < 0.01. For the calculation condition shown in Figures 3, 5, and 6 (SRMP-1), k2/kt = 1, and is about 10.
Note the acceleration discussed in this section is in comparison with the polymerization rate without accounting for the statistical variation, represented by Equation (12), not with respect to the bulk polymerization rate. When compared with the bulk polymerization, 〈[Trap]Act,i〉 could be larger or smaller than [Trap]bulk, as was shown earlier [10,14]. For the cases with 〈[Trap]Act,i〉 > [Trap]bulk, Rp,NoSV is smaller than that in bulk, Rp,bulk, as in the case of Figure 11. Such cases are found in many good living conditions where k2/kt is large. With the activation reaction, one trapping agent is formed and this increase may make 〈[Trap]Act,i〉 > [Trap]bulk [10]. In some cases, the miniemulsion polymerization rate cannot make the polymerization rate faster compared with R p,bulk, even though Rp > Rp,NoSV.
On the other hand, with [Trap]bulk > 〈[Trap]Act,i〉, the miniemulsion polymerization rate may show larger acceleration expected from Figure 12. Such cases are found when k2/ kt is small, i.e., in a bad living condition [14]. Because the bimolecular termination is significant in bulk polymerization in such cases, the segregation of radicals into different polymer particles [6] reduces the termination frequency. Reduced termination frequency slows down the accumulation of the trapping agents in a particle. A smaller 〈[Trap]Act,i〉 leads a faster polymerization rate, resulting in the relationship, Rp,NoSV > Rp,bulk.
In order to develop a simple equation that can be used as a pointer to roughly determine the diameter below which the acceleration due to the statistical variation becomes significant let us assume The concentration of trapping agents in a particle with diameter Dp is given by Assuming this concentration is equal to [Trap]bulk. Therefore, the particle size below which the polymerization rate becomes larger because of the statistical variation effect, is given by:
The upper curve shown in Figure 5 and the upper limit of the acceleration window shown in Figure 6 are calculated by using Equation (18) with Good agreement of the upper limit of the acceleration window for the other SRMP conditions and ATRPs, including bad living conditions, can be found elsewhere [10,13,14].
4.2. Cases with [Interm] ≪ [Trap]—RAFT
In many RAFT systems, [Interm] ≪ [Trap] holds, and the statistical variation of [Interm] may become significant in smaller particles. On the other hand, however, if [Interm] is the only term to fluctuate, the average concentration still applies because [Interm] resides in the numerator of Equation (11). Therefore, the statistical variation effect would become significant when other concentration terms are significant. It was discovered that the statistical variation of monomer concentration is significant when the particle size is small with a relatively fast polymerization conditions [23]. This monomer-concentration-variation (MCV) effect applies also for DTRP and conventional nonliving FRP. Note that the MCV effect is attributed to the correlated variation of both [M] and [PXP], or [M] and [R•], as clarified in [21]. When the MCV effect is dominant, the exact miniemulsion polymerization rate expression, Equation (11) reduces to:
Specifically for RAFT, K is a constant, and therefore:
Because [XP] is large, the difference of a single molecule concentration in XP is negligible, and The validity of Equation (20) for RAFT polymerization was confirmed in [21].
With the MCV effect, the polymerization rate becomes smaller than that estimated by using the average concentrations, Rp,NoSV, i.e., Equation (12). The slower polymerization rate of Dp = 25 nm in Figure 8(a) and that of Dp = 10 nm in Figure 10 is because of the MCV effect.
In the present discussion, however, it is worth noting that the transfer of monomer molecules among particles is neglected. Especially for particles with smaller Dp's the monomer transfer may not be neglected. However, as will be discussed later, Dp-values below which the MCV effect becomes significant may not be extremely small depending on the polymerization condition. In addition, even when the monomer transfer mitigates the statistical variation, the MCV may still have a certain degree of effect to slow down the polymerization rate. The present discussion provides the minimum polymerization rate due to the MCV effect. For the ideal zero-one condition, an analytic solution of the polymerization rate was also proposed [23].
The question to be answered in this section is that how to determine the diameter, below which the polymerization rate becomes smaller than the estimate using the average concentrations, Rp,NoSV given by Equation (12).
Figure 13 shows the conversion development in each particle, obtained by the MC simulation for RAFT-11 with Dp = 50 nm. The first 5 particles simulated are shown. The conversion development is different significantly among particles, i.e., the monomer concentration differs significantly at the same reaction time.
The average time interval between radical entry for the condition shown in Figure 13 is t̅e = 254.6 s. In the present series of RAFT simulations, the radical generation rate per unit oil phase is kept constant, which corresponds to a series of experiments where the monomer/initiator ratio is kept constant.
The MCV effect is expected to be significant when the conversion increase in a particle during the time period of t̅e is significant. The average radical concentration in a particle is given by . With this radical concentration, the conversion development in a particle is given by:
The characteristic time for the conversion development, t̅ or the relaxation time is given by:
On the other hand, the average time between radical entry, t̅e is given by:
Therefore, the characteristic particle diameter below which the MCV effect is significant, would be obtained from the relationship, t̅ = at̅e, where a is a constant, or:
Equation (24) leads to obtain:
To determine the a-value, first consider the conventional nonliving FRP. Figure 14 shows the conversion development of the conventional nonliving FRP with various particle sizes, obtained from the MC simulation. The parameters used are the same as RAFT-11 in Table 2, except that the RAFT agent is not used here. At Dp = 25 nm, the MCV effect is so significant that the polymerization rate is smaller than that for Dp = 50 and 100 nm.
The miniemulsion polymerization rate is determined from the MC simulation data, using the following equation:
On the other hand, if the statistical variation effect is neglected, the polymerization rate is given by:
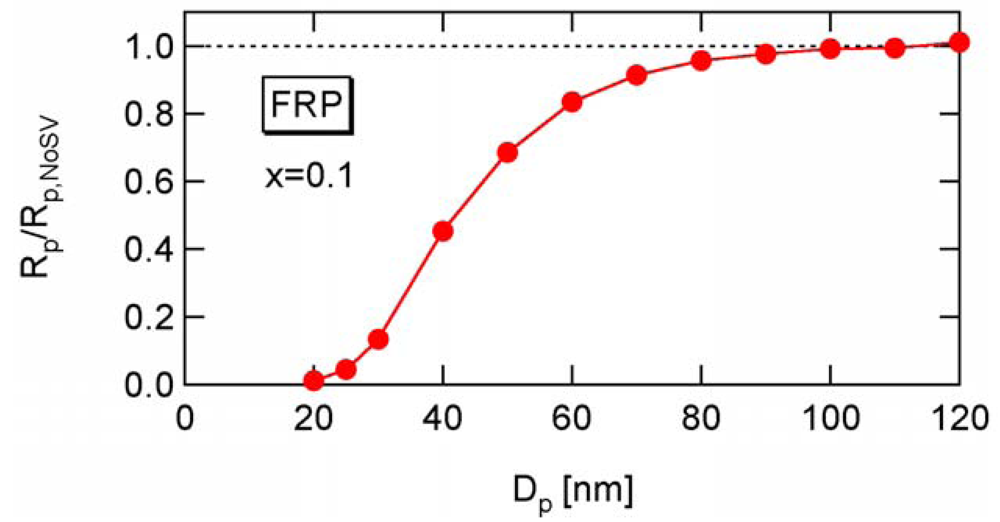
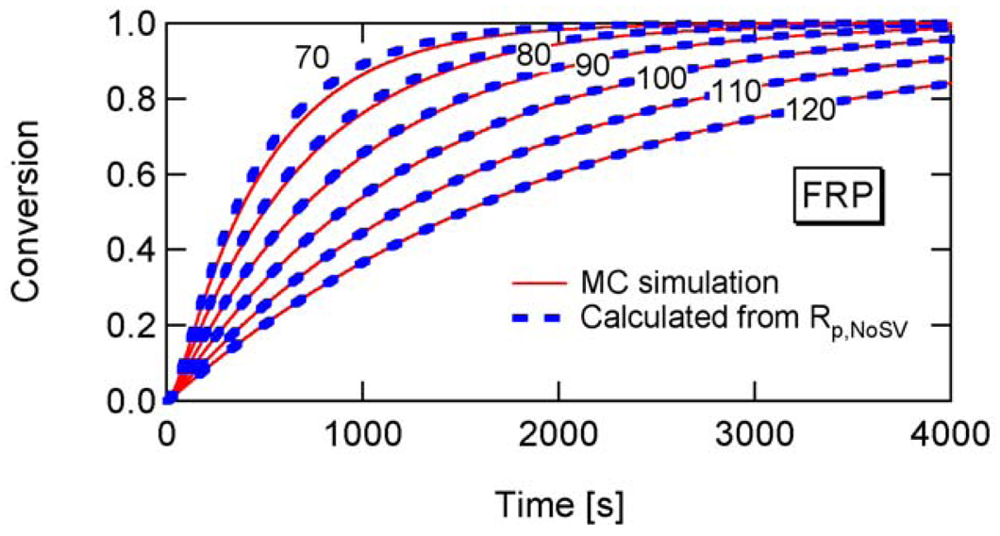
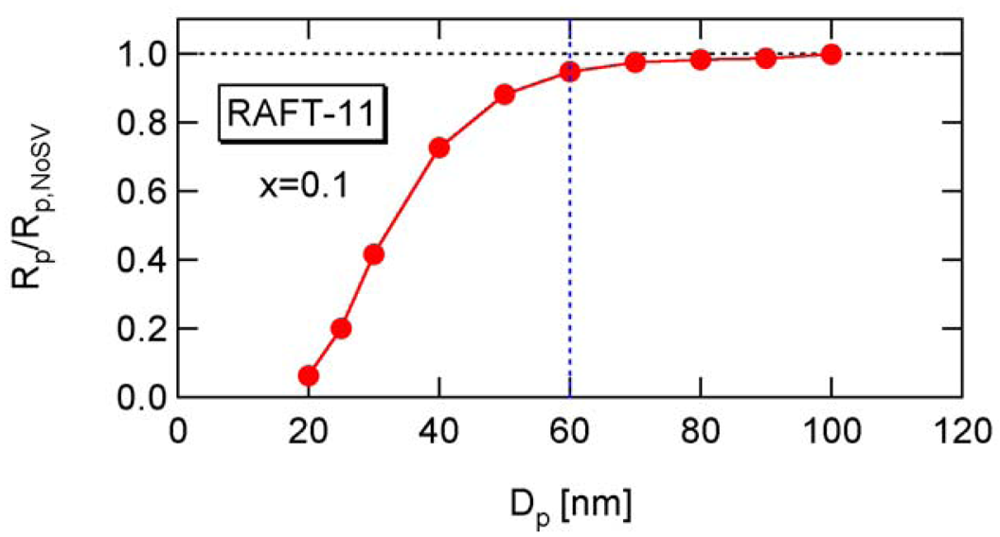
Figure 15 shows the ratio between Rp and Rp,NoSV at conversion x = 0.1. Figure 16 shows the comparison of the conversion developments obtained from Rp and R p,NoSV. From these figures, a noticeable statistical variation effect is observed for Dp < 80 nm. By setting Equation (25) leads to obtain a = 10.3, and therefore, the applicability of a = 10 is now examined for the RAFT cases.
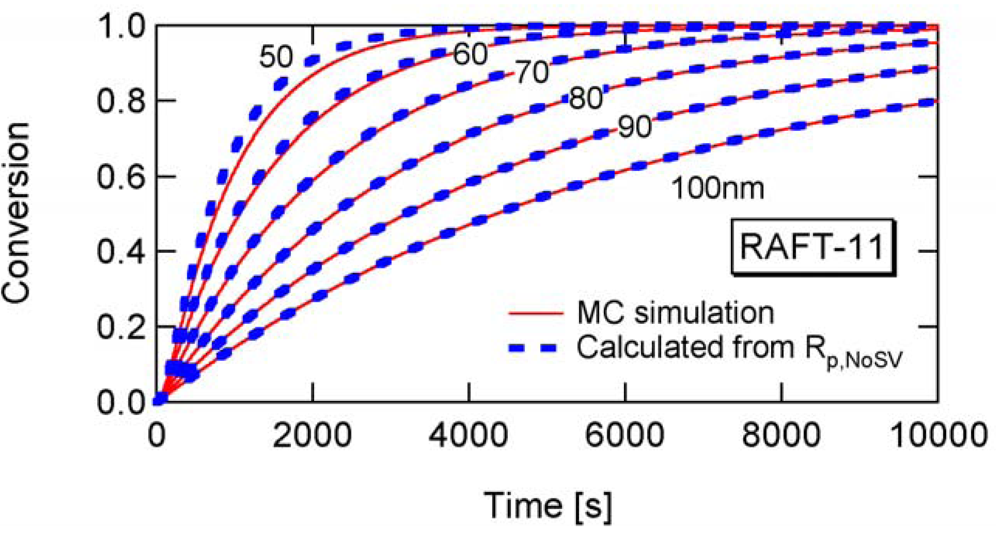
Figure 17 shows the calculated developments for RAFT-11, -12, and -13, using Equation (25) with a = 10. For RAFT-11, the statistical variation effect is predicted to be significant for Dp smaller than about 60 nm. Figure 18 shows the ratio between Rp and Rp,NoSV that does not account for the statistical variation effect. Figure 19 shows the comparison of the conversion developments obtained from Rp and Rp,NoSV. From Figures 18 and 19, it is confirmed that obtained from a = 10 is a reasonable estimate below which the MCV effect becomes significant.
From Figure 17, the -value for RAFT-12 is estimated to be about 30 nm, and Figure 20 confirms such estimation.
Because a = 10 applies to various reaction conditions, by using a = 10 in Equation (25) the following equation is now proposed to estimate the particle diameter below which the statistical variation effect to make the polymerization rate smaller than that estimated by using the average concentrations.
Finally, let us consider the case with the slow fragmentation (SF) model, RAFT-01 in Table 2. In this case, [PXP] < [XP], but not [PXP] ≪ [XP], and the -value below which a significant rate acceleration is predicted is very small, as was shown in Figure 9.
As shown in Figure 10, Dp = 10 nm in RAFT-01 condition leads to show smaller polymerization rate than bulk polymerization, rather than showing a larger polymerization rates as was shown in the cases of RAFT-11, -12, and -13. It is now shown that the deceleration is caused by the correlated variation of [M] and [PXP], i.e., the MCV effect.
The condition, [XP]0 = 0.04 mol L−1 leads to obtain the initial number of RAFT agent in a 10 nm particle being nXP = 12.6, and nXP = 13 is used for the MC simulation. This condition leads to [XP]0 = 0.0414, a slightly larger [XP]0 than the originally set condition shown in Table 2. The time development of and with [XP]0 = 0.0414 are shown in Figure 21. As shown in this figure, Dp = 10 nm is smaller than throughout the polymerization. This is the reason for not showing acceleration. The MCV effect is dominant throughout the polymerization, and the polymerization rate becomes smaller than that expected from the average concentrations, Rp,NoSV.
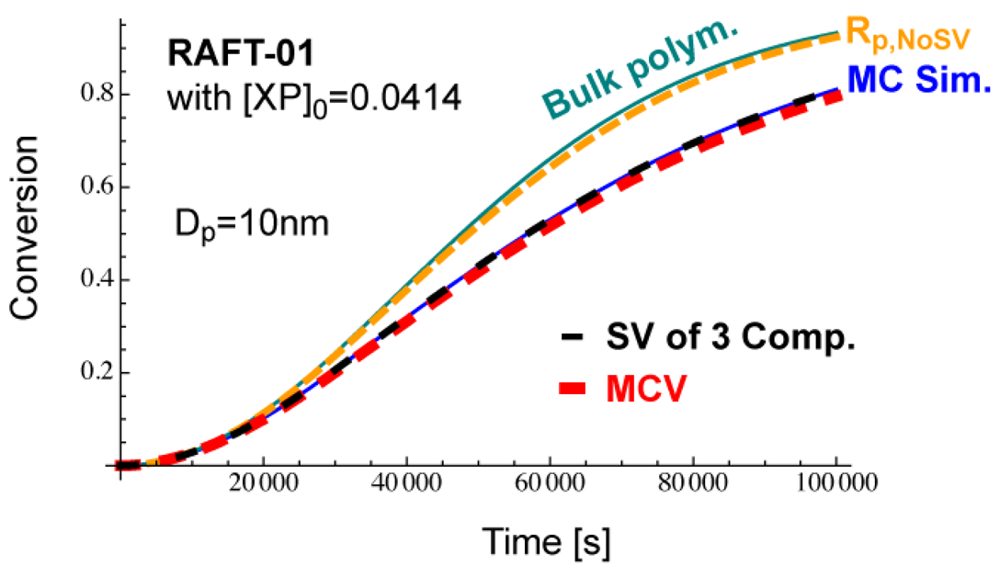
Figure 22 shows the conversion development calculated from various methods. The MC simulation (blue) corresponds to the experimental results of the miniemulsion polymerization with Dp = 10 nm. If one neglects the statistical variation and use the average concentrations incorrectly, one obtains Rp,NoSV-curve (orange), which clearly overestimates the polymerization rate, and is close to the bulk polymerization rate. On the other hand, if one accounts for the MCV effect (red), the calculated results agree reasonably well with the MC simulation, which shows that the MCV effect dominates the rate decrease. Perfect agreement with the MC simulation is obtained when the statistical variation of all three components are accounted for, as shown by the black broken curve.
5. Conclusions
Important threshold diameters below which the polymerization rate starts to deviate significantly (1) from the bulk polymerization, and (2) from the estimate using the average concentrations, for various types of RDRPs, are determined, as summarized in Table 4. These diameters are obtained on the basis of two important features of polymerization carried out in nano-sized reaction loci, (1) high single-molecule concentration effect, and (2) large statistical variation effect. These values can be calculated in a straightforward manner, and provide vital information for the design of miniemulsion polymerization processes.
For the cases with [Trap] ≪ [Interm], such as for SRMP and ATRP, there may be an acceleration window in which the polymerization rate is larger than that of the corresponding bulk polymerization. The lower and upper limits of the particle sizes are represented by and respectively. For the polymerization rate decreases significantly with by making Dp smaller, provided that the trapping agents do not exit from the particle. The -value required for the calculation of is a function of k2/kt, and a smaller k2/kt-value leads to a larger -value. As a rough indicator, -value is about 10 for k2/kt > 0.5, about 20 for k2/kt around 0.05, and larger than 30 for k2/kt < 0.01. Figure 12 can be used to roughly determine the -value. Note, however, from the theoretical point of view, the acceleration discussed here is with respect to the polymerization rate calculated by using the average concentrations, Rp,NoSV, and therefore, acceleration compared with the bulk polymerization is not always observed.
For the cases with [Interm] ≪ [Trap], such as for many RAFT systems, the significant rate increase by decreasing the particle size, as in the cases of conventional FRP, occurs for or equivalently, For the statistical variation effect becomes significant, and the polymerization rate becomes smaller than R p,NoSV, and the average concentration cannot be used. For the cases with such as for the representative SF model, the rate increase by decreasing the particle size does not occur at all.
The conventional nonliving FRP and DTRP can be considered as a special case of RAFT with ϕA = 1, and the values of and for these systems can be determined by applying ϕA = 1 to the equations for RAFT.


| K | [Interm] | [Trap] | |
|---|---|---|---|
| SRMP | k1/k2 | [PX] | [X] |
| ATRP | k1[Y]/k2 | [PX] | [XY] |
| RAFT | k1/k2 | [PXP] | [XP] |
| k1 [s−1] | k2 [L mol−1 s−1] | kct [L mol−1 s−1] | Comment | ||
|---|---|---|---|---|---|
| RAFT-11 | 1 × 10⁴ | 1 × 10⁶ | 1 × 10⁷ | Typical IT model | |
| RAFT-12 | 1 × 10² | 1 × 10⁶ | 1 × 10⁷ |  | Lager intermediate time, t̅PXP |
| RAFT-13 | 1 | 1 × 10⁶ | 1 × 10⁷ | ||
| RAFT-01 | 0.5 | 1 × 10⁶ | 0 | Typical SF model | |
| Diameter, Dp (nm) | Concentration of a single molecule (mol L−1) |
|---|---|
| 150 | 9.43 × 10⁻⁷ |
| 100 | 3.18 × 10⁻⁶ |
| 75 | 7.55 × 10⁻⁶ |
| 50 | 2.55 × 10⁻⁵ |
| 30 | 1.18 × 10⁻⁴ |
| 25 | 2.04 × 10⁻⁴ |
| Cases | High Single-Molecule Conc. Effect | Large Statistical Variation Effect |
|---|---|---|
| [Trap] ≪ [Interm] (SRMP, ATRP) | ||
| [Interm] ≪ [Trap] (RAFT) | or | |
| Conventional FRP, DTRP |
Acknowledgments
This work is supported by a grant-in-aid for Scientific Research, the Ministry of Education, Culture, Sports, Science, and Technology, Japan (grant-in-aid 21560890).
- Goto, A.; Fukuda, T. Kinetics of living radical polymerization. Prog. Polym. Sci. 2004, 29, 329–385. [Google Scholar]
- Braunecker, W.A.; Matyjaszewski, K. Controlled/living radical polymerization: Features, developments, and perspectives. Prog. Polym. Sci. 2007, 32, 93–146. [Google Scholar]
- Cunningham, M.F. Controlled/living radical polymerization in aqueous dispersed systems. Prog. Polym. Sci. 2008, 33, 365–398. [Google Scholar]
- Zetterlund, P.B.; Kagawa, K.; Okubo, M. Controlled/living radical polymerization in dispersed systems. Chem. Rev. 2008, 108, 3747–3794. [Google Scholar]
- Zetterlund, P.B. Controlled/living radical polymerization in nanoreactors: Compartmentalization effects. Polym. Chem. 2011, 2, 534–549. [Google Scholar]
- Zetterlund, P.B.; Okubo, M. Compartmentalization in nitroxide-mediated radical polymerization in dispersed systems. Macromolecules 2006, 39, 8959–8967. [Google Scholar]
- Kagawa, Y.; Zetterlund, P.B.; Minami, H.; Okubo, M. Compartmentalization in atom transfer radical polymerization (ATRP) in dispersed systems. Macromol. Theory Simul. 2006, 15, 608–613. [Google Scholar]
- Zetterlund, P.B.; Okubo, M. Compartmentalization in TEMPO-mediated radical polymerization in dispersed systems: Effect of macroinitiator concentration. Macromol. Theory Simul. 2007, 16, 221–226. [Google Scholar]
- Tobita, H.; Yanase, F. Monte carlo simulation of controlled/living radical polymerization in emulsified systems. Macromol. Theory Simul. 2007, 16, 476–488. [Google Scholar]
- Tobita, H. Kinetics of stable free radical mediated polymerization inside submicron particles. Macromol. Theory Simul. 2007, 16, 810–823. [Google Scholar]
- Zetterlund, P.B.; Kagawa, Y.; Okubo, M. Compartmentalization in atom transfer radical polymerization of styrene in dispersed systems: Effects of target molecular weight and halide end group. Macromolecules 2009, 42, 2488–2496. [Google Scholar]
- Thomson, M.E.; Cunningham, M.F. Compartmentalization effects of the rate of polymerization and the degree of control in ATRP aqueous dispersed phase polymerization. Macromolecules 2010, 43, 2772–2779. [Google Scholar]
- Tobita, H. Modeling controlled/living radical polymerization kinetics: Bulk and miniemulsion. Macromol. React. Eng. 2010, 4, 643–662. [Google Scholar]
- Tobita, H. Effect of fluctuation and segregation in the rate acceleration of ATRP miniemulsion polymerization. Macromol. Theory Simul. 2011, 20, 179–190. [Google Scholar]
- Monteiro, M.I.; Brouwer, H. Intermediate radical termination as the mechanism for retardation in reversible addition-fragmentation chain transfer polymerization. Macromolecules 2001, 34, 349–352. [Google Scholar]
- Barner-Kowollik, C.; Quinn, J.F.; Uyen Nguyen, T.L.; Heuts, J.P.A.; Davis, T.P. Kinetic investigations of reversible addition fragmentation chain transfer polymerizations: Cumil phenyldithioacetate mediated homopolymerizations of styrene and methyl methacrylate. Macromolecules 2001, 34, 7849–7857. [Google Scholar]
- Barner-Kowollik, C.; Coote, M.L.; Davis, T.P.; Randon, L.; Vana, P. The reversible addition-fragmentation chain transfer process and the strength and limitations of modeling: Comment on “The Magnitude of the Fragmentation Rate Coefficient”. J. Polym. Sci. Part A: Polym. Chem. 2003, 41, 2828–2832. [Google Scholar]
- Wang, A.R.; Zhu, S.; Kwak, Y.; Goto, A.; Fukuda, T.; Monteiro, M.S. A difference of six order of magnitude: A reply to “The Magnitude of the Fragmentation Rate Coefficient”. J. Polym. Sci. Part A: Polym. Chem. 2003, 41, 2833–2839. [Google Scholar]
- Barner-Kowollik, C.; Buback, M.; Charleux, B.; Coote, M.L.; Drache, M.; Fukuda, T.; Goto, A.; Klumperman, B.; Lowe, A.B.; Mcleary, J.B.; Moad, G.; Monteiro, M.J.; Sanderson, R.D.; Tonge, M.P.; Vana, P. Mechanism and kinetics of dithiobenzoate-mediated RAFT polymerization. I. The current situation. J. Polym. Sci. Part A: Polym. Chem. 2006, 44, 5809–5831. [Google Scholar]
- Klumperman, B.; van den Dungen, E.T.A.; Heuts, J.P.A.; Monteiro, M.J. RAFT-mediated polymerization—A story of incompatible data? Macromol. Rapid Commun. 2010, 31, 1846–1862. [Google Scholar]
- Tobita, H. Effects of retardation and variation of monomer concentration in RAFT miniemulsion polymerization. Macromol. Theory Simul. 2011, 20, 709–720. [Google Scholar]
- Suzuki, K.; Nishimura, Y.; Kanematsu, Y.; Masuda, Y.; Satoh, S.; Tobita, H. Experimental varidation of intermediate termination in RAFT polymerization with dithiobenzoate via comparison of rates of miniemulsion polymerization and bulk polymerization. Macromol. React. Eng. 2011. [Google Scholar] [CrossRef]
- Tobita, H. RAFT miniemulsion polymerization kinetics, 1—Polymerization rate. Macromol. Theory Simul. 2009, 18, 108–119. [Google Scholar]
- Fukuda, T.; Terauchi, T.; Goto, A.; Ohno, K.; Tsuji, Y.; Miyamoto, T. Mechanism and kinetics of nitroxide-controlled free radical polymerization. Macromolecules 1996, 29, 6393–6398. [Google Scholar]
- Goto, A.; Fukuda, T. Effects of radical initiator on polymerization rate and polydispersity in nitroxide-controlled free radical polymerization. Macromolecules 1997, 30, 4272–4277. [Google Scholar]
- Tobita, H. Effects of nano-sized polymerization locus on the kinetics of controlled/living radical polymerization. In Advanced Polymer Nanoparticles: Synthesis and Surface Modifications; Mittal, V., Ed.; CRC Press: Boca Raton, FL, USA, 2011; pp. 263–305. [Google Scholar]
- Tobita, H. Kinetics of controlled/living radical polymerization in emulsified systems. Macromol. Symp. 2008, 261, 36–45. [Google Scholar]
- Gilbert, R.G. Emulsion Polymerization: A Mechanistic Approach; Academic Press: London, UK, 1995. [Google Scholar]
- Zetterlund, P.B.; Okubo, M. Compartmentalization in NMP in dispersed systems: Relative contributions of confined space effect and segregation effect depending on nitroxide type. Macromol. Theory Simul. 2009, 18, 277–286. [Google Scholar]
© 2011 by the authors; licensee MDPI, Basel, Switzerland. This article is an open access article distributed under the terms and conditions of the Creative Commons Attribution license (http://creativecommons.org/licenses/by/3.0/).
Share and Cite
Tobita, H. Threshold Particle Diameters in Miniemulsion Reversible-Deactivation Radical Polymerization. Polymers 2011, 3, 1944-1971. https://doi.org/10.3390/polym3041944
Tobita H. Threshold Particle Diameters in Miniemulsion Reversible-Deactivation Radical Polymerization. Polymers. 2011; 3(4):1944-1971. https://doi.org/10.3390/polym3041944
Chicago/Turabian StyleTobita, Hidetaka. 2011. "Threshold Particle Diameters in Miniemulsion Reversible-Deactivation Radical Polymerization" Polymers 3, no. 4: 1944-1971. https://doi.org/10.3390/polym3041944