Phase Diagrams of the Aqueous Two-Phase Systems of Poly(ethylene glycol)/Sodium Polyacrylate/Salts


Abstract
: Aqueous two-phase systems consisting of polyethylene glycol (PEG), sodium polyacrylate (NaPAA), and a salt have been studied. The effects of the polymer size, salt type (NaCl, Na2SO4, sodium adipate and sodium azelate) and salt concentrations on the position of the binodal curve were investigated. The investigated PEG molecules had a molar mass of 2,000 to 8,000 g/mol, while that of NaPAA was 8,000 g/mol. Experimental phase diagrams, and tie lines and calculated phase diagrams, based on Flory-Huggins theory of polymer solutions are presented. Due to strong enthalpic and entropic balancing forces, the hydrophobicity of the added salt has a strong influence on the position of the binodal, which could be reproduced by model calculations.1. Introduction
Aqueous two phase systems (ATPS) based on water-soluble polymers are highly useful tools for extraction and purification of biomolecules [1-8]. An important aspect of the ATPS investigations concerns the search of systems containing reduced amount of phase forming compounds. Such ATPS have potential application in industry due to the low cost of purification/extraction of biomolecules. ATPS containing polymers that are easily recycled are interesting mostly for environmental reasons. The ATPS here investigated are based on polyethylene glycol (PEG) and sodium polyacrylate (NaPAA), which together with a salt separate into a PEG-enriched top-phase and a NaPAA enriched bottom phase. The PEG from the top-phase can be recycled by adding strongly hydrophilic salts as described by Albertsson [1], and the NaPAA can form a concentrated complex at low pH (<4) with PEG [9]. These properties are thus of remarkable, industrial importance. These polymers are environmentally friendly and are relatively low-cost chemicals. In addition, when mixed together they phase separate at quite low polymer concentrations and at rather mild salt concentrations. In previous works PEG-PAA two-phase systems have been used for the partitioning of the proteins GFP (green fluorescence protein) [6], hemoglobin, lysozyme and glucose-6-phosphate dehydrogenase [5]. Saravanan et al. have studied the effects of pH and salt on the partitioning of myoglobin and ovalbumin in PEG-PAA systems [7]. In these earlier studies on the applicability of the systems for bioseparations it was found that the systems are relatively inert (giving low protein denaturation), have a relatively low viscosity and can separate by gravity within a few minutes [5,6].
The aim of this work was to investigate the physico-chemical properties of the segregating two-polymer ATPS, formed by PEG, NaPAA and different salts: NaCl, Na2SO2, NaOOC-(CH2)4-COONa (di-sodium adipate), and NaOOC-(CH2)7-COONa (di-sodium azelate). Furthermore, the underlying basic thermodynamic driving forces of ion mixing entropy and ion hydrophilicity was investigated in the framework of Flory-Huggins theory [10].
The most studied aqueous two-phase systems are based upon the segregative behavior of two non-charged polymers, for instance PEG and dextran. In such systems, the salt type and concentration have very little influence on the position of the binodal. In contrast, the salt concentration has a very strong influence on two-polymer ATPS, where one or both of the polymers are charged, as shown by Albertsson for the PEG-dextran-sulphate [1], and Bergfeldt et al. [11] for the sodium polystyrene sulphonate-sodium polyacrylate system. The use of charged ampholytic polymers based on acrylate monomers for two-phase extraction of proteins have also been studied by Hughes and Lowe [12]. However, the systems they used contained high amount of relatively complex polymers. Persson et al. have also studied the use of cationic polymers for protein partitioning [13]. Waziri et al. showed that PEG can form a two-phase system with relatively low polymer content with an almost neutral ampholyte polydiallyamino-ethanoate-dimethyl-sulfoxide (PAEDS) [14]. For these cited examples the polymers are still non-commercial and have a complex composition which is a strong drawback for developing a reliable bioseparation process. Recently, the effect of different inorganic ions on the PEG-polyacrylate systems has been investigated [15]. The tendency for a charged and a non-charged polymer to segregate, without salt addition, into two-phases is strongly suppressed by the large difference in small ion concentration between the phases. Therefore, in systems without salt addition, two-phase formation occurs only at very high polymer concentration (e.g., 10 wt% of each polymer) when the mixing enthalpy becomes strong enough to favor separation, as observed previously [16,17]. However, by addition of salt, phase separation can occur at significantly lower polymer concentrations (e.g., 3–5 wt% of each polymer) [15]. Apart from the salt concentration, the ion type is also important. Gupta et al. [15] found that the binodal curve moves to the water-rich corner in a phase diagram when the salt ion was exchanged from nitrate to sulfate and/or to phosphate for a fixed molarity of the salt. Since systems with low polymer content is desired because of lower cost, viscosity and biocompatibility, there is a natural interest to find out salts that can move the binodal curve closer to the water rich region in a phase diagram. For instance, the charge, hydrophilicity and the concentrations of the ions influence strongly the efficiency of the separation and the shape of the binodal, as shown below. In this work the effects of such salts on the two-phase system is explained by using the Flory-Huggins model for polymer solutions. The presented work here shows novel results in several aspects: the effects of ion concentration and ion partition preference have been separated, namely hydrophobic anions will favor phase separation more than hydrophilic anions at the same concentration. We have also shown that a simple mean field model can explain the changes in terms of balancing the partitioning of the counter ions (in the current work the Na+ ions). Finally, the systems presented here are also new with respect to the low polymer molecular weight and low polymer concentration needed for phase separation.
2. Model and Calculation Procedure
The Flory-Huggins model [10] has been extensively used on reproducing both fundamental partitioning effects such as entropic repulsion [18] and more specific effects such as thermoseparation [19] and the electrochemical driving force in aqueous two-phase systems [18,20,21]. The model is based on mean-field statistical mechanical treatment of the combinatorial entropy upon mixing a polymer with a solvent in a lattice system, where the size of the lattice site unit is the same as the smallest component (usually the solvent). All other component sizes and polymerization degree are counted in a number of lattice sites units. The enthalpy of mixing is obtained by simply regarding first neighbor interactions, and the nearest lattice neighbors are always represented by the mean-field composition. In this model no reactions are taking place, thus in order to obtain the phase diagrams it is sufficient to minimize the free energy of mixing. In the search for the minimum global mixing free energy, random amounts of components are moved between the phases. The chemical potentials of the non-charged components are kept equal between the phases. For ionic species, a special treatment is performed. First of all we divide the ions interaction in two parts. One is the coulombic long-range interaction, which due to its strength causes the phases to become electroneutral at equilibrium. The other interaction is the sum of all other interaction types (e.g., polar interactions) and effects apart from the direct coulombic interaction. In the calculations, the coulombic interaction has simply been replaced by setting an electroneutrality condition on each phase. Therefore, by forcing electroneutrality in a model calculation, the fundamental effect of long-range coulombic force is implicitly accounted for in the calculations [21,22]. The polar or hydrophilic character of the ion has been collected into one nearest neighbor interaction. Thus a mixing enthalpy of the system is calculated where the coulombic interaction is omitted, and its free energy is shifted from a real system by a constant term. However, the fundamental effect of coulombic interaction is retained since the system is forced into electroneutrality. The electroneutrality of the ion partitioning will cause the formation of an electrochemical potential or driving force of the system, if the ions have different preferences of the phases. The partitioning of an ion can be better understood by introducing two concepts: “real ion partition” and “intrinsic ion partition”, where the former is simply calculated as the ratio of the ion concentration in the phases and the latter is calculated through the difference in non-ideal chemical potential of the ion in the two-phases, which in turn is obtained by calculating the non-ideal chemical potential of the ion as a non-charged component. The difference in real and intrinsic partitioning corresponds to a free energy cost (per charge), which must attain the same value for all charged species for satisfying a global free energy minimum. Having these constraints, it is possible to treat ion partitioning in the framework of Flory-Huggins theory.
2.1. The Flory-Huggins Model
The entropy of mixing water (1), PEG (2), polyacrylate (3), small cations (4) and anions (5) is given as follows:
In the equation ntot is the total number of mole of lattice sites, and Mi and ϕi are the molecular size (expressed in units of the water molecules) and volume fraction of the different components, respectively. The volume fraction of a component equals the number of moles of lattice sites of the component divided by the total lattice volume of the phase:
For simplicity, the lattice size of the water molecule and salt ions are set equal to one, thus:
The enthalpy is given by introducing the pairwise nearest neighbor interaction parameter wij between component (i) and (j), with the unit J/mol (no interactions of diagonal type, wii = 0). The interaction and size parameters are given in Table 1.
Since the Flory-Huggins theory is a mean field theory the enthalpy is dependent on the average concentration of the components. Thus, we have:
The global mixing free energy of the two phase system is compared with a corresponding homogenous 1-phase system.
For the uncharged species, we add the equilibrium condition:
The chemical potential exemplified for the top-phase for component (i) is:
Using the general form of Equations 6–8 and inserting expressions of Equations 9 and 10, it is possible to obtain the intrinsic partitioning of a component (charged or non-charged):
2.1. Calculation Methodology
The starting up of the calculation of the phase diagrams is performed by defining the total composition of the system. Then an attempt to construct a two-phase system is made by starting up with an unsymmetrical composition of the two-phases. In a program, random amounts of the components move between the phases until the global minimum free energy is found. The movements are performed under the electroneutrality condition and the condition of chemical equilibrium in Equations 6 and 7 and the electrochemical potential described below.
2.2. Electrochemical Potential
If the ions would partition freely according to their non-ideal chemical potential (i.e., the intrinsic partitioning), then at the lowest free energy, the system, would not be electroneutral. However, since electroneutrality is forced on the system, every ion free energy is raised by a term scaled to the ion charge. This is the electrochemical driving force and is obtained as follows. Firstly, a molar transfer free energy of a charge (from bottom to top-phase) can be calculated from partition coefficient of an ion: Ki,real (ratio of top and bottom ion concentration).
The difference in this molar free energy obtained for the real ion partitioning and the “intrinsic” partitioning divided by the charge of the component, is a transfer free energy per charge in the system. This is an electro-chemical driving force that scales with the charge of each component.
The minimum free energy in Equation 5 is searched under the condition that Equation 14 gives the same value for all charged components and that Equations 6 and 7 are satisfied.
3. Materials and Methods
3.1. Materials
PEG 2000 (molecular weight range 1,900–2,200 g/mol) and PEG 4000 (3,500–4,500 g/mol) were obtained from Merck (Hohenbrunn, Germany), and PEG 8000 (7,000–9,000 g/mol) from Sigma-Aldrich. NaPAA 8000 as 45 wt% pH ca. 7.4 was obtained from Sigma-Aldrich (no data on polydispersity). Adipic acid was obtained from KEBO AB, Stockholm, Sweden. Azelaic acid was obtained from Eastman Kodak Co., Rochester, N.Y. All other chemicals were of pro analysis grade. The di-sodium salts of adipic and azelaic acids were obtained by titrating a water-slurry of the acids with a 50% NaOH solution until pH was between 7.5 and 8.4. The final clear stock solution concentrations of di-sodium adipate and di-sodium azelate were 1.003 and 1.001 mol/kg, respectively.
3.2. Two-Phase Systems and Binodals
For each phase diagram three stock solutions of PEG, NaPAA and salt were prepared. Each solution had the same salt concentration, for instance 3 wt% NaCl or Na2SO4. The stock-solutions were mixed in graded 15 mL glass tubes and then centrifuged with a table centrifuge (2,000 rpm, 1 minute). Then the tube was inspected for formation of two-phases. By titrating with the three stock solutions it is possible to obtain a binodal curve. Generally, the solutions become turbid in the two-phase side of the binodal; however, close to the binodal, the lack of turbidity upon mixing was not a good indication of a one-phase system. This explains the necessity of centrifugation of the systems. For the tie-line determination, corresponding 10 g two-phase systems were made (in triplicate) and were then put in a water-bath for equilibration. The formation of two-phase systems was generally accomplished within 2 min. After the phase separation, the volumes were read and the sample was carefully taken from top-phase using Pasteur-pipettes. Samples from bottom phase were taken after the remaining top-phase had been removed.
3.3. Determination of PEG Concentration
A sample of 1–2 g pure phase (top or bottom) was added to a 15 mL glass beaker. The beaker with the solution was then placed in an oven at 110–150 °C overnight to evaporate the water. About 6 g of warm acetone of high purity (less than 1% water) was added to the dried residue to dissolve the PEG molecules. The acetone-PEG solution was carefully removed from the beaker with a Pasteur-pipette and placed in another glass beaker. Three extractions were made for each residue. The PEG content was then determined gravimetrically by evaporating the acetone.
3.4. Determination of NaCl Concentration
NaCl was determined by the Mohr titration method. Three different aqueous solutions were prepared: Solution 1: 51.97 mmol/kg AgNO3, solution 2: 5 wt% K2Cr2O7, and solution 3: 0.74 wt% NaHCO3. One-gram sample from the two-phase systems was mixed in a beaker with 4–5 mL solution 3. Then 5 drops of solution 2 were added to the mixture. Finally, the mixture was titrated with solution 1 until formation of the red precipitate Ag2Cr2O7.
3.5. Determination of Na2SO4 Concentration
Na2SO4 was determined by precipitation, which was performed by mixing the salt solution with an excessive Ba(NO3)2 solution so that all SO42− is precipitated as BaSO4. Since poly(acrylate) is also precipitated by Ba2+ (or other multivalent ions), a special procedure was developed. One-gram sample was mixed in a 15 mL plastic tube with 4 mL of an organic solution consisted of 50 wt% acetone and 50 wt% methanol. The mixture became turbid due to a two-phase formation. The top-phase containing the salt was removed and placed in a glass tube. For each sample two organic phase extractions were performed and the organic phases were pooled together (ca. 8 g). Water was added to make the total volume 10 mL. Then 3 mL of a 10 wt% Ba(NO3)2 stock solution was added to the glass tube. A white precipitate was immediately formed and centrifuged at 1,500g for 15 minutes in a table centrifuge. The supernatant was discarded and the pellet washed several times from excessive salts by re-suspending it in water and centrifuged again. The glass tube with the precipitate was then dried in an oven overnight. The BaSO4 was then determined gravimetrically to obtain the original content of Na2SO4.
3.6. Determination of NaPAA Concentration
The NaPAA concentration was determined through refractive index measurement of the sample. A sample of the phase was diluted so that the total concentration in the diluted solution of PEG, NaPAA and salt was less than 10 wt%. The refractive index was measured, which gives the total contribution from all components. Previously, linear standard curves were determined separately for aqueous solutions of PEG, salt and NaPAA. The refractive index of the diluted sample was then subtracted by the individual contributions of PEG and salt, and the remaining refractive index gives the concentration of NaPAA through a linear standard curve of refractive index of NaPAA in water. The refractive index was determined with an Abbe type refractometer (OPTECH, optical technology).
4. Results
4.1. Effect of NaCl Concentration
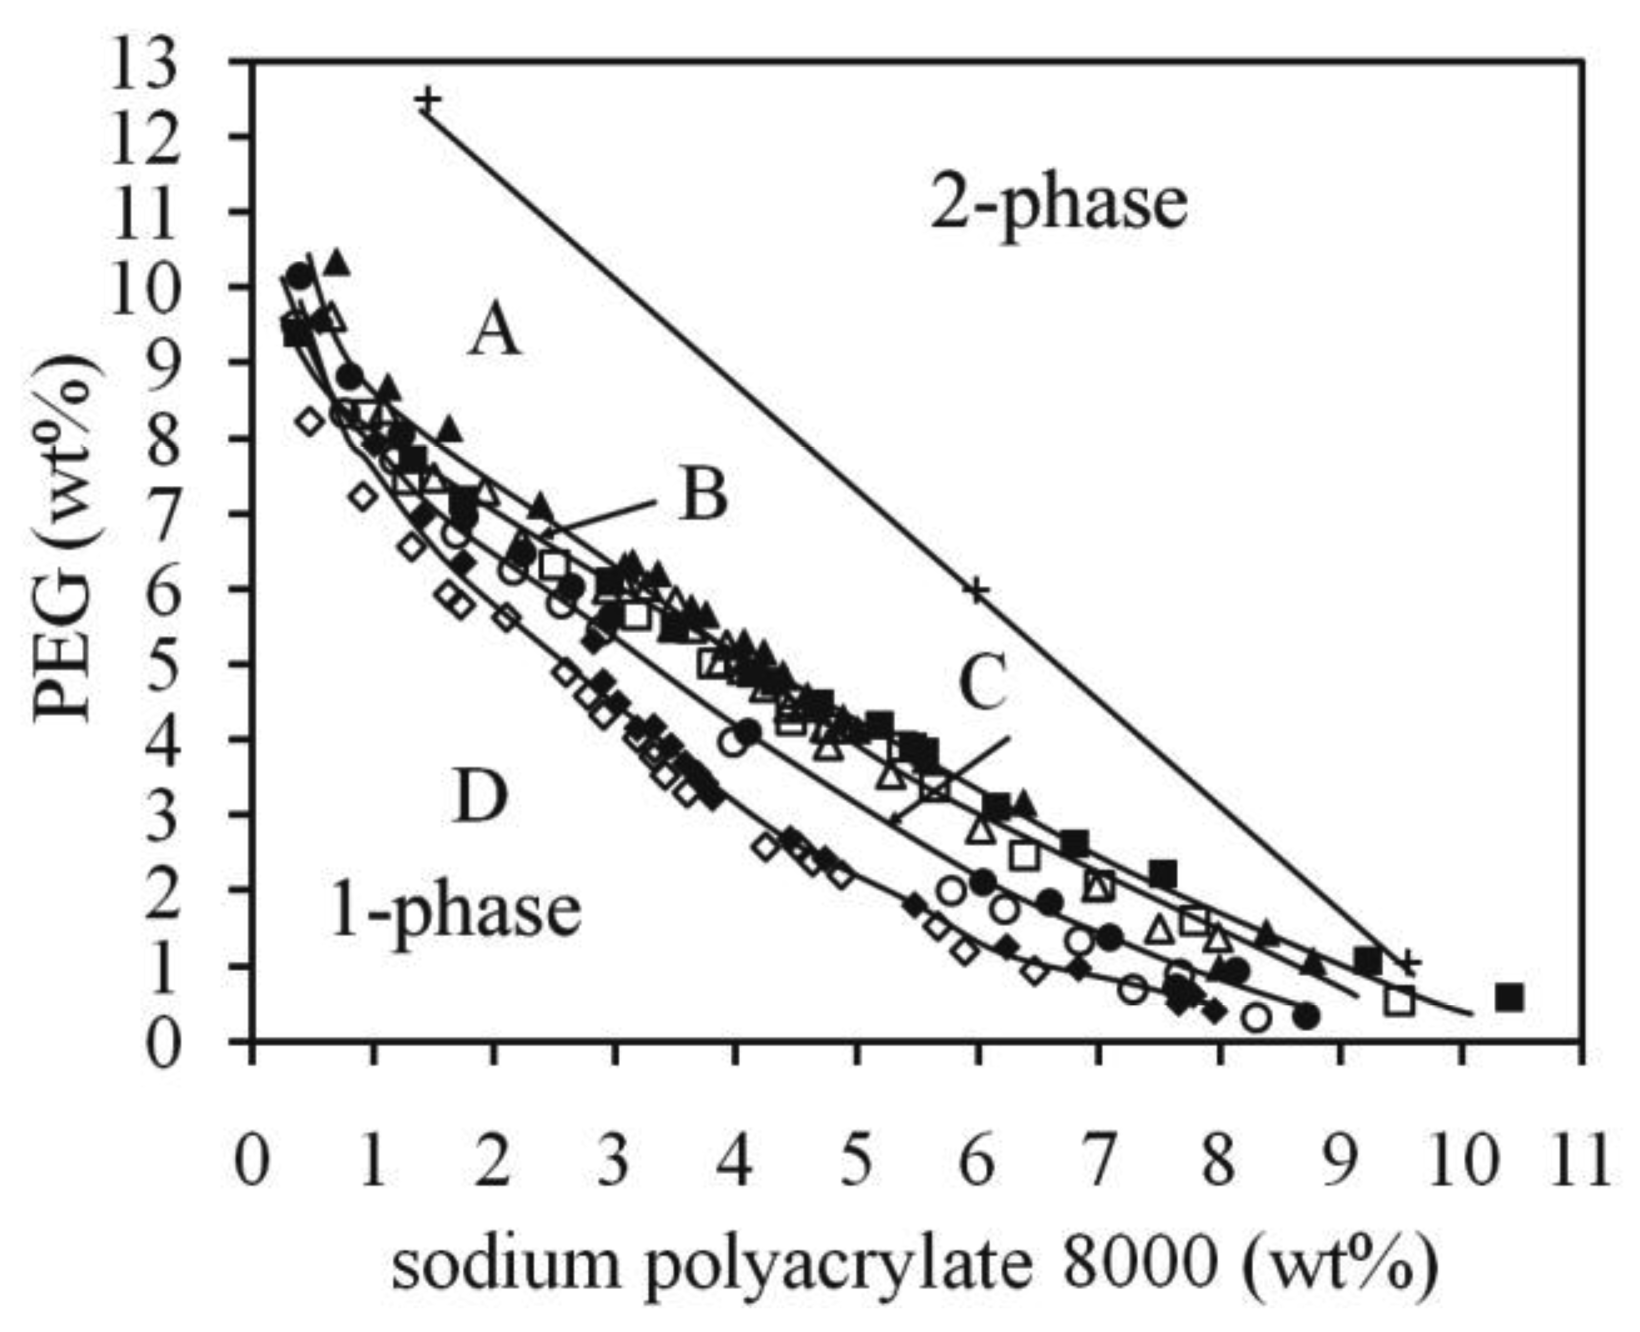
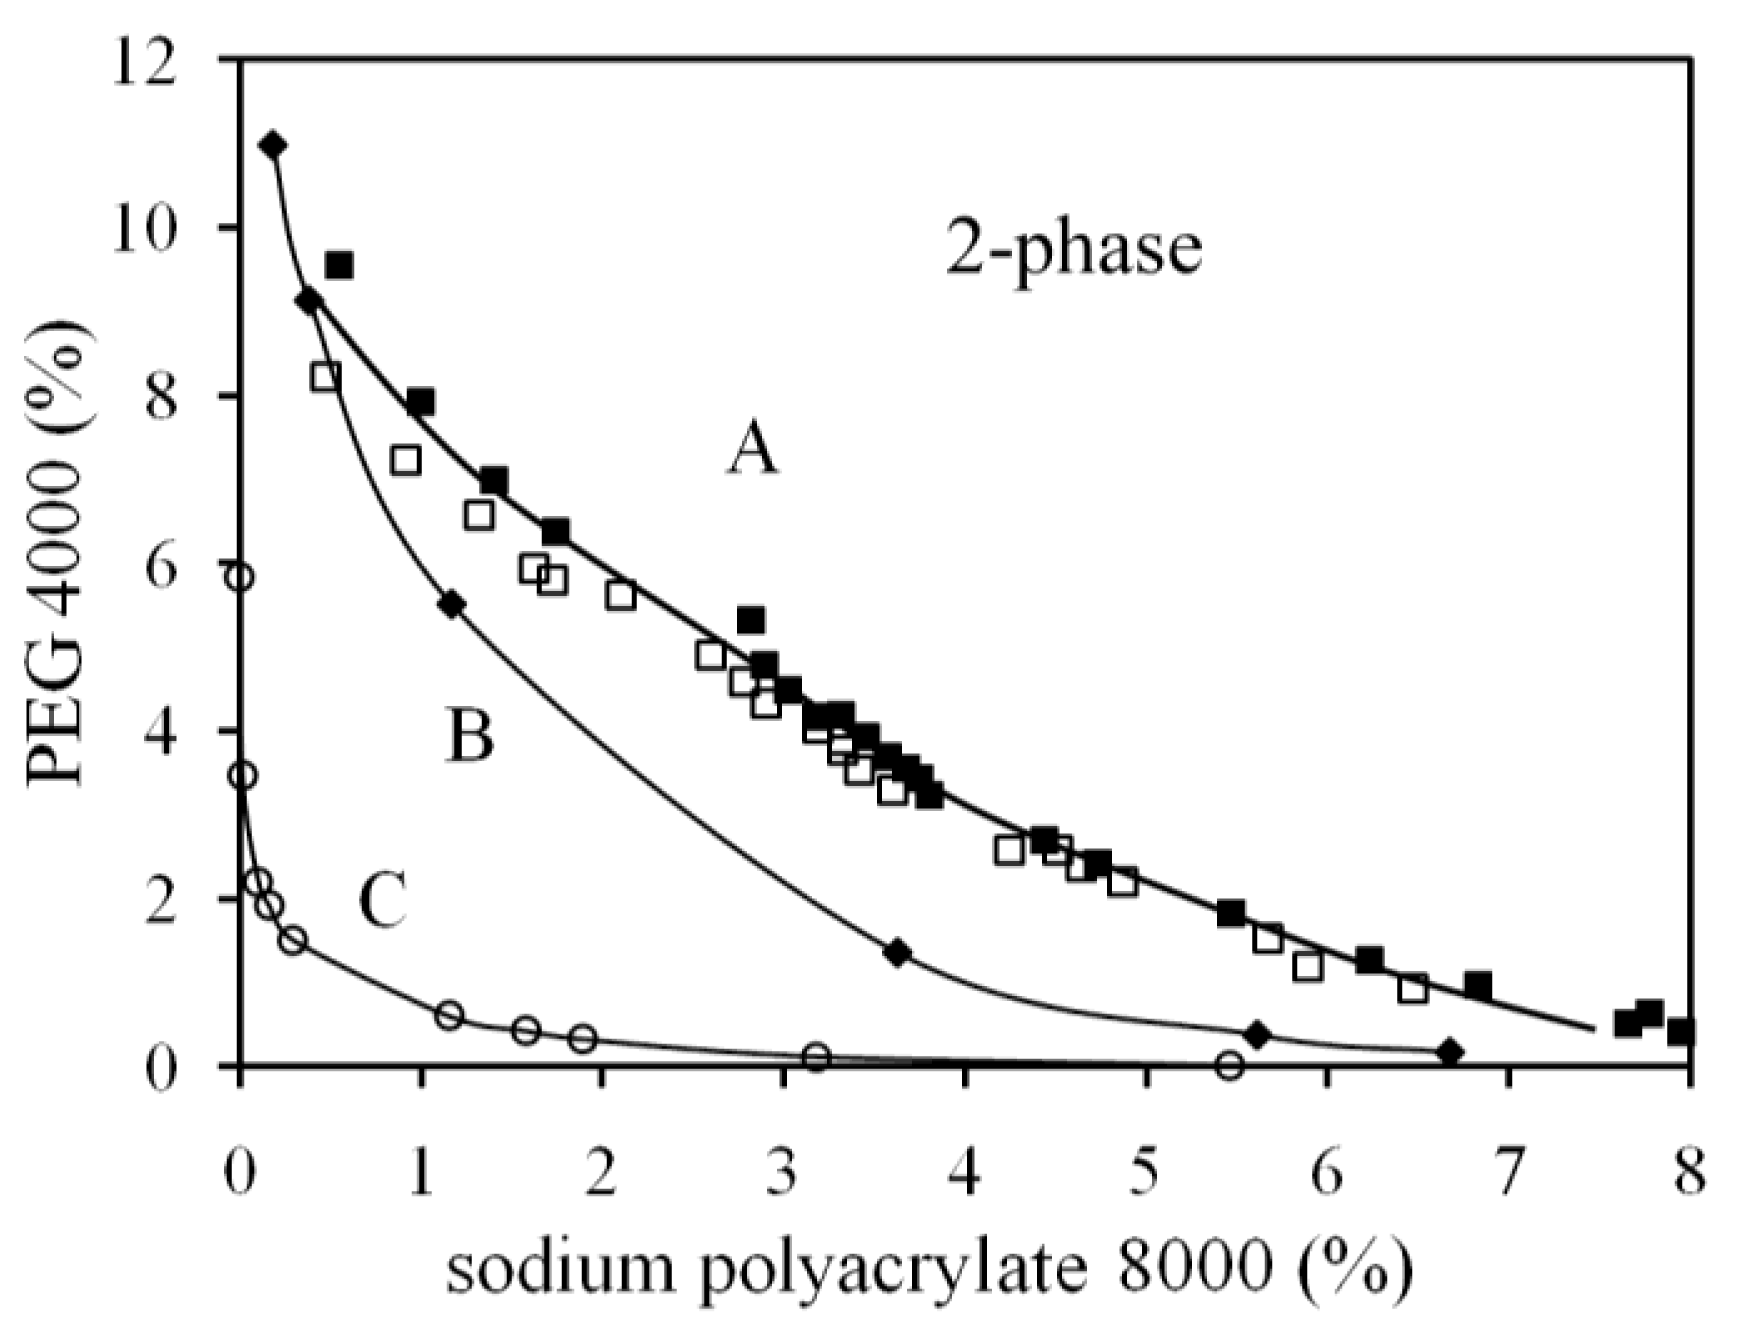
In Figure 1 three binodals of the system composed by PEG 8000 and polyacrylate 8000 with varying amount of NaCl are shown. By increasing salt concentration (1.05%, 3.7% and 6%) the binodal moves closer to the water-rich region, and the changes are larger in the PEG-rich part of the phase diagram. There seems to be a saturation effect of the added salt so that a further increase of the salt concentration does not increase the two-phase region significantly. The straight tie-line shown belongs to the binodal C, and shows a discrepancy between the top-phase composition (PEG-rich phase) and the binodal (for a ternary system the tie-line should connect to the binodal). One explanation can be that the system is not ternary and the mixing point of the tie-line creates a top-phase different from the mixing points of the binodal at the PEG-rich region. The partition coefficient, K, for NaCl was at the mixing point of the tie-line equal to 1.14, i.e., a preference for the PEG-rich phase.
4.2. Effect of Na2SO4 Salt Concentration
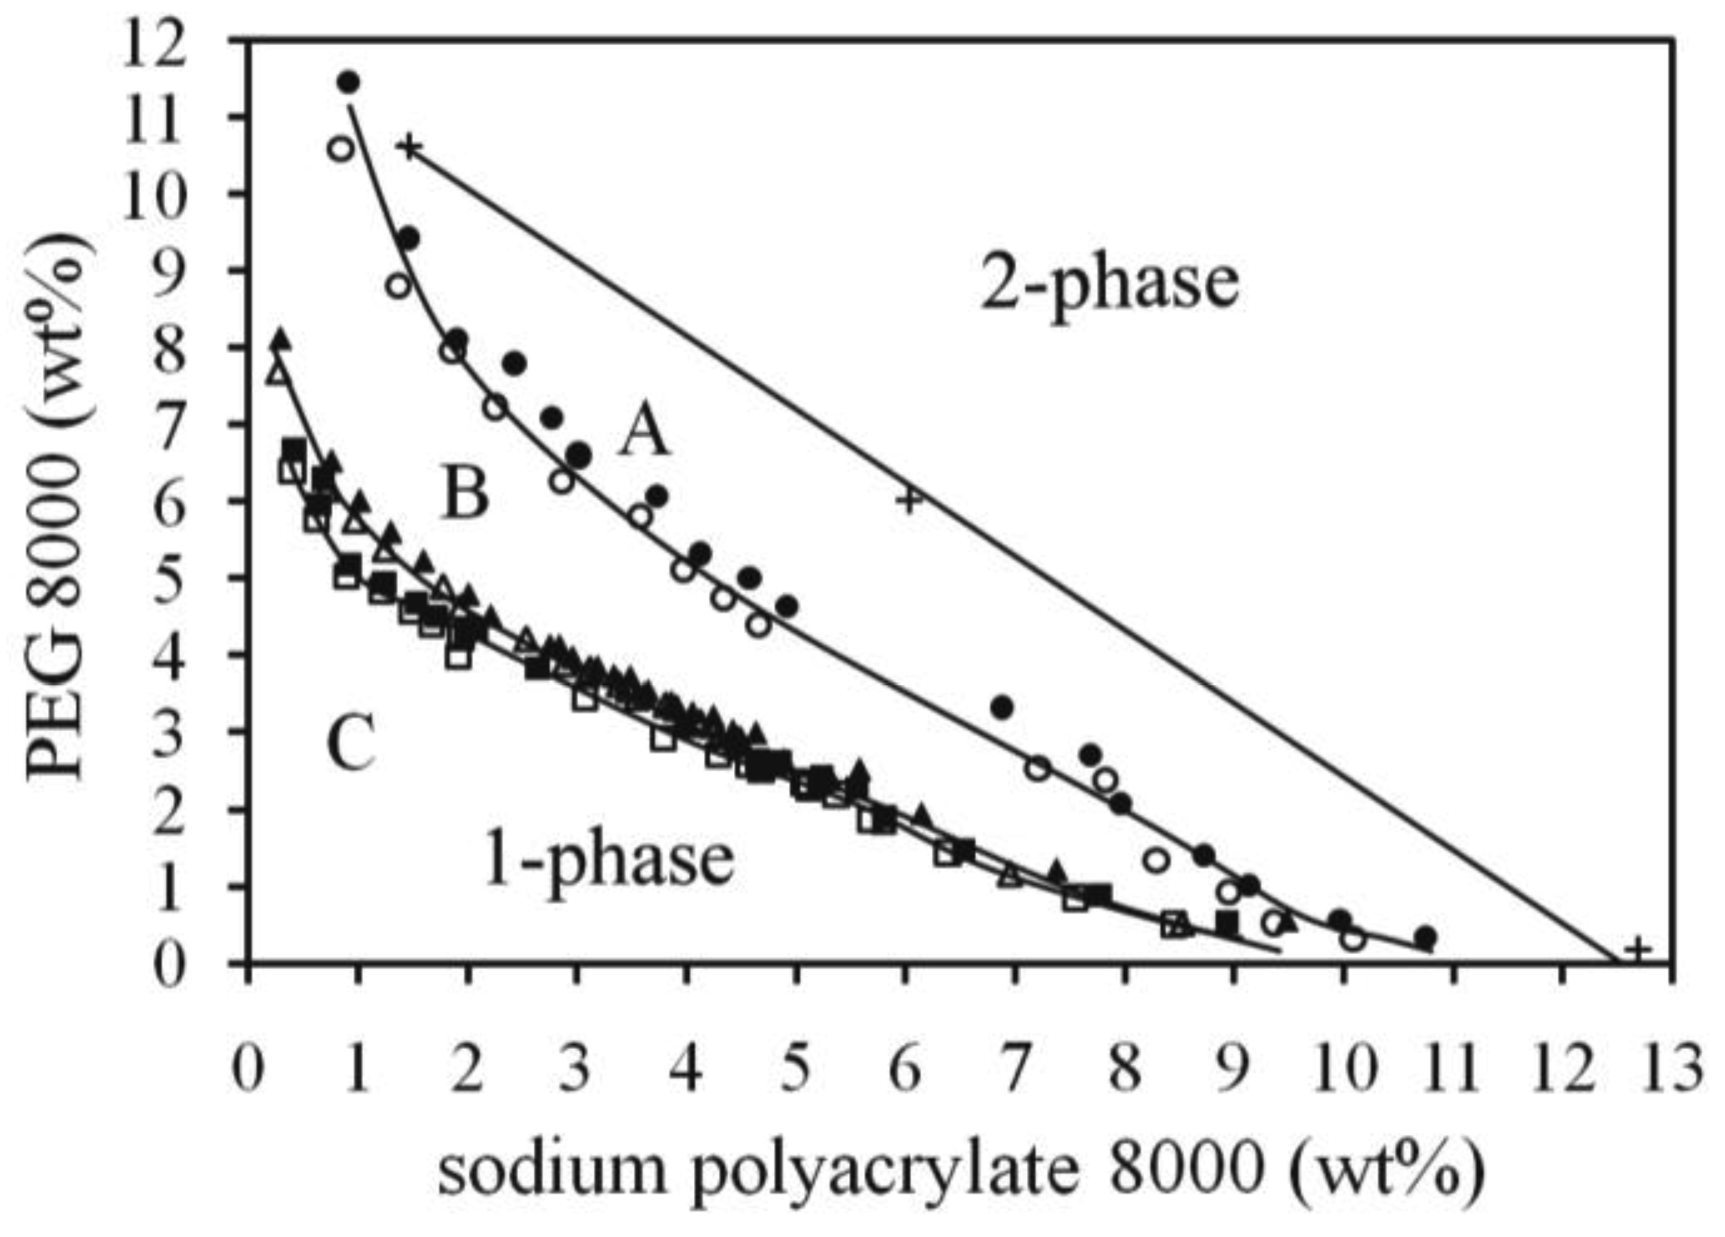
In Figure 2 the binodals for systems with different PEG size and Na2SO4 content are shown. The effect of increasing Na2SO4 from 3 to 6 wt% for the PEG 4000/NaPAA 8000 mixture can be seen by comparing binodals B and D. The movement of the binodal to the water region is significant and the changes are more pronounced in the NaPAA-rich region. A straight tie-line for the system with PEG 4000 and 3 wt% Na2SO4 (binodal B) is also shown, and as above, in Figure 1, the tie-line is not connected to the binodal curve as normally found in ternary aqueous two-phase systems. The partition coefficient K for Na2SO4 in the mixing point for the tie-line was 1.0, which is a more even partitioning between the phases than for NaCl. This may be understood by the relatively stronger hydrophilicity of the SO42− ion compared to the Cl− in terms of solvation free energy [23].
4.3. Effect of Polymer Molecular Weight
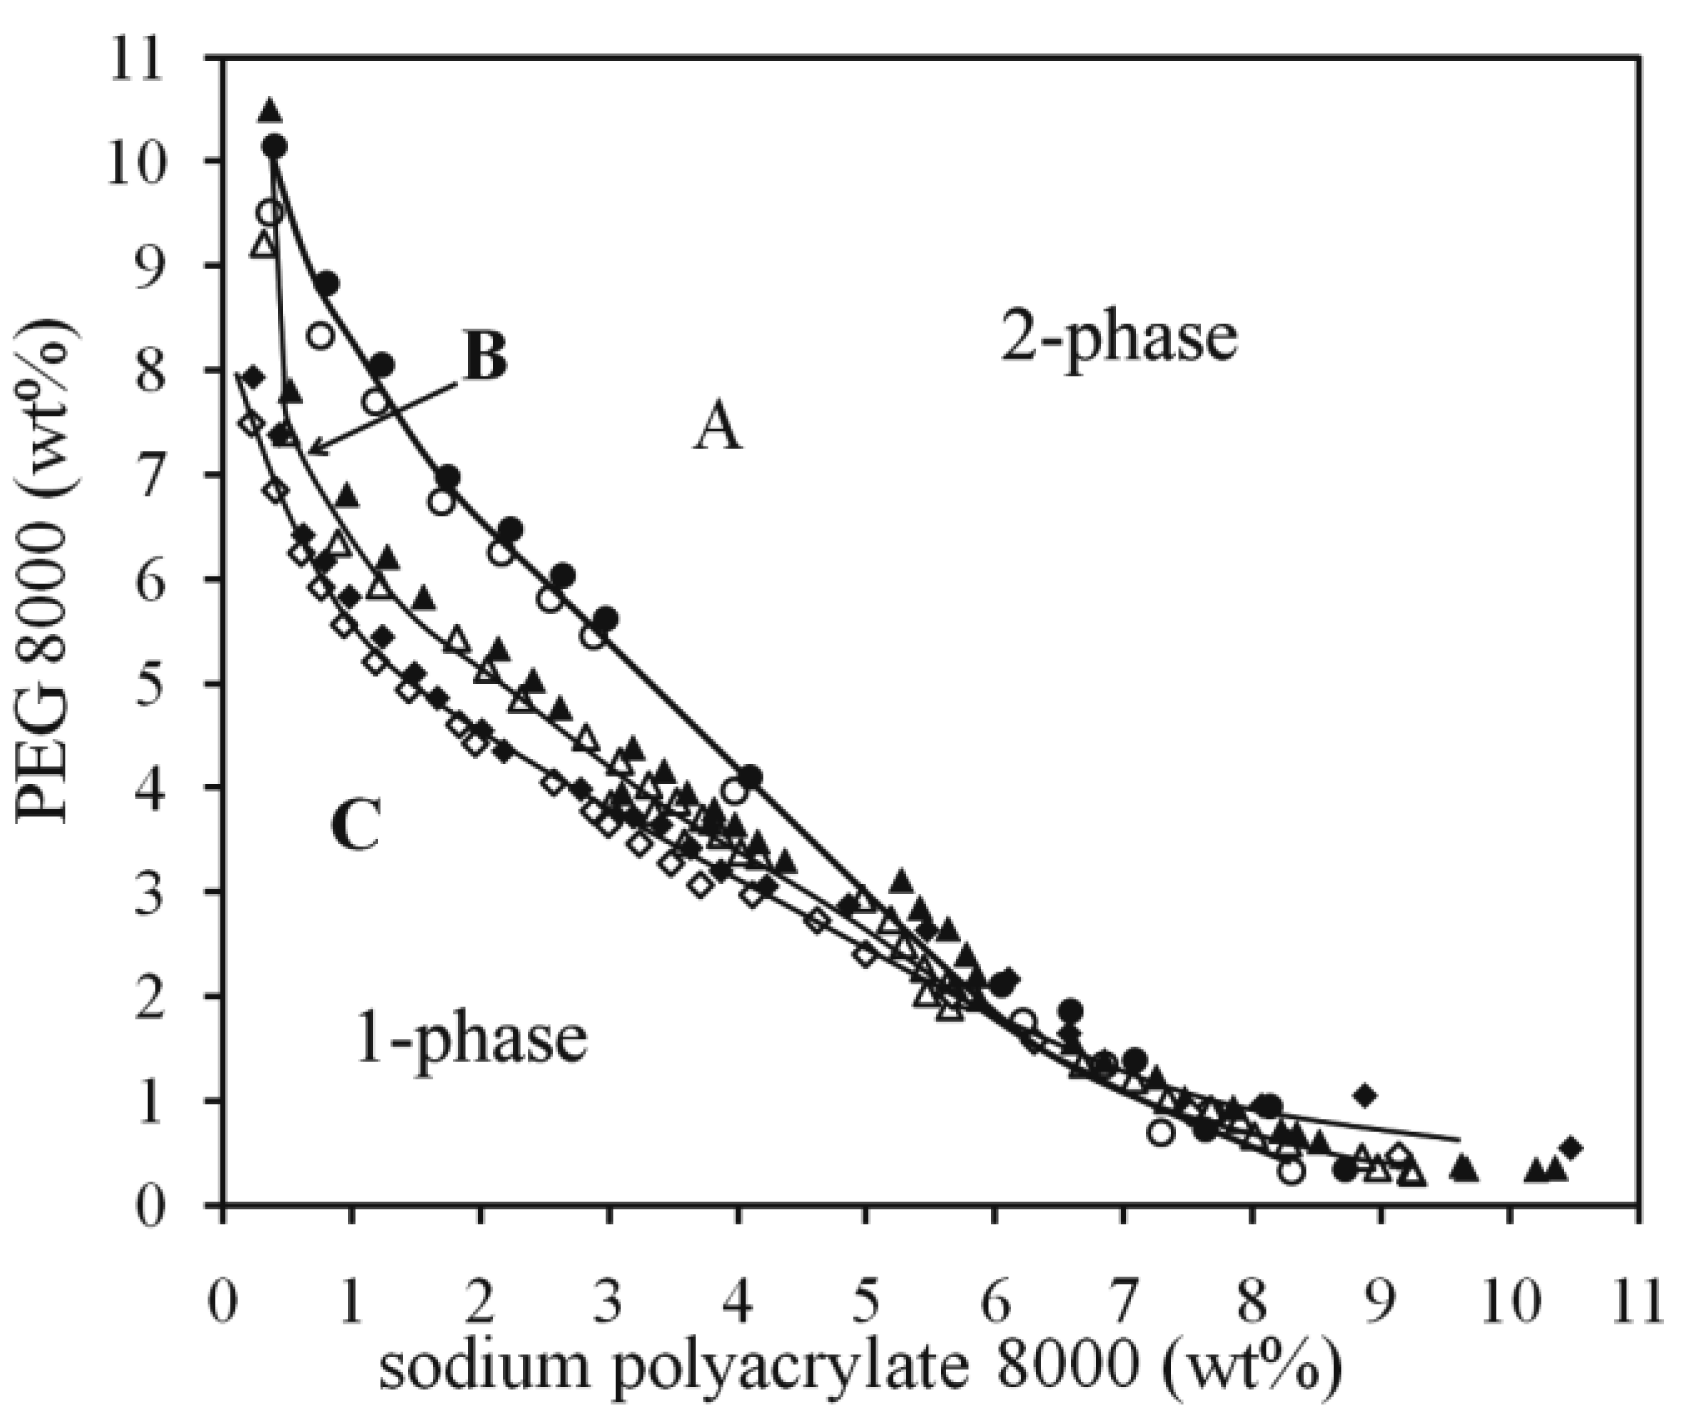
The effect of PEG size on the position of the binodal can be seen in Figure 2, where binodal A (PEG 2000, 6 wt% Na2SO4) should be compared with binodal D (PEG 4000, 6 wt% Na2SO4) and binodal B (PEG 4000, 3 wt% Na2SO4) with binodal C (PEG 8000, 3% Na2SO4). In Figure 3 the binodals for systems containing the hydrophobic divalent salt di-sodium azelate are shown. In both of these examples the binodals move as expected to the water rich region as the molecular weight of PEG increases. The changes are more pronounced at the NaPAA rich region.
4.4. Effect of Salt Type on the Binodal
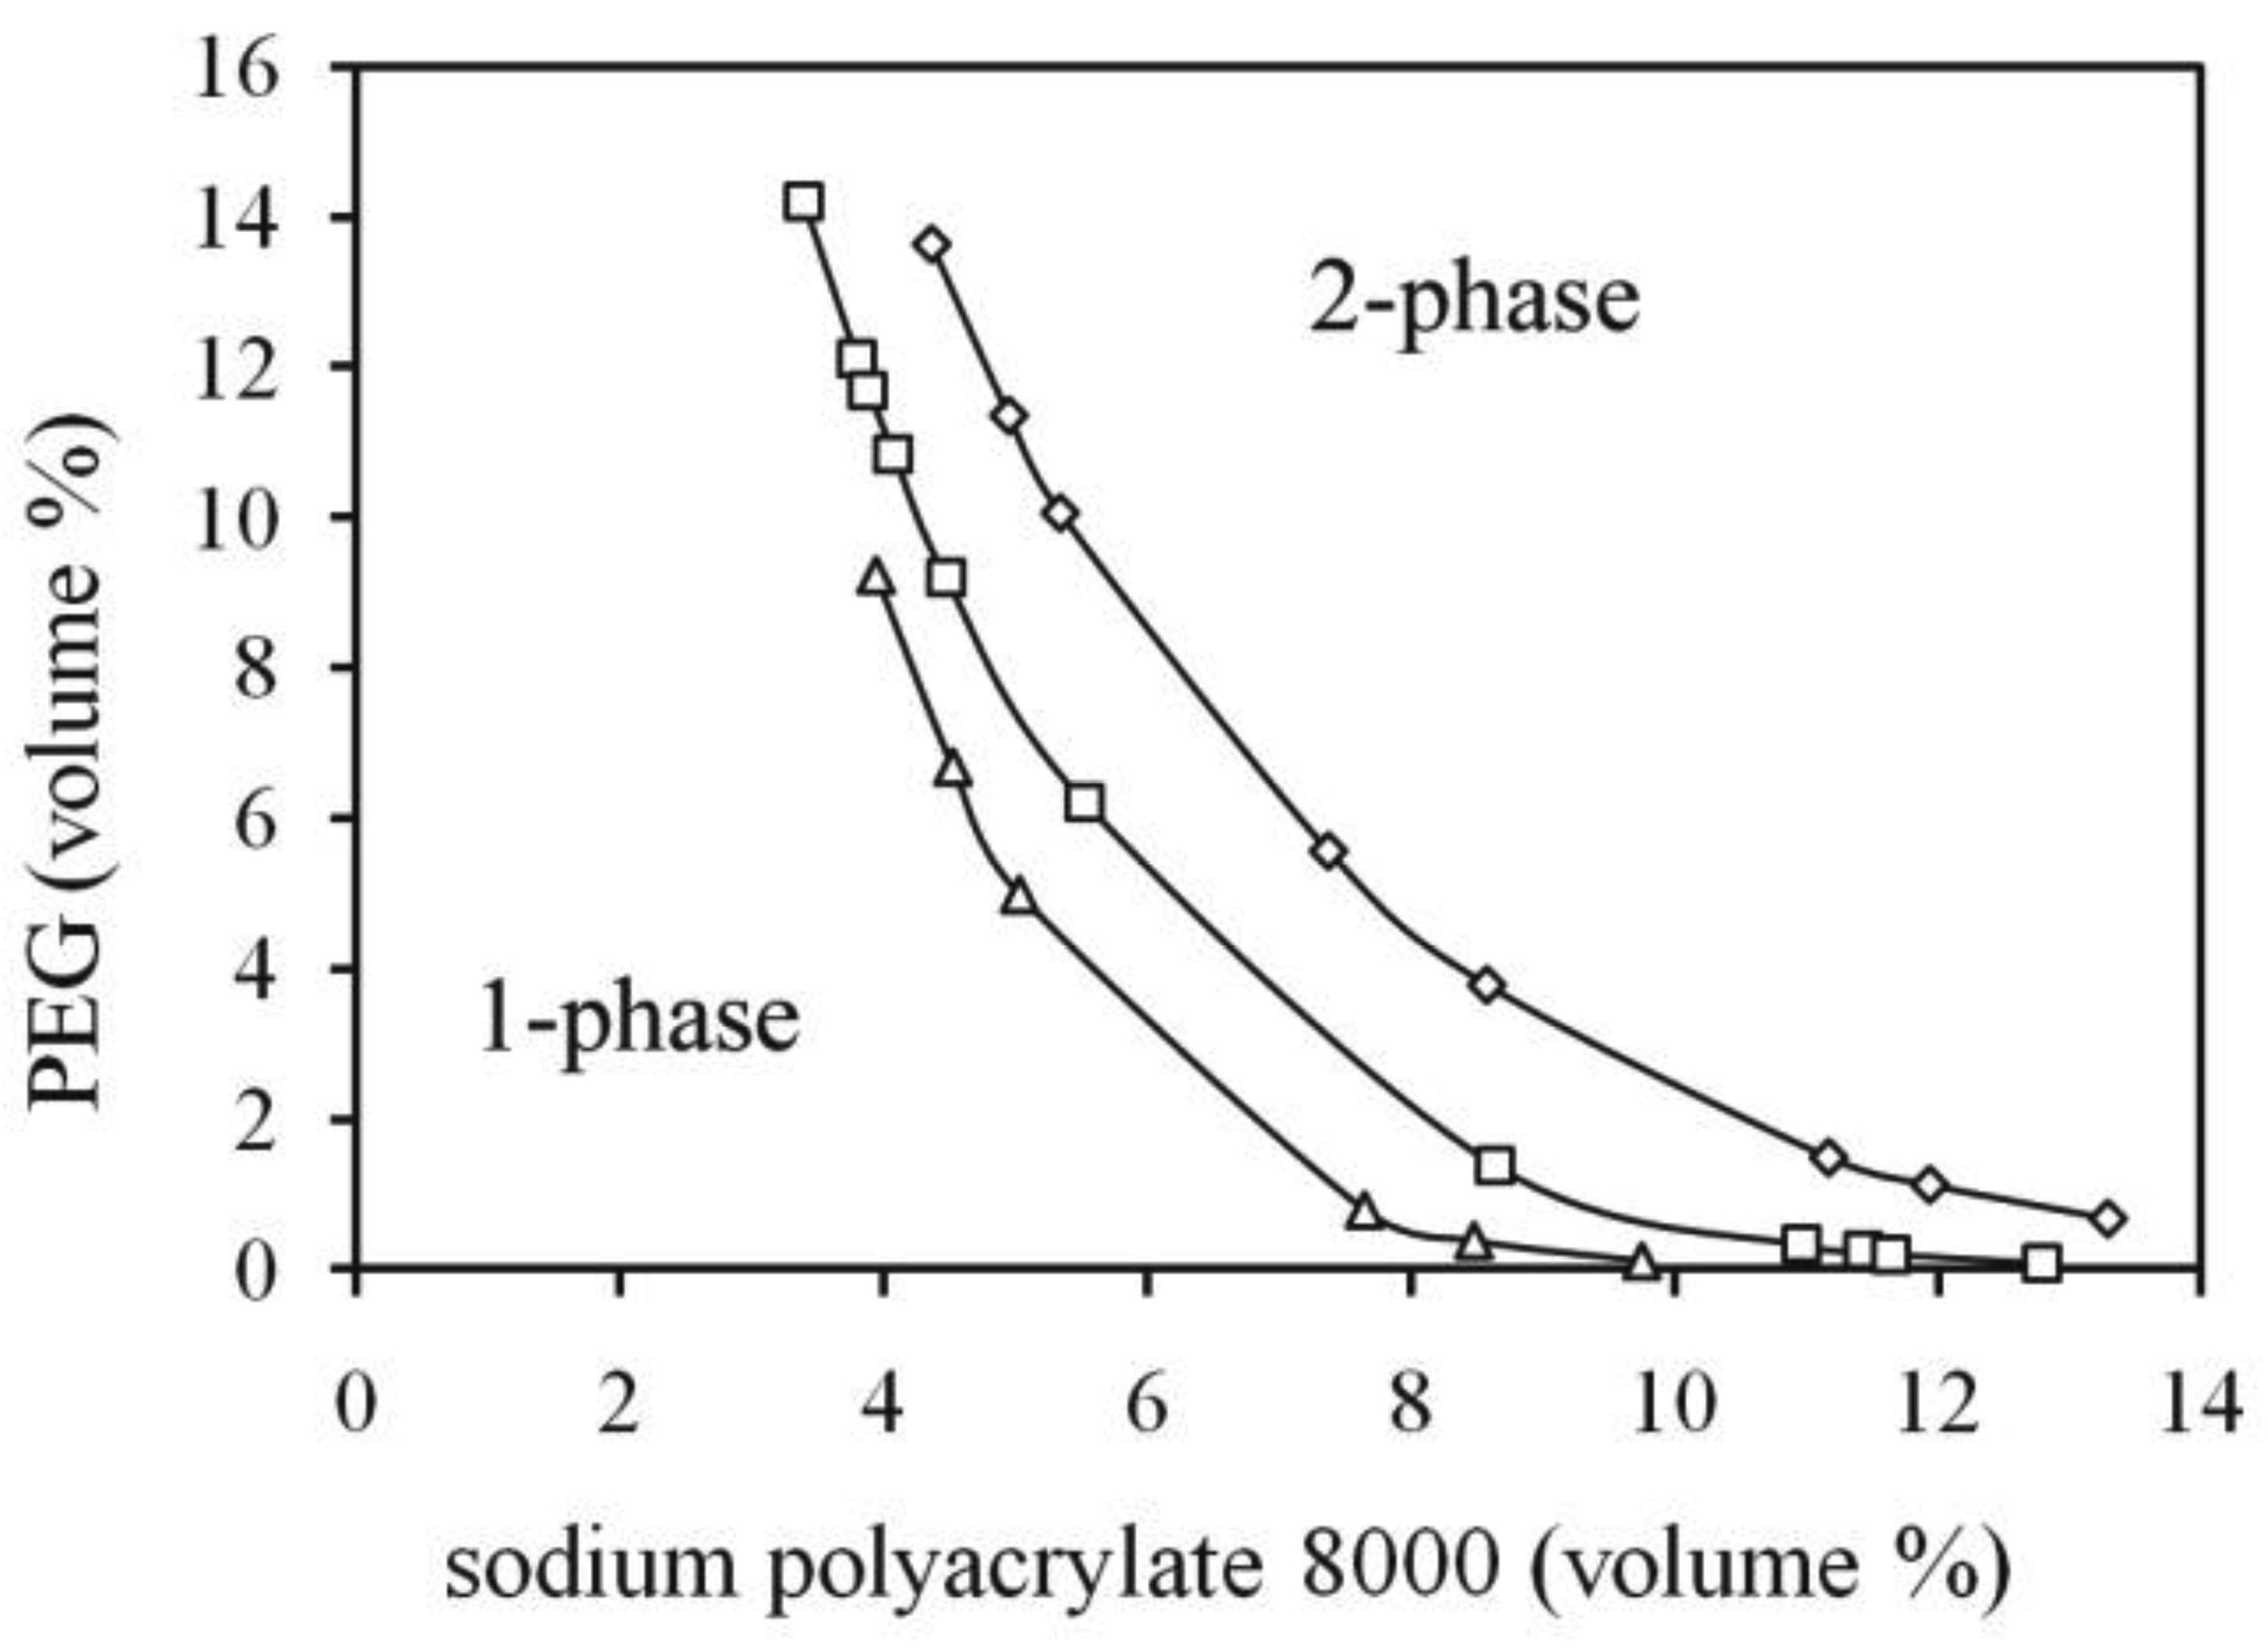
In Figure 4, the effect of increasing the anion hydrophobicity of the added salt on the binodal curve is shown. The added salts are Na2SO4, di-sodium adipate and di-sodium azelate. Interestingly, the binodal changes are significant only at the PEG-rich region. At the NaPAA rich region there is a very weak tendency for an increasing miscibility of PEG and NaPAA.
5. Discussion
5.1. Effect of Salt Concentration
As mentioned in the Introduction, the salt decreases the entropy penalty of compartmentalization of the polyelectrolytes. The more salt ions are added to the system, the stronger is the effect. A saturation effect upon salt addition in terms of decreased amount of the one-phase region may occur when the salt concentration is high enough that the polyelectrolyte effectively behaves as an uncharged polymer. The effect of increasing the two-phase region upon increased salt addition is modeled as in Figure 5 and all parts of the binodal curve are affected. The saturation effect of the salt observed in the experimental system is however not seen in the model. This is due to the fact that the modeled ions in that case are athermic, which means that the only non-zero enthalpy comes from endothermic repulsion between the polymers. In the experimental case, however, the attractive ion-water solvation interaction may possibly partly counteract two-phase formation by driving the polymers to associate. The relative influence of the polyelectrolyte counter ions (Na+) becomes less important if more of the smaller ions are added to the system (e.g., NaCl), since the latter will even out the ion concentration difference between the phases and thus entropically facilitate compartmentalization of the polyelectrolyte. This effect is stronger for divalent than monovalent ions. This allows a separation at lower polymer concentration, which also means that a smaller enthalpic repulsion between the polymers is enough to overcome the effect of the mixing entropy.
5.2. Effect of Polymer Size
The Flory-Huggins theory [18] predicts a linear dependence on the partition driving force (both enthalpic and entropic contributions) accordingly to the relationship
5.3. Effect of Salt Type
As pointed out in the Introduction, Gupta et al. [15] demonstrated the influence of the salt type on the binodal position of the PEG-polyacrylate system. They explained the effect of ions in terms of water structure breaking or structure making. We present here a more simple and fundamental effect, which is supported by the Flory-Huggins theory. The experimental effect shown in Figure 4, where an increase of the anion hydrophobicity of the added salt moved the binodal to the water-rich corner (increasing the two-phase region) has been reproduced with the model in Figure 7 below. A modeled “hydrophilic salt” of the Na2SO4 type gives a binodal far from the water rich region. In order to avoid multi-parameter changes, the salt is made “hydrophilic” simply by letting the SO42− anions have a strong repulsion to PEG. The comparing “hydrophobic” anion is then modeled by setting this interaction equal to zero (athermic interaction). This causes strong changes in the calculated binodal, an effect that was also found in the experimental case (Figure 4) where the hydrophobic ion is azelate. The explanation of this effect (displayed in Figure 7) can be understood from the mean field model calculation by considering the Na+-ion partitioning. There is a tendency for the small hydrophilic ion to even out the concentration between the phases. As counter ion the strongly hydrophilic SO42−, which has a strong repulsion to PEG, cannot distribute itself to the PEG-phase as strong as the intrinsic partitioning preference of Na+, so a significant amount of polyacrylate takes the counter ion role. When a more hydrophobic divalent anion is used instead, then by lacking a strong repulsion to PEG, it will energetically favor the transfer of Na+-ions to the PEG-phase, which in turns allows a polyacrylate to contribute less to this partitioning process, which allows a larger two-phase region. This effect is interesting from a technical point of view since a formation of two-phase systems can be achieved with less amount of polymer. The use of di-sodium azelate as a two-phase inducing salt may be questioned if the two-phase system is intended to be used in bioseparations process, since the alkane dicarboxylates have surfactant-like properties and may denature proteins. However, this type of surfactant has relatively high cmc (>100 mM) and poor hydrophobic solubilization power [24,25].
6. Conclusions
The experimental and calculated phase diagrams of several PEG/NaPAA/salt systems have been determined. The increase in salt concentration or PEG molecular size always leads to an increase in two-phase region as expected for polyelectrolyte-containing systems. The increase in molecular size of PEG moves the binodal more into the PAA rich region. An interesting effect of hydrophobic divalent anions was observed when these anions cause a stronger increase in the two-phase region at the PEG-rich region than a hydrophilic anion. The Flory-Huggins theory can be used to reproduce the experimental effects.


| Component (charge) | Interaction parameters (J/mol) | Polymerization degree (Mi) (corresponding polymer) |
|---|---|---|
| Water | w12 = w13 = w14= w15 = 0 | 1 |
| PEG | w12 = w24 = w25 = 0,w23 = 2,400 | 202 (PEG 4000) 202 (PEG 4000) 404 (PEG 8000) |
| Polyacrylate (−85) | w12 = w24 = w25 = 0, w23 = 2,400 | 335 (NaPAA 8000) |
| Small cation (+1) | w14=w23 = w34 = w45 = 0 | 1 |
| Small anion (−1) or (−2) | w15 = w35 = w45 = 0 w25 = 0 for (−1) anion w25 = 0 for (−2) anion or w25 = 27,000 (*) | 1 |
(*)value for the “SO42−” anion in Figure 6 and binodal B in Figure 7.
Acknowledgments
This project was supported by FAPESP (Fundação Amparo de Pesquisa em São Paulo), the Research Foundation of the State of S ão Paulo, Brazil. Eloi Feitosa acknowledges CNPq for research grant (Grant 304543/2006-3).
References
- Albertsson, P.-Å. Partition of Cell Particles and Macromolecules, 3rd ed.; Wiley: New York, NY, USA, 1986. [Google Scholar]
- Walter, H.; Brooks, D. Partition in Aqueous Two-Phase Systems: Theory, Methods, Uses and Applications in Biotechnology; Academic Press: Orlando, FL, USA, 1985. [Google Scholar]
- Hatti-Kaul, R. Aqueous Two-Phase Systems. Methods Biotechnol. 2000, 11, 5–10. [Google Scholar]
- Zaslavsky, B.Y. Aqueous Two-Phase Partitioning: Physical Chemistry and Bioanalytical Applications; Marcel Dekker: New York, NY, USA, 1995. [Google Scholar]
- Johansson, H.-O.; Magaldi, F.M.; Feitosa, E.; Pessoa Junior, A. Protein Partitioning in Poly(ethylene glycol)/Sodium Polyacrylate Aqueous Two-Phase Systems. J. Chromatogr. A 2008, 1178, 145–153. [Google Scholar]
- Johansson, H.-O.; Ishii, M.; Minaguti, M.; Feitosa, E.; Penna, T.C.V.; Pessoa Junior, A. Separation and Partitioning of Green Fluorescent Protein from Escherichia Coli Homogenate in Poly(ethylene glycol)/Sodium-Poly(acrylate) Aqueous Two-Phase Systems. Sep. Purif. Technol. 2008, 62, 166–174. [Google Scholar]
- Saravanan, S.; Rao, J.R.; Nair, B.U.; Ramasami, T. Aqueous Two-Phase Poly(ethylene glycol)-Poly(acrylic acid) System for Protein Partitioning: Influence of Molecular Weight, pH and Temperature. Process Biochem. 2008, 43, 905–911. [Google Scholar]
- Johansson, H.-O.; Svensson, M.; Persson, J.; Tjerneld, F. Aqueous Two-Phase Systems with Smart Polymers. In Smart Polymers for Bioseparation and Bioprocessing; Galaev, I., Mattiasson, B., Eds.; Taylor & Francis: New York, NY, USA, 2002. [Google Scholar]
- Ikawa, T.; Abe, K.; Honda, K.; Tsuchida, E. Interpolymer Complex between Poly(ethylene oxide) and Poly(carboxylic acid). J. Polym. Sci. A 1975, 13, 1505–1514. [Google Scholar]
- Flory, P.J. Principles of Polymer Chemistry; Cornell University Press: Ithaca, NY, USA, 1953. [Google Scholar]
- Bergfeldt, K.; Piculell, L.; Tjerneld, F. Phase Separation Phenomena and Viscosity Enhancements in Aqueous Mixtures of Poly(styrenesulfonate) with Poly(acrylic acid) at Different Degrees of Neutralization. Macromolecules 1995, 28, 3360–3370. [Google Scholar]
- Hughes, P.; Lowe, C.R. Purification of Proteins by Aqueous 2-Phase Partition in Novel Acrylic Co-Polymer Systems. Enzyme Microb. Technol. 1988, 10, 115–122. [Google Scholar]
- Persson, J.; Johansson, H.-O.; Galaev, I.; Mattiasson, B.; Tjerneld, F. Aqueous Polymer Two-Phase Systems Formed by New Thermoseparating Polymers. Bioseparation 2000, 9, 105–116. [Google Scholar]
- Waziri, S.M.; Abu-Sharkh, B.F.; Asrof Ali, S. Protein Partitioning in Aqueous Two-Phase Systems Composed of a pH-Responsive Copolymer and Polyethylene glycol). Biotechnol. Prog. 2004, 20, 526–532. [Google Scholar]
- Gupta, V.; Nath, S.; Chand, S. Role of Water Structure on Phase Separation in Polyelectrolyte-Polyethyleneglycol Based Aqueous Two-Phase Systems. Polymer 2002, 43, 3387–3390. [Google Scholar]
- Saravanan, S.; Reena, J.A.; Rao, J.R.; Murugesan, T.; Nair, B.U. Phase Equilibrium Compositions, Densities, and Viscosities of Aqueous Two-Phase Polyethylene glycol) Plus Poly(acrylic acid) System at Various Temperatures. J. Chem. Eng. Data 2006, 51, 1246–1249. [Google Scholar]
- Grünfelder, T.; Pessoa Filho, P. A.; Maurer, G. Liquid-Liquid Equilibrium of Aqueous Two-Phase Systems Containing Some Synthetic Polyelectrolytes and Polyethylene Glycol. J. Chem. Eng. Data 2009, 54, 198–207. [Google Scholar]
- Johansson, H.-O.; Karlström, G.; Tjerneld, F.; Haynes, C.A. Driving Forces for Phase Separation and Partitioning in Aqueous Two-Phase Systems. J. Chromatogr. B 1998, 711, 3–17. [Google Scholar]
- Johansson, H.-O.; Karlström, G.; Tjerneld, F. Experimental and Theoretical-Study of Phase-Separation in Aqueous-Solutions of Clouding Polymers and Carboxylic-Acids. Macromolecules 1993, 26, 4478–4483. [Google Scholar]
- Johansson, G. Effects of Salts on Partition of Proteins in Aqueous Polymeric Biphasic Systems. Acta Chem. Scand. 1974, B28, 873–882. [Google Scholar]
- Johansson, H.-O.; Lundh, G.; Karlström, G.; Tjerneld, F. Effects of Ions on Partitioning of Serum Albumin and Lysozyme in Aqueous Two-Phase Systems Containing Ethylene Oxide Propylene oxide Co-Polymers. Biochim. Biophys. Acta 1996, 1290, 289–298. [Google Scholar]
- Jönsson, M.; Johansson, H.-O. Protein Partitioning in Thermoseparating Systems of a Charged Hydrophobically Modified Ethylene Oxide Polymer. J. Chromatogr. A 2003, 983, 133–144. [Google Scholar]
- Marcus, Y. A Simple Empirical-Model Describing the Thermodynamics of Hydration of Ions of Widely Varying Charges, Sizes, and Shapes. Biophys. Chem. 1994, 51, 111–127. [Google Scholar]
- Meguro, K.; Ikeda, K.; Otsuji, M.; Yasuda, M.; Esumi, K. Physicochemical Properties of the α, ω-Type Surfactant in Aqueous-Solution. J. Colloid Interface Sci. 1987, 118, 372–378. [Google Scholar]
- Ueno, M.; Yamamoto, S.; Meguro, K. Properties of Aqueous-Solutions of Several Salts of α, ω-Alkanediol Disulfates. J. Am. Oil Chem. Soc. 1974, 51, 373–376. [Google Scholar]
© 2011 by the authors; licensee MDPI, Basel, Switzerland. This article is an open access article distributed under the terms and conditions of the Creative Commons Attribution license (http://creativecommons.org/licenses/by/3.0/).
Share and Cite
Johansson, H.-O.; Feitosa, E.; Junior, A.P. Phase Diagrams of the Aqueous Two-Phase Systems of Poly(ethylene glycol)/Sodium Polyacrylate/Salts. Polymers 2011, 3, 587-601. https://doi.org/10.3390/polym3010587
Johansson H-O, Feitosa E, Junior AP. Phase Diagrams of the Aqueous Two-Phase Systems of Poly(ethylene glycol)/Sodium Polyacrylate/Salts. Polymers. 2011; 3(1):587-601. https://doi.org/10.3390/polym3010587
Chicago/Turabian StyleJohansson, Hans-Olof, Eloi Feitosa, and Adalberto Pessoa Junior. 2011. "Phase Diagrams of the Aqueous Two-Phase Systems of Poly(ethylene glycol)/Sodium Polyacrylate/Salts" Polymers 3, no. 1: 587-601. https://doi.org/10.3390/polym3010587