The Role of Rare Earth Lanthanum Oxide in Polymeric Matrix Brake Composites to Replace Copper

1
School of Mechanical Engineering and Automation, Fuzhou University, Fuzhou 350116, China
2
Mechanical and Electrical Engineering Practice Center, Fuzhou University, Fuzhou 350116, China
*
Author to whom correspondence should be addressed.
Polymers 2018, 10(9), 1027; https://doi.org/10.3390/polym10091027
Submission received: 3 August 2018
/
Revised: 8 September 2018
/
Accepted: 12 September 2018
/
Published: 14 September 2018
Abstract
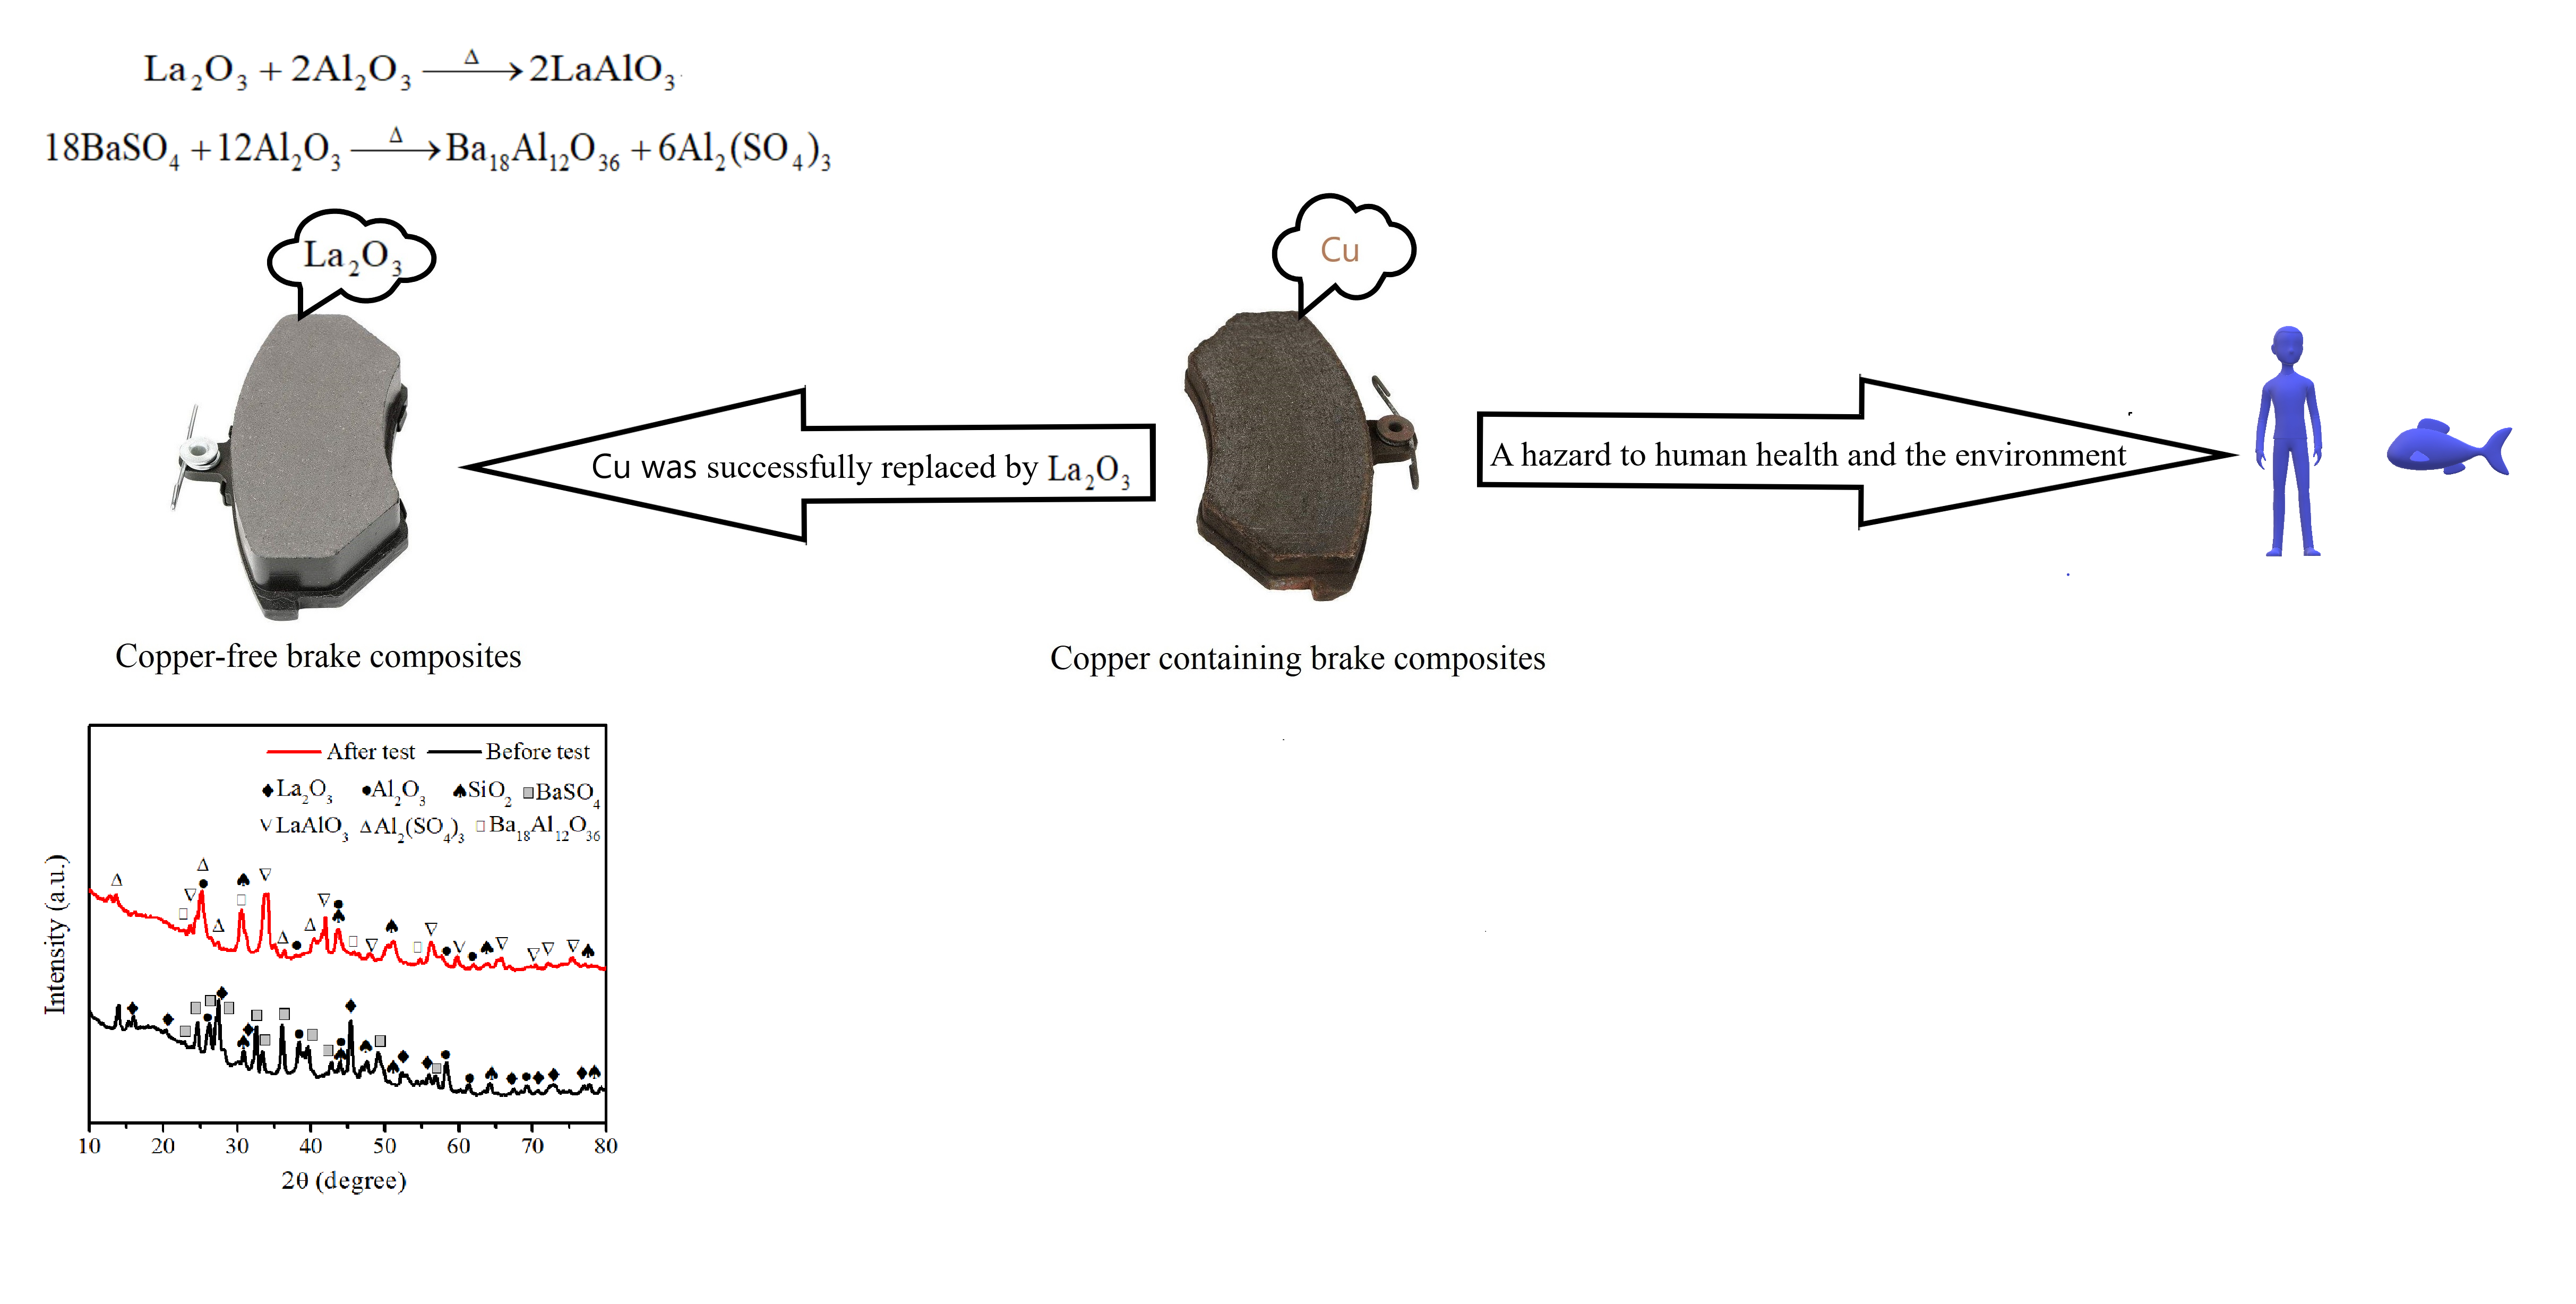
:The main focus of current research in polymeric matrix brake composites is on searching out a replacement for copper, which has been recently proved to be a hazard to human health and the environment. In this paper, rare earth lanthanum oxide was explored for the replacement of copper in composites. The mechanism of the role of lanthanum oxide in brake composites to replace copper was analyzed. Four series of polymeric matrix brake composites with various amounts of copper (15, 10, 5 and 0 wt %) and rare earth lanthanum oxide (0, 5, 10 and 15 wt %) were developed, in which the copper was gradually replaced by lanthanum oxide in the formula. These series were characterized in terms of physical, thermo-physical and mechanical properties. The results show that lanthanum oxide can be successfully used as a replacement for copper in brake composites. Brake composites with 15 wt % lanthanum oxide that are copper-free are considered optimal, where tribo-properties are considered best. Compared with the addition of copper in brake composites, lanthanum oxide is more conducive to the formation of compacted friction films and transfer films, which is beneficial to the tribological properties of the brake composites. The addition of La2O3 to the brake composites can cause the reaction between La2O3 and Al2O3 to form LaAlO3, and the reaction between Al2O3 and BaSO4 can produce Ba18Al12O36 and Al2SO4 during the friction and wear processes, which can effectively improve the tribological properties of the brake composites at elevated temperature. This research was contributive to the copper-free, metal-free and eco-friendly brake composites.

1. Introduction
During braking, the wear debris, which contains several hazardous elements (e.g., copper, lead, zinc, antimony), has been recently proven as a threat to human and aquatic life [1,2,3]. In 2010, California and Washington State pioneered new laws to restrict copper and other heavy metals in brake pads [4]. With the development of the automobile industry, requirements for safety, comfort and environmental friendliness are highly demanded. The development of copper-free, metal-free and eco-friendly brake composites will be a trend in this field. The non-metallization of the polymeric matrix brake composites must be realized by looking for substitute materials of copper.
Copper is an important component in polymeric matrix brake composites and plays a crucial role in the friction properties of the brake composites. The positive effects of copper on brake composites can be summarized in three aspects. First, copper has high thermal conductivity and can effectively conduct away heat from the friction interface, contributing to the good heat resistance of the brake composites [5,6]. Second, copper is often used in the friction material industry as a solid lubricant for high-temperature applications that maintain the stability of friction at elevated temperatures [7,8]. Third, copper is also known for its good ductility, contributing to the formation of friction films, playing an important role in friction and wear properties [9,10,11]. Many scholars worldwide are conducting research to develop brake composites formulations without copper, and some achievements have been reached [12,13,14,15,16,17]. However, most developed copper-free brake composites have weaker friction properties than the copper-containing formulations, and most of them contain one or more types of steel fiber, metal lubricants, metal oxides, etc., which cannot realize polymeric matrix brake composites without metals. Gilardi et al. [18] studied the performance of copper-free brake composites by replacing copper with various types of graphite and reported that different types of graphite and their combined use improved the noise vibration and harshness performance and thermal conductivity of the composites. Aranganathan and Bijwe [19] studied the effect of newly commercially available thermo graphite on the friction properties of copper-free friction materials and concluded that this graphite showed low fade and fluctuations in friction coefficient, but they drastically reduced other friction performance, which were not desirable features. Copper perhaps must be replaced by a combination of ingredients. There has been no single ingredient that can replace copper in brake composites.
Rare earth oxides as inorganic particles are gradually introduced into the preparation of the composites because of their excellent physical and chemical characteristics that improve the properties of many materials. It can be used in composite materials to improve the mechanical properties, interfacial properties, heat resistance, etc. [20,21,22,23]. The oxides are allotropes of hexagonal crystals, which are similar to layered structures with high melting points and low hardness, act as a solid lubricant at high temperature [24]. In our previous works [25,26], the effects of rare earth lanthanum oxide on the mechanical and tribological properties of the brake composites were studied. We found that rare earth lanthanum oxide can significantly improve the mechanical and tribological properties of the brake composites. Based on these findings, this paper studies the mechanism of the role of rare earth lanthanum oxide in brake composites by replacing copper with rare earth oxides. Hence, four series of polymeric matrix brake composites with varying amounts of copper and rare earth lanthanum oxide were designed and developed by reducing the content of copper (15, 10, 5 and 0 wt %) while increasing the corresponding content of lanthanum oxide (0, 5, 10 and 15 wt %) to replace copper.
2. Materials and Methods
2.1. Formulation and Designation of Composites
Rare earth lanthanum oxide (La2O3) was supplied by Foshan blue pigment New Material Co., Ltd. (Foshan, China). Table 1 outlines the details of La2O3, which were provided by the supplier. La2O3 powder was examined by scanning electron microscopy (SEM) (Model SUPRA 55, Carl Zeiss AG, Jena, Germany) and energy dispersive spectrometry (EDS) (Model X-Max50, Oxford Instruments Co., Ltd., Oxford, UK) to study the details of the shape, size, and elements, as shown in Figure 1 and Figure 2. Ceramic fibers was supplied by Zhoukou Qifeng Mineral Fibers Co., Ltd. (Zhoukou, China). Table 2 outlines its details, which were provided by the supplier. Cashew nut-shell-liquid-modified phenolic resin was supplied by Sumitomo (Tokyo, Japan). Table 3 outlines its details, which were provided by the supplier. Amongst eight ingredients of the brake composites, except La2O3, ceramic fibers and phenolic resin, all fillers such as copper (Cu), graphite, alumina, barite and nitrile-butadiene rubber (NBR) powder were procured from a local supplier (Fuzhou Taijiang Pinjie Experimental Instrument Co., Ltd., Fuzhou, China). Table 4 outlines the details of Cu, which were provided by the supplier.
Brake composites containing eight ingredients were formed by keeping 85 wt % fixed (comprising fibres, additives and various fillers) as a parent composition. The balance 15 wt % was adjusted by varying the wt % of Cu as 15, 10, 5 and 0 wt % and compensated with La2O3 (the replacement of Cu). The prepared composites were designated as C15L0, C10L5, C5L10 and C0L15. The full design of the series is shown in Table 5.
2.2. Fabrication of Composites
The ingredients were mixed in a plough type shear mixer (Model JF810S, Jilin Electrical and Mechanical Equipment Co., Ltd., Changchun, China) to ensure macroscopic homogeneity. The mixing was performed for 15 min. Then, the mixture was placed in a four-column hydraulic machine (Model Y32-63, Ruian Huada Machinery Co., Ltd., Ruian, China). The mold cavity was filled with approximately 60 g of the mixture and heat-cured in a compression molding machine under a pressure of 10 MPa for 10 min, at a curing temperature of 160 °C. Five intermittent breathings were provided to allow the volatiles to be expelled during the initiation of curing. Then, the brake composites were post-cured in an oven (Model JF980S, Jilin Electrical and Mechanical Equipment Co., Ltd., Changchun, China) at 160 °C for 12 h. The post-cured brake composites were surface-grinded, polished, and used for further characterization.
2.3. Characterization of Brake Composites
2.3.1. Characterization of Physical, Mechanical, and Thermo-Physical Properties
The developed brake composites were characterized for physical (density and porosity), mechanical (hardness and impact strength) and thermo-physical (thermal conductivity and thermal resistance) properties. The density of the brake composites was calculated based on Archimedes principle. The porosity was measured using the Japanese Industrial standard JIS D 4418-1996 [27], and the porosity, p, can be expressed as
where is the initial mass of the sample, is the mass of the sample after oil absorption, ρ is the density of the sample, and V is the volume of the sample. The hardness was measured using an electric plastic Rockwell hardness tester (Model XHRD-150, Laizhou Huayi Test Instrument Co., Ltd., Laizhou, China), according to the ISO 2039-2:1987 standard [28]. The impact strength of the brake composites was measured using a simply-supported beam pendulum impact tester (Model XJJ-5, Jinan Fangyuan Test Instrument Co., Ltd., Jinan, China), according to the ISO 179-1:2010 standard [29]. The impact strength, , can be calculated by
where A is the energy required for breaking the sample, b is the width of the sample, and d is the thickness of the sample. The tensile strength and elastic modulus of the composites were measured using a microcomputer-controlled electronic universal testing machine (Model CMT-5105, New Sice Materials Testing Co., Ltd., Shenzhen, China), according to the ISO 527-4 standard [30]. Thermo-physical properties such as thermal conductivity and thermal resistance of the brake composites were measured using a thermal conductivity tester (Model DRL-II, Xiangtan Xiangyi Instrument Co., Ltd., Xiangtan, China), according to the ASTM D5470-2006 standard [31]. Each case was measured five times, after which the results were averaged.
2.3.2. Tribological Characterization
The friction and wear performance of the developed brake composites was evaluated using a chase friction tester (Model XYC-A, Xianyang Xinyi Friction and Sealing Equipment Co., Ltd., Xianyang, China), according to the standard SAE J661-1997 [32]. The test specimen had dimensions of 25.4 mm × 25.4 mm and a flat bottom; the radius of the working surface is conformed to the radius of the test drum. For post-cured brake linings, we removed 1.0/1.2 mm to ensure that the resin-impregnated surface was totally removed. The specimen thickness should be approximately six mm as measured in the center of the specimen. The standard consists of two baseline tests, two fade tests, two recovery tests and a single wear test with the load of 667 N. The interface computer stores the acquired data and displays the test results inline. The abstract of the testing schedule is shown in Table 6.
2.3.3. Morphological Characterization
The worn morphology of the samples after tribology testing was analyzed by SEM (Model SUPRA 55, Carl Zeiss AG, Jena, Germany) and EDS (Model X-Max50, Oxford Instruments Co., Ltd., Oxford, UK), which was used to determine the elements distribution of the worn surface of samples. All samples were coated with a thin layer of gold using a sputtering coater (Model 108, Cressington Scientific Instruments Co., Ltd., Watford, UK).
The surface roughness of the samples after tribology testing was measured by a white light confocal 3D profiler (Model Micromeasure II, Stil Co., Saint Hilaire, France). The measuring range of the area is 3000 μm × 3000 μm, and the step-length of the X and Y axis are both 0.5 μm. Each case was measured three times, after which the results were averaged.
In order to study the properties of the transfer film formed on the counter surface, the tribology tests were carried out by a microcomputer controlled friction test machine (Model MMS-2A, Jinan Yihua Tribology Testing Technology Co., Ltd., Jinan, China). The material of the counter surface is gray iron. The worn morphology of the counterpart after tribological testing was analyzed by SEM (Model S-3400N, Hitachi Co., Ltd., Tokyo, Japan) and EDS (Model QUANTAX, Bruker Nano GmbH, Berlin, Germany), which was used to determine the element distribution of the counter surface.
2.3.4. X-ray Diffraction Analysis
To study the role of La2O3 in polymeric matrix brake composites during the friction process, the X-ray diffractometer (Model X’pert3 and Empyrean, Panalytical B.V., Almelo, The Netherlands) was used to make a qualitative analysis on the composites. The anode material was Cu. Measurements were obtained with a scanning rate of 0.013°/s and a diffraction angle range increases from 5° to 90° (2-Theta range), where theta is the angle of incidence of the X-ray beam on the sample. The diffraction patterns were analyzed using MDI jade software.
3. Results and Discussions
3.1. Physical, Mechanical, and Thermo-Physical Properties
The data in Table 7 show that the density and porosity of the brake composites decrease with the decrease in Cu content and increase in La2O3 content. La2O3 is less dense than Cu. With the decrease in Cu content, the amount of La2O3 increases and causes the decrease in density. The porosity of the brake composites decreases in the series because of the closer packing of notably fine La2O3 powder. The hardness and impact strength of the brake composites increase with the decrease in Cu content and increase in La2O3 content. Cu is softer than La2O3. With the decrease in Cu content, the amount of La2O3 increases and causes the increase in hardness. As mentioned, rare earth oxides can be used in composite materials to improve the mechanical properties [21,22,25,26]. The impact strength, tensile strength, and elastic modulus of the brake composites are increased because of the La2O3 content as expected, and the results are in accordance with our previous work [25,26]. The thermal performance of the composites occurs in the following order: C10L5 > C5L10 > C15L0 > C0L15. Composites that contain both Cu and La2O3 are better than those containing only Cu or La2O3 in this aspect. We expect that La2O3 has synergistic effects with Cu in composites, which can further improve the thermal performance of the brake composites.
3.2. Tribological Properties
3.2.1. Friction Coefficient
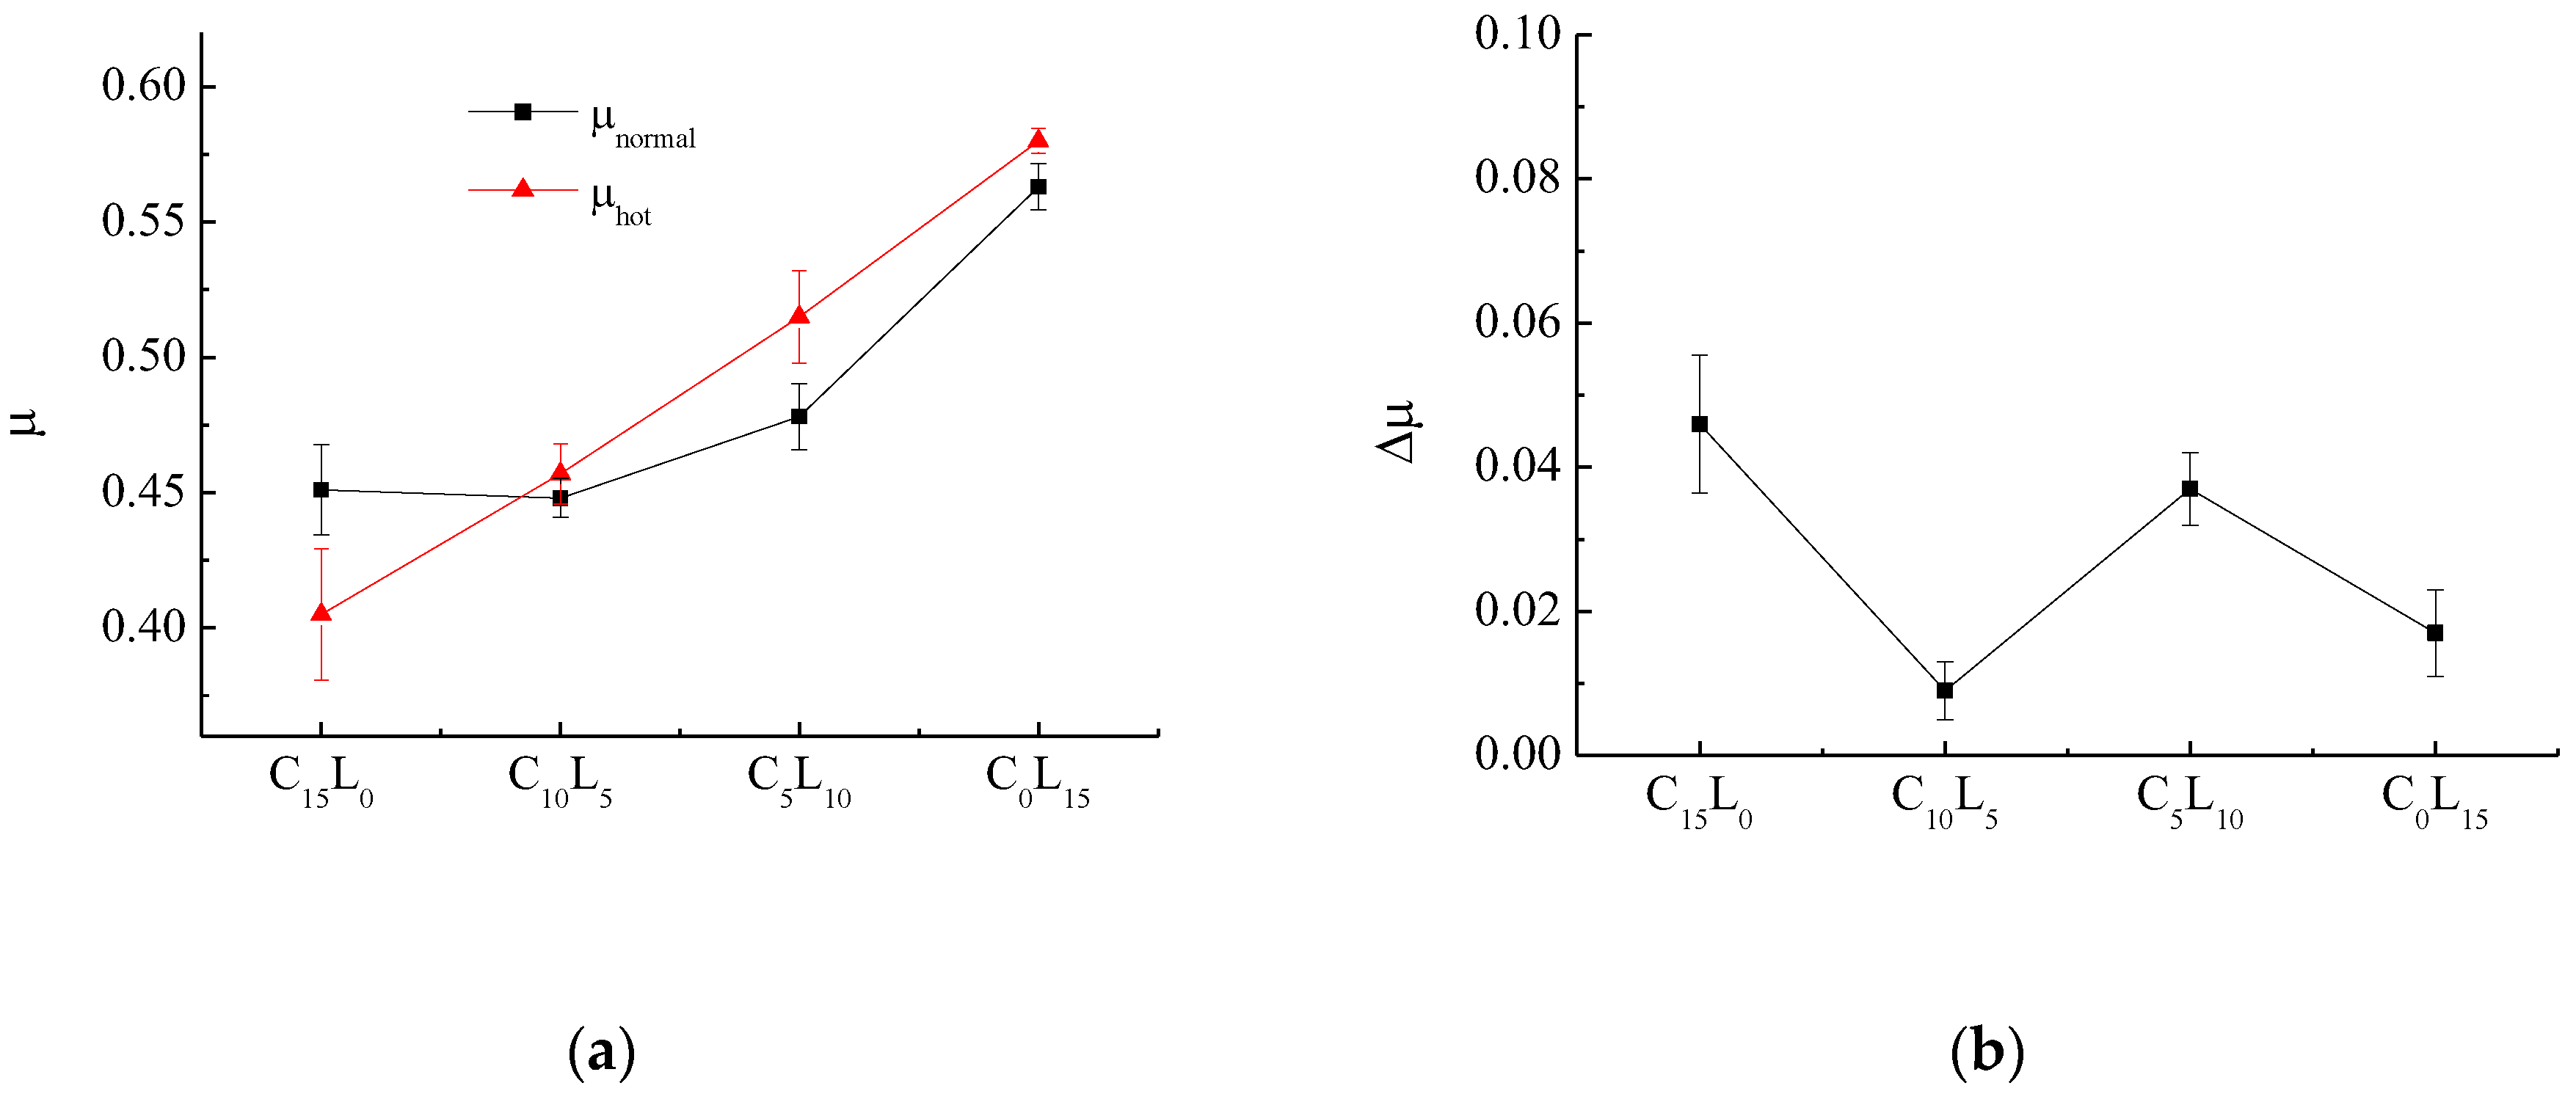
The variation in friction coefficient (μ) with the decrease in Cu content and increase in La2O3 content is shown in Figure 3. The normal friction coefficient (μnormal) was calculated as the average of selected μ values corresponding to 93, 121, 149, and 204 °C from the second fade cycle. For an ideal automotive brake composites, μ should be 0.20–0.70 (higher value is better). The hot friction coefficient (μhot) was calculated as the average of selected μ values that correspond to 204 and 149 °C of the first recovery cycle, 232, 260, 288, 316, and 343 °C of the second fade cycle, and 260, 204 and 149 °C of the second recovery cycle. Δμ was defined as the difference between μnormal and μhot to characterize the friction coefficient stability and is shown in Figure 3b.
Figure 3a shows that μnormal and μhot increase with the decrease in Cu content and increase in La2O3 content, particularly the increase in μhot. Except for C15L0, μhot was higher than μnormal for all composites, which shows the good heating fade resistance of the developed brake composites containing La2O3. Thus, the addition of La2O3 effectively improves μ, particularly for the improvement of μhot. In Figure 3b, the La2O3-containing brake composites has lower Δμ than the La2O3-free brake composites. C10L5 has the lowest Δμ, followed by C0L15 and C5L10. However, C15L0 has the highest Δμ, which is not the desired feature. Thus, the addition of La2O3 is more conducive to the stability of the friction coefficient for brake composites than Cu. C0L15 has the best friction properties. According to modern tribological theory, sliding friction coefficient, μ, is mainly composed of three kinds of friction coefficients, including μa caused by adhesion, μf caused by furrow action and μr caused by roughness. The sliding friction coefficient, μ, can be given by
where μr is not related to the composition of the material but is affected by the state of the friction surface. The above results from Table 7 proved that the hardness, tensile strength, and elastic modulus of the brake composites increase with the decrease in Cu content and increase in La2O3 content. With the increase in tensile strength and elastic modulus of the composites, the shear-resistant of the composite surface is strengthened, leading to the improvement in friction coefficient, which is caused by adhesion (μa). With the increase in the hardness of the composites, the furrow action between the surface of the micro-convex body and its counterpart is strengthened, leading to an improvement in the friction coefficient, which is caused by the furrow action (μf). Therefore, the sliding friction coefficient increases with the increase in La2O3 content.
μ = μa + μf + μr
3.2.2. Fade and Recovery Behavior
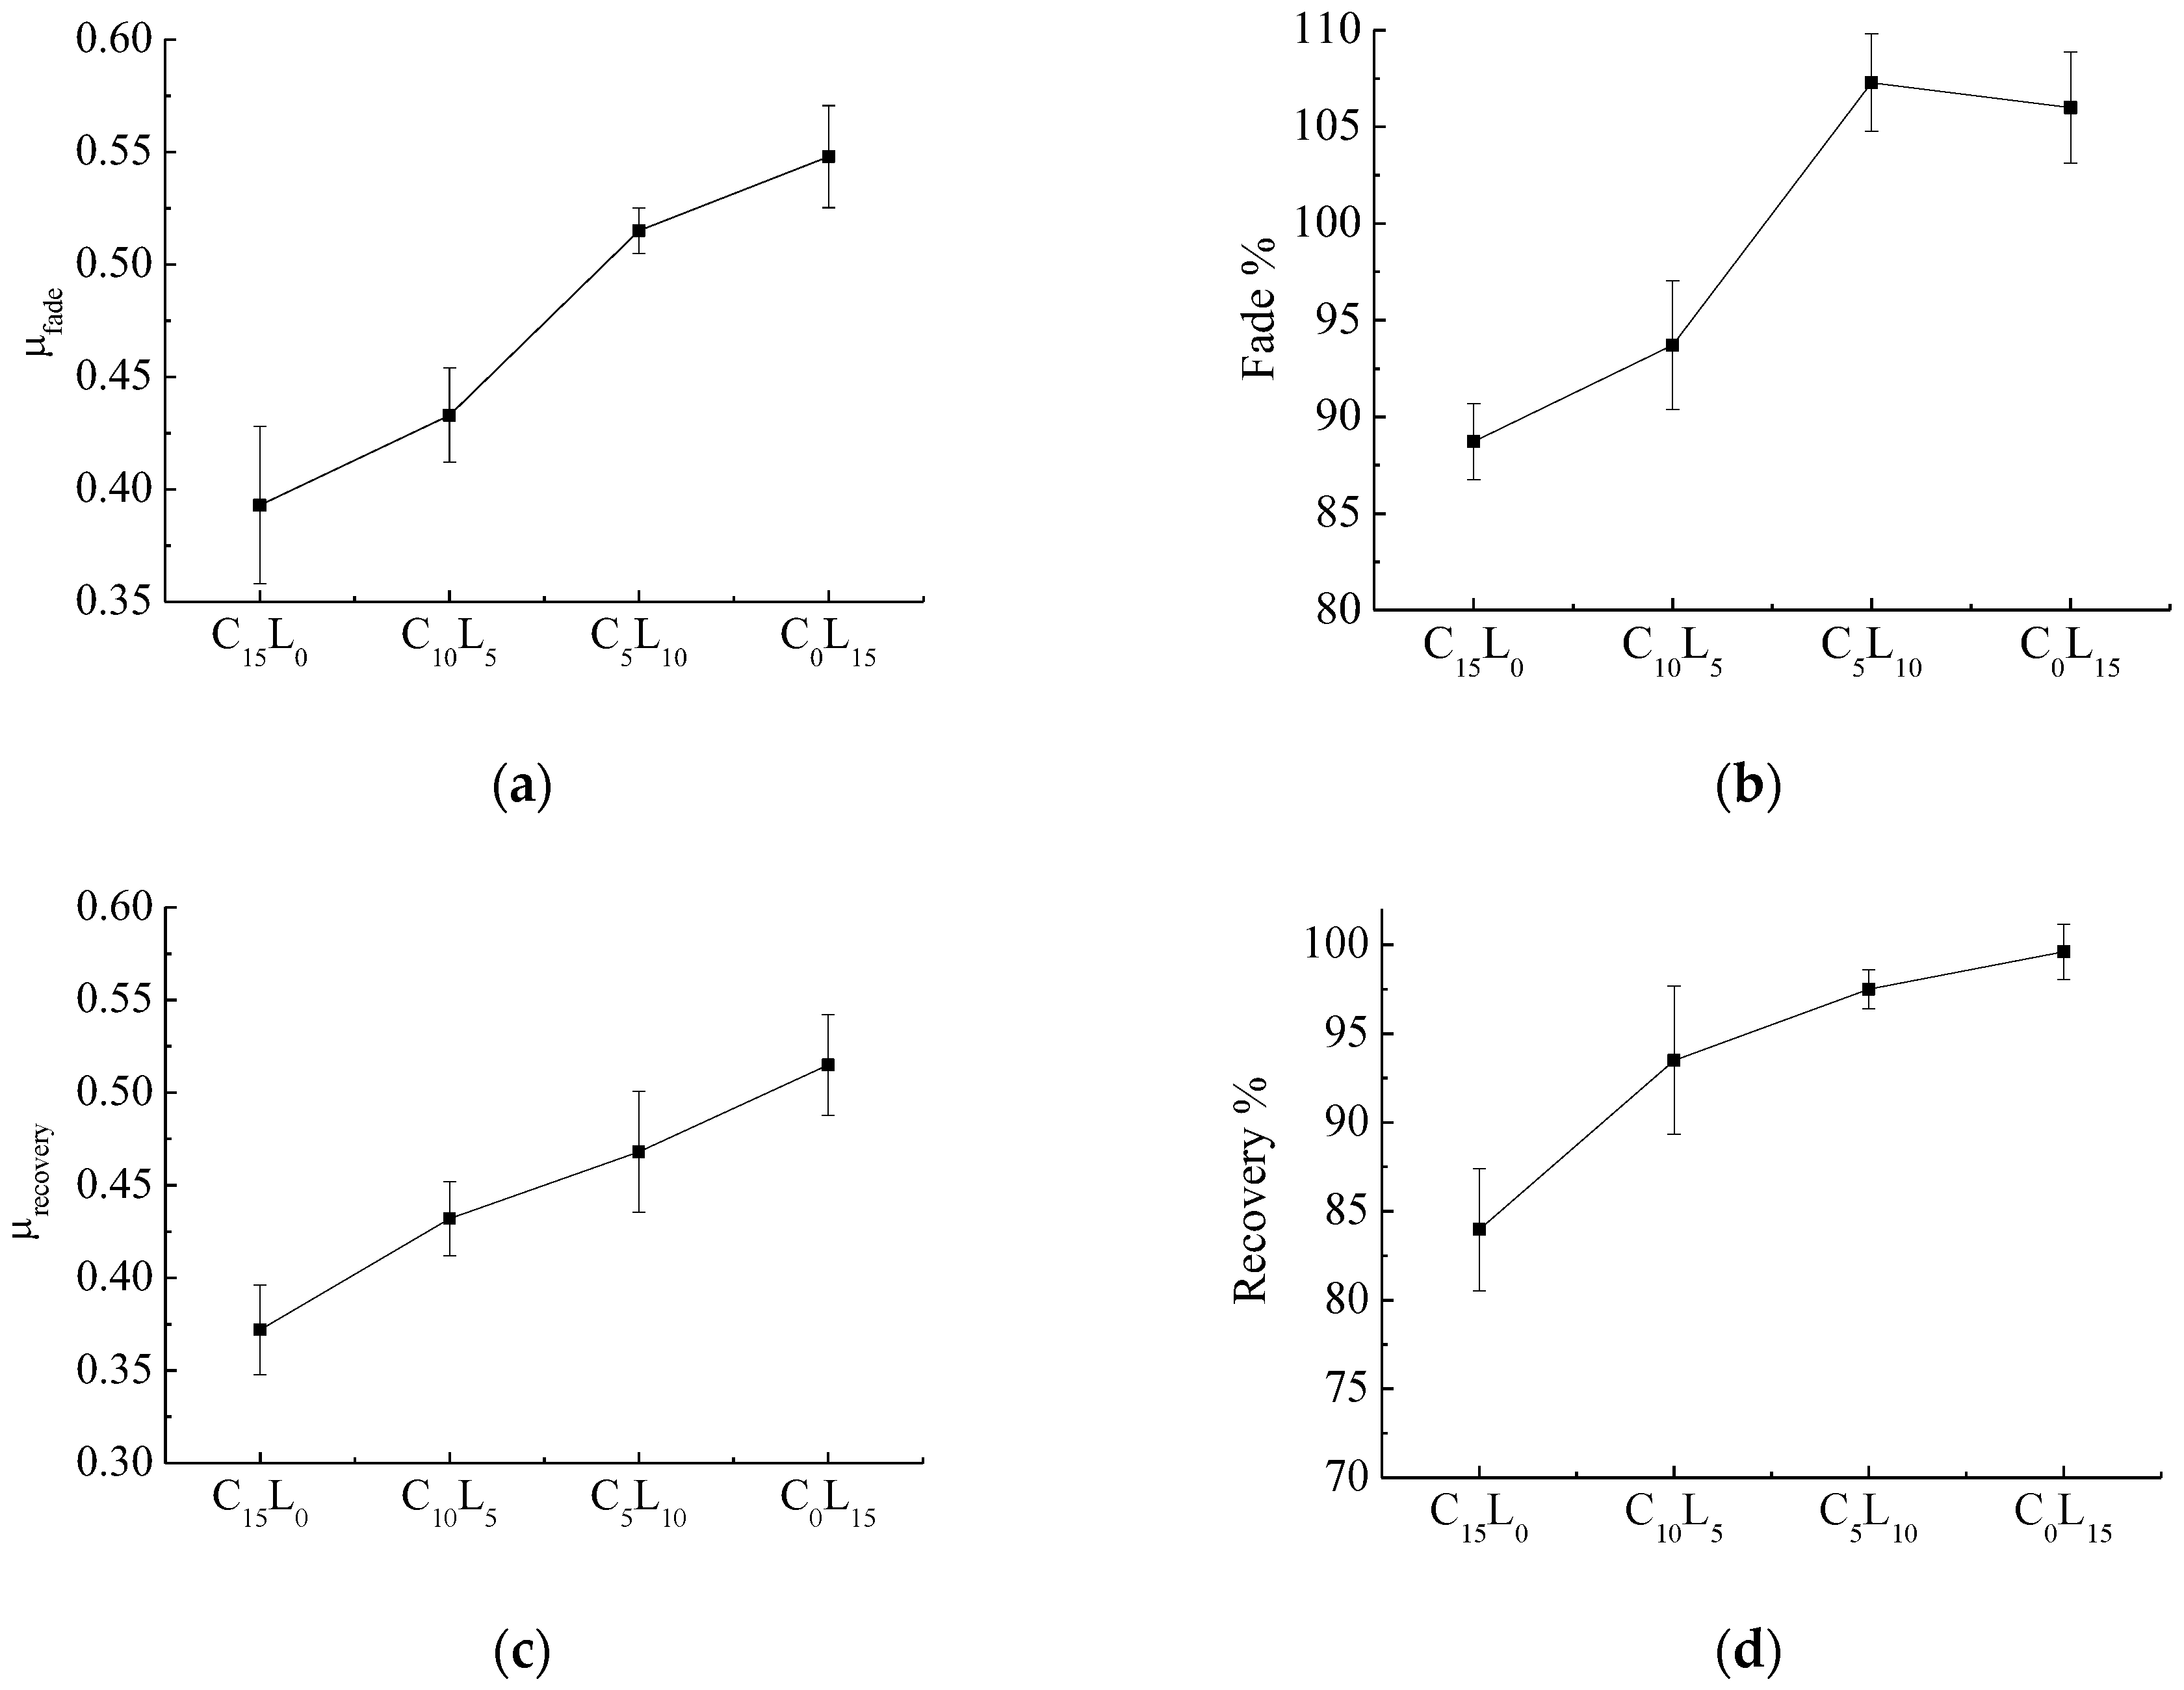
To characterize the fade and recovery properties of all selected composites, various derived friction performance parameters such as μfade, fade% and recovery% were defined as follows: μfade: average μ of the fade and recovery cycles above 260 °C. A higher μ indicates a better heat fading resistance. μbaseline: average μ of the first baseline cycle. μbaseline is defined to assess the friction performance without the effect of temperature. fade%: μfade/μbaseline × 100. A higher % fade ratio is desirable. For an ideal brake composites, fade% should be greater than 80%. recovery%: μrecovery/μbaseline × 100. A higher recovery% is desirable. In general, for an acceptable brake composites, recovery% should be in the desired range (80%–100%). Figure 4 shows the fade and recovery behaviors of all selected composites.
Figure 4a,b shows that μfade and fade% almost increase with the decrease in Cu content and increase in La2O3 content. The added La2O3 into brake composites has the benefit of improving the heat resistance function. The fade% of C5L10 and C0L15, whose values are greater than 100, show that μ of the composites dose not decrease with the increase in temperature but increases and proves the good heating fade resistance of the developed brake composites. This tribological property is different from the traditional properties of the brake composites and similar to carbon-carbon composites, which have been widely used in aircraft brake composites because of their excellent tribological properties [33]. It is expected that the addition of La2O3 in polymeric matrix brake composites will significantly improve the tribological properties. Figure 4c,d shows that μrecovery and recovery% increase with the decrease in Cu content and increase in La2O3 content. The added La2O3 into brake composites has the benefit of improving the recovery function. Compared with C10L5 (composites containing only Cu), C10L5 (composites containing only La2O3) show better heat fading resistance and recovery performance. It can be seen that La2O3 is more conducive to improving the heat fading resistance and recovery performance of the brake composites than copper.
3.2.3. Wear Behavior
The wear of the brake composites was measured by the weight loss method after completing various baseline, fade, and recovery cycles. From Figure 5, the weight loss of the composites first decreases and then increases with the decrease in Cu content and increase in La2O3 content. C10L5 shows the highest wear resistance, followed by C5L10. The composite C15L0 is moderate, whereas C0L15 is poor in wear performance. Evans and Marshall [34] studied the theory of wear and concluded that the wear loss was directly proportional to the elastic modulus and inversely proportional to the hardness. As mentioned above, with the decrease in Cu content, the amount of La2O3 increases and causes the increase in hardness and elastic modulus. From Table 7, it can be seen that the hardness firstly increases rapidly at the beginning and then increases slowly with the increase in La2O3 content, while the elastic modulus increases slowly the first time and then rapidly later. Thus, the wear loss of the composites firstly decreases due to the rapid increase in hardness, and then increases due to the accelerative increase in the elastic modulus. From Figure 5, it also can be seen that the composites that contain both Cu and La2O3 have better wear performance than those containing only Cu or La2O3, where similar synergistic effects were observed with the effect on the thermal performance, as shown in Table 7. When the brake composites have poorer thermal conductivity, less heat is conducted away from the friction interface, contributing to the increase in thermal decomposition of the resin and wear loss of the composites.
Thus, overall, C0L15 is superior to C15L0 in most properties such as μnormal, μhot, Δμ, μfade, μrecovery, fade% and recovery%, whereas C0L15 has slightly superior wear resistance. For brake composites, friction properties are more important than wear resistance. Hence, C0L15 is the optimal sample in this study for the best possible combination of performance properties.
3.3. Worn Surface Analysis
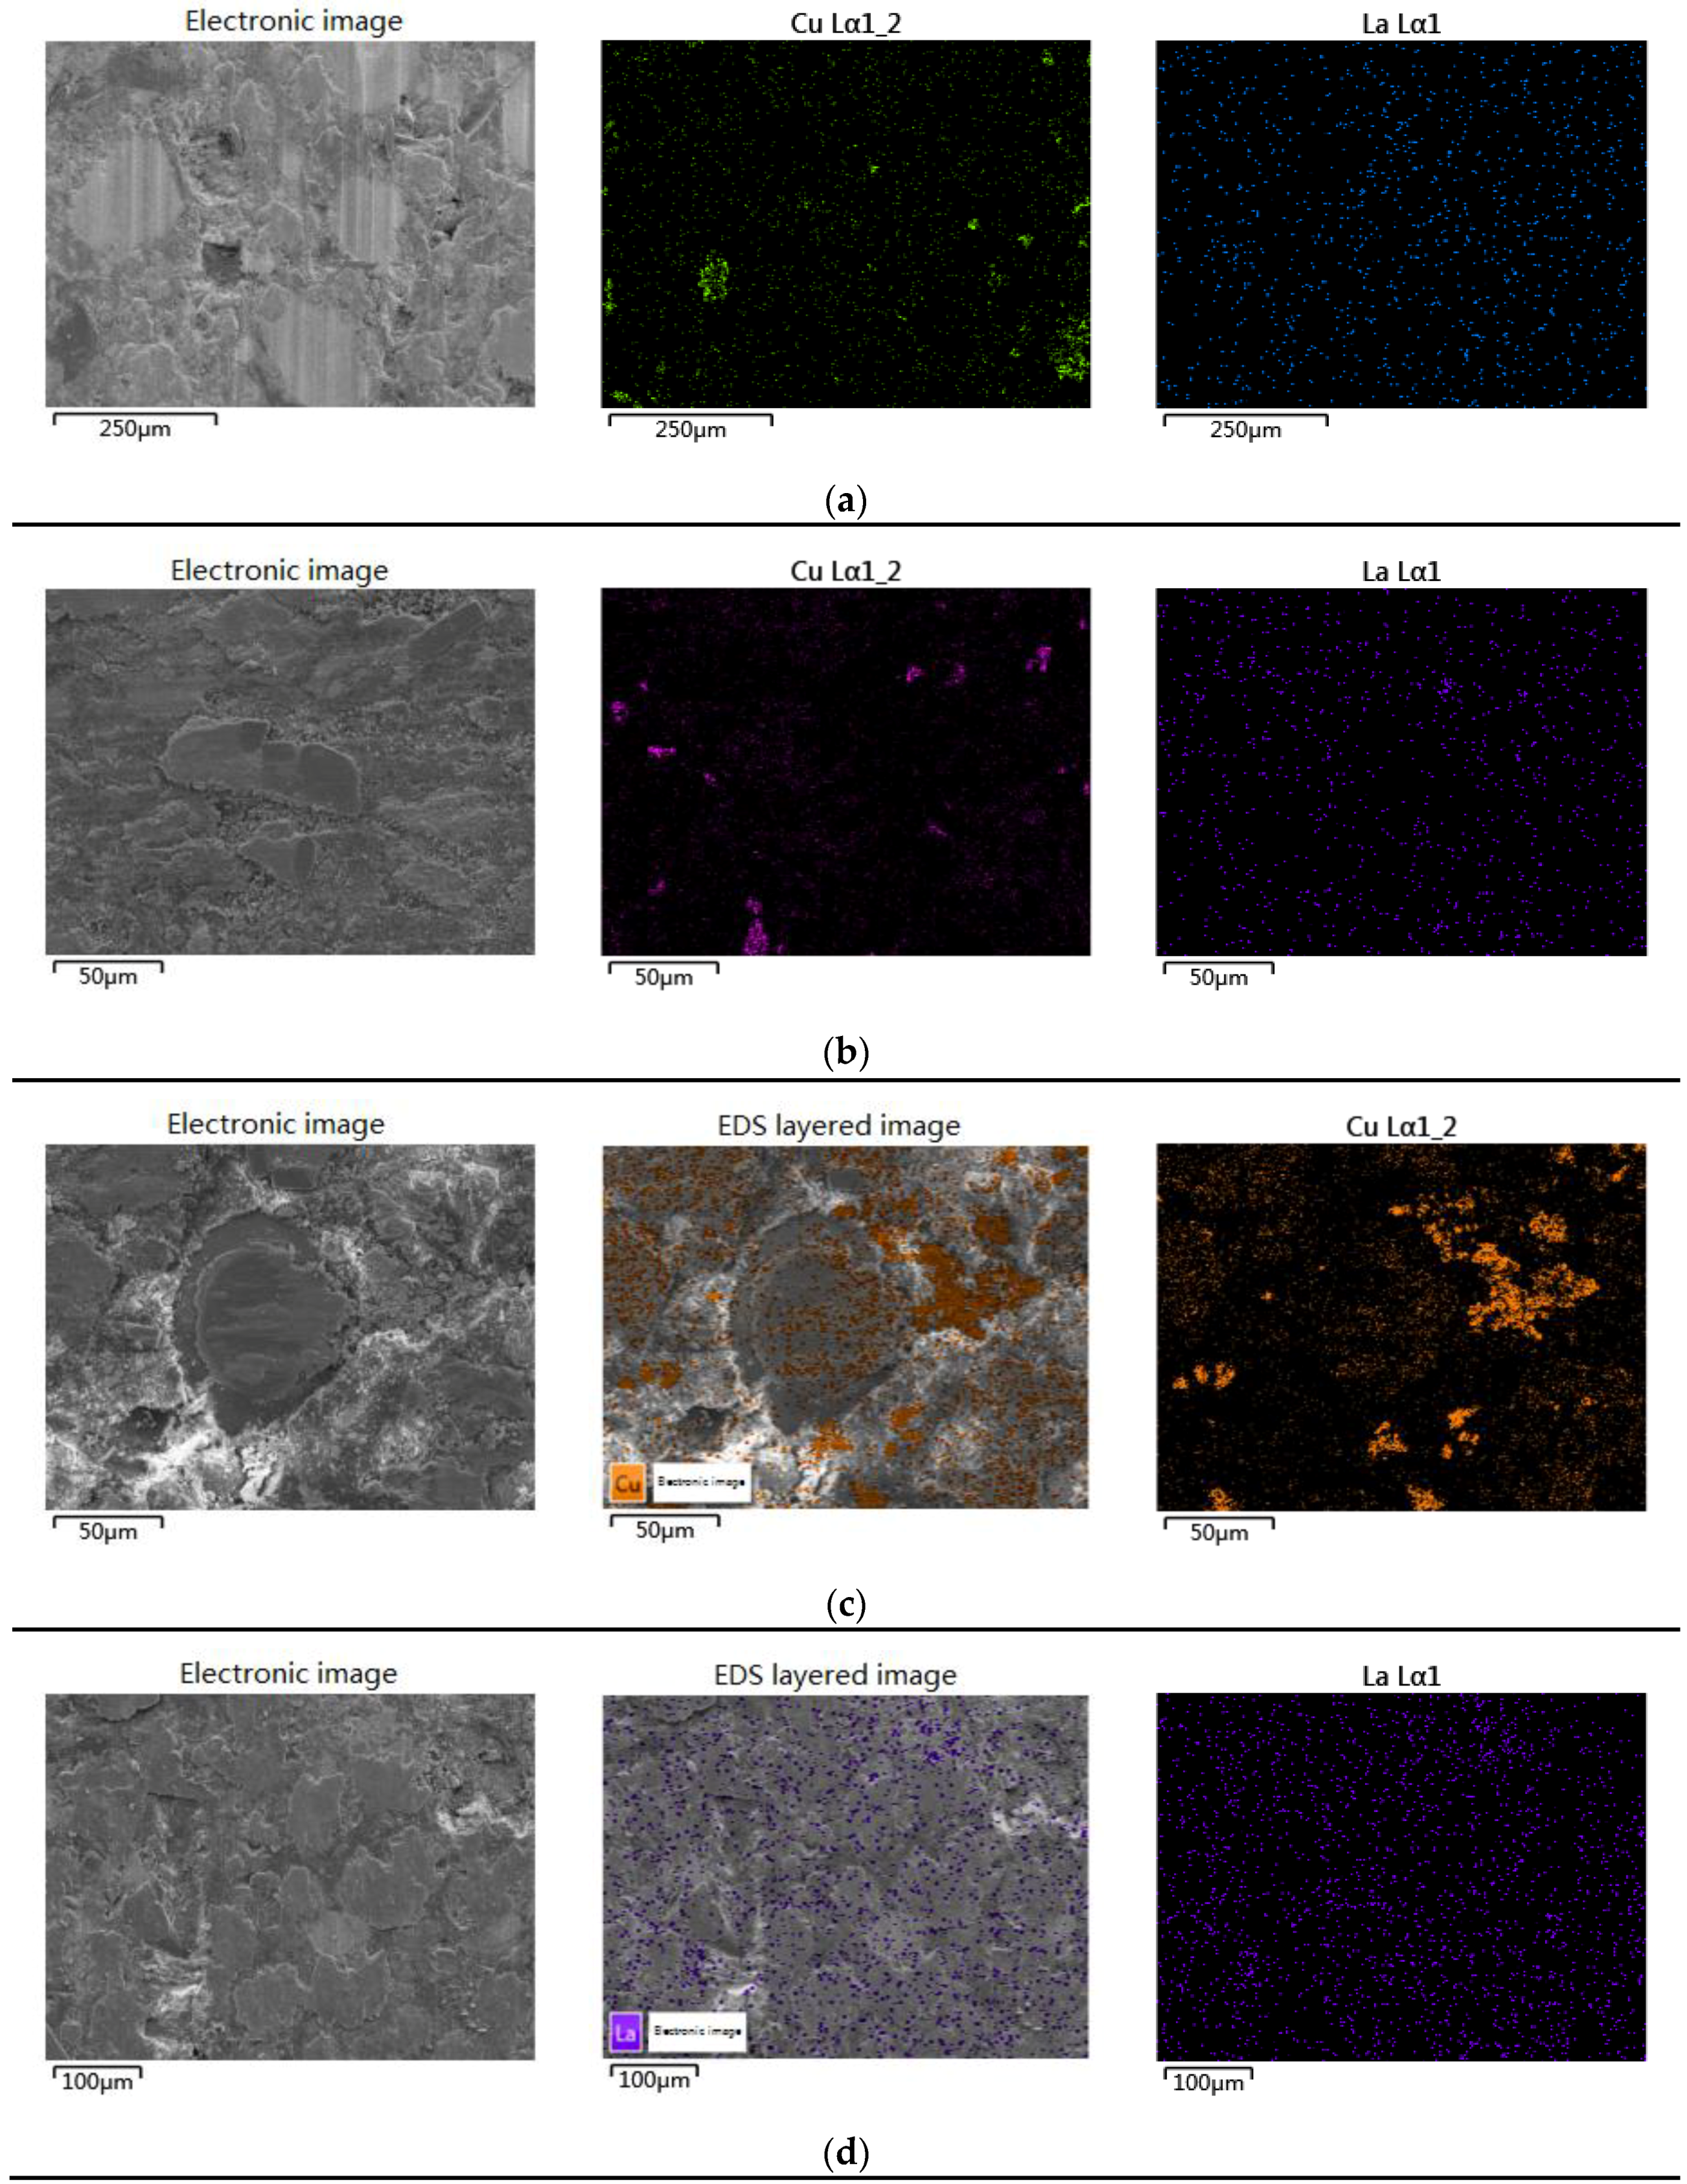
The wear mechanisms during wearing of friction materials are extremely complex dynamic processes, since several interactions such as physical, chemical, and mechanical are simultaneously operative. Consequently, they depend on various factors such as the basic compositions, their synergistic effect, load, velocity, interface temperature, and friction surface characteristics. It is generally acknowledged by most scholars that a uniform, continuous and thin friction film on the interface is beneficial to the stability of μ and good wear resistance [35,36,37]. The worn surfaces of the brake composites studied by SEM are arranged according to their increasing wear resistance (C10L5 > C5L10 > C15L0 > C0L15) in Figure 6. Figure 7 shows their EDS micrographs, and the EDS spectrums are given in Figure S1 in the Supplementary Materials.
The distinct features observed in all micrographs in Figure 6 are the thickness and continuity of the friction film (marked as 1), which are possibly enriched with Cu and La2O3 and must be further confirmed by EDS studies (Figure 7). The micrographs of C10L5 (Figure 6a) show the smoothest and cleanest surface. A thinner and most continuous film enriched with Cu and La2O3 (Figure 7a) of uniform thickness was observed throughout the surface with no crack or degradation of ingredients, supporting its highest wear resistance and stable friction behavior. The surface of C5L10 (Figure 6b) shows discontinuous pieces of friction film enriched with Cu and La2O3 (Figure 7b), which was responsible for its higher wear resistance. The micrographs of C15L0 (Figure 6c) show some damage to the ingredients, wear debris, and the thinnest but discontinuous film enriched with Cu (Figure 7c), which was responsible for some wear. The surface of C0L15 (Figure 6d) shows the thickest friction film enriched with La2O3 (Figure 7d). A small amount of thick friction film (marked as 2) was easily abraded from the surface, which caused more wear.
By contrast with the EDS elemental mapping images of the worn surface of C15L0 (Figure 7c) and C0L15 (Figure 7d), lanthanum oxide is more uniformly distributed on the surface than copper, which is more conducive to the formation of a continuous friction film. The lanthanum oxides are allotropes of hexagonal crystals, which are similar to layered structures, possessing high melting points and a low hardness. From Figure 7d, it can be seen that the friction film enriched with La coated on the worn surface, which can act as a solid lubricant at high temperatures as expected [24]. With more La2O3, a thicker friction film is formed. However, the thick oxide film is more easily worn out from the surface as C0L15, which is not desirable.
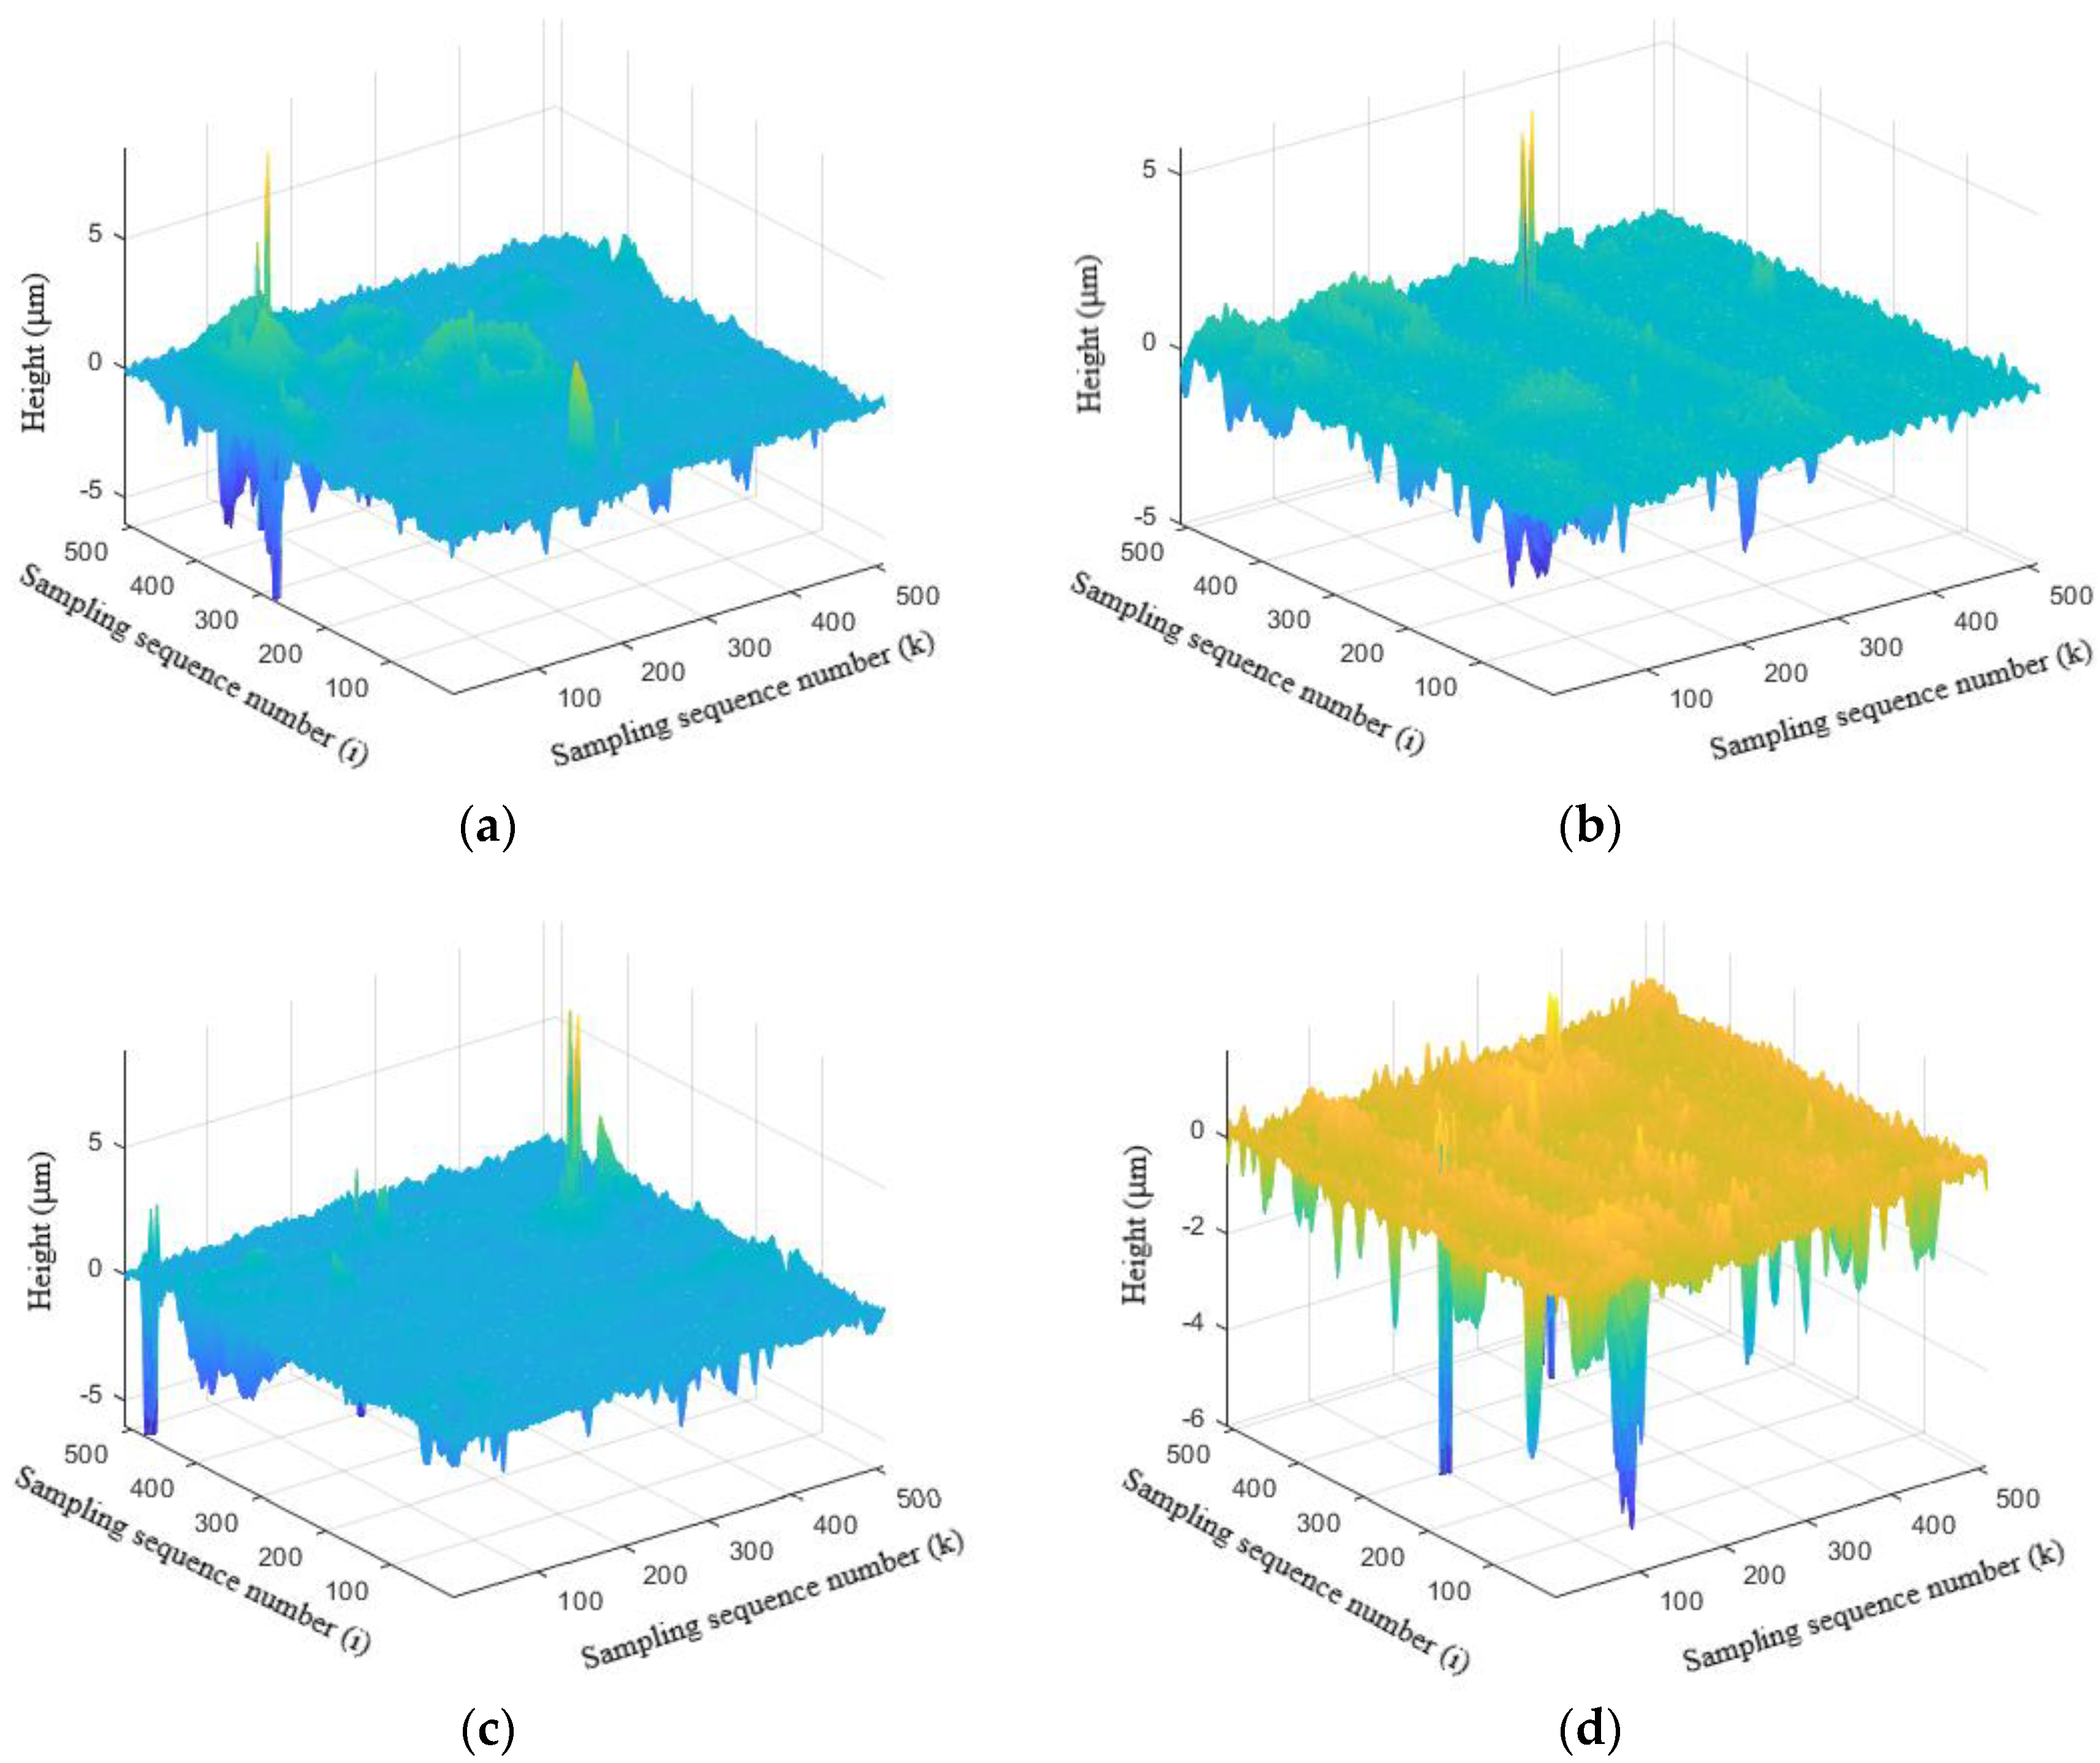
3.4. Three-Dimensional Surface Texture Analysis
As previously mentioned, the friction coefficient caused by roughness, μr, is affected by the state of the friction surface. The measurements of 3-D surface topography of the worn surfaces of the brake composites after tribology testing are shown in Figure 8. The obtained roughness parameters of the worn surface roughness of specimens are shown in Table 8.
Sa shows the deviation of surface height, and can be expressed as
where z(xk, yl) is the height of the Z axis at the coordinate point, M is the length of 3-D surface image, N is the width of 3-D surface image, and u can be computed by
Sq shows the standard deviation of surface height, and can be given by
Sku shows the steepness of surface topography, and can be defined as
where Sku = 3, Sku < 3, and Sku > 3 are interpreted as a normal distribution, the probability dispersion of height distribution, and the probability concentration of height distribution, respectively. The smaller Sku is, the more amounts of surface peaks will be.
From Figure 8 and Table 8, it can be seen that the value of Sq of the brake composites containing La2O3 is much lower than that containing Cu under the same condition, indicating that the brake composites containing La2O3 have a lower surface roughness during the friction process. As mentioned above, La2O3 is more conducive to the formation of friction film than Cu and causes the decrease in surface roughness. The values of Sku in Table 8 are all greater than three, indicating that all the specimens surface have surface peaks. With the decrease in Cu content, the amount of La2O3 increases and causes the increase in the values of Sku. It can be seen that the surface of C0L15 demonstrates more peaks than any other types. As the amount of peaks increases on the surface, the furrow action enhances and causes the increase in friction coefficient. Thus, C0L15 has the best friction properties.
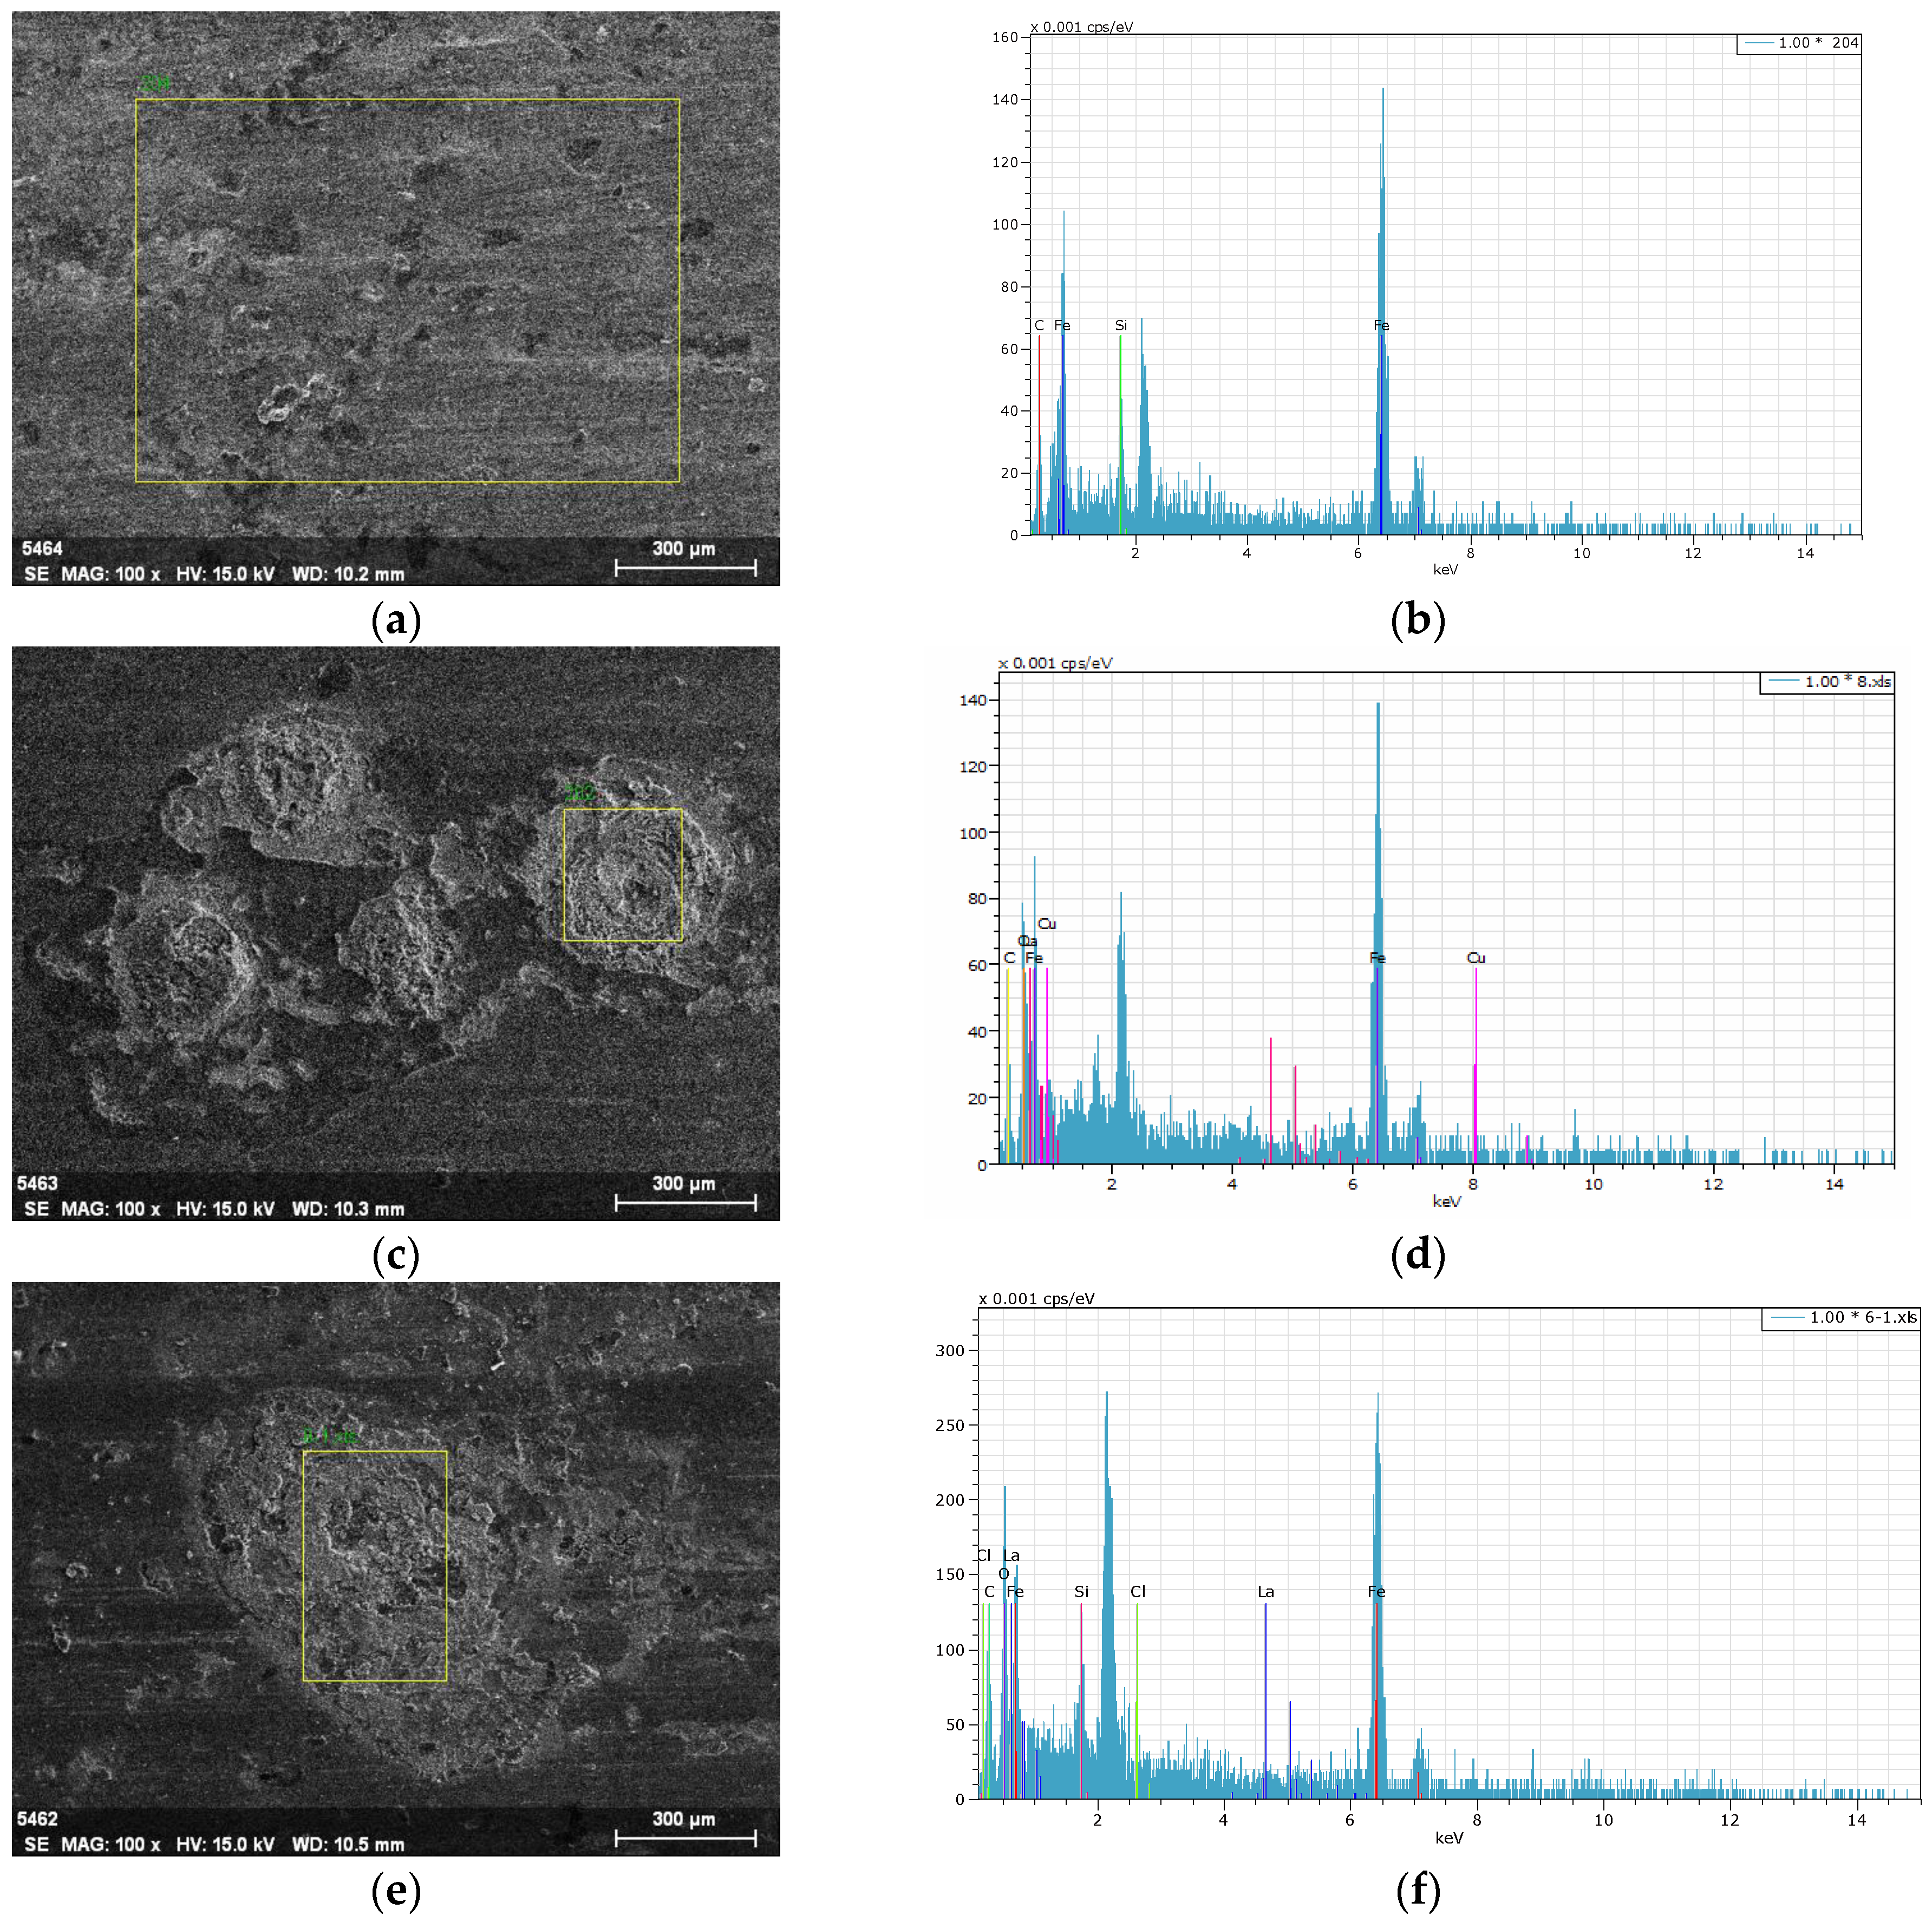
3.5. Friction Transfer Film
The tribological properties of the brake composites is directly affected by the thickness, uniformity, and continuity of the transfer film formed on the counter surface. Many research results indicated that copper has a good ductility, which is conducive to the formation of stable, continuous and uniform friction transfer film on the counter surface, and plays a role in stabilizing the friction coefficient and reducing wear loss [9,10,11,38]. In order to study whether La2O3 could play a role similar to Cu during the friction process, the coupled parts before and after tribology testing with C15L0 and C0L15 were analyzed by SEM and EDS. The SEM micrographs and EDS spectrums of the counter surface are shown in Figure 9. From Figure 9, compared with the coupled part before tribology testing (Figure 9a), transfer films were formed on the counter surface after tribology testing (Figure 9c,e), which were further confirmed as films enriched with Cu and La2O3 (Figure 9d,f), respectively. Compared with Figure 9c, the transfer layer formed on the counter surface after tribology testing with C0L15 (Figure 9e) was more continuous and compacted, helping to the better tribological properties of C0L15 than C15L0. It can be seen that the addition of La2O3 to brake composites is more conducive to the formation of uniform and continuous transfer film on the counter surface than Cu. Overall, rare earth La2O3 can be successfully used as a replacement for Cu in brake composites.
3.6. X-ray Diffraction Analysis
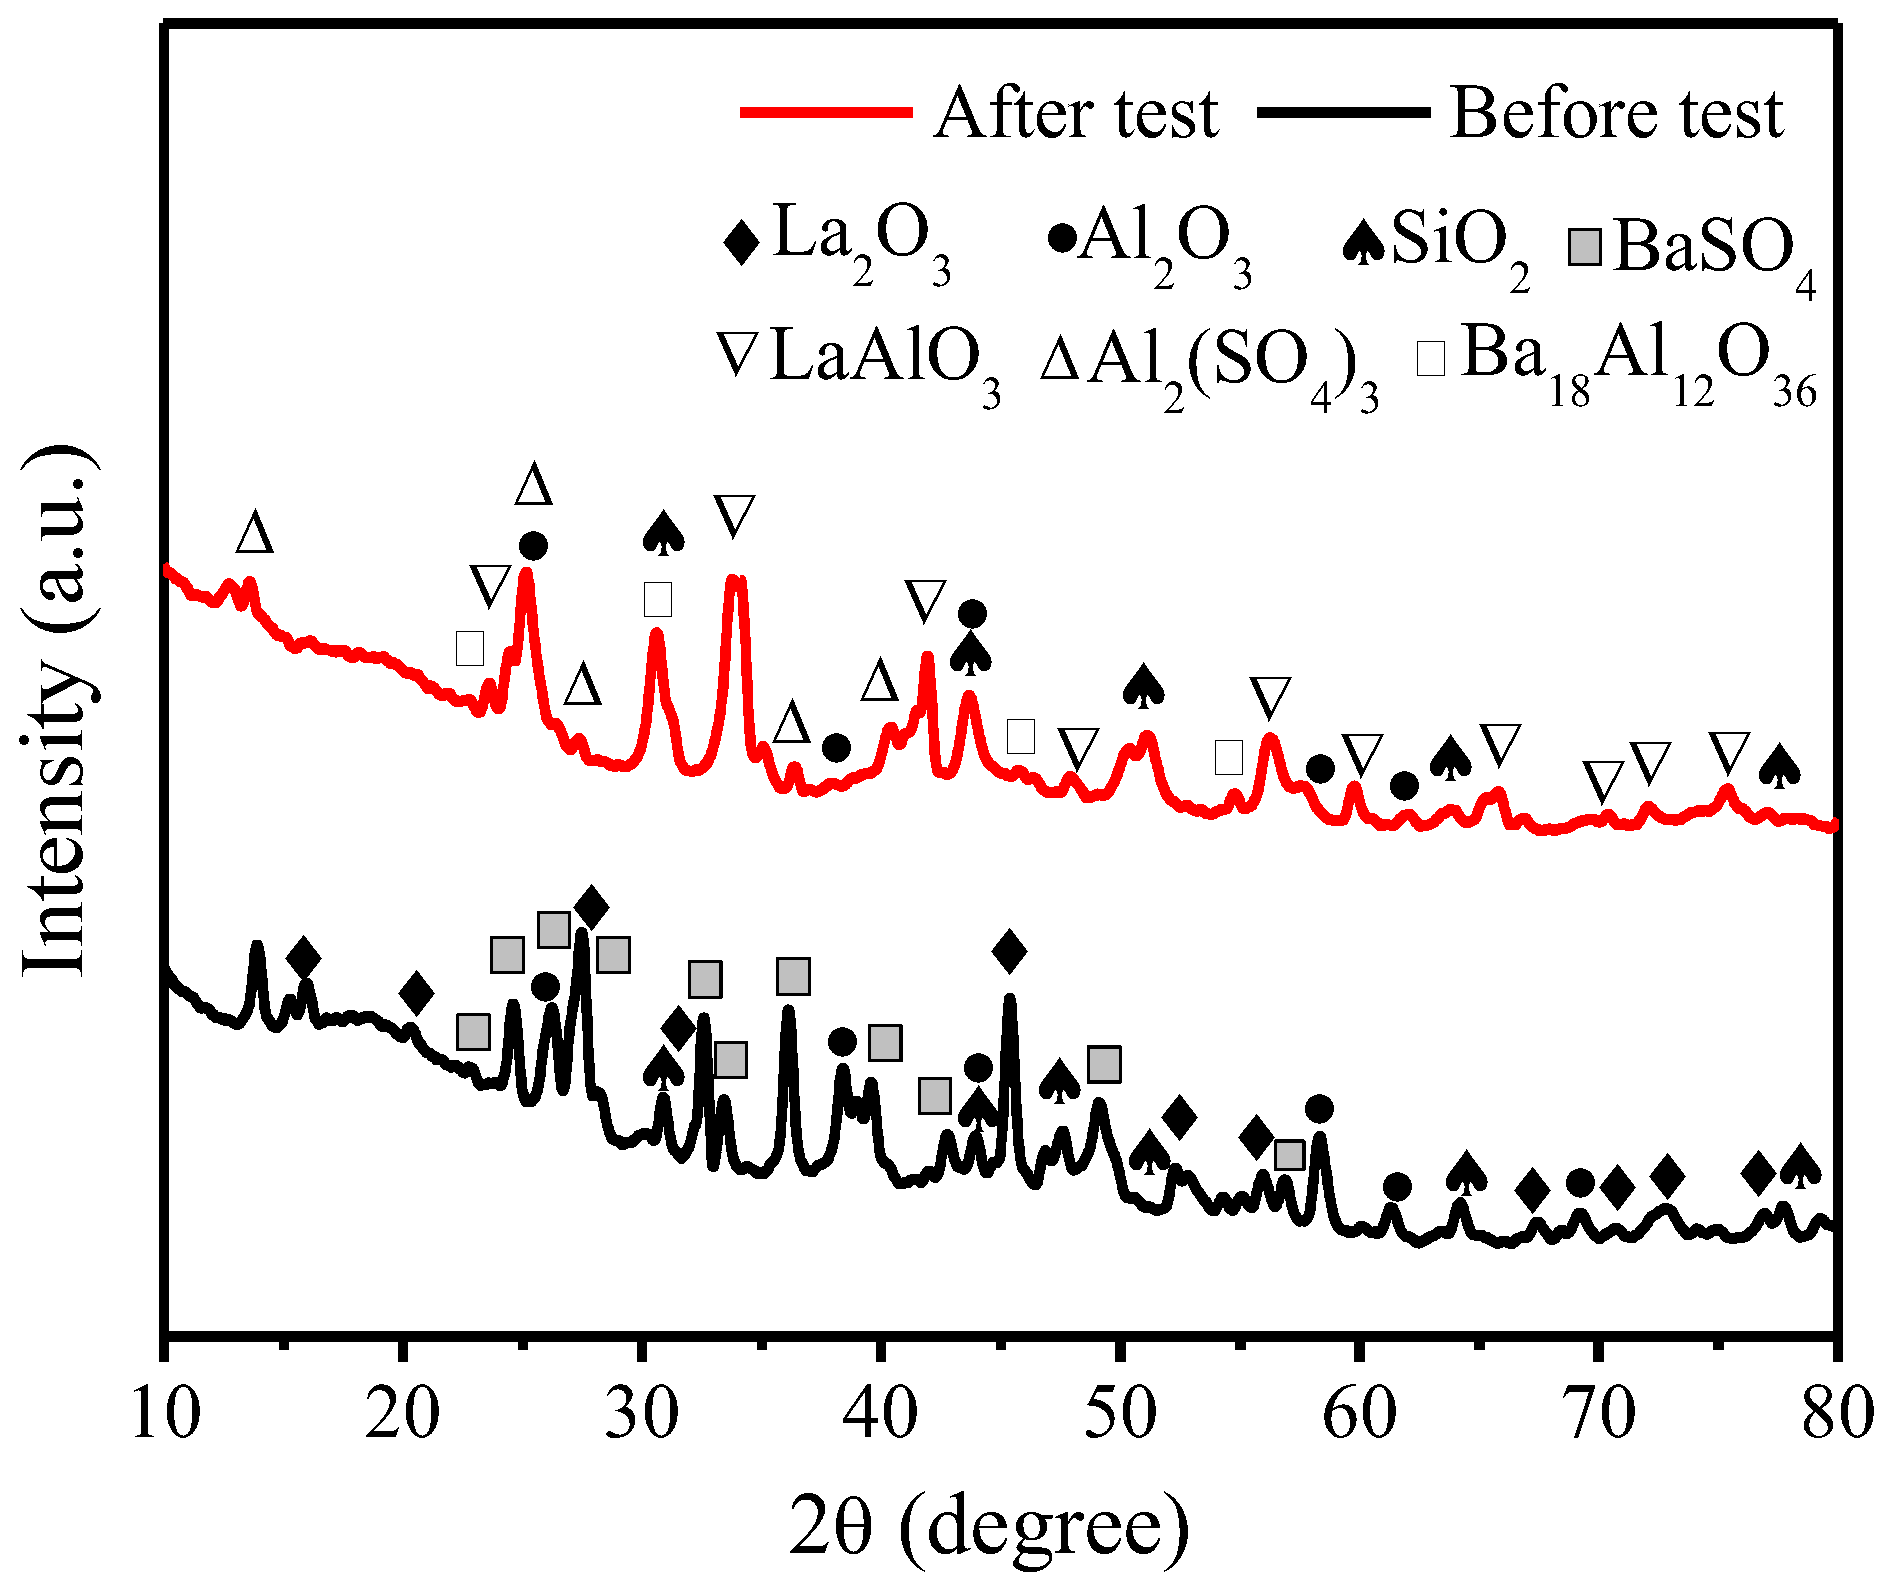
To further study the role of La2O3 during friction and wear processes, the qualitative phase analysis of C0L15 before and after tribology testing was carried out with X-ray diffraction (XRD). The XRD patterns are shown in Figure 10. It can be seen that C0L15 before tribology testing appears to have diffraction peaks of La2O3, Al2O3, SiO2 and BaSO4, which are consistent with the composition of C0L15. Compared with C0L15 before tribology testing, C0L15 after tribology testing appears to have diffraction peaks of Al2O3 and SiO2, and the new diffraction peaks of LaAlO3, Ba18Al12O36 and Al2(SO4)3, while the diffraction peaks for the La2O3 and BaSO4 phase disappear, suggesting that the chemical reaction occurs during the friction and wear processes.
The friction and wear processes of the brake composites are extremely complex dynamic processes, since several interactions such as physical, chemical, and mechanical are simultaneously operative. Under the interaction of external force, chemistry, heat and rare earth lanthanum oxide with excellent chemical activity, the chemical reaction occurs among components. The reaction between La2O3 and Al2O3 can form LaAlO3. The chemical equation can be expressed as
BaSO4 reacting with Al2O3 yields Ba18Al12O36 and Al2(SO4) 3. The chemical equation can be given by
Compared with La2O3, LaAlO3 shows hexagonal crystals as well [39], which is similar to layered structures with lower melting points and lower hardness, and is more conducive to the formation of continuous and compacted friction films. LaAlO3 can be used in functional ceramics with high quality [40]. The generated Ba18Al12O36 belongs to the barium aluminate salts, which can be used as inorganic bonding materials, and has excellent high temperature properties [41]. The produced Al2SO4 has a melting point of 770 °C, and can be used as an inorganic binder [42]. Given the above, the addition of La2O3 to the brake composites can lead to the reaction between La2O3 and Al2O3 to form LaAlO3, and lead to the reaction between Al2O3 and BaSO4 to produce Ba18Al12O36 and Al2SO4 during the friction and wear processes. This process is similar to the mechanism of sintering ceramics that enables the previously accumulated inorganic filler to bind together with chemical bonds, which can effectively improve the tribological properties of the brake composites at elevated temperature. The traditional resin-based brake materials will suffer from the decrease of friction coefficient at elevated temperature, owing to the limited heat resistance of the phenolic resin. As previously mentioned, μhot for all developed brake composites containing La2O3 was higher than that of μnormal. This tribological property of the composites is opposite to the traditional resin-based brake composites, and is in accordance with the property of the ceramic brake composites at elevated temperature [43,44]. Overall, the addition of La2O3 to the brake composites can promote chemical reaction between inorganic fillers, and act as an inorganic binder at elevated temperature, which can effectively improve the tribological properties of the brake composites.
4. Conclusions
This study aims to use its findings as a guide to the development of Cu -free, metal-free and eco-friendly brake composites. The results obtained are useful for understanding the mechanism of the role of La2O3 in polymeric matrix brake composites to replace Cu. Cu can be successfully replaced by La2O3 in brake composites. The results are summarized as follows:
- For almost all important properties (e.g., μnormal, μhot, Δμ, μfade, μrecovery, fade% and recovery%), Cu-free brake composites (C0L15) performed significantly better than the brake composites containing Cu without La2O3 (C15L0), while the Cu-contained brake composites (C15L0) are slightly superior in thermal performance and wear resistance.
- La2O3 has synergistic effects with Cu in the composites, which can further improve the thermal performance and wear resistance of the brake composites. Composites containing both Cu and La2O3 have better thermal and wear performance than those containing only Cu or La2O3.
- The addition of La2O3 in brake composites improves the heat resistance function compared to the addition of Cu. The friction coefficient (μ) increases with the increase in temperature, which is different from the traditional properties of the brake composites and proves the best heating fade resistance of the developed copper -free brake composites.
- Compared with the addition of Cu in brake composites, La2O3 is more conducive to the formation of continuous and compacted friction films and transfer films and causes the decrease in surface roughness, which is beneficial to the tribological properties of the brake composites.
- The addition of La2O3 to the brake composites can cause the reaction between La2O3 and Al2O3 to form LaAlO3, and cause the reaction between Al2O3 and BaSO4 to produce Ba18Al12O36 and Al2SO4 during the friction and wear processes. This process is similar to the mechanism of sintering ceramics, which can effectively improve the tribological properties of the brake composites at elevated temperature.
Supplementary Materials
The following are available online at https://www.mdpi.com/2073-4360/10/9/1027/s1, Figure S1: EDS spectrums of the worn surfaces of the brake composites: (a) C10L5; (b) C5L10; (c) C15L0; (d) C0L15.
Author Contributions
C.G. and K.Z. have conceived the idea and supervised the whole procedure. K.Z. wrote the paper and contributed to the whole process of the preparation of samples, experimental measurement, and interpretation of results. F.H. contributed to the process of the preparation of samples. Y.L. contributed to the discussion of the experimental results and all authors provided feedback.
Funding
The authors gratefully acknowledge the financial support of the National Science Foundation of China (Grant No. 51375094) and Fujian Provincial Collaborative Innovation Center for High-end Equipment Manufacturing (No. 0020-50006103).
Acknowledgments
The authors are grateful to the Haixi Institutes of Chinese Academy of Sciences for the support of thermal performance testing of the brake composites.
Conflicts of Interest
The authors declare no conflict of interest.
References
- Hjortenkrans, D.; Bergbäck, B.; Häggerud, A. New metal emission patterns in road traffic environments. Environ. Monit. Assess. 2006, 117, 85–98. [Google Scholar] [CrossRef] [PubMed]
- Kukutschová, J.; Roubíek, V.; Malachová, K.; Pavlícková, Z.; Holua, R.; Kubaková, J.; Mika, V.; MacCrimmon, D.; Filip, P. Wear mechanism in automotive brake composites, wear debris and its potential environmental impact. Wear 2009, 267, 807–817. [Google Scholar] [CrossRef] [Green Version]
- Hagino, H.; Oyama, M.; Sasaki, S. Laboratory testing of airborne brake wear particle emissions using a dynamometer system under urban city driving cycles. Atmos. Environ. 2016, 131, 269–278. [Google Scholar] [CrossRef]
- Copper-Free Brakes Initiative. Available online: http://www.copperfreebrakes.org (accessed on 19 October 2017).
- Kumar, M.; Bijwe, J. Non-asbestos organic (NAO) friction composites: Role of copper; its shape and amount. Wear 2011, 270, 269–280. [Google Scholar] [CrossRef]
- Kumar, M.; Bijwe, J. Optimized selection of metallic fillers for best combination of performance properties of friction materials: A comprehensive study. Wear 2013, 303, 569–583. [Google Scholar] [CrossRef]
- Kumar, M.; Bijwe, J. NAO friction materials with various metal powders: Tribological evaluation on full-scale inertia dynamometer. Wear 2010, 269, 826–837. [Google Scholar] [CrossRef]
- Kumar, M.; Bijwe, J. Role of different metallic fillers in non-asbestos organic (NAO) friction composites for controlling sensitivity of coefficient of friction to load and speed. Tribol. Int. 2010, 43, 965–974. [Google Scholar] [CrossRef]
- Kim, S.J.; Lee, J.Y.; Han, J.M.; Kim, Y.C.; Park, H.D.; Sung, S.H.; Lee, J.J.; Cha, J.H.; Jo, J.H. The role of copper on the friction and wear performance of automotive brake composites. SAE Int. J. Mater. Manuf. 2012, 5, 9–18. [Google Scholar] [CrossRef]
- Österlea, W.; Prietzela, C.; Kloßa, H.; Dmitriev, A.I. On the role of copper in brake composites. Tribol. Int. 2010, 43, 2317–2326. [Google Scholar] [CrossRef]
- Menezes, P.L. Study of friction and transfer layer formation in copper-steel tribo-system: Role of surface texture and roughness parameters. Tribol. Trans. 2009, 52, 6–11. [Google Scholar] [CrossRef]
- Lee, P.W.; Filip, P. Friction and wear of Cu-free and Sb-free environmental friendly automotive brake composites. Wear 2013, 302, 1404–1413. [Google Scholar] [CrossRef]
- Aranganathan, N.; Bijwe, J. Development of copper-free eco-friendly brake-friction material using novel ingredients. Wear 2016, 352–353, 79–91. [Google Scholar] [CrossRef]
- Subramanian, V. Friction Material for Brakes—A Copper and Titanate Free Nonasbestos Friction Material. U.S. Patent Application No. 20100084232A1, 8 April 2010. [Google Scholar]
- Chen, H.; Paul, H.G. Copper-Free Friction Material for Brake Pads. C.N. Patent Application No. 102971550A, 13 March 2013. [Google Scholar]
- Zhang, J.Z. Copper-Free Friction Material Composition for Brake Pads. U.S. Patent Application No. 2014357758A1, 4 December 2014. [Google Scholar]
- Cox, R.L. Copper Free Friction Material Composition. U.S. Patent Application No. 20150369321A1, 24 December 2015. [Google Scholar]
- Gilardi, R.; Alzati, L.; Thiam, M.; Brunel, J.; Desplanques, Y.; Dufrénoy, P.; Sharma, S.; Bijwe, J. Copper substitution and noise reduction in brake pads: Graphite type selection. Materials 2012, 5, 2258–2269. [Google Scholar] [CrossRef]
- Aranganathan, N.; Bijwe, J. Special grade of graphite in NAO friction materials for possible replacement of copper. Wear 2015, 330–331, 515–523. [Google Scholar] [CrossRef]
- Peng, G.; Zheng, D.; Cheng, C.; Zhang, J.; Zhang, H. Effect of rare-earth addition on morphotropic phase boundary and relaxation behavior of the PNN-PZT ceramics. J. Alloy. Compd. 2017, 693, 1250–1256. [Google Scholar] [CrossRef]
- Cheng, X.H.; Shang-Guan, Q.Q. Effect of rare earths on mechanical and tribological properties of carbon fibers reinforced PTFE composite. Tribol. Lett. 2006, 21, 153–159. [Google Scholar] [CrossRef]
- Bao, D.D.; Cheng, X.H. Tribological behavior of polytetrafluroethylene composites filled with rare earths treated carbon fiber under dry friction condition. Tribology 2006, 26, 135–139. [Google Scholar]
- Zhang, S.H.; Wang, S.X.; Huang, Z.H. A kinetic analysis of thermal decomposition of polyaniline and its composites with rare earth oxides. J. Therm. Anal. Calorim. 2015, 119, 1853–1860. [Google Scholar] [CrossRef]
- Sliney, H.E. Rare Earth Fluorides and Oxides—An Exploratory Study of Their Uses as Solid Lubricants at Temperatures to 1800 °F (1000 °C); TN D-5301; NASA: Washington, DC, USA, 1969.
- Zheng, K.; Gao, C.; He, F.; Lin, Y.; Jiang, L. Tribological performance of resin-based brake friction materials modified with La2O3. China Mech. Eng. 2018, 29, 666–673. [Google Scholar]
- Zheng, K.; Gao, C.; He, F.; Lin, Y.; Lei, Y. Tribological performance of rare earth modified resin matrix brake materials under different conditions. Trans. Mater. Heat Treat. 2017, 38, 133–140. [Google Scholar]
- JIS D 4418-1996. Test Procedure of Porosity for Brake Linings and Pads of Automobiles; Japanese Industrial Standards Committee: Tokyo, Japan, 1996.
- ISO 2039-2:1987. Plastics—Determination of Hardness—Part 2: Rockwell Hardness; International Organization for Standardization: Geneva, Switzerland, 1987. [Google Scholar]
- ISO 179-1:2010. Plastics—Determination of Charpy Impact Properties—Part 1: Non-Instrumented Impact Test; International Organization for Standardization: Geneva, Switzerland, 2010. [Google Scholar]
- ISO 527-4. Plastics—Determination of Tensile Properties; International Organization for Standardization: Geneva, Switzerland, 1997. [Google Scholar]
- ASTM D5470-06. Standard Test Method for Thermal Transmission Properties of Thermally Conductive Electrical Insulation Materials; American Society for Testing and Materials: West Conshohocken, PA, USA, 2011. [Google Scholar]
- SAE J661-1997. Brake Lining Quality Test Procedure; Society of Automotive Engineers: Pittsburgh, PA, USA, 1997. [Google Scholar]
- Yen, B.K.; Ishihara, T. On temperature-dependent tribological regimes and oxidation of carbon–carbon composites up to 1800 °C. Wear 1996, 196, 254–262. [Google Scholar] [CrossRef]
- Evans, A.G.; Marshall, D.B. Wear Mechanisms in Ceramics. In Fundamental of Friction and Wear of Materials; Rigney, D.A., Ed.; American Society for Metals: Geauga County, OH, USA, 1981; pp. 439–452. [Google Scholar]
- Filip, P.; Weiss, Z.; Rafaja, D. On friction layer formation in polymer matrix composite materials for brake applications. Wear 2002, 252, 189–198. [Google Scholar] [CrossRef]
- Rhee, S.K.; Jacko, M.G.; Tsang, P.H.S. The role of friction film in friction, wear and noise of automotive brakes. Wear 1991, 146, 89–97. [Google Scholar] [CrossRef]
- Österle, W.; Urban, I. Friction layers and friction films on PMC brake pads. Wear 2004, 257, 215–226. [Google Scholar] [CrossRef]
- Cho, M.H.; Cho, K.H.; Kim, S.J.; Kim, D.H.; Jang, H. The role of transfer layers on friction characteristics in the sliding interface between friction materials against gray iron brake disks. Tribol. Lett. 2005, 20, 101–108. [Google Scholar] [CrossRef]
- Dicks, O.A.; Shluger, A.L.; Sushko, P.V.; Littlewood, P.B. Spectroscopic properties of oxygen vacancies in LaAlO3. Phys. Rev. B 2017, 93, 134114. [Google Scholar] [CrossRef]
- Huang, C.; Shen, C.; Qiu, T. Research on Microwave Dielectric Properties of LaAlO3-SrTiO3 Ceramics with High Quality Factor. J. Synth. Cryst. 2014, 43, 2056–2061. [Google Scholar]
- Li, J.; Wang, Z.; Wang, X.; Liu, H.; Ma, Y. Synthesis and hydration characteristics of barium aluminate. J. Ceram. 2018, 39, 69–72. [Google Scholar]
- Yang, K.; Cheng, X.; Hao, E. Study on the aluminium sulphate-phosphate inorganic adhesive. China Ceram. 2009, 45, 43–45. [Google Scholar]
- Nilov, A.; Kulik, V.; Garshin, A. Analysis of friction materials and technologies developed to make brake shoes for heavily loaded brake systems with disks made of a ceramic composite. Refract. Ind. Ceram. 2015, 56, 402–412. [Google Scholar] [CrossRef]
- Ralph, R.; Gerd, S.; Walter, K. Integration of CMC brake disks in automotive brake systems. Int. J. Appl. Ceram. Technol. 2012, 9, 712–724. [Google Scholar]
Figure 1.
Scanning electron microscope (SEM) micrograph of selected La2O3.
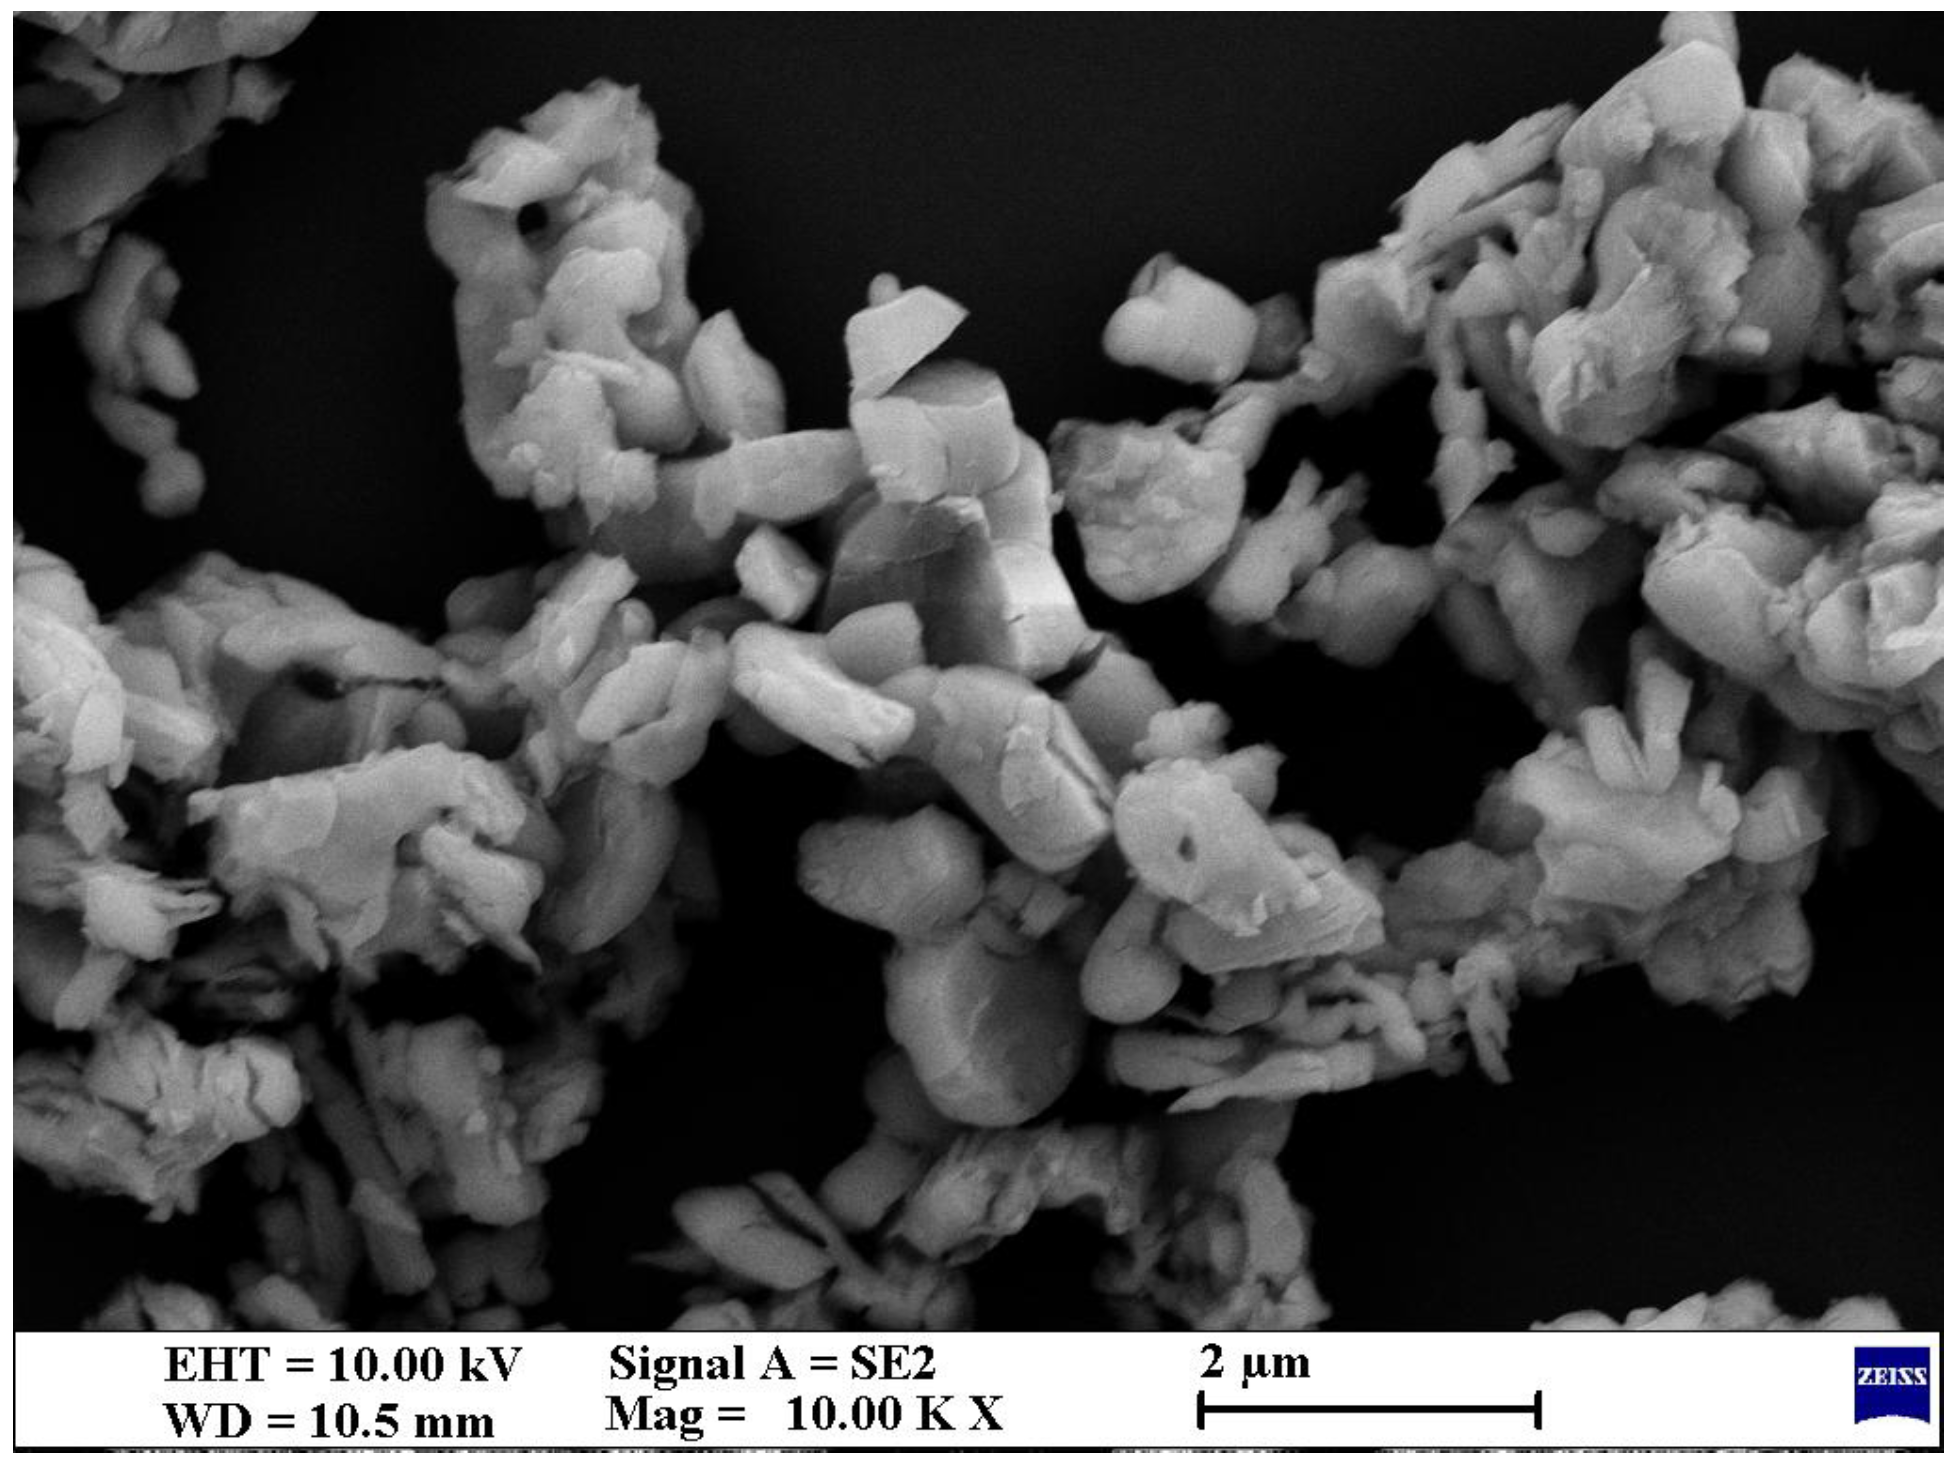
Figure 2.
Energy dispersive spectrometry (EDS) elemental mapping images of selected La2O3.
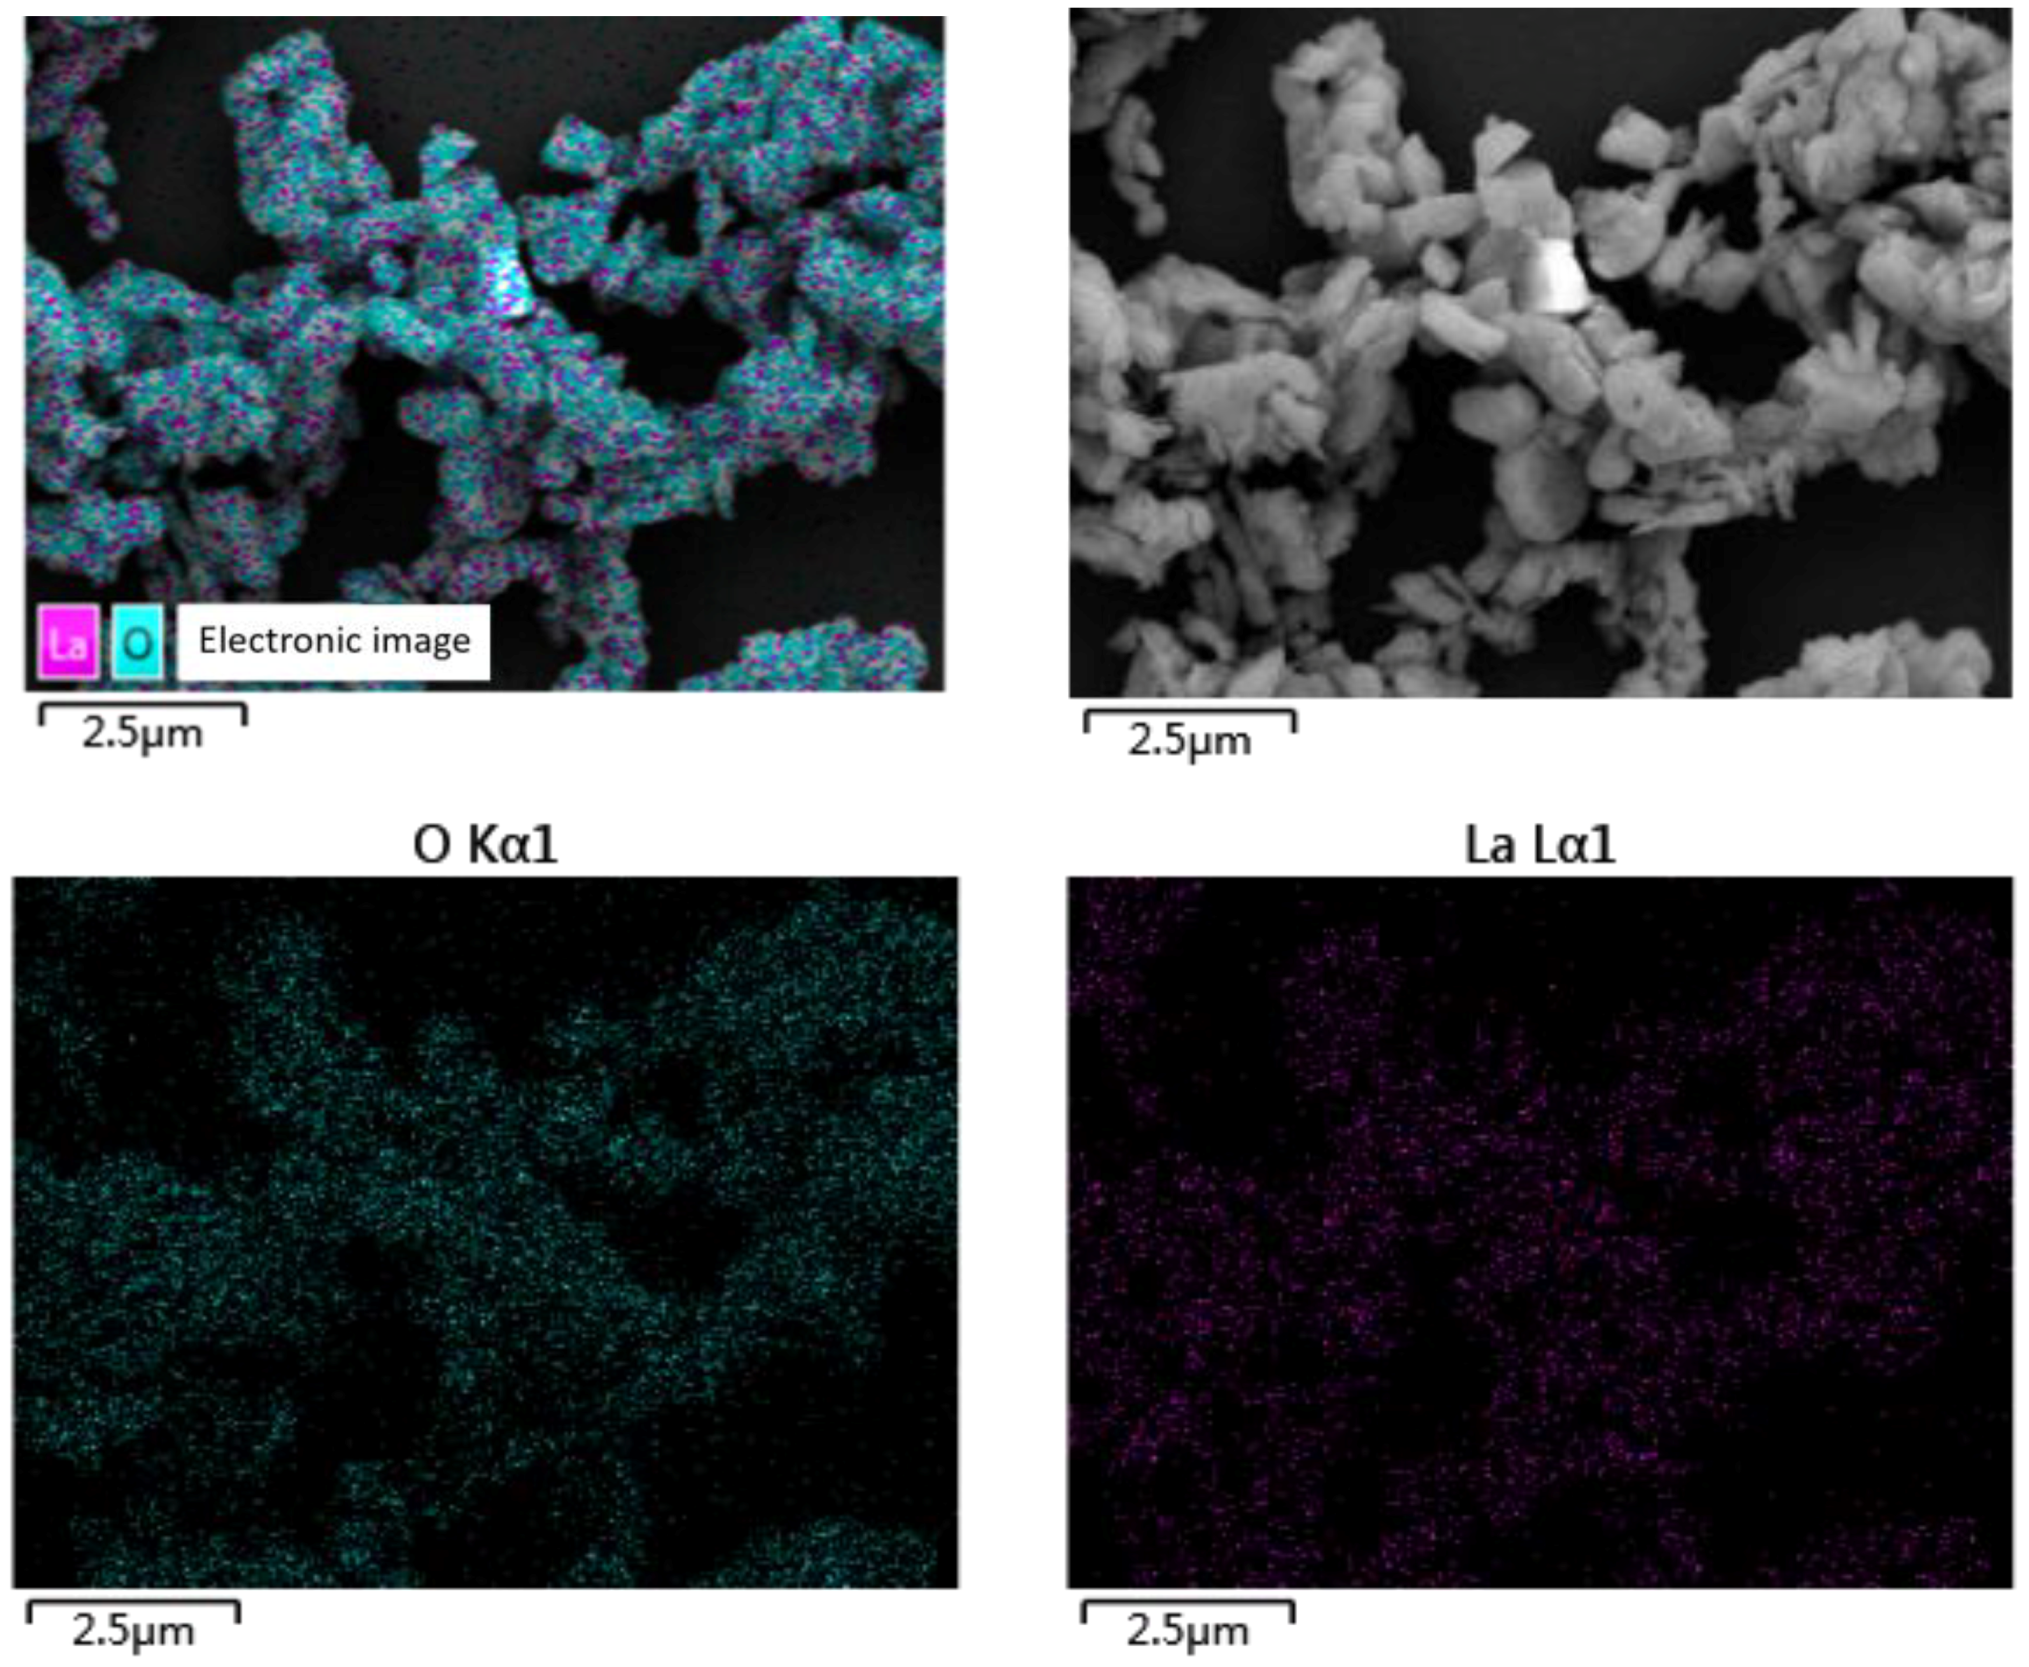
Figure 3.
Variation in μnormal, μhot and Δμ (μ fluctuations) with different wt % of Cu and La2O3 for brake composites: (a) μnormal and μhot; (b) Δμ.
Figure 3.
Variation in μnormal, μhot and Δμ (μ fluctuations) with different wt % of Cu and La2O3 for brake composites: (a) μnormal and μhot; (b) Δμ.

Figure 4.
Fade and recovery behaviors of the brake composites: (a) μfade; (b) fade%; (c) μrecovery; (d) recovery%.
Figure 4.
Fade and recovery behaviors of the brake composites: (a) μfade; (b) fade%; (c) μrecovery; (d) recovery%.

Figure 5.
Wear performance of the brake composites.
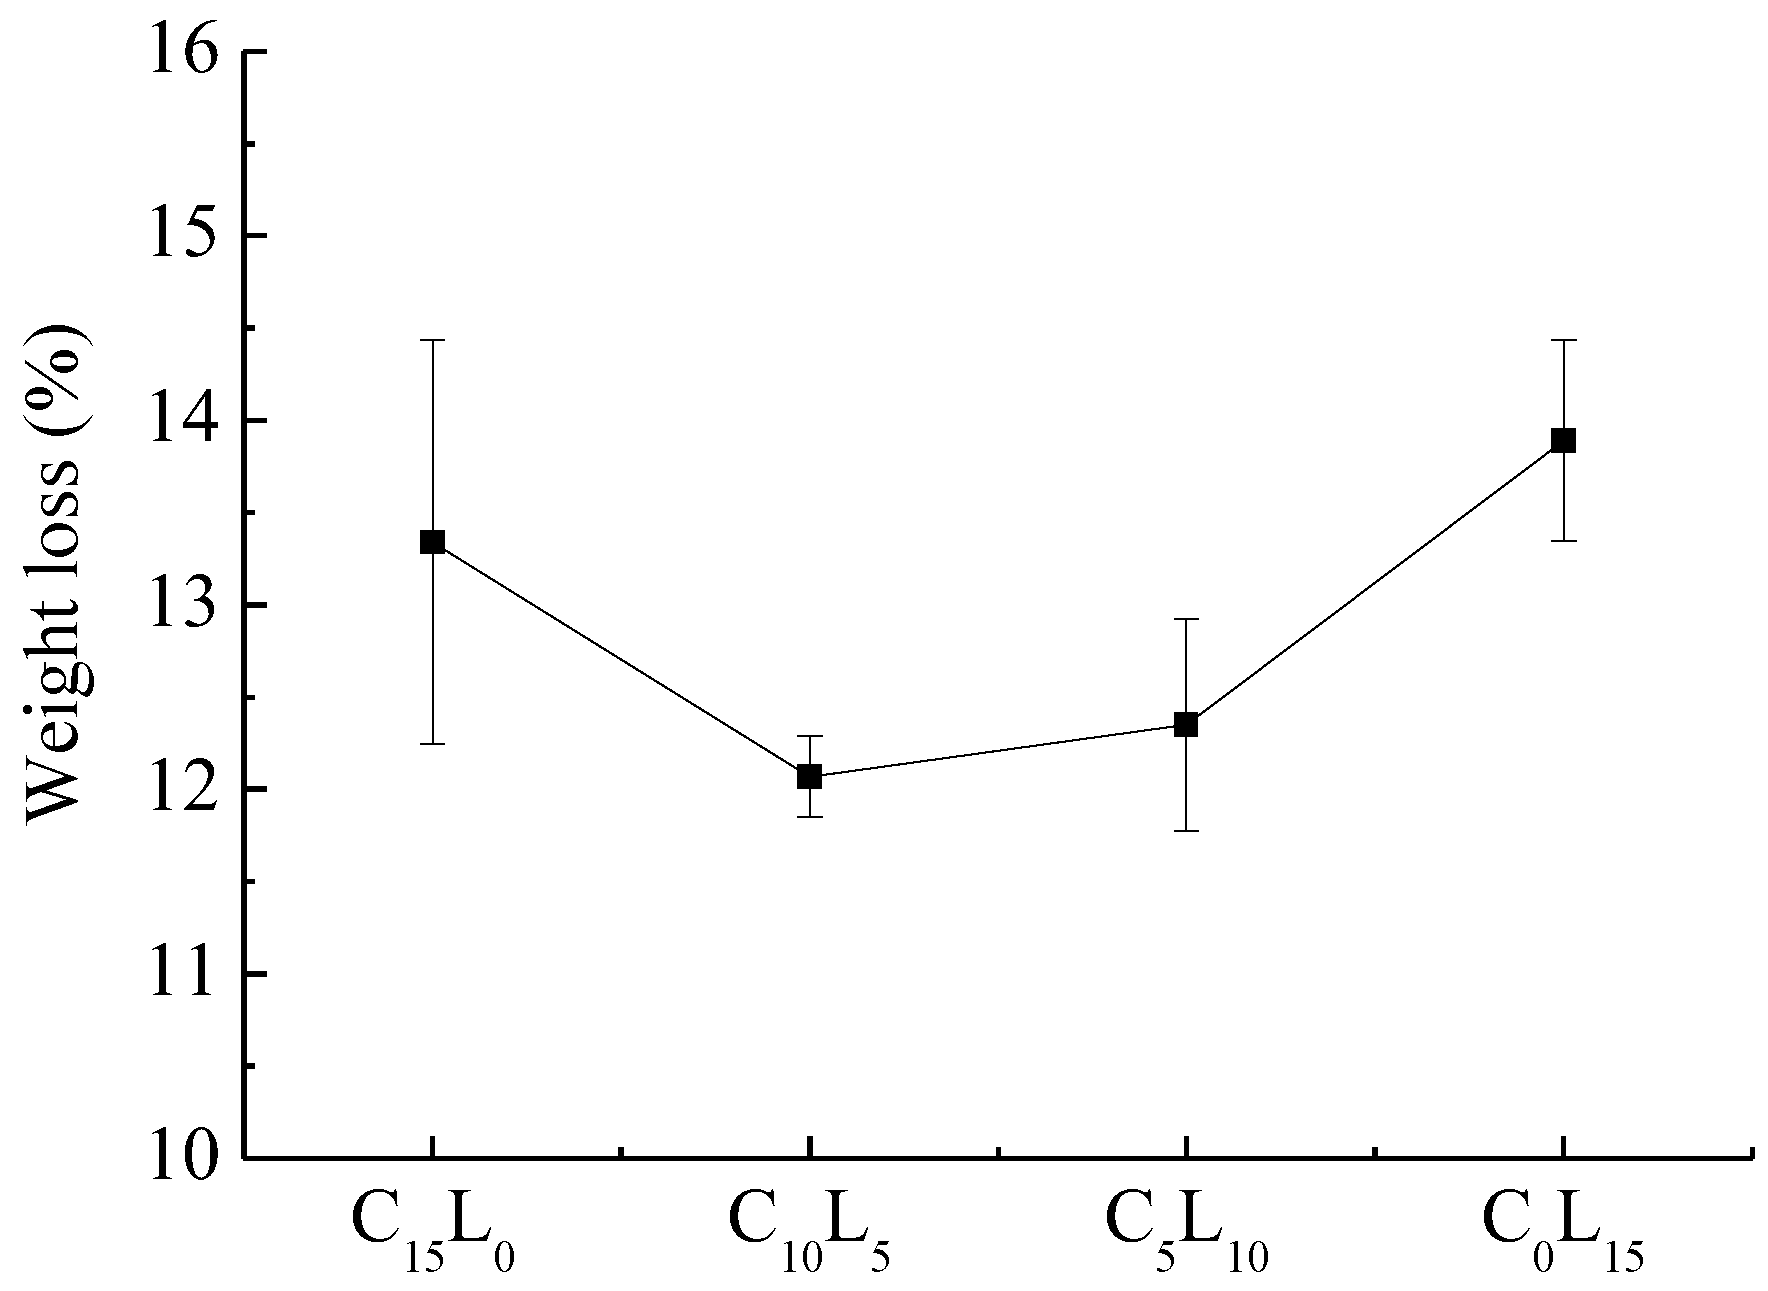
Figure 6.
SEM micrographs of the worn surfaces of the brake composites: (a) C10L5; (b) C5L10; (c) C15L0; (d) C0L15.
Figure 6.
SEM micrographs of the worn surfaces of the brake composites: (a) C10L5; (b) C5L10; (c) C15L0; (d) C0L15.
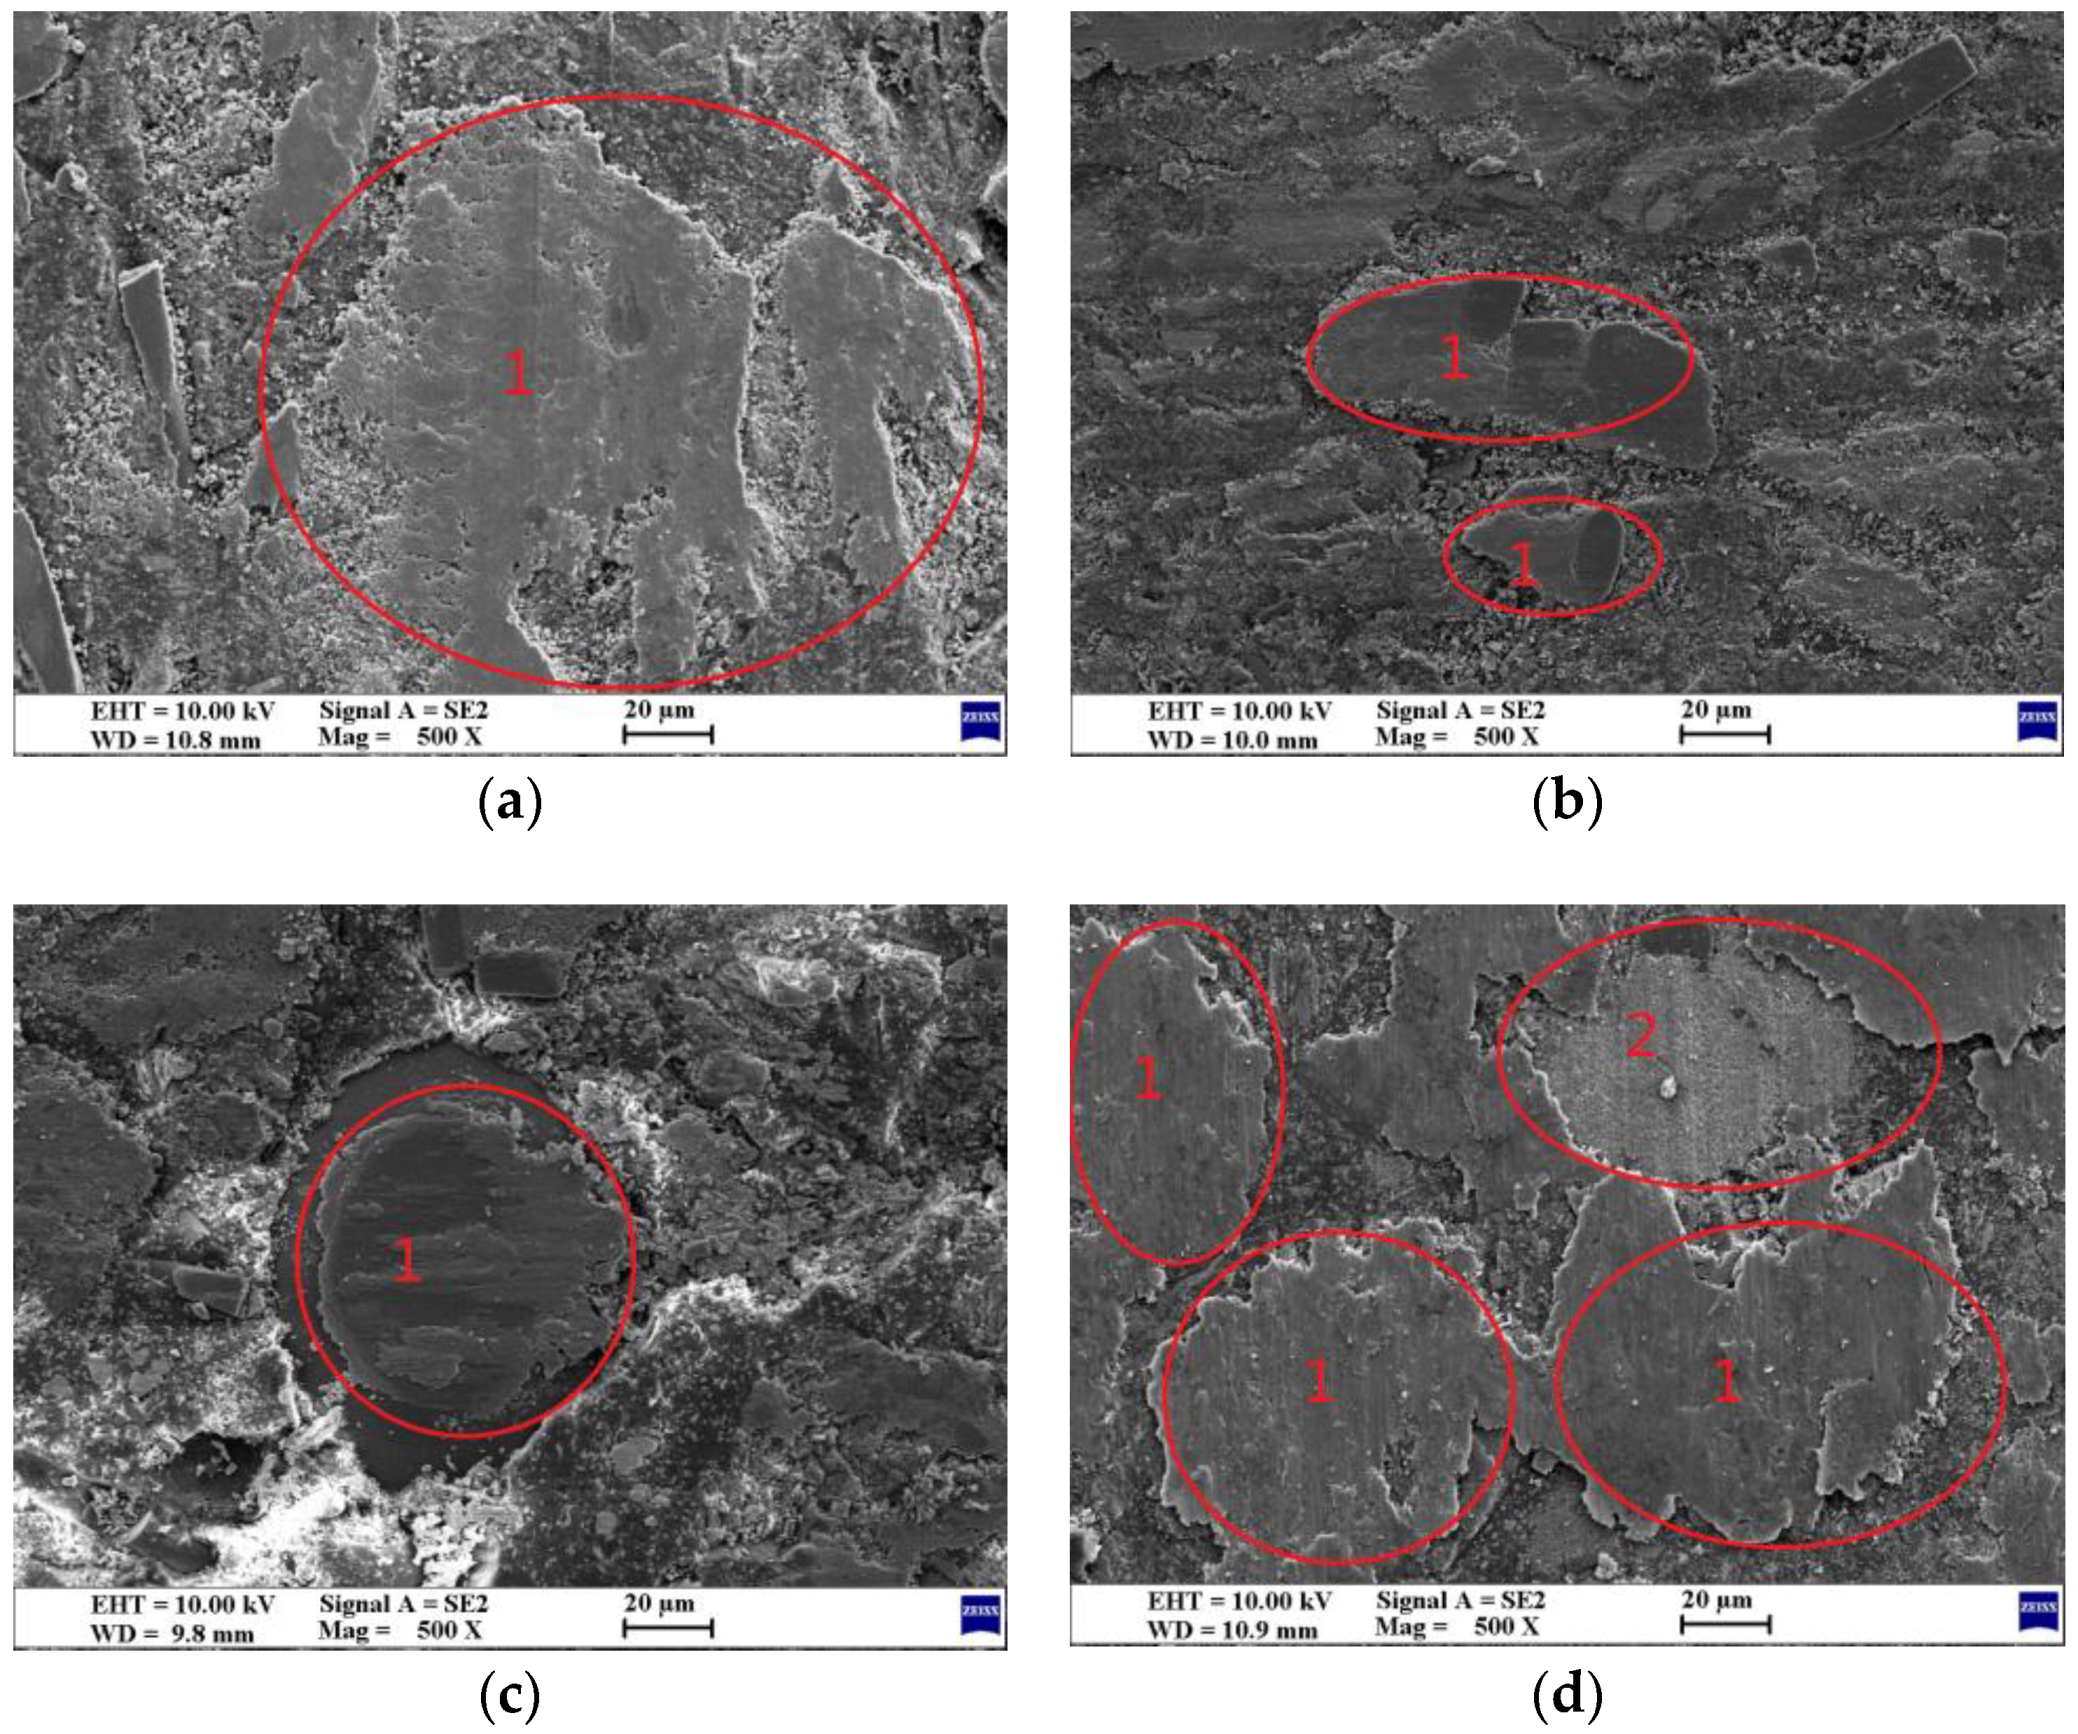
Figure 7.
Worn surfaces of composites-EDS elemental mapping images: (a) C10L5; (b) C5L10; (c) C15L0; (d) C0L15.
Figure 7.
Worn surfaces of composites-EDS elemental mapping images: (a) C10L5; (b) C5L10; (c) C15L0; (d) C0L15.

Figure 8.
3-D surface topography of the worn surfaces of the brake composites: (a) C15L0; (b) C10L5; (c) C5L10; (d) C0L15.
Figure 8.
3-D surface topography of the worn surfaces of the brake composites: (a) C15L0; (b) C10L5; (c) C5L10; (d) C0L15.

Figure 9.
SEM micrographs and EDS spectrums of the counter surface: (a) SEM micrograph of the counter surface before tribology testing; (b) EDS spectrum of the counter surface before tribology testing; (c) SEM micrograph of the counter surface after tribology testing with C15L0; (d) EDS spectrum of the counter surface after tribology testing with C15L0; (e) SEM micrograph of the counter surface after tribology testing with C0L15; (f) EDS spectrum of the counter surface after tribology testing with C0L15.

Figure 10.
XRD patterns of C0L15 before and after tribology testing.

Table 1.
Details of La2O3 used in brake composites.
| Property Details | Purity (%) | Granularity (mesh) | Melting Point (°C) | Density (g·cm−3) |
|---|---|---|---|---|
| Specifications | 99.95 | 200 | 2217 | 6.51 |
Table 2.
Details of the ceramic fibers used in brake composites.
| Property Details | Fiber Length (mm) | Fiber Diameter (μm) | Mohs Hardness | Refractoriness (°C) | Main Chemical Components (%) |
|---|---|---|---|---|---|
| Specifications | 1.0–3.5 | 2.0–4.0 | 5–6 | >1170 | SiO2: 45–55 Al2O3: 40–50 |
Table 3.
Specifications of the resin used in brake composites.
| Sieve Analysis Test 160-mesh Sieve (%) | Curing Time 150 °C (s) | Flow Distance 125 °C (mm) | Viscosity (mPa·s) | Relative Molecular Mass | pH | Free Phenol (%) |
|---|---|---|---|---|---|---|
| ≤5 | 50–100 | 40–80 | 3–4 | 600–700 | >7 | ≤5 |
Table 4.
Details of Cu used in brake composites.
| Property Details | Purity (%) | Granularity (mesh) | Melting Point (°C) | Density (g·cm−3) |
|---|---|---|---|---|
| Specifications | 99.5 | 200 | 1083.4 | 8.96 |
Table 5.
Formulation design and designations of composites.
| Ingredients/Designation | Cu (wt %) | La2O3 (wt %) | Parent Composition 1 (wt %) |
|---|---|---|---|
| C15L0 | 15 | 0 | 85 |
| C10L5 | 10 | 5 | |
| C5L10 | 5 | 10 | |
| C0L15 | 0 | 15 |
1 Binder (phenolic resin)–20 wt %; fibres (ceramic)–15 wt %; additives (graphite)–3 wt % and fillers (alumina, barite, NBR powder)–47 wt %.
Table 6.
Chase testing schedule.
| S. no. | Test Runs | Speed (rpm) | Load (N) | On Time (s) | Off Time (s) | Repetitions | Temperature Range (°C) |
|---|---|---|---|---|---|---|---|
| 1 | First Baseline | 417 | 667 | 10 | 20 | 20 | 82–93 |
| 2 | First fade | 417 | 667 | 600 | 0 | 1 | 82–288 |
| 3 | First recovery | 417 | 667 | 10 | 0 | 1 | 260–93 |
| 4 | Wear | 417 | 667 | 20 | 10 | 100 | 193–216 |
| 5 | Second fade | 417 | 667 | 600 | 0 | 1 | 93–343 |
| 6 | Second recovery | 417 | 667 | 10 | 0 | 1 | 316–93 |
| 7 | Second Baseline | 417 | 667 | 10 | 20 | 20 | 82–93 |
Table 7.
Properties of the developed composites.
| Properties | C15L0 | C10L5 | C5L10 | C0L15 | ||||
|---|---|---|---|---|---|---|---|---|
| Average | Standard Deviation | Average | Standard Deviation | Average | Standard Deviation | Average | Standard Deviation | |
| Density (g·cm−3) | 2.24 | 0.01 | 2.22 | 0.02 | 2.15 | 0.03 | 2.09 | 0.02 |
| Porosity (%) | 0.57 | 0.03 | 0.51 | 0.04 | 0.42 | 0.02 | 0.40 | 0.01 |
| Hardness (HRM) | 103.2 | 0.6 | 109.1 | 0.5 | 111.9 | 1.0 | 112.9 | 0.4 |
| Impact strength (kJ/m2) | 7.13 | 0.23 | 7.54 | 0.09 | 8.13 | 0.34 | 9.90 | 0.20 |
| Tensile strength (MPa) | 37.94 | 0.51 | 38.96 | 0.57 | 39.20 | 0.39 | 41.24 | 0.43 |
| Elastic modulus (Gpa) | 1.30 | 0.04 | 1.37 | 0.03 | 1.43 | 0.06 | 1.58 | 0.07 |
| Thermal conductivity (W/m·K) | 1.83 | 0.04 | 1.95 | 0.05 | 1.88 | 0.02 | 1.79 | 0.03 |
| Thermal resistance (×10−4 K·m2/W) | 16.70 | 0.37 | 15.40 | 0.41 | 16.04 | 0.17 | 17.30 | 0.29 |
Table 8.
Roughness parameter of the worn surface roughness of specimens.
| Roughness Parameters | C15L0 | C10L5 | C5L10 | C0L15 | ||||
|---|---|---|---|---|---|---|---|---|
| Average | Standard Deviation | Average | Standard Deviation | Average | Standard Deviation | Average | Standard Deviation | |
| Sa (μm) | 0.44 | 0.02 | 0.22 | 0.01 | 0.23 | 0.01 | 0.21 | 0.01 |
| Sq (μm) | 0.76 | 0.03 | 0.36 | 0.01 | 0.42 | 0.01 | 0.41 | 0.01 |
| Sku | 12.90 | 1.35 | 28.48 | 1.85 | 46.26 | 1.59 | 55.02 | 1.87 |
© 2018 by the authors. Licensee MDPI, Basel, Switzerland. This article is an open access article distributed under the terms and conditions of the Creative Commons Attribution (CC BY) license (http://creativecommons.org/licenses/by/4.0/).
Share and Cite
MDPI and ACS Style
Zheng, K.; Gao, C.; He, F.; Lin, Y. The Role of Rare Earth Lanthanum Oxide in Polymeric Matrix Brake Composites to Replace Copper. Polymers 2018, 10, 1027. https://doi.org/10.3390/polym10091027
AMA Style
Zheng K, Gao C, He F, Lin Y. The Role of Rare Earth Lanthanum Oxide in Polymeric Matrix Brake Composites to Replace Copper. Polymers. 2018; 10(9):1027. https://doi.org/10.3390/polym10091027
Chicago/Turabian StyleZheng, Kaikui, Chenghui Gao, Fushan He, and Youxi Lin. 2018. "The Role of Rare Earth Lanthanum Oxide in Polymeric Matrix Brake Composites to Replace Copper" Polymers 10, no. 9: 1027. https://doi.org/10.3390/polym10091027
Note that from the first issue of 2016, this journal uses article numbers instead of page numbers. See further details here.