Influence of Hot Chlorinated Water and Stabilizer Package on the Fatigue Crack Growth Resistance of Glass Fiber Reinforced Polyamide


Abstract
:
1. Introduction
2. Materials and Methods
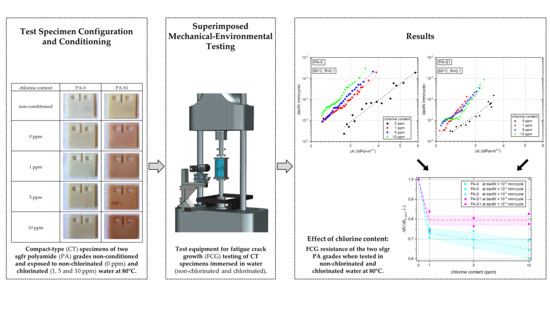
2.1. Materials
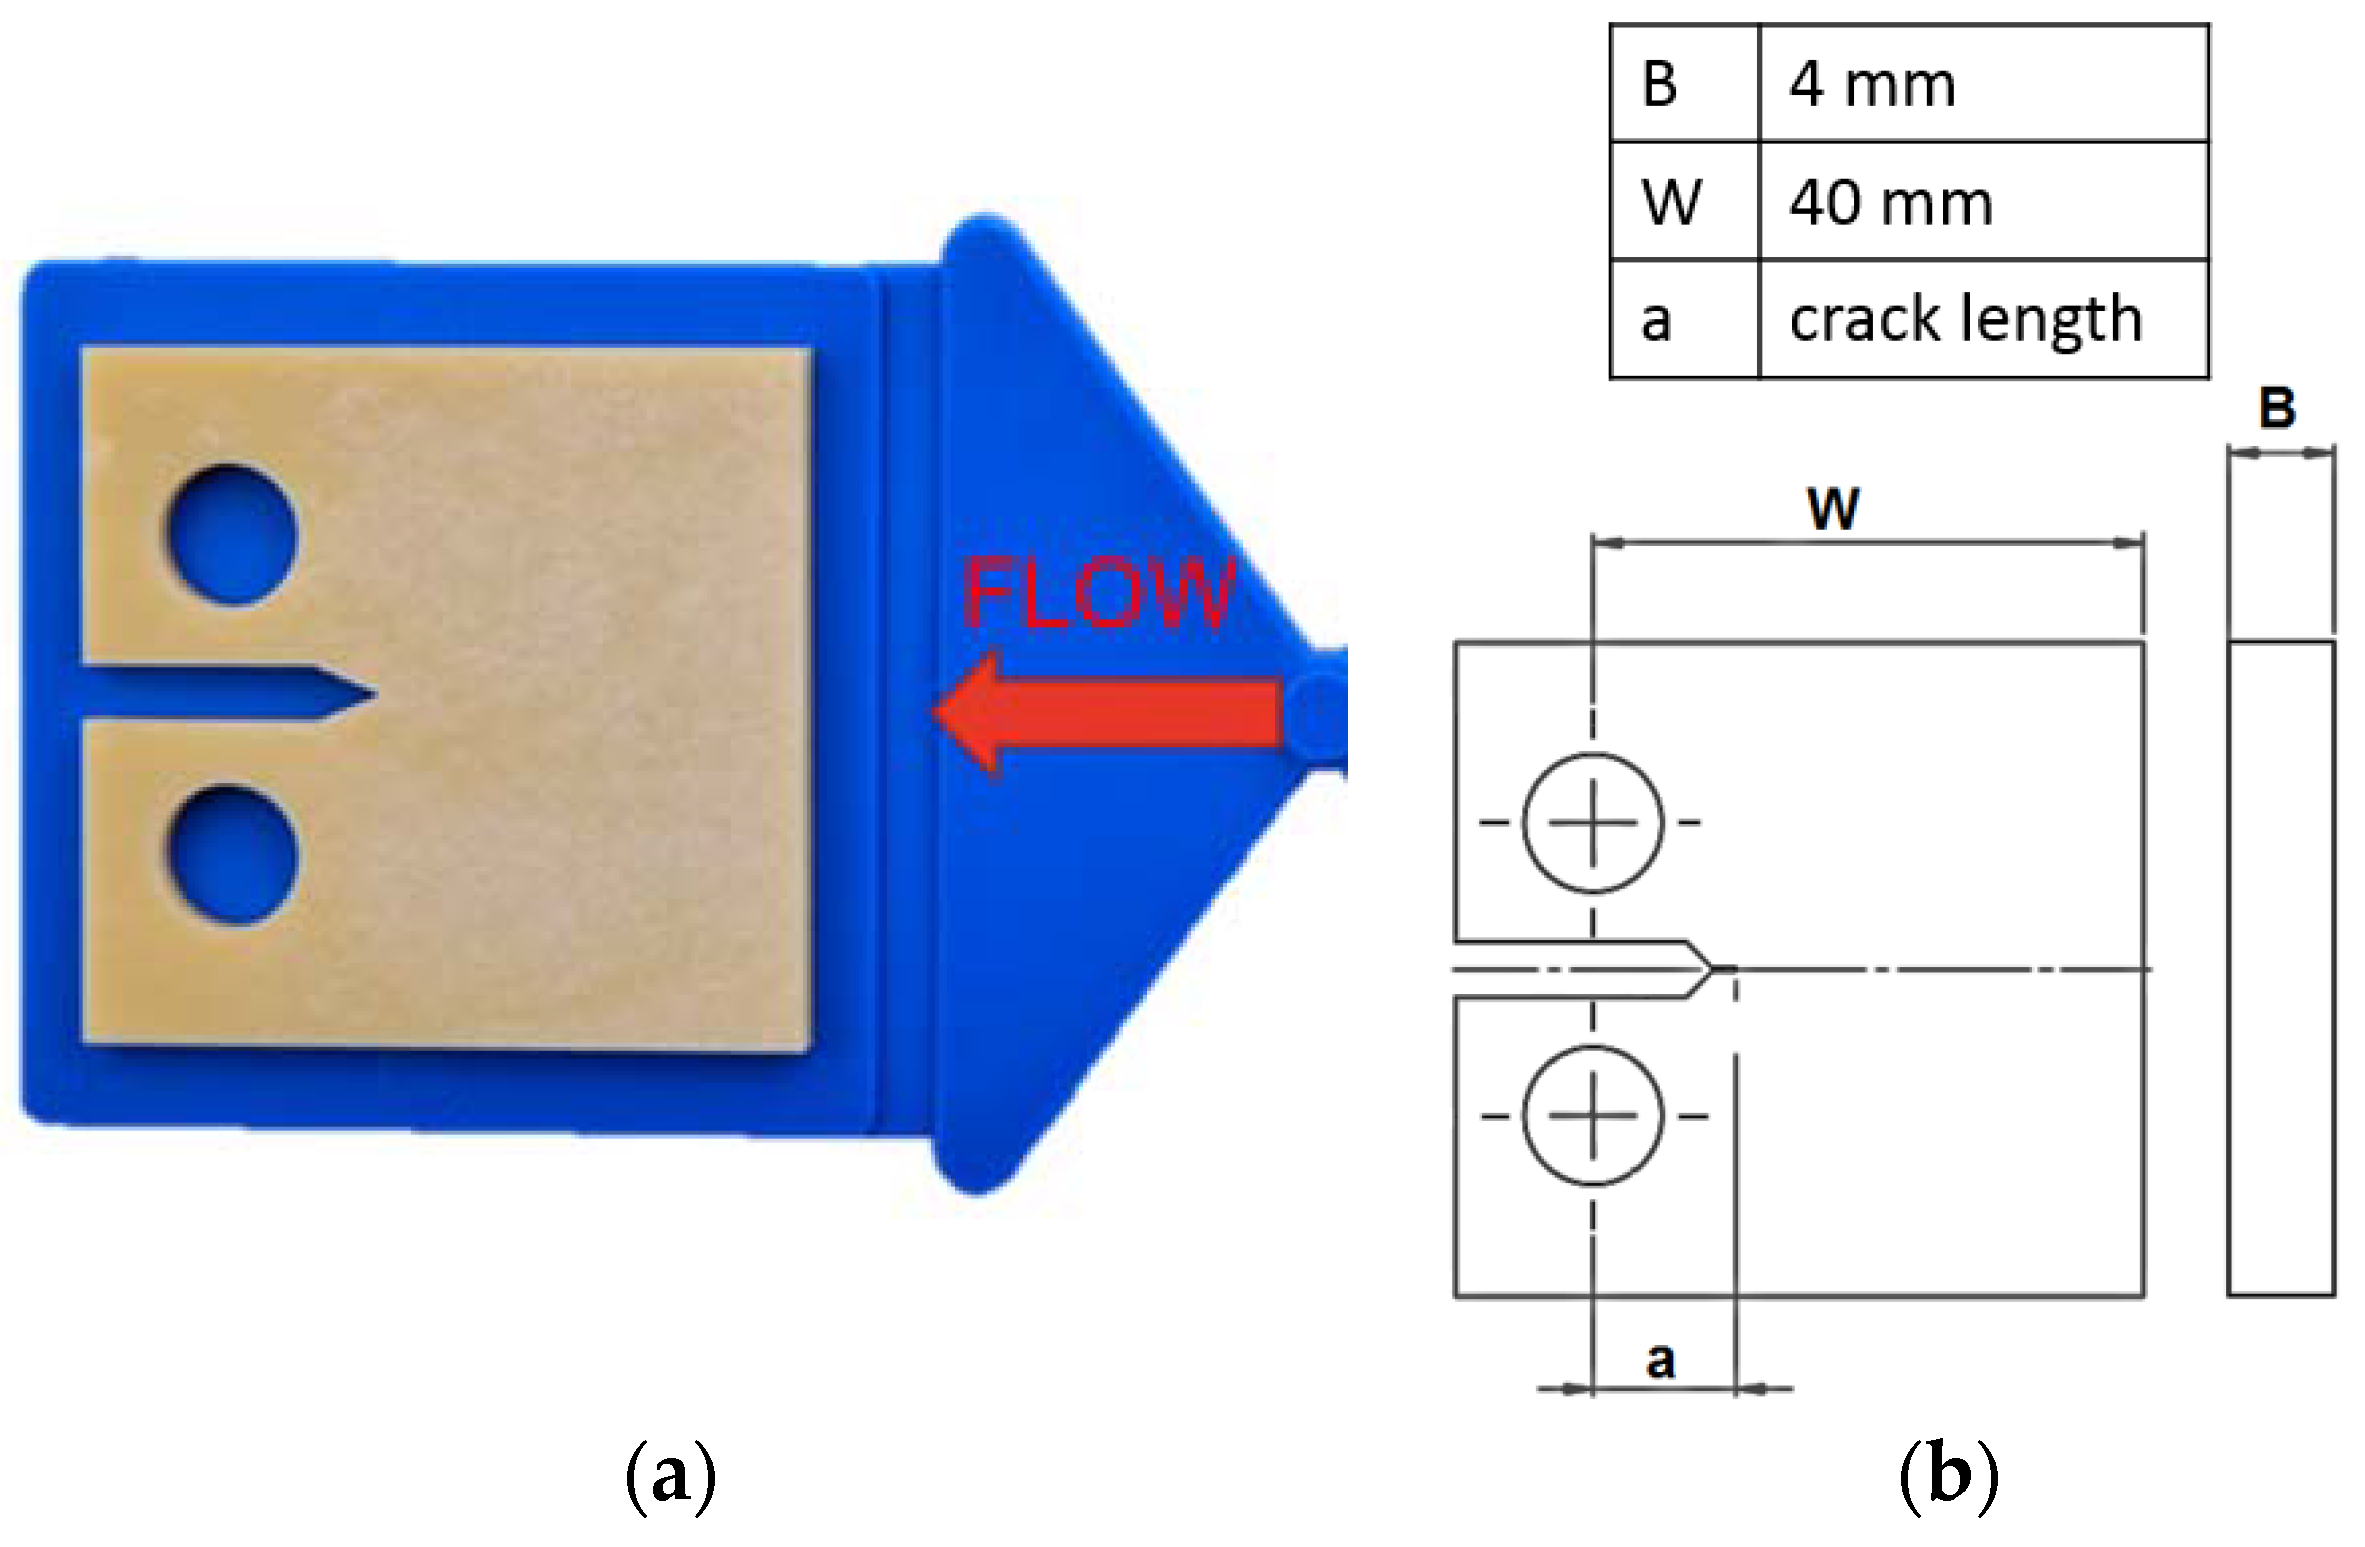
2.2. Specimens
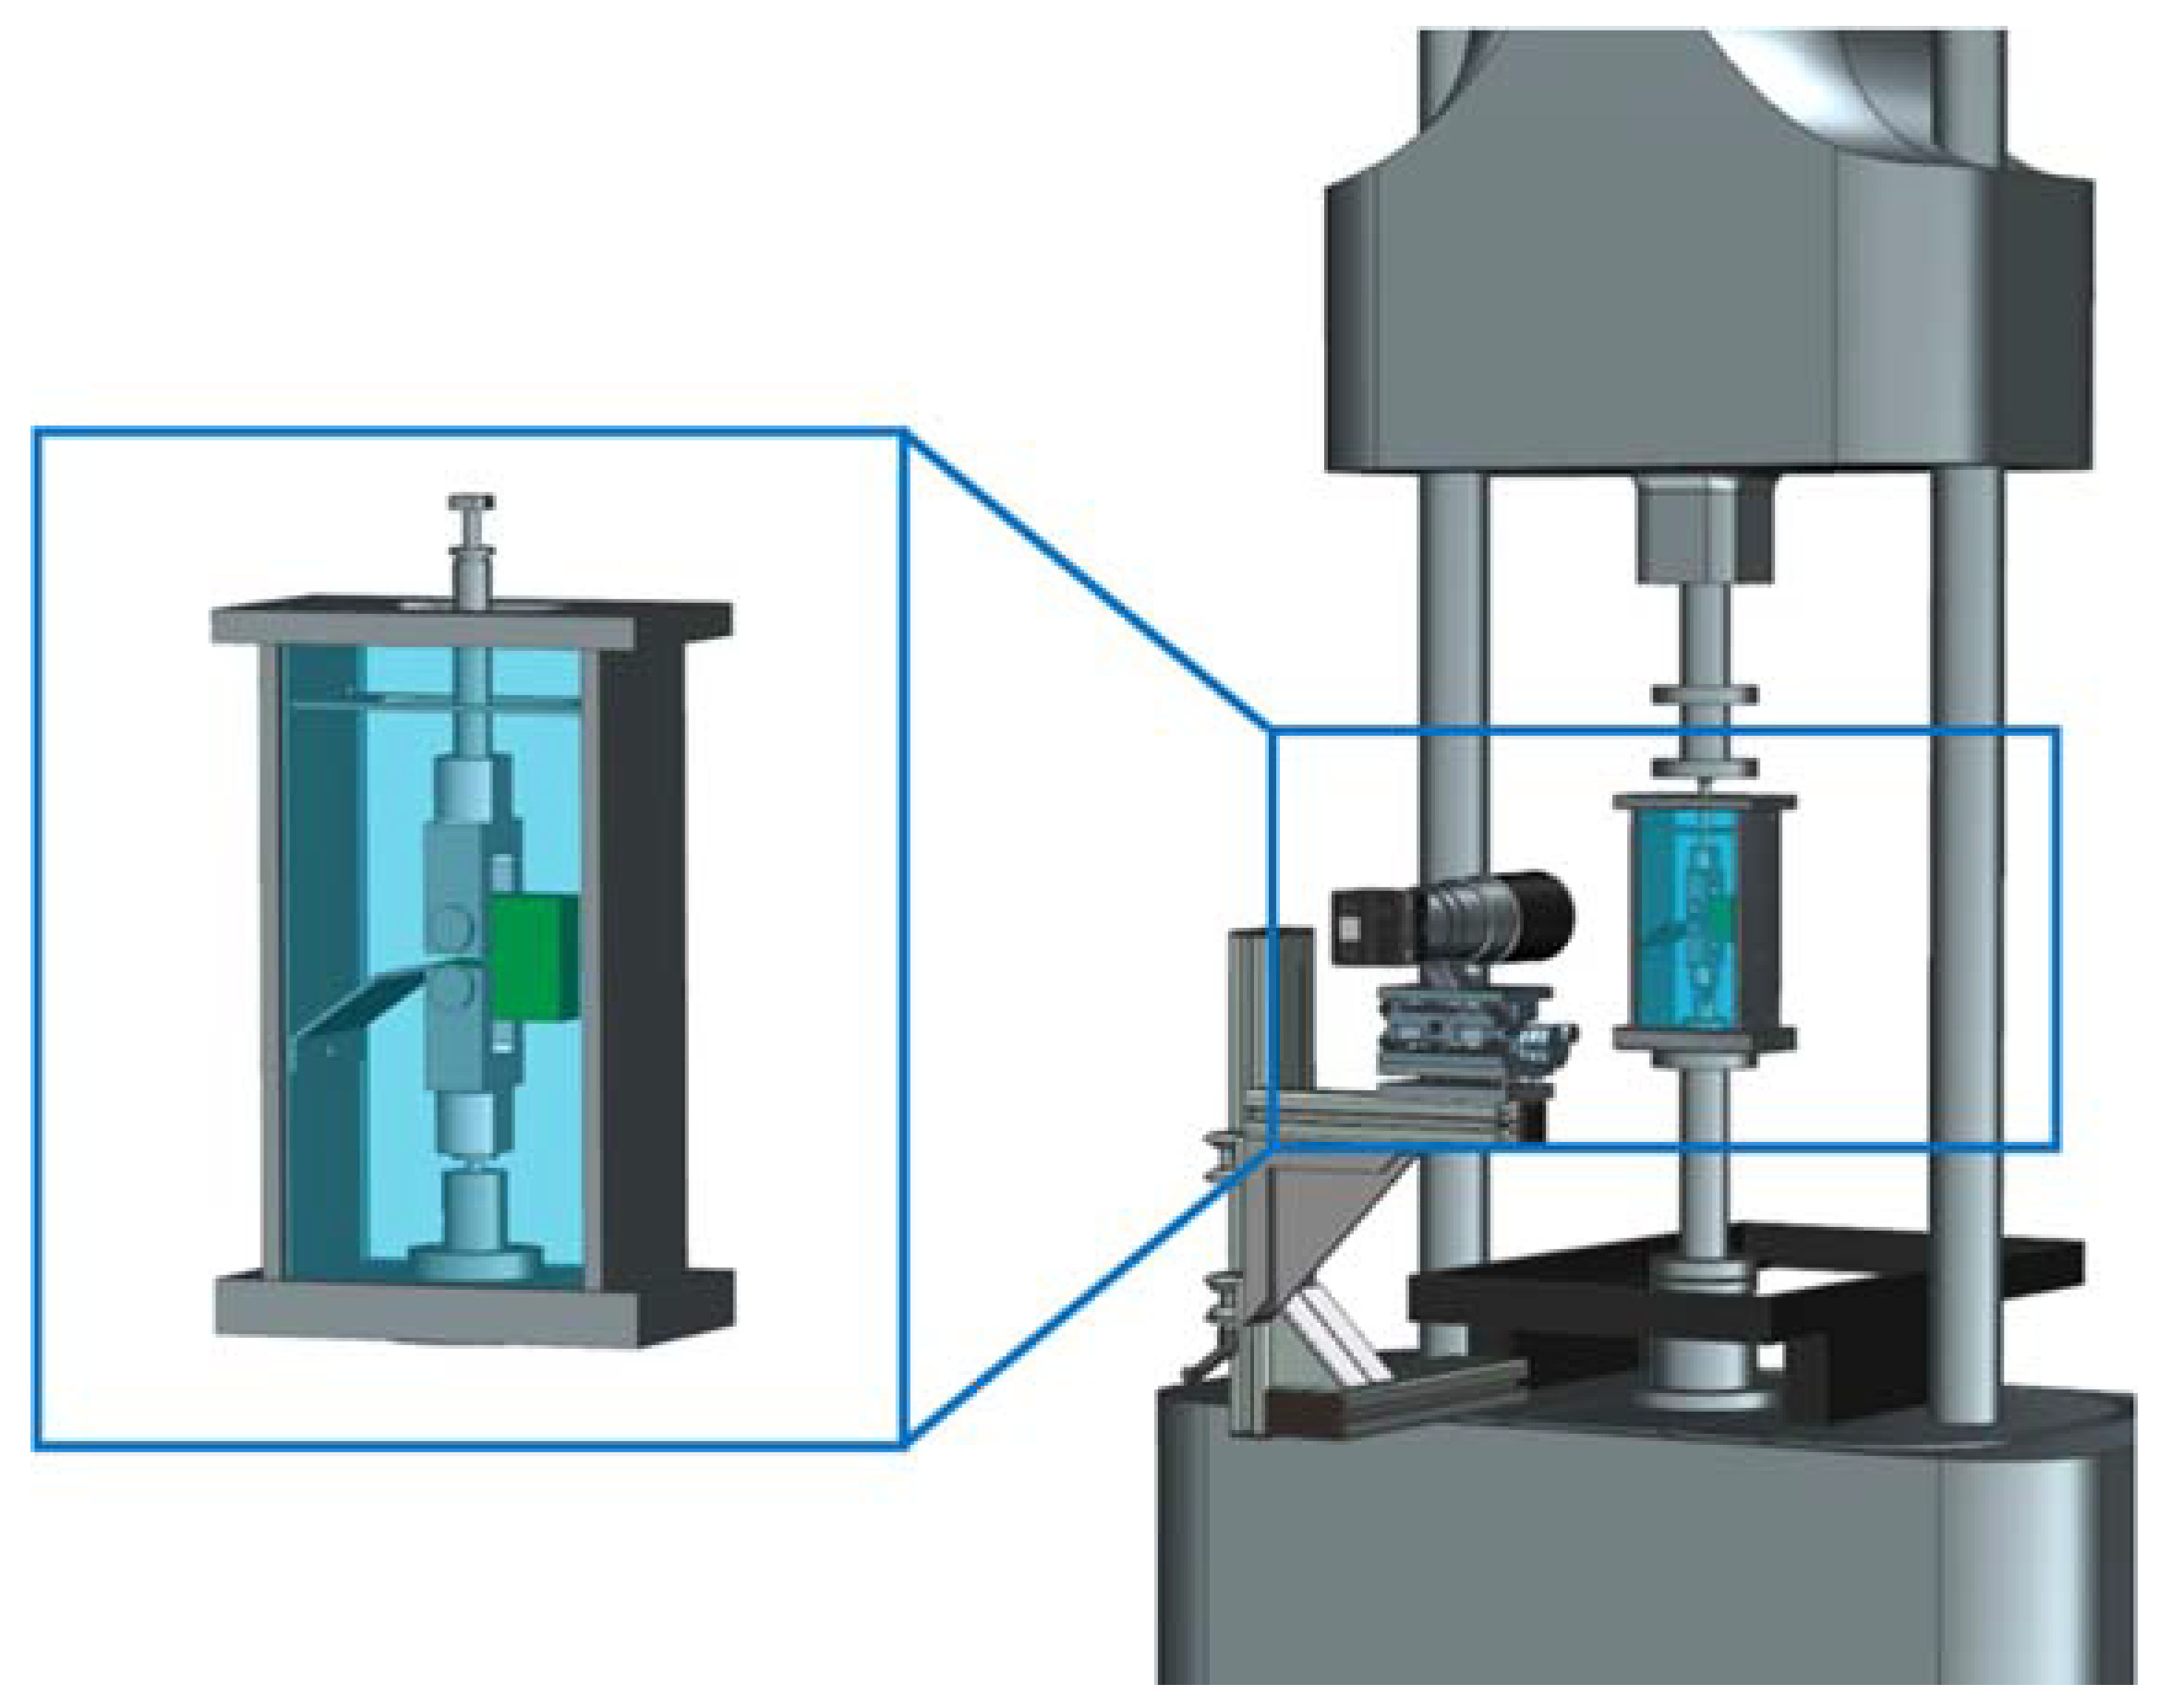
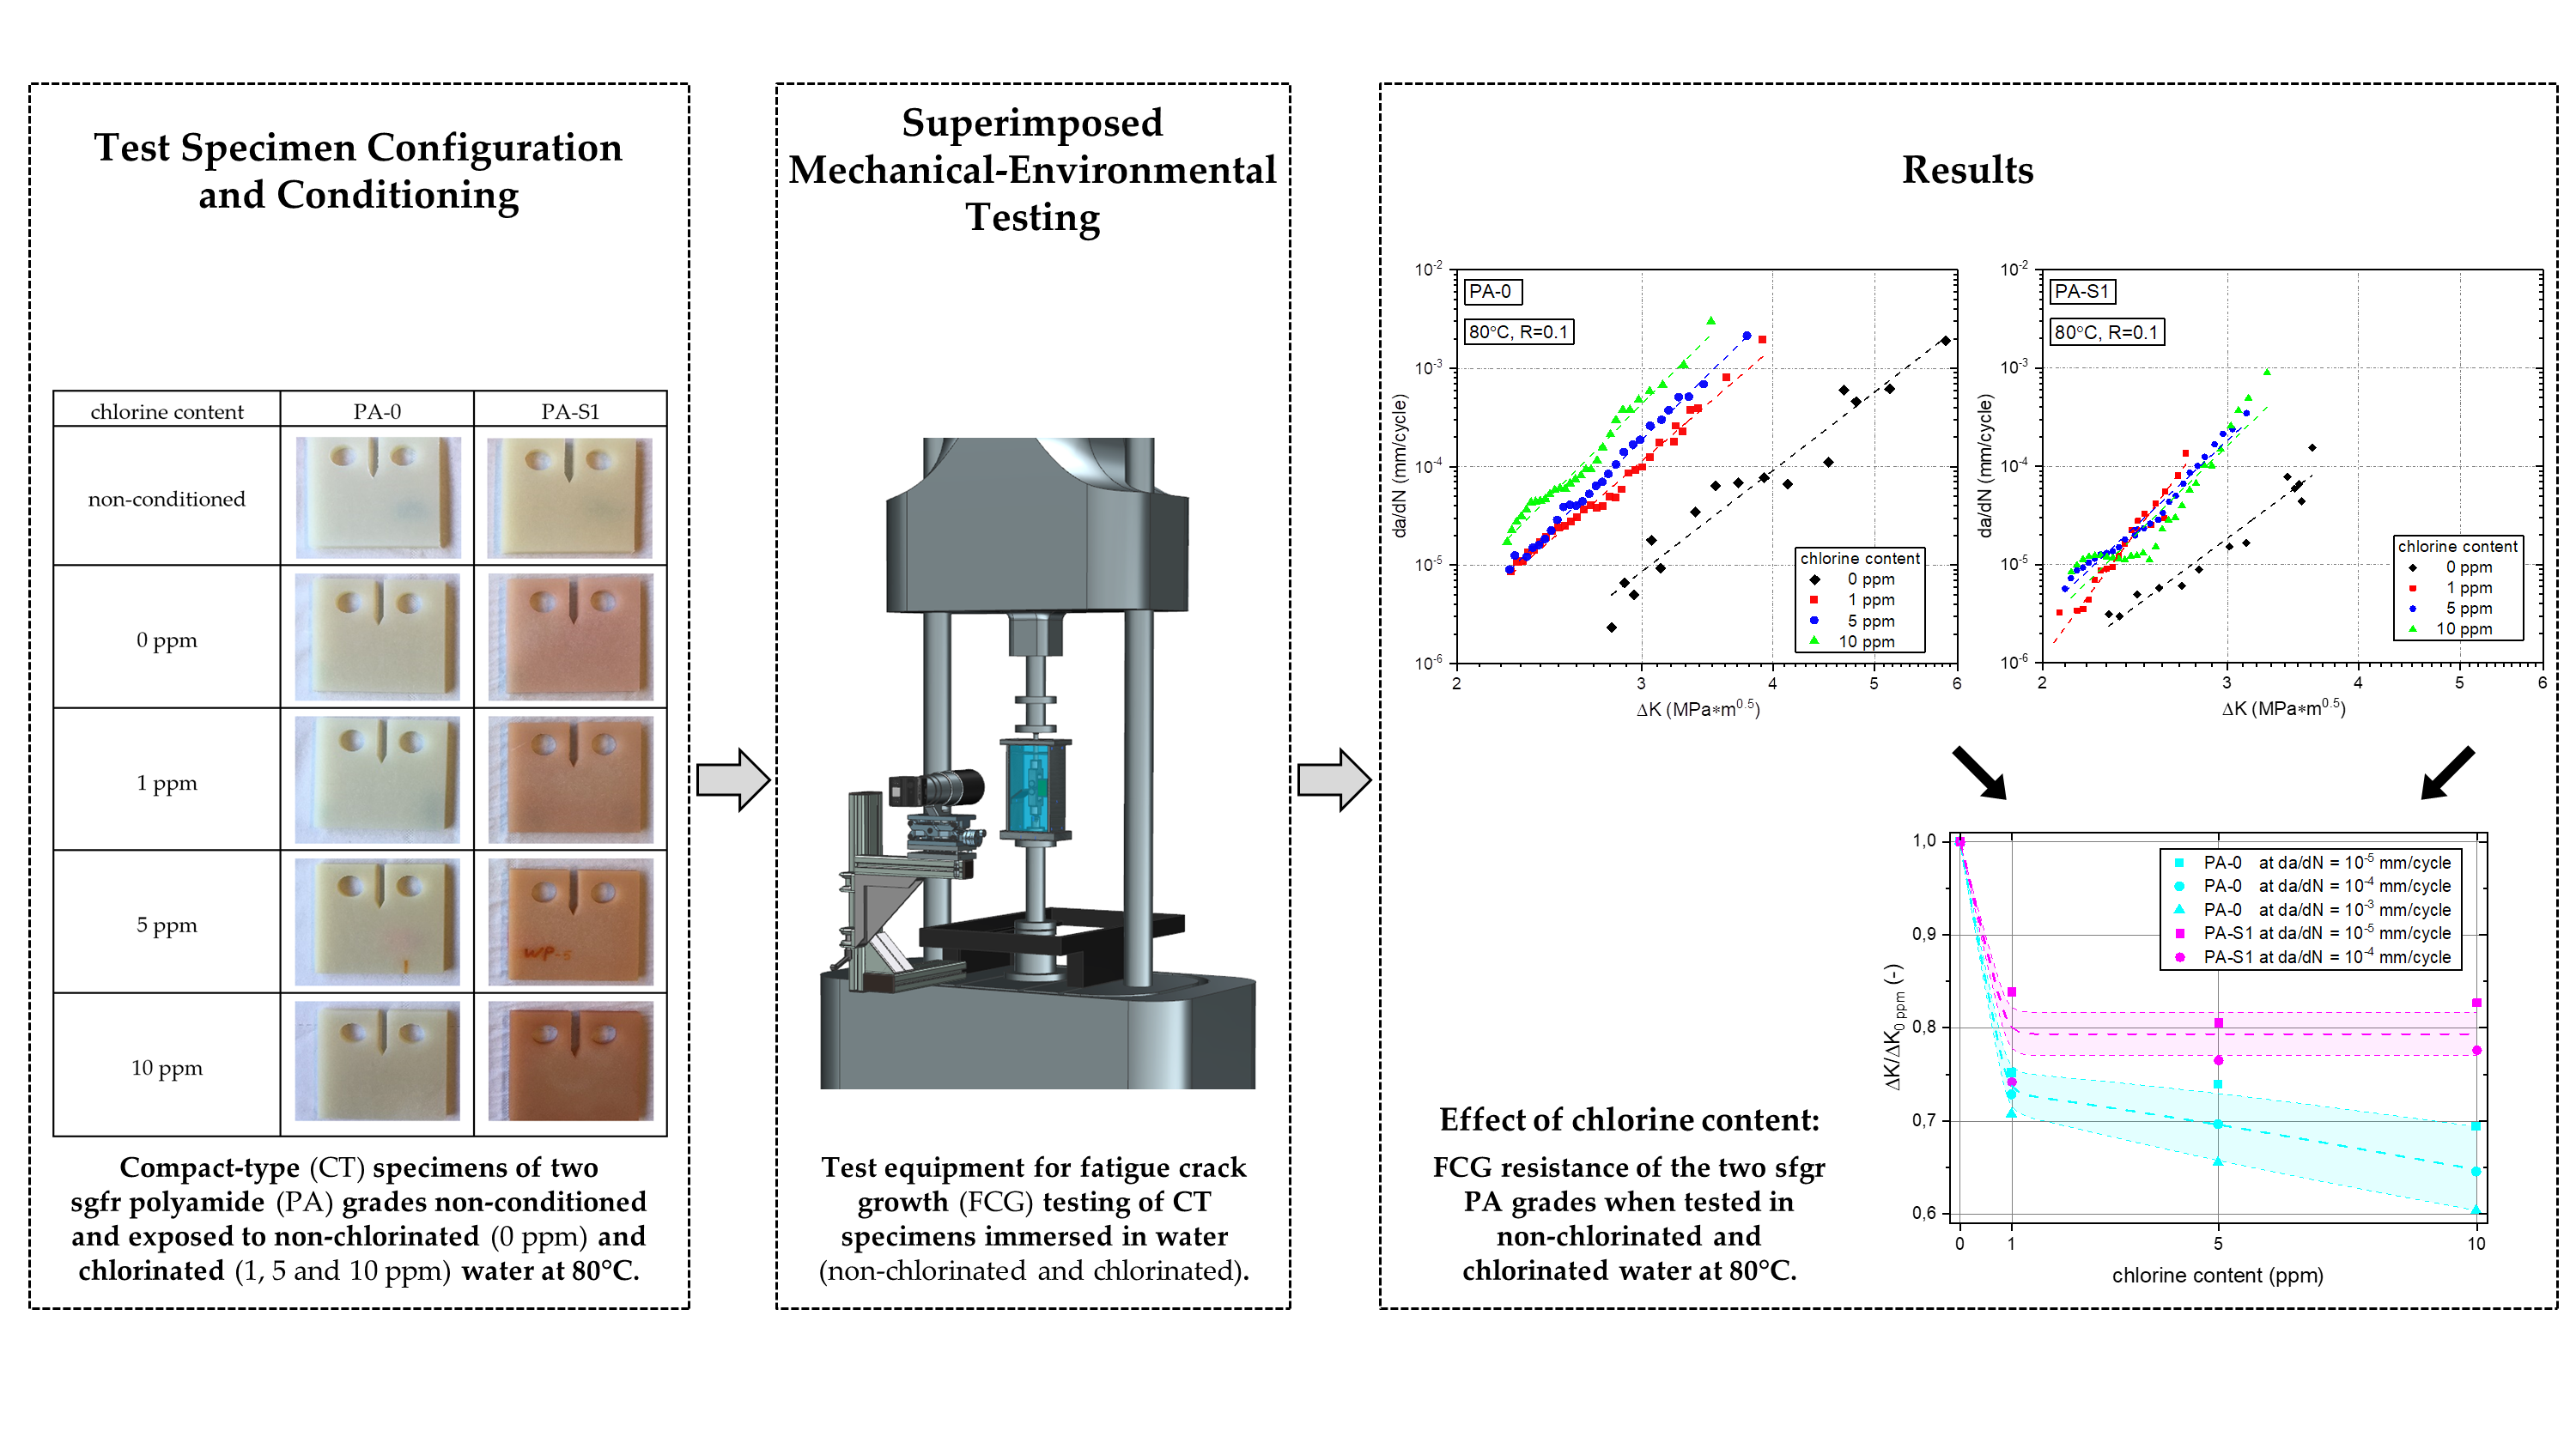
2.3. Fatigue Crack Growth Tests
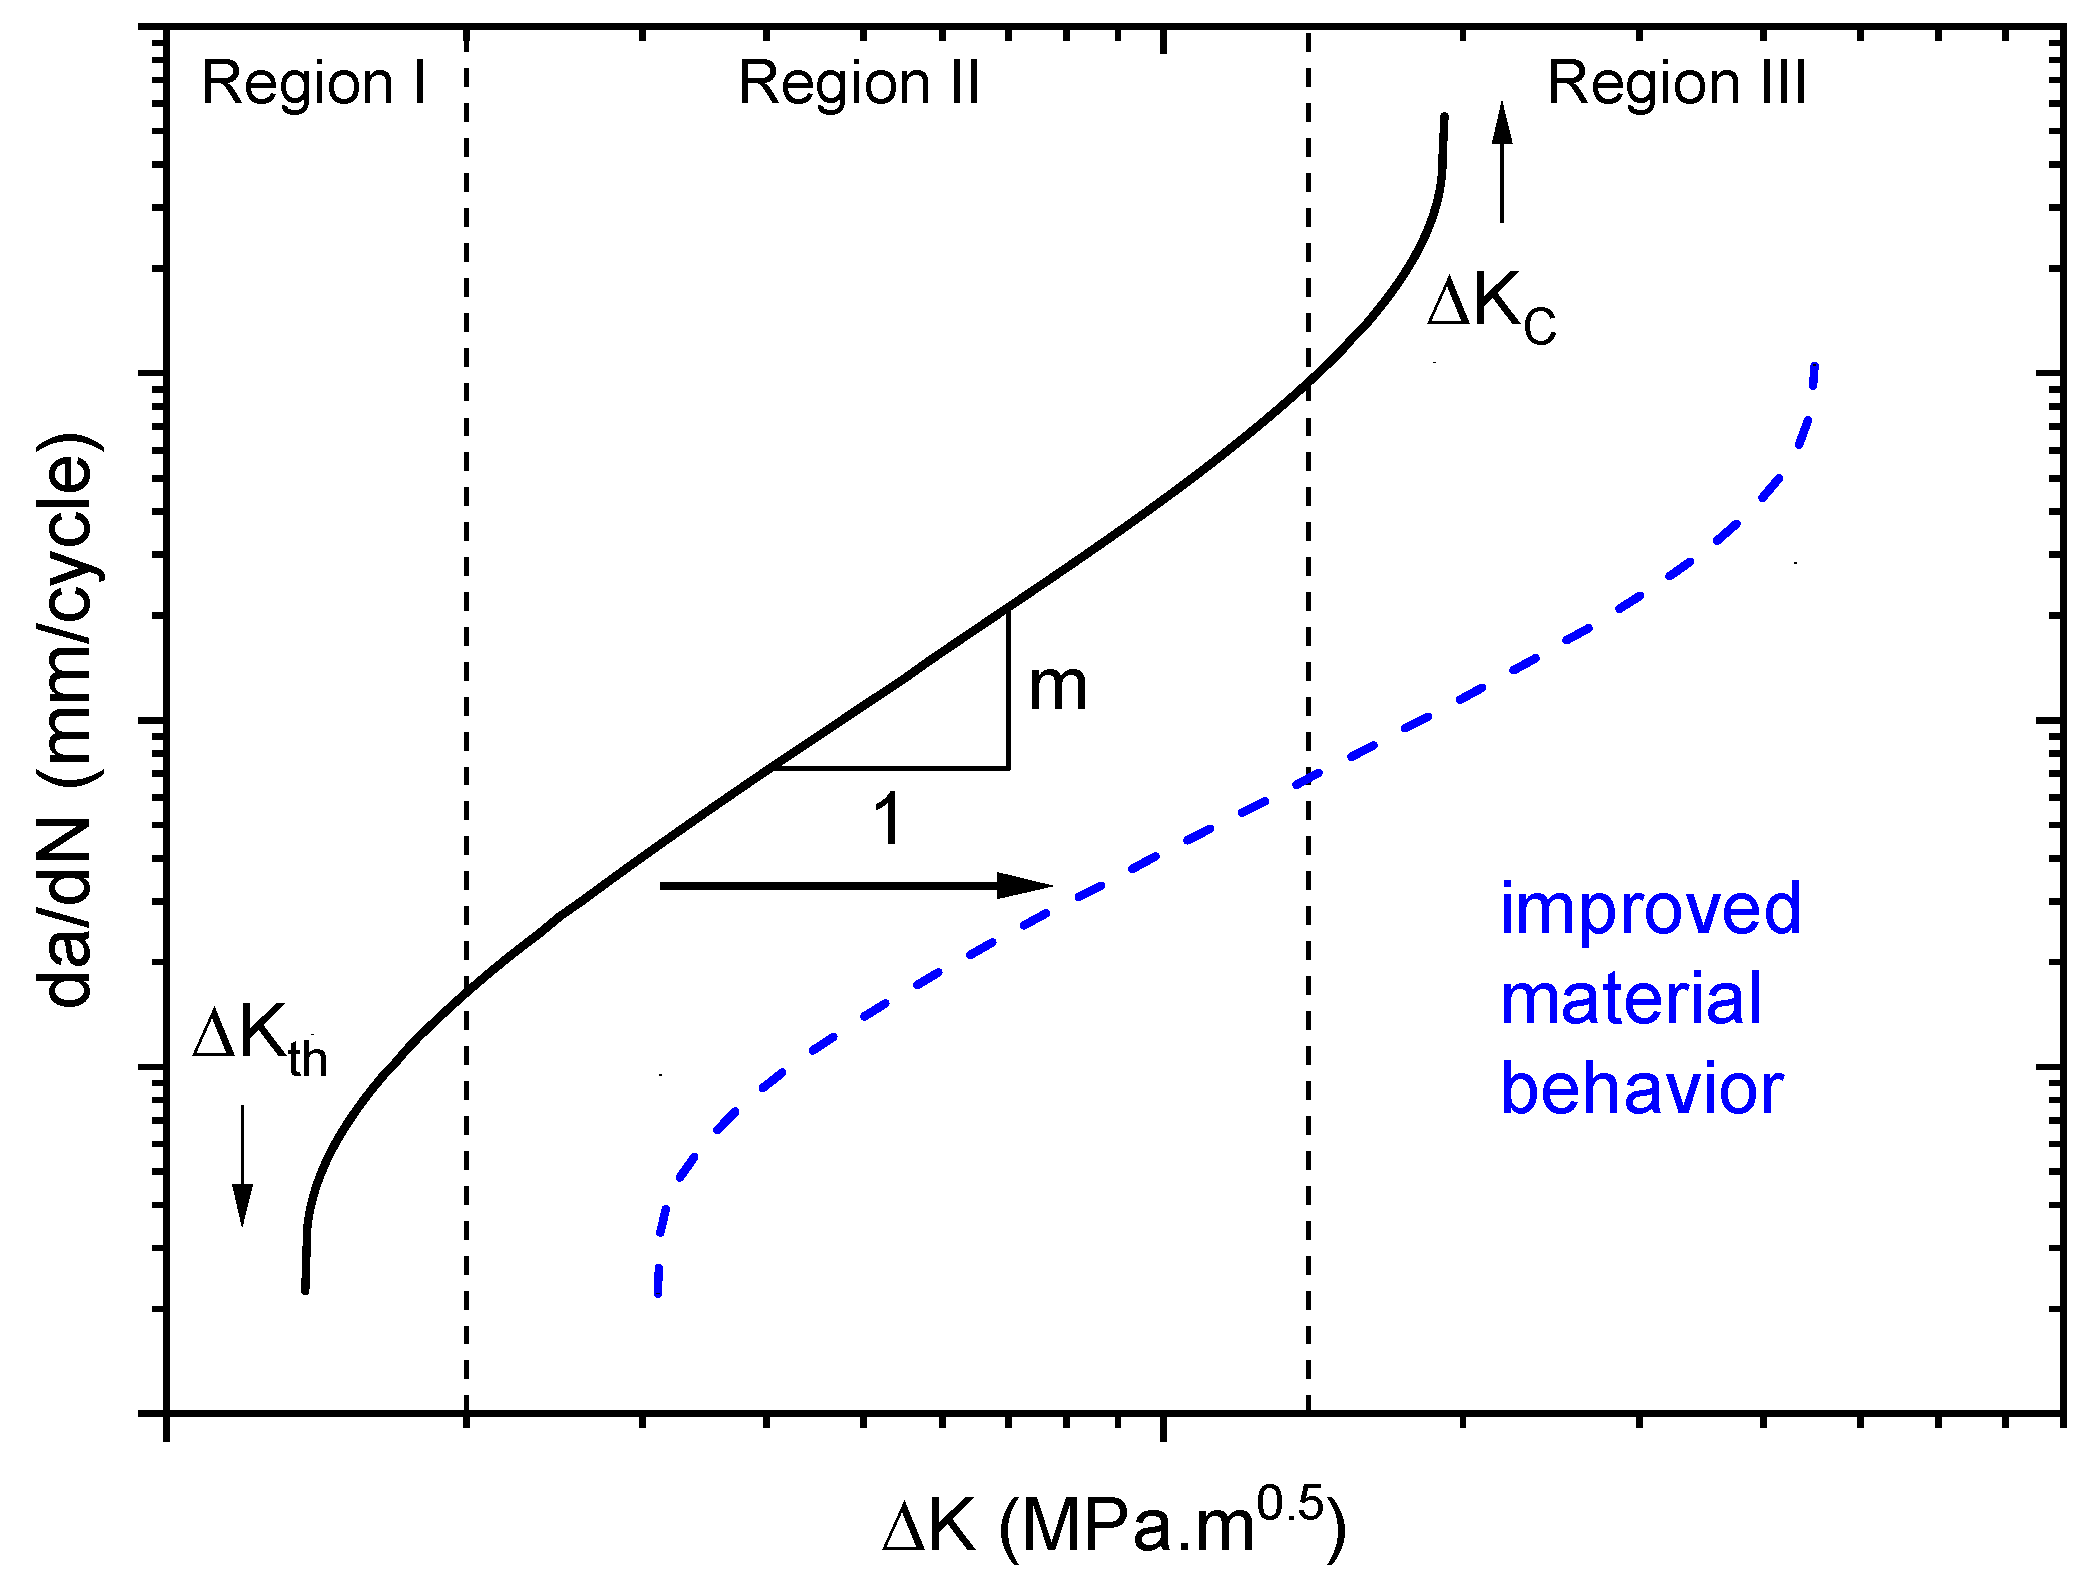
2.4. Data Reduction
3. Results
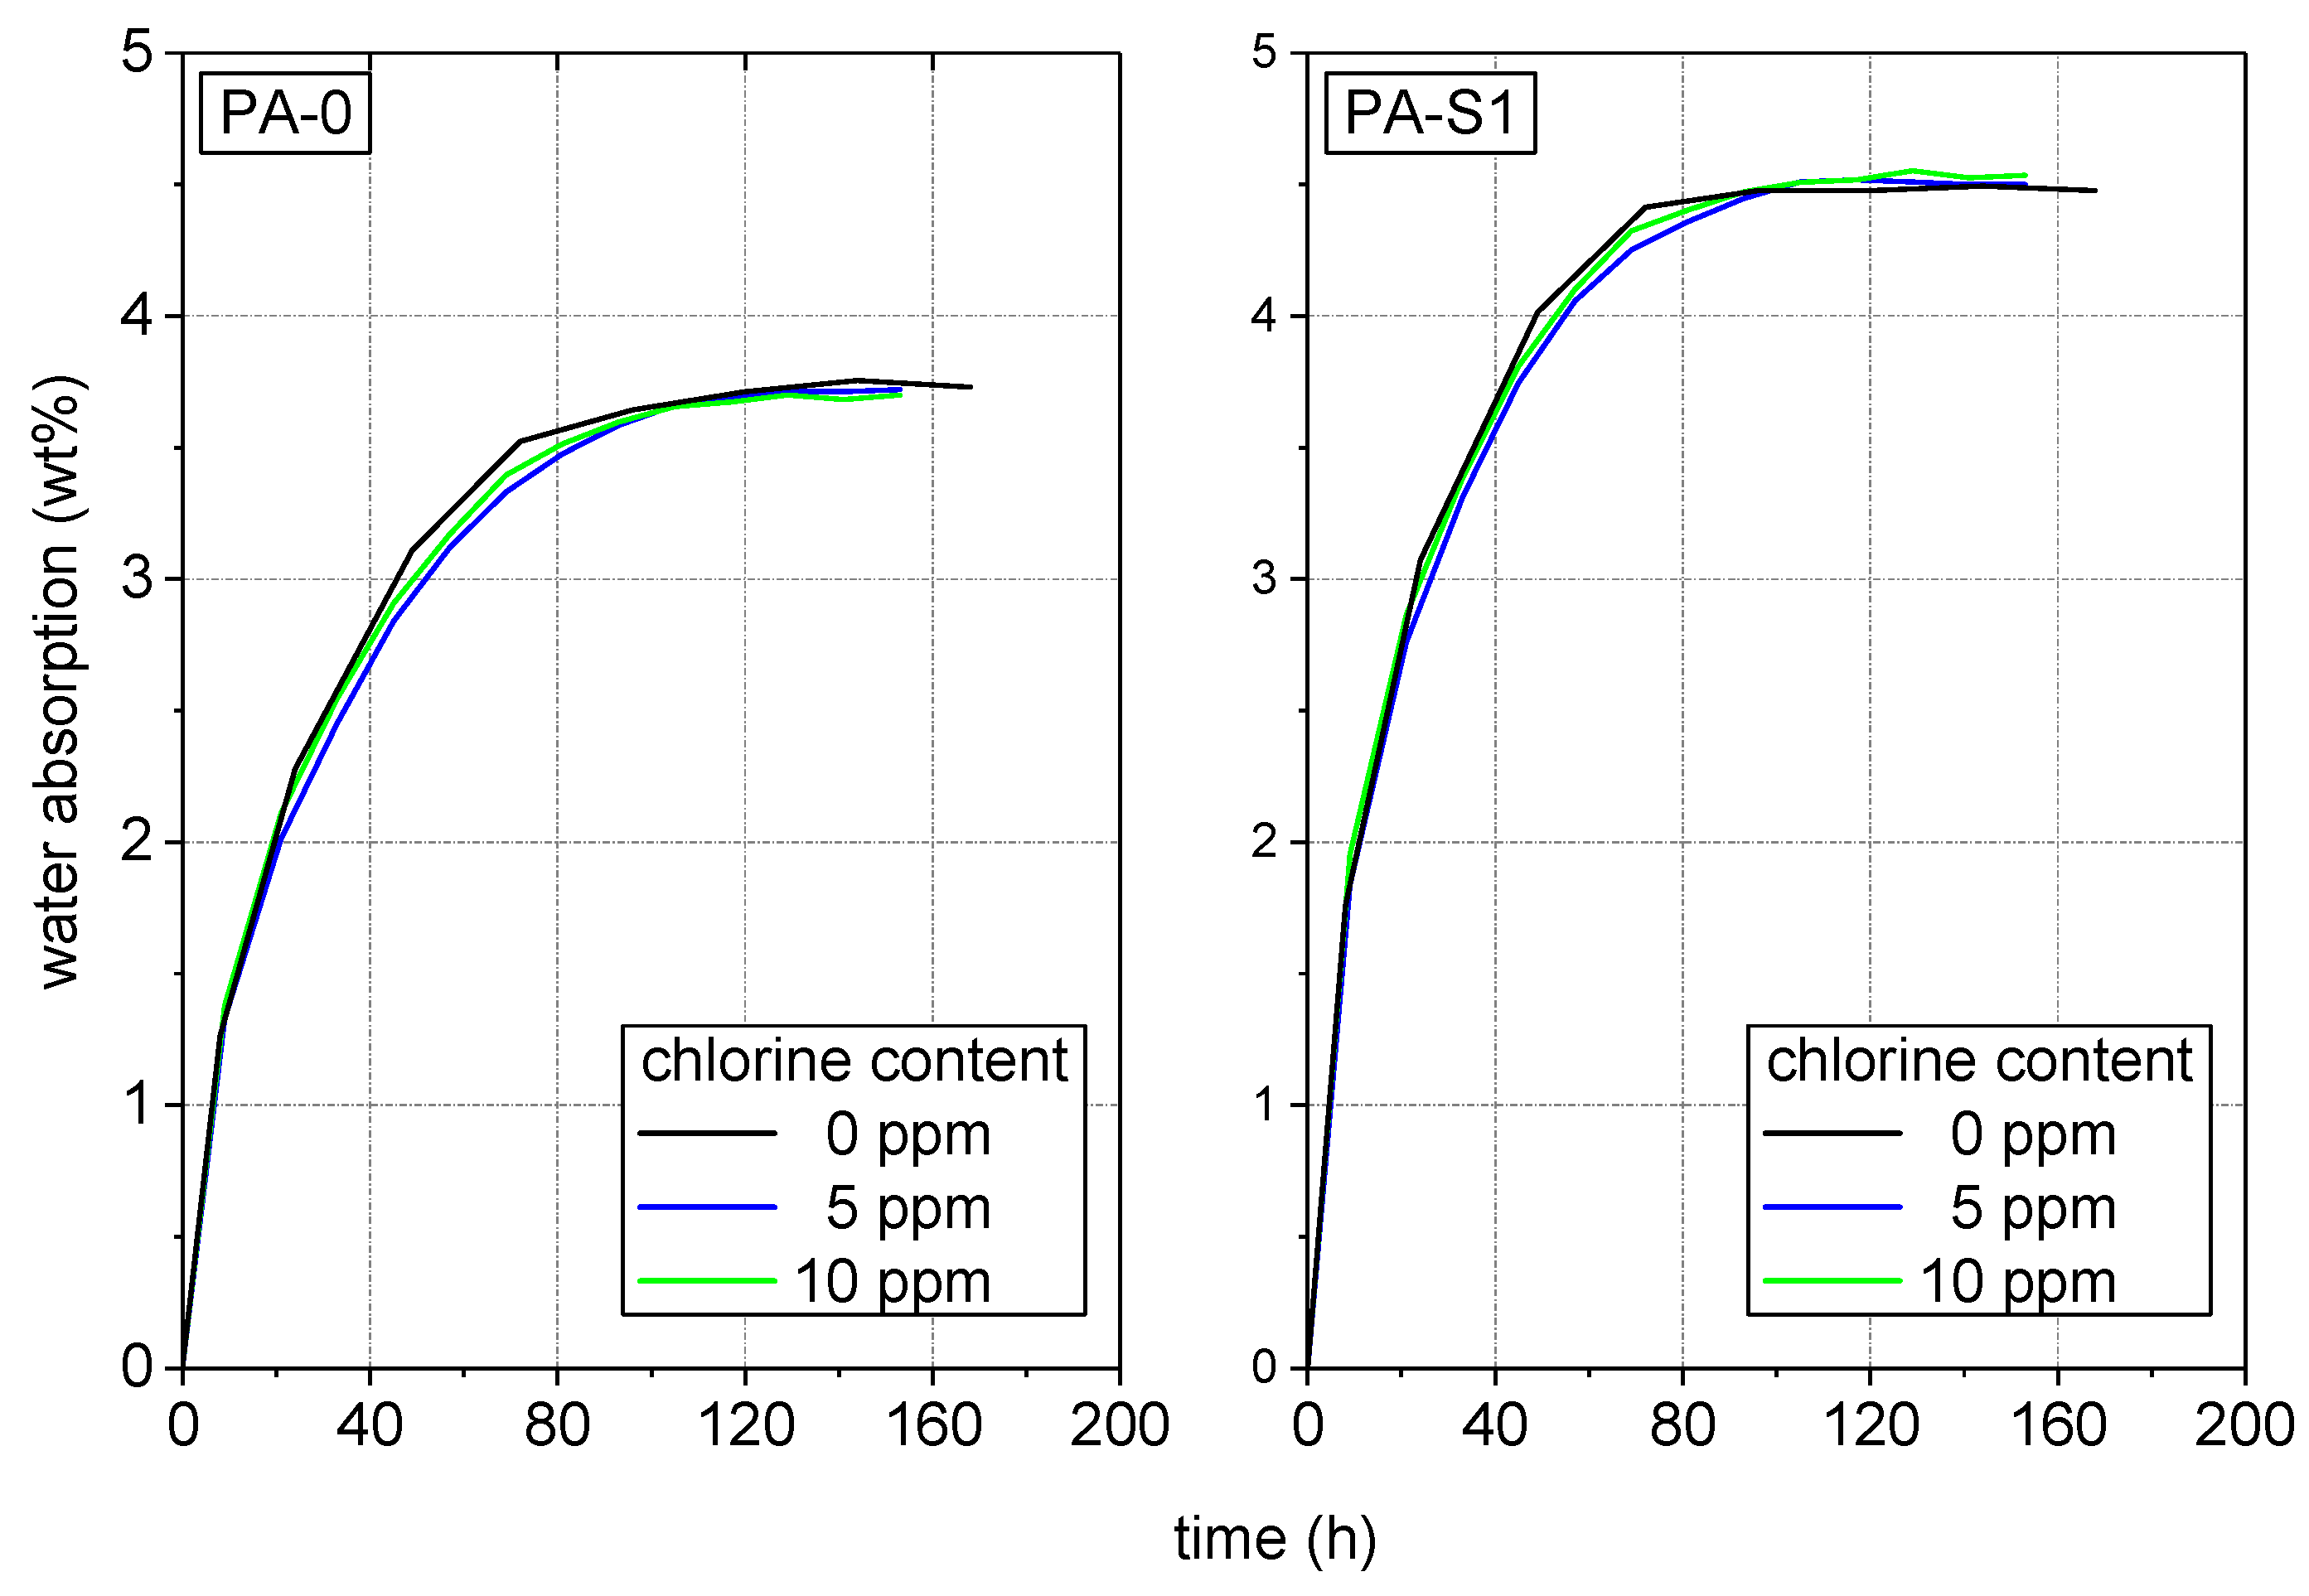
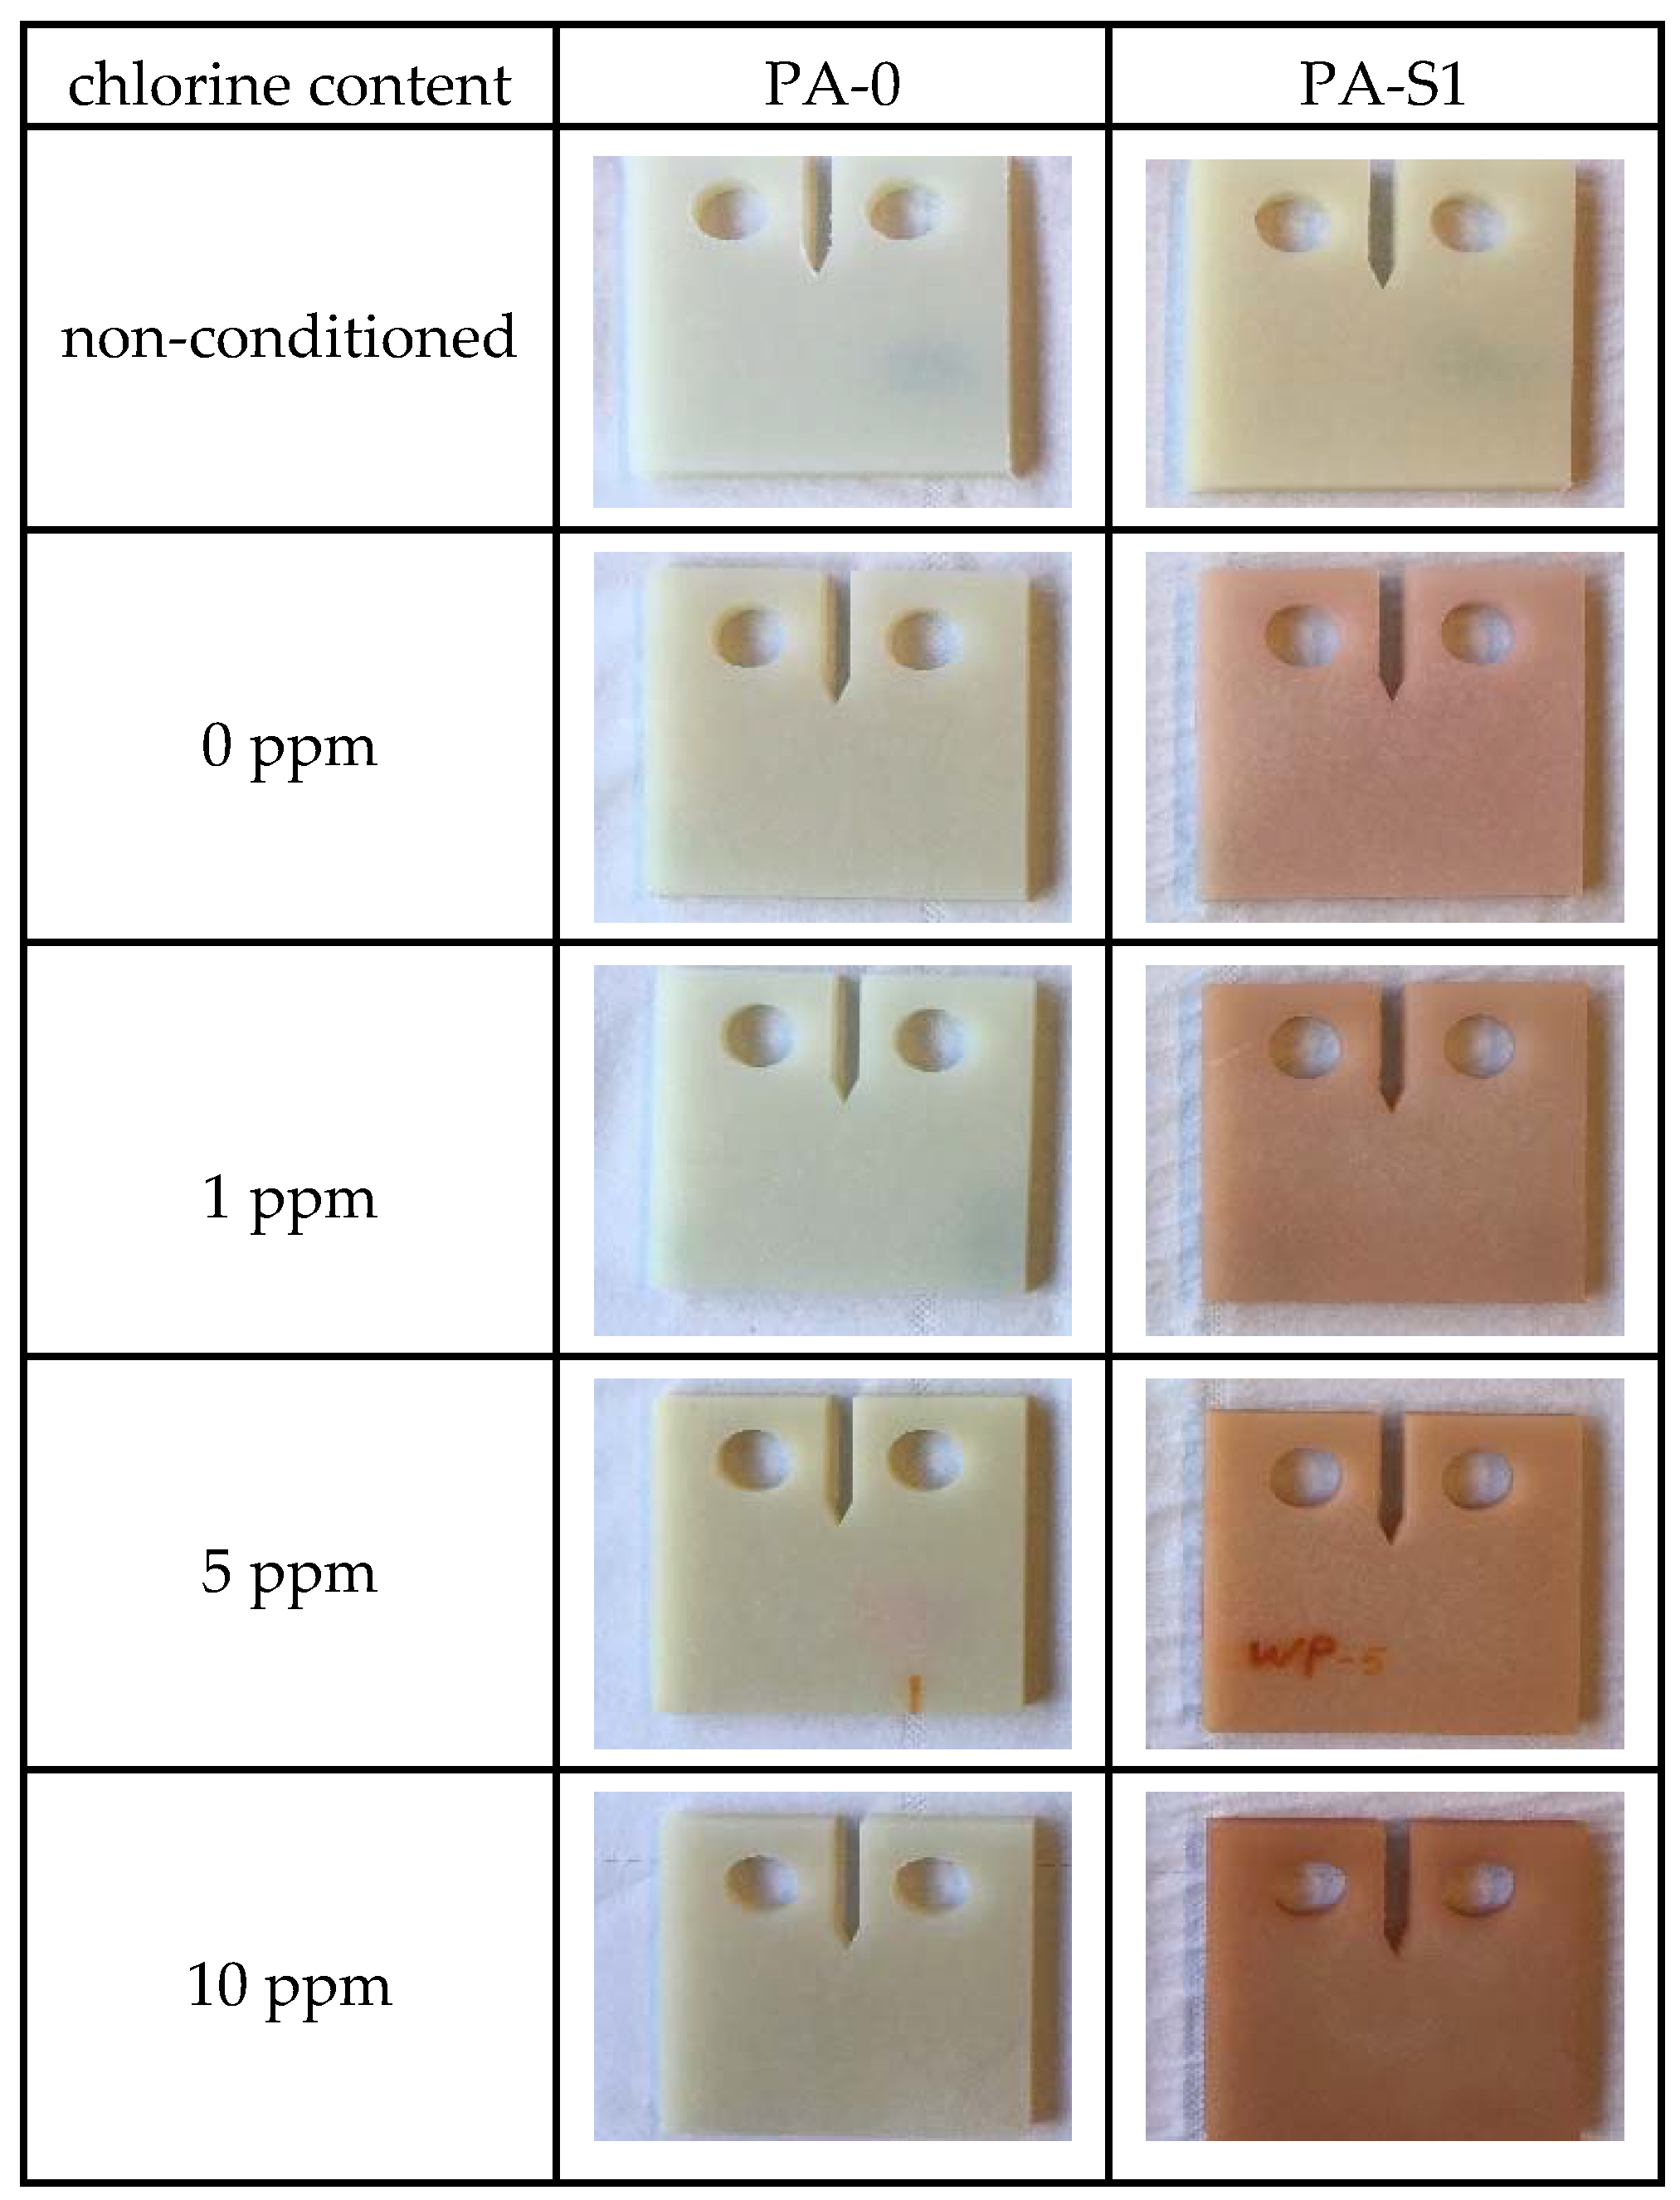
3.1. Specimen Pre-Conditioning and Water Absorption
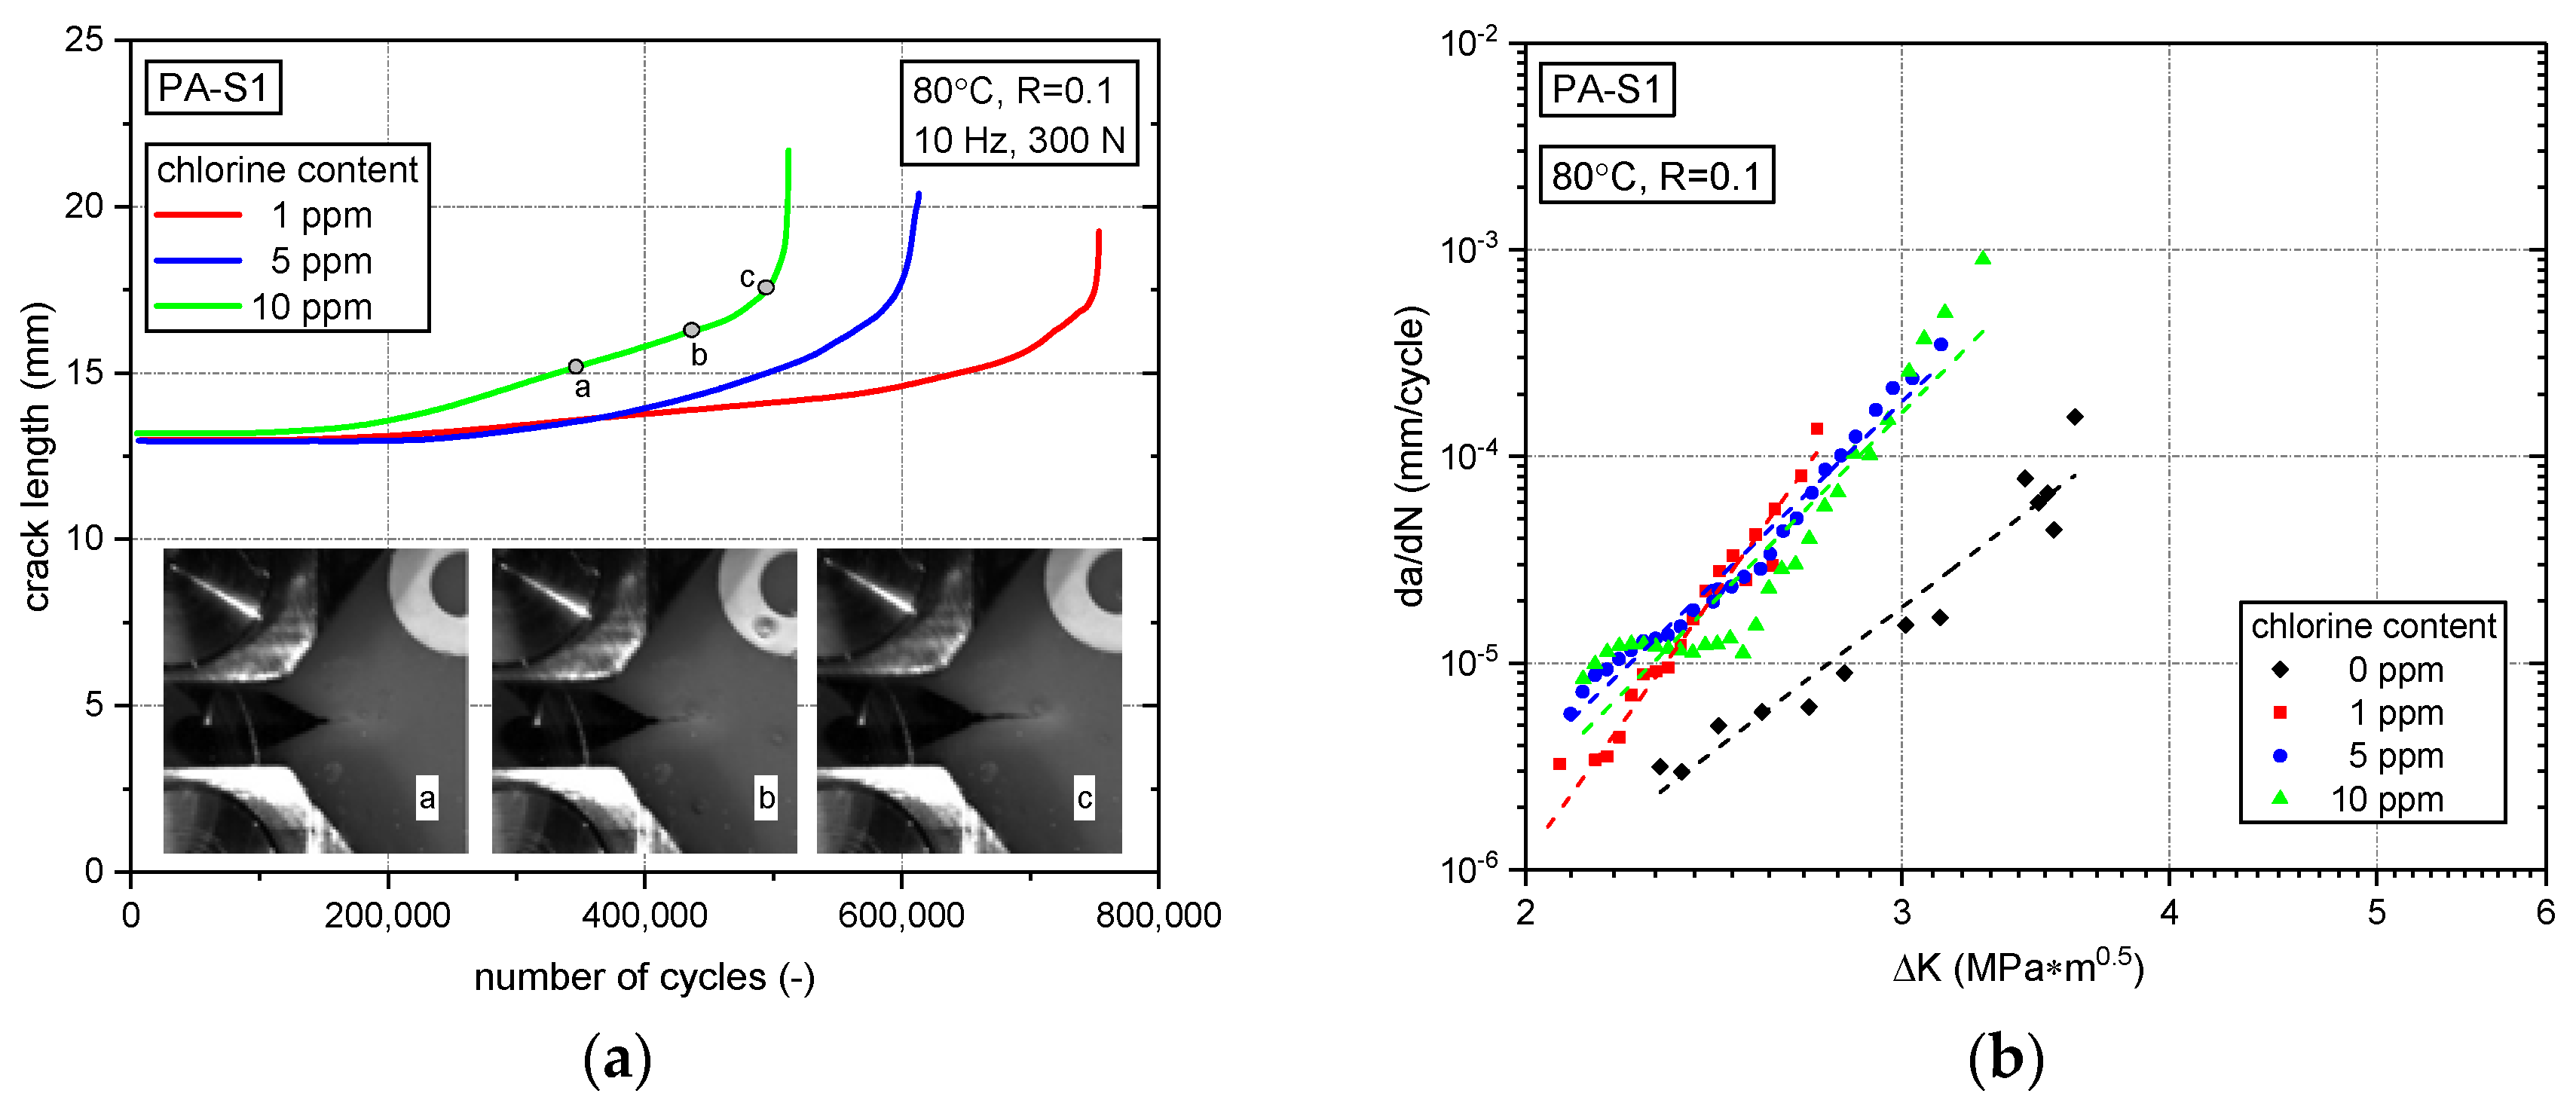
3.2. Fatigue Crack Growth Resistance
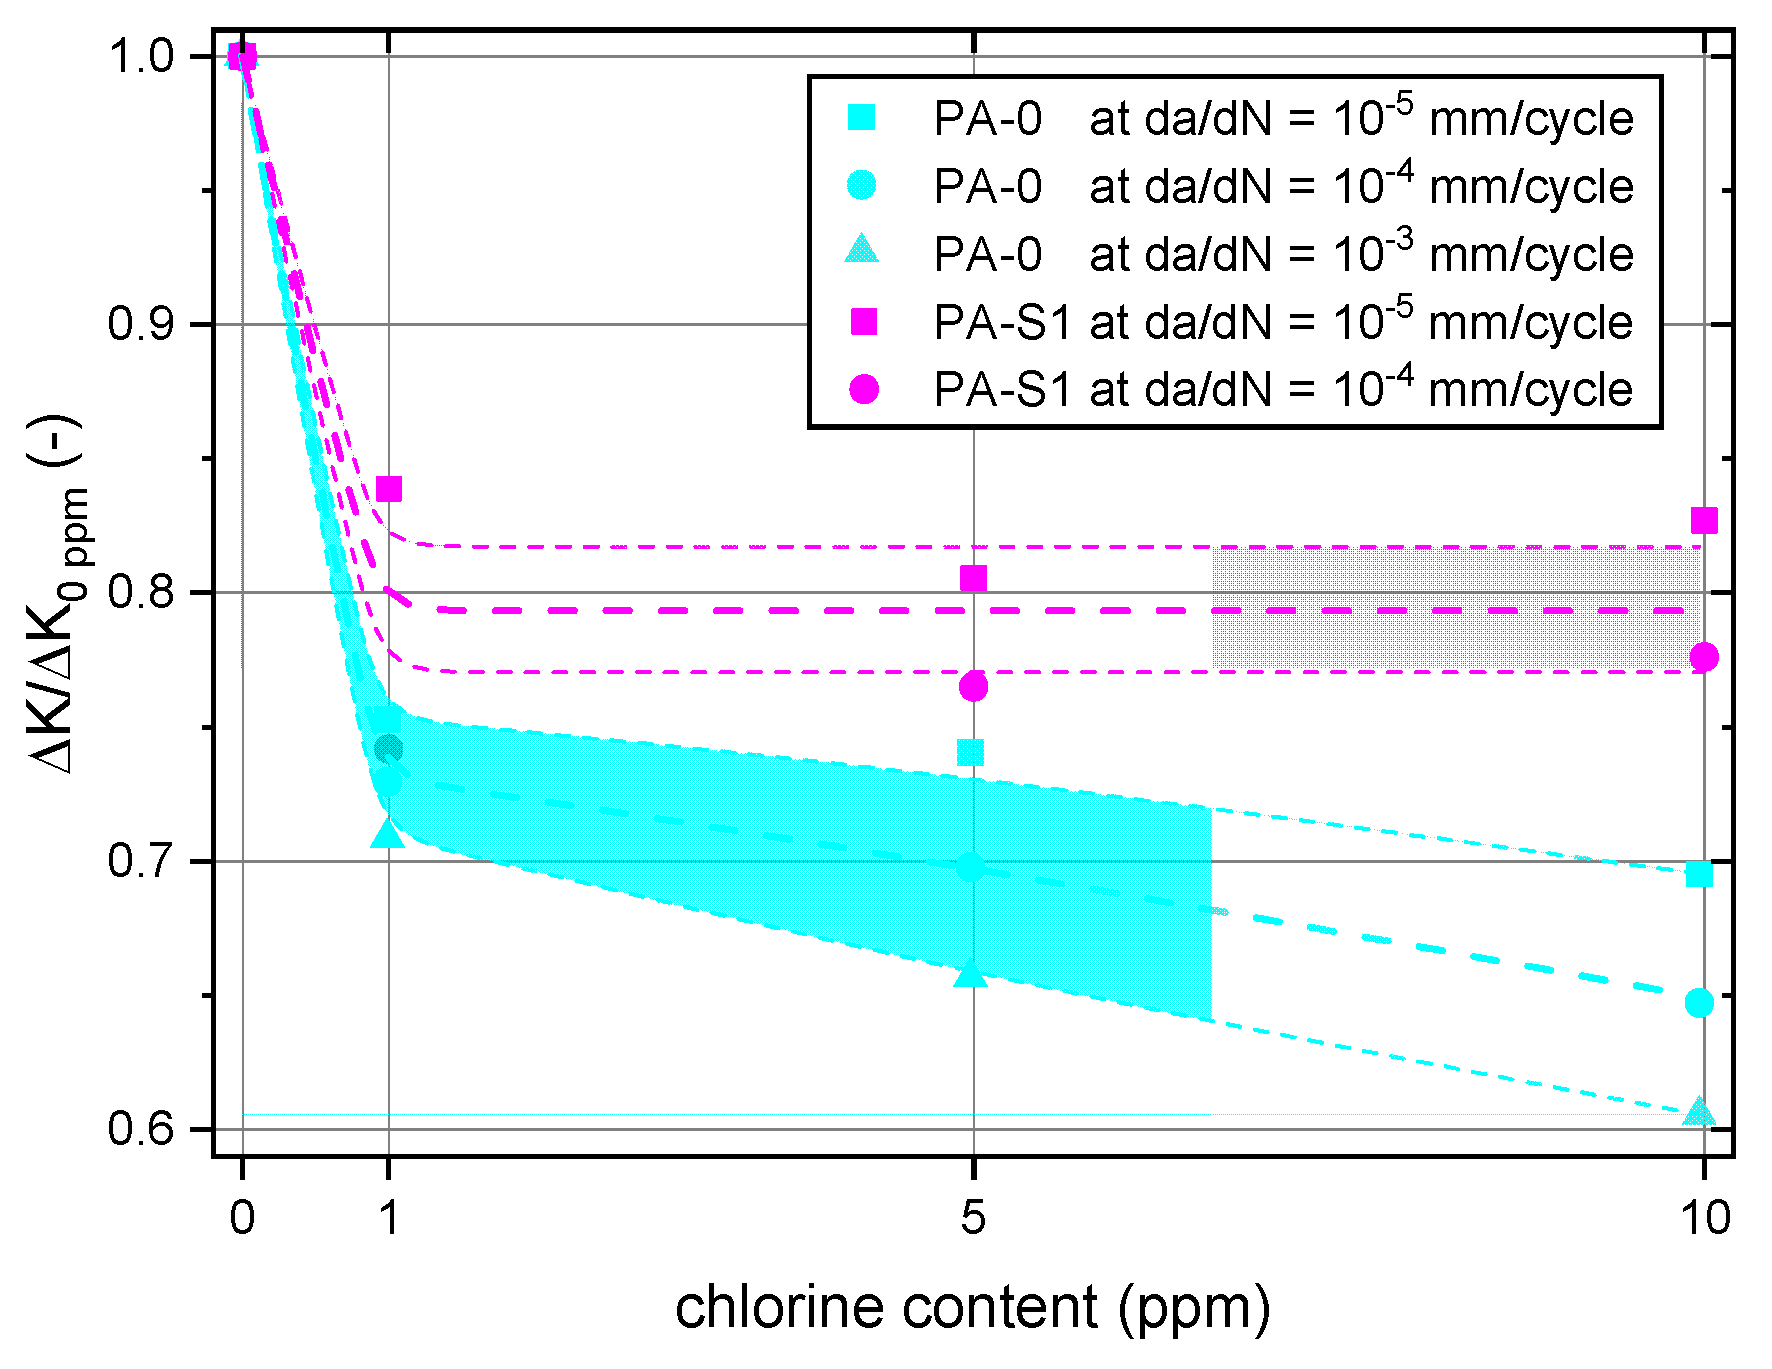
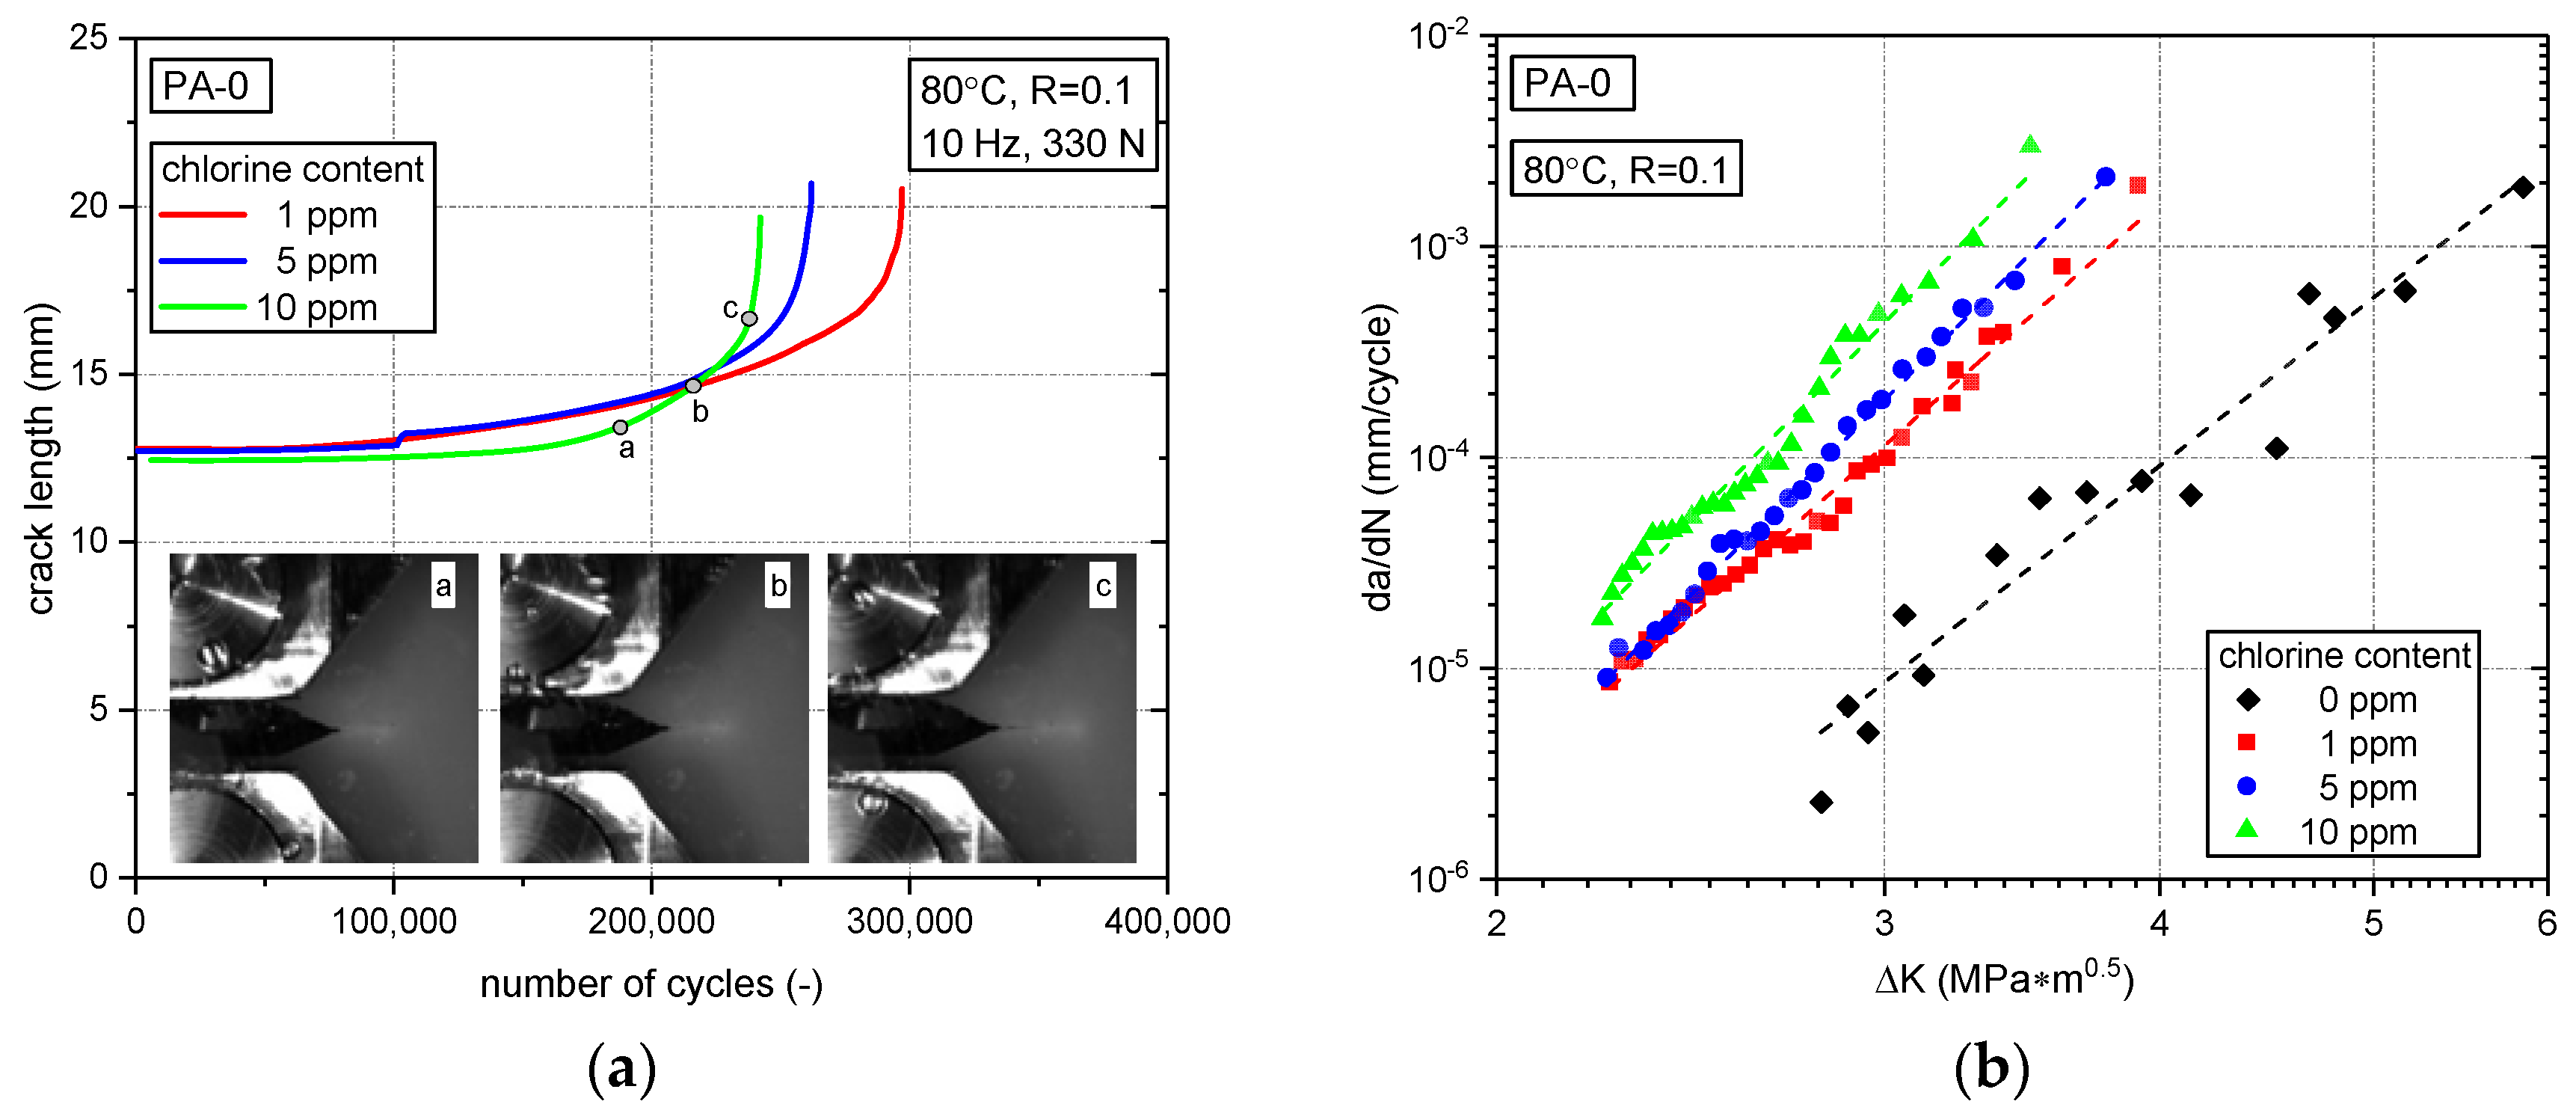
3.2.1. Effect of Chlorine Content
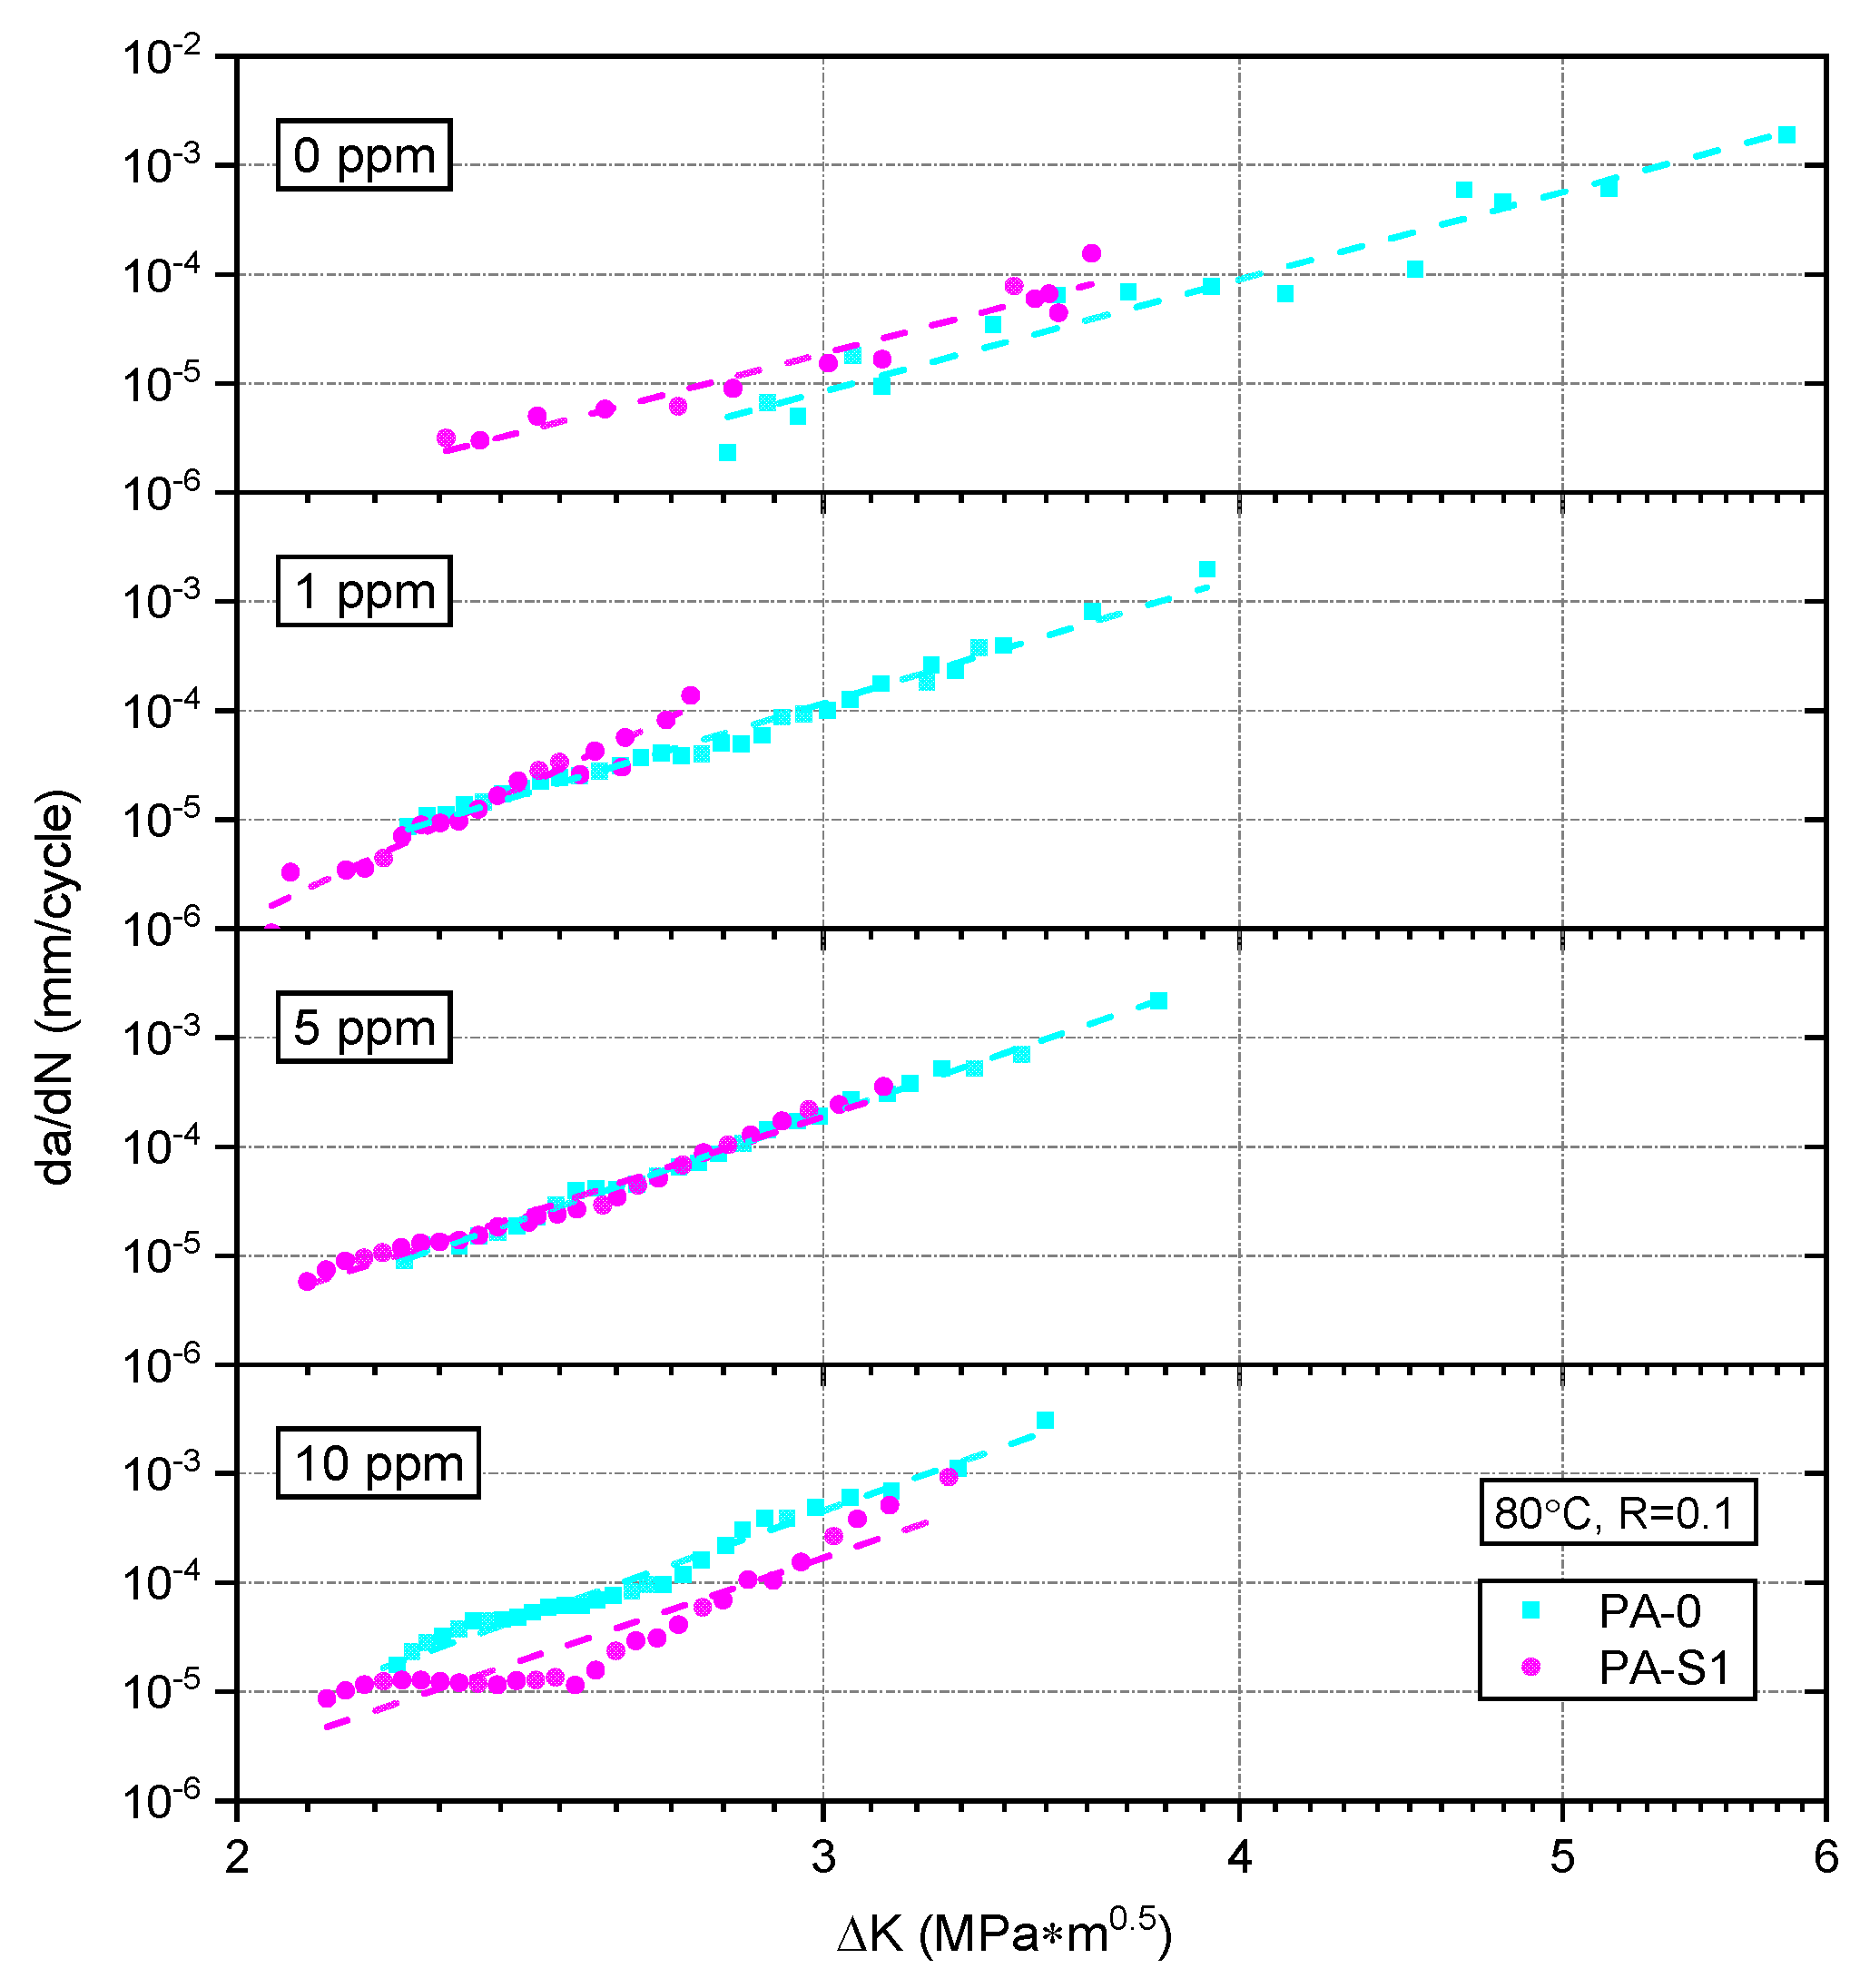
3.2.2. Effect of Stabilizer System
4. Discussion
5. Summary, Main Conclusions, and Outlook
Author Contributions
Funding
Acknowledgments
Conflicts of Interest
References
- Lang, R.W.; Wallner, G.M.; Fischer, J. Novel Solar-Thermal Systems Based on Polymeric Materials: A Comprehensive Science-Driven Research Effort. In Proceedings of the World Congress on Civil, Structural, and Environmental Engineering, Prague, Czech Republic, 30–31 March 2016. [Google Scholar] [CrossRef]
- Köhl, M.; Meir, M.G.; Papillon, P.; Wallner, G.M.; Saile, S. (Eds.) Polymeric Materials for Solar Thermal Applications; Wiley-VCH: Weinheim, Germany, 2012. [Google Scholar]
- Thomason, J.L. Structure–property relationships in glass reinforced polyamide, part 2: The effects of average fiber diameter and diameter distribution. Polym. Compos. 2007, 28, 331–343. [Google Scholar] [CrossRef] [Green Version]
- Arif, M.F.; Meraghni, F.; Chemisky, Y.; Despringre, N.; Robert, G. In situ damage mechanisms investigation of PA66/GF30 composite: Effect of relative humidity. Compos. Part B Eng. 2014, 58, 487–495. [Google Scholar] [CrossRef] [Green Version]
- Monson, L.; Braunwarth, M.; Extrand, C.W. Moisture absorption by various polyamides and their associated dimensional changes. J. Appl. Polym. Sci. 2008, 107, 355–363. [Google Scholar] [CrossRef]
- Solecrafte. Product Brochure. Available online: http://www.solcrafte.com/sites/default/files/downloads/solcrafte_brochure_en_2015-12-1.pdf (accessed on 6 September 2016).
- Fischer, J.; Bradler, P.R.; Schlaeger, M.; Wallner, G.M.; Lang, R.W. Novel Solar Thermal Collector Systems in Polymer Design—Part 5: Fatigue Characterization of Engineering PA Grades for Pressurized Integrated Storage Collectors. Energy Procedia 2016, 91, 27–34. [Google Scholar] [CrossRef]
- Bradler, P.R.; Fischer, J.; Pohn, B.; Wallner, G.M.; Lang, R.W. Effect of stabilizers on the failure behavior of glass fiber reinforced polyamides for mounting and framing of solar energy applications. Energy Procedia 2017, 119, 828–834. [Google Scholar] [CrossRef]
- Fischer, J.; Bradler, P.R.; Leitner, S.; Wallner, G.M.; Lang, R.W. Mechanical Behavior of Polymeric Materials for Mounting Systems of Solar-thermal Collectors. Energy Procedia 2018. accepted. [Google Scholar]
- Bradler, P.R.; Fischer, J.; Schlaeger, M.; Wallner, G.M.; Lang, R.W. A Fracture Mechanical Based Lifetime Assessment Approach for Polyamide Used for Integrated Storage Collectors. In Proceedings of the EuroSun2016, Palma de Mallorca, Spain, 11–14 October 2016; Martínez, V., González, J., Eds.; International Solar Energy Society: Freiburg, Germany, 2016; pp. 1–7. [Google Scholar]
- World Health Organization. Guidelines for Drinking-Water Quality, 4th ed.; World Health Organization: Geneva, Switzerland, 2011. [Google Scholar]
- Deborde, M.; Von Gunten, U. Reactions of chlorine with inorganic and organic compounds during water treatment-Kinetics and mechanisms: A critical review. Water Res. 2008, 42, 13–51. [Google Scholar] [CrossRef] [PubMed]
- World Chlorine Council. Drinking Water Chlorination: World Chlorine Council Position Paper. Available online: https://worldchlorine.org/publications/ (accessed on January 2008).
- Bowman, G.; Mealy, R. The Fundamentals of Chlorine Chemistry and Disinfection; The Wisconsin State Lab of Hygiene and The Wisconsin Dept. of Natural Resources: Madison, WI, USA, 2007. [Google Scholar]
- Fischer, J.; Bradler, P.R.; Lang, R.W. Test equipment for fatigue crack growth testing of polymeric materials in chlorinated water at different temperatures. Eng. Fract. Mech. 2018. [Google Scholar] [CrossRef]
- Kahlen, S.; Jerabek, M.; Wallner, G.M.; Lang, R.W. Characterization of physical and chemical aging of polymeric solar materials by mechanical testing. Polym. Test. 2010, 29, 72–81. [Google Scholar] [CrossRef]
- Bradler, P.R.; Fischer, J.; Pohn, B.; Wallner, G.M.; Lang, R.W. Effect of various stabilizer systems for glass fiber reinforced polyamides on the fatigue behavior under superimposed mechanical-environmental loads. Energy Procedia 2018. accepted. [Google Scholar]
- Geretschlaeger, K.J. Characterization of Pigmented and Reinforced Polymeric Materials for Solar Energy Technologies. Ph.D. Thesis, Johannes Kepler University, Linz, Austria, 2015. [Google Scholar]
- Geretschlaeger, K.J.; Wallner, G.M. Aging characteristics of glass fiber-reinforced polyamide in hot water and air. Polym. Compos. 2016. [Google Scholar] [CrossRef]
- Thomason, J.L.; Ali, J.Z. The dimensional stability of glass–fibre reinforced polyamide 66 during hydrolysis conditioning. Compos. Part A Appl. Sci. Manuf. 2009, 40, 625–634. [Google Scholar] [CrossRef] [Green Version]
- McKeen, L.W. (Ed.) The Effect of Temperature and Other Factors on Plastics and Elastomers, 3rd ed.; Elsevier Science; William Andrew: Amsterdam, The Netherlands, 2014. [Google Scholar] [CrossRef]
- Tanaka, K.; Mizuno, S.; Honda, H.; Katayama, T.; Enoki, S. Effect of Water Absorption on the Mechanical Properties of Carbon Fiber/Polyamide Composites. J. Solid Mech. Mater. Eng. 2013, 7, 520–529. [Google Scholar] [CrossRef]
- Dam, N.; Ogilby, P.R. On the Mechanism of Polyamide Degradation in Chlorinated Water. Helv. Chim. Acta 2001, 84, 2540. [Google Scholar] [CrossRef]
- Buch, P.R.; Mohan, D.J.; Reddy, A.V.R. Preparation, characterization and chlorine stability of aromatic–cycloaliphatic polyamide thin film composite membranes. J. Membr. Sci. 2008, 309, 36–44. [Google Scholar] [CrossRef]
- Glater, J.; Zachariah, M.R.; McCray, S.B.; McCutchan, J.W. Reverse osmosis membrane sensitivity to ozone and halogen disinfectants. Desalination 1983, 48, 1–16. [Google Scholar] [CrossRef]
- Konagaya, S.; Watanabe, O. Influence of chemical structure of isophthaloyl dichloride and aliphatic, cycloaliphatic, and aromatic diamine compound polyamides on their chlorine resistance. J. Appl. Polym. Sci. 2000, 76, 201–207. [Google Scholar] [CrossRef]
- Koo, J.Y.; Petersen, R.J.; Cadotte, J.E. ESCA Characterization of chlorine-damaged polyamide reverse osmosis membrane. Am. Chem. Soc. Polym. Prepr. Div. Polym. Chem. 1986, 27, 391–392. [Google Scholar]
- Freeman, A.; Mantell, S.C.; Davidson, J.H. Mechanical performance of polysulfone, polybutylene, and polyamide 6/6 in hot chlorinated water. Sol. Energy 2005, 79, 624–637. [Google Scholar] [CrossRef]
- Lang, R.W.; Pinter, G.; Balika, W. Konzept zur Nachweisführung für Nutzungsdauer und Sicherheit von PE-Druckrohren bei beliebiger Einbausituation. 3R Int. 2005, 44, 32–41. [Google Scholar]
- Stern, A.; Asanger, F.; Lang, R.W. Creep crack growth testing of plastics—II. data acquisition, data reduction and experimental results. Polym. Test. 1998, 17, 423–441. [Google Scholar] [CrossRef]
- Stern, A.; Novotny, M.; Lang, R.W. Creep crack growth testing of plastics—I. test configurations and test system design. Polym. Test. 1998, 17, 403–422. [Google Scholar] [CrossRef]
- Lang, R.W.; Stern, A.; Doerner, G. Applicability and limitations of current lifetime prediction models for thermoplastics pipes under internal pressure. Angew. Makromol. Chem. 1997, 247, 131–145. [Google Scholar] [CrossRef]
- DeCoste, J.B.; Malm, F.S.; Wallder, V.T. Cracking of Stressed Polyethylene. Ind. Eng. Chem. 1951, 43, 117–121. [Google Scholar] [CrossRef]
- Schoeffl, P.F. Influence of Liquid Hydrocarbon Environments on High Density Polyethylene for Oil and Gas Applications. Ph.D. Thesis, Johannes Kepler University, Linz, Austria, 2014. [Google Scholar]
- Schoeffl, P.F.; Bradler, P.R.; Lang, R.W. Yielding and crack growth testing of polymers under severe liquid media conditions. Polym. Test. 2014, 40, 225–233. [Google Scholar] [CrossRef]
- Schoeffl, P.F.; Lang, R.W. Effect of liquid oilfield-related media on slow crack growth behavior in polyethylene pipe grade materials. Int. J. Fatigue 2015, 72, 90–101. [Google Scholar] [CrossRef]
- Fischer, J.; Bradler, P.R.; Lang, R.W.; Wallner, G.M. Fatigue crack growth resistance of polypropylene in chlorinated water at different temperatures. In Proceedings of the Plastic Pipes XVIII Conference, Berlin, Germany, 12–14 September 2016. [Google Scholar]
- Bradler, P.R.; Fischer, J.; Wallner, G.M.; Lang, R.W. Effect of irradiation induced cross-linking on the properties of different polyamide grades. Energy Procedia 2018. accepted. [Google Scholar]
- Tazaki, G.; Hasegawa, T. Polyamide Resin Composition; WO/2017/115699; World Interlectual Property Organization: Geneva, Switzerland, 2017. [Google Scholar]
- Ulrich, H. Chemistry and Technology of Carbodiimides; John Wiley & Sons: Chichester, UK; Hoboken, NJ, USA, 2007. [Google Scholar]
- Lang, R.W.; Manson, J.A.; Hertzberg, R.W. Fatigue Crack Propagation in Short-Fiber Reinforced Plastics. In Polymer Blends and Composites in Multiphase Systems; Han, C.D., Ed.; American Chemical Society: Washington, DC, USA, 1984; pp. 261–277. [Google Scholar]
- Freudenthaler, P.J. Automated, Optically Assisted Fatigue Crack Growth Method for plastics Using Cracked Round Bar Specimens. Master’s Thesis, Johannes Kepler University, Linz, Austria, 2018. [Google Scholar]
- Saberi Fathi, S.I. Optische Auswertung Von Rissfortpflanzungsversuchen. Bachelor’s Thesis, Johannes Kepler University, Linz, Austria, 2014. [Google Scholar]
- Lang, R.W.; Manson, J.A.; Hertzberg, R.W. Fatigue Crack Propagation in Short-Glass-Fiber-Reinforced Nylon 66: Effect of Frequency. In The Role of the Polymeric Matrix in the Processing and Structural Properties of Composite Materials; Springer: New York, NY, USA, 1983; pp. 377–396. [Google Scholar] [CrossRef]
- Karger-Kocsis, J. Effects of processing induced microstructure on the fatigue crack propagation of unfilled and short fibre-reinforced PA-6. Composites 1990, 21, 243–254. [Google Scholar] [CrossRef]
- Karger-Kocsis, J.; Friedrich, K. Fatigue crack propagation in short and long fibre-reinforced injection-moulded PA 6.6 composites. Composites 1988, 19, 105–114. [Google Scholar] [CrossRef]
- Lang, R.W.; Manson, J.A.; Hertzberg, R.W. Effect of short glass fibers and particulate fillers on fatigue crack propagation in polyamides. Polym. Eng. Sci. 1982, 22, 982–987. [Google Scholar] [CrossRef]
- Gross, D.; Seelig, T. Bruchmechanik. Mit einer Einführung in die Mikromechanik; Springer: Berlin/Heidelberg, Germany, 2011. [Google Scholar]
- Lang, R.W. Polymerphysikalische Anätze zur Beschreibung des Deformations- und Versagensverhaltens von PE-Rohren: Application of polymer physics conceps to deformation and failure behaviour of PE pipes. 3R Int. 1997, 36, 40–44. [Google Scholar]
- Clavería, I.; Elduque, D.; Santolaria, J.; Pina, C.; Javierre, C.; Fernandez, A. The influence of environmental conditions on the dimensional stability of components injected with PA6 and PA66. Polym. Test. 2016, 50, 15–25. [Google Scholar] [CrossRef]
- Lang, R.W.; Manson, J.A.; Hertzberg, R.W. Mechanisms of fatigue fracture in short glass fibre-reinforced polymers. J. Mater. Sci. 1987, 22, 4015–4030. [Google Scholar] [CrossRef]
- Lang, R.W. Applicability of Linear Elastic Fracture Mechanics to Fatigue in Poymers and Short-Fiber Composites. Ph.D. Thesis, Lehigh University, Bethlehem, PA, USA, 1980. [Google Scholar]
- Robeson, L.M. Environmental stress cracking: A review. Polym. Eng. Sci. 2013, 53, 453–467. [Google Scholar] [CrossRef]
- Kamaludin, M.A.; Patel, Y.; Blackman, B.R.K.; Williams, J.G. Fracture mechanics testing for environmental stress cracking in thermoplastics. Procedia Struct. Integr. 2016, 2, 227–234. [Google Scholar] [CrossRef]
- Kamaludin, M.A.; Patel, Y.; Williams, J.G.; Blackman, B.R.K. A fracture mechanics approach to characterising the environmental stress cracking behaviour of thermoplastics. Theor. Appl. Fract. Mech. 2017, 92, 373–380. [Google Scholar] [CrossRef]
- Contino, M.; Andena, L.; Rink, M.; Colombo, A.; Marra, G. Fracture of high-density polyethylene used for bleach bottles. Procedia Struct. Integr. 2016, 2, 213–220. [Google Scholar] [CrossRef] [Green Version]
- Andena, L.; Castellani, L.; Castiglioni, A.; Mendogni, A.; Rink, M.; Sacchetti, F. Determination of environmental stress cracking resistance of polymers: Effects of loading history and testing configuration. Eng. Fract. Mech. 2013, 101, 33–46. [Google Scholar] [CrossRef]
- Andena, L.; Rink, M.; Marano, C.; Briatico-Vangosa, F.; Castellani, L. Effect of processing on the environmental stress cracking resistance of high-impact polystyrene. Polym. Test. 2016, 54, 40–47. [Google Scholar] [CrossRef] [Green Version]
- Bubeck, R.A.; Baker, H.M. The influence of branch length on the deformation and microstructure of polyethylene. Polymer 1982, 23, 1680–1684. [Google Scholar] [CrossRef]
- Mai, Y.-W. Environmental stress cracking of glassy polymers and solubility parameters. J. Mater. Sci. 1986, 21, 904–916. [Google Scholar] [CrossRef]
- Haager, M.; Pinter, G.; Lang, R.W. Estimation of Slow Crack Growth Behavior in Polyethylene after Stepwise Isothermal Crystallization. Macromol. Symp. 2004, 217, 383–390. [Google Scholar] [CrossRef]
- Samat, N.; Burford, R.; Whittle, A.; Hoffman, M. The effects of frequency on fatigue threshold and crack propagation rate in modified and unmodified polyvinyl chloride. Polym. Eng. Sci. 2009, 49, 1299–1310. [Google Scholar] [CrossRef]
- Grellmann, W.; Seidler, S. Kunststoffprüfung; Carl Hanser Verlag GmbH & Co. KG: München, Germany, 2011. [Google Scholar]
- Pinter, G.; Lang, R.W. Effect of stabilization on creep crack growth in high-density polyethylene. J. Appl. Polym. Sci. 2003, 90, 3191–3207. [Google Scholar] [CrossRef]
- Pinter, G.; Duretek, I.; Aust, N.; Lang, R.W. Characterisation of the thermo-oxidative degradation of polyethylene pipes by chromatographical, rheological and thermo-analytical methods. Macromol. Symp. 2002, 181, 213–224. [Google Scholar] [CrossRef]


| Material Designation | Zytel 70F30HSL NC010 | PA Supporting Material | Irganox 1098 | Stabilizer 9000 |
|---|---|---|---|---|
| PA-0 | 100 wt % | - | - | - |
| PA-S1 | 90 wt % | 9 wt % | 0.4 wt % | 0.6 wt % |
© 2018 by the authors. Licensee MDPI, Basel, Switzerland. This article is an open access article distributed under the terms and conditions of the Creative Commons Attribution (CC BY) license (http://creativecommons.org/licenses/by/4.0/).
Share and Cite
Fischer, J.; Bradler, P.R.; Akhras, M.H.; Wallner, G.M.; Lang, R.W. Influence of Hot Chlorinated Water and Stabilizer Package on the Fatigue Crack Growth Resistance of Glass Fiber Reinforced Polyamide. Polymers 2018, 10, 829. https://doi.org/10.3390/polym10080829
Fischer J, Bradler PR, Akhras MH, Wallner GM, Lang RW. Influence of Hot Chlorinated Water and Stabilizer Package on the Fatigue Crack Growth Resistance of Glass Fiber Reinforced Polyamide. Polymers. 2018; 10(8):829. https://doi.org/10.3390/polym10080829
Chicago/Turabian StyleFischer, Joerg, Patrick R. Bradler, Mohamad H. Akhras, Gernot M. Wallner, and Reinhold W. Lang. 2018. "Influence of Hot Chlorinated Water and Stabilizer Package on the Fatigue Crack Growth Resistance of Glass Fiber Reinforced Polyamide" Polymers 10, no. 8: 829. https://doi.org/10.3390/polym10080829