The Coordination and Luminescence of the Eu(III) Complexes with the Polymers (PMMA, PVP)


1
School of Chemistry and Materials Science, Heilongjiang University, Harbin 150086, China
2
Key Laboratory of Functional Inorganic Material Chemistry, Heilongjiang University, Harbin 150086, China
*
Authors to whom correspondence should be addressed.
Polymers 2018, 10(5), 508; https://doi.org/10.3390/polym10050508
Submission received: 21 March 2018
/
Revised: 21 April 2018
/
Accepted: 4 May 2018
/
Published: 7 May 2018
(This article belongs to the Special Issue Electrospinning of Nanofibres)
Abstract
:The rare earth complexes and the polymers can be made into composite nanofibers through electrospinning. The fluorescence intensity of these fiber composites is much higher than that of the rare earth complexes. By changing the mixed proportion of polymethyl methacrylate (PMMA) and complexes, nanofiber materials were prepared. Then, by measuring their fluorescence intensity, it is found that the carbonyl bond of PMMA may have coordinated with the rare earth ions and enhanced the luminescence intensity of them. Then, a series of experiments were designed to study their coordination and luminescence mechanism. The coordination mechanism of the polymers with carbonyl groups and the rare earth complexes was explained by Eu(TFT)3(TPPO), Eu(TFT)3(TPPO)2, Eu(PFP)3(TPPO), Eu(PFP)3(TPPO)2, and polyvinyl pyrrolidone (PVP) dissolved in chloroform solution, where TFT means 2-(2,2,2-trifluoroethyl)-1-tetralone, PFP means 2-(2,2,3,3,3-Pentafluoropro-panoyl)-3,4-dihydronaphthalen-1(2H)-one and TPPO means phosphine oxide. The coordination of PVP and the rare earth complexes in solution was studied, and it was found that the fluorine atoms of the ligand had a significant impact on the aggregation-induced effect of the composites. The electron transitioned in the polymers and the complexes were enhanced greatly by the coordination. The colors of emission light could be adjusted by the coordination of the polymers and the rare earth complexes.
1. Introduction
Lanthanide ions are widely used in the field of optical and magnetic researches on the basis of their peculiar luminescent and magnetic properties [1,2,3,4,5,6]. However, Ln(III) ions are unable to show a high luminous emission under direct excitation because the f–f transitions of lanthanide ions are spin-forbidden. Many scientists find that the auxiliary ligands can play an important role in increasing the intensity of a luminous emission and inhibiting the quenching of fluorescence by an intramolecular energy transfer process from ancillary ligands to the central metal ion—the so-called ‘‘synergistic effect’’ [7]. The design of lanthanide coordination compounds has attracted particular attention in order to improve the luminescent properties of lanthanide ions.
In recent years, people with knowledge of the rare earth complexes attempted to take advantage of the polymers, which can be used as ligands to synthesize a series of macromolecular complexes. These macromolecular complexes have many unique properties [8,9,10,11,12,13]. Some polymers with carbonyl groups have been mixed with the rare earth complexes to be made into nanospinning materials. The fluorescence properties of nanospinning materials were studied, and their properties have been improved greatly [14,15]. However, the in-depth studies of their mechanism have not been reported. We all know that the molecular electron transitions of macromolecular polymers are different to those of the rare earth complexes [16,17].
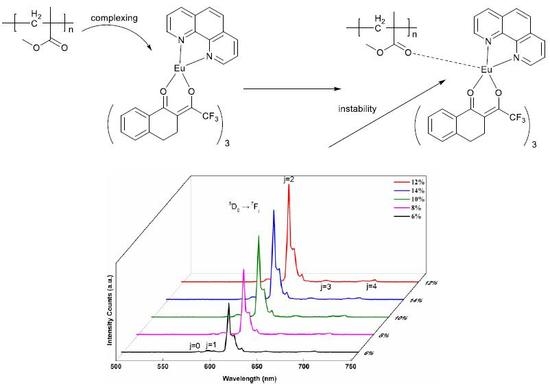
In our previous study, 2-(2,2,2-trifluoroethyl)-1-tetralone (TFT) and 2-(2,2,3,3,3-Pentafluoropro-panoyl)-3,4-dihydronaphthalen-1(2H)-one (PFP) were used to synthesize firm coordination compounds with Eu3+ ions in order to enhance the luminescence intensity due to the effect of their π–π* transition [18,19,20,21,22,23]. In this paper, we further synthesized two ligands and six complexes. The coordination and luminescence mechanism of the complexes and the polymers were studied in different ways. The Eu(TFT)3phen/PMMA and Eu(TFT)3bpy/PMMA nanofibers were prepared by electrospinning technology, and the influence of Eu(III) complexes on both the morphology and the luminescence of composite nanofibers was researched. The synergistic luminescence mechanism of the complexes and the polymers was studied by the combination of some selected complexes with PVP. The polymers have a very strong characteristic emission. The rare earth complexes [24,25,26,27,28,29,30] and the polymers (carbonyl groups) can form unstable coordination, thus changing the fluorescence properties of the Eu(III) complexes [31,32,33,34]. Usually, the emitting colors from the electron transitions in the polymer molecules are blue, while the Eu(III) complexes emit red light. The emitting colors can be adjusted by the coordination of the polymers and the rare earth complexes.
2. Synthesis and Characterization
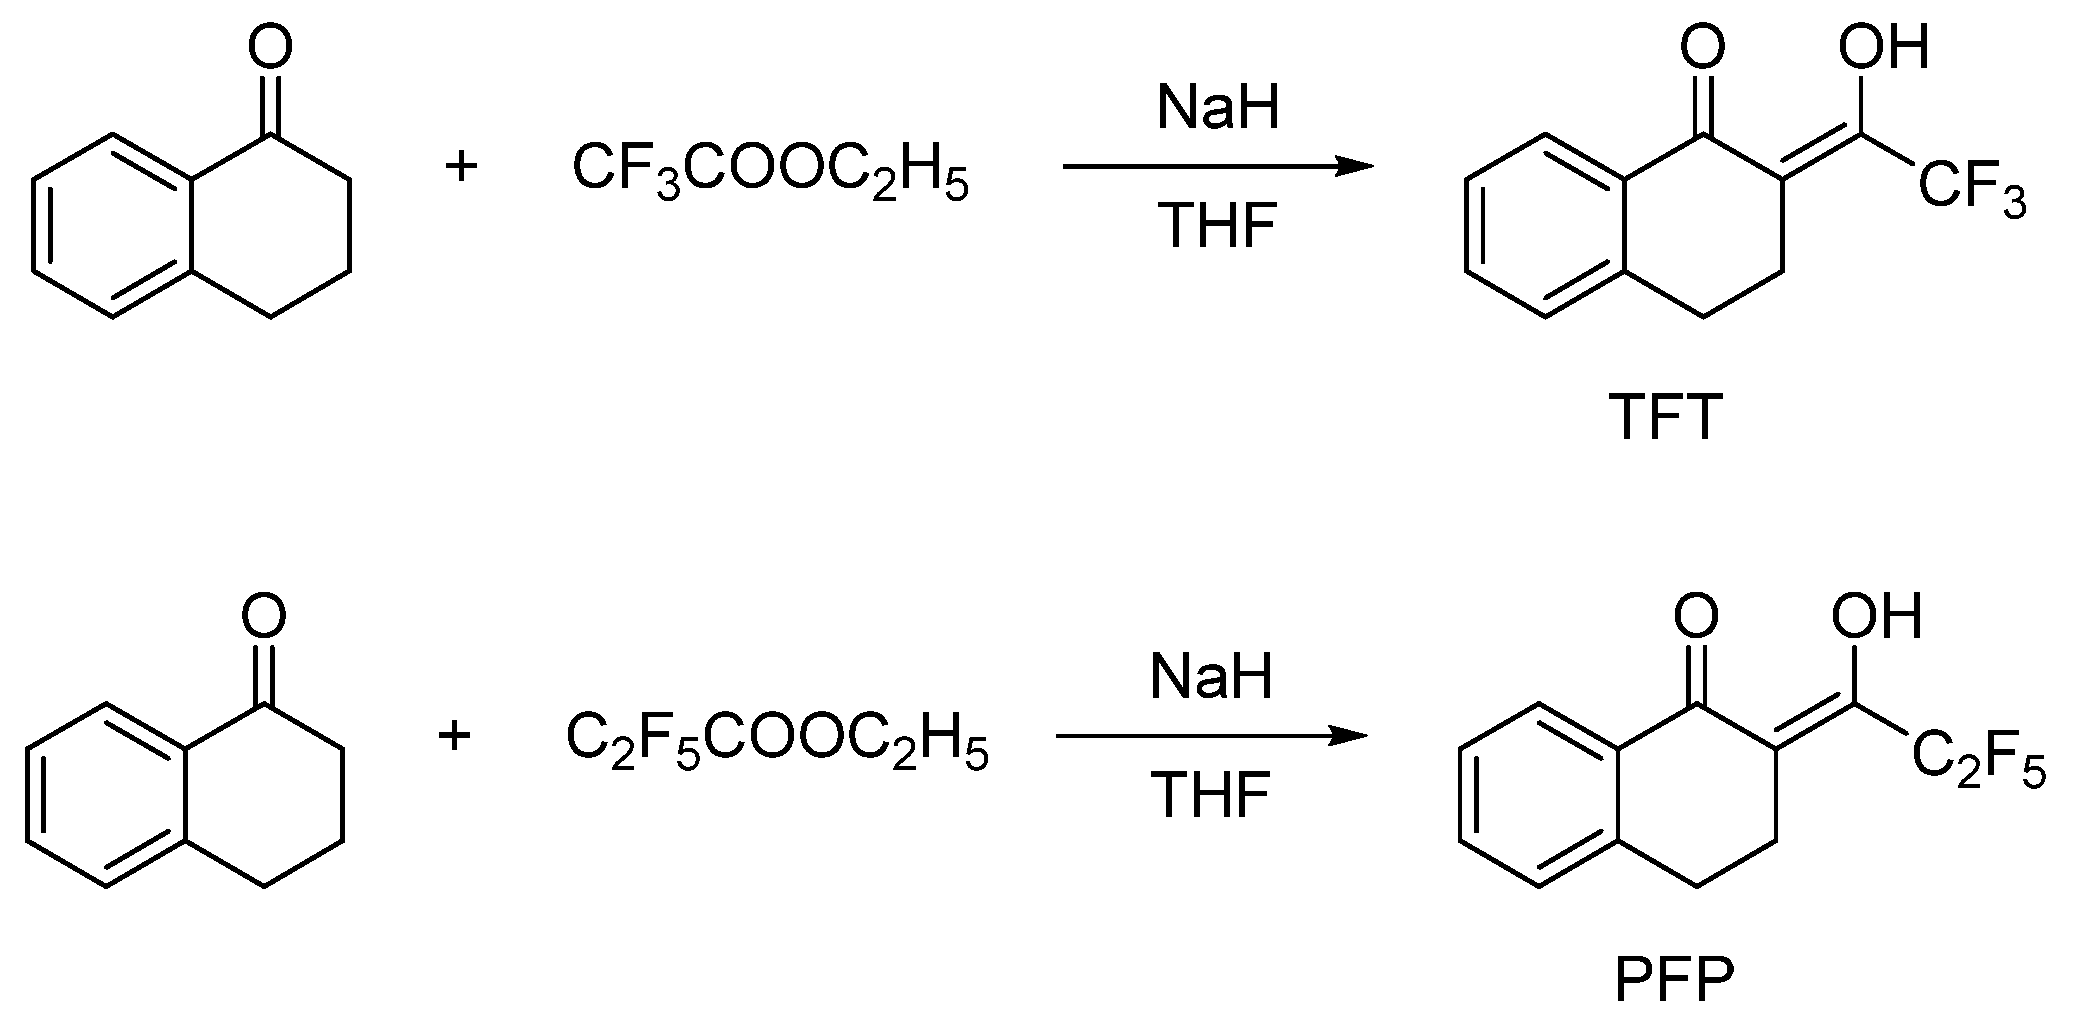
2.1. Synthesis of 2-(2,2,2-trifluoroethyl)-1-tetralone (TFT) and 2-(2,2,3,3,3-pentafluoropropanoyl)-3,4-dihydronaphthalen-1(2H)-one (PFP)
1-tetralone (5.00 mmol) in THF (10 mL) was added to a THF solution (50 mL) of ethyl trifluoroacetate (ethyl pentafluoro-propionate) (10.00 mmol). The mixture was stirred for 1 h. Later, NaH (7.5 mmol) solids were added with vigorous stirring, and the combined solution was stirred at 25 °C for 24 h in an inert atmosphere. Then, a dilute hydrochloric acid solution (0.5 mol·L−1) was added to the solution to make the solution have a pH 2. The mixed solution was extracted twice by dichloromethane. The organic layer was separated from the aqueous layer and dried overnight with anhydrous Na2SO4. After the solvent was removed by reduced pressure distillation, an oily solid was obtained. The solid product was isolated by column chromatography using hexane as an eluent (Scheme 1).
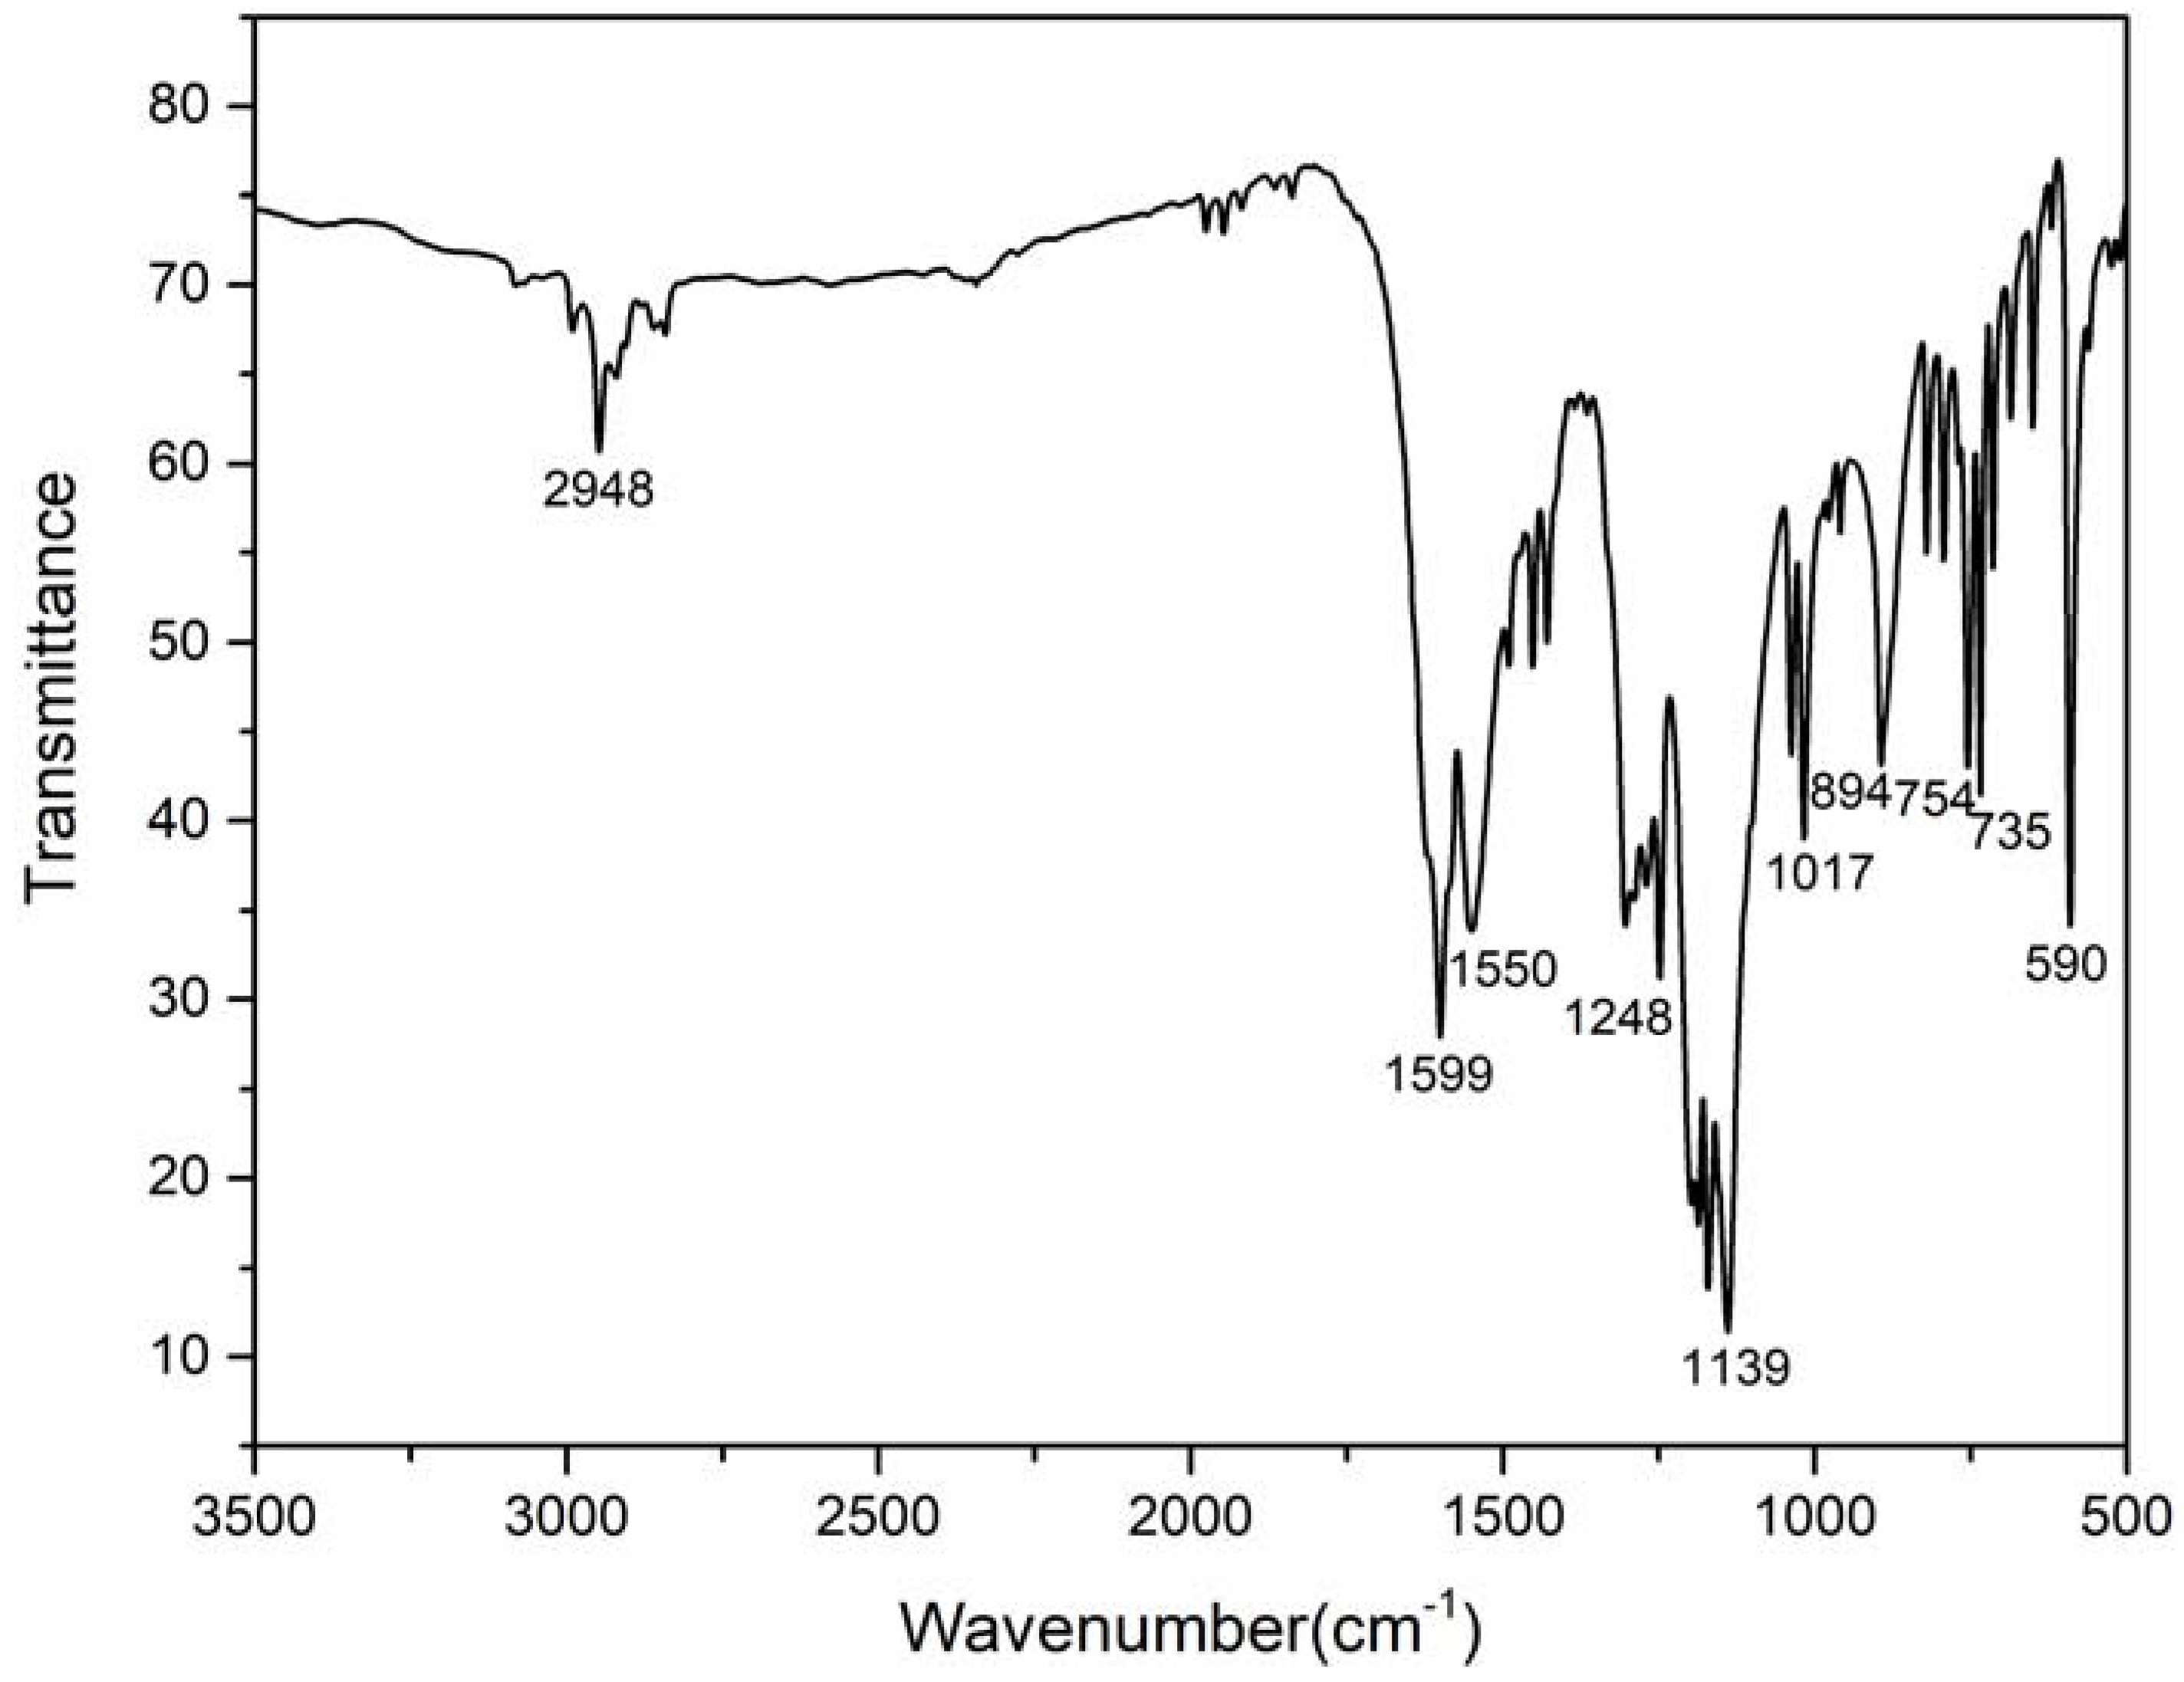
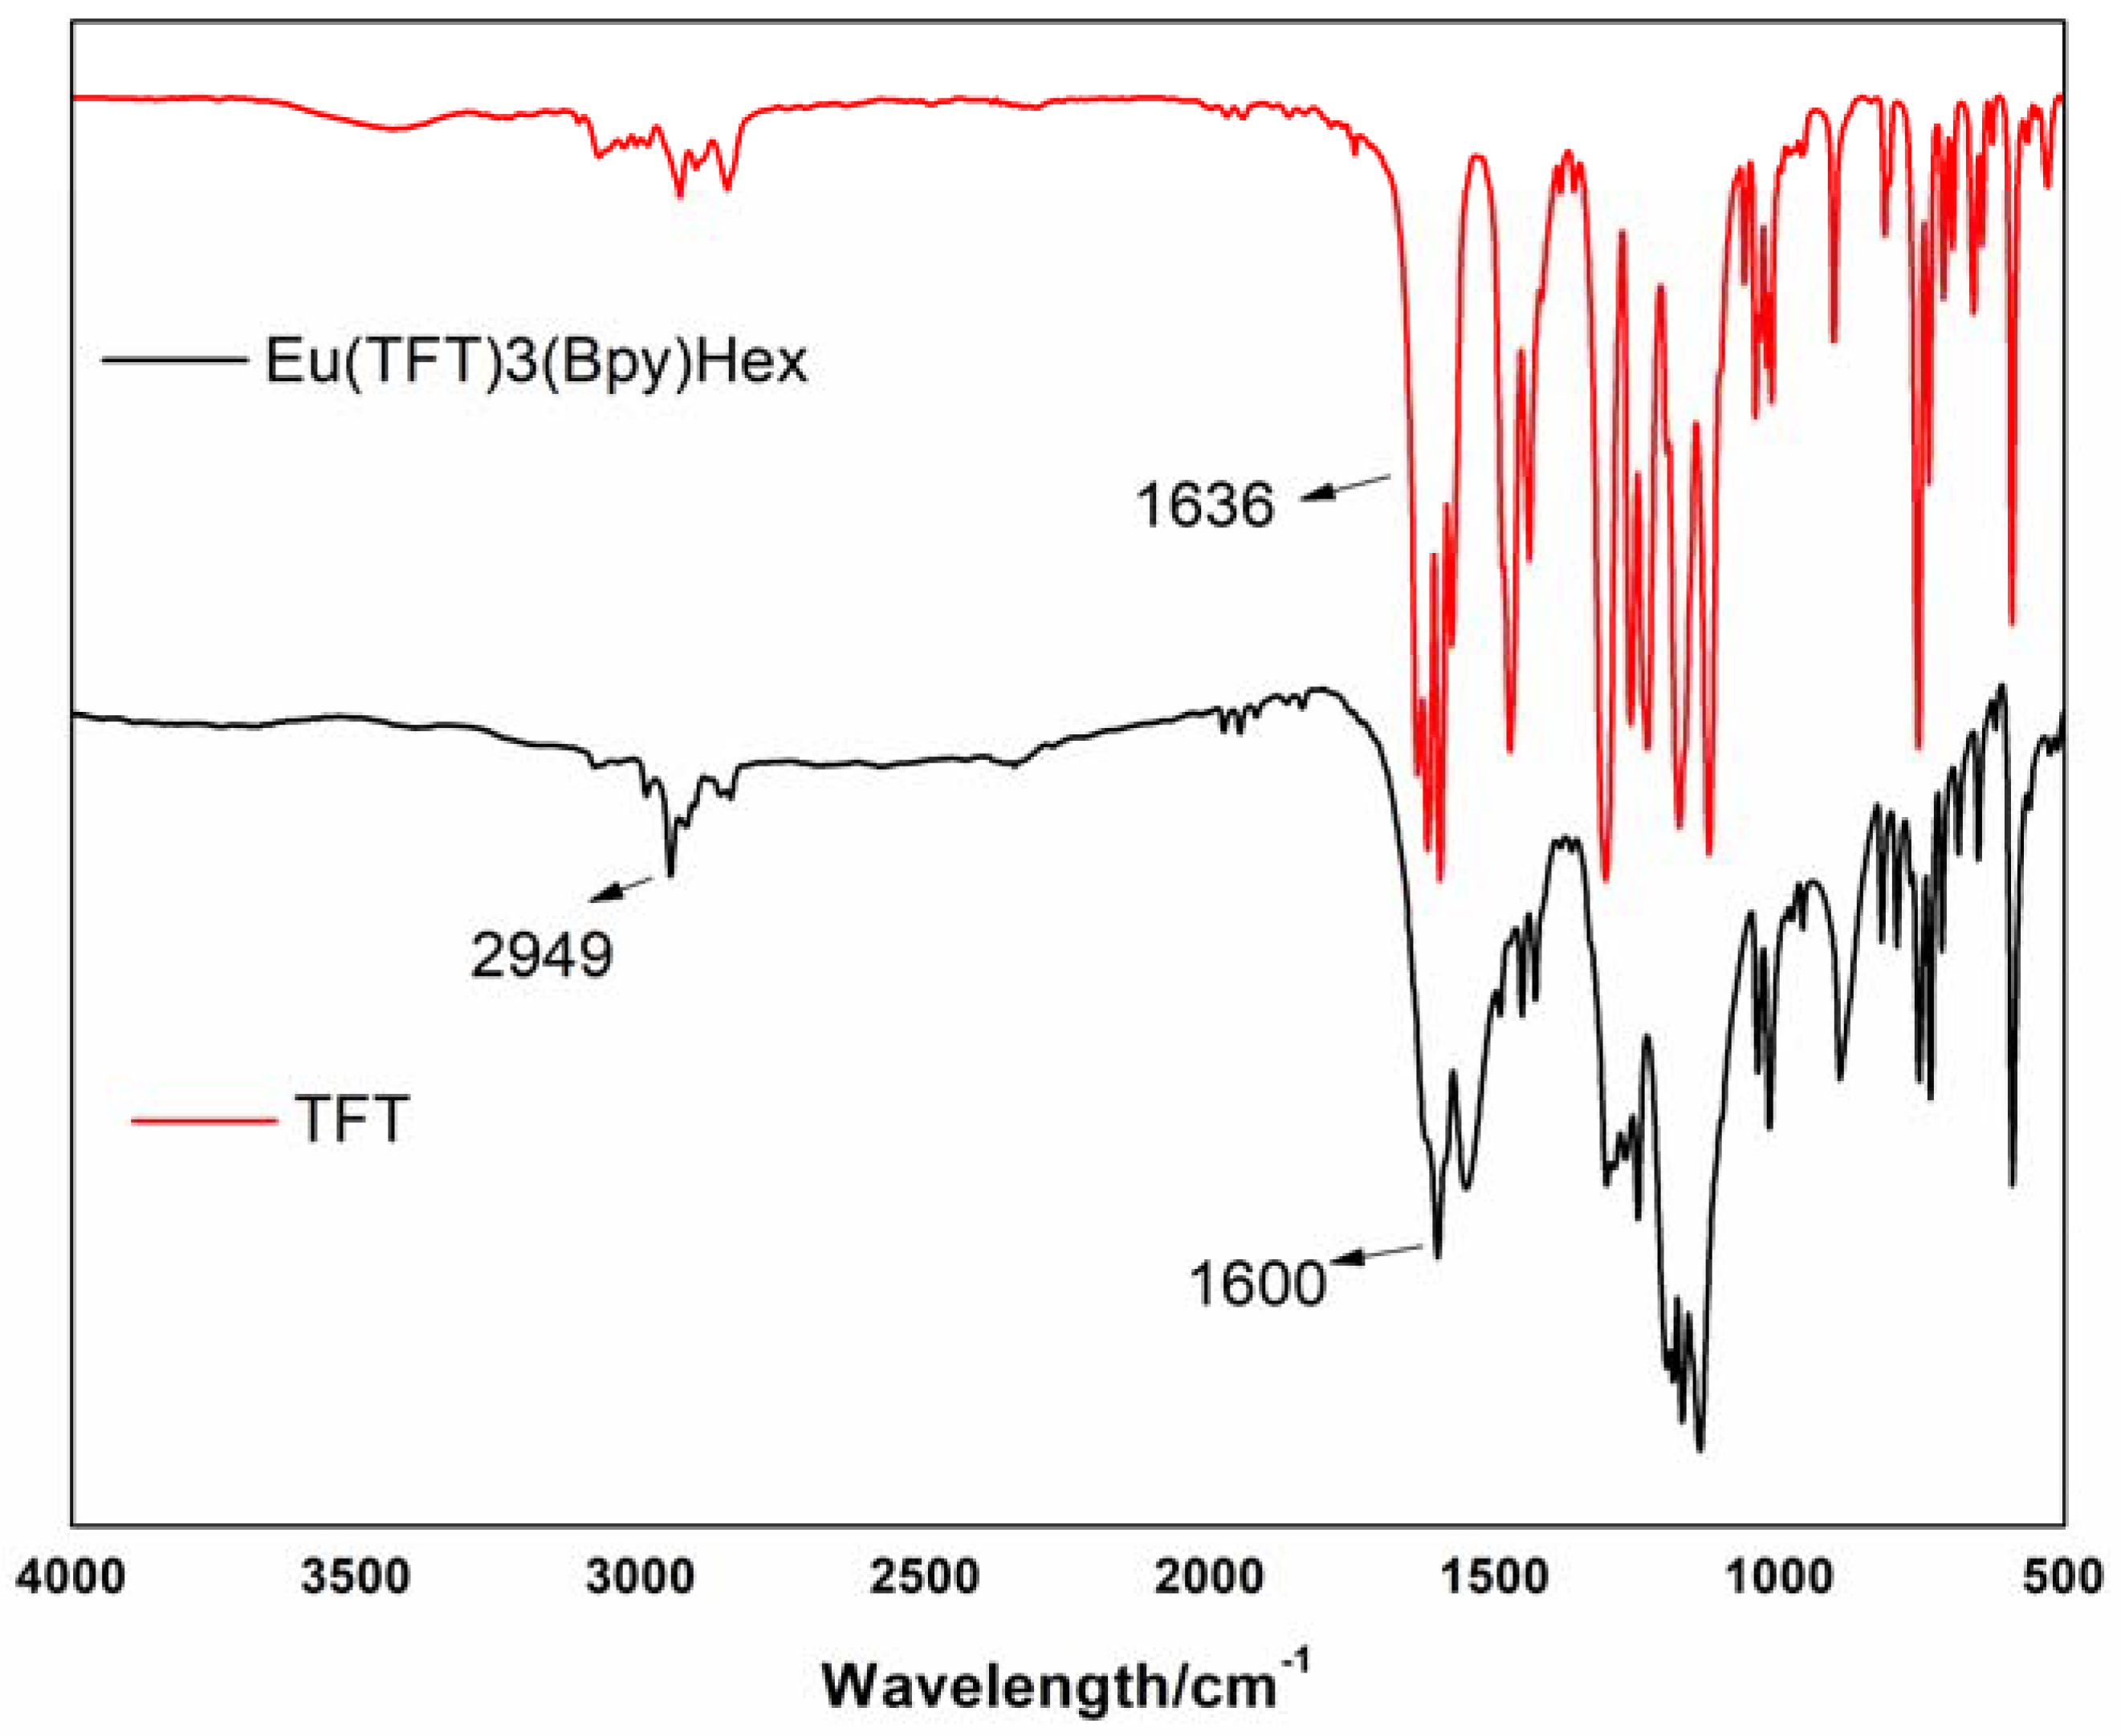
TFT: Yellow crystal. Yield: 81%. m.p. 50.2–50.8 °C. 1H NMR (400 MHz, CDCl3) δ 15.66 (s, 1H), 7.99 (d, J = 7.8 Hz, 1H), 7.50 (td, J = 7.5, 1.4 Hz, 1H), 7.37 (t, J = 7.4 Hz, 1H), 7.28–7.25 (m, 1H), 3.49 (s, 1H), 2.94–2.87 (m, 1H), 2.77 (t, J = 6.8 Hz, 1H) IR (KBr) νmax: 2947 cm−1 (s, νO–H), 1600 cm−1 (s, νC=O), 1303 cm−1 (s), 1246 cm−1 (s), 1139 cm−1 (s, νC–F), 753 cm−1 (m, νCF3).
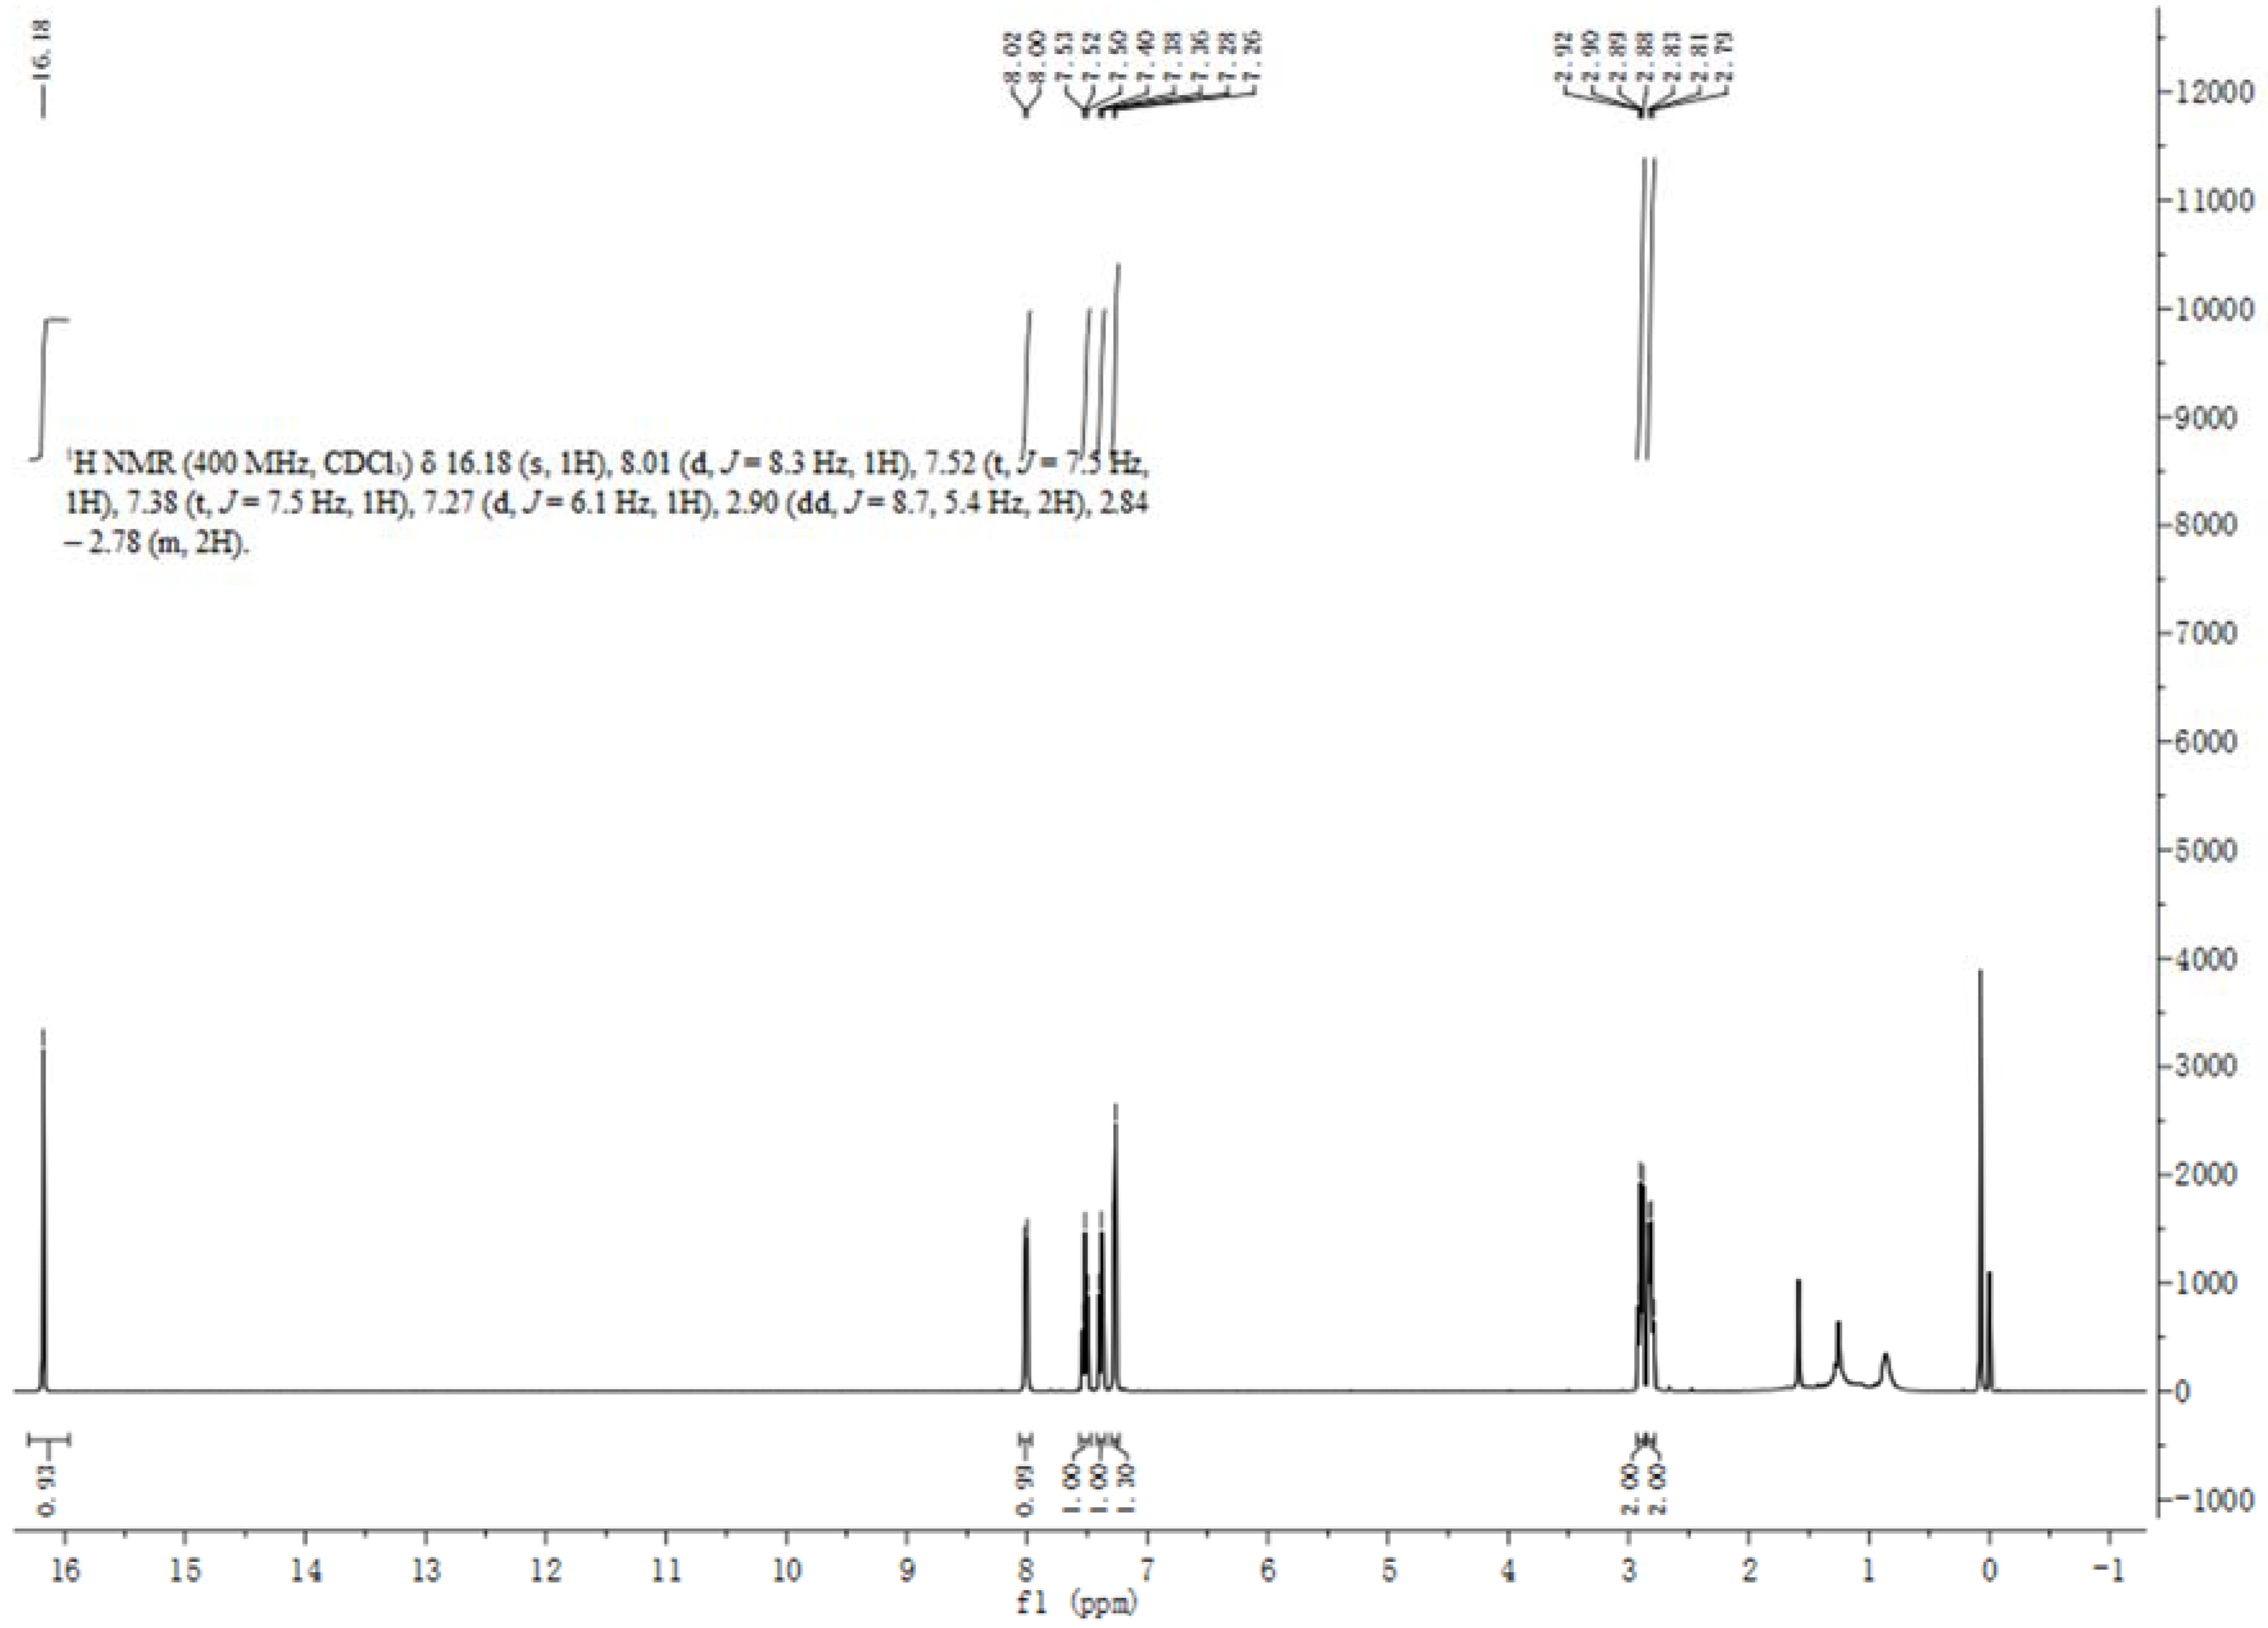
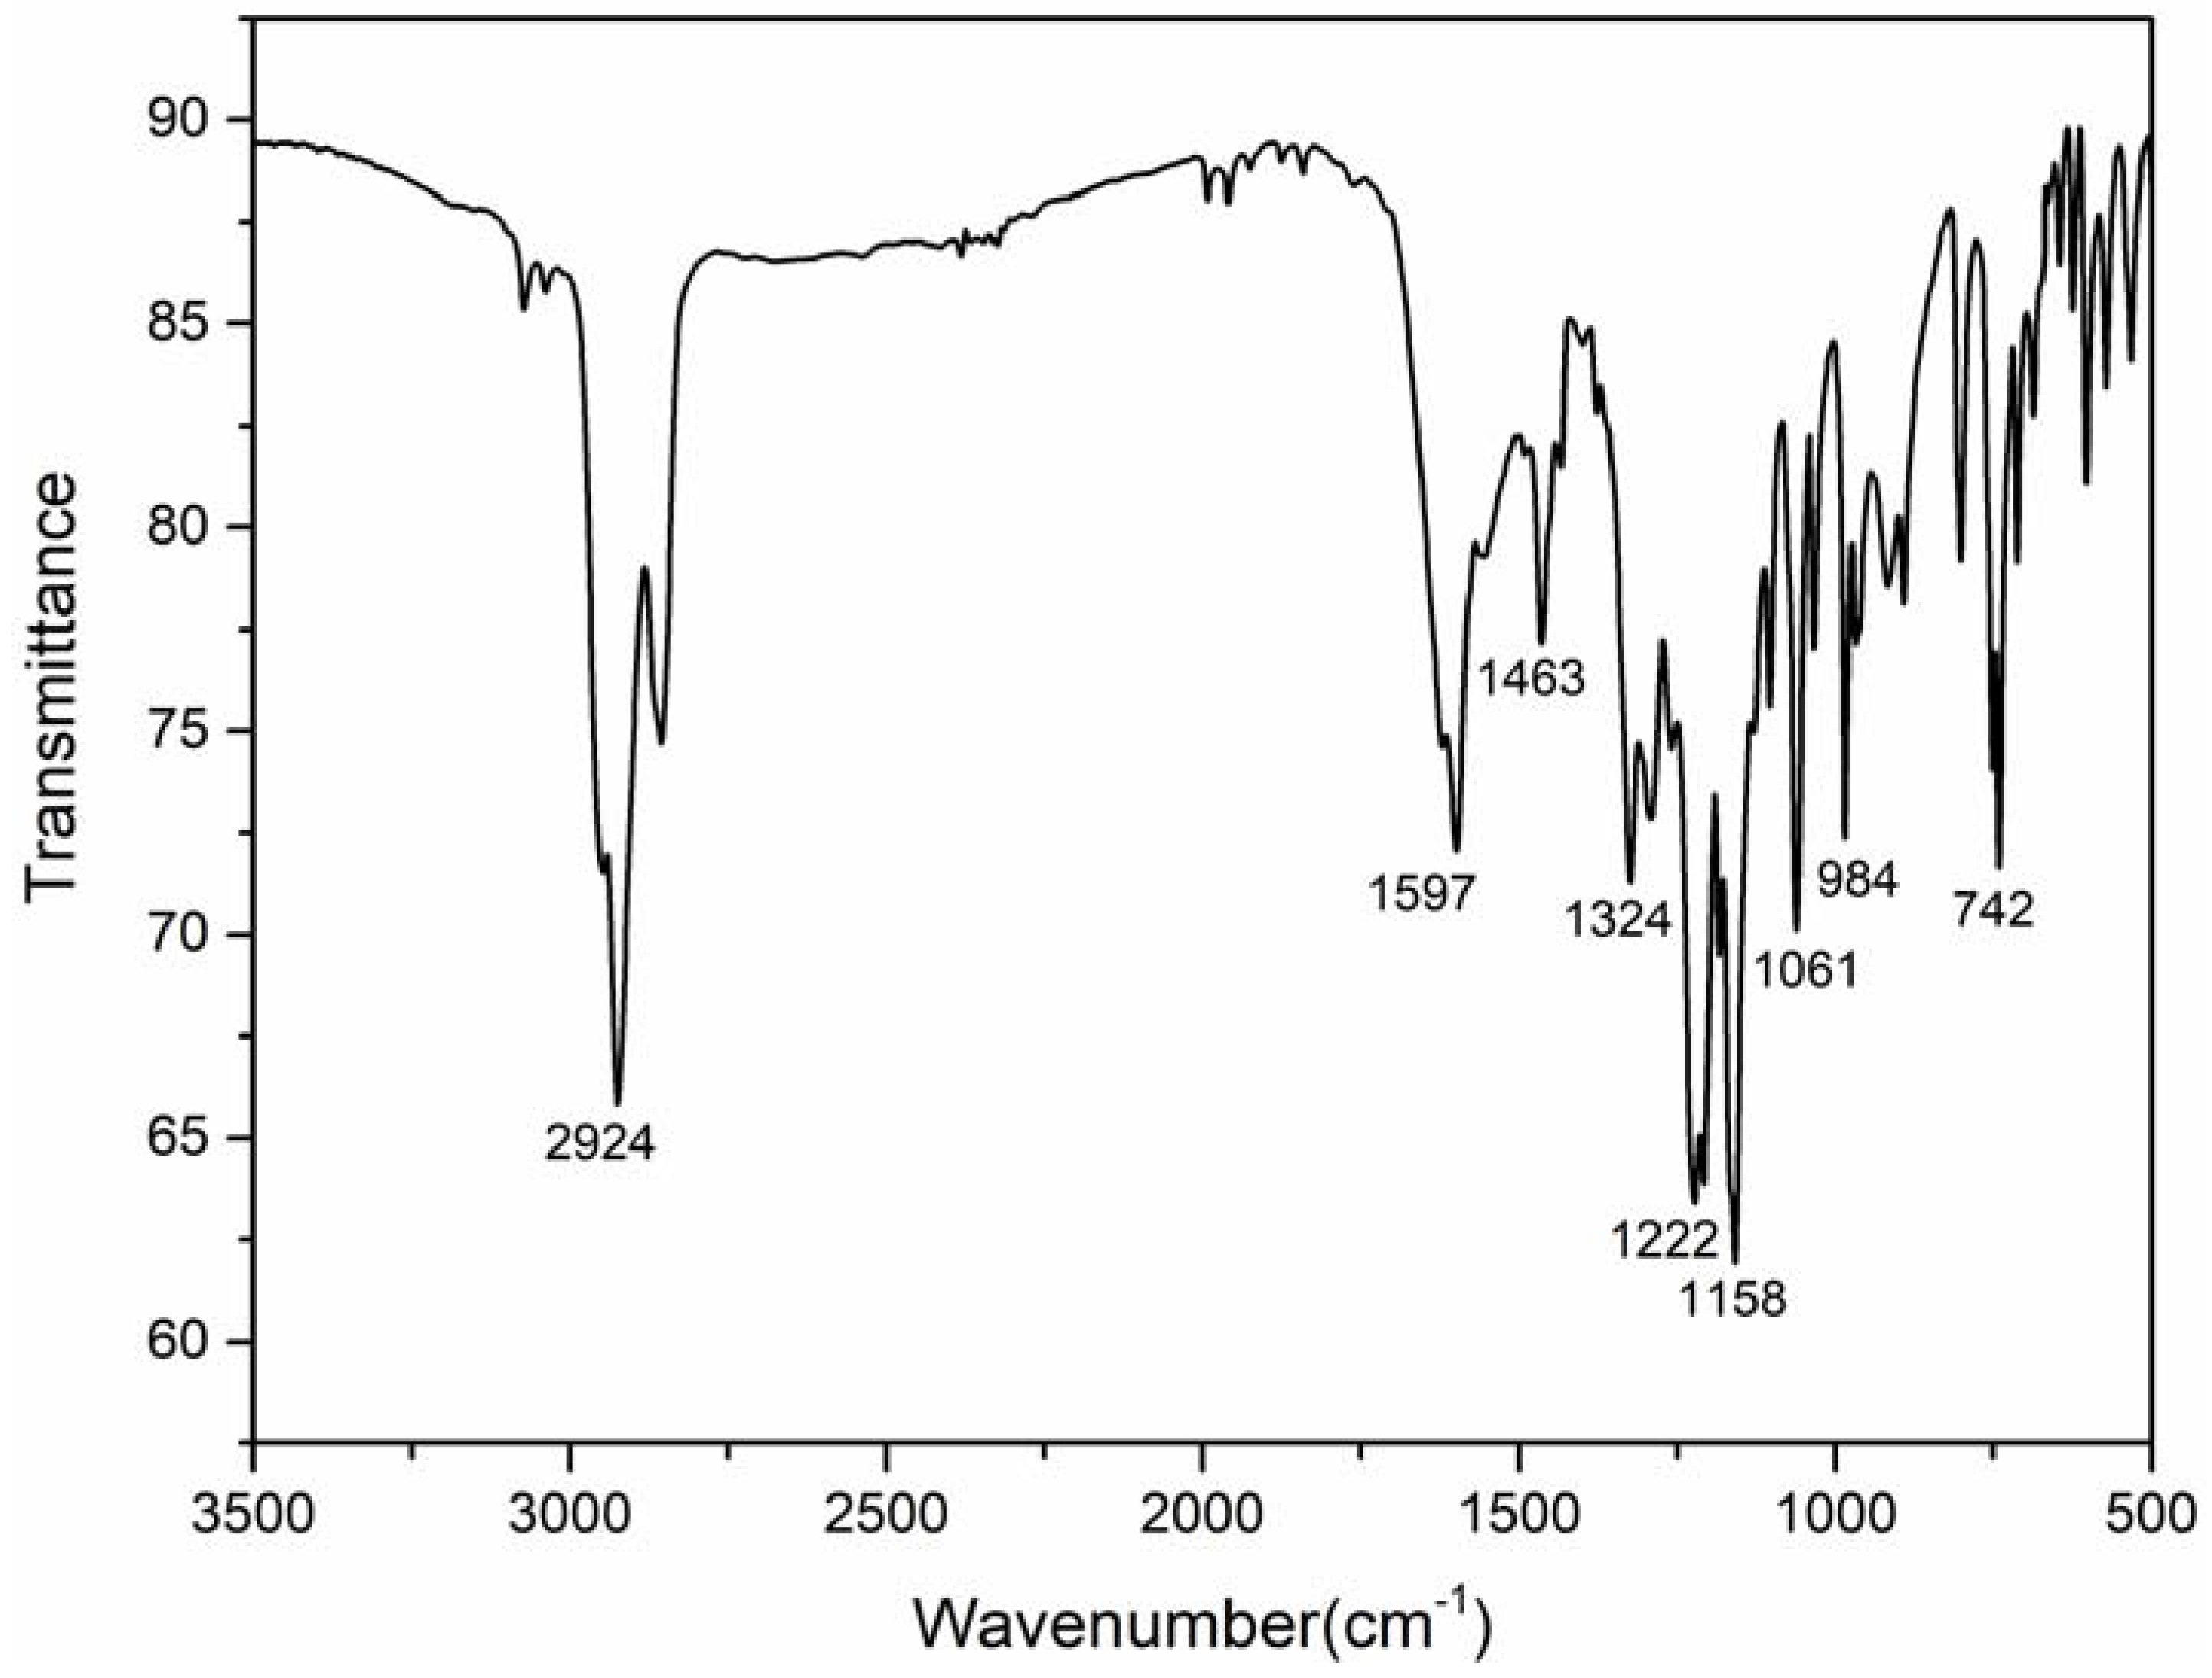
PFP: Yellow solid. Yield: 79%. m.p. 57.4–57.9 °C. 1H NMR (400 MHz, CDCl3) δ 16.18 (s, 1H), 8.01 (d, J = 8.3 Hz, 1H), 7.52 (t, J = 7.5, 1H), 7.38 (t, J = 7.5 Hz, 1H), 7.27 (d, J = 6.1 Hz, 1H), 3.49 (s, 1H), 2.90 (dd, J = 8.7, 5.4 Hz, 2H), 2.84–2.78 (m, 2H). IR (KBr) νmax: 2924 cm−1 (s, νO–H), 1597 cm−1 (s, νC=O), 1324 cm−1 (s), 1222cm−1 (s), 1158 cm−1 (s, νC–F), 742 cm−1 (m, νCF3).
2.2. Syntheses of Complexes 1–6
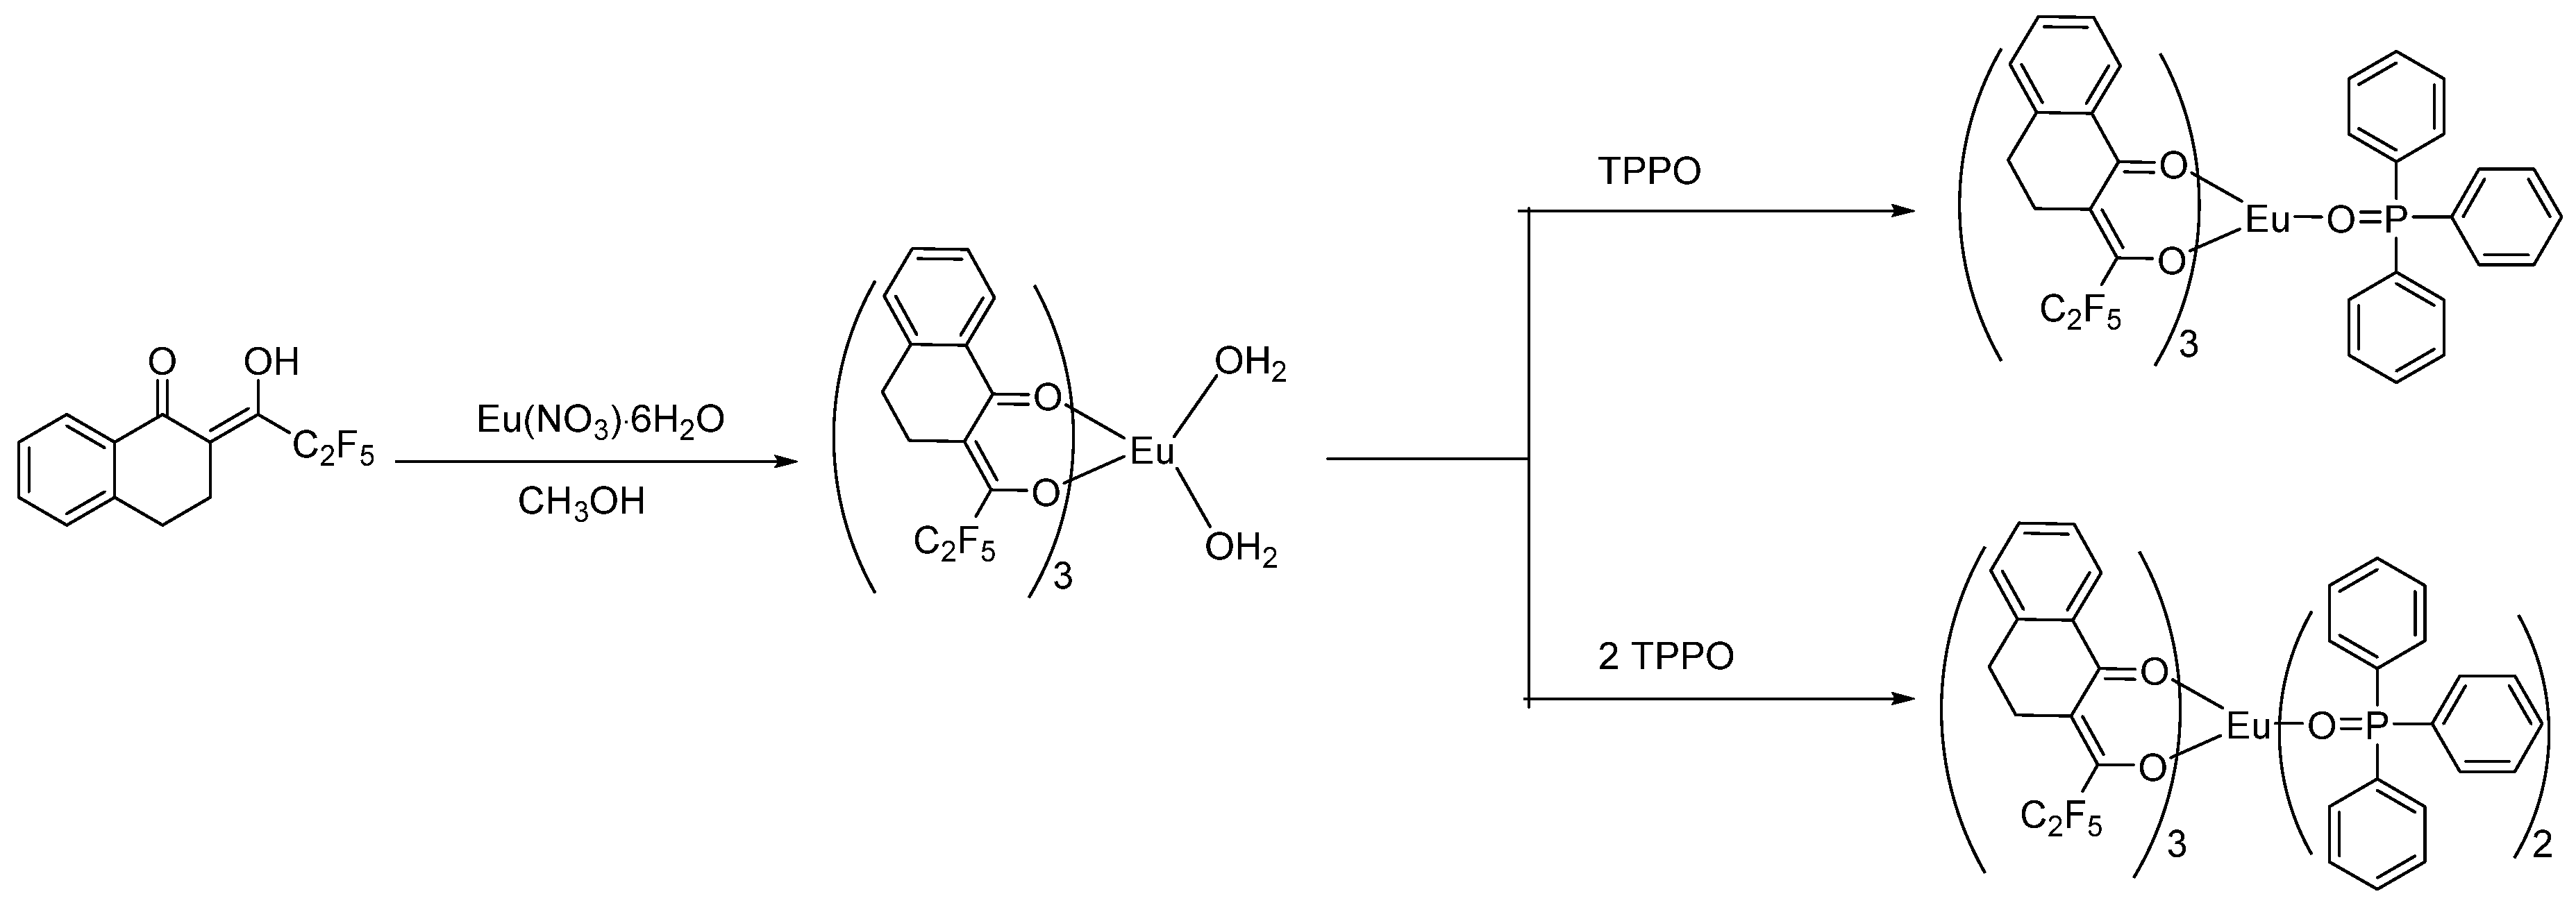
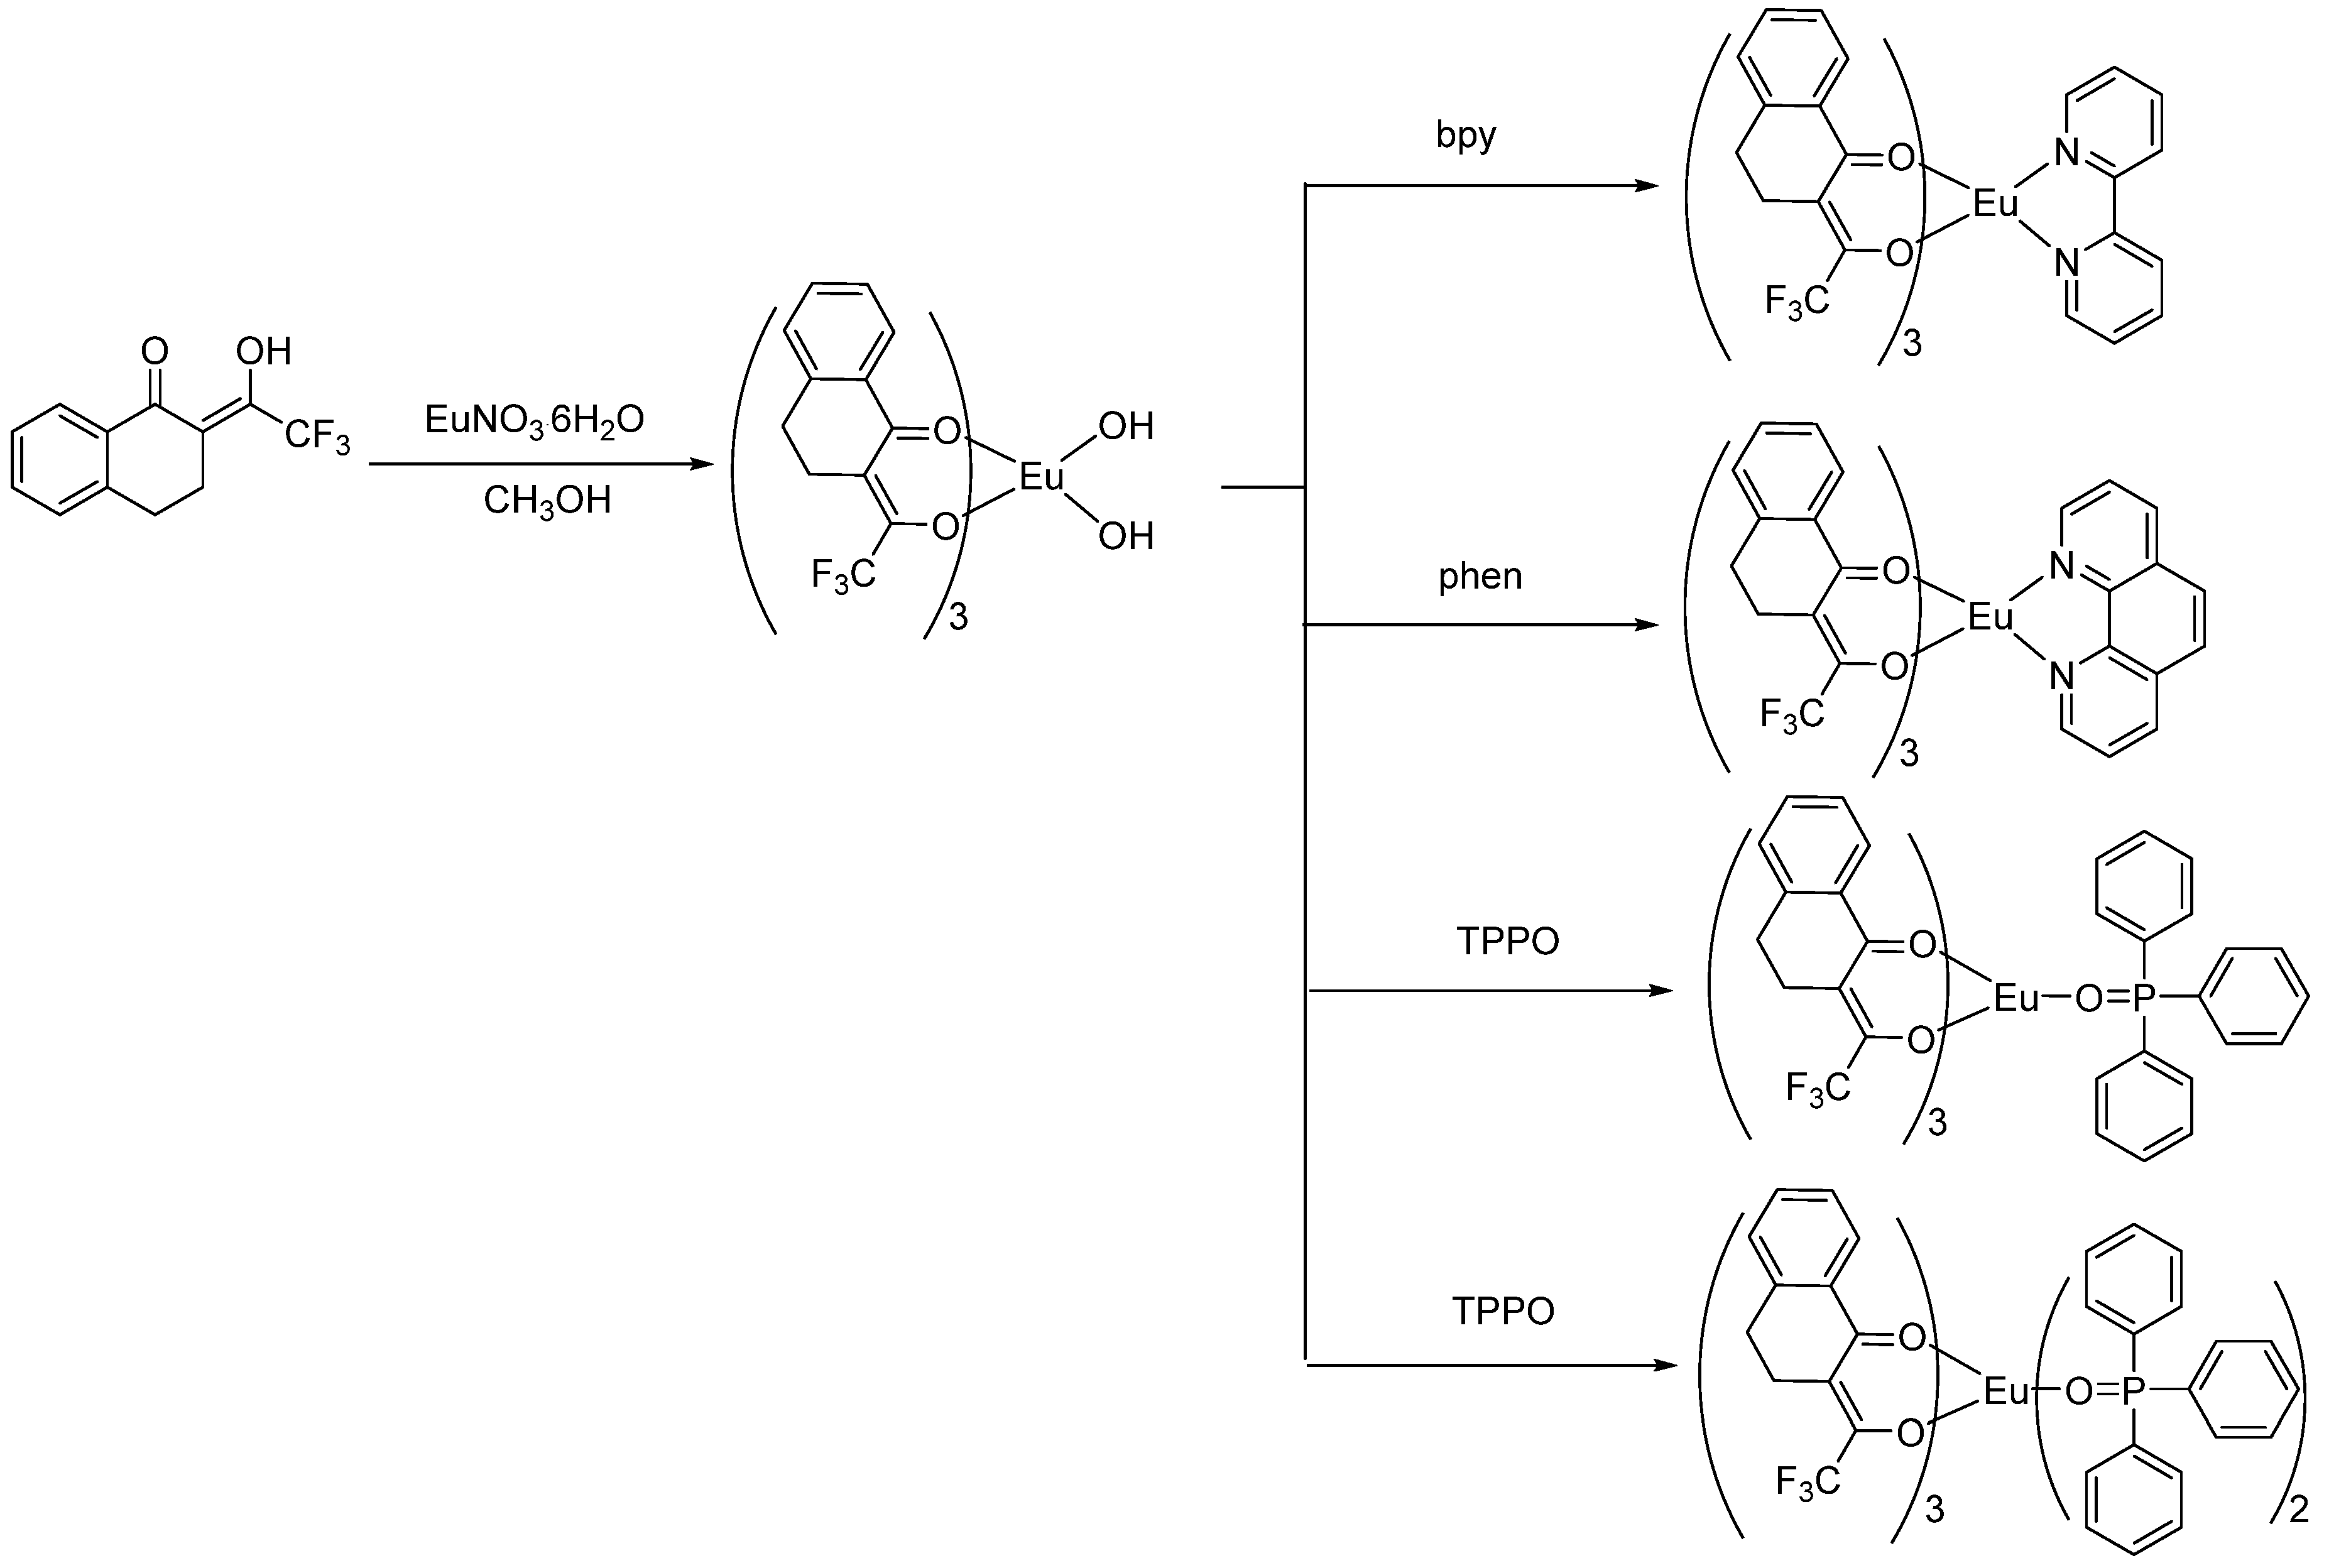
Mixed TFT (PFP) (4.12 mmol) and NaOH (4.12 mmol) in CH3OH (20 mL) was stirred for 0.5 h. Another methanol solution of EuCl3·6H2O (1.38 mmol) was added dropwise under stirring. Then, the substances 1,10-o-Phenanthroline (Phen) or 2,2-Bispyridine (Bpy), phosphine oxide (TPPO), and TPPO (2.76 mmol) (1.38 mmol) were added and stirred for 12 h at 25 °C (Scheme 2 and Scheme 3). The products were obtained by reduced pressure distillation and washed with hexane, then recrystallized with the dichloromethane-hexane (Scheme 2, Scheme 3 and Scheme 4).
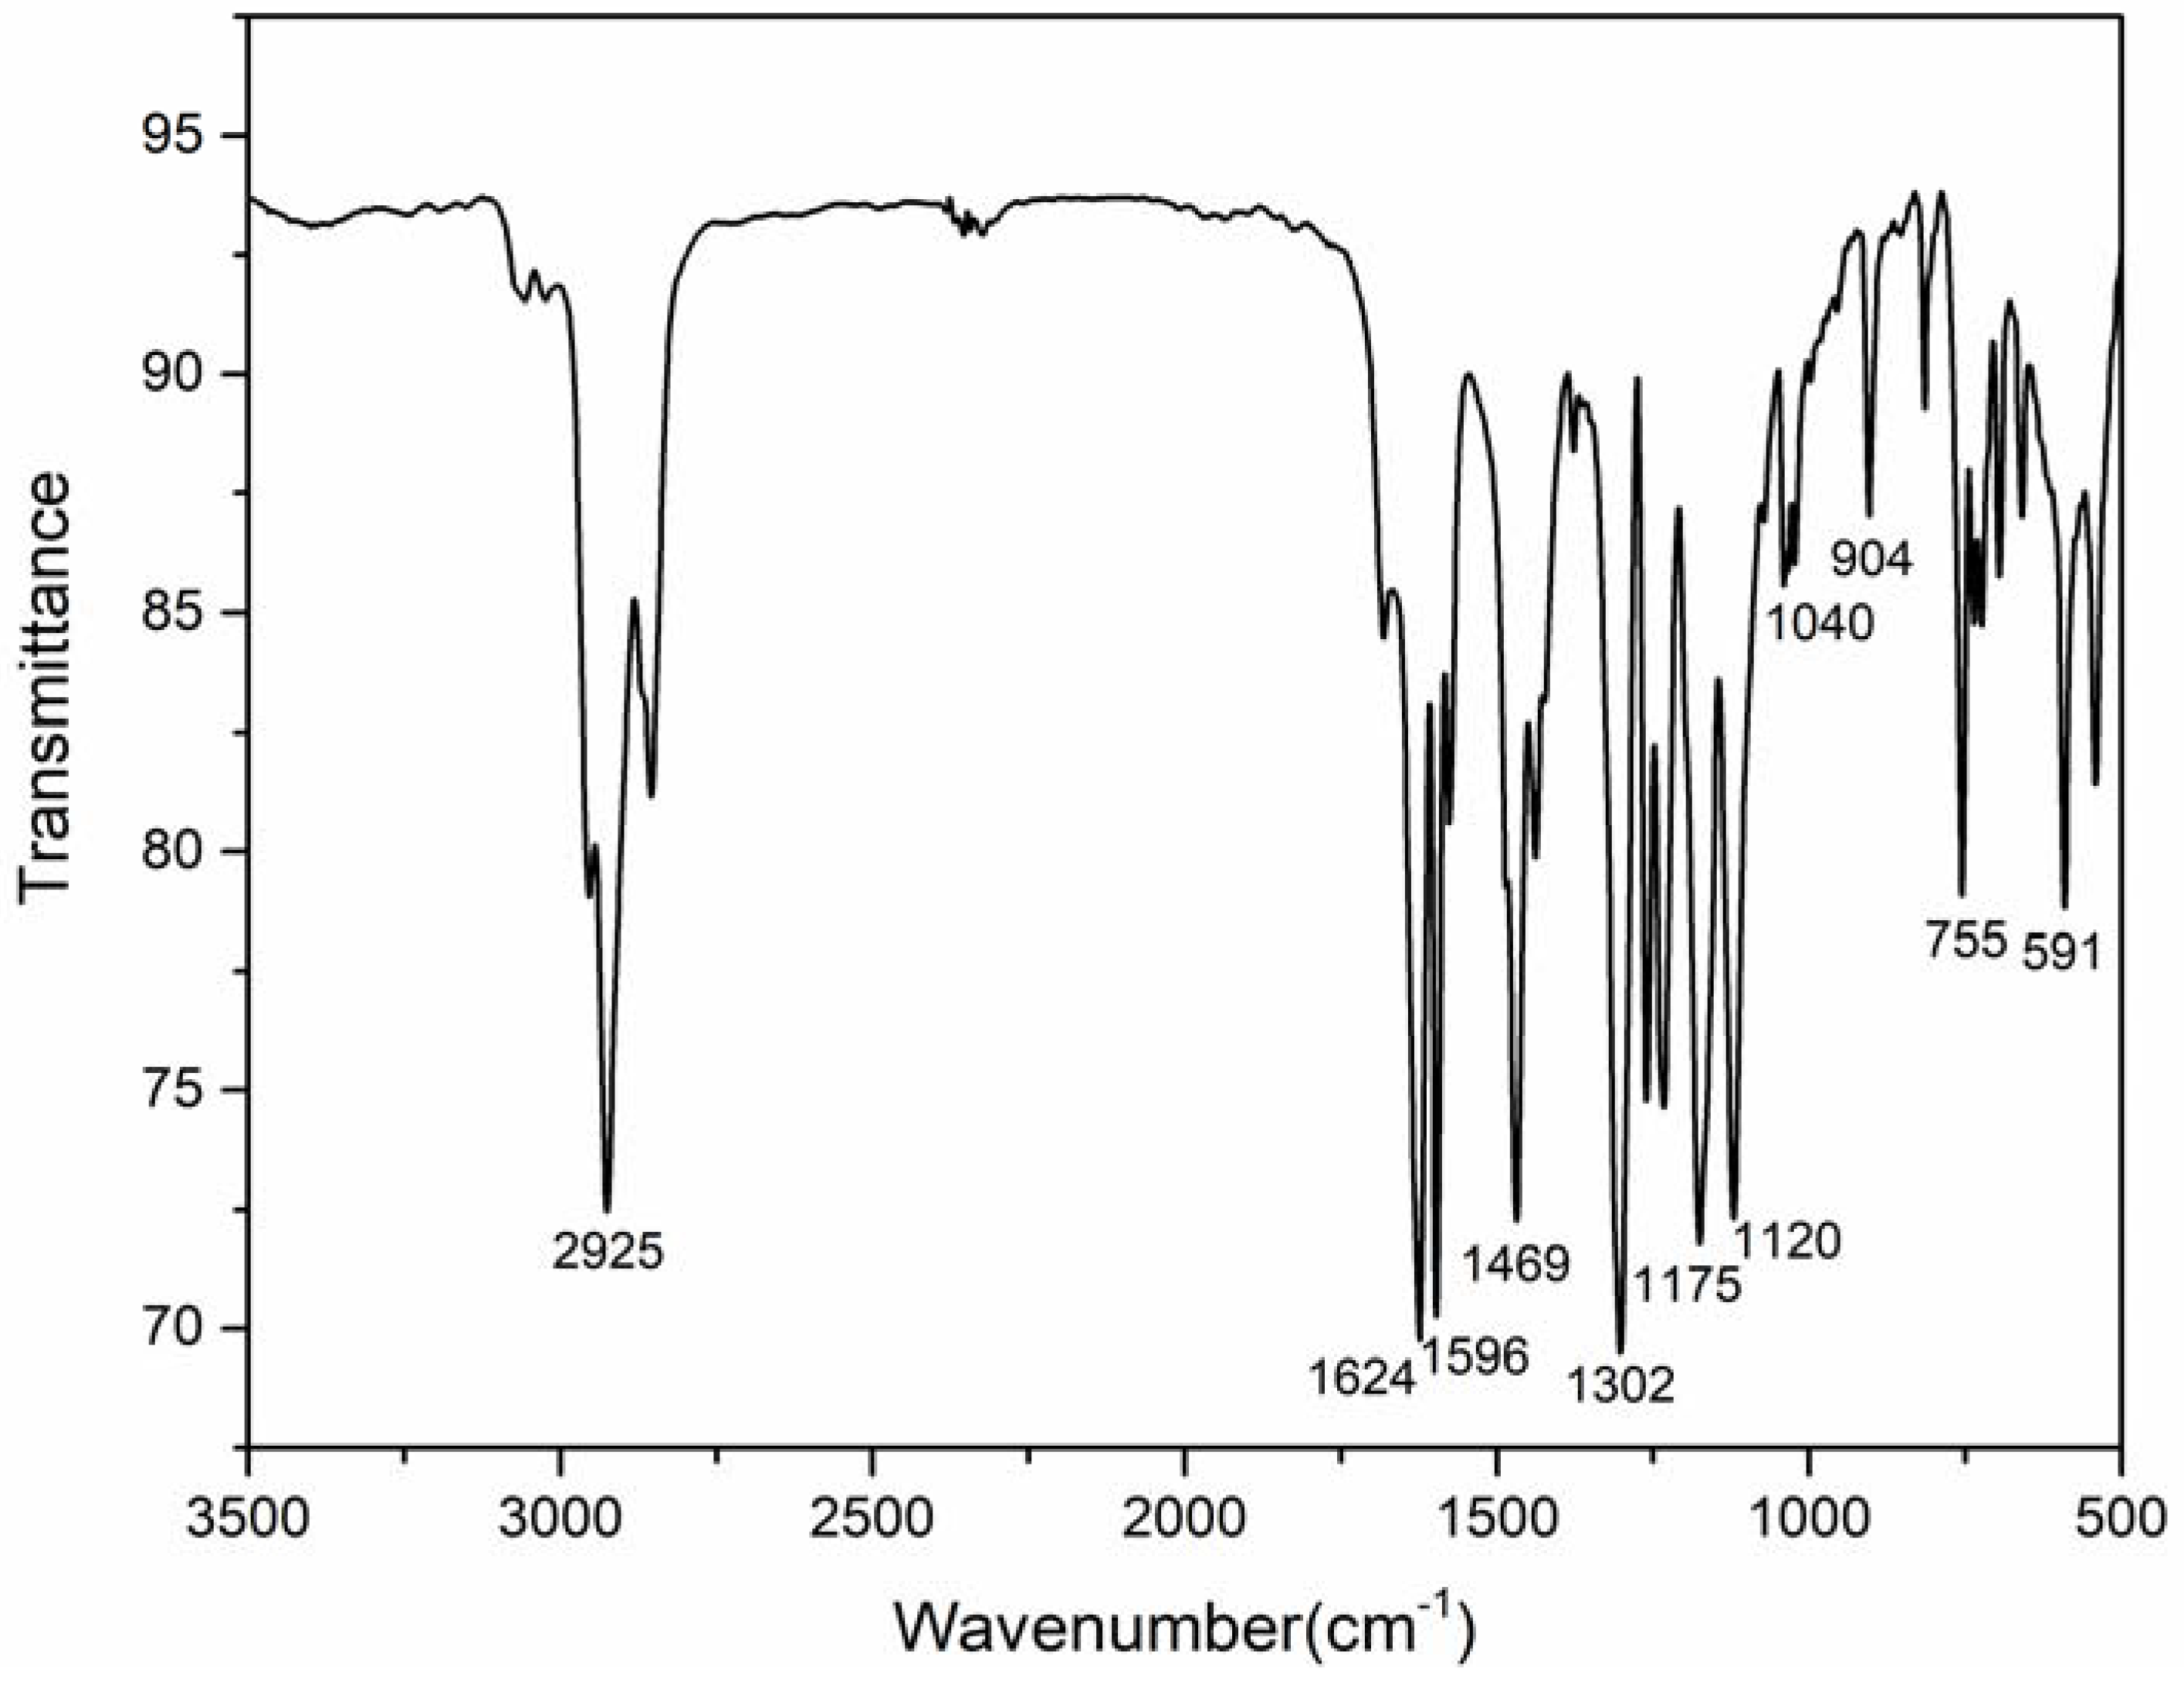
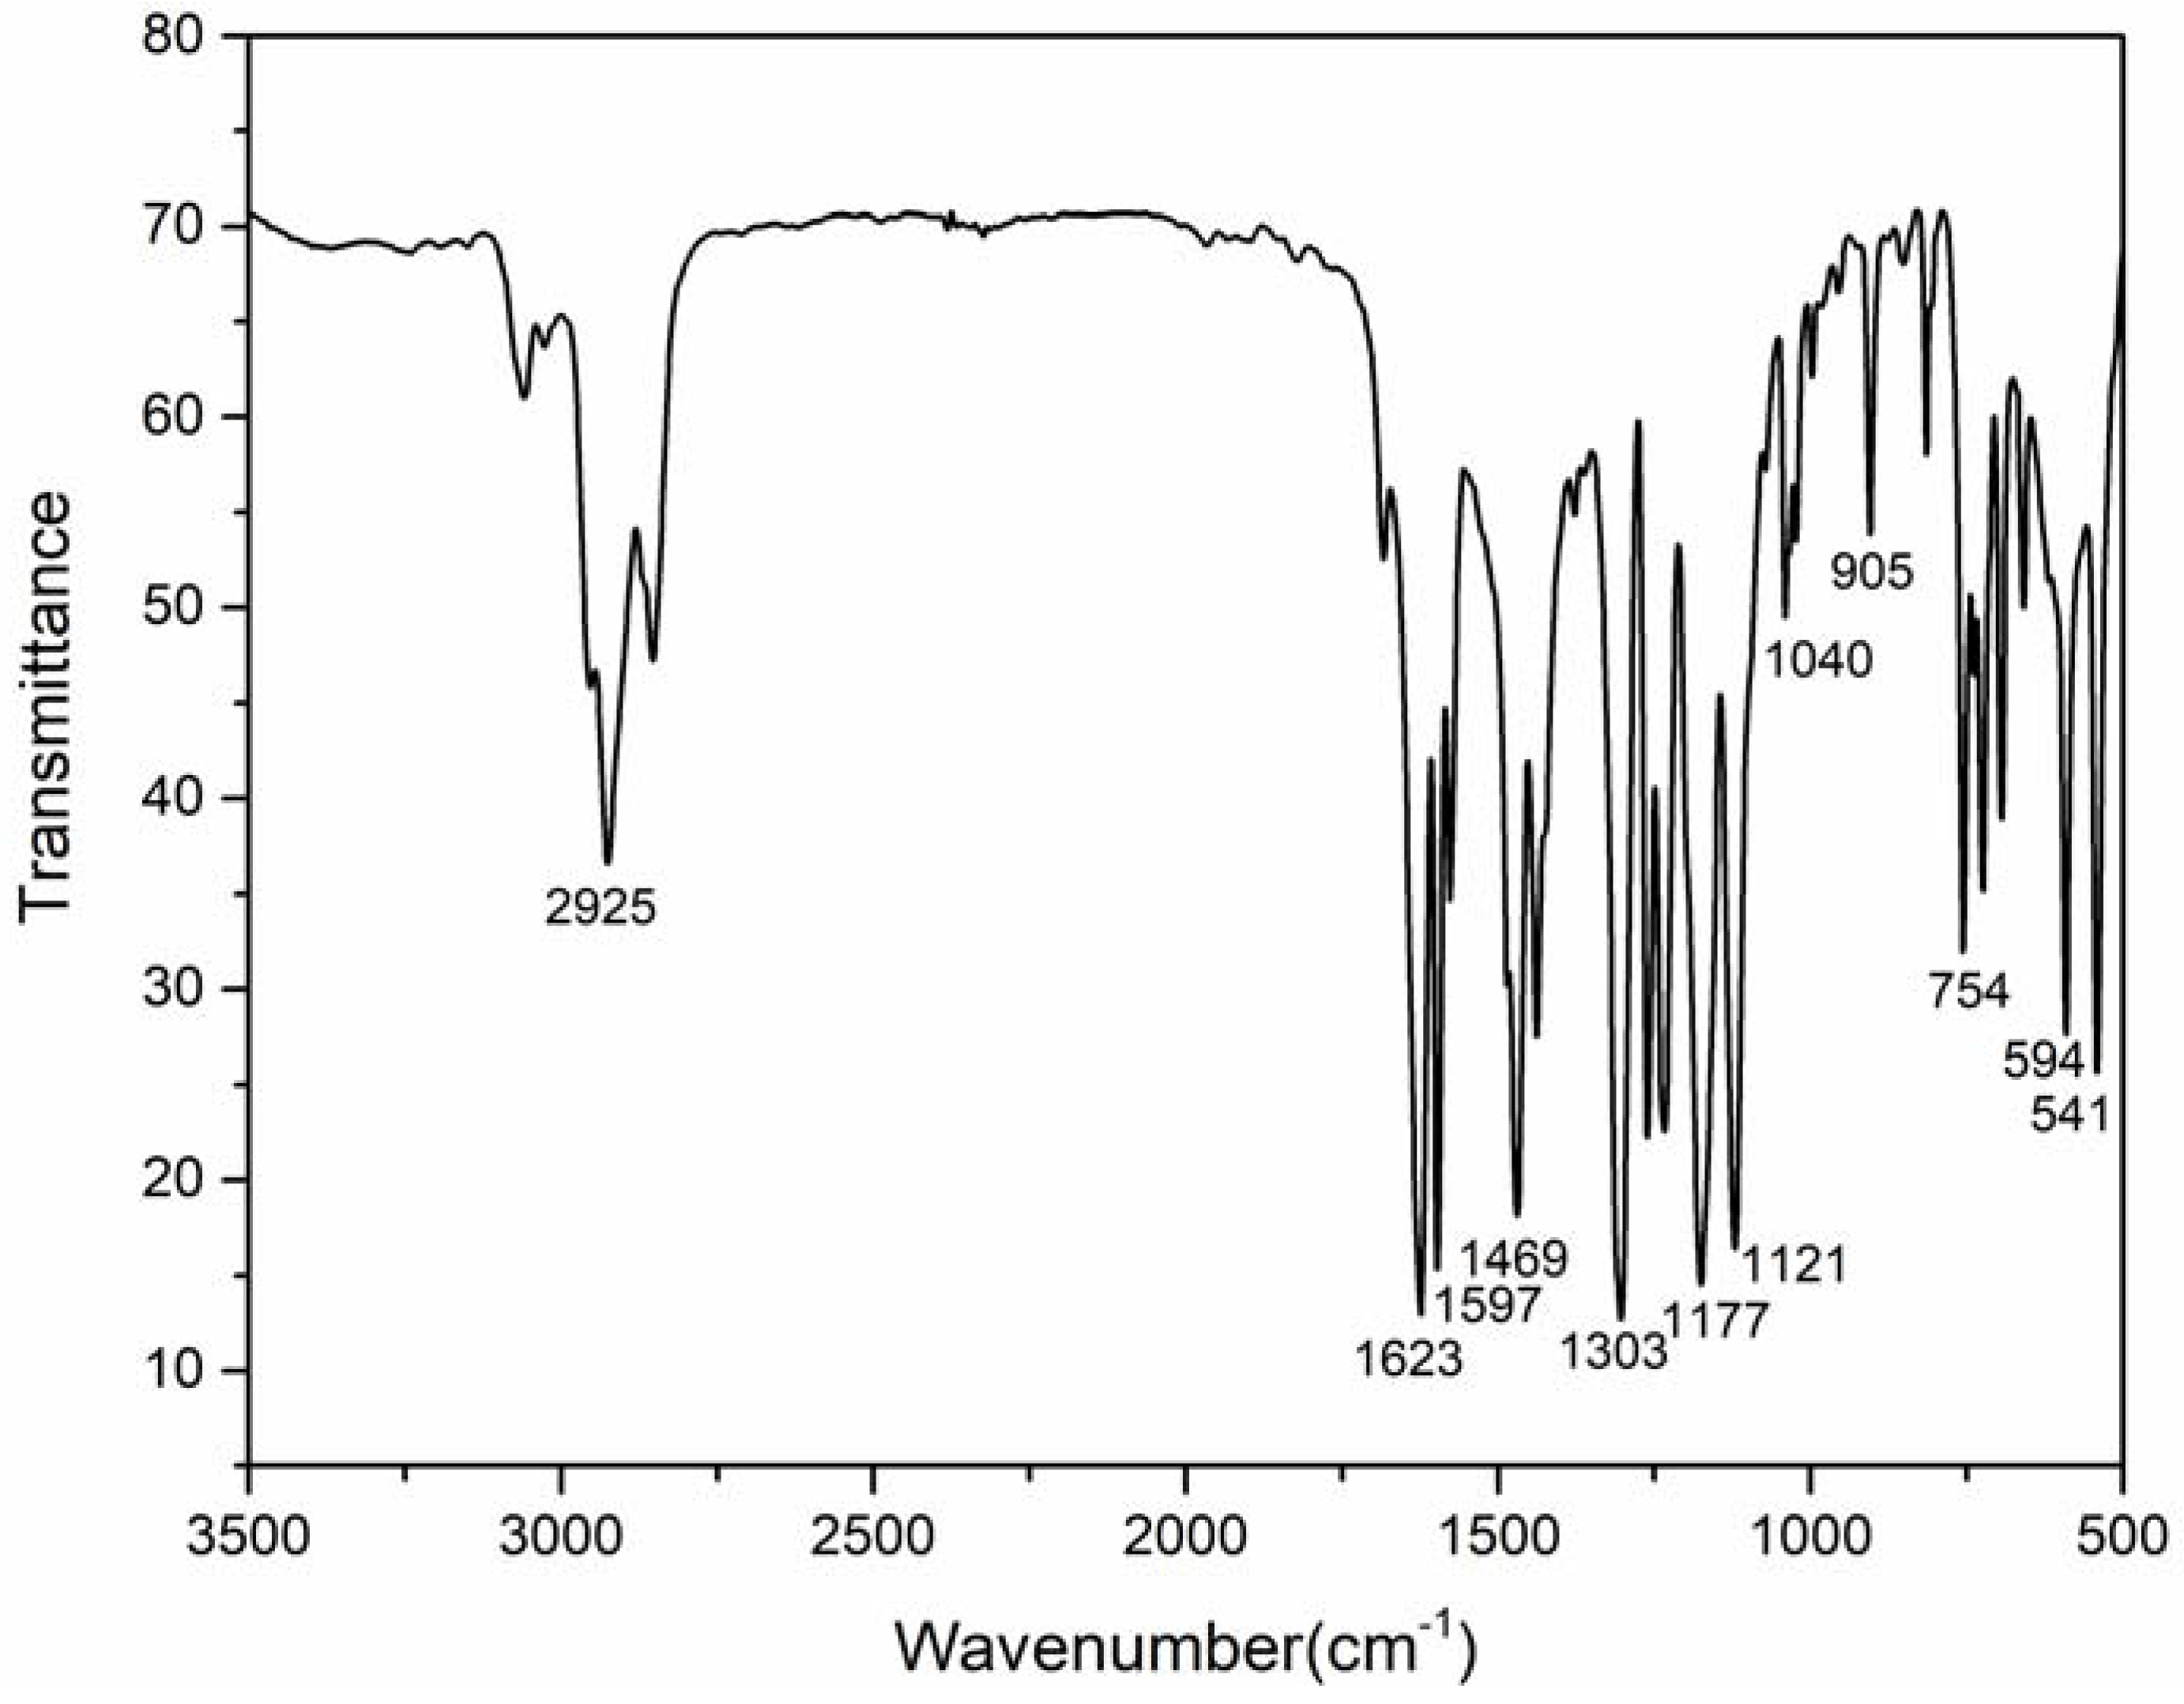
Eu(TFT)3(bpy)(1): Yield: 82% Anal. (%) Calcd for C46H32EuN2O6F9 (Mr = 1031): C 53.54, H 3.10; Found: C 53.43, H 3.12. IR data (KBr pellet, cm−1): 1596 cm−1 (s, νC=O), 1302 cm−1 (s), 1231 cm−1 (s), 1123 cm−1 (s, νC–F), 754 cm−1 (m, νCF3).
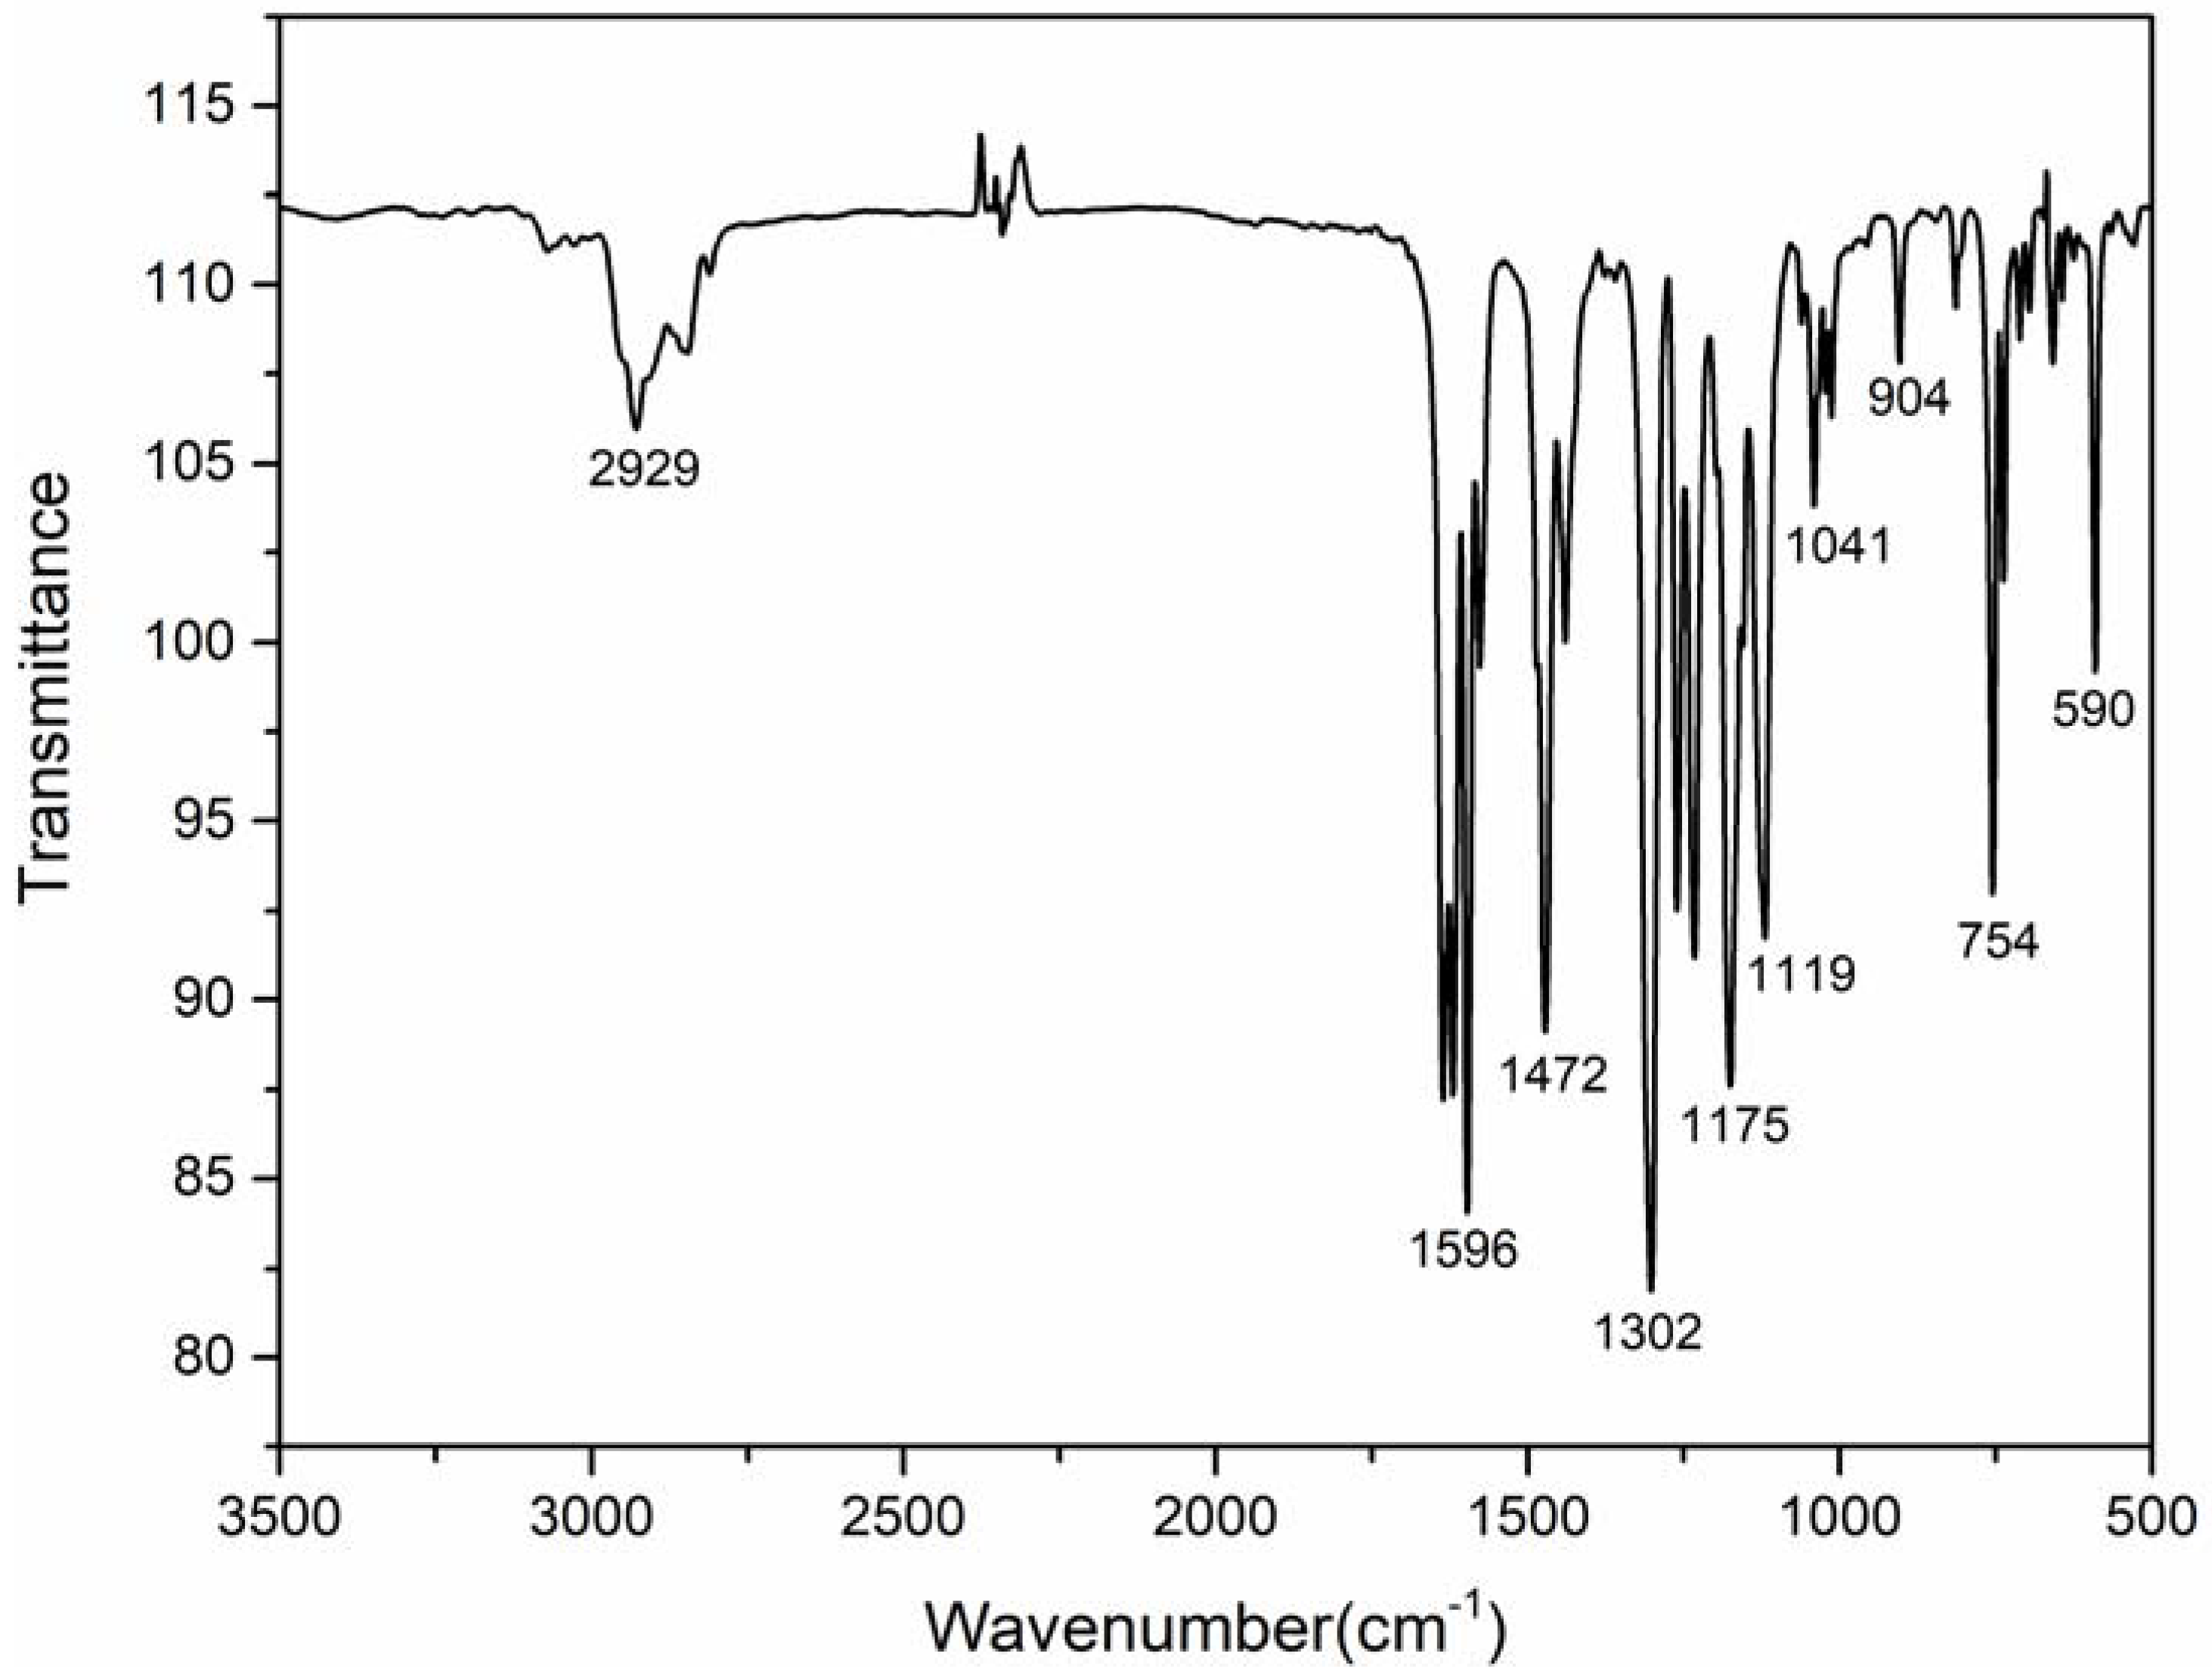
Eu(TFT)3(phen)(2): Yield: 87% Anal. (%) Calcd for C48H32EuN2O6F9 (Mr = 1055): C 54.60, H 3.05; Found: C 54.62, H 3.08. IR data (KBr pellet, cm−1): 1596 cm−1 (s, νC=O), 1303 cm−1 (s), 1233 cm−1 (s), 1126 cm−1 (s, νC–F), 755 cm−1 (m, νCF3).
Eu(TFT)3(TPPO)(3): Yield: 79% Anal. (%) Calcd for C54H39EuPO7F9 (Mr = 1153): C 56.20, H 3.38; Found: C 56.18, H 3.35. IR data (KBr pellet, cm−1): 1595 cm−1 (s, νC=O), 1302 cm−1 (s), 1234 cm−1 (s), 1120 cm−1 (s, νC–F), 755 cm−1 (m, νCF3).
Eu(TFT)3(TPPO)2(4): Yield: 82% Anal. (%) Calcd for C72H54EuP2O8F9 (Mr = 1431): C 60.38, H 3.77; Found: C 60.35, H 3.79. IR data (KBr pellet, cm−1): 1597 cm−1 (s, νC=O), 1303 cm−1 (s), 1232 cm−1 (s), 1121 cm−1 (s, νC–F), 754 cm−1 (m, νCF3).
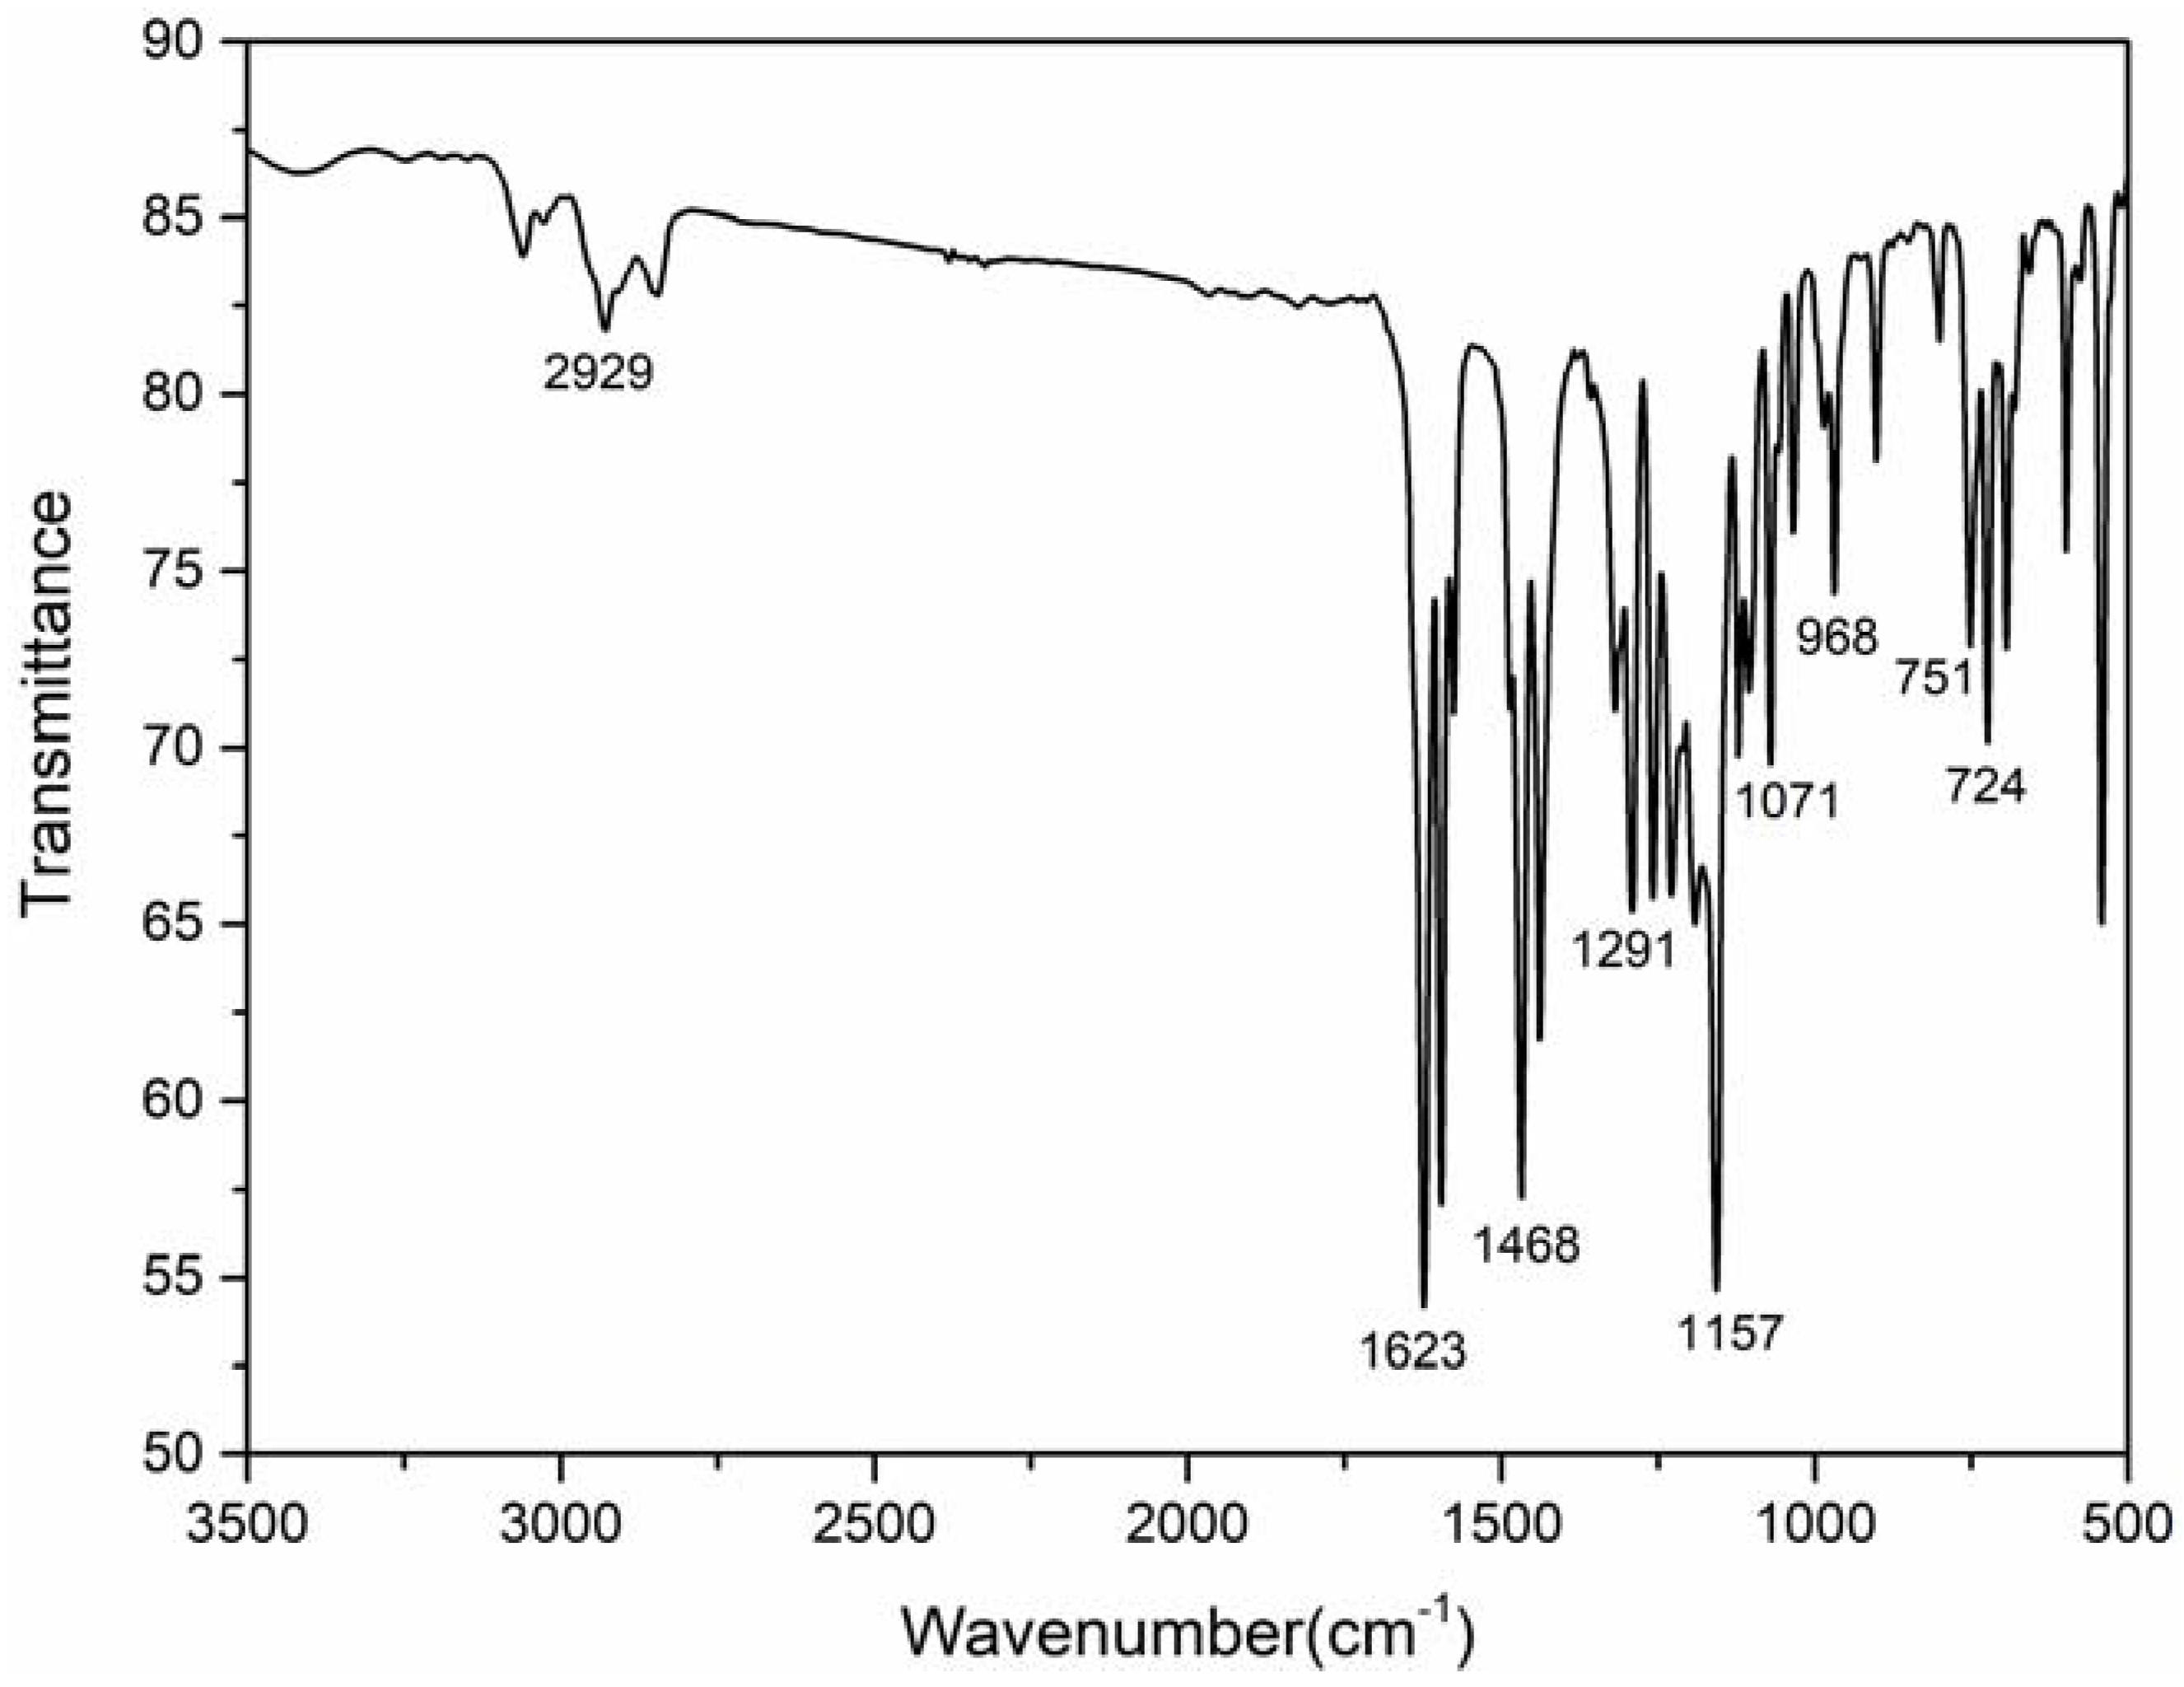
Eu(PFP)3(TPPO)(5): Yield: 82% Anal. (%) Calcd for C57H39EuPO7F15 (Mr = 1272): C 53.77, H 3.07; Found: C 53.74, H 3.12. IR data (KBr pellet, cm−1): 1595 cm−1 (s, νC=O), 1291 cm−1 (s), 1221 cm−1 (s), 1124 cm−1 (s, νC–F), 752 cm−1 (m, νCF3).
Eu(PFP)3(TPPO)2(6): Yield: 83% Anal. (%) Calcd for C75H54EuP2O8F15 (Mr = 1581): C 56.93, H 3.42; Found: C 56.89, H 3.37. IR data (KBr pellet, cm−1): 1597 cm−1(s, νC=O), 1291 cm−1 (s), 1227 cm−1 (s), 1122 cm−1 (s, νC–F), 751 cm−1 (m, νCF3).
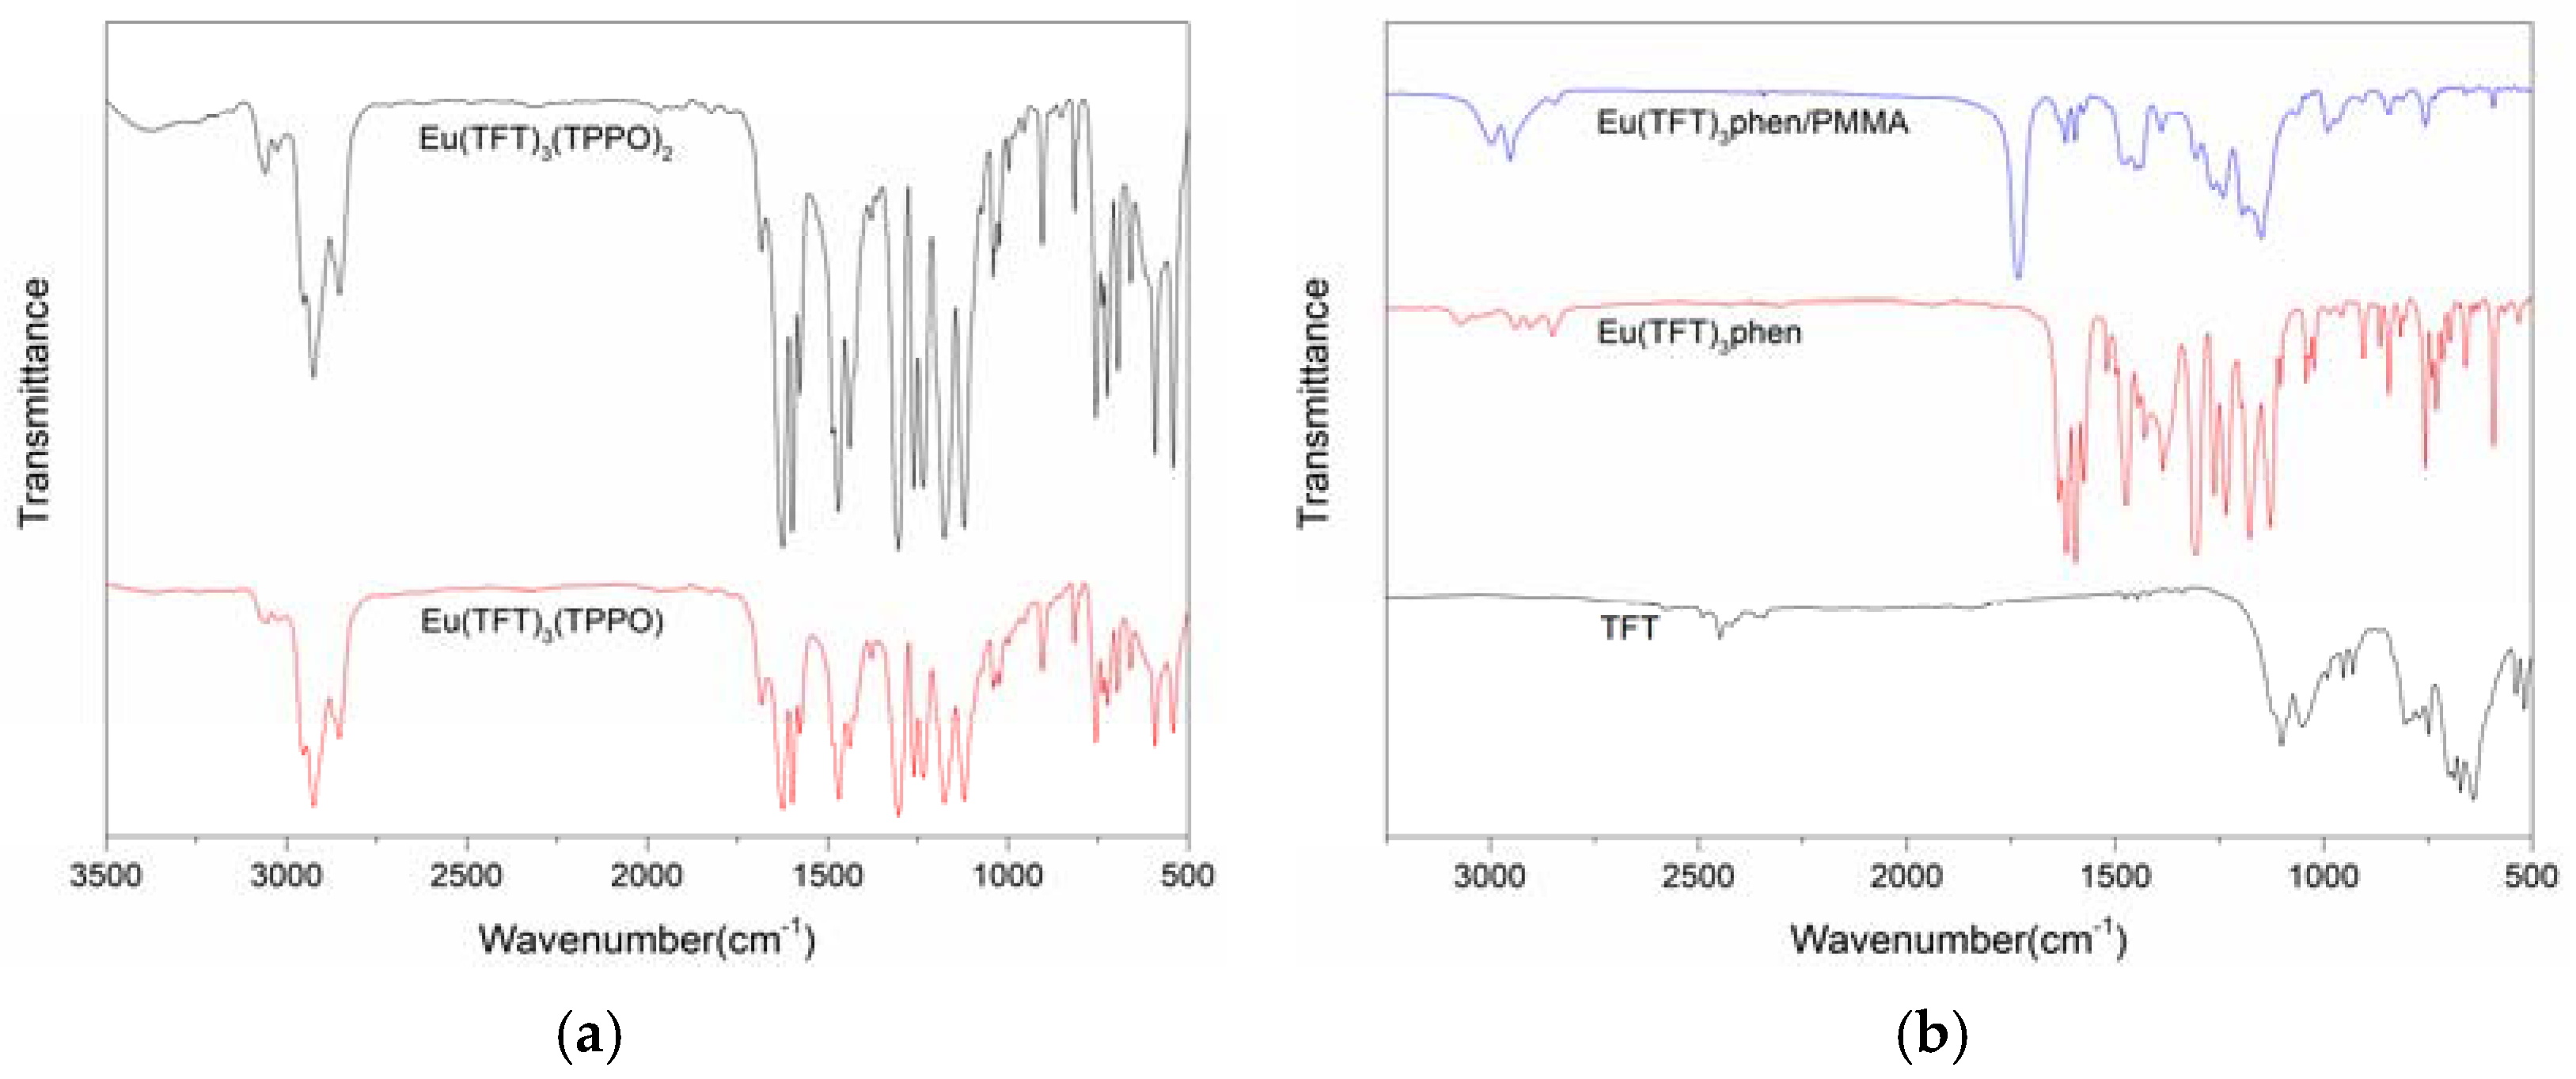
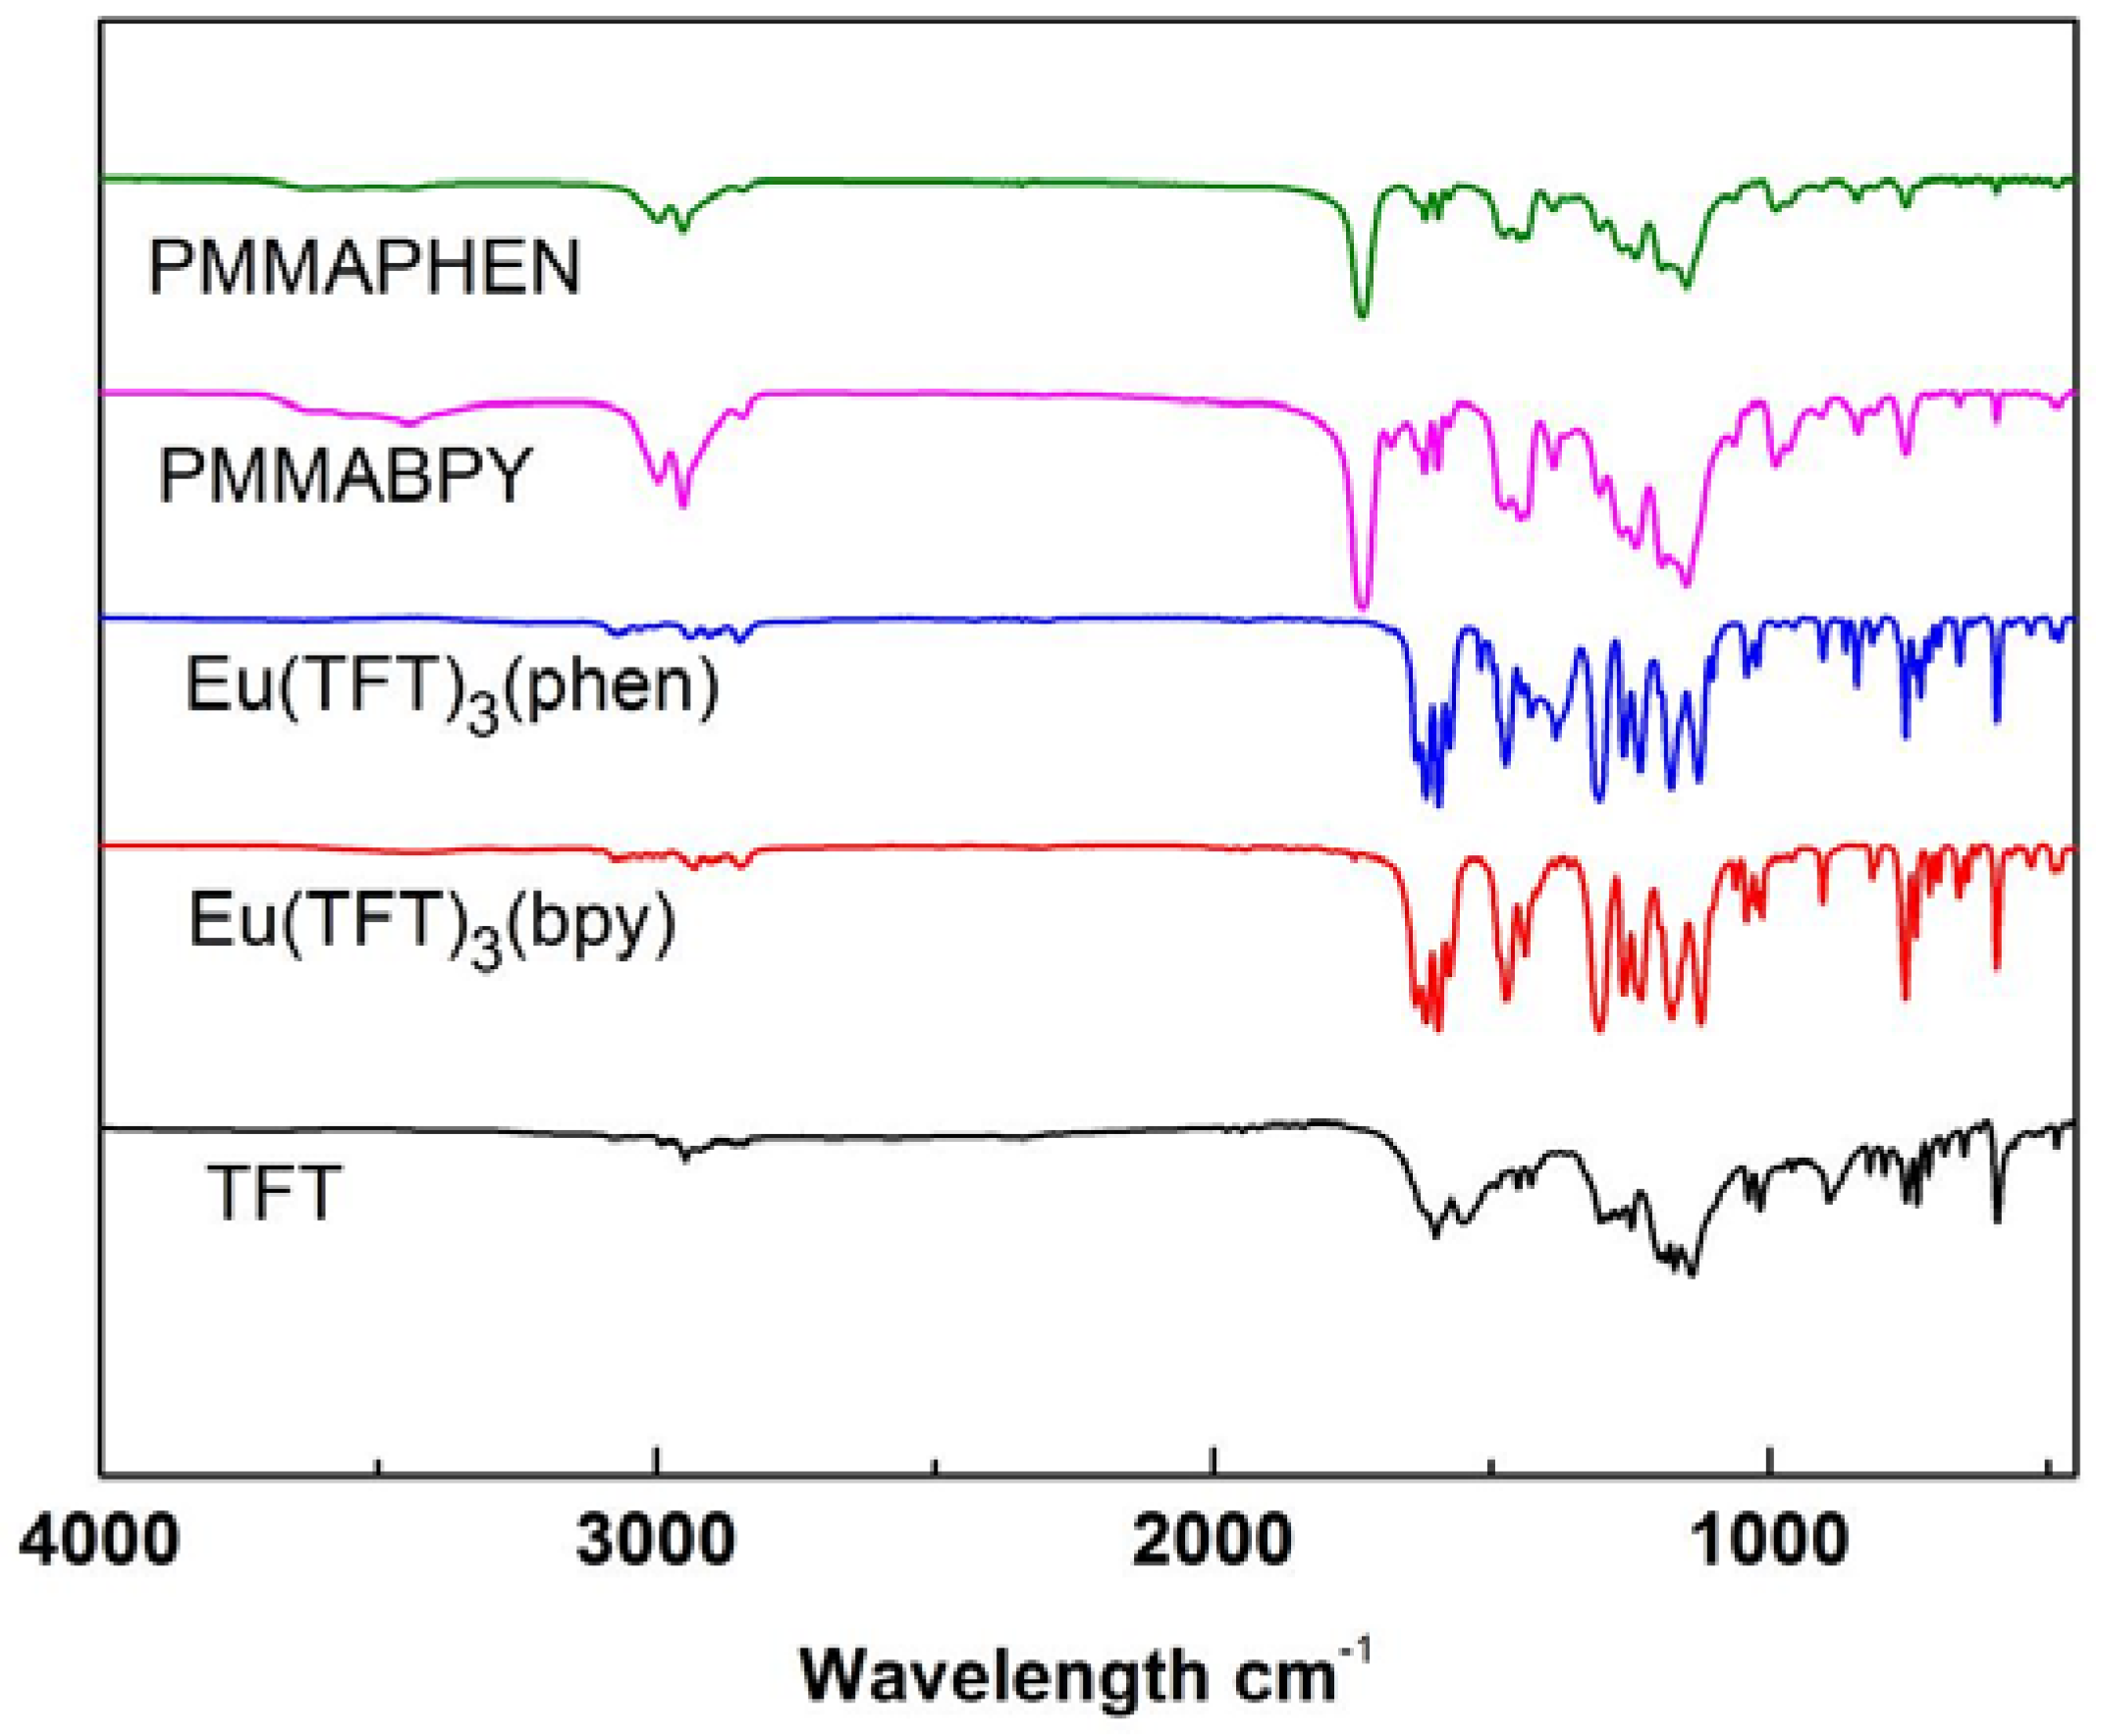
The FTIR spectra of TFT, PFP, complexes 1–6 are shown in Appendix B (Figure A3, Figure A4, Figure A5, Figure A6, Figure A7, Figure A8, Figure A9, Figure A10, Figure A11 and Figure A12). FTIR spectra of TFT, complexes 2–4 and Eu(TFT)3(phen)/polymethyl methacrylate (PMMA), which was synthesized in subsequent experiments, are shown in Figure 1 for comparison purposes.
2.3. Molecular Structures of the Complexes 1 and 2
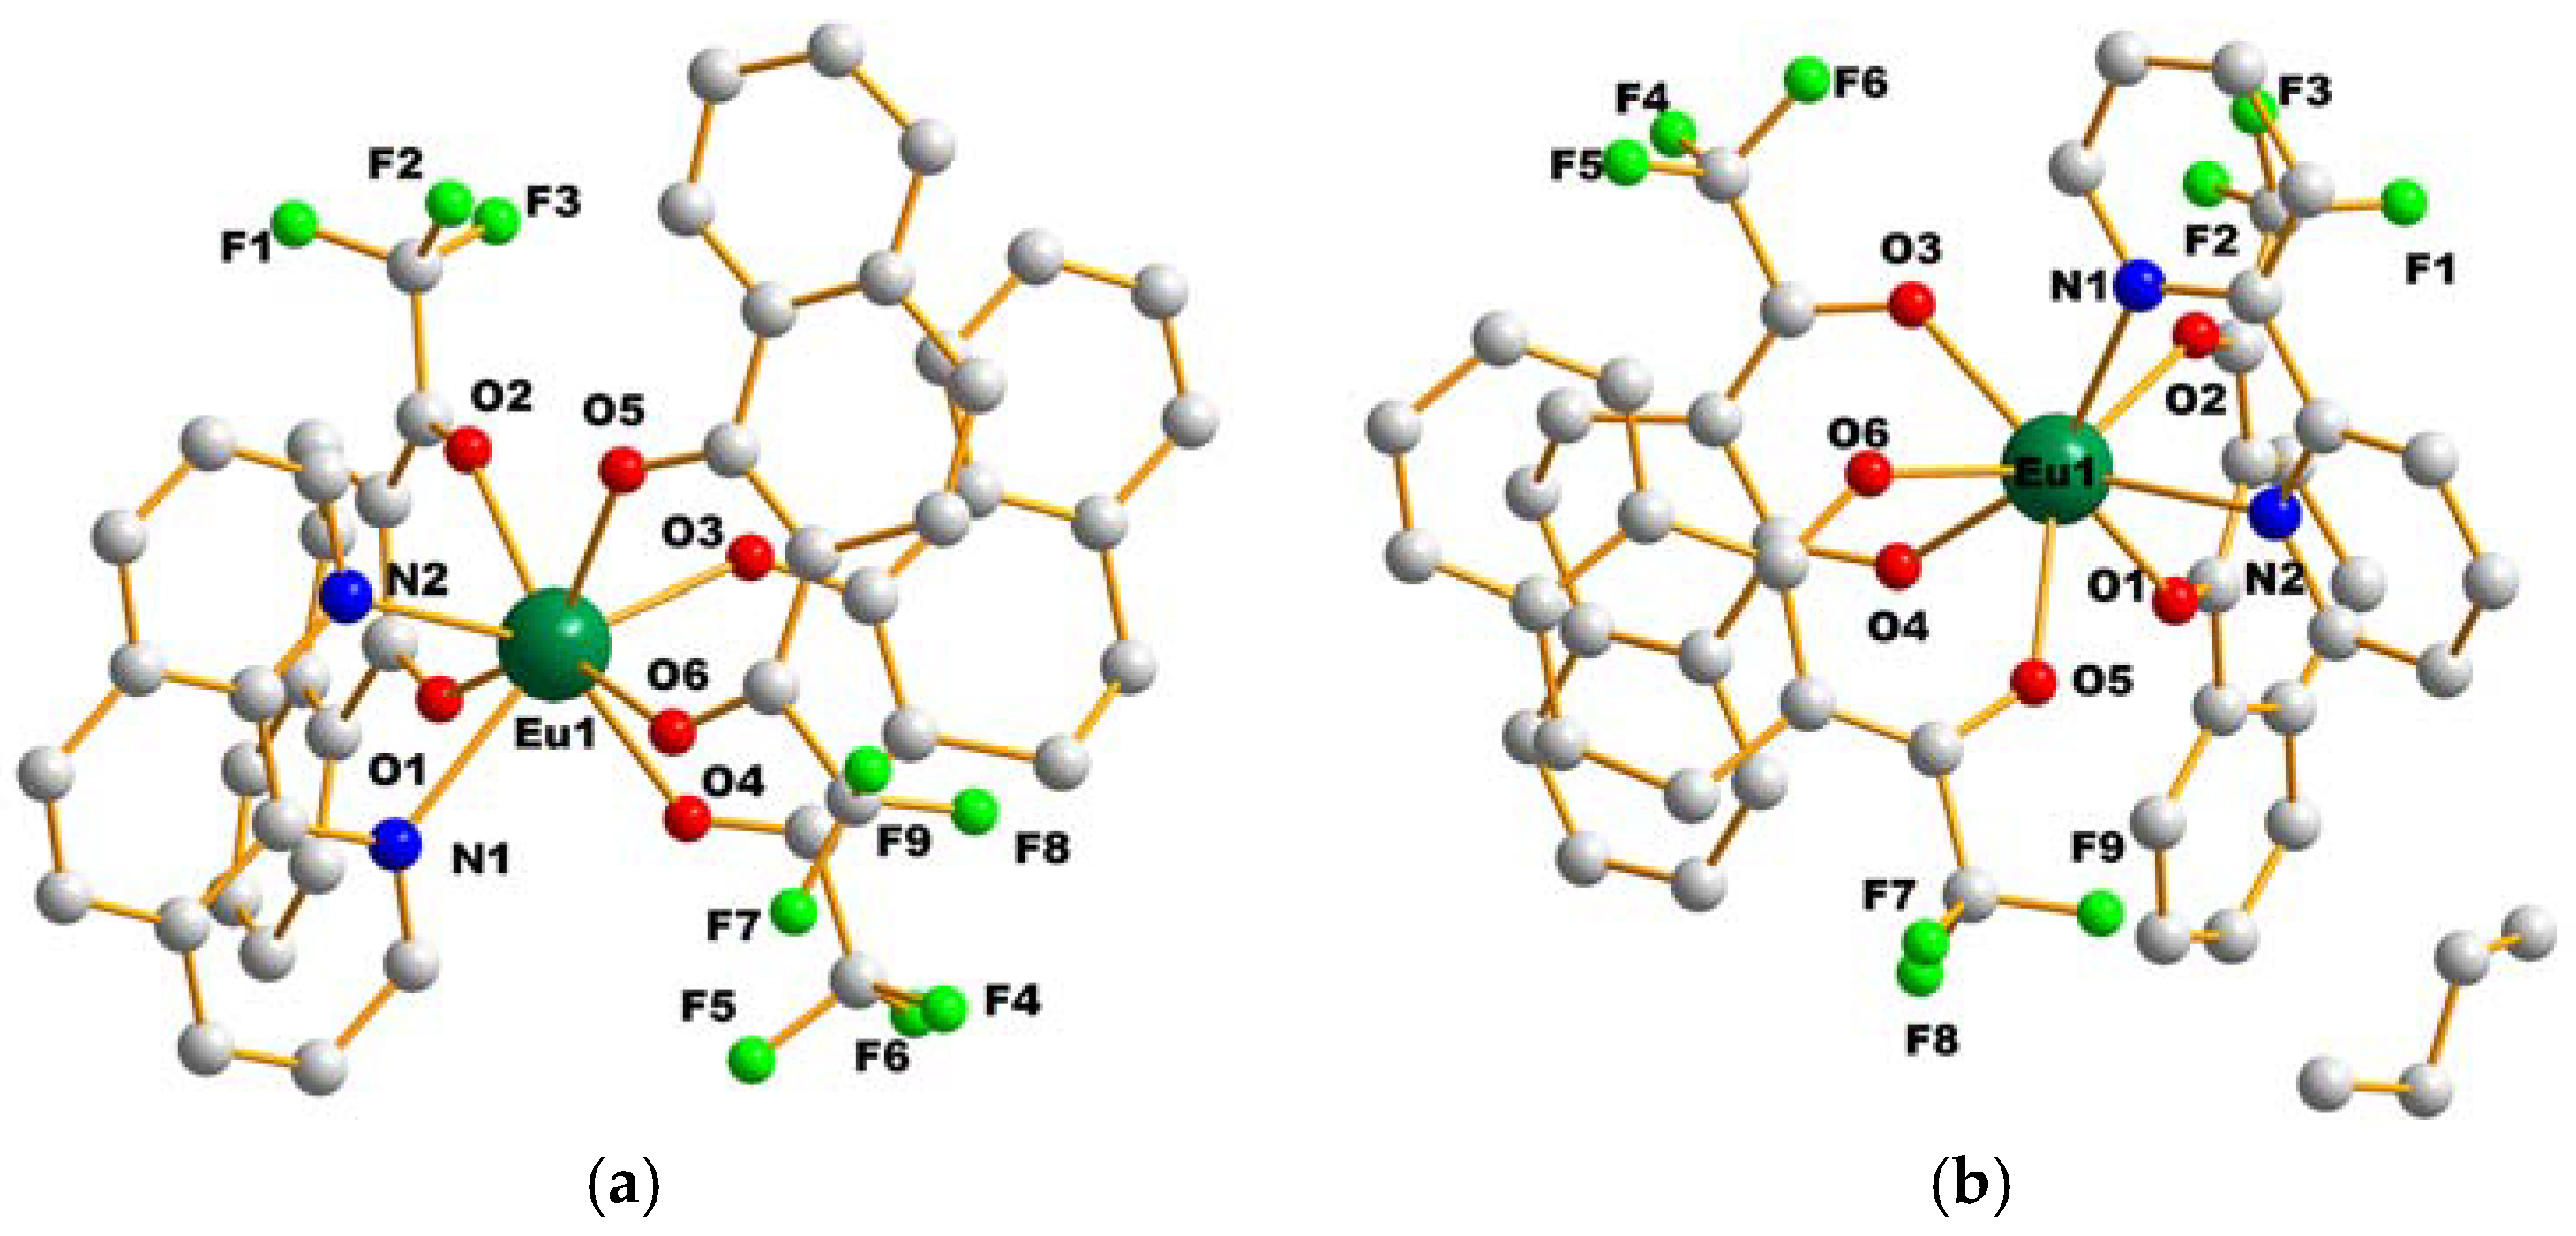
The molecular structures of the complexes 1 and 2 were revealed by single crystal X-ray studies, which crystallize in the monoclinic crystal system with space groups of P21/n and P21/c, respectively. The asymmetric unit of complex 1 is composed of one Eu3+ ion, three deprotonated ligands, and one auxiliary ligand (phen, bpy). Each Eu3+ ion center adopts a distorted hexahedron geometry, coordinated by six O atoms from three carbonyl groups (O1, O3, O5), three hydroxy groups (O2, O4, O6) of three ligands, and two N atoms (N1, N2) from one auxiliary ligand (Figure 2a,b). The average bond lengths of the Eu–O and Eu–N for complex 1 are 2.347 Å and 2.588 Å, respectively. The average bond lengths of the Eu–O and Eu–N for complex 2 are 2.357 Å and 2.583 Å (Appendix D, Table A1 and Table A2), respectively. The average length of the Eu–N bond with the nitrogen atoms from the auxiliary ligand is substantially longer, indicating a weak interaction. In other words, the TFT ligand is more stable when bound to the central metal ion, which is due to the strong interaction between the Eu3+ ion and the oxygen atoms. In comparison with complex 1, complex 2 introduces the solvent n-hexane.
2.4. Morphology of Composite Nanofibers and Dispersion of Eu/PMMA.
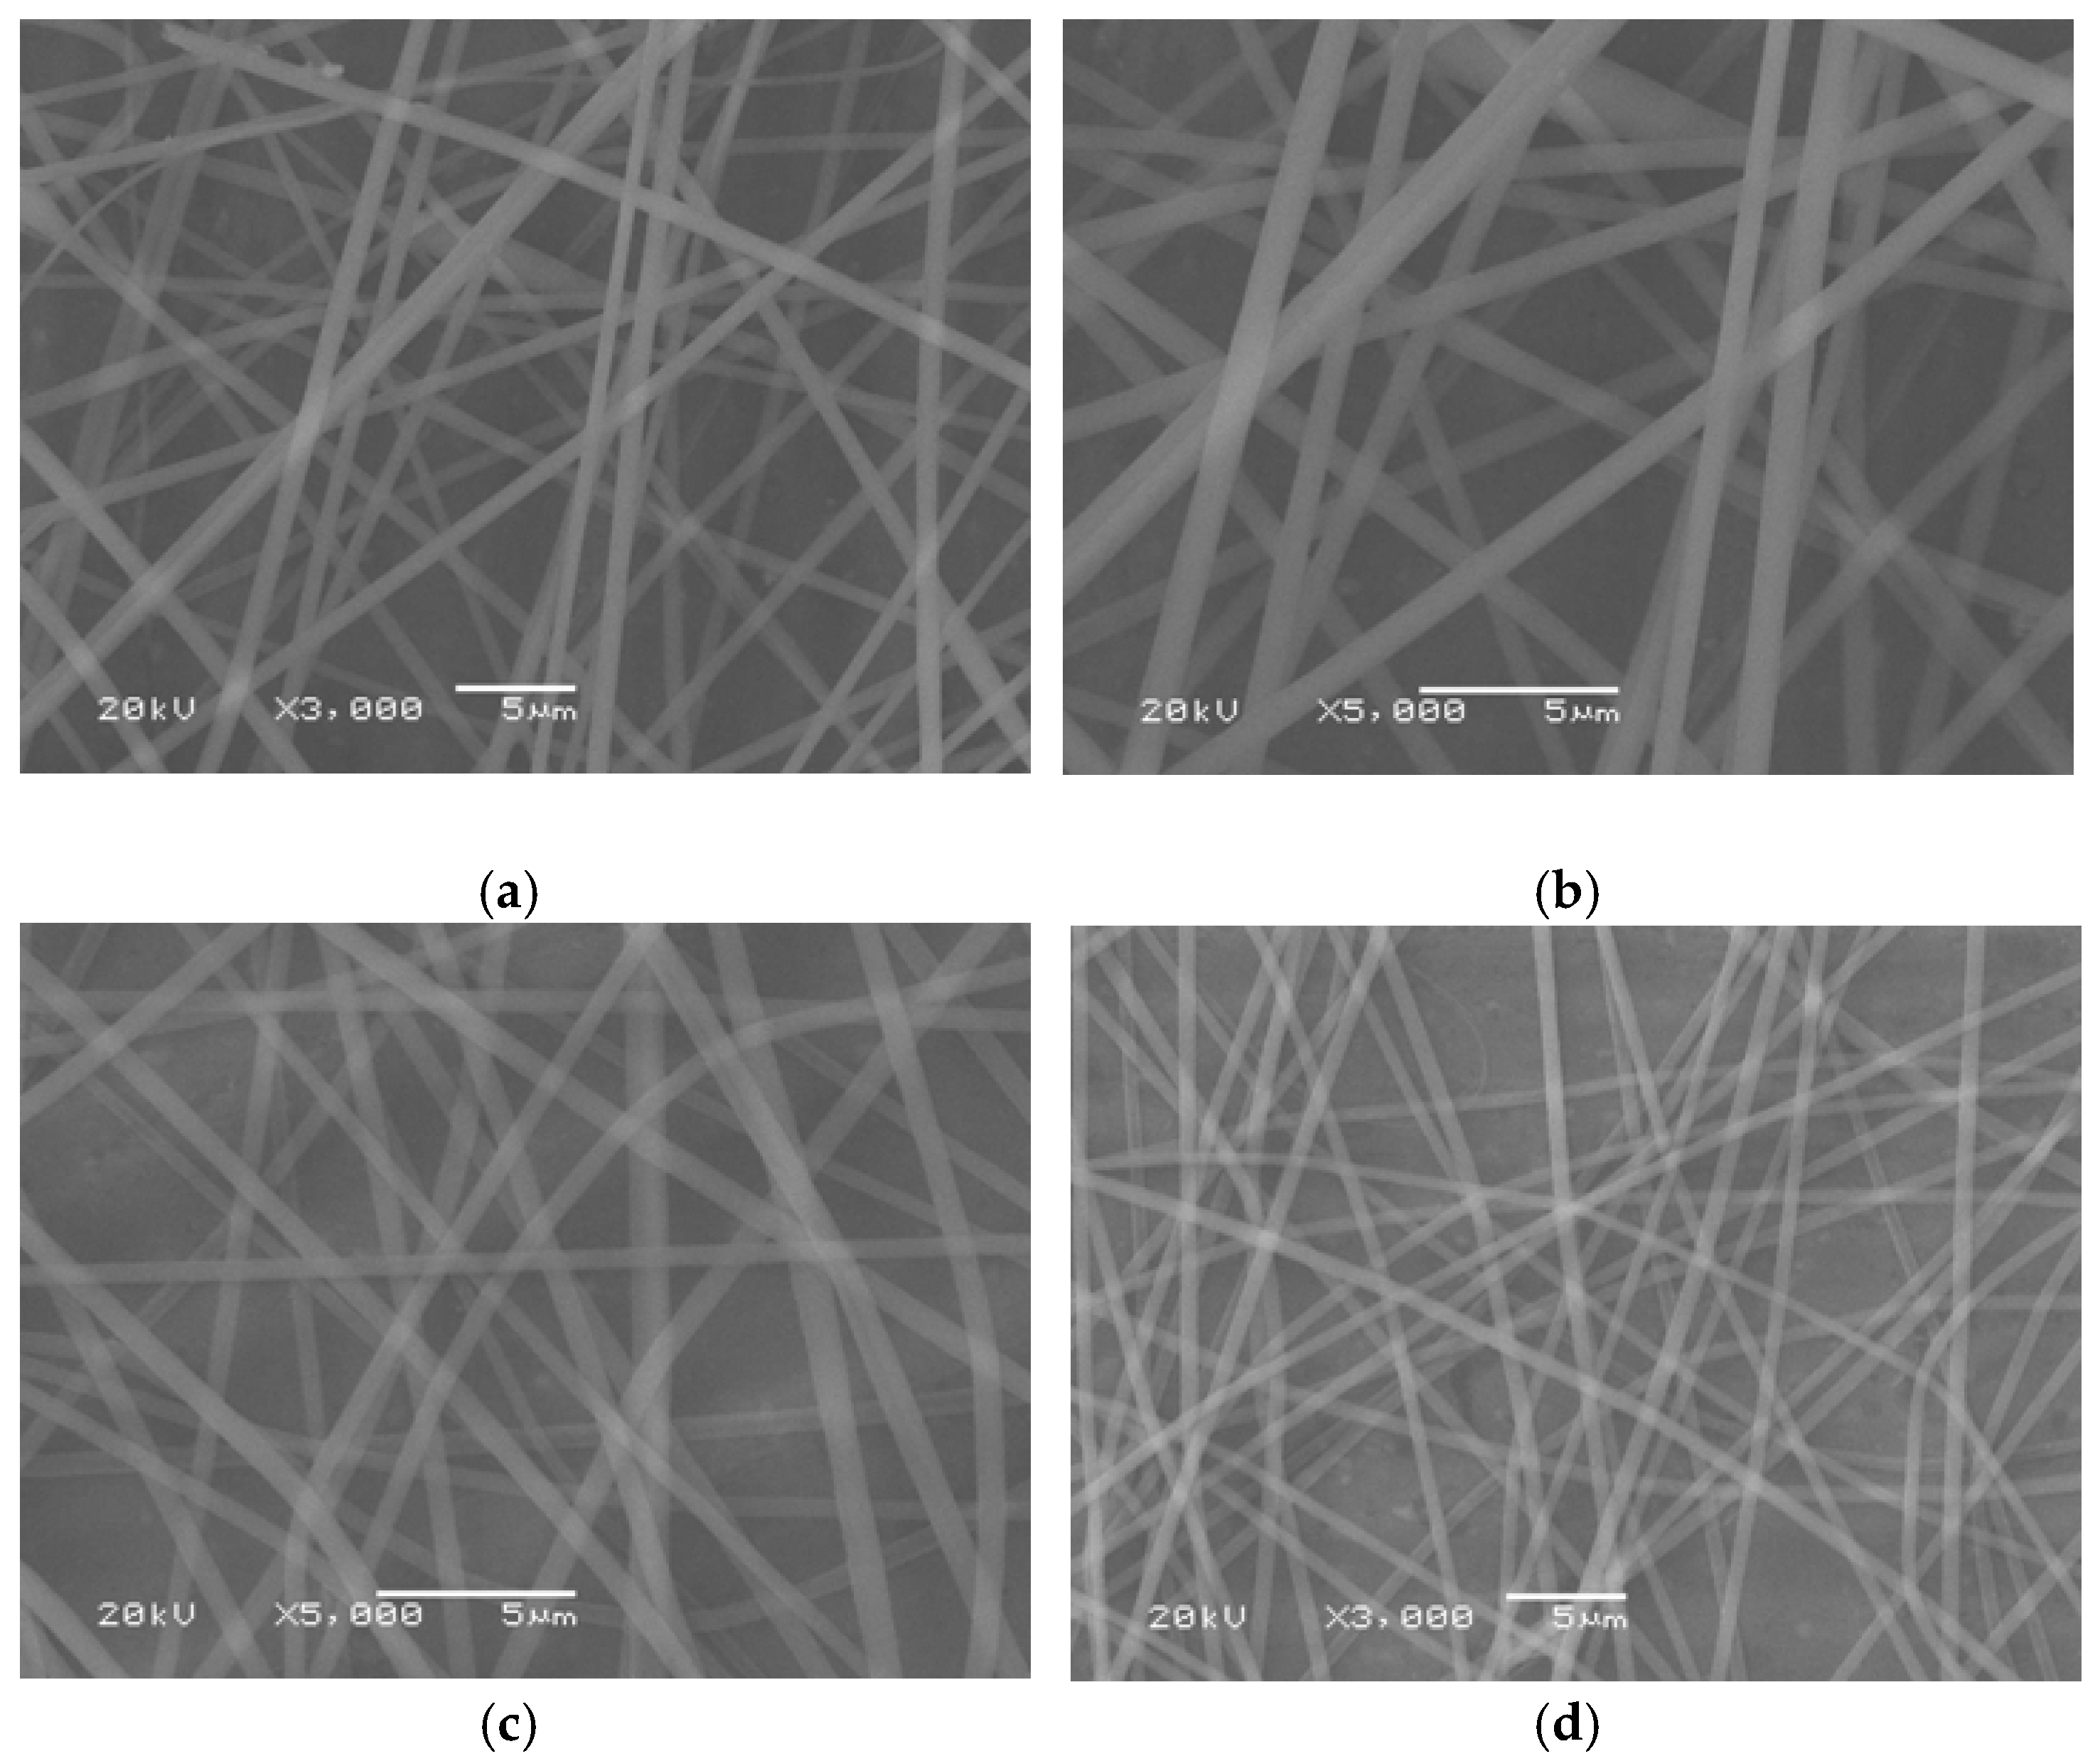
The SEM images of typical electrospun nanofibers demonstrated that the nanofibers of Eu(TFT)3phen/PMMA, Eu(TFT)3bpy/PMMA were successfully prepared (Figure 3a–d), and both nanofibers appeared to be distinctly separated and randomly interspersed. The surface of the composite nanofibers was smooth without identifiable particles, suggesting that complex 1 (or 2) might be uniformly dispersed into the nanofibers. Figure 4a,b disposed the fluorescence microscope images of Eu(TFT)3phen/PMMA and Eu(TFT)3bpy/PMMA composite nanofibers, respectively. The carbonyl bond of PMMA and the rare earth ions could have produced coordination bonds. Their composite materials were used as electron transport carriers, and they could be fabricated as electrospinning fibers. More importantly, the aggregation of the Eu/PMMA composite led to the formation of nanoparticles in the composite fibers during the entire electrospinning process.
3. Results and Discussion
3.1. UV–Vis Spectral Analysis
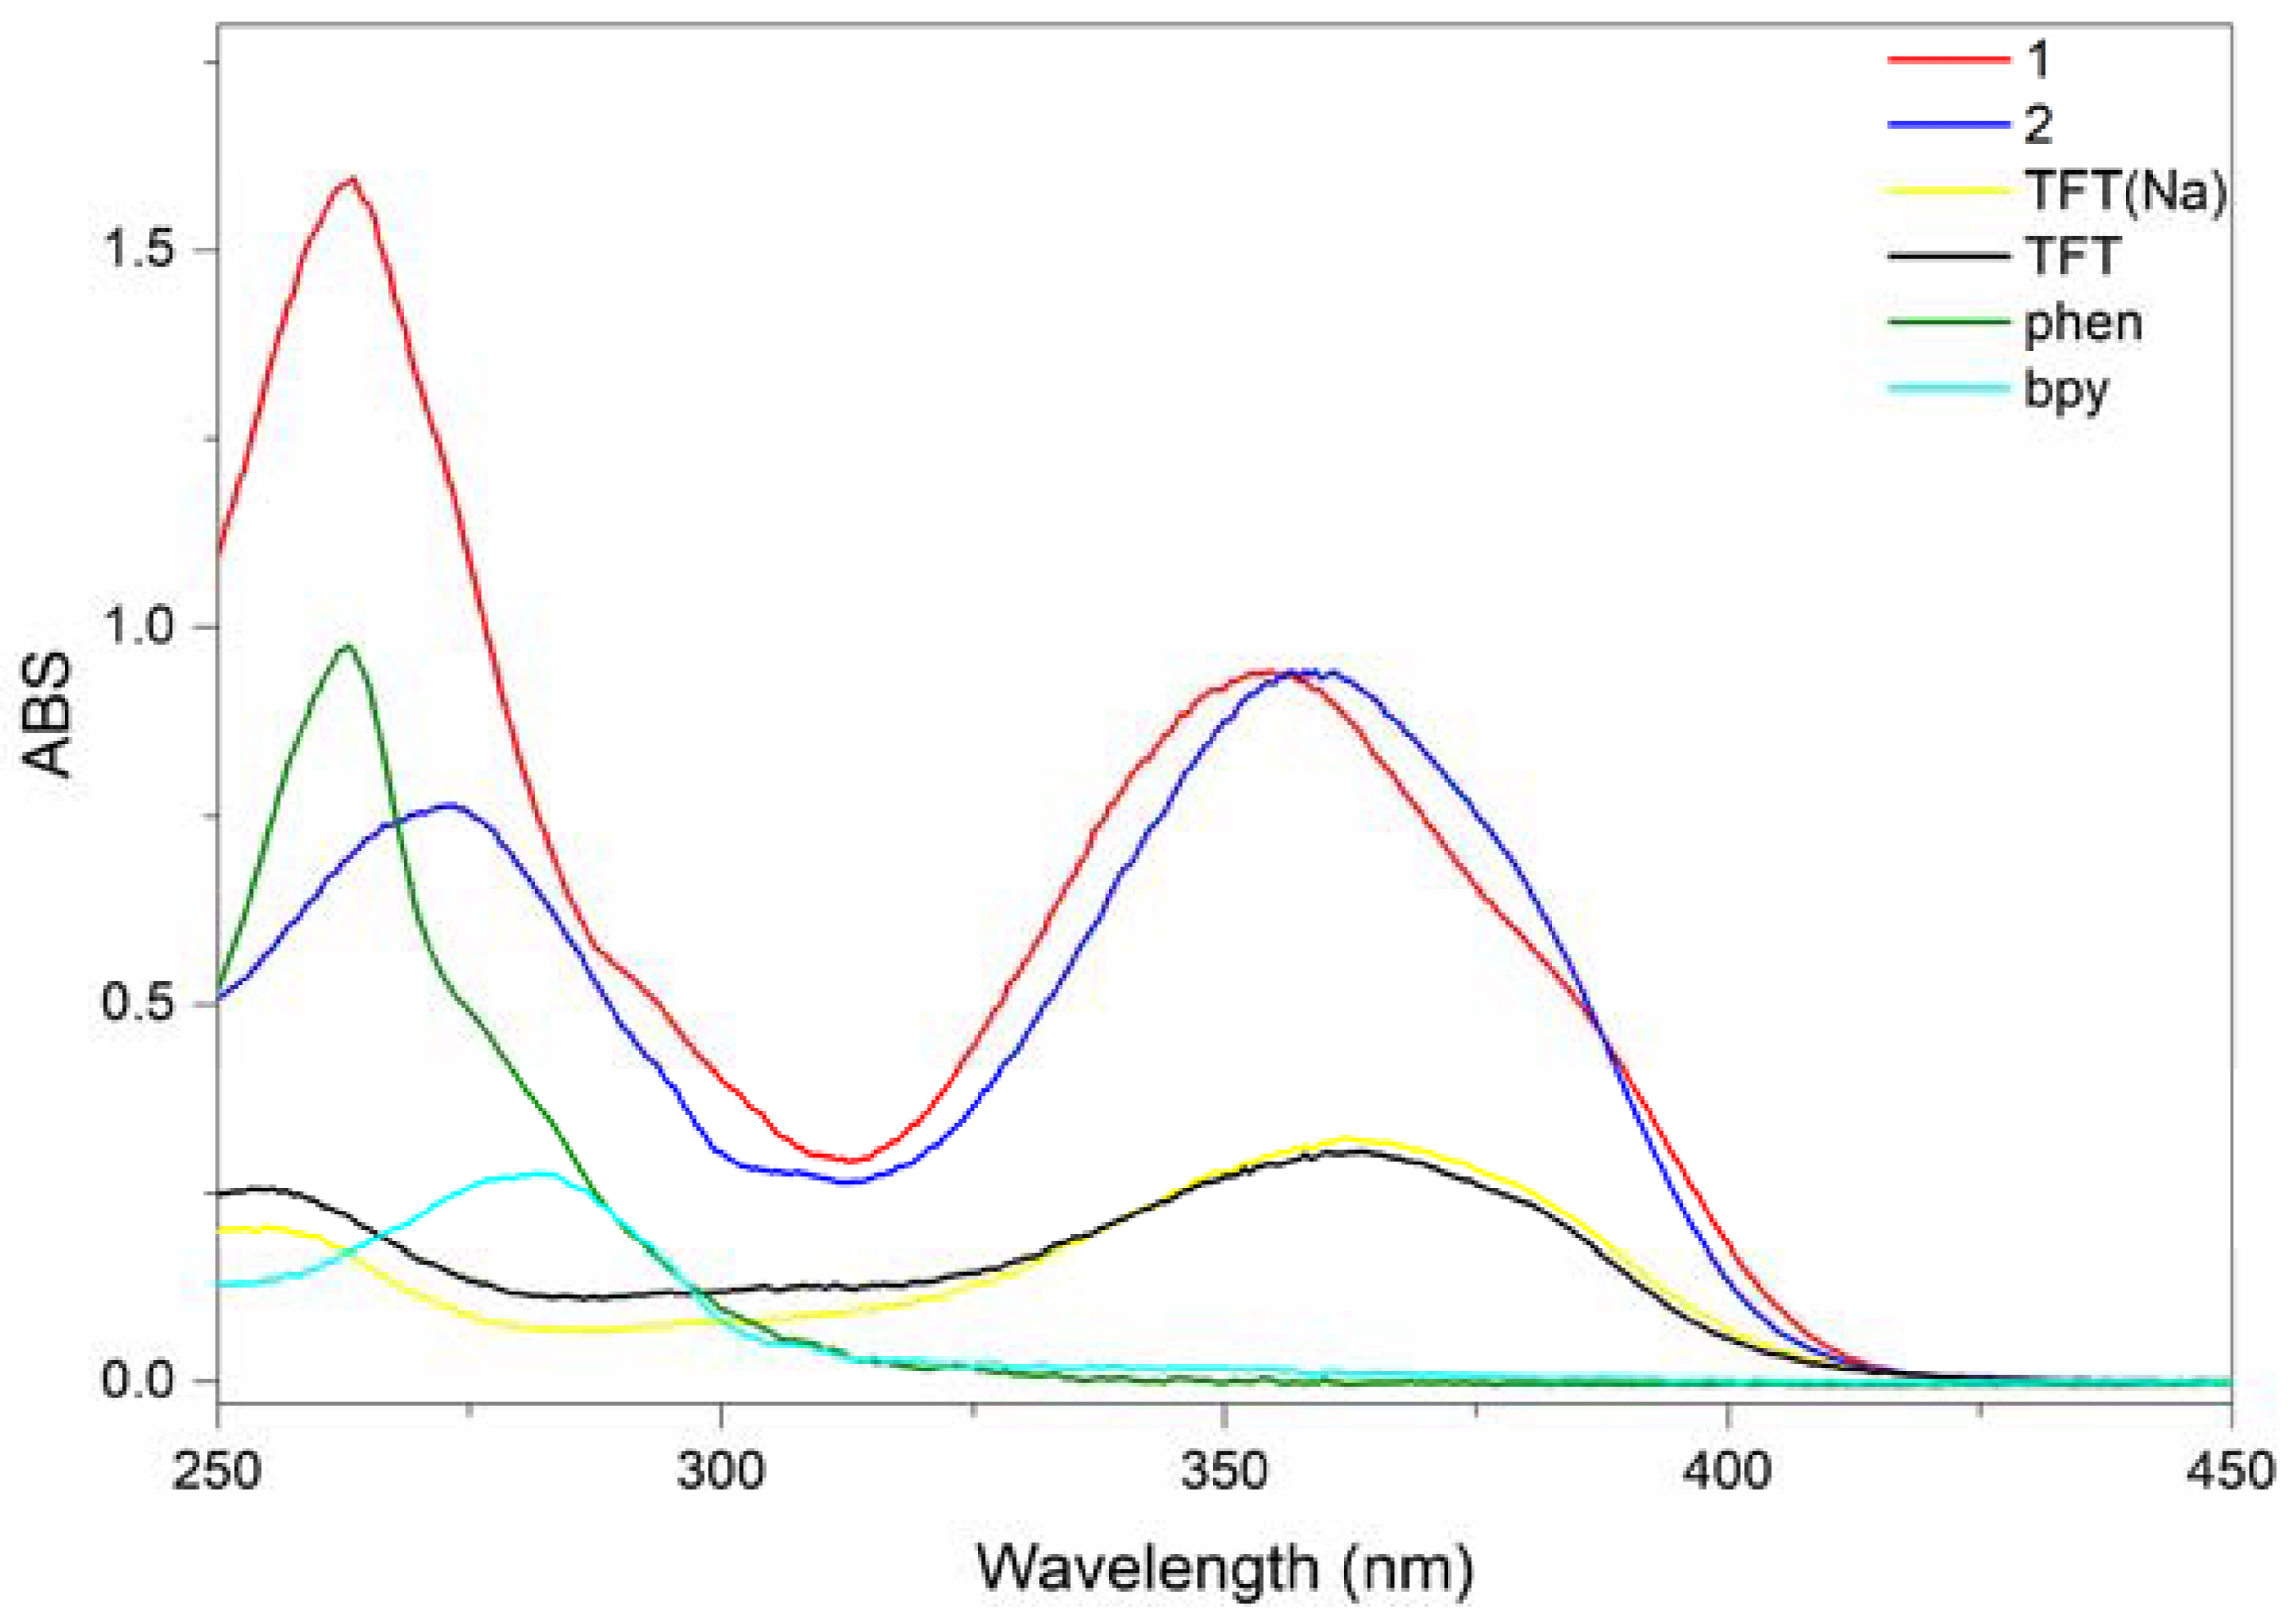
The ultraviolet absorption spectra of TFT and complexes 1 and 2 are shown in the CH3CN solution (1 × 10⁻⁵ mol·L−1). According to the spectra (Figure 5), the absorption broad band appeared to be slightly blue-shift from 363 nm for the TFT to 362 nm for the Na(TFT) because of the transfer of the β-diketonate proton. In addition, the maximal absorption of Phen and Bpy was 263 and 272 nm, respectively. This was due to the singlet–singlet π–π* absorption of the ancillary ligand. As for complexes 1 and 2, the two typical UV–Vis absorption peaks were 353 and 359 nm, respectively. They had high absorption intensities, which were blue-shifted compared to ligand TFT (363 nm), due to the influence of TFT complexed with the Eu3+ ion. In addition, the molar absorption coefficient values of complexes 1 and 2 were approximately 0.9 × 10⁵ L·mol−1·cm−1 around 350–360 nm, which was three times higher than the ligand base on each of the complexes consisting of three ligands.
The calculated HOMO and LUMO levels of the ground state were −0.21 and −0.30 eV, respectively, while the values for singlet excitation of complex 1 were −0.08 and 0.05 eV (Table A3), respectively. Both the electronic distributions of HOMO localize at TFT, while those of LUMO localize at phen (Figure 6). The lowest excitation energy of complex 1 was 4.47 eV. The intraligand charge transfer, the metal-to-ligand charge transfer, and the metal center conversion are the major reasons for the absorption transitions. The calculation data corresponded with the phenomena that the absorption intensity of the complexes was approximately two times higher than that of the ligand.
3.2. Thermal Stability Analysis
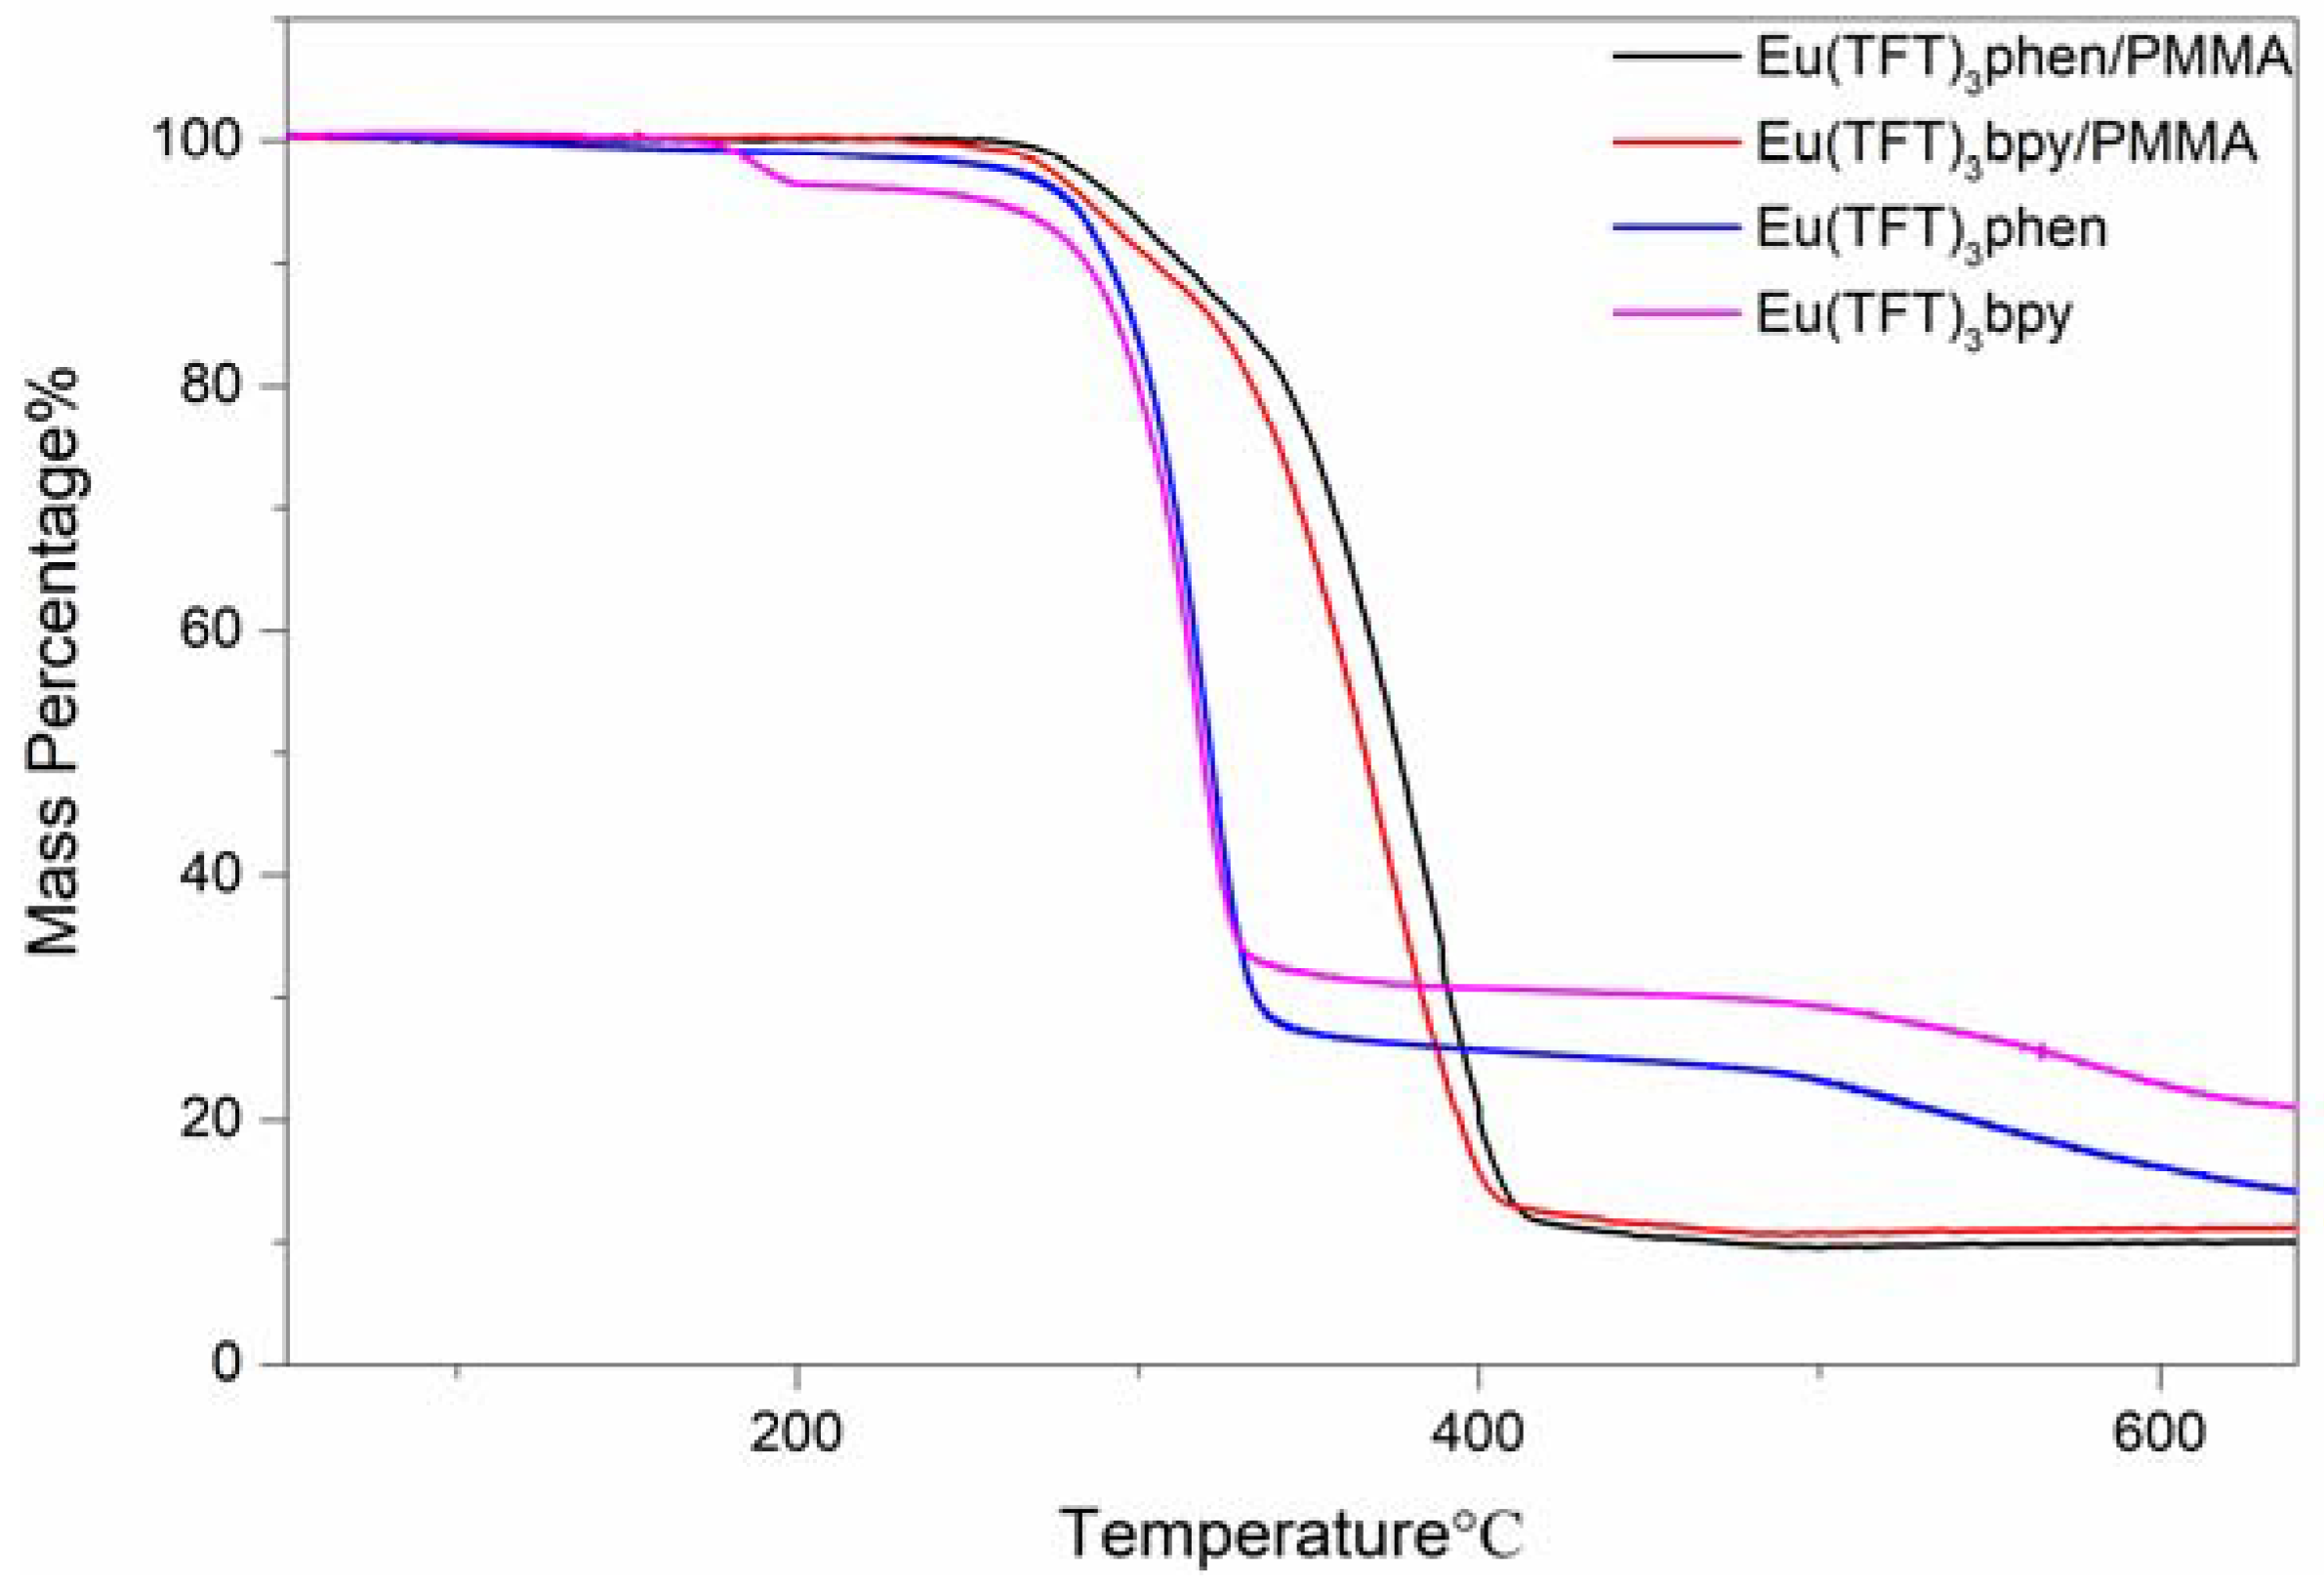
The thermal stabilities of complexes 1 and 2 (Figure 7) were analyzed with thermogravimetric analysis (TGA) in a temperature range from 50 to 720 °C at a rate of 10 °C·min−1 under a nitrogenous gas atmosphere. Within the temperature range of 250–650 °C, the TGA curve of complex 1 showed that the weightlessness rate was 85.9%, which corresponds to how the TFT and phen ligands (calcd 86.1%) decomposed gradually. Within the temperature range of 190–210 °C, the TGA curve of complex 2 showed a weight loss of 4%, corresponding to how the solvent n-hexane (calcd 4%) evaporated gradually. In the temperature range of 250–650 °C, a weight loss of 76.2% corresponded to how the TFT and bpy ligands (calcd 76.8%) decomposed gradually. The final mass residues of complexes 1 and 2 were europium oxide.
We take complex 1 as an example. The experimental results show that the initial decomposition temperature of the composite is approximately 268 °C. It is higher than the decomposition temperature of complex 1 by 18 °C. The Eu/PMMA composite nanofiber produces a thermal behavior in a wide temperature range from 268 to 410 °C, which is 80°C higher than that of the undoped polymethyl methacrylate (PMMA) fiber. The result shows that when the PMMA is used as the polymer matrix, the rigid chain segment of the polymer has a limited effect on the vibration of the organic ligand and improves the relative independence of the doping molecule, such that the complex can remain stable in a good environment.
3.3. The Photoluminescent Properties of Complexes
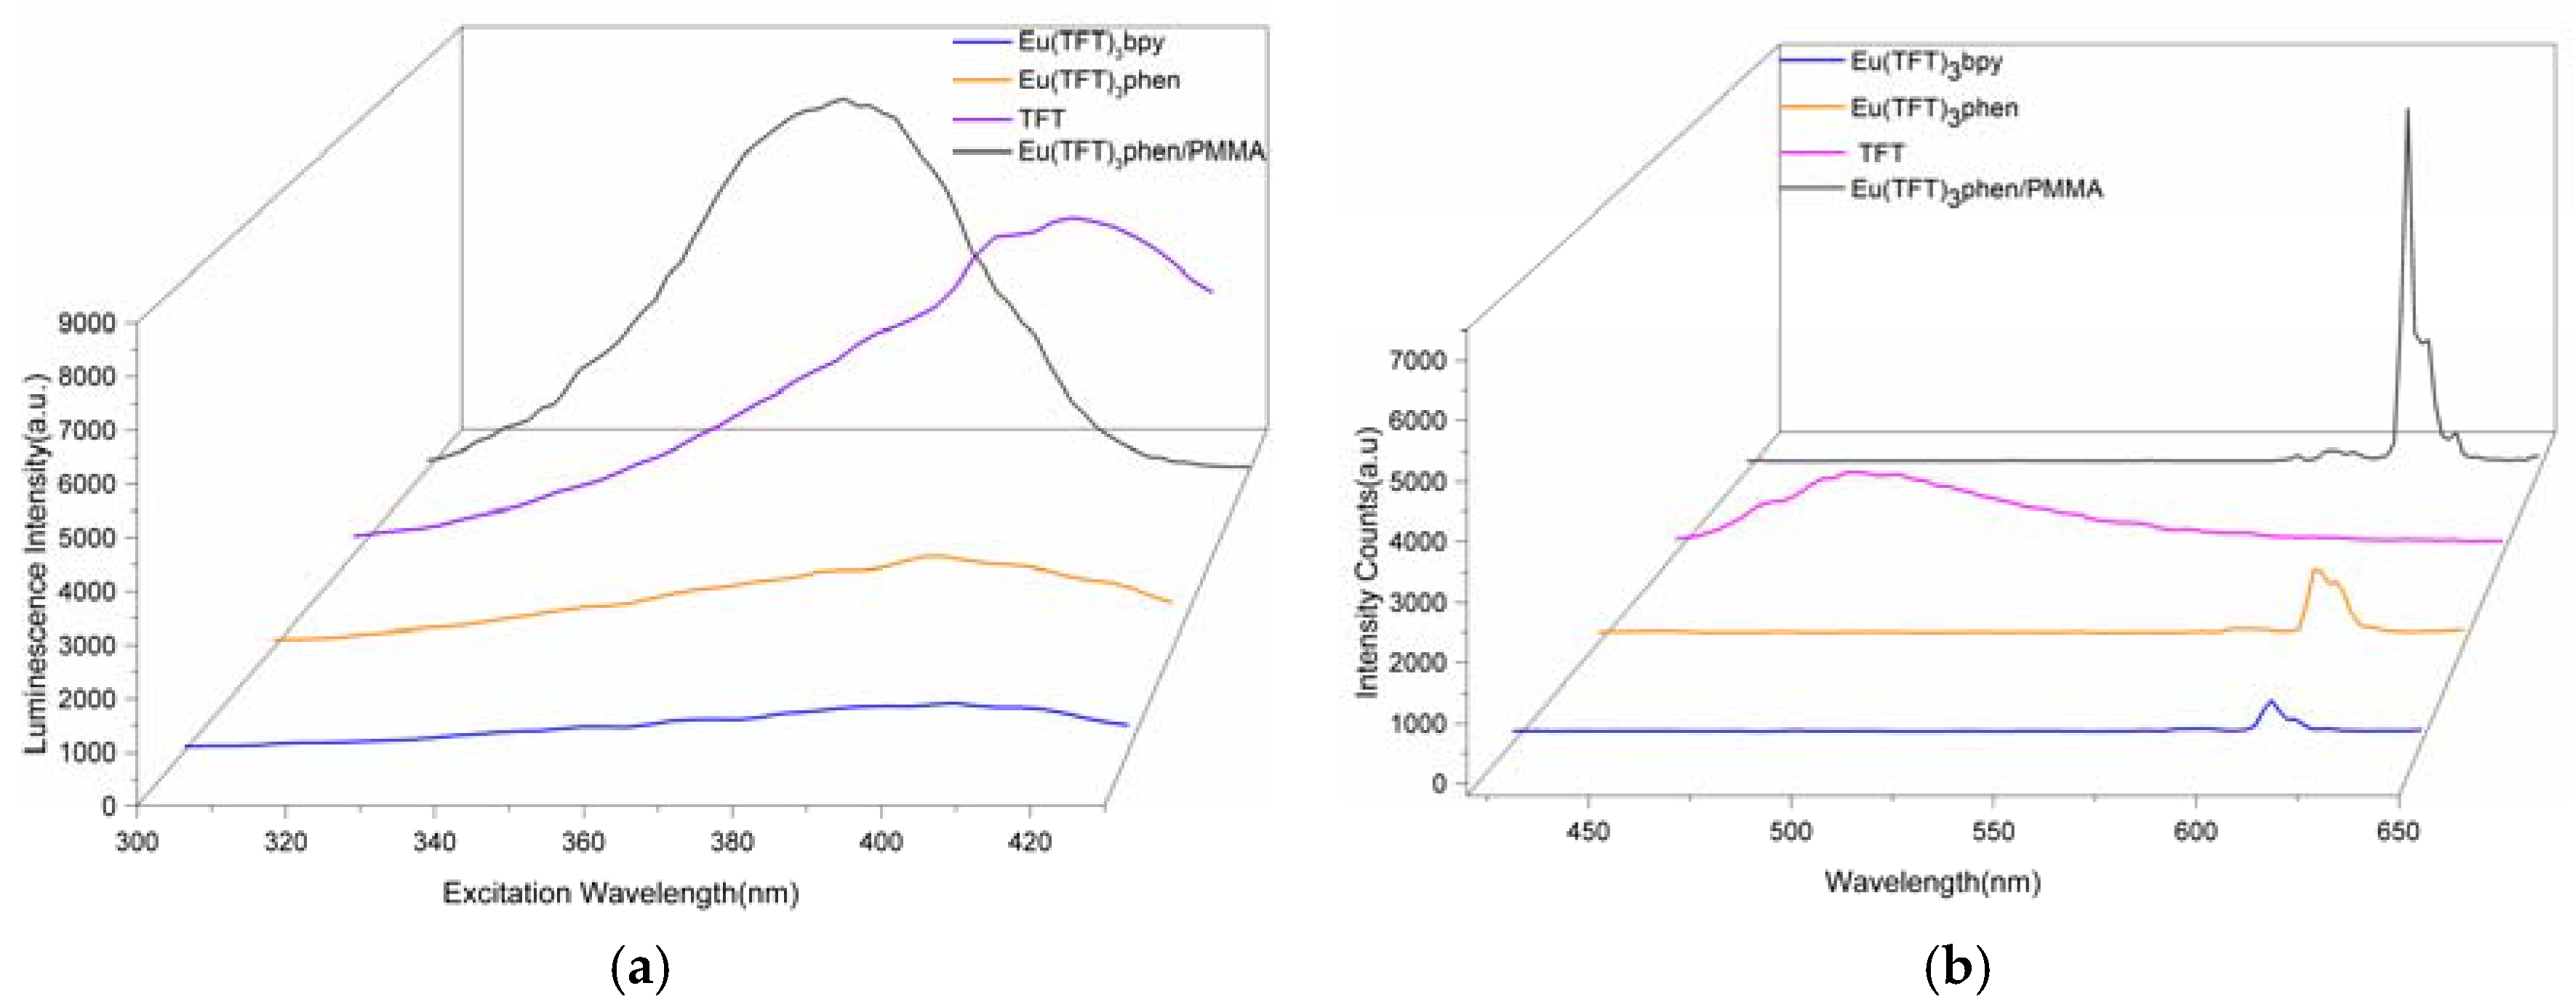
The fluorescence spectra of TFT and complexes 1 and 2 are shown in Figure 8. The several characteristic narrow emission bands of the Eu3+ ion are formed upon excitation at 390–410 nm (Figure 8a), corresponding to the transitions from the metal-centered 5D0 excited state to the 7FJ ground state (Figure 8b), respectively. Among them, the 5D0 → 7FJ transition around 611 nm is the highest intensity emission, which belongs to an induced electric dipole transition, indicating that the Eu3+ ion is not situated in a location with inversion center symmetry.
The Eu(III) complexes have the strongest fluorescence intensity among the lanthanide series and emit red light at 605–700 nm. The blue light emission appeared at 450–480 nm. As can be seen in Figure 8b, the broad emission band of organic ligands (λem = 468 nm) cannot be observed in field of complexes 1 and 2. Therefore, it is effective to transfer the absorbed energy to the emission level of the Eu3+ ion. Meanwhile, we discovered that the emission peak of complex 1 was stronger than complex 2; the main reason for this was the difference in the auxiliary ligand. The light absorption of the auxiliary ligand of complexes 1 and 2 was different. The phen ligand had a higher efficiency of light absorption and an energy in the triplet excited state that was higher than the lowest emitting level of the Eu(III).
3.4. The Photoluminescent Properties of PMMA, PVP/Complexes Composites
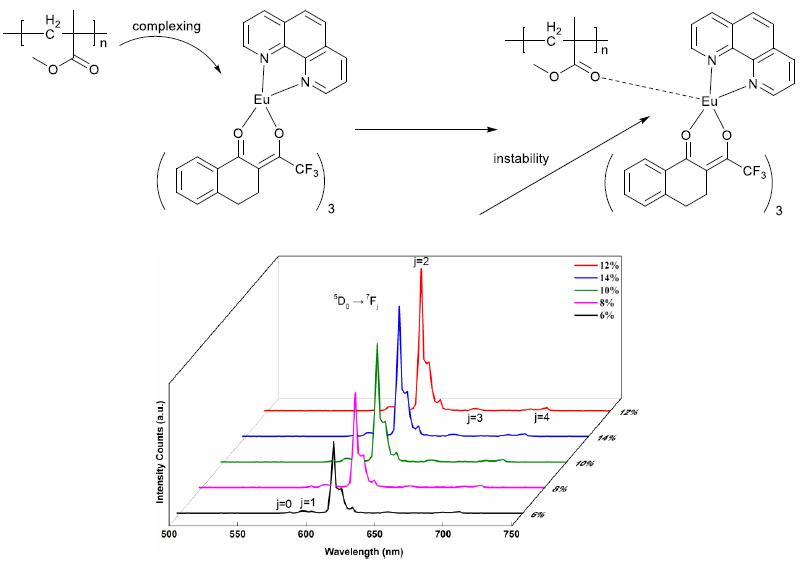
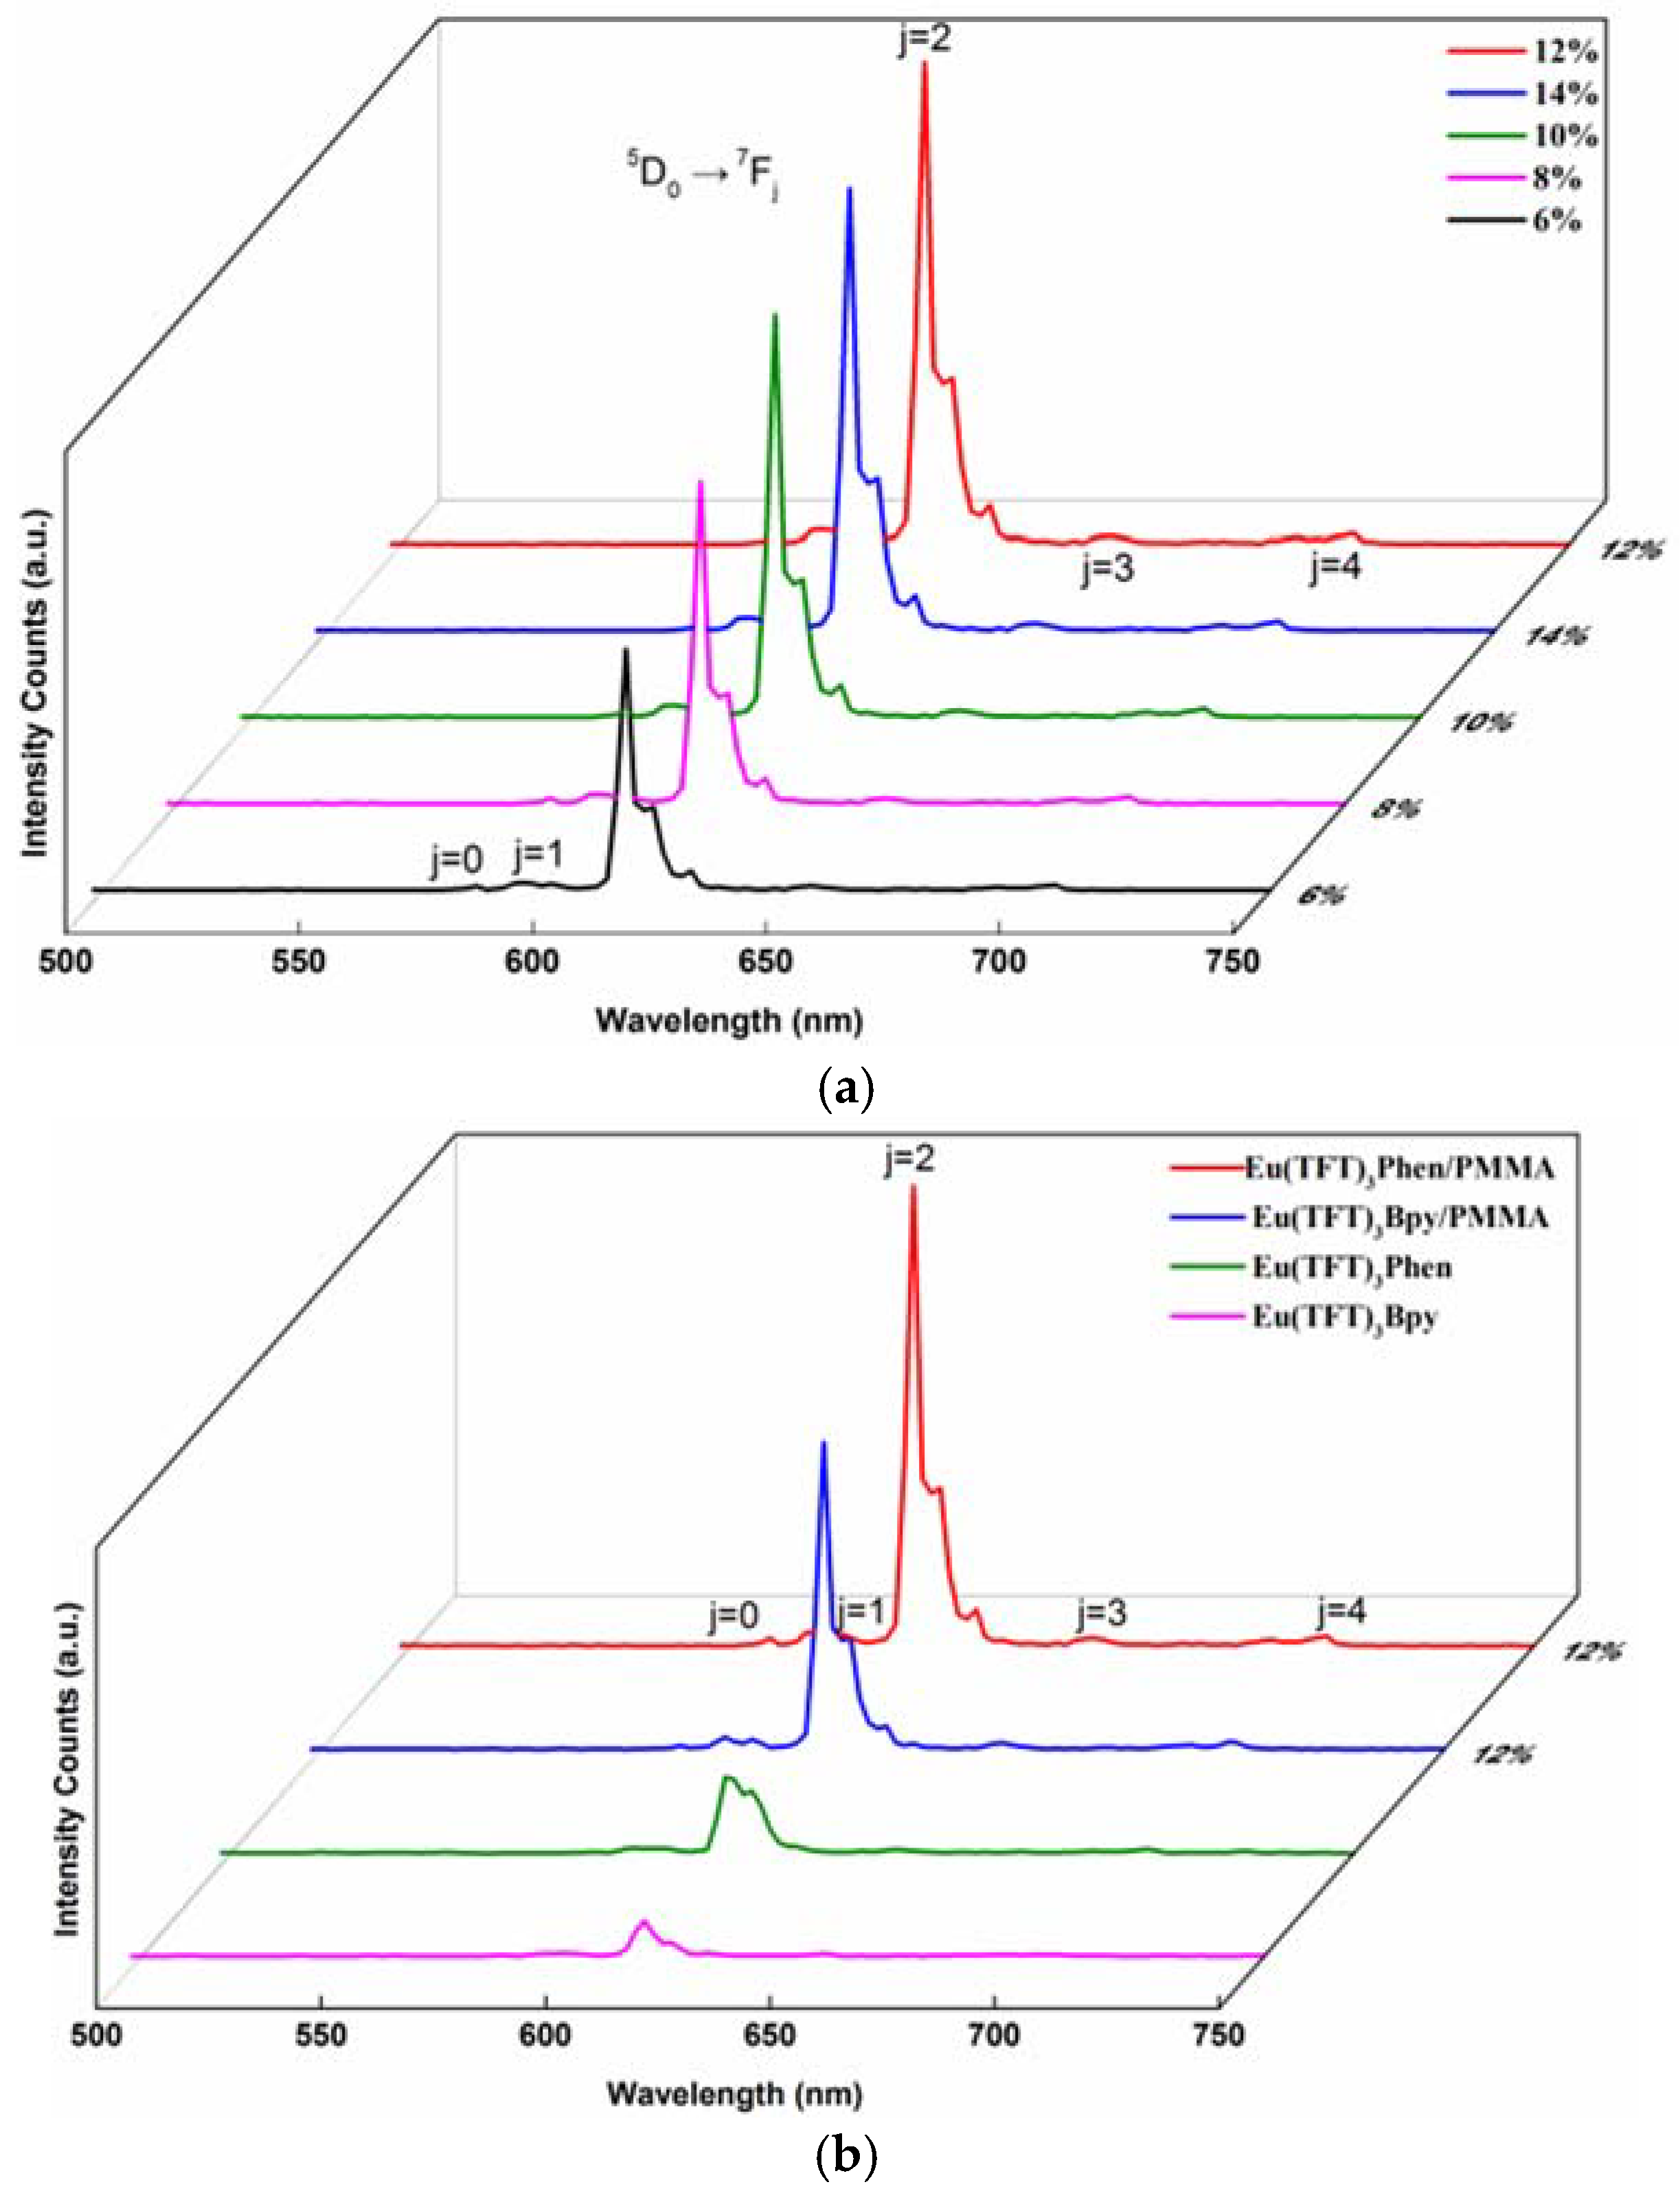
The emission spectra of the composite nanofibers with Eu(TFT)3phen/PMMA and the emission spectra of complexes 1 and 2 and Eu/PVP composite fibers with a content of 12 wt % are shown in Figure 9a,b. We found that the fluorescence intensity of the complexes in PMMA was significantly improved. With an increase in doping level, the fluorescence emission intensity increased gradually, then showed a decreasing trend after reaching a maximum strength with a Eu(TFT)3phen content of 12 wt % during emission. The 5D0 → 7F2 fluorescence emission peaks of Eu/PMMA composite fibers were higher than that of the Eu3+ complexes. The emission intensity of Eu(TFT)3phen/PMMA was clearly stronger than Eu(TFT)3bpy/PMMA, which is consistent with the fluorescence microscope images.
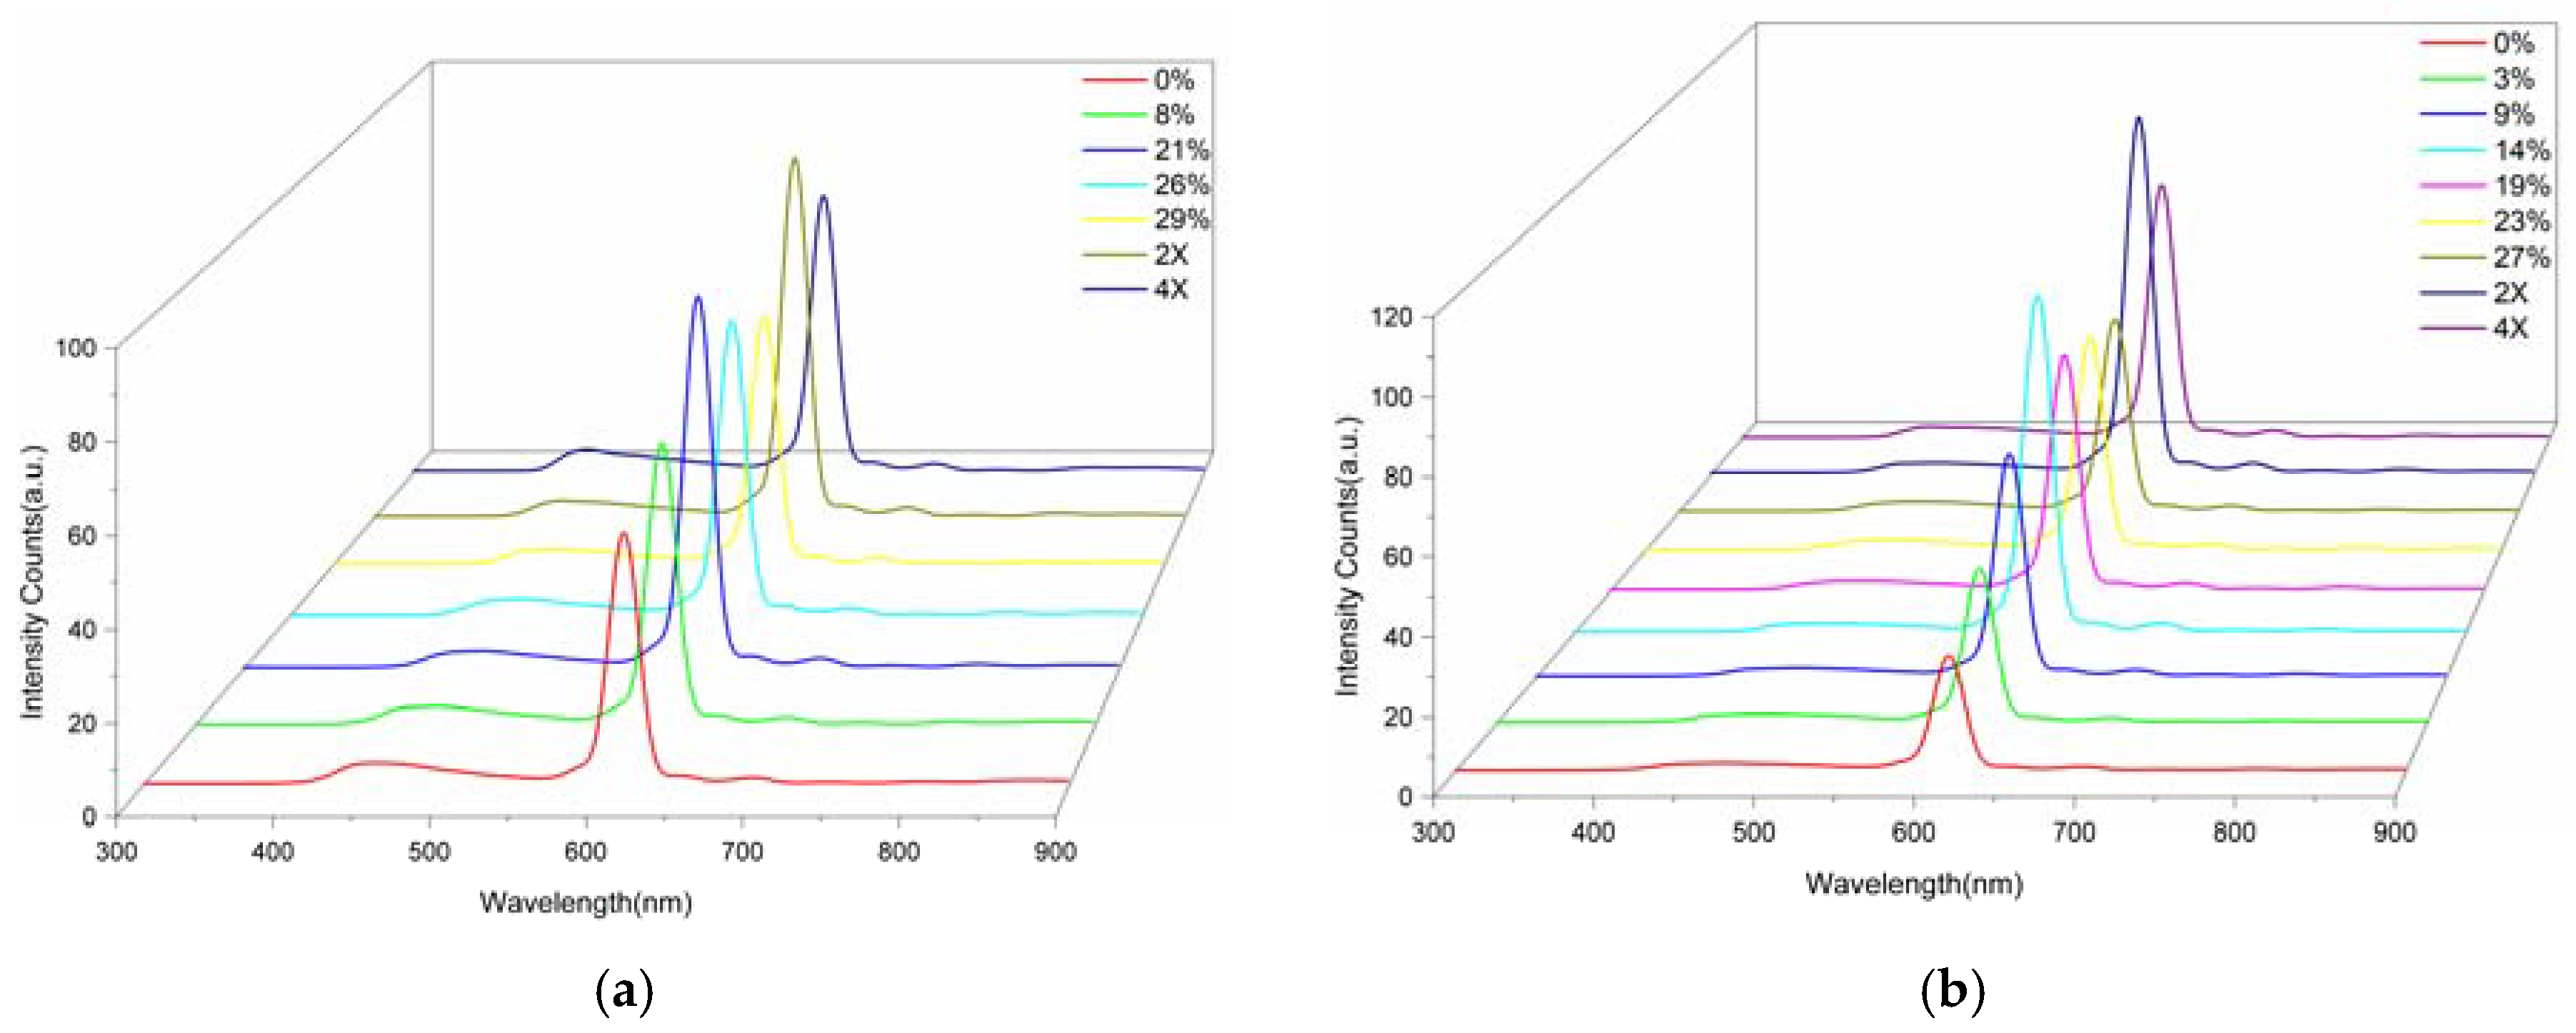
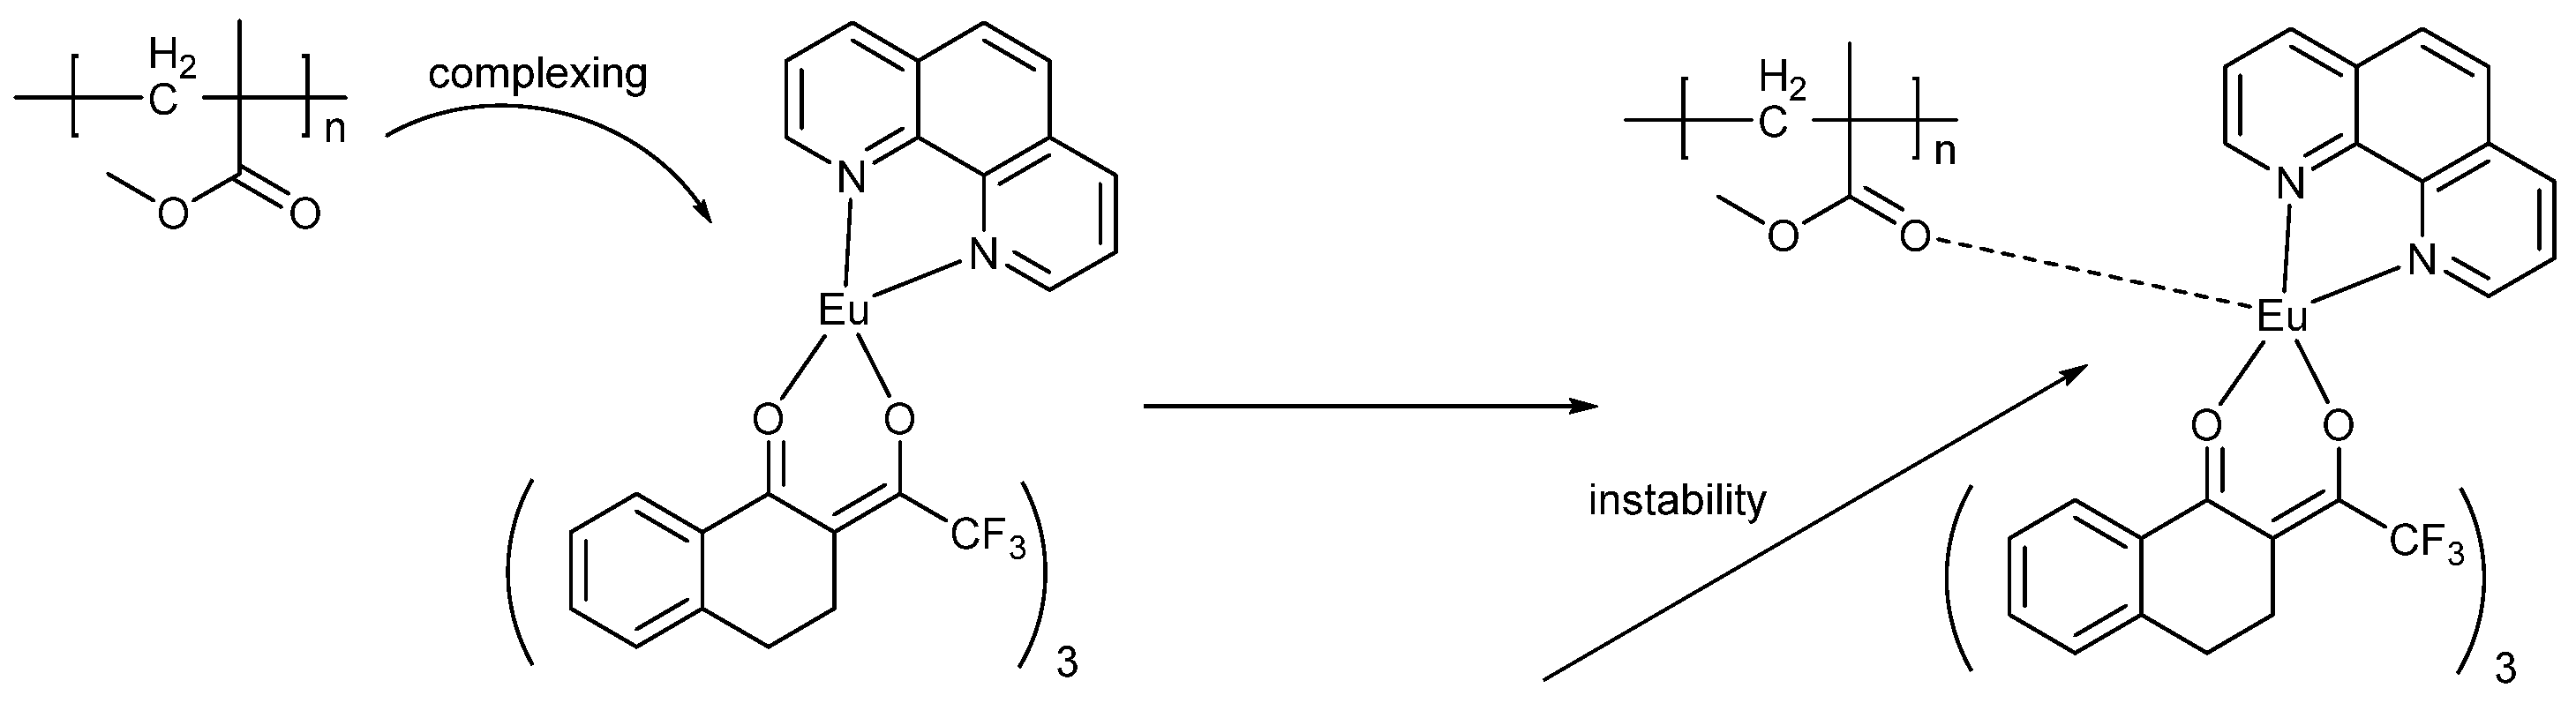
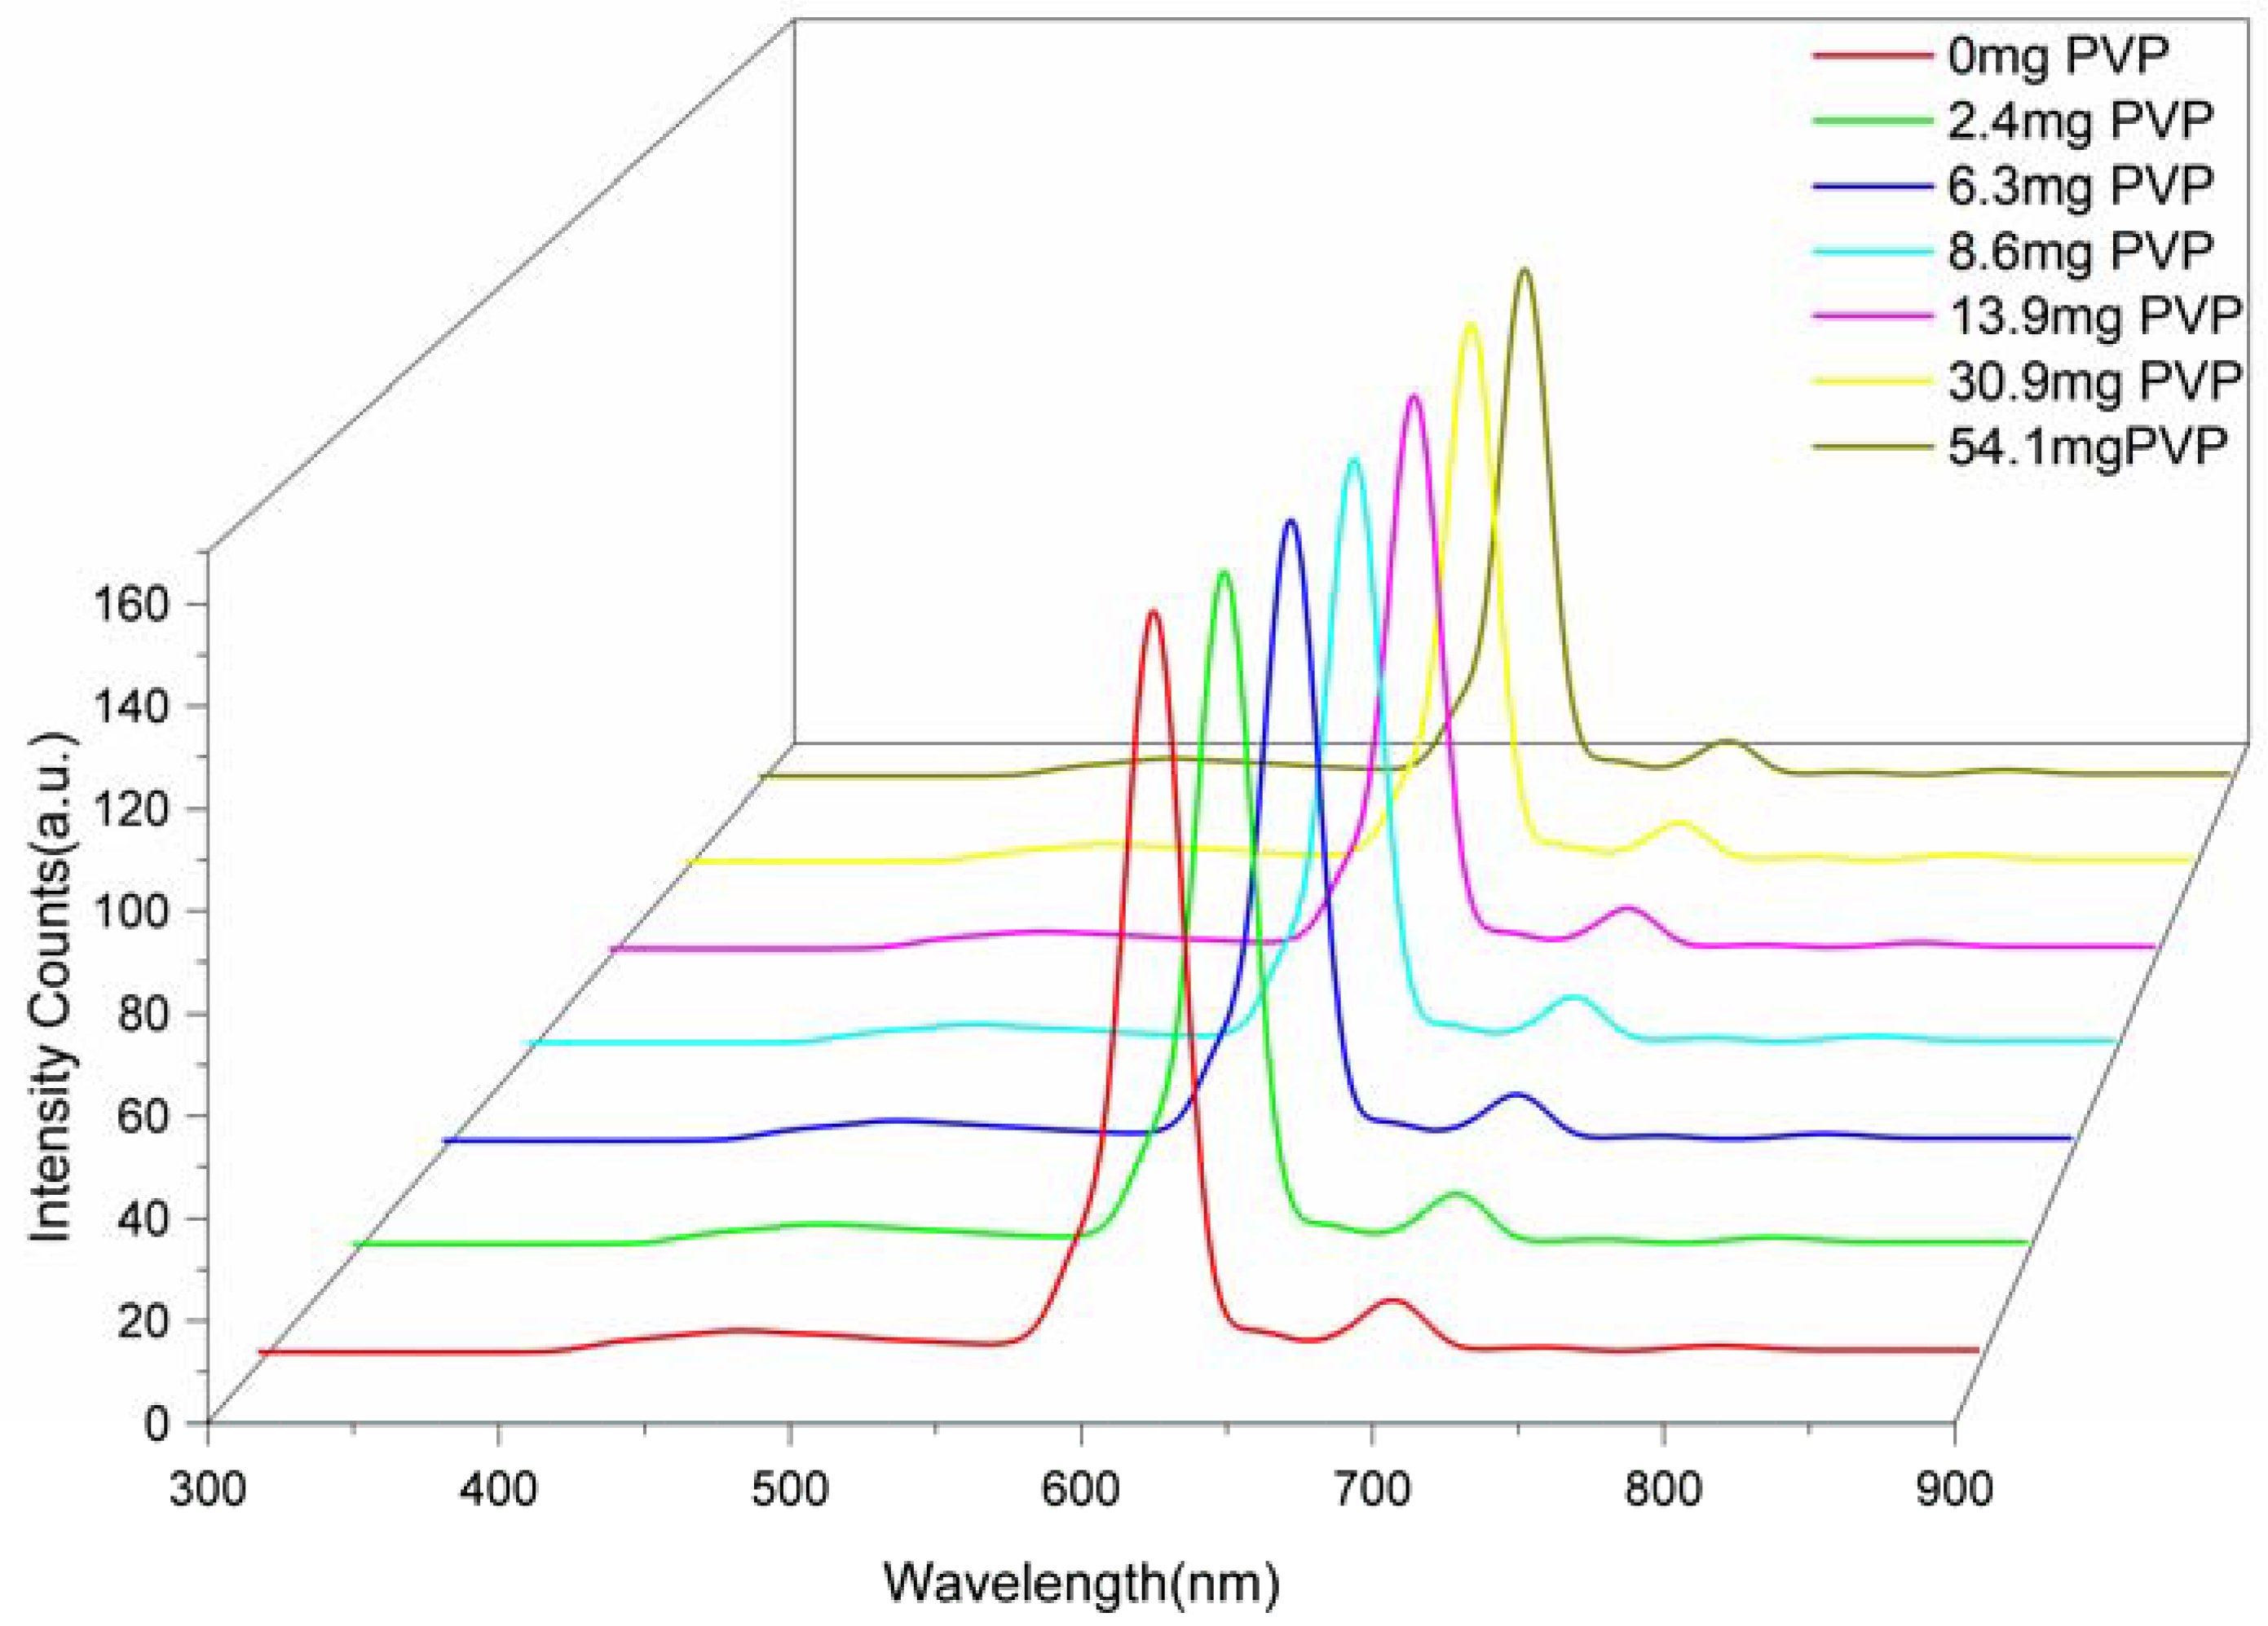
The polymers have a strong isolation effect, and they are not easy to react with small molecular compounds. By changing the mixed proportion of PMMA and complexes and measuring their fluorescence intensity, it was found that PMMA’s carbonyl bond may have coordinated with the rare earth ions to enhance the luminescence intensity of the rare earth ions (Scheme 5). In order to study the coordination and luminescence mechanism of the rare earth complexes and the polymers, we designed a series of experiments. Eu(TFT)3(TPPO) (0.07 g) and Eu(TFT)3(TPPO)2 (0.07 g) were dissolved in chloroform (50 mL), respectively. Then, polyvinyl pyrrolidone (PVP) was added to the solution to test their liquid fluorescence properties, and the liquid fluorescence spectra were obtained (Figure 10a,b). By analyzing the liquid fluorescence spectra, we found that the liquid fluorescence intensities of Eu(TFT)3(TPPO) and Eu(TFT)3(TPPO)2 were almost the same. This shows that the roles of two TPPO molecules and one TPPO molecule were almost identical. The fluorescence properties of the rare earth complexes depended on the electron-stretching transfer in the complexes. In the process of electron stretching in rare earth complexes, the difference in electronic tensile transmission between two TPPO molecules and one TPPO molecule was very small. However, when PVP was added, the liquid fluorescence curves changed significantly. The emission peak intensity was significantly improved at 612 nm. At approximately 500 nm, there was a strong launch peak, which was caused by PVP. PVP had an intramolecular electron transition. The carbonyl bond of PVP and the ligand coordinated, which could have enhanced the intramolecular transition of PVP and increased the aggregation-induction effect of molecules. The emission peaks of 500 and 612 nm exist simultaneously, which could have adjusted the luminescence color of the complexes (Figure 10a,b). When the mass fraction of Eu(TFT)3(TPPO)/PVP was 23 wt %, its liquid fluorescence intensity was at its highest (345 nm). When the mass fraction of Eu(TFT)3(TPPO)2/PVP was 15 wt %, its liquid fluorescence intensity was at its highest (345 nm). When the concentration was too high, they produced the aggregation-induced quenching, and the fluorescence intensity decreased. At the same time, the emission wavelengths of 500 and 612 nm were not quenched synchronously, indicating that the polymers were different from the fluorescence mechanism of the rare earth complexes. In theory, the rare earth ions and ligands could form twelve -coordination complexes, but because of space resistance, the trivalent rare earth ions and ligands could form stable complexes of eight-coordination, and the rare earth complexes of nine(ten)-coordination were not very stable.
The fluorescence intensities of the rare earth complexes were increased in methanol, 1,2-dimethoxyethane, and acetonitrile due to their association with the solvent. The oxygen atoms (nitrogen atoms) of the solvent and the Eu3+ ions of the rare earth complexes could form coordination bonds, which enhanced the fluorescence properties of the Eu(III) complexes. However, the coordination bond was unstable. The Eu(III) complexes could be mixed with PMMA, PVP, and polyacrylonitrile (PAN) to make composite nanofibers. The fluorescence properties of the mixed Eu(III) complexes with these polymers were improved significantly because these polymers and the Ln(III) ions of complexes could form new complexes. The different types of auxiliary ligands were added and the fluorescence intensity of the complexes could be clearly improved.
Complex 3 (0.07 g) was added to N,N-dimethyl formamide (DMF) (50 mL). Then, PVP was added to the DMF solution. We found that the fluorescence intensity of the solution decreased slightly. The carbonyl bond of DMF could form a coordination bond with the Eu(III) ion of the rare earth complexes. However, the carbonyl bond of PVP, which is soluble in DMF, could not be coordinated with the complexes. There was no emission peak caused by PVP (Appendix C Figure A13). The emission peak near 500 nm was caused by the coordination of PVP and the rare earth complexes, which greatly enhanced the electron transition in polymer molecules. We found that the thermal stabilities of Eu(TFT)3phen/PMMA and Eu(TFT)3bpy/PMMA were improved by the analysis of heat loss. The experimental results showed that the oxygen atoms of PMMA and Eu(III) ions of complexes 1 and 2 formed new coordination bonds. Their thermal stability was enhanced and the fluorescence intensity in chloroform was significantly improved (Figure 10a,b). The fluorescence spectra indicated that the Eu/PMMA nanofibers had a maximum luminescence intensity at a content of 12 wt %. When PMMA had a mass fraction of 10–14 wt %, a carbonyl bond of PMMA was matched with an Eu(III) ion of complex 1 or 2. Through a comparison with the fluorescence properties of the complexes 3 and 4 and Eu(TFT)3(TPPO)/PVP and Eu(TFT)3(TPPO)2/PVP, it was found that the rare earth complexes could form nine coordination bonds, which had a significant effect on the luminescence properties of the complexes. However, the ninth coordination bond was not a very stable coordination bond. The auxiliary ligands and the rare earth complexes of a different molar ratio formed new complexes, but their luminescence properties underwent little change. However, two different auxiliary ligands were involved in coordination, and the optical properties of the complexes could be greatly changed. The auxiliary ligands could be TPPO, phen, bpy, or the polymers with carbonyl groups.
Complexes 5 and 6 were added to chloroform (50 mL), respectively. Then, PVP was added. The fluorescence intensity of PVP/complexes 5 and 6 were increased by one to three times, but it was far less than the fluorescence intensity of the PVP/complexes 3 and 4 (Figure 11a,b). The increase in the number of fluorine atoms in PFP would have enhanced the aggregation-induced effect of the rare earth complexes. From the experimental data, we found that when the concentration of PVP/complexes was diluted two times, the fluorescence intensity was significantly enhanced, which was due to the attenuation of the aggregation-induction effect. When the solution was diluted four times, the fluorescence intensity decreased due to a decrease in concentration.
3.5. Fluorescence Lifetimes and Fluorescence Quantum Efficiencies of Complexes 1–6 and Eu(TFT)3bpy/PMMA, Eu(TFT)3phen/PMMA
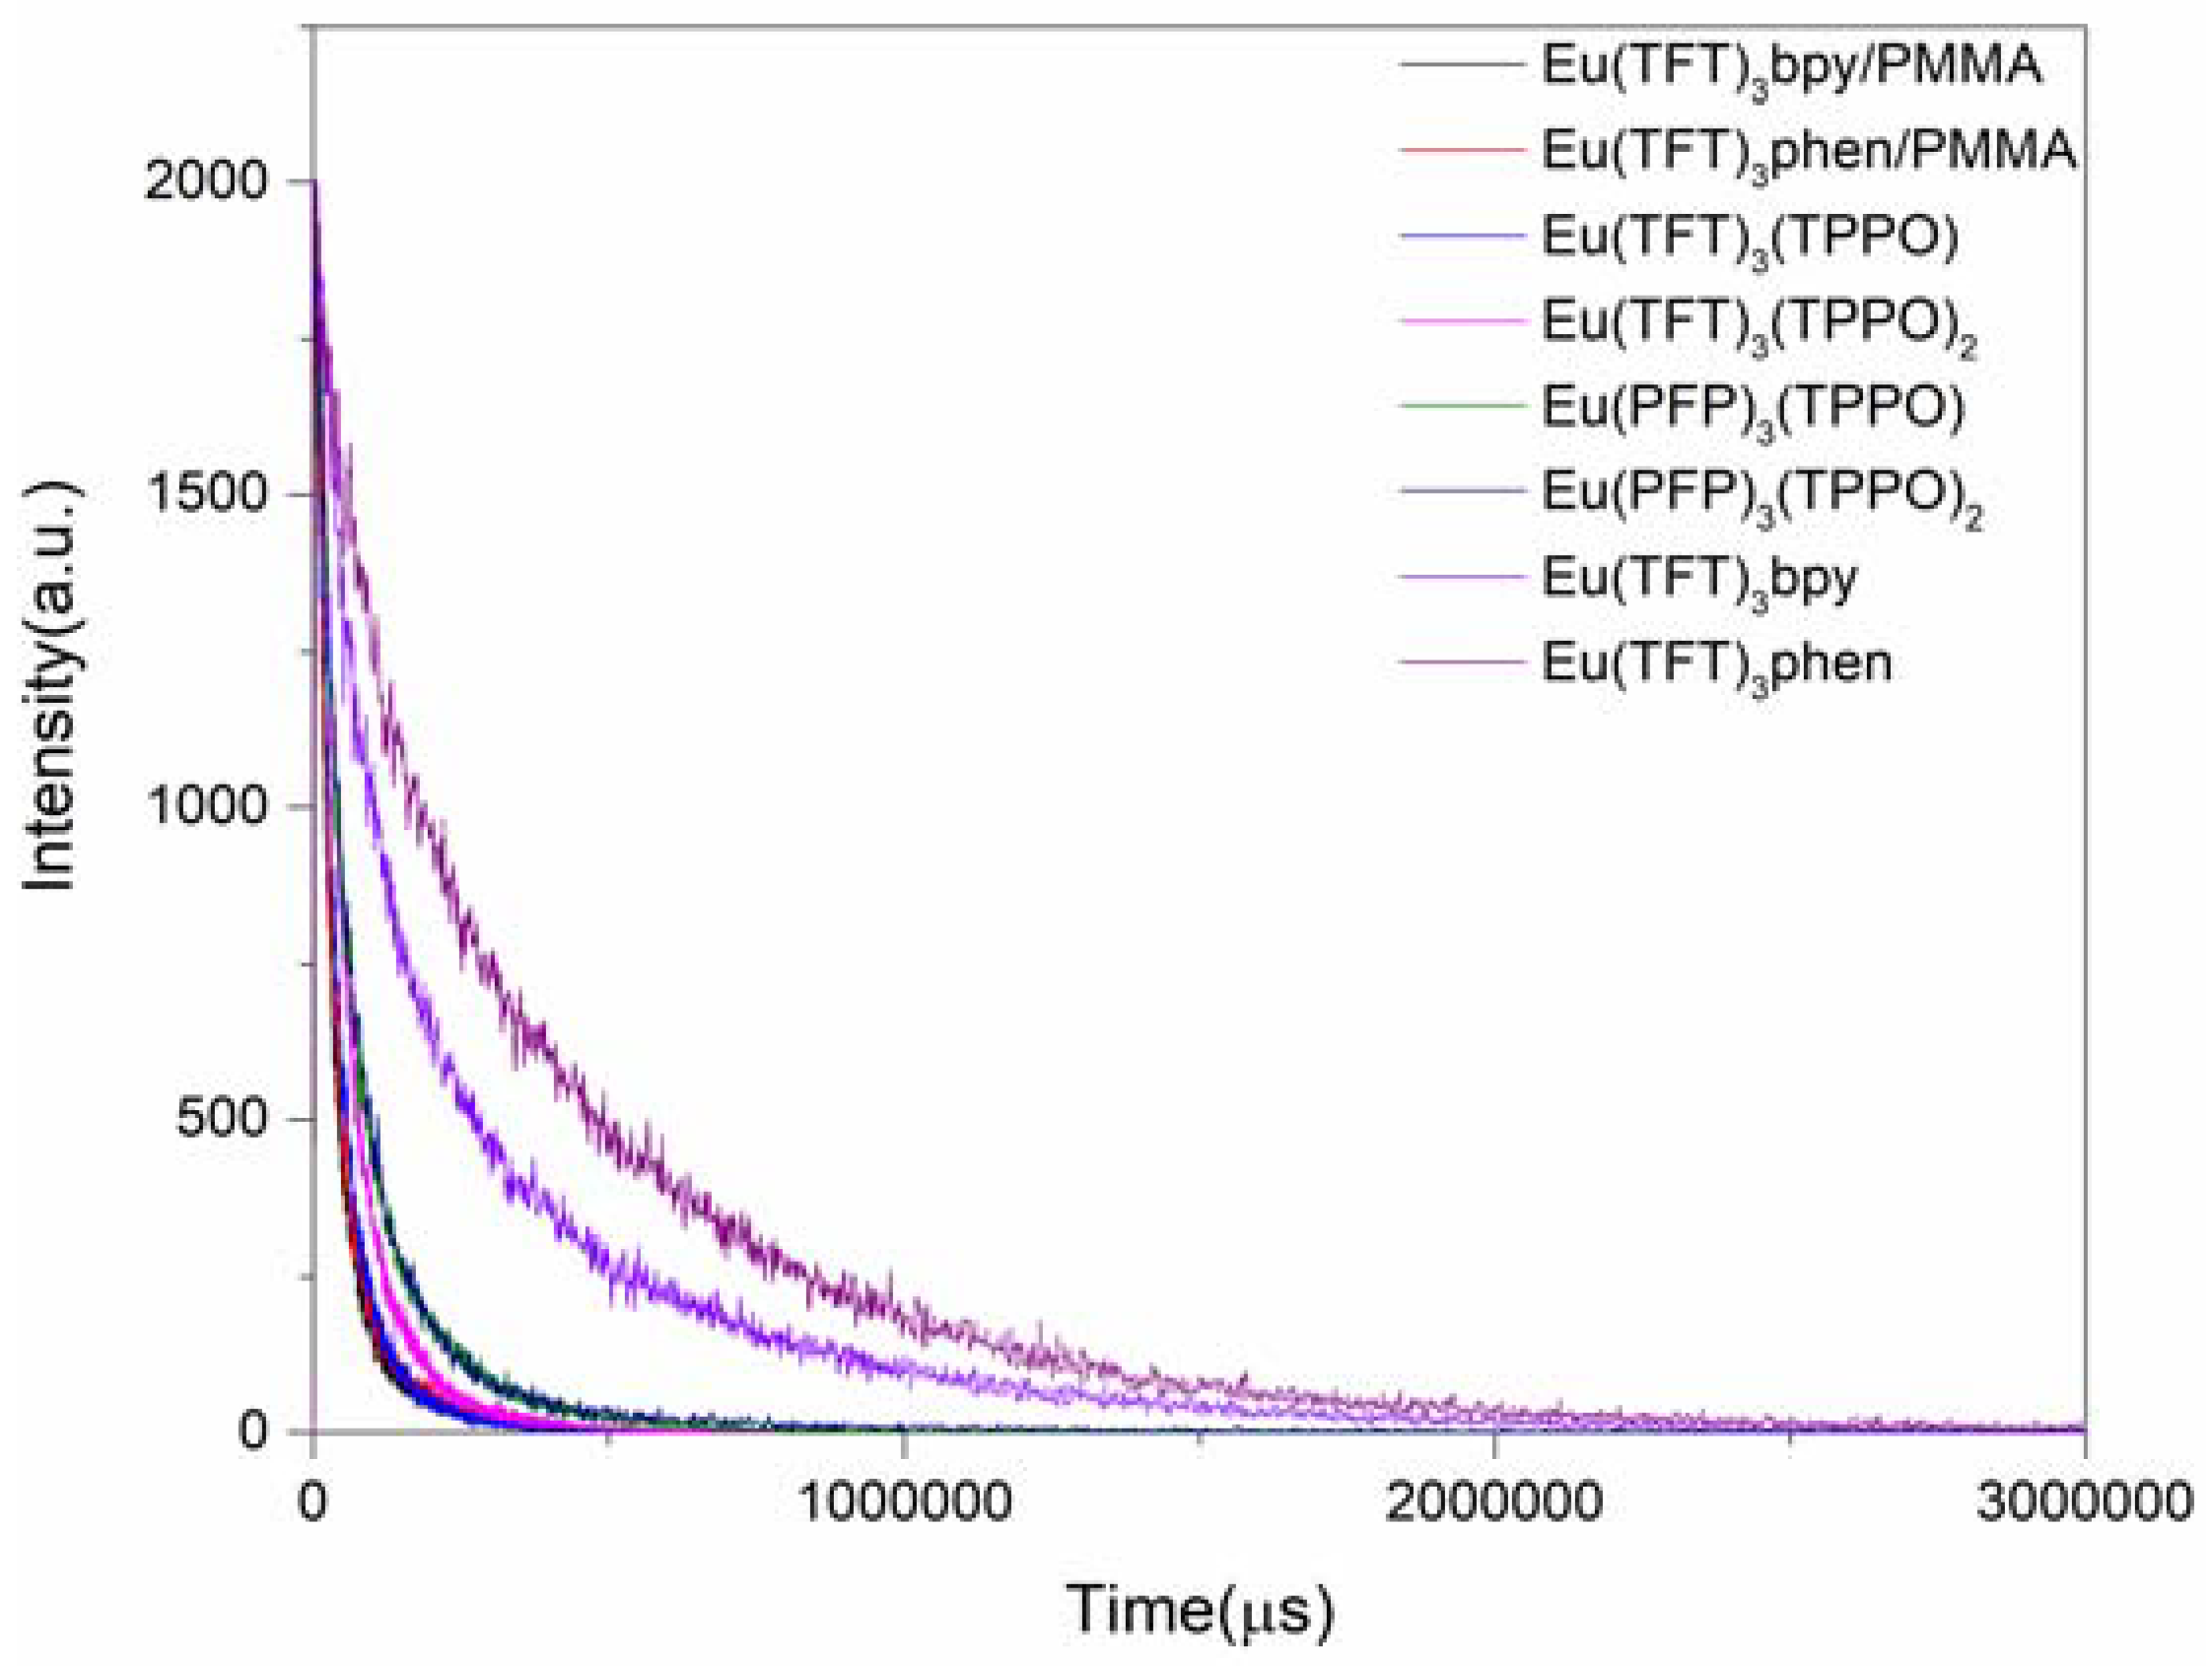
When the fluorescence lifetimes of complexes 1–6 and Eu(bpy)3bpy/PMMA, Eu(phen)3phen/PMMA were measured, it was found that the excited state molecules emitted fluorescence in the form of radiative transition to the ground state. However, there was also quenching and energy transfer between the molecules. The interaction between the molecules could accelerate the molecules of excited states back to the ground state, so the fluorescence lifetimes were reduced. The fluorescence lifetimes of the polymers were about 10−8 s, which was due to the strong aggregation-induced effect between the polymer molecules. The lifetime τ was related to the rate constant of these processes, and the rate constant k of the total withdrawal process could be expressed by the sum of the rate constants of various withdrawal processes (k = kF + ∑ki (kF: decay rate constant of various non-radiation processes); τ = 1/k = 1/(kF + ∑ki)).
When the rare earth complexes and the polymers were mixed, the fluorescence lifetime of the complex was reduced by coordinating with the polymer ligand with a high molecular weight, which consumed excessive energy. The fluorescence decay curves (Figure 12) and emission spectrums (Figure 8) of the rare earth complexes and Eu(TFT)3bpy/PMMA, Eu(TFT)3phen/PMMA showed that the coordination of PMMA and Eu(III) ions could increase the emission intensity of Eu(III) ions and increase the interaction between molecules.
The fluorescence quantum efficiencies of Eu(TFT)3phen/PMMA and Eu(TFT)3bpy/PMMA were attenuated compared to Eu(TFT)3phen and Eu(TFT)3bpy (Table A4). This is the same mechanism as the attenuation of the fluorescence lifetime of Eu(TFT)3phen/PMMA, which was mainly caused by the aggregation-induced quenching of the rare earth complexes and the polymers. However, by comparing the fluorescence lifetimes and quantum efficiencies of complexes 3–6, the fluorescence lifetimes and quantum efficiencies of the rare earth complexes could be significantly improved with an increase in the number of auxiliary ligands. This is mainly because the two TPPO molecules were better for the sensitization of the rare earth ions.
4. Conclusions
In summary, we reported the preparation of six novel eight-coordinated Eu(III) complexes. Luminescence studies revealed that TFT, PFP, PMMA, and PVP were effective sensitizers on the luminescence of Eu(III) ions due to the ligand transferring the absorbed energy effectively to the emitting level of the center metal ion. In addition, the coordination and luminescence mechanism of the rare earth complexes and the polymers were investigated. The experimental data and results showed that the polymers could be used as an auxiliary ligand to change the optical properties of the rare earth complexes. The rare earth complexes could enhance electron transition in polymer molecules. The polymers and the complexes had two strong emission peaks, such that the light color was changed. A fluorine atom could enhance the aggregation-induced effect of PMMA and PVP/complexes.
Supplementary Materials
The following are available online at https://www.mdpi.com/2073-4360/10/5/508/s1, Cif S1: CCDC 1484014-Complex 1, Cif S2: CCDC 1524434-Complex 2.
Author Contributions
Conceptualization, Y.H. and S.W.; Methodology, Y.H.; Software, H.S.; Validation, W.Z., G.Y. and H.S.; Formal Analysis, W.Z.; Investigation, S.W.; Resources, G.Y.; Data Curation, Y.H.; Writing-Original Draft Preparation, W.Z.; Writing-Review & Editing, Y.H.; Visualization, G.Y.; Supervision, S.W.; Project Administration, Y.H.; Funding Acquisition, Y.H. and S.W.
Acknowledgments
The authors are grateful to National Science Foundation of China (51773053) and Natural Science Foundation of Heilongjang Province of China (B2017010).
Conflicts of Interest
The authors declare no conflict of interest.
Appendix A
Figure A1.
1H NMR spectra of TFT.
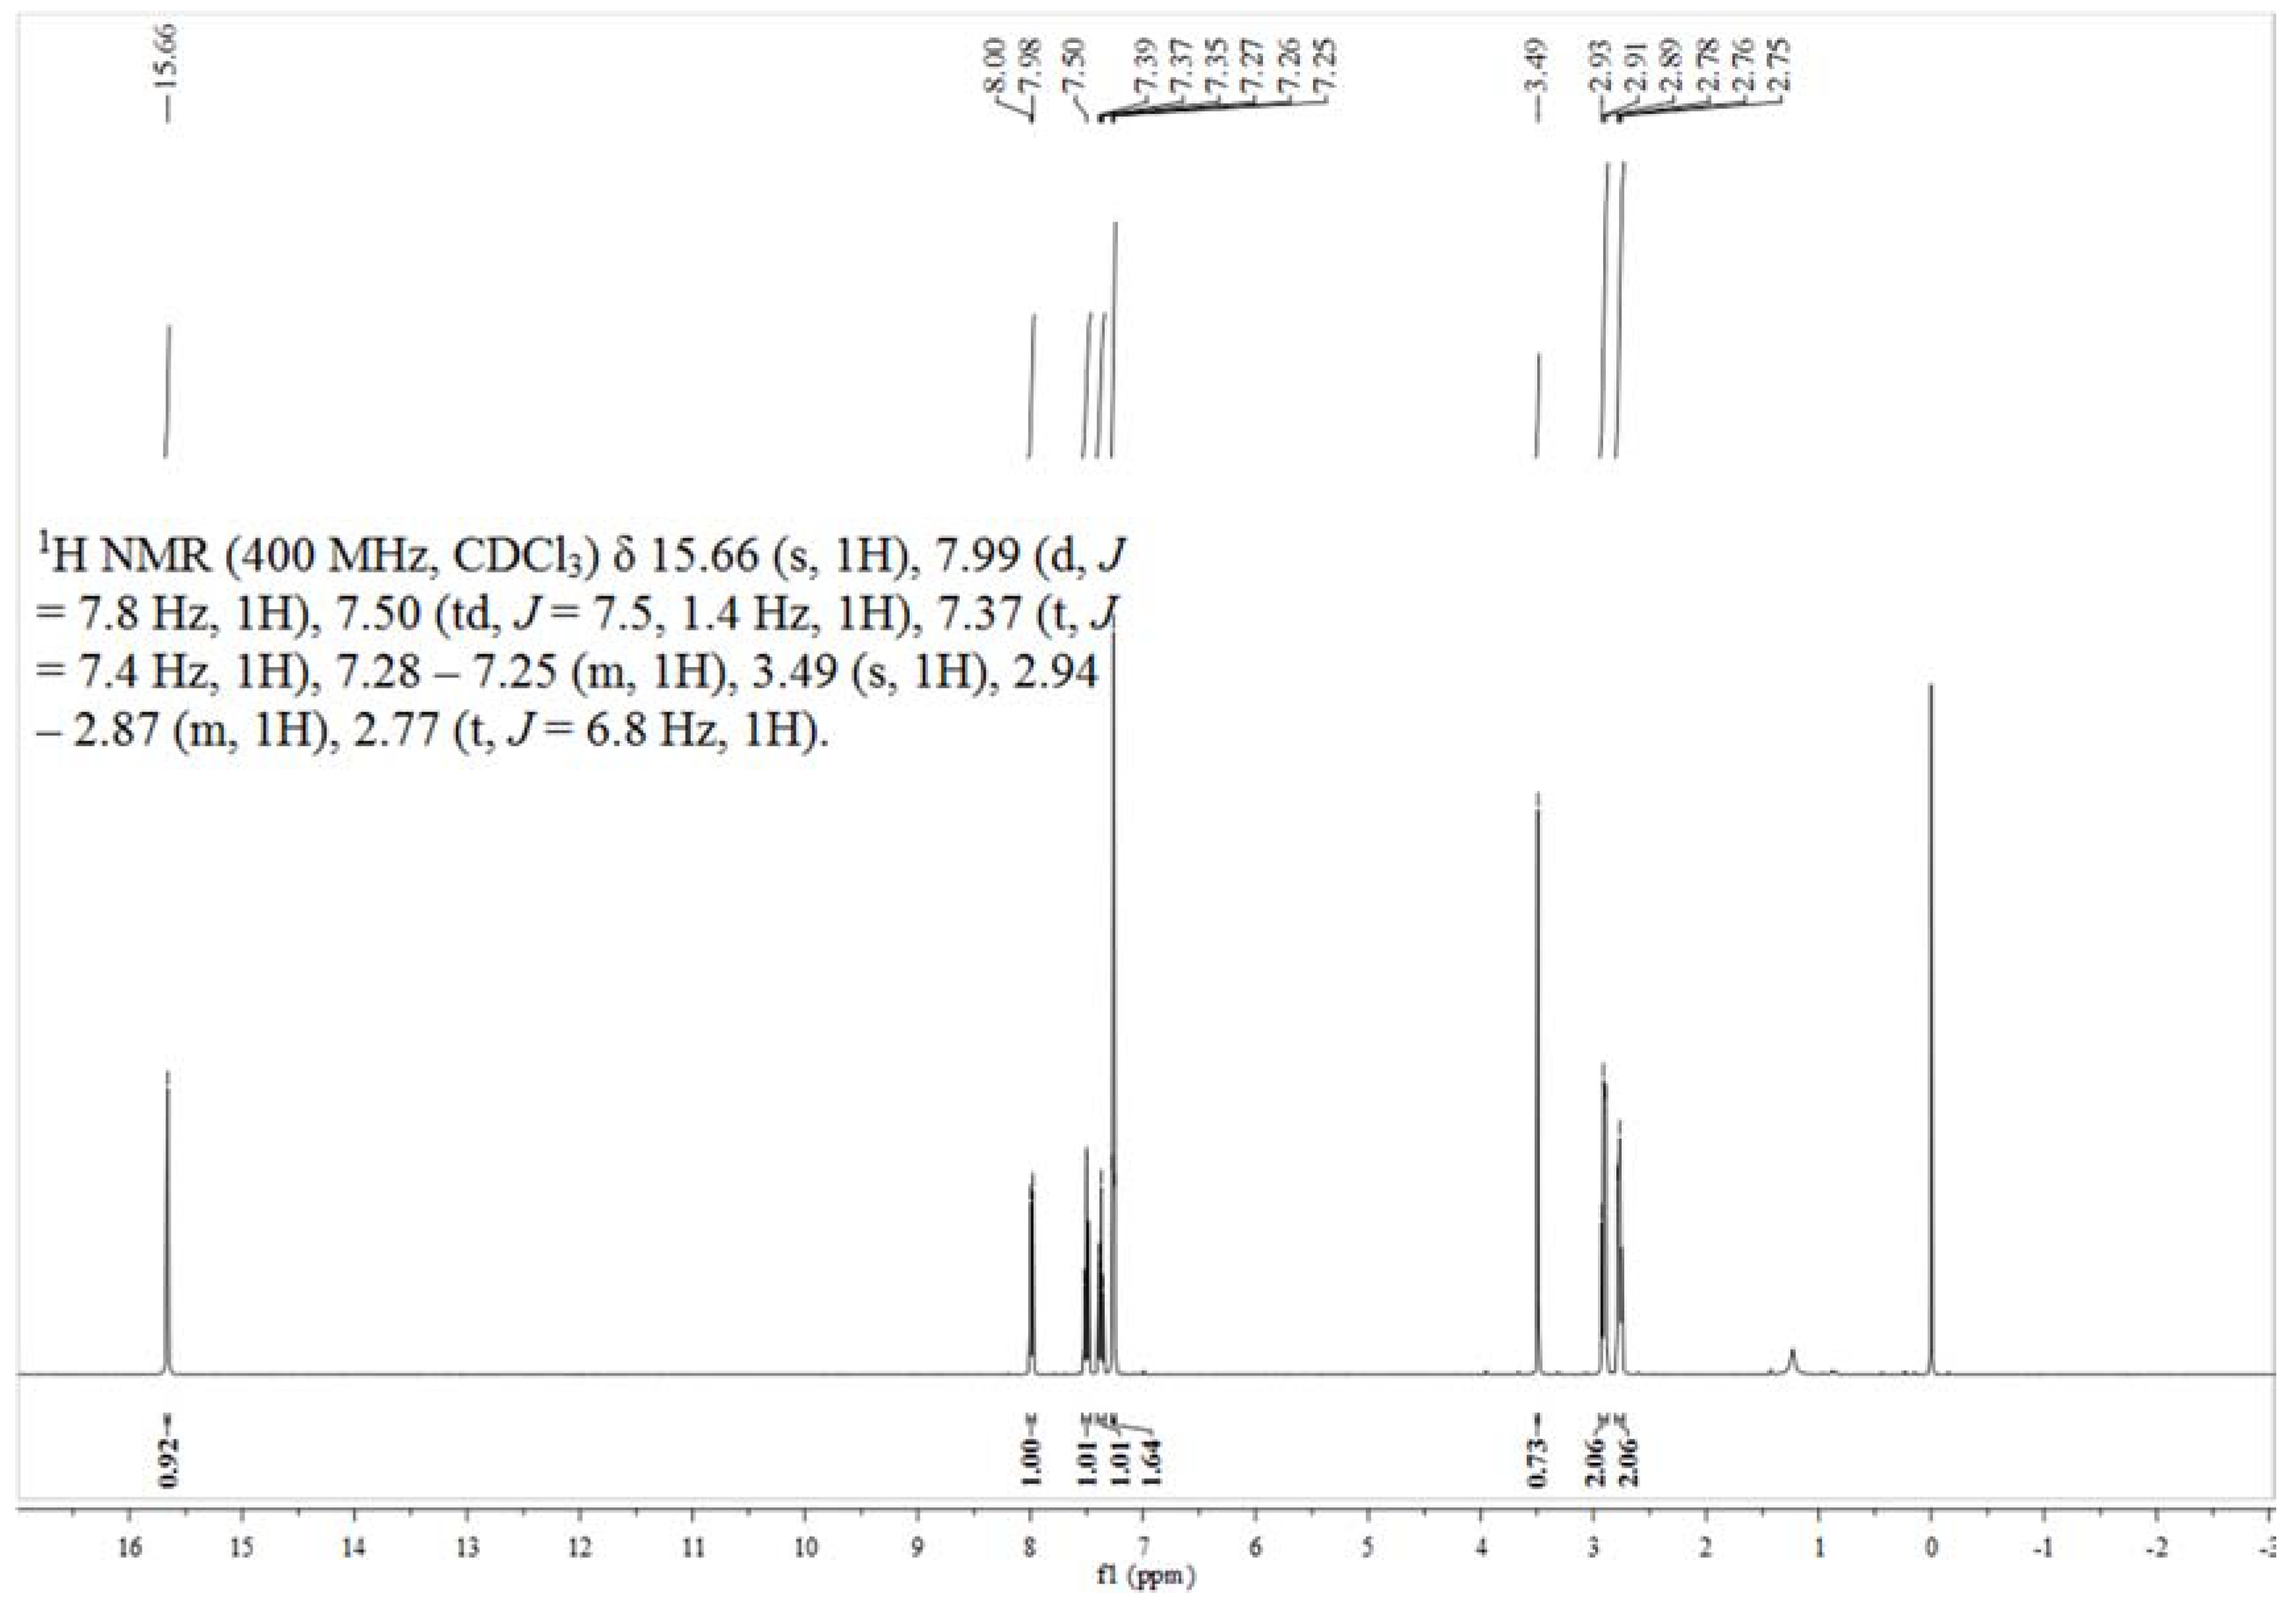
Figure A2.
1H NMR spectra of PFP.
Appendix B
Figure A3.
FTIR spectra of TFT.

Figure A4.
FTIR spectra of PFP.

Figure A5.
FTIR spectra of Eu(PFP)3TPPO.
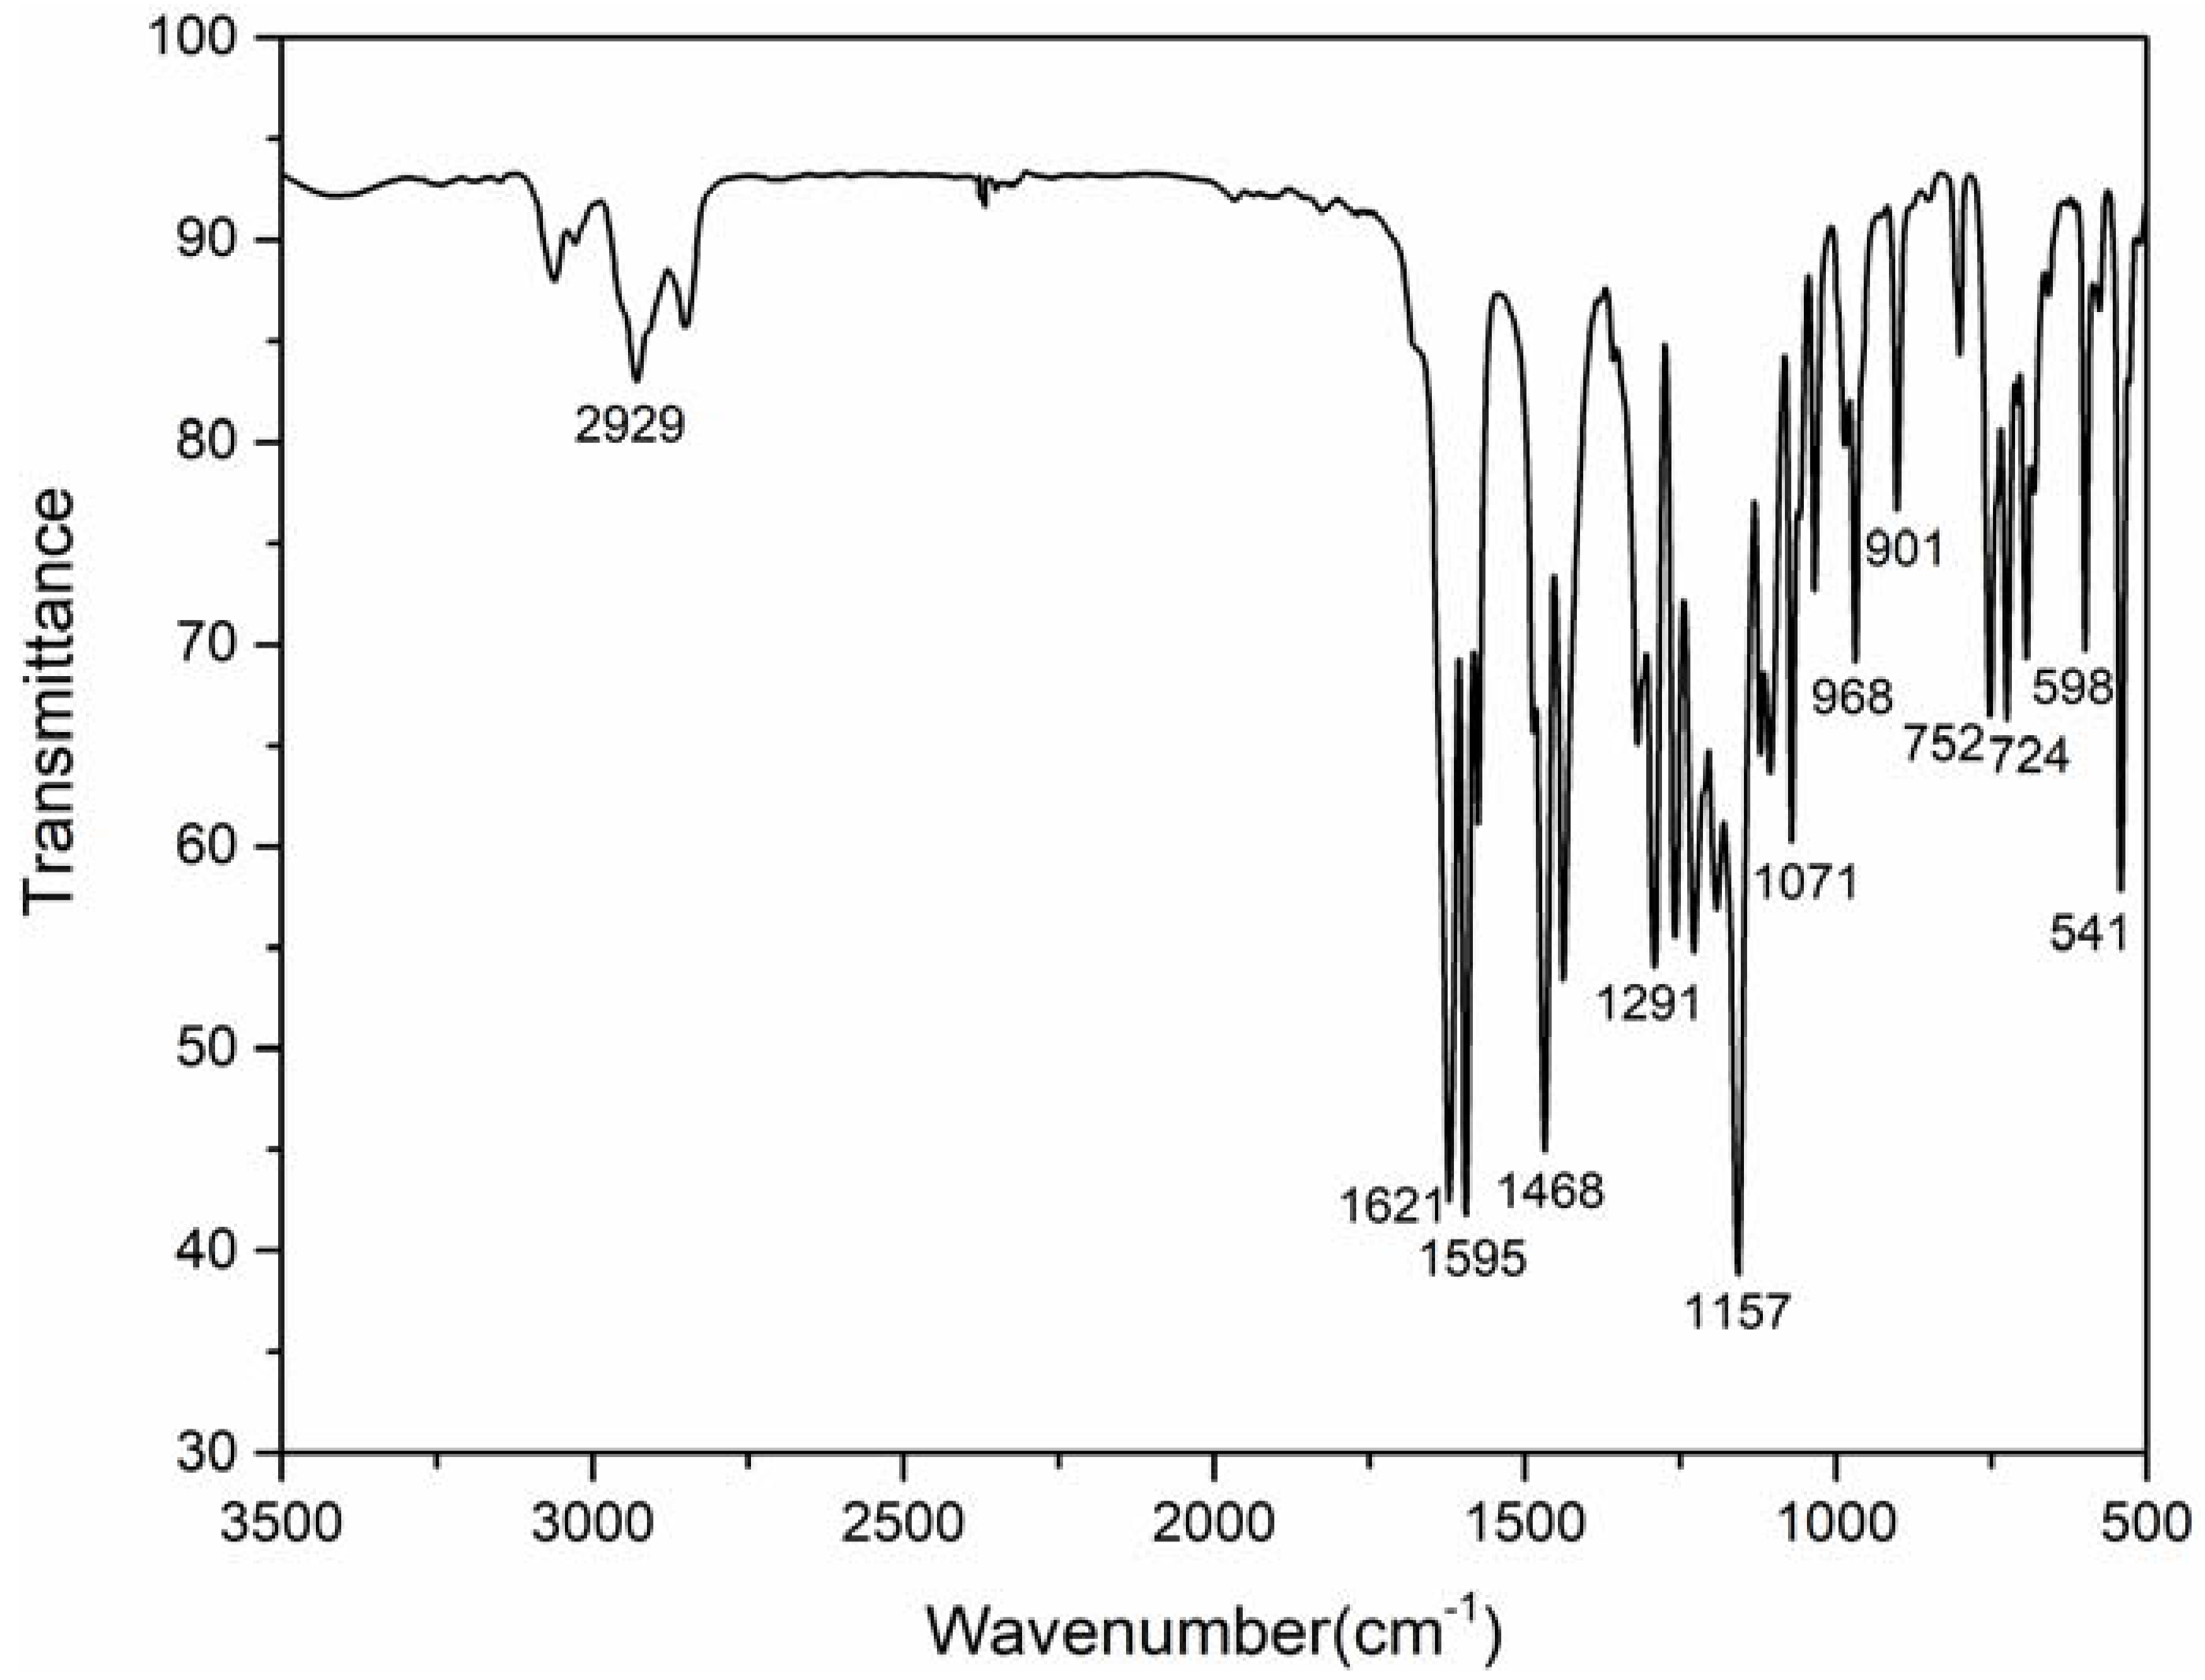
Figure A6.
FTIR spectra of Eu(PFP)3(TPPO)2.

Figure A7.
FTIR spectra of Eu(TFT)3bpy.

Figure A8.
FTIR spectra of Eu(TFT)3phen.
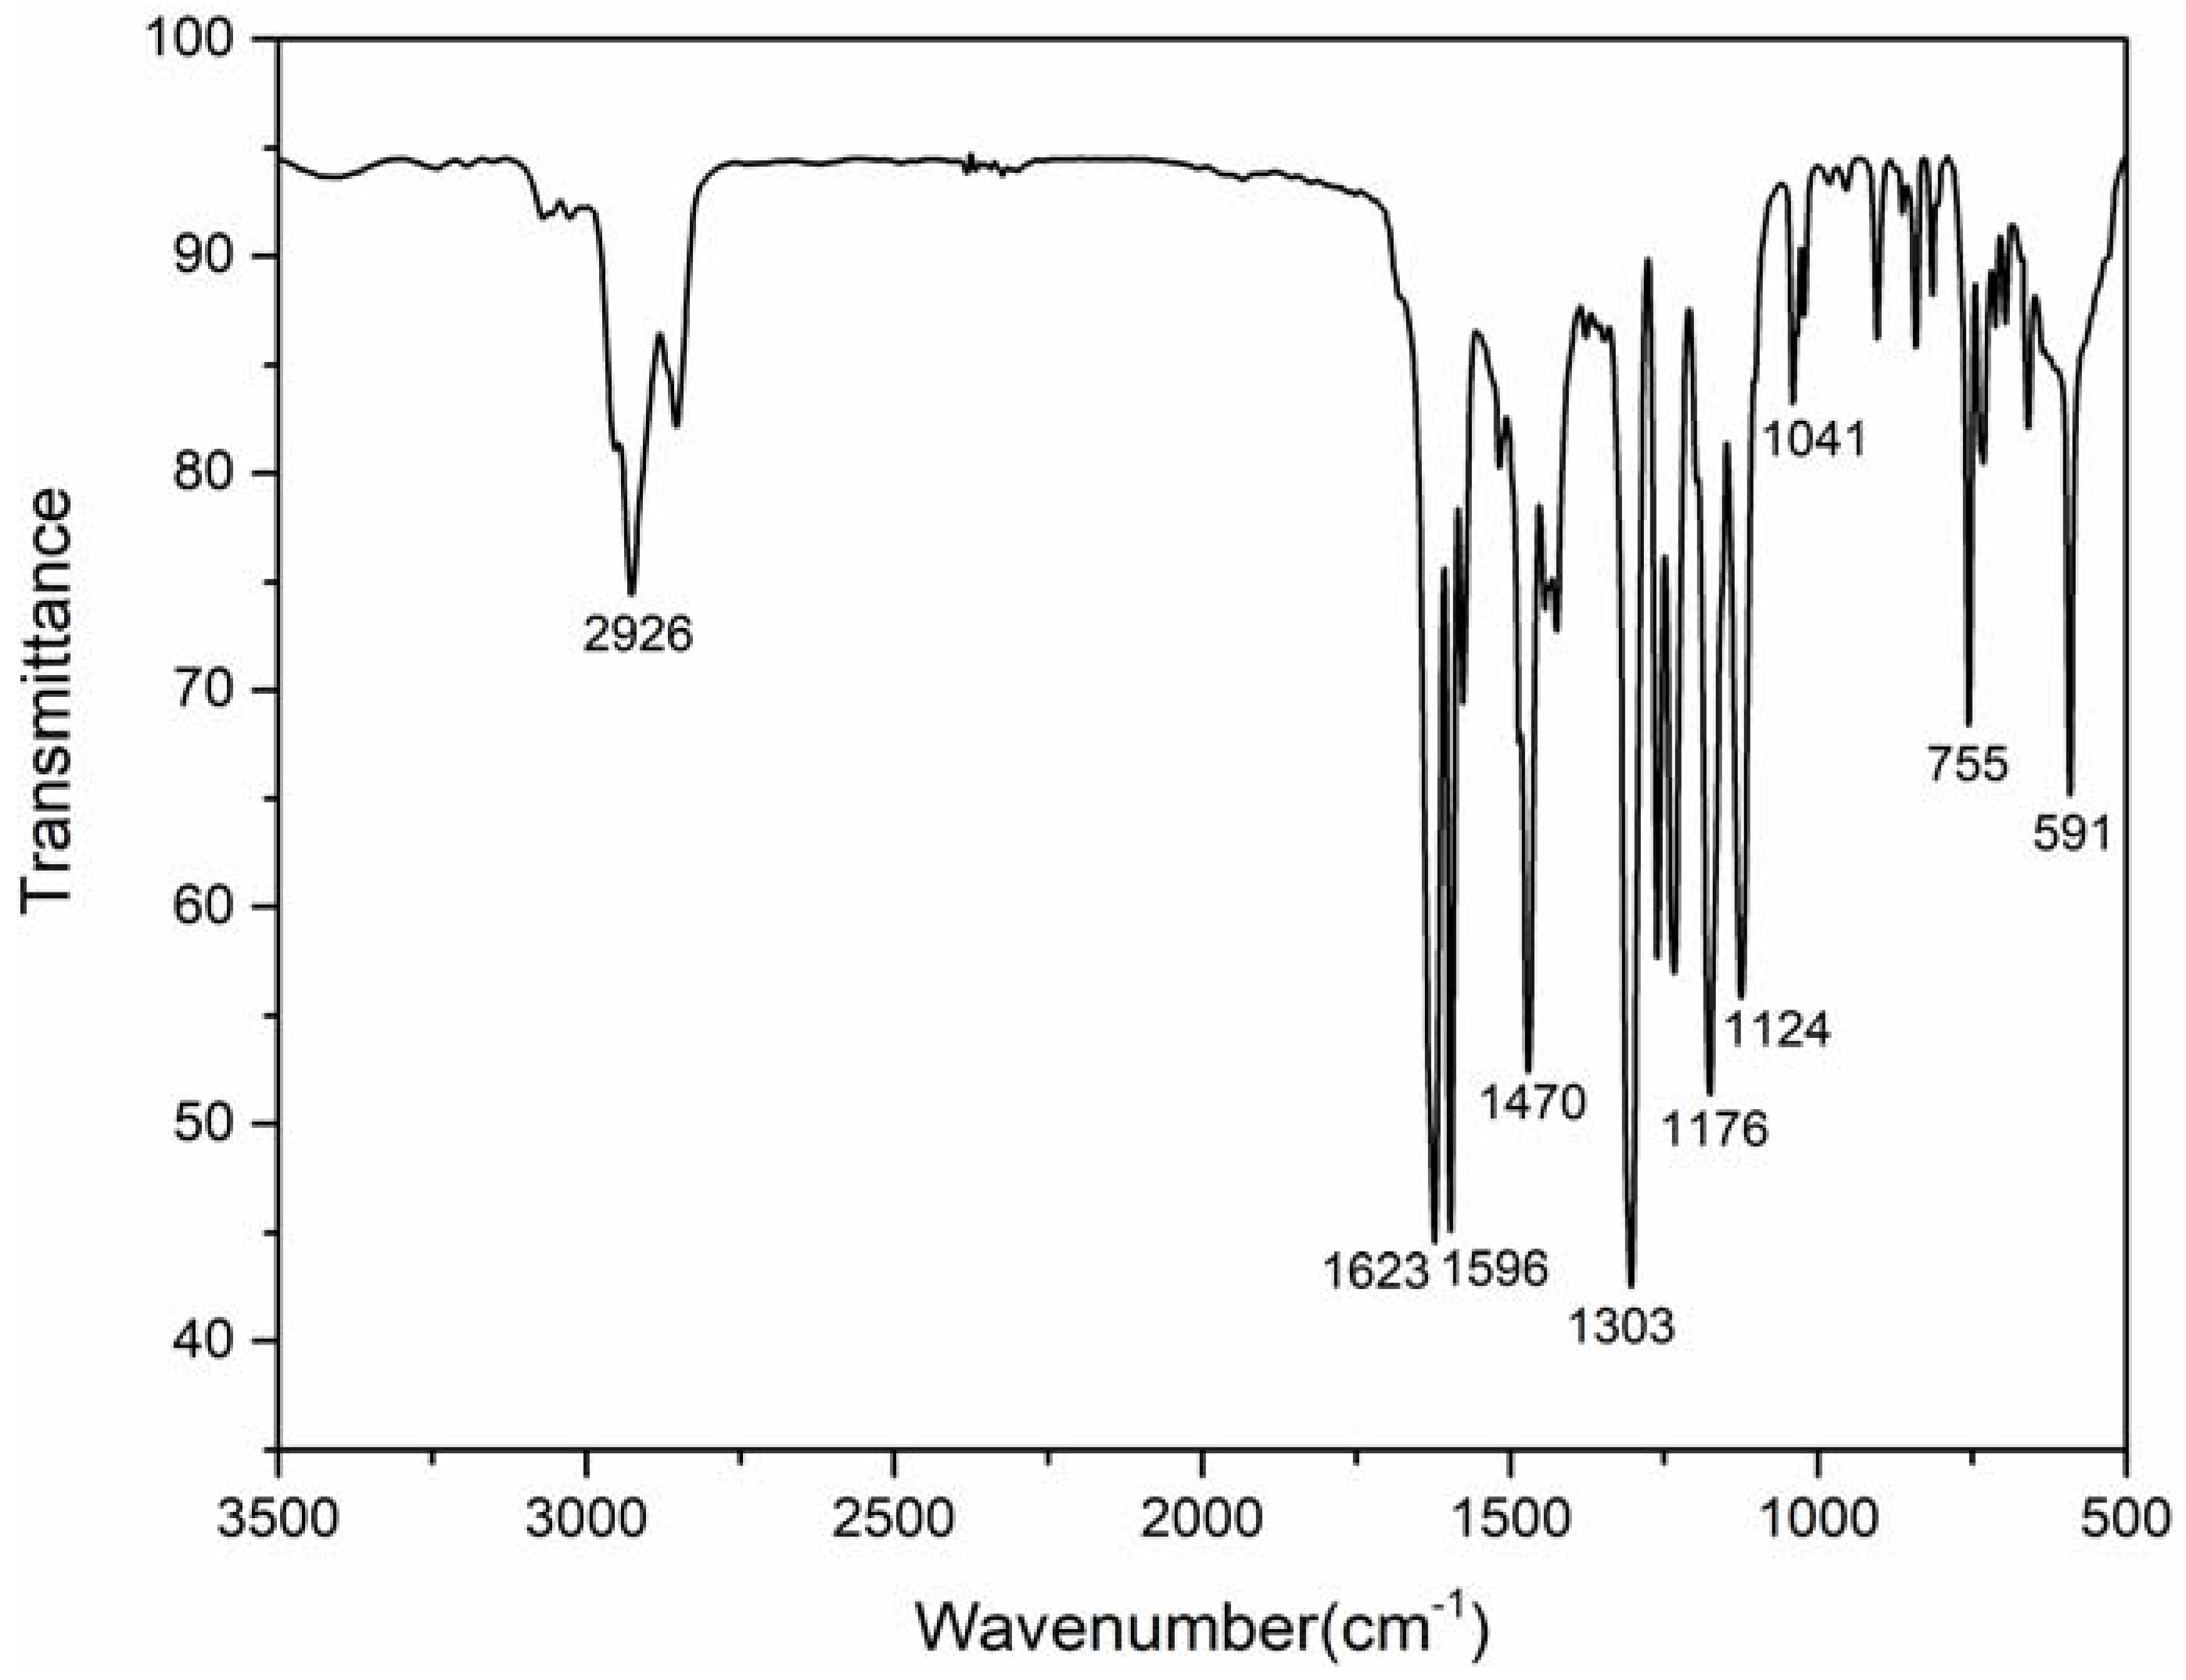
Figure A9.
FTIR spectra of Eu(TFT)3TPPO.

Figure A10.
FTIR spectra of Eu(TFT)3(TPPO)2.

Figure A11.
FTIR spectra of TFT, complexes 1 and 2, and Eu/PMMA.

Figure A12.
FTIR spectra of TFT and complex 2.

Appendix C
Figure A13.
Fluorescence spectrum of PVP/complex 3 in dimethyl formamide (DMF).

Appendix D

Table A1.
Selected bond lengths (Å) in Eu(TFT)3(phen).
| Bond Lengths | |
|---|---|
| Eu(1)-O1 | 2.347(4) |
| Eu(1)-O2 | 2.351(5) |
| Eu(1)-O3 | 2.324(4) |
| Eu(1)-O4 | 2.347(4) |
| Eu(1)-O5 | 2.354(4) |
| Eu(1)-O6 | 2.358(4) |
| Eu(1)-N1 | 2.590(5) |
| Eu(1)-N2 | 2.586(5) |
Table A2.
Selected bond lengths (Å) in Eu(TFT)3(bpy)·Hex.
| Bond Lengths | |||
|---|---|---|---|
| Eu(1)-O1 | 2.341(3) | C(3S)-C(2S) | 1.41(3) |
| Eu(1)-O2 | 2.368(3) | C(3S)-C(3S)#1 | 1.46(4) |
| Eu(1)-O3 | 2.356(3) | C(1S)-C(2S) | 1.542(9) |
| Eu(1)-O4 | 2.347(3) | ||
| Eu(1)-O5 | 2.351(3) | ||
| Eu(1)-O6 | 2.379(3) | ||
| Eu(1)-N1 | 2.576(3) | ||
| Eu(1)-N2 | 2.590(8) | ||
Table A3.
Absorptions of Eu complex 1 Calculated with the TDDFT Method.
| Sn | Confign | CI codff | E/nm (eV) | Oscillator | Assignt |
|---|---|---|---|---|---|
| S1 | H → L + 2 | 0.2898 | 277.23(4.47) | 0.1533 | ILCT/LMCT/MLCT/MC |
| S2 | H → L + 3 | 0.3316 | 275.69(4.49) | 0.3093 | ILCT |
| S3 | H-1 → L + 2 | 0.1572 | 266.16(4.66) | 0.4822 | ILCT/LMCT/MLCT/MC |
| S4 | H → L + 1 | 0.1091 | 254.70(4.87) | 0.0279 | LMCT/MLCT/MC |
| S5 | H → L | 0.1363 | 249.71(4.97) | 0.0024 | LMCT/MLCT/MC |
Table A4.
Luminescence lifetimes and quantum yields of complexes.
| Samples | τ (ms) | Фoverall (%) |
|---|---|---|
| Eu(TFT)3phen | 314 | 52.17 |
| Eu(TFT)3bpy | 172 | 48.93 |
| Eu(TFT)3phen/PMMA | 28 | 19.17 |
| Eu(TFT)3bpy/PMMA | 26 | 18.81 |
| Eu(TFT)3(TPPO) | 45.2 | 20.76 |
| Eu(TFT)3(TPPO)2 | 62.4 | 21.97 |
| Eu(PFP)3(TPPO) | 62 | 21.91 |
| Eu(PFP)3(TPPO)2 | 70 | 22.17 |
References
- Carlos, L.D.; Ferreira, R.A.; Bermudez, V.Z.; Ribeiro, S.J. Lanthanide-containing light-emitting organic-inorganic hybrids: A bet on the future. Adv. Mater. 2009, 40, 509–534. [Google Scholar] [CrossRef] [PubMed]
- Shelton, A.H.; Sazanovich, I.V.; Weinstein, J.A.; Ward, M.D. Controllable three-component luminescence from a 1,8-naphthalimide/Eu(III) complex: White light emission from a single molecule. Chem. Commun. 2012, 48, 2749–2751. [Google Scholar] [CrossRef] [PubMed]
- Bruno, S.M.; Ferreira, R.A.S.; Carlos, L.D.; Pillinger, M.; Ribeiro-Claro, P.; Goncalves, I.S. Synthesis, characterisation and luminescence properties of MCM-41 impregnated with an Eu3+, β-diketonate complex. Microporous Mesoporous Mater. 2008, 113, 453–462. [Google Scholar] [CrossRef]
- Wang, D.; Luo, Z.; Liu, Z.; Wang, D.; Fan, L.; Yin, G. Synthesis and photoluminescent properties of Eu (III) complexes with fluorinated β-diketone and nitrogen heterocyclic ligands. Dyes Pigment. 2016, 132, 398–404. [Google Scholar] [CrossRef]
- Hamblin, J.; Abboyi, N.; Lowe, M.P. A binaphthyl-containing Eu complex and its interaction with human serum albumin: A luminescence study. Chem. Commun. 2005, 5, 657–659. [Google Scholar] [CrossRef] [PubMed]
- Lv, Y.; Zhang, J.; Cao, W.; Fu, Y.; han, Z. Luminescence properties of complex Tb0.25Eu0.75(TTA)2(N-HPA)Phen. J. Alloy. Compd. 2009, 468, 406–409. [Google Scholar] [CrossRef]
- Lapaev, D.V.; Nikiforov, V.G.; Safiullin, G.M.; Lobkov, V.S.; Knyazev, A.A.; Krupin, A.S.; Galyametdinov, Y.G. Changes in luminescent properties of vitrified films of terbium(III) β-diketonate complex upon UV laser irradiation. J. Lumin. 2016, 175, 106–112. [Google Scholar] [CrossRef]
- Wang, L.; Wang, W.; Zhang, W.; Kang, E.; Huang, W. Synthesis and Luminescence Properties of Novel Eu-Containing copolymers Consisting of Eu(III)-Acrylate-β-Diketonate Complex Monomers and Methyl Methacrylate. Chem. Mater. 2000, 12, 2212–2218. [Google Scholar] [CrossRef]
- Yang, C.; Liu, S.; Xu, J.; Li, Y.; Shang, M.; Lei, L.; Wang, G.; He, J.; Wang, X.; Lu, M. Efficient red emission from poly(vinyl butyral) films doped with a novel europium complex based terpyridyl as ancillary ligand: Synthesis, structural elucidation by Sparkle/RM1 calculation, and photophysical properties. Polym. Chem. 2016, 7, 1147–1157. [Google Scholar] [CrossRef]
- Yang, C.; Xu, J.; Zhang, Y.; Li, Y.; Zheng, J.; Lianga, L.; Lu, M. Efficient monochromatic red-light-emitting PLEDs based on a series of nonconjugated Eu-polymers containing a neutral terpyridyl ligand. J. Mater. Chem. C 2013, 1, 4885–4901. [Google Scholar] [CrossRef]
- Yang, C.; Xu, J.; Ma, J.; Zhu, D.; Zhang, Y.; Lianga, L.; Lu, M. An efficient long fluorescence lifetime polymer-based sensor based on europium complex as chromophore for the specific detection of F−, CH3COO−, and H2PO4−. Polym. Chem. 2012, 3, 2640–2648. [Google Scholar] [CrossRef]
- Cai, J.; Niu, H.; Wang, C.; Ma, L.; Bai, X.; Wang, W. Tuning the bandgaps of polyazomethines containing triphenylamine by different linkage sites of dialdhyde monomers. Electrochim. Acta 2012, 76, 229–241. [Google Scholar] [CrossRef]
- And, J.S.Y.; Swager, T.M. Fluorescent Porous Polymer Films as TNT Chemosensors: Electronic and Structural Effects. J. Am. Chem. Soc. 2017, 120, 11864–11873. [Google Scholar]
- Li, W.; Tao, Y.; An, G.; Yan, P.; Li, Y.; Li, G. One-dimensional luminescent composite nanofibers of Eu(TFI)3TPPO/PVP prepared by electrospinning. Dyes Pigment. 2017, 146, 47–53. [Google Scholar] [CrossRef]
- Zhang, X.; Wen, S.; Hu, S.; Chen, Q.; Fong, H.; Zhang, L.; Liu, L. Luminescence Properties of Eu(III) Complex/Polyvinylpyrrolidone Electrospun Composite Nanofibers. J. Phys. Chem. C 2013, 114, 3898–3903. [Google Scholar] [CrossRef]
- Miller, R.D.; Hofer, D.; Rabolt, J.; Fickes, G.N. Anomalously long-wavelength electronic transition in conformationally locked organosilane high polymers. J. Am. Chem. Soc. 2002, 107, 2172–2174. [Google Scholar] [CrossRef]
- Jiang, B.; Yang, S.W.; Bailey, S.L.; Hermans, L.G.; Niver, R.A.; Bolcar, M.A.; Jones, W.E., Jr. Toward transparent molecular wires: Electron and energy transfer in transition metal derivatized conducting polymers. Coord. Chem. Rev. 1998, 171, 365–386. [Google Scholar] [CrossRef]
- Taydakov, I.V.; Akkuzina, A.A.; Avetisov, R.I.; Khomyakov, A.V.; Saifutyarov, R.R.; Avetissov, I.C. Effective electroluminescent materials for OLED applications based on lanthanide 1,3-diketonates bearing pyrazole moiety. J. Lumin. 2016, 177, 31–39. [Google Scholar] [CrossRef]
- Zhai, L.; Zhang, F.; Sun, J.; Liu, M.; Sun, M.; Lu, R. New non-traditional oranogelator of β-diketone-boron difluoride complexes with terminal tetraphenylethene: Self-assembling and fluorescent sensory properties towards amines. Dyes Pigment. 2017, 145, 54–62. [Google Scholar] [CrossRef]
- Zhang, X.; Lu, R.; Jia, J.; Liu, X.; Xue, P.; Xu, D.; Zhou, H. Organogel based on β-diketone-boron difluoride without alkyl chain and H-bonding unit directed by optimally balanced π-π interaction. Chem. Commun. 2010, 46, 8419–8421. [Google Scholar] [CrossRef] [PubMed]
- Pereira, C.C.; Dias, S.; Coutinho, I.; Leal, J.P.; Branco, L.C.; Laia, C.A. Europium(III) tetrakis(beta-diketonate) complex as an ionic liquid: A calorimetric and spectroscopic study. Inorg. Chem. 2013, 52, 3755–3764. [Google Scholar] [CrossRef] [PubMed]
- Melby, L.R.; Rose, N.J.; Abramson, E.; Caris, J.C. Synthesis and Fluorescence of Some Trivalent Lanthanide Complexes. J. Am. Chem. Soc. 1964, 86, 5117–5125. [Google Scholar] [CrossRef]
- Armelao, L.; Quici, S.; Barigelletti, F.; Accorsi, G.; Bottaro, G.; Cavazzini, M.; Tondello, E. Design of luminescent lanthanide complexes: From molecules to highly efficient photo-emitting materials. Coord. Chem. Rev. 2010, 254, 487–505. [Google Scholar] [CrossRef]
- Han, Y.; Yan, P.; Sun, J.; An, G.; Yao, X.; Li, Y.; Li, G. Luminescence and white-light emitting luminescent sensor of tetrafluoroterephthalate-lanthanide metal-organic frameworks. Dalton Trans. 2017, 46, 4642–4653. [Google Scholar] [CrossRef] [PubMed]
- Wang, D.; Pi, Y.; Liu, H.; Wei, X.; Hu, Y.; Zheng, J. Synthesis and spectroscopic behavior of highly luminescent trinuclear europium complexes with tris-β-diketone ligand. J. Alloy. Compd. 2014, 613, 13–17. [Google Scholar] [CrossRef]
- Congiu, M.; Alamiry, M.; Moudam, O.; Ciorba, S.; Richardson, P.R.; Maron, L.; Jones, A.C.; Richards, B.S.; Robertson, N. Preparation and photophysical studies of [Ln(hfac)3DPEPO], Ln = Eu, Tb, Yb, Nd, Gd; interpretation of total photoluminescence quantum yields. Dalton Trans. 2013, 42, 13537–13545. [Google Scholar] [CrossRef] [PubMed]
- Divya, V.; Sankar, V.; Raghu, K.G.; Reddy, M.L. A mitochondria-specific visible-light sensitized europium beta-diketonate complex with red emission. Dalton Trans. 2013, 42, 12317–12323. [Google Scholar] [CrossRef] [PubMed]
- Xu, H.; Hu, H.C.; Cao, C.S.; Zhao, B. Lanthanide organic framework as a regenerable luminescent probe for Fe3+. Inorg. Chem. 2015, 54, 4585–4587. [Google Scholar] [CrossRef] [PubMed]
- Ma, X.; Li, X.; Yue, C.; Jin, L.P. Highly Thermostable One-Dimensional Lanthanide(III) Coordination Polymers Constructed from Benzimidazole-5,6-dicarboxylic Acid and 1,10-Phenanthroline: Synthesis, Structure, and Tunable White-Light Emission. Cryst. Growth Des. 2012, 12, 5227–5232. [Google Scholar] [CrossRef]
- Freund, C.; Porzio, W.; Giovanella, U.; Vignali, F.; Pasini, M.; Destri, S. Thiophene based europium β-diketonate complexes: Effect of the ligand structure on the emission quantum yield. Inorg. Chem. 2011, 50, 5417–5429. [Google Scholar] [CrossRef] [PubMed]
- Singh, A.K.; Singh, S.K.; Mishra, H.; Prakash, R.; Rai, S.B. Structural, Thermal, and Fluorescence Properties of Eu (DBM)3Phenx Complex Doped in PMMA. J. Phys. Chem. B 2010, 114, 13042–13051. [Google Scholar] [CrossRef] [PubMed]
- Biju, S.; Freire, R.O.; Eom, Y.K.; Scopelliti, R.; Bünzli, J.C.; Kim, H.K. A EuIII tetrakis (β-diketonate) dimeric complex: Photophysical properties, structural elucidation by sparkle/AM1 calculations, and doping into PMMA films and nanowires. Inorg. Chem. 2014, 53, 8407–8417. [Google Scholar] [CrossRef] [PubMed]
- Aromí, G.; Gamez, P.; Reedijk, J. Poly beta-diketones: Prime ligands to generate supramolecular metalloclusters. Coord. Chem. Rev. 2008, 252, 964–989. [Google Scholar]
- Hou, Z.; Li, G.; Lian, H.; Lin, J. One-dimensional luminescent materials derived from the electrospinning process: Preparation, characteristics and application. J. Mater Chem. 2012, 22, 5254–5276. [Google Scholar] [CrossRef]
Scheme 1.
Structures of compounds 2-(2,2,2-trifluoroethyl)-1-tetralone (TFT) and 2-(2,2,3,3,3-Pentafluoropro-panoyl)-3,4-dihydronaphthalen-1(2H)-one (PFP).
Scheme 1.
Structures of compounds 2-(2,2,2-trifluoroethyl)-1-tetralone (TFT) and 2-(2,2,3,3,3-Pentafluoropro-panoyl)-3,4-dihydronaphthalen-1(2H)-one (PFP).

Scheme 2.
Syntheses of complexes 1–4.
Scheme 3.
Syntheses of complexes 5 and 6.

Scheme 4.
Structures of complexes 1–6.
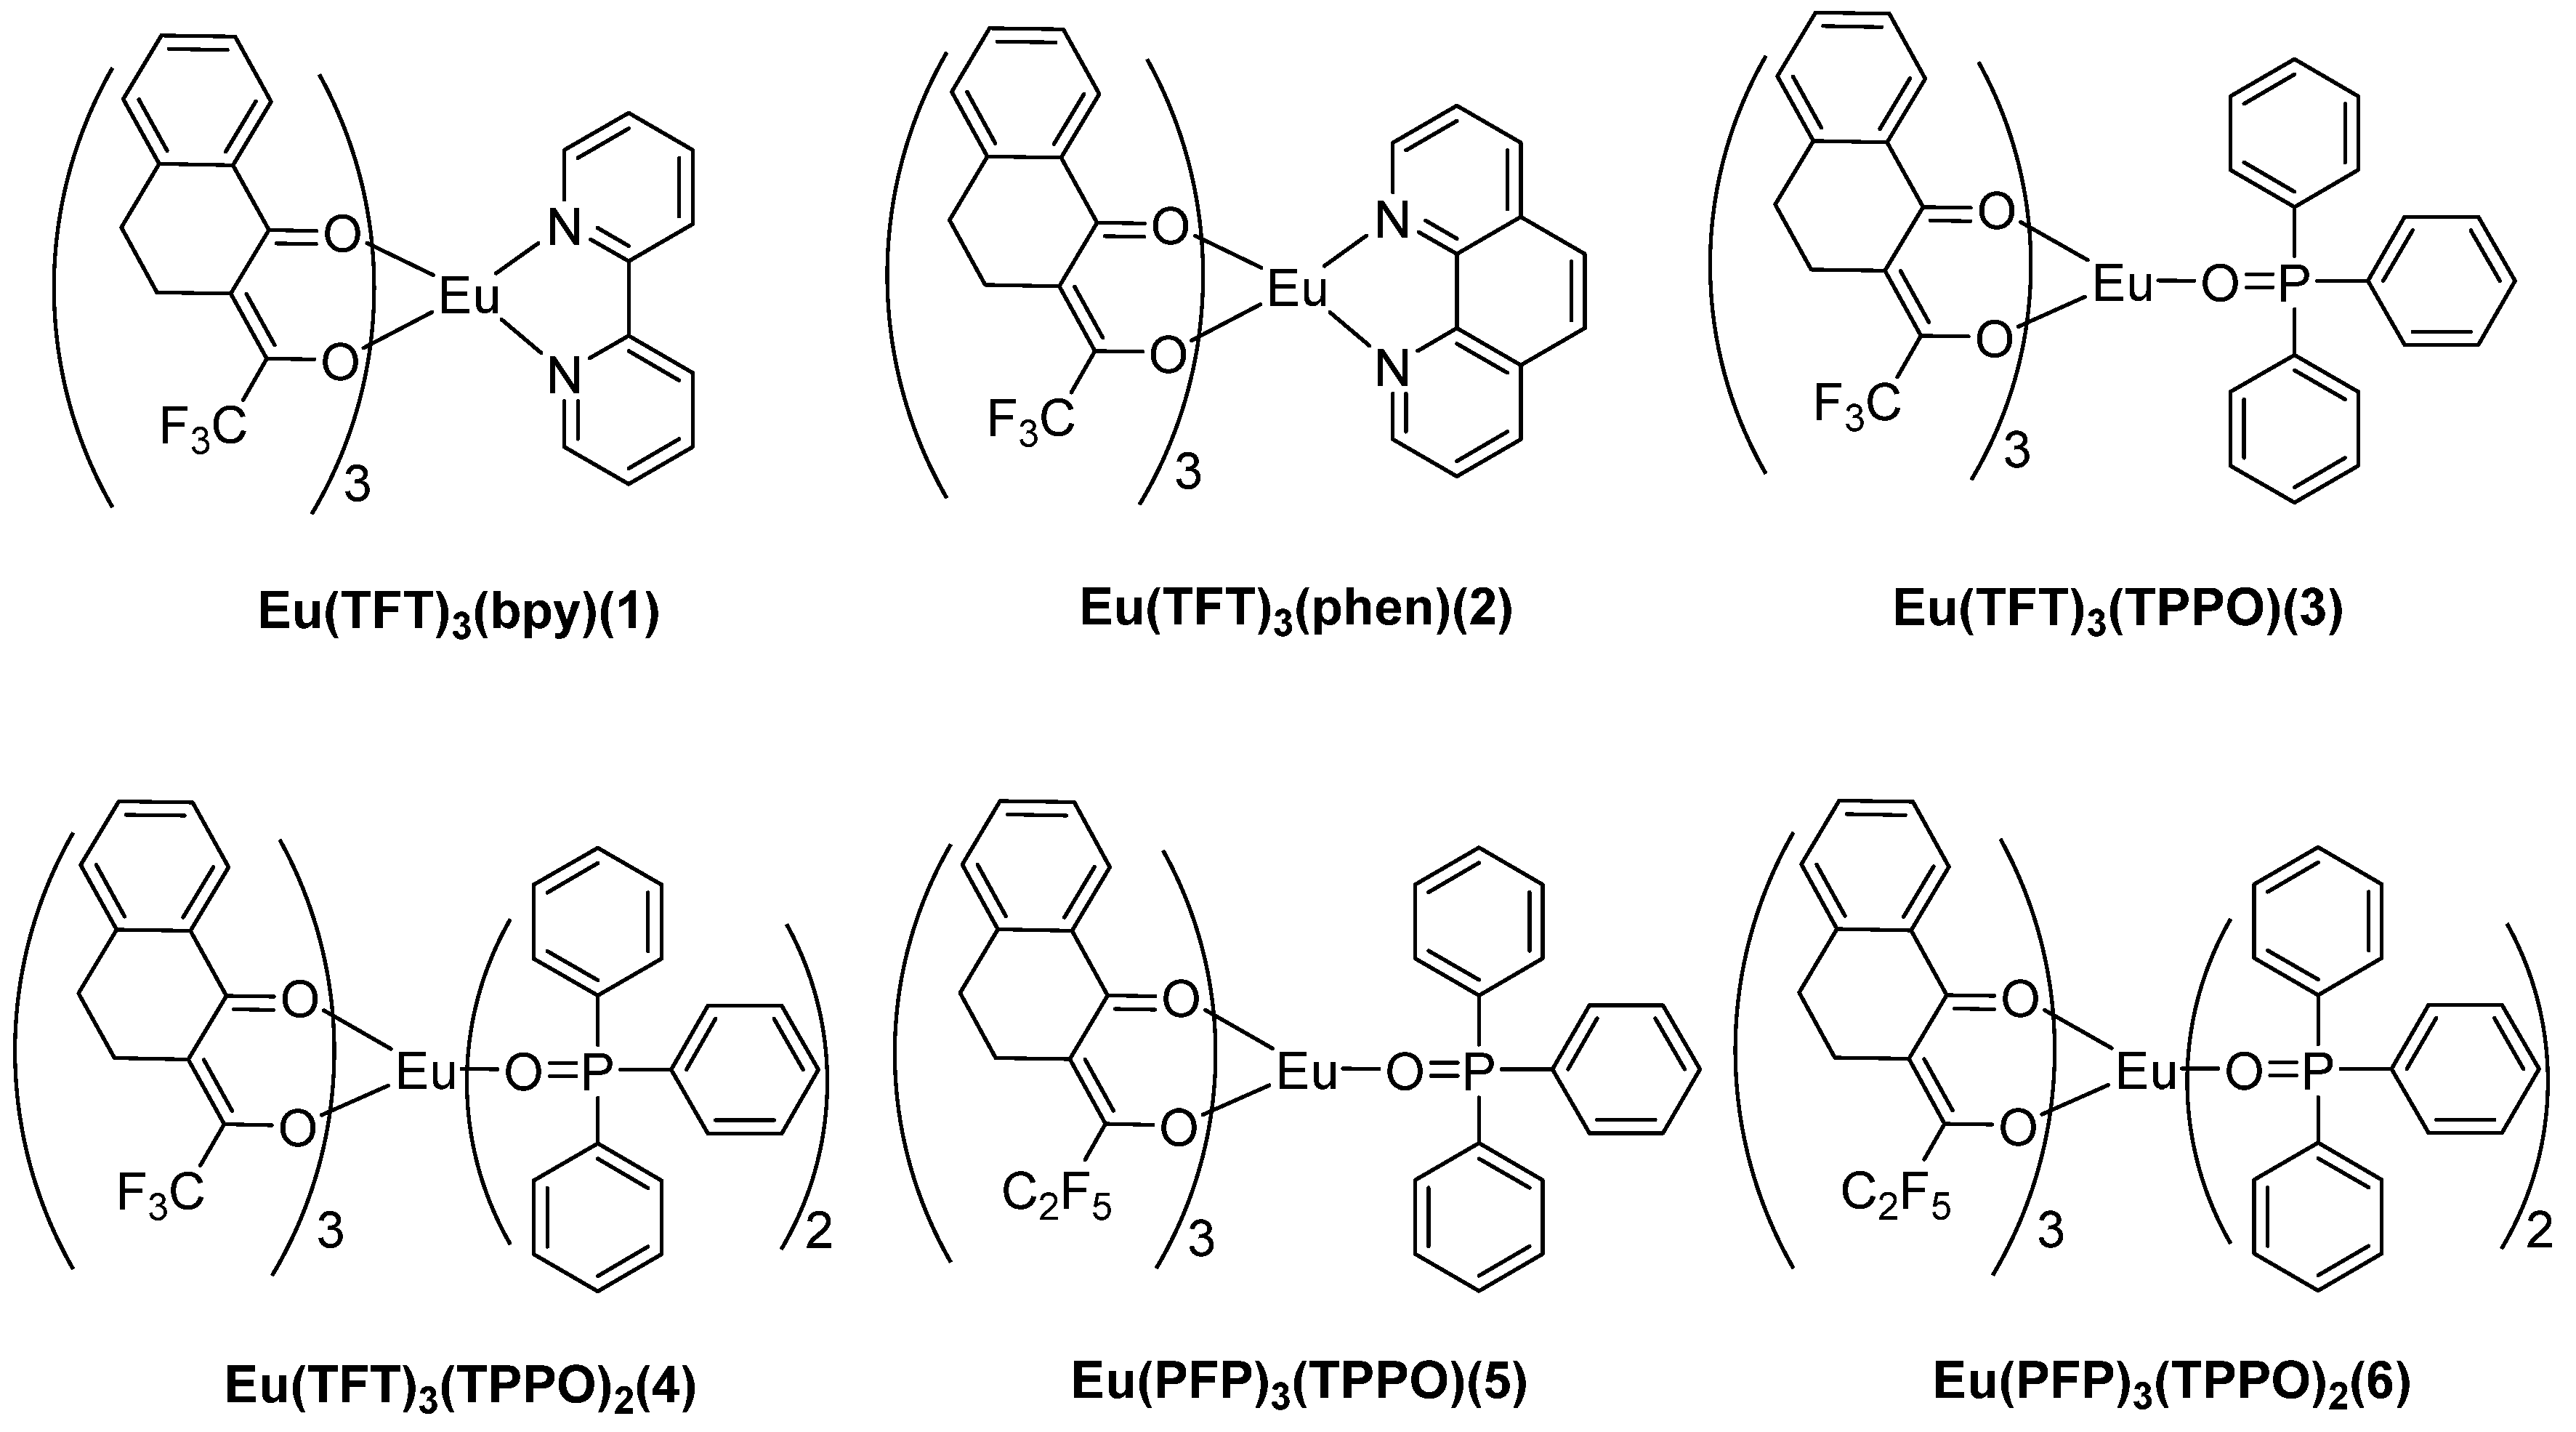
Figure 1.
FTIR spectra of TFT, Eu(TFT)3(phen)/polymethyl methacrylate (PMMA) and complexes 2–4.

Figure 2.
Molecular structure for Eu(TFT)3(phen) (a) and Eu(TFT)3 (bpy)·1/2Hex (b).

Figure 3.
SEM images of the composite nanofibers of Eu(TFT)3phen/PMMA (a,b), Eu(TFT)3bpy/PMMA (c,d).
Figure 3.
SEM images of the composite nanofibers of Eu(TFT)3phen/PMMA (a,b), Eu(TFT)3bpy/PMMA (c,d).

Figure 4.
The fluorescence microscope images of Eu(TFT)3phen/PMMA (a) and Eu(TFT)3bpy/PMMA (b) composite nanofibers.
Figure 4.
The fluorescence microscope images of Eu(TFT)3phen/PMMA (a) and Eu(TFT)3bpy/PMMA (b) composite nanofibers.
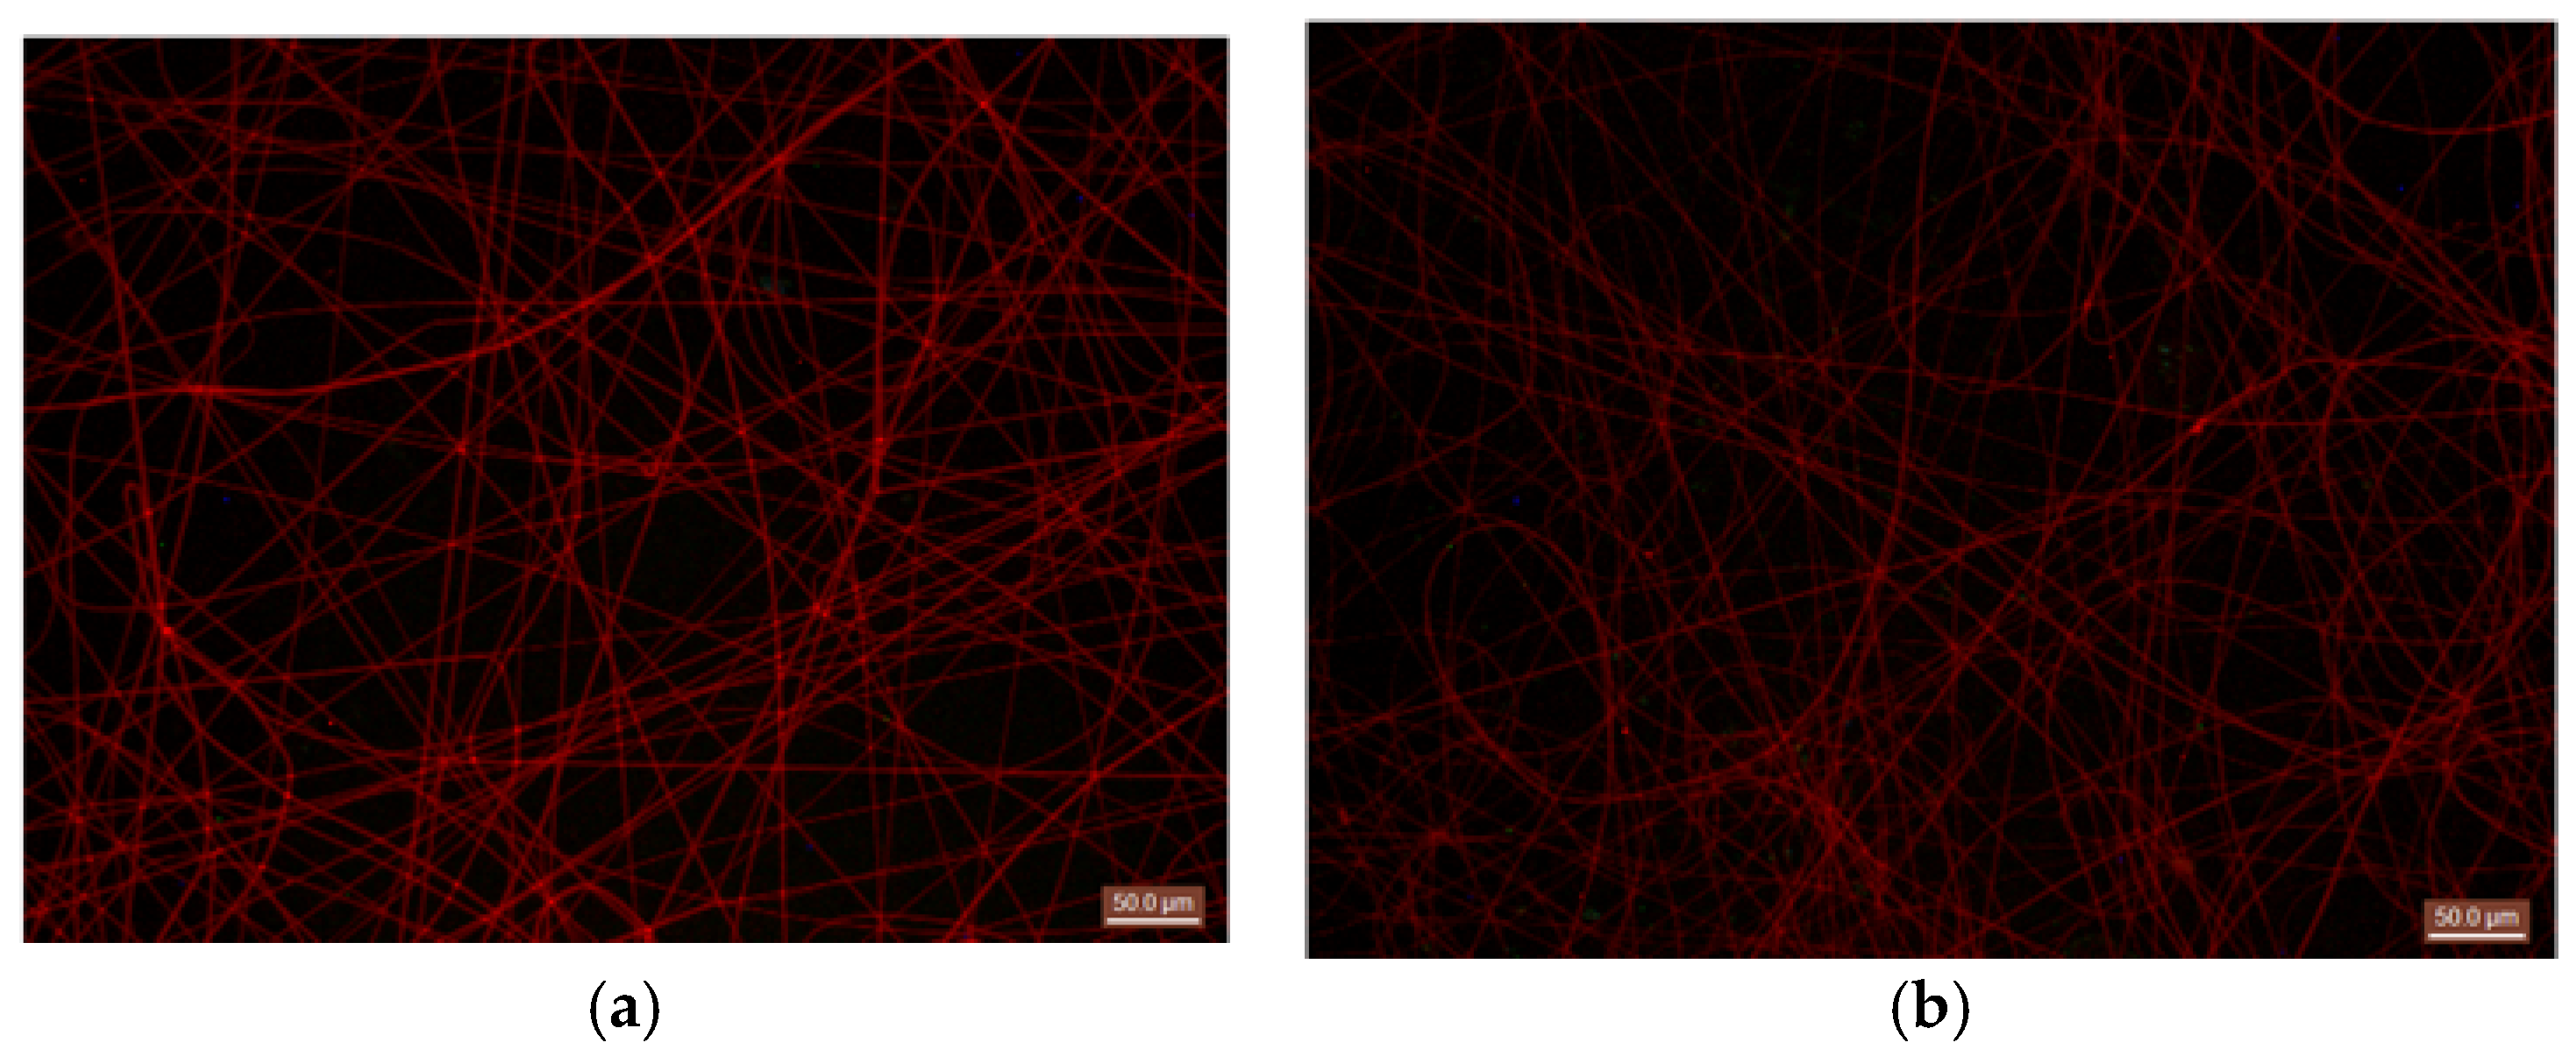
Figure 5.
UV–Vis absorption spectra of complexes 1 and 2 and TFT, Na(TFT), phen, bpy in the CH3CN solution in the UV–Vis spectrum.
Figure 5.
UV–Vis absorption spectra of complexes 1 and 2 and TFT, Na(TFT), phen, bpy in the CH3CN solution in the UV–Vis spectrum.

Figure 6.
Spatial plots of the selected frontier molecular orbits of the excited states of complex 1.
Figure 6.
Spatial plots of the selected frontier molecular orbits of the excited states of complex 1.
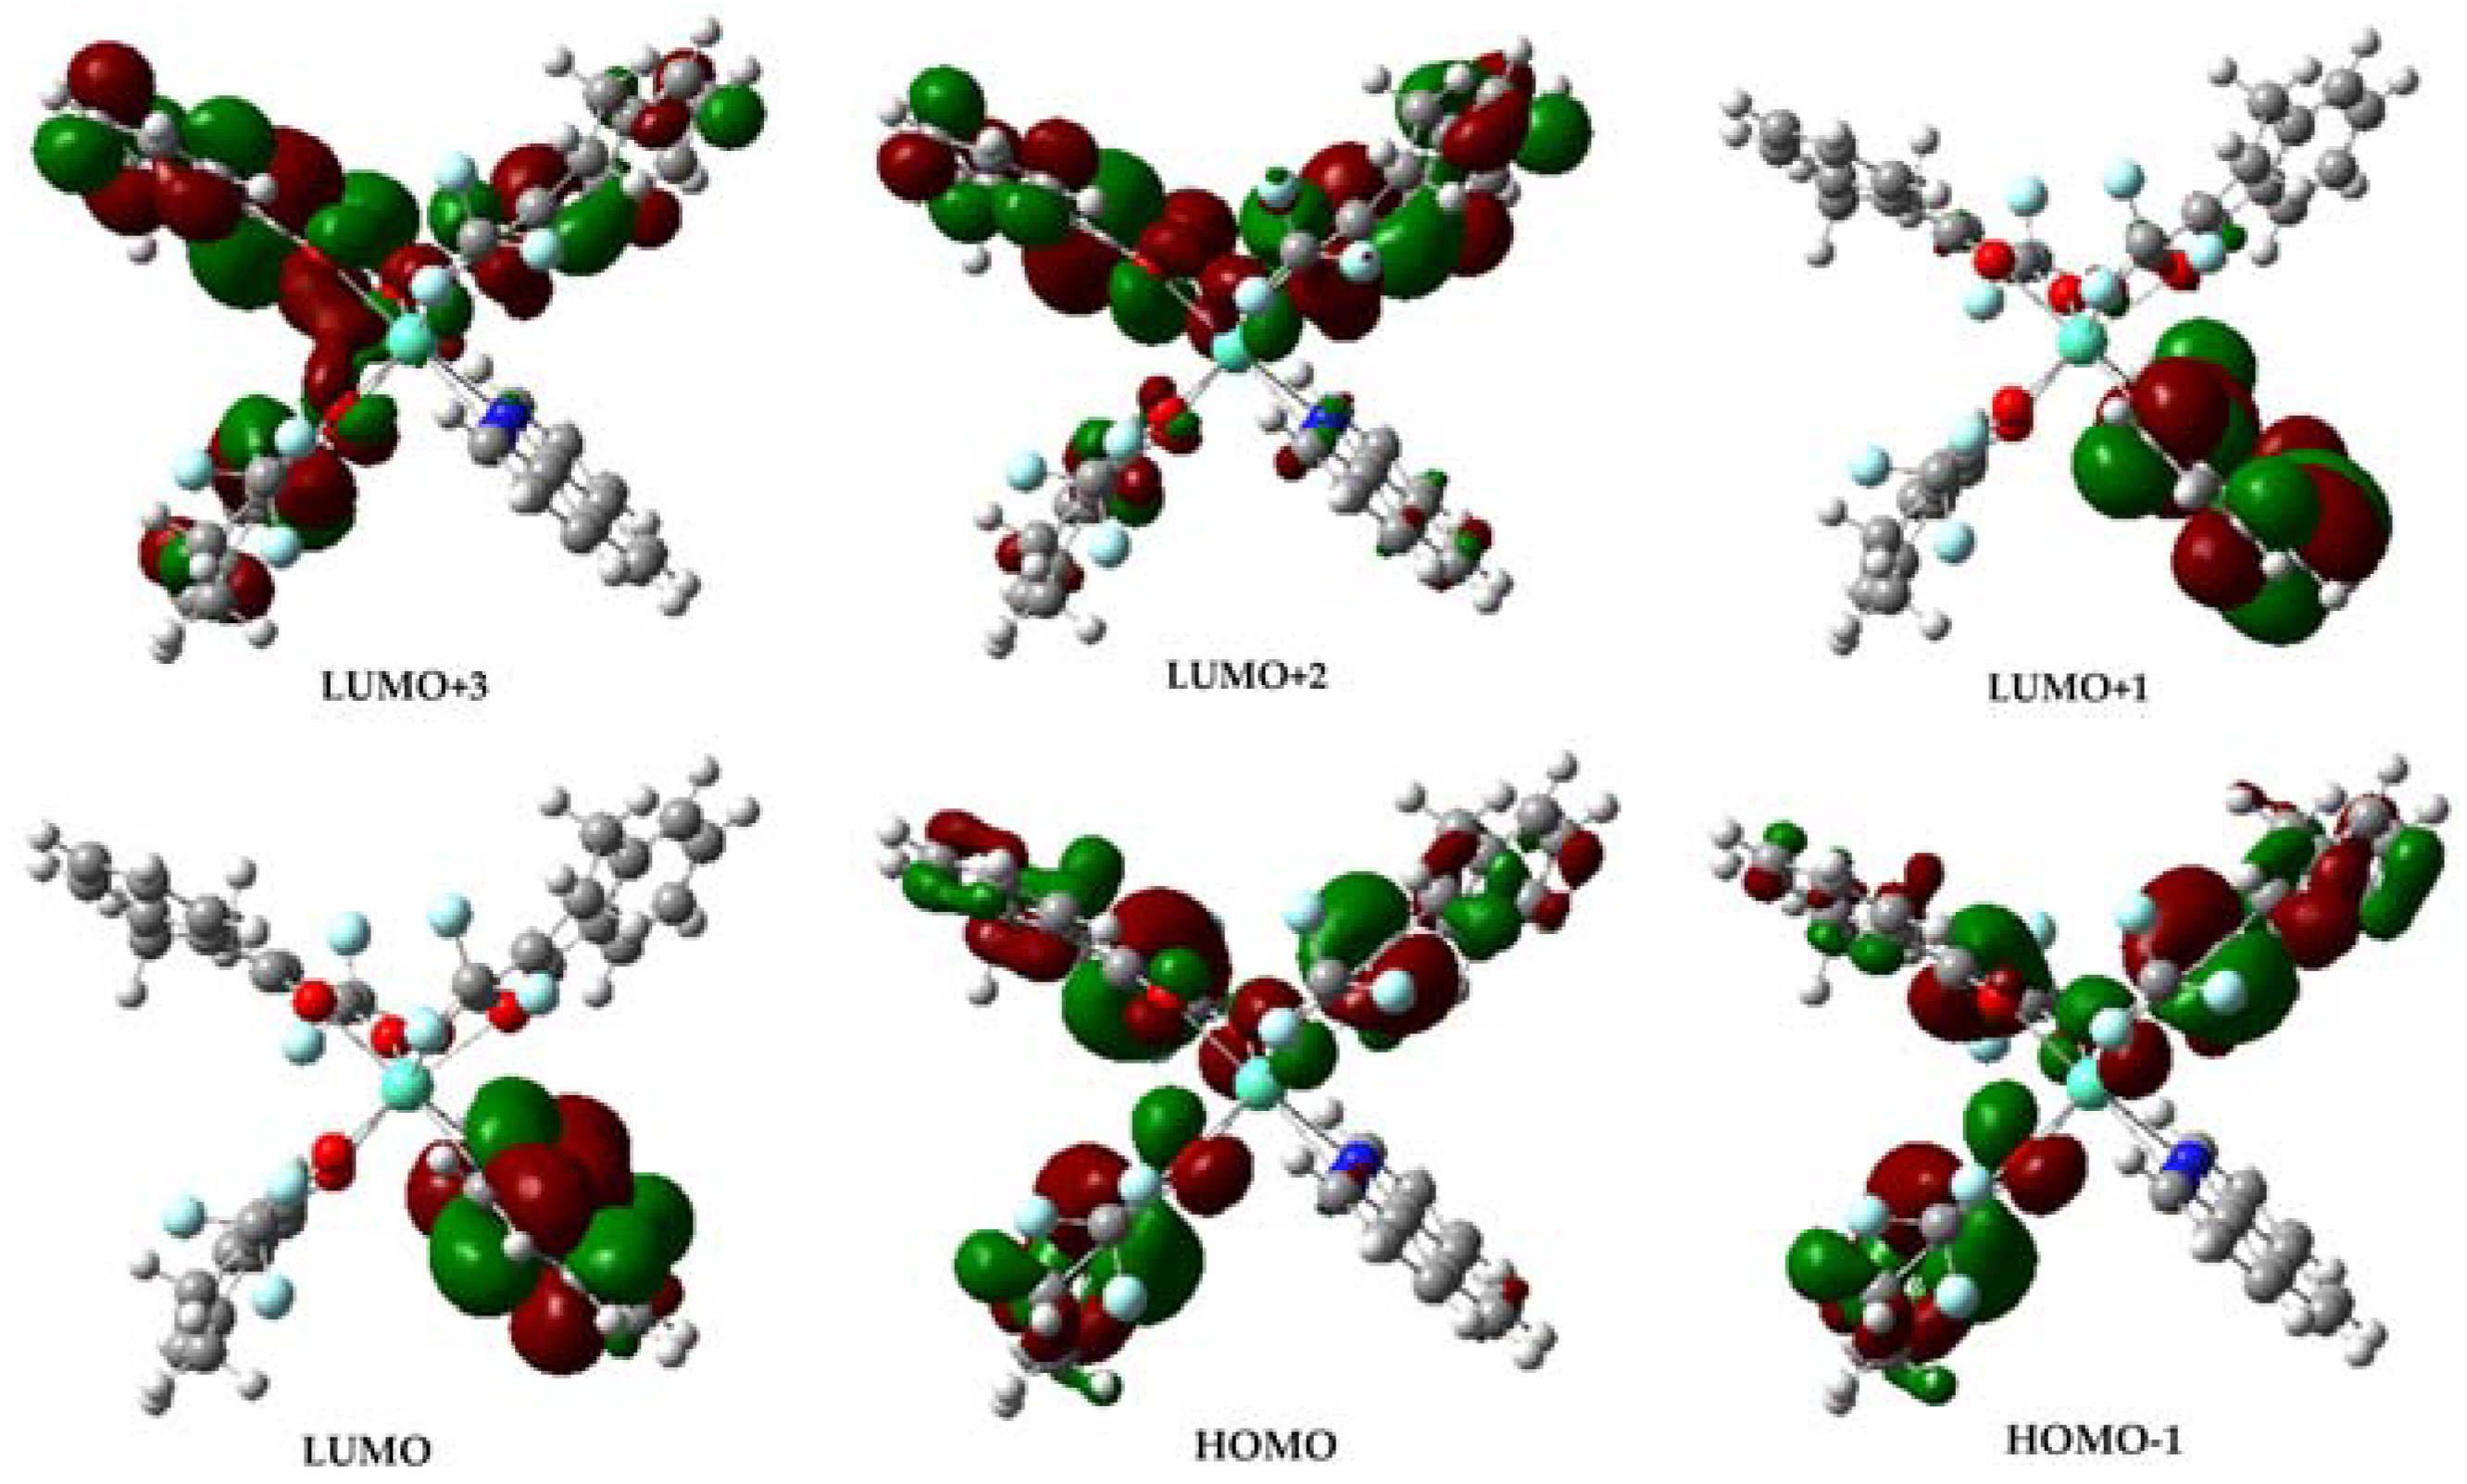
Figure 7.
TGA curves of the complexes 1 and 2, Eu(TFT)3phen/PMMA, and Eu(TFT)3bpy/PMMA.

Figure 8.
The excitation (a) and emission (b) spectra of complexes 1, 2, TFT, Eu(TFT)3phen/PMMA (12%) in the solid state.
Figure 8.
The excitation (a) and emission (b) spectra of complexes 1, 2, TFT, Eu(TFT)3phen/PMMA (12%) in the solid state.

Figure 9.
The emission spectra of the composite nanofibers Eu(TFT)3phen/PMMA (a); The emission spectra of complexes 1, 2 and Eu/PVP composite fibers content of 12 wt % (b).
Figure 9.
The emission spectra of the composite nanofibers Eu(TFT)3phen/PMMA (a); The emission spectra of complexes 1, 2 and Eu/PVP composite fibers content of 12 wt % (b).
Scheme 5.
Coordination mechanism of Eu(TFT)3(phen)/PMMA.

Figure 10.
The liquid fluorescence curve spectrograms of complexes 3 (a) and 4 (b) in chloroform.
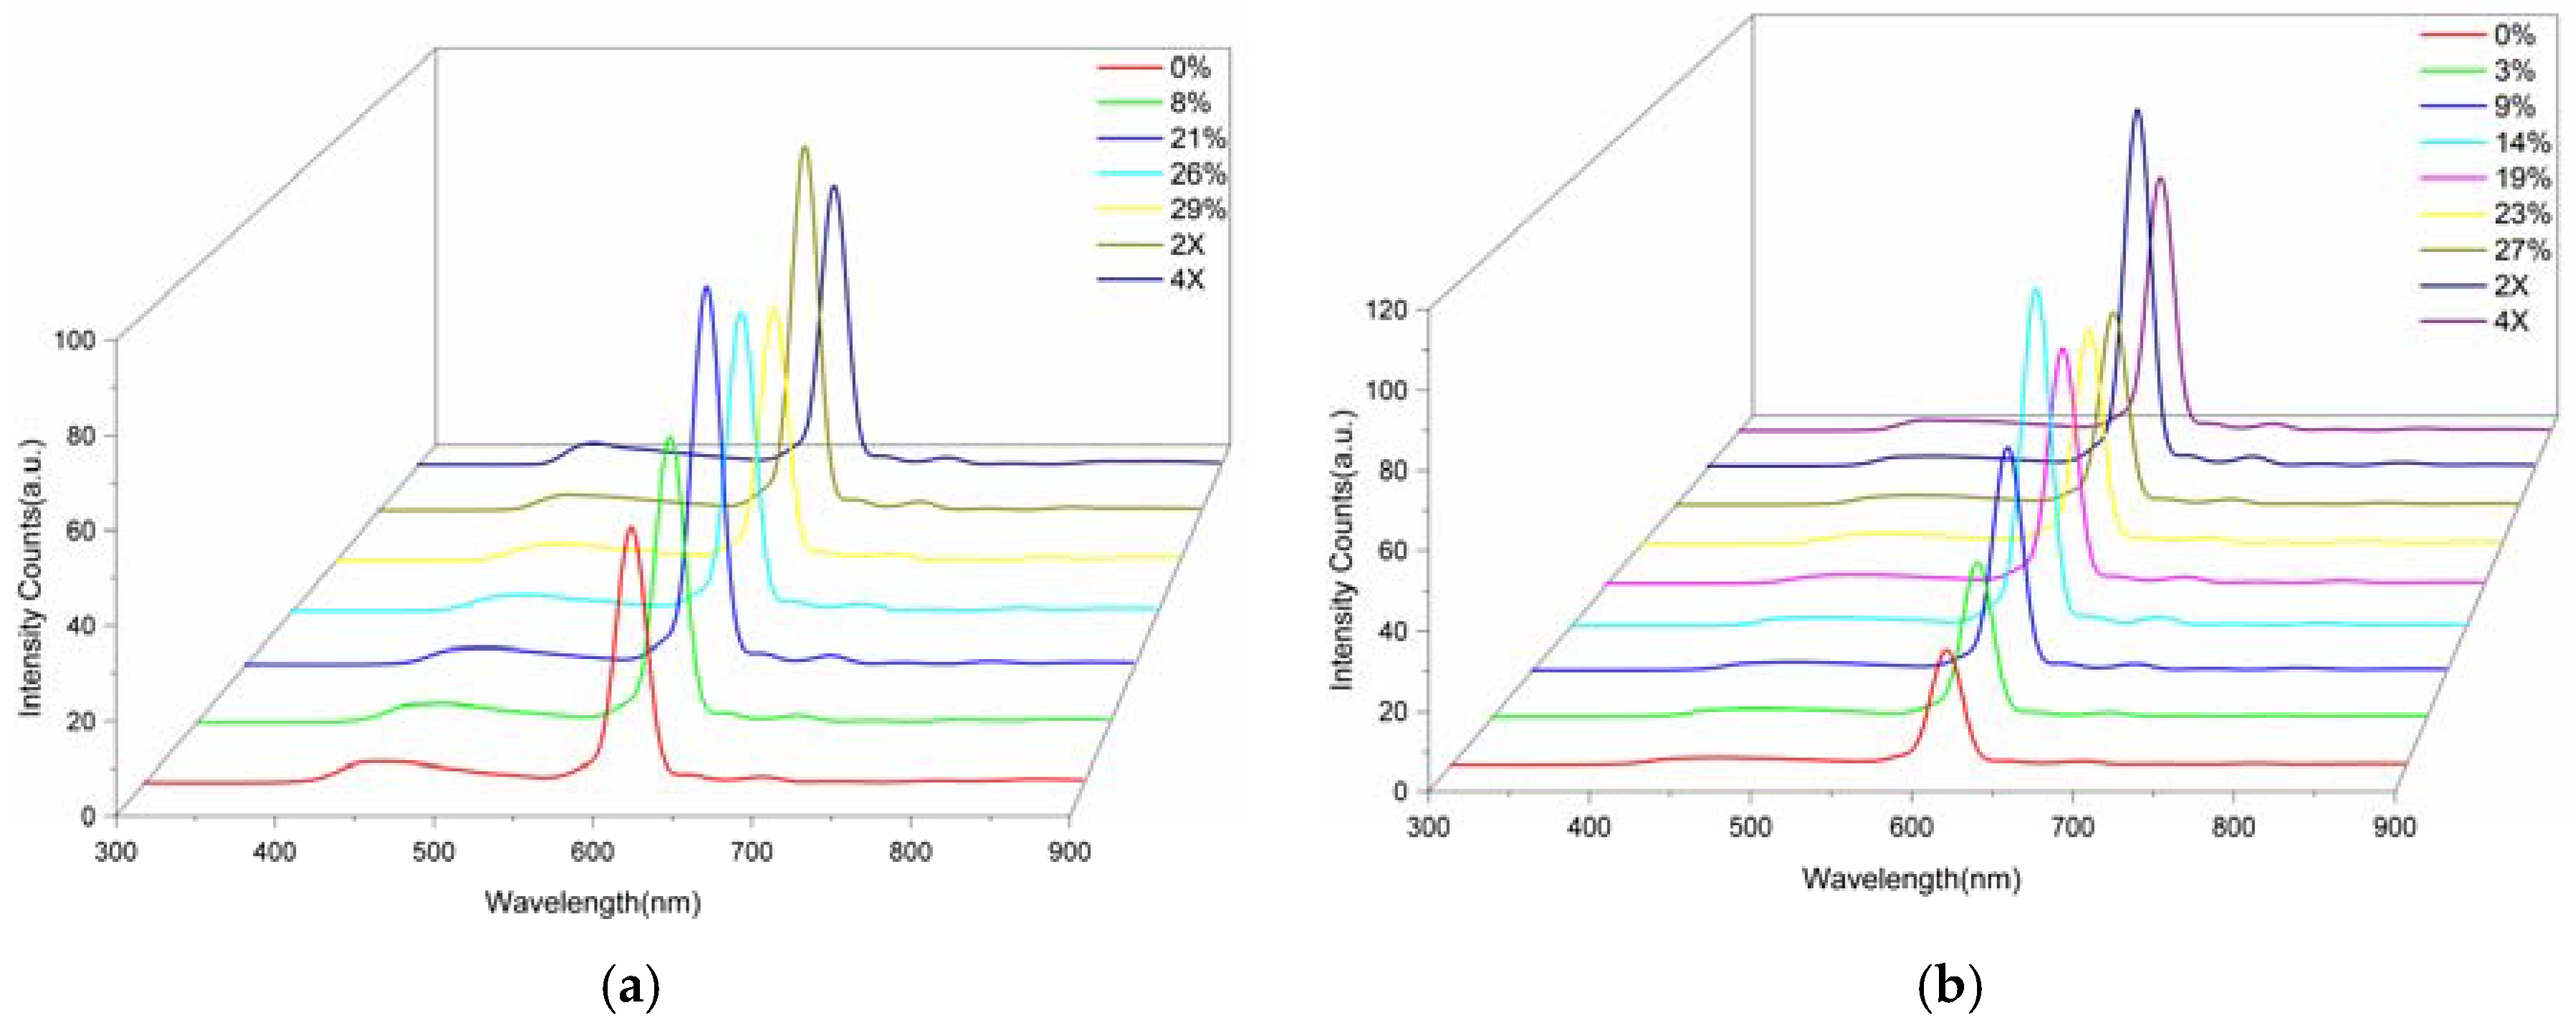
Figure 11.
The liquid fluorescence curve spectrograms of complexes 5 (a) and 6 (b) in chloroform.

Figure 12.
The fluorescence decay curves of complexes 1–6 and Eu(TFT)3bpy/PMMA, Eu(TFT)3phen/PVP.
© 2018 by the authors. Licensee MDPI, Basel, Switzerland. This article is an open access article distributed under the terms and conditions of the Creative Commons Attribution (CC BY) license (http://creativecommons.org/licenses/by/4.0/).
Share and Cite
MDPI and ACS Style
Zhao, W.; Shao, H.; Yu, G.; Hou, Y.; Wang, S. The Coordination and Luminescence of the Eu(III) Complexes with the Polymers (PMMA, PVP). Polymers 2018, 10, 508. https://doi.org/10.3390/polym10050508
AMA Style
Zhao W, Shao H, Yu G, Hou Y, Wang S. The Coordination and Luminescence of the Eu(III) Complexes with the Polymers (PMMA, PVP). Polymers. 2018; 10(5):508. https://doi.org/10.3390/polym10050508
Chicago/Turabian StyleZhao, Weican, Haifeng Shao, Guang Yu, Yanjun Hou, and Shuhong Wang. 2018. "The Coordination and Luminescence of the Eu(III) Complexes with the Polymers (PMMA, PVP)" Polymers 10, no. 5: 508. https://doi.org/10.3390/polym10050508
Note that from the first issue of 2016, this journal uses article numbers instead of page numbers. See further details here.