Article

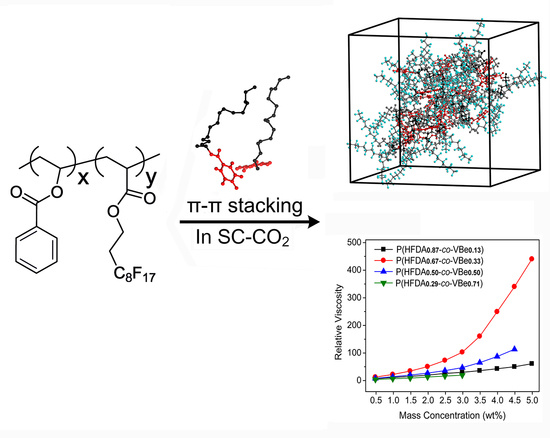
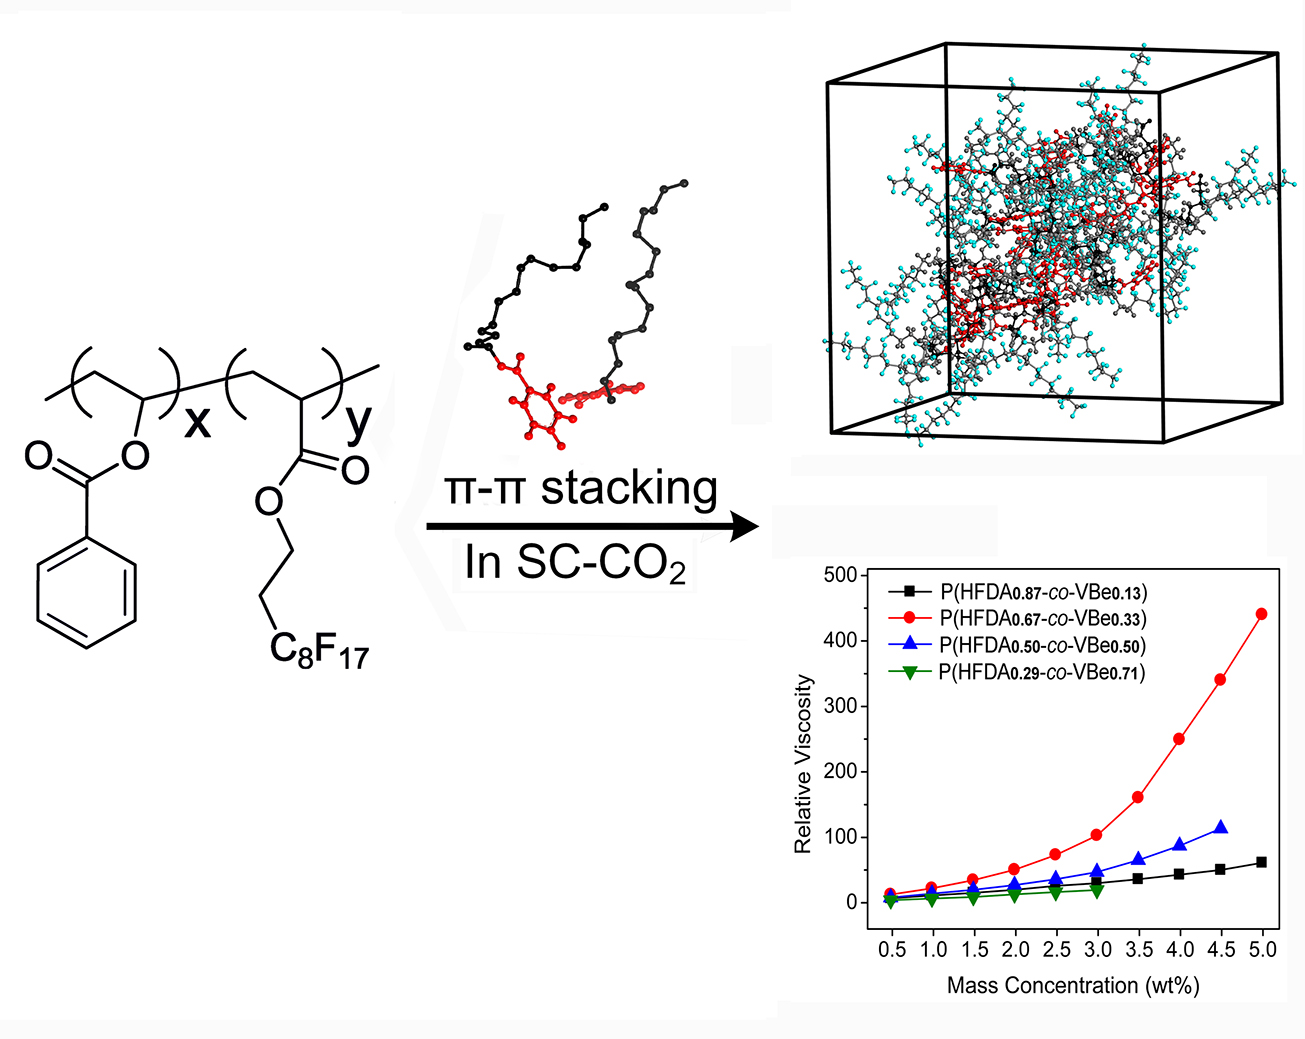
Thickening Supercritical CO2 with π-Stacked Co-Polymers: Molecular Insights into the Role of Intermolecular Interaction

1
State Key Laboratory of Heavy Oil Processing, China University of Petroleum (East China), Qingdao 266580, China
2
Key Laboratory of Colloid and Interface Chemistry of State Education of Ministry, Shandong University, Jinan 250100, China
3
Department of Chemistry, Capital Normal University, Beijing 100048, China
4
Geological Logging Company, Shengli Petroleum Engineering Company, Petroleum Engineering Services Limited Company of China Petrochemical Corporation, Dongying 257100, China
*
Author to whom correspondence should be addressed.
Polymers 2018, 10(3), 268; https://doi.org/10.3390/polym10030268
Submission received: 16 January 2018 / Revised: 23 February 2018 / Accepted: 1 March 2018 / Published: 6 March 2018
(This article belongs to the Special Issue π-Stacked Polymers)

Abstract

:
Vinyl Benzoate/Heptadecafluorodecyl acrylate (VBe/HFDA) co-polymers were synthesized and characterized as thickening agents for supercritical carbon dioxide (SC-CO2). The solubility and thickening capability of the co-polymer samples in SC-CO2 were evaluated by measuring cloud point pressure and relative viscosity. The molecular dynamics (MD) simulation for all atoms was employed to simulate the microscopic molecular behavior and the intermolecular interaction of co-polymer–CO2 systems. We found that the introduction of VBe group decreased the polymer–CO2 interaction and increased the polymer–polymer interaction, leading to a reduction in solubility of the co-polymers in SC-CO2. However, the co-polymer could generate more effective inter-chain interaction and generate more viscosity enhancement compared to the Poly(Heptadecafluorodecyl) (PHFDA) homopolymer due to the driving force provided by π-π stacking of the VBe groups. The optimum molar ratio value for VBe in co-polymers for the viscosity enhancement of SC-CO2 was found to be 0.33 in this work. The P(HFDA0.67-co-VBe0.33) was able to enhance the viscosity of SC-CO2 by 438 times at 5 wt. %. Less VBe content would result in a lack of intermolecular interaction, although excessive VBe content would generate more intramolecular π-π stacking and less intermolecular π-π stacking. Both conditions reduce the thickening capability of the P(HFDA-co-VBe) co-polymer. This work presented the relationship between structure and performance of the co-polymers in SC-CO2 by combining experiment and molecular simulations.

Graphical Abstract

1. Introduction

Supercritical carbon dioxide (SC-CO2) has been applied in many industrial processes due to its good diffusion, heat transfer and mass transfer properties. In unconventional oil and gas exploitation, CO2 has been recognized as clean fracturing fluid, which has strong width generation capability [1,2]. SC-CO2 does not damage the reservoir and possesses obvious technical advantages for the stimulation of low permeability and water-sensitive reservoir compared to hydraulic fracturing. In addition, CO2 is easier to flow back and could replace the natural gas adsorbed in the reservoir [3,4]. The practices of the United States and Canada showed that the stimulation effect of CO2 fracturing was especially excellent for shale gas reservoirs [5]. However, the low viscosity of SC-CO2 has limited its capability of exporting the proppants into the reservoir fractures to support the oil–gas pathway [6]. Therefore, thickening SC-CO2 is essential in improving the technology for the sand fracturing of SC-CO2 [7]. The viscosity enhancement of CO2 could improve its proppant exporting performance and reduce its filtration into the reservoir [4].
Due to the low solubility of polymer in CO2, thickening CO2 using polymers was very difficult. The good solubility of polymer in SC-CO2 is reflected by the CO2-philic group, low surface tension [8] and low glass transition temperature (Tg) [9,10] generally. Tapriyal et al. found that the charge deviation and quadrupole moment allows CO2 to play the roles of both electron-accepting Lewis acid and electron-donating Lewis base, which provides it with the ability to interact with specific groups (such as fluorine, carbonyl, carboxyl, etc.) [11]. For example, the hydrogen bond and electron donor–acceptor interaction (EDA) between CO2 and carbonyl group was believed to improve the solubility of materials in SC-CO2 [12,13]. Wallen et al. demonstrated that, except for the Lewis Acid–Lewis Base (LA–LB) interaction between the carbon of CO2 and oxygen of carbonyl in the CO2-carbonyl compound systems, there is a cooperative C–H···O interaction which is worth considering in the design of CO2-philic materials [14,15,16]. The CO2-soluble polymers were generally recognized as containing CO2-philic groups with high free volume, low solubility parameters and low glass transition temperatures [17,18,19,20].
Beckman et al. put forward the argument that specialized thickeners should be synthesized rather than testing a huge number of commercial polymers [21]. Researchers have explored methods to enhance the CO2-philicity by modifying polymers with specific groups [22,23,24]. Due to the strong LA–LB interaction between F and C of CO2, fluoropolymer has high solubility in CO2, but does not enhance the viscosity of CO2 significantly, which may due to the weak polymer–polymer interaction. It was believed that the co-polymer obtained from the combination of a CO2-philic monomer and CO2-phobic monomer could generate inter-chain associations to thicken CO2 by hydrogen bonds, solvo–phobic or van der Waals interactions [25]. It may be an effective strategy to modify the CO2-philic polymer by introducing a CO2-phobic group in the molecular design of thickening agents for SC-CO2 [26,27,28]. Enick et al. have synthesized P(HFDA-co-St) co-polymers as thickening agents and the experimental results showed that the co-polymers could thicken CO2 effectively [4,6].
The exploitation of new functional polymer for thickening CO2 requires clear knowledge of the effect of molecular structure on performance. It is difficult to obtain the correction by experiments due to the huge cost of time and economy. Molecular simulation has been used to reveal microscopic structure and intermolecular interactions of the polymer–CO2 system. Johnson et al. have calculated the interaction between CO2 and polymer repeat units by ab initio calculation, but the calculation results were inconsistent with the experimental results. The reason is that the model does not consider the influences of temperature and polymer–polymer interactions [29,30]. Compared to the ab initio calculation, the molecular dynamics simulation (MD) for all atoms is more suitable for the polymer–CO2 system and the results are more credible. Liu and Sun have explored the correlation of co-polymer structure with its solubility by MD simulations and obtained good results [31,32,33,34]. The microscopic information of the polymer–CO2 system could be used to provide guidance for the exploitation of polymer thickeners. To date, little research about the thickening capability of polymer in SC-CO2 simulated by the all-atom MD has been reported as far as we know.
This paper aims to provide insights into the role of intermolecular interactions in the solubility and thickening capability of π-stacked co-polymers by experiments and molecular simulation. Four co-polymers with different compositions were synthesized and characterized. The solubility and thickening capability of the co-polymers in SC-CO2 were evaluated by cloud point pressure and relative viscosity measurement experiments. By investigating the co-polymer–CO2 interaction energy, equilibrium conformations and radial distribution functions (RDFs), microscopic structure and intermolecular interaction of co-polymer–CO2 systems were explored. The relationships of the co-polymer structure and composition with the solubility and thickening capability were revealed.

2. Methodology

2.1. Synthesis and Characterization

2.1.1. Materials

The materials used in this work were vinyl benzoate (VBe, 99.5%, Alfa Aesar, Heysham, UK), 3,3,4,4,5,5,6,6,7,7,8,8,9,9,10,10,10-heptadecafluorodecyl acrylate (HFDA, 98%, Alfa Aesar, Heysham, UK), 2,2′-Azobisisobutyronitrile (AIBN, 99%, Aladdin Industrial Corporation, City of Industry, CA, USA), 1,1,2-Trichlorotrifluoroethane (99.5%, Aladdin Industrial Corporation, City of Industry, CA, USA), Methanol (99.9%, Aladdin Industrial Corporation, City of Industry, CA, USA) and Chloroform-d (99.8%, Alfa Aesar, Heysham, UK). AIBN was recrystallized twice before use.

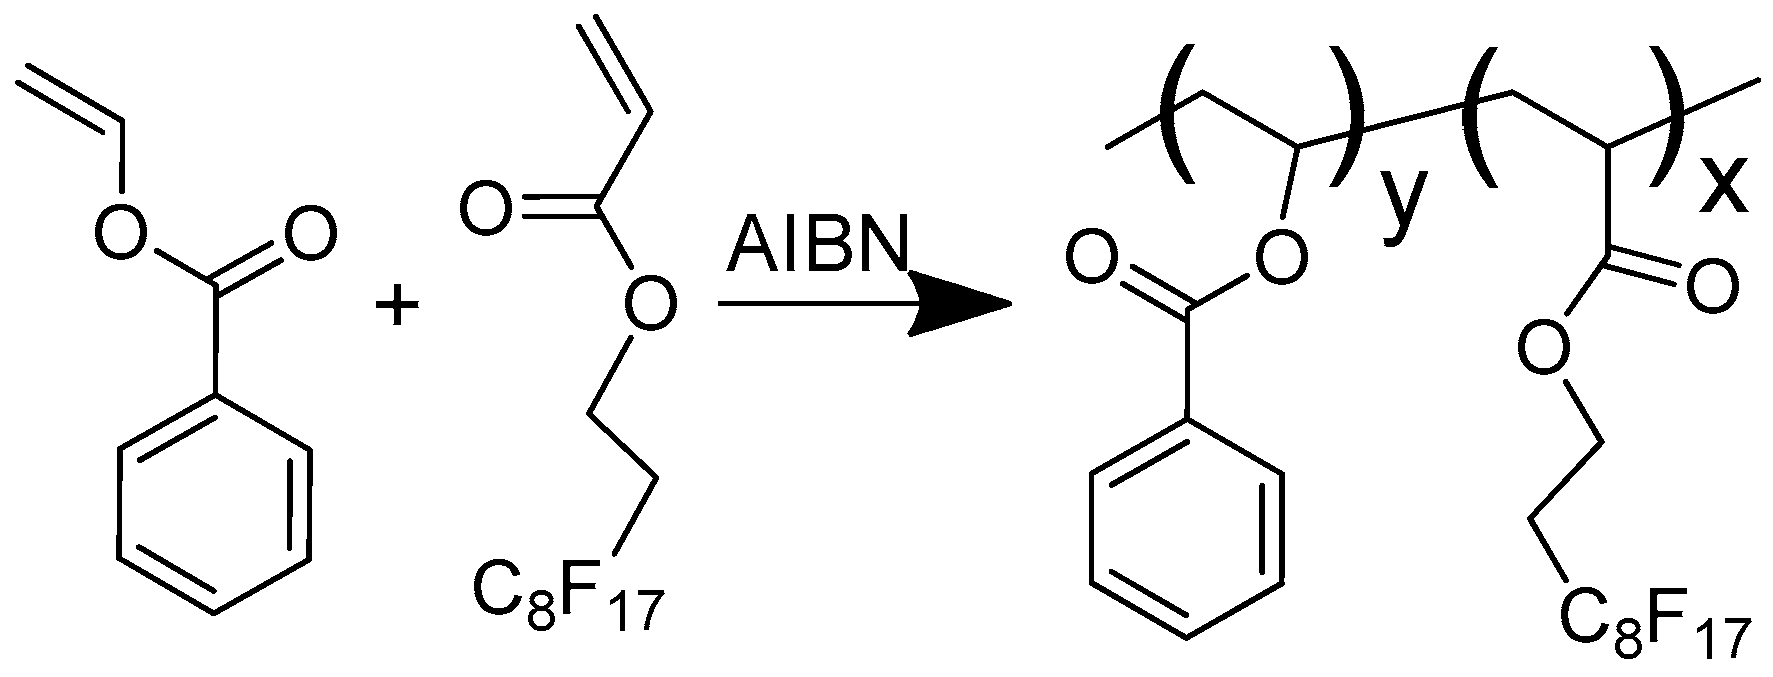
2.1.2. Preparation of Co-Polymer

The Vinyl benzoate/Heptadecafluorodecyl acrylate (VBe/HFDA) co-polymer was synthesized with AIBN as the initiator according to the procedure shown in Scheme 1 [35,36,37]. Two monomers were mixed together in a glass ampoule. AIBN (1.0 mol % relative to monomers) was added as a free radical initiator. The ampoule was sealed under reduced pressure and the polymerization was carried out at 60 °C for 24 h after the oxygen was removed. The product was dissolved in 1,1,2-trichlorotrifluoroethane and then purified twice in methanol. After this, the product collected and dried under vacuum. The co-polymers synthesized were named P(HFDAx-co-VBey), ‘x’ is the molar ratio of HFDA and y is the molar ratio of Vinyl Benzoate.

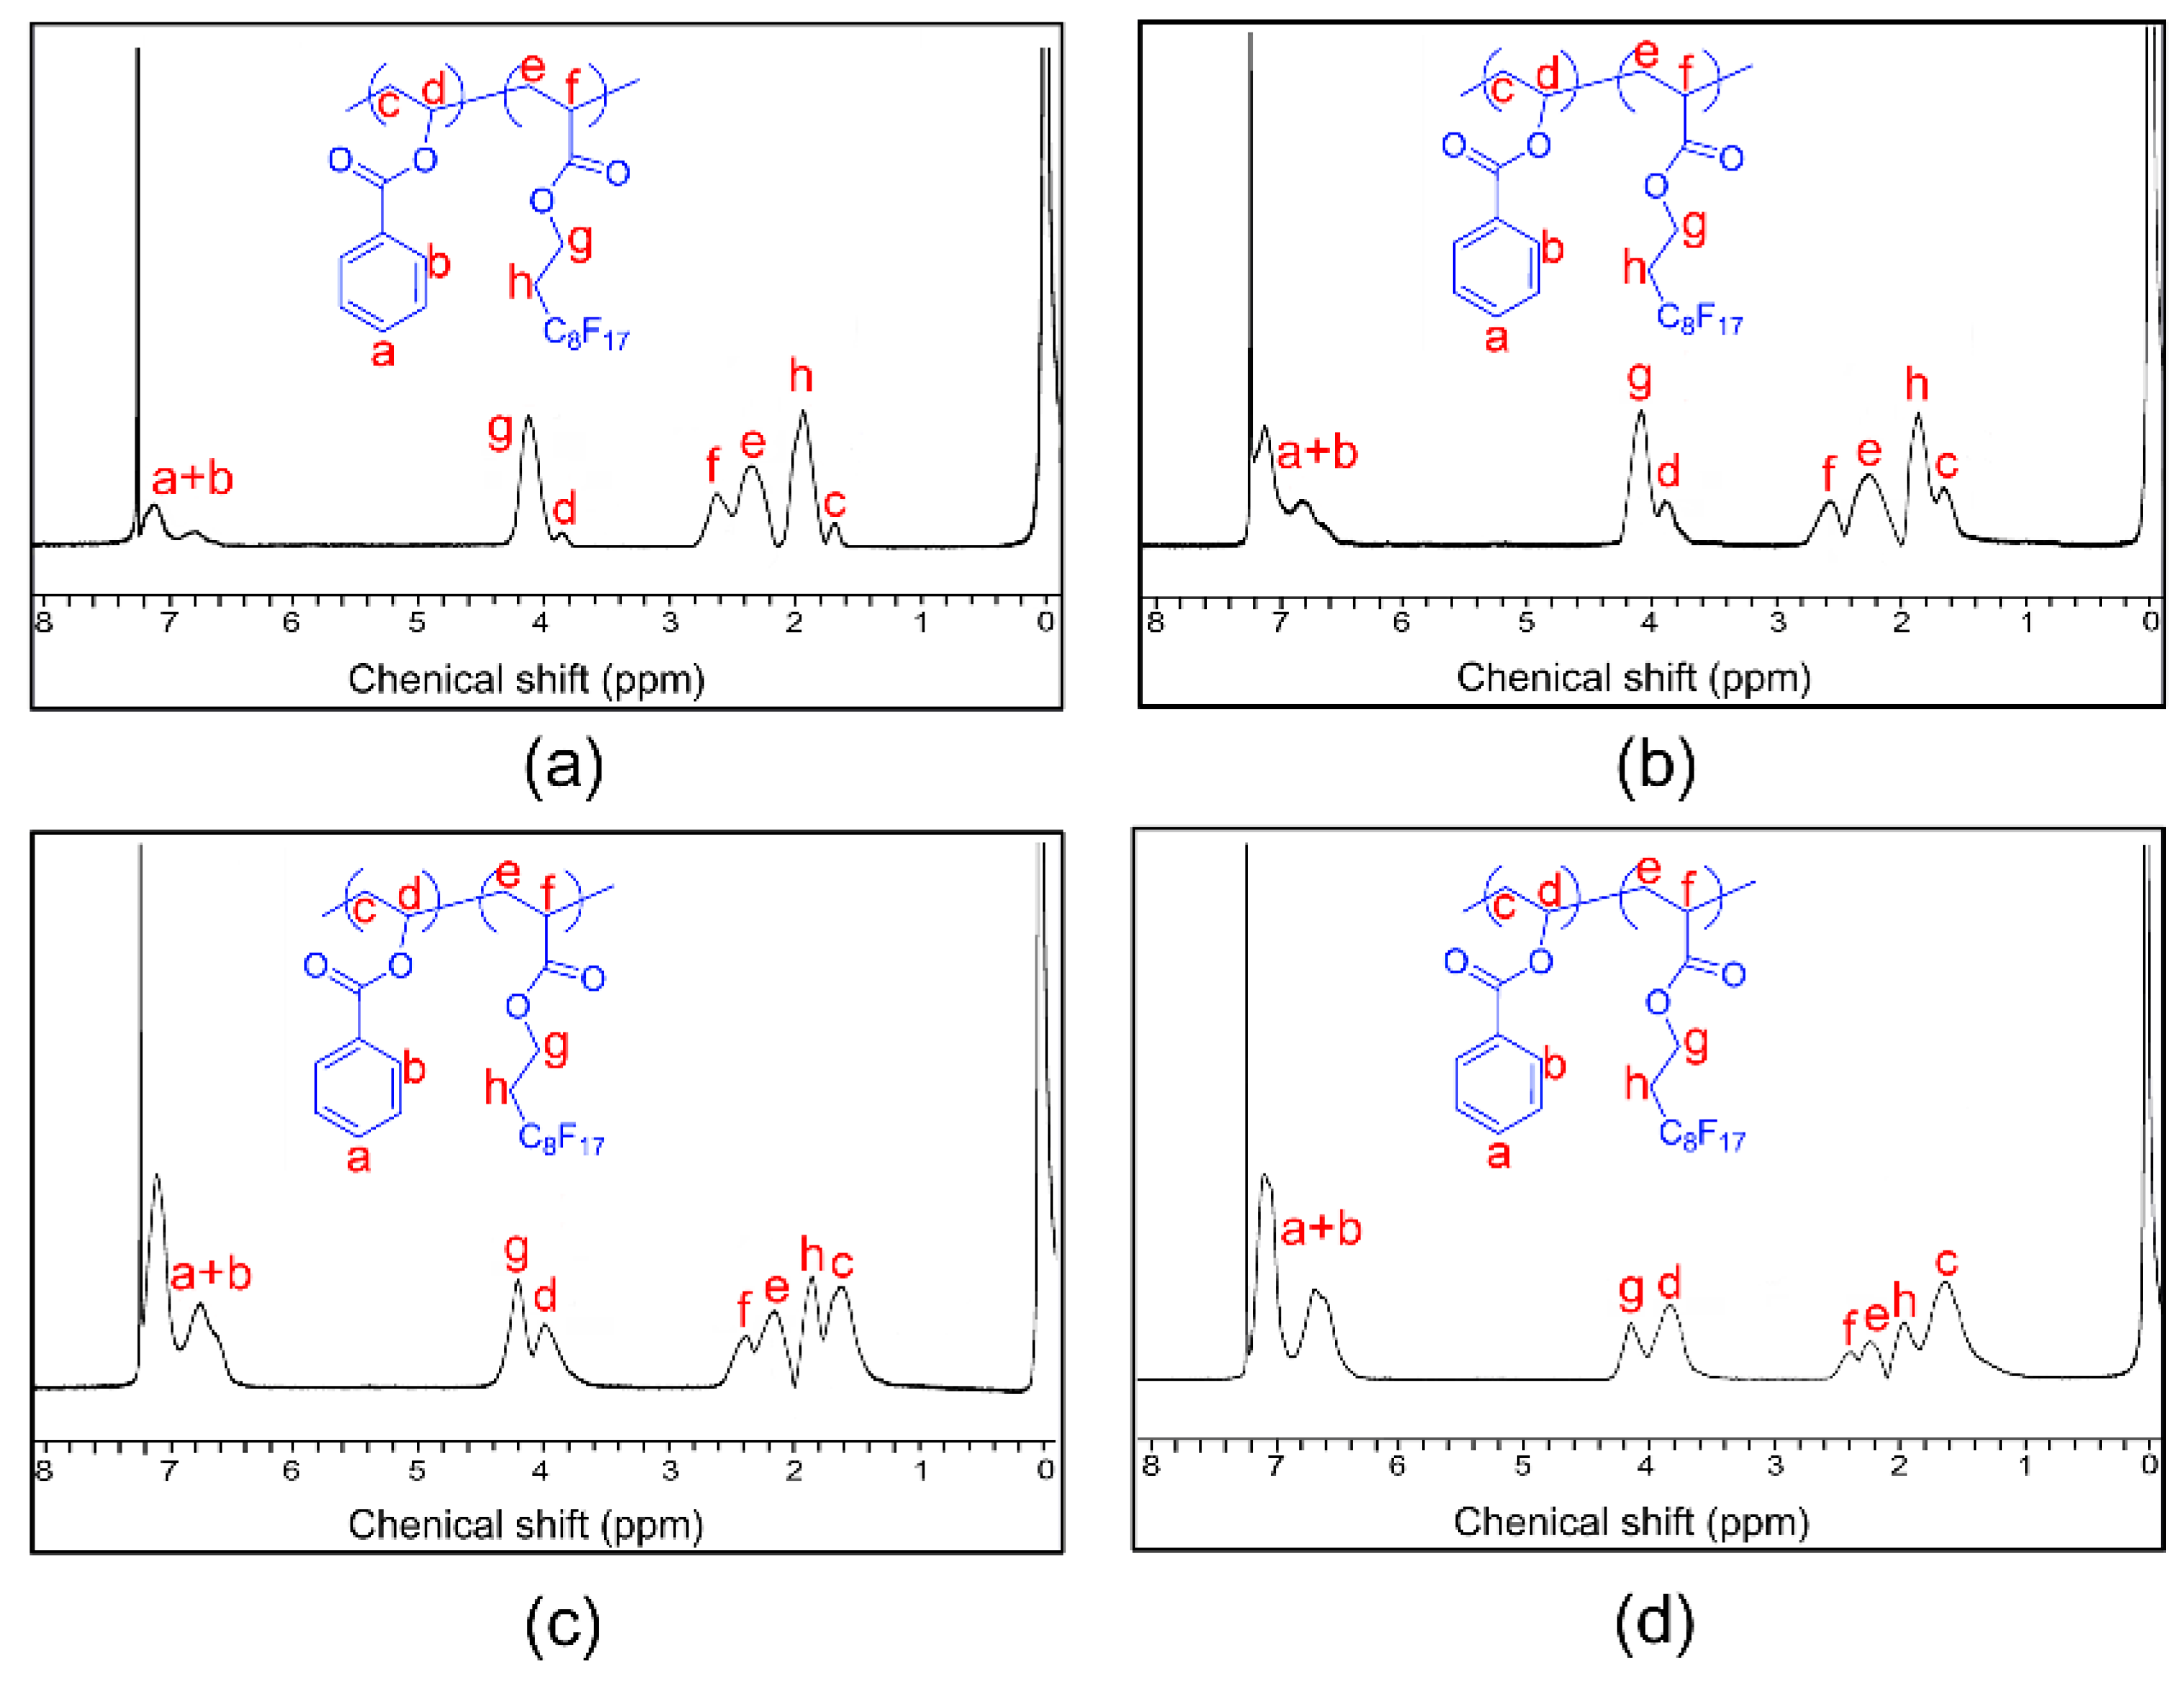
2.1.3. Nuclear Magnetic Resonance (NMR) Spectroscopy

1H-NMR spectrum of the co-polymer was recorded by Bruker 400 MHz Nuclear Magnetic Resonance Spectrometer (Bruker, Karlsruhe, Germany) with 1,1,2-tritriuorotrichloroethane and Chloroform-d used as the solvent at 20 °C. The spectra were used to analyze the co-polymerization ratio. The co-polymerization ratio of the two monomers was obtained by the integral relative intensity of the chemical shifts of the H atoms belonging to different characteristic proton groups [32,33,34,35,36].

2.1.4. Differential Scanning Calorimetry

To evaluate the chain flexibility, glass transition temperature of the co-polymers as measured using the Mettler-Toledo Differential Scanning Calorimeter (Mettler Toledo, Zurich, Switzerland) under the N2 atmosphere. The heating rate and the cooling rate were 10 °C/min [22,23,24]. Each sample was measured three times, taking the average of the last two as the result.

2.1.5. Molar Mass Analysis

Six solutions with different concentrations of the co-polymer sample was dissolved in 1,1,2-trichlorotrifluoroethane, before being filtered through a 0.8-μm filter. The absolute refractive index increments of co-polymer sample, dn/dc, were determined by the Optilab rEX extended differential refractive index detector, while the molar mass of the co-polymer sample was measured by Static Light Scattering (SLS) with Wyatt DAWN HELEOS Multi-Angle Laser Light Scatter (Wyatt Technology, Santa Barbara, CA, USA). The light scattering data was measured through a fixed 18-angle detector display simultaneously [38,39,40,41,42,43,44].

2.1.6. Surface Tension Measurements

The surface tension of the co-polymers was determined to evaluate the polymer–polymer interactions. The solution of polymer with 1,1,2-trifluorotriochloroethane was spin-coated on a glass substrate at a rotational speed of 2000 rpm. A homogeneous polymer film was obtained after drying. The contact angles of water–polymer and hexadecane–polymer were measured by DSAHT Contact Angle Meter (KRÜSS GmbH, Hamburg, Germany). After this, the surface tension of the co-polymers was calculated by the two-liquid method to evaluate the polymer–polymer interaction [36,45,46,47].

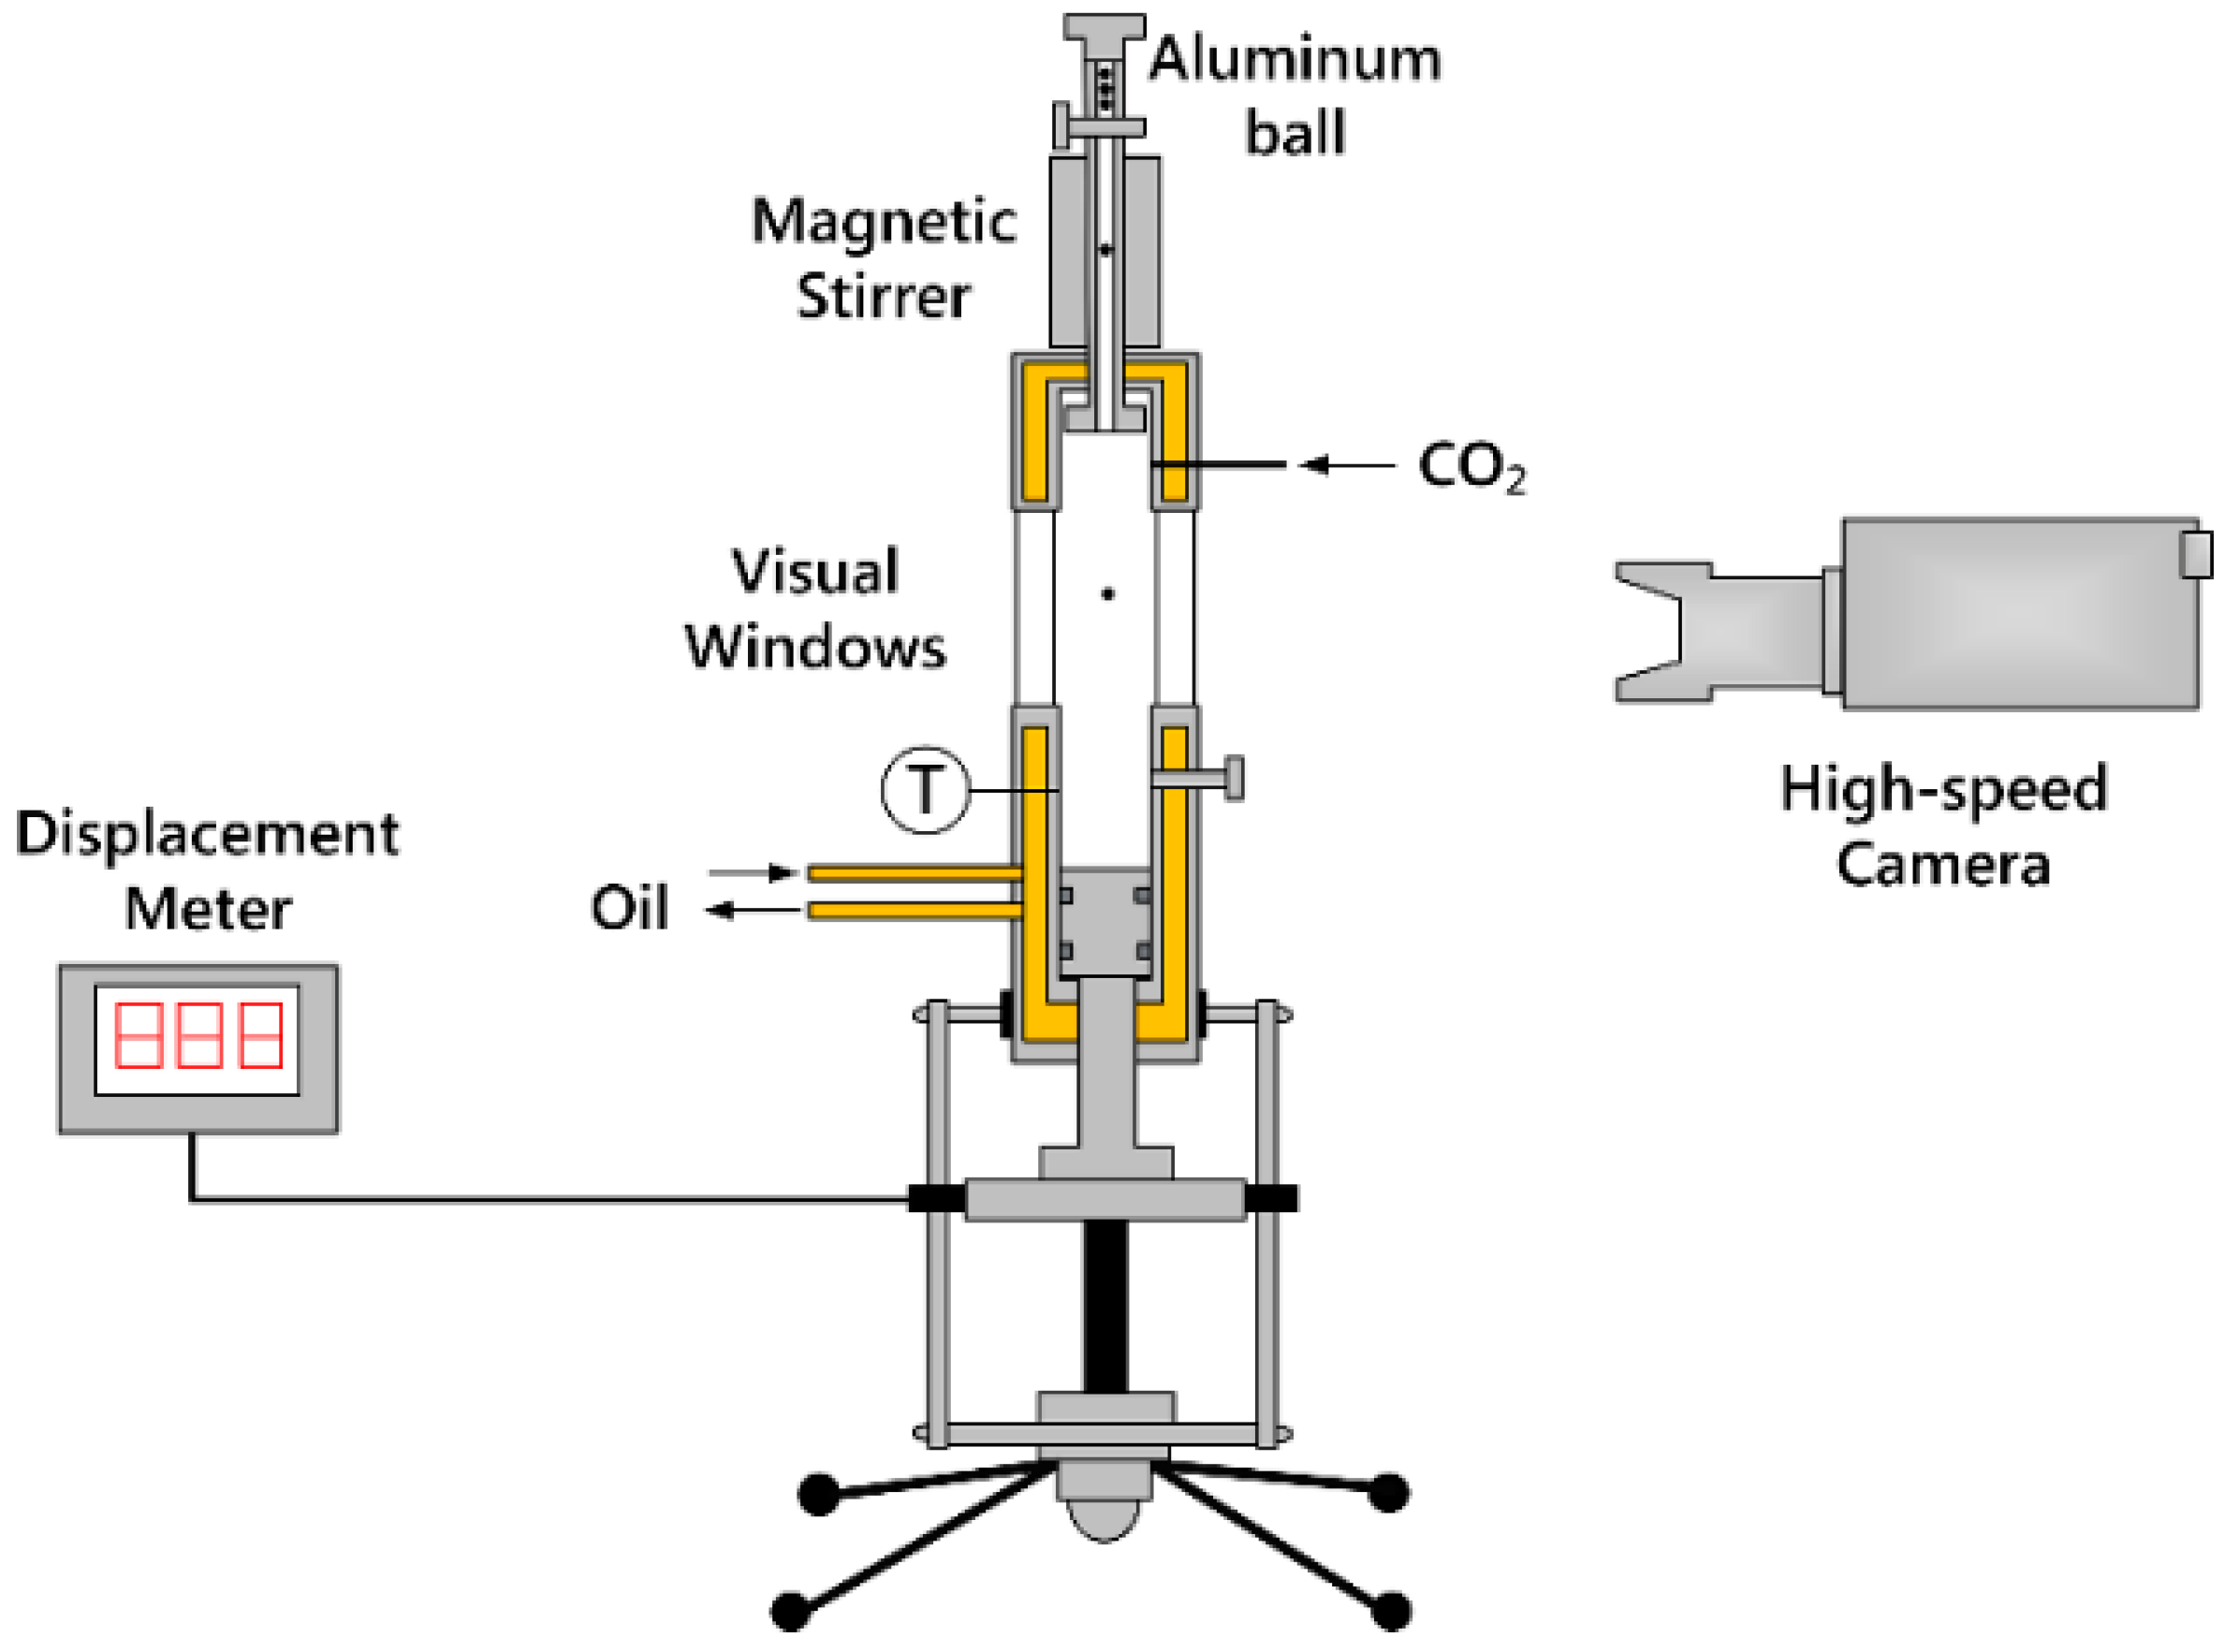
2.2. Cloud Point and Viscosity Measurements

The core part used for cloud point and viscosity measurements was the high temperature and high pressure visual unit, which is shown in Scheme 2. The visual windows were made of quartz glass and the supporting pressure is 30 MPa. The temperature was controlled by oil bath. The volume of the unit could be changed by moving the piston, which had a moving distance that was determined by displacement meter.
The polymer–CO2 mixture was stirred for 30 min to form a homogeneous system after being heated to the desired temperature, before the piston was moved to bring the system to the desired pressure. The polymer–CO2 system was a single phase under the initial conditions after having achieved phase equilibrium. After this, the piston was moved slowly to increase the volume of the unit under constant temperature, before decreasing the pressure until mist appeared. The pressure at which the mist appeared exactly was the cloud point pressure [48,49]. The phase transitions of the CO2–polymer system under a constant temperature were shown in Figure 1. The cloud point pressure was determined by repeating three measurements.
The pitching device at the top of the device could put aluminum ball into the visual unit. At the pressures above the cloud point pressure, the process of aluminum ball passing through the visual windows was captured by the high-speed camera at 2000 frames per second and used for the viscosity calculation. The viscosity of CO2 and polymer–CO2 mixture were calculated by Equation (1) under the pressures above the cloud point pressure [50,51]:
η = t ( 1 ρ l / ρ s ) A [ 1 + 2 α ( T T r ) ] [ 1 2 β ( P P r ) ] ,
where α and β are the thermal expansion coefficient and the compression coefficient of the visual unit; Tr and Pr are the reference temperature and pressure; ρl and ρs are the density of the solution and the ball respectively; t is the settling time; and A is the apparatus constant.
The ratio of the CO2–polymer viscosity to the CO2 viscosity at the same temperature and pressure, which is also known as the relative viscosity was used to evaluate the viscosification of the co-polymer [21]. The relative viscosity was obtained by Equation (2):
Relative   viscosity = η mix / η CO 2 ,
where ηmix is the viscosity of the CO2–polymer mixture and η CO 2 is the viscosity of CO2.

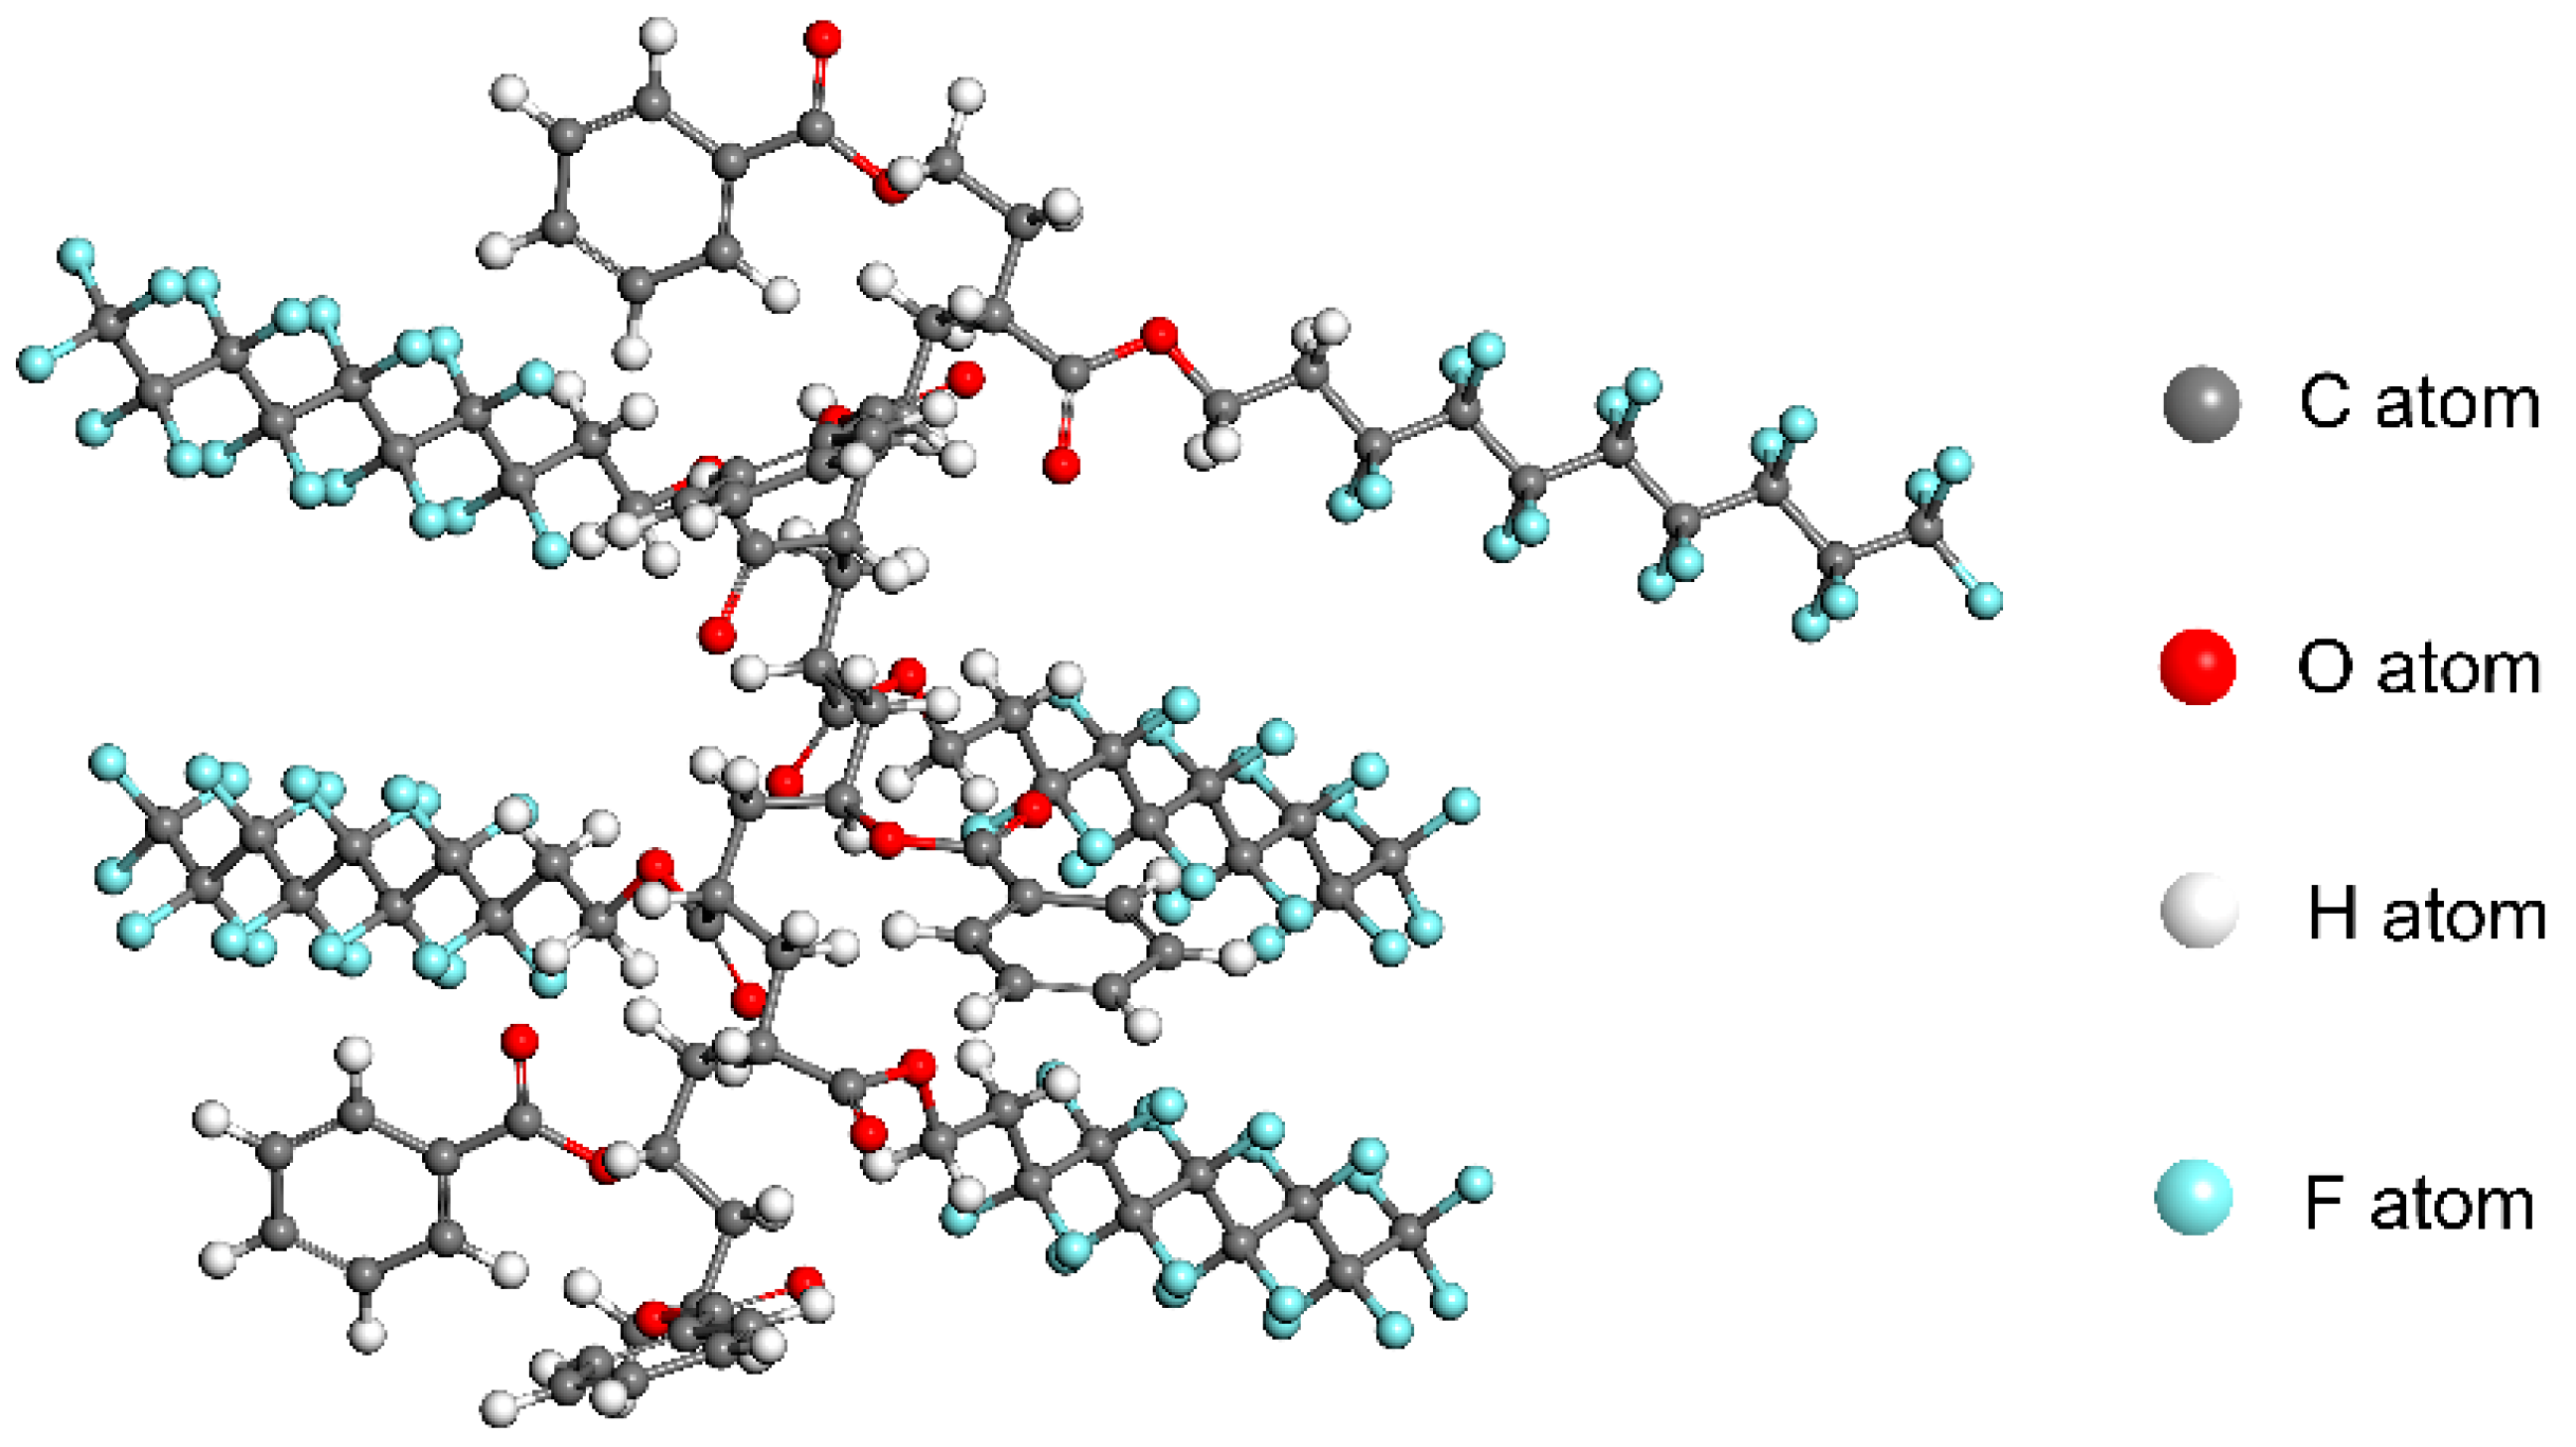
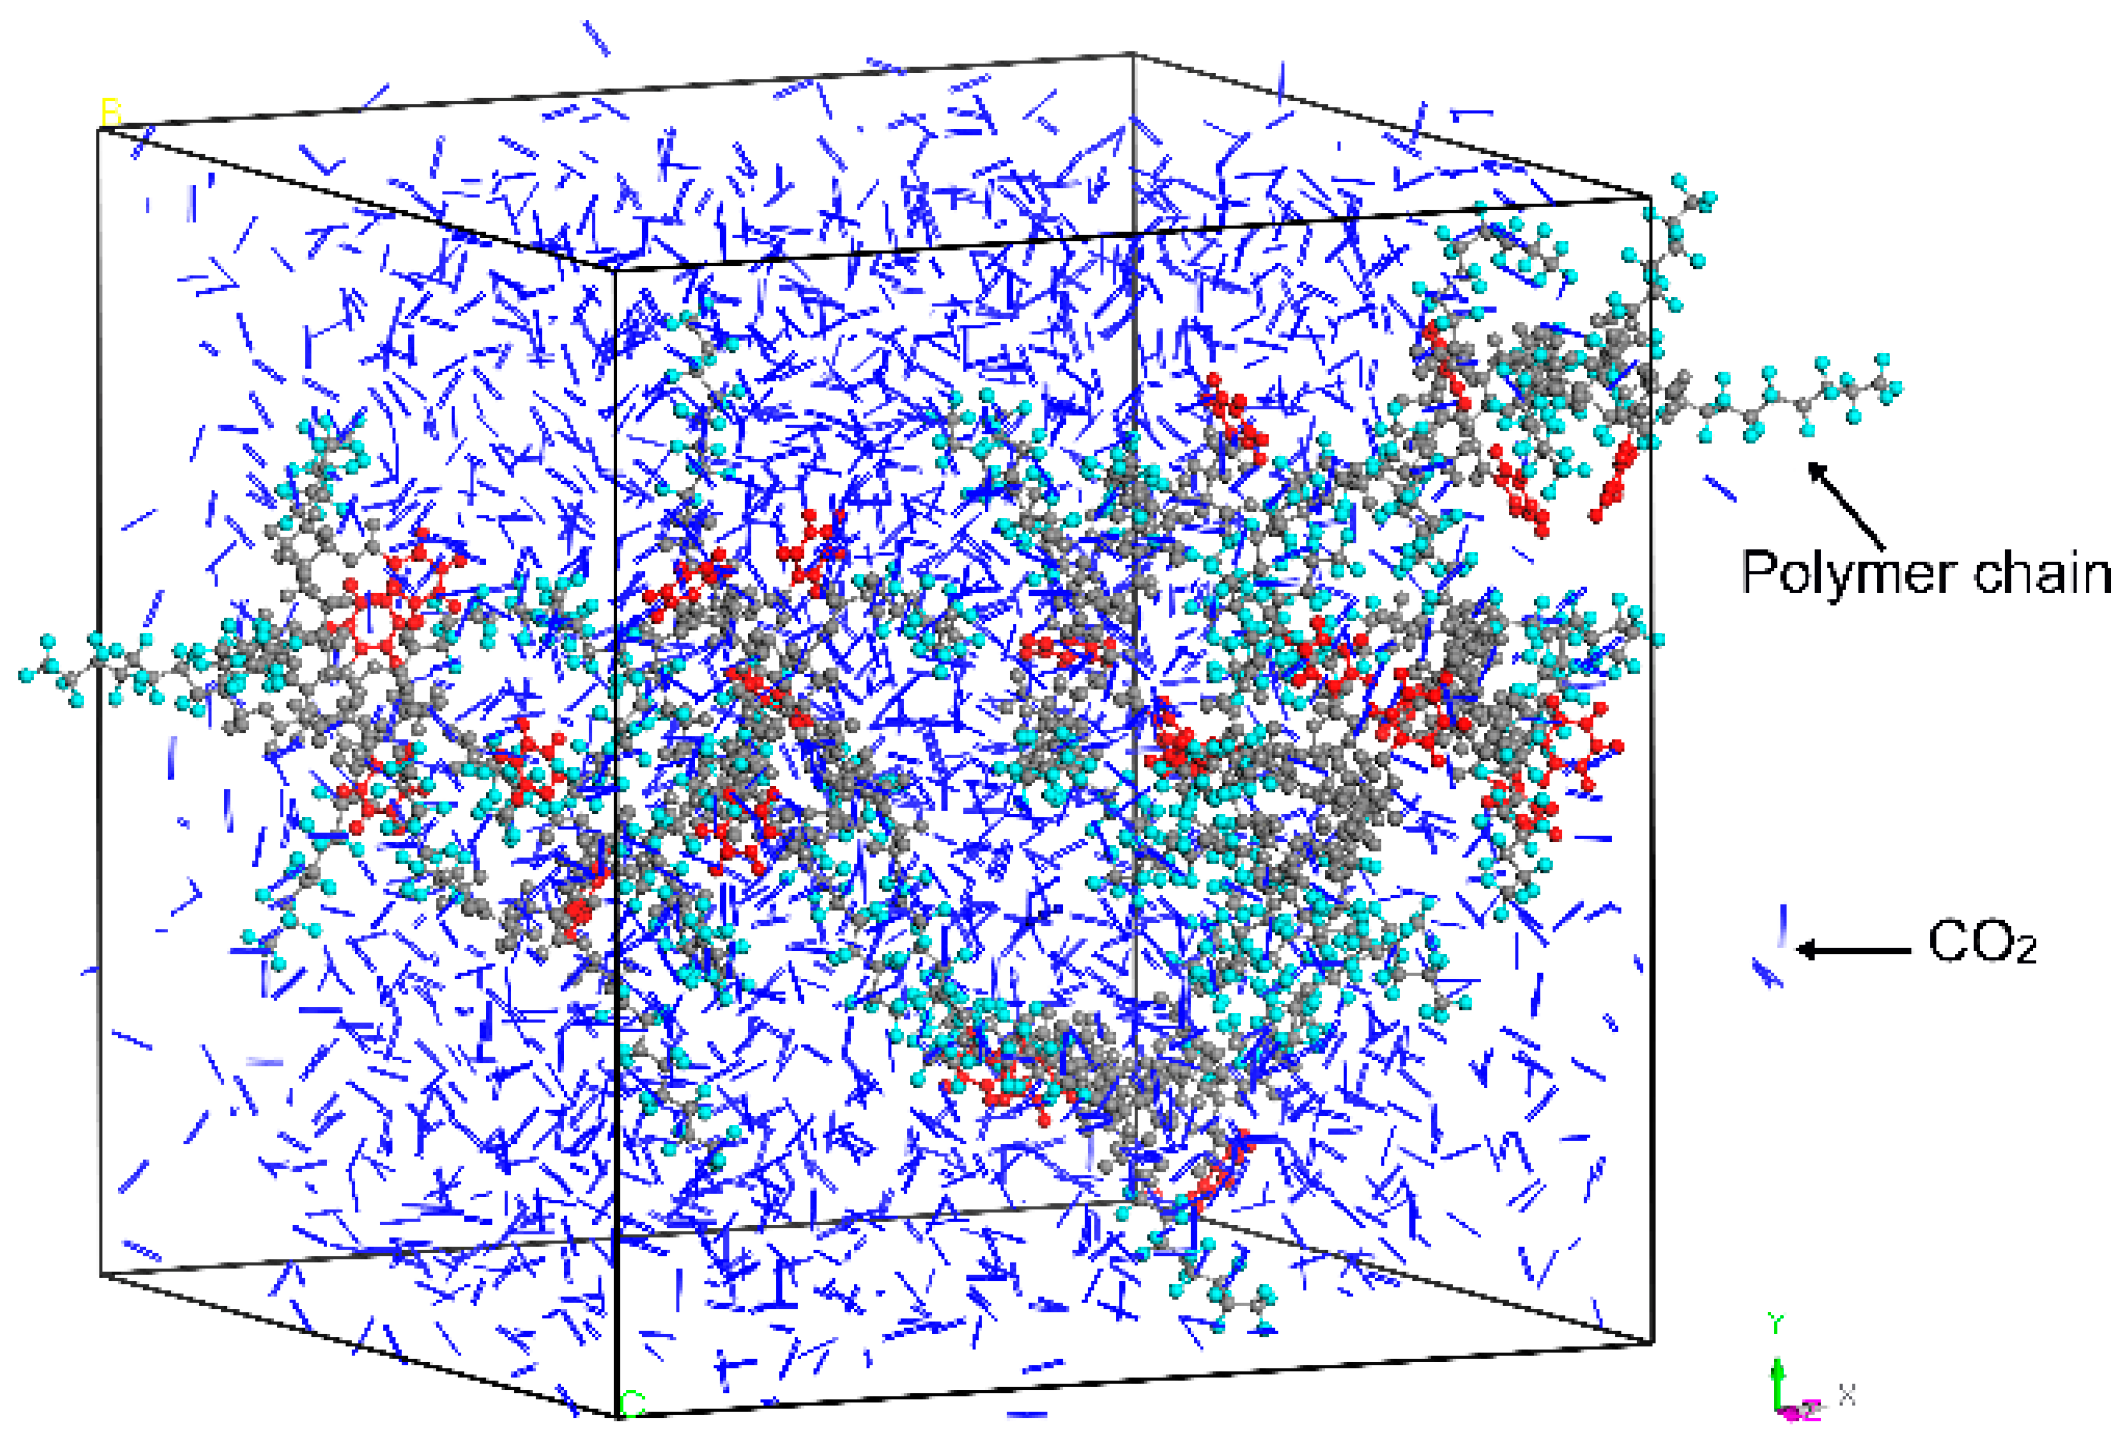
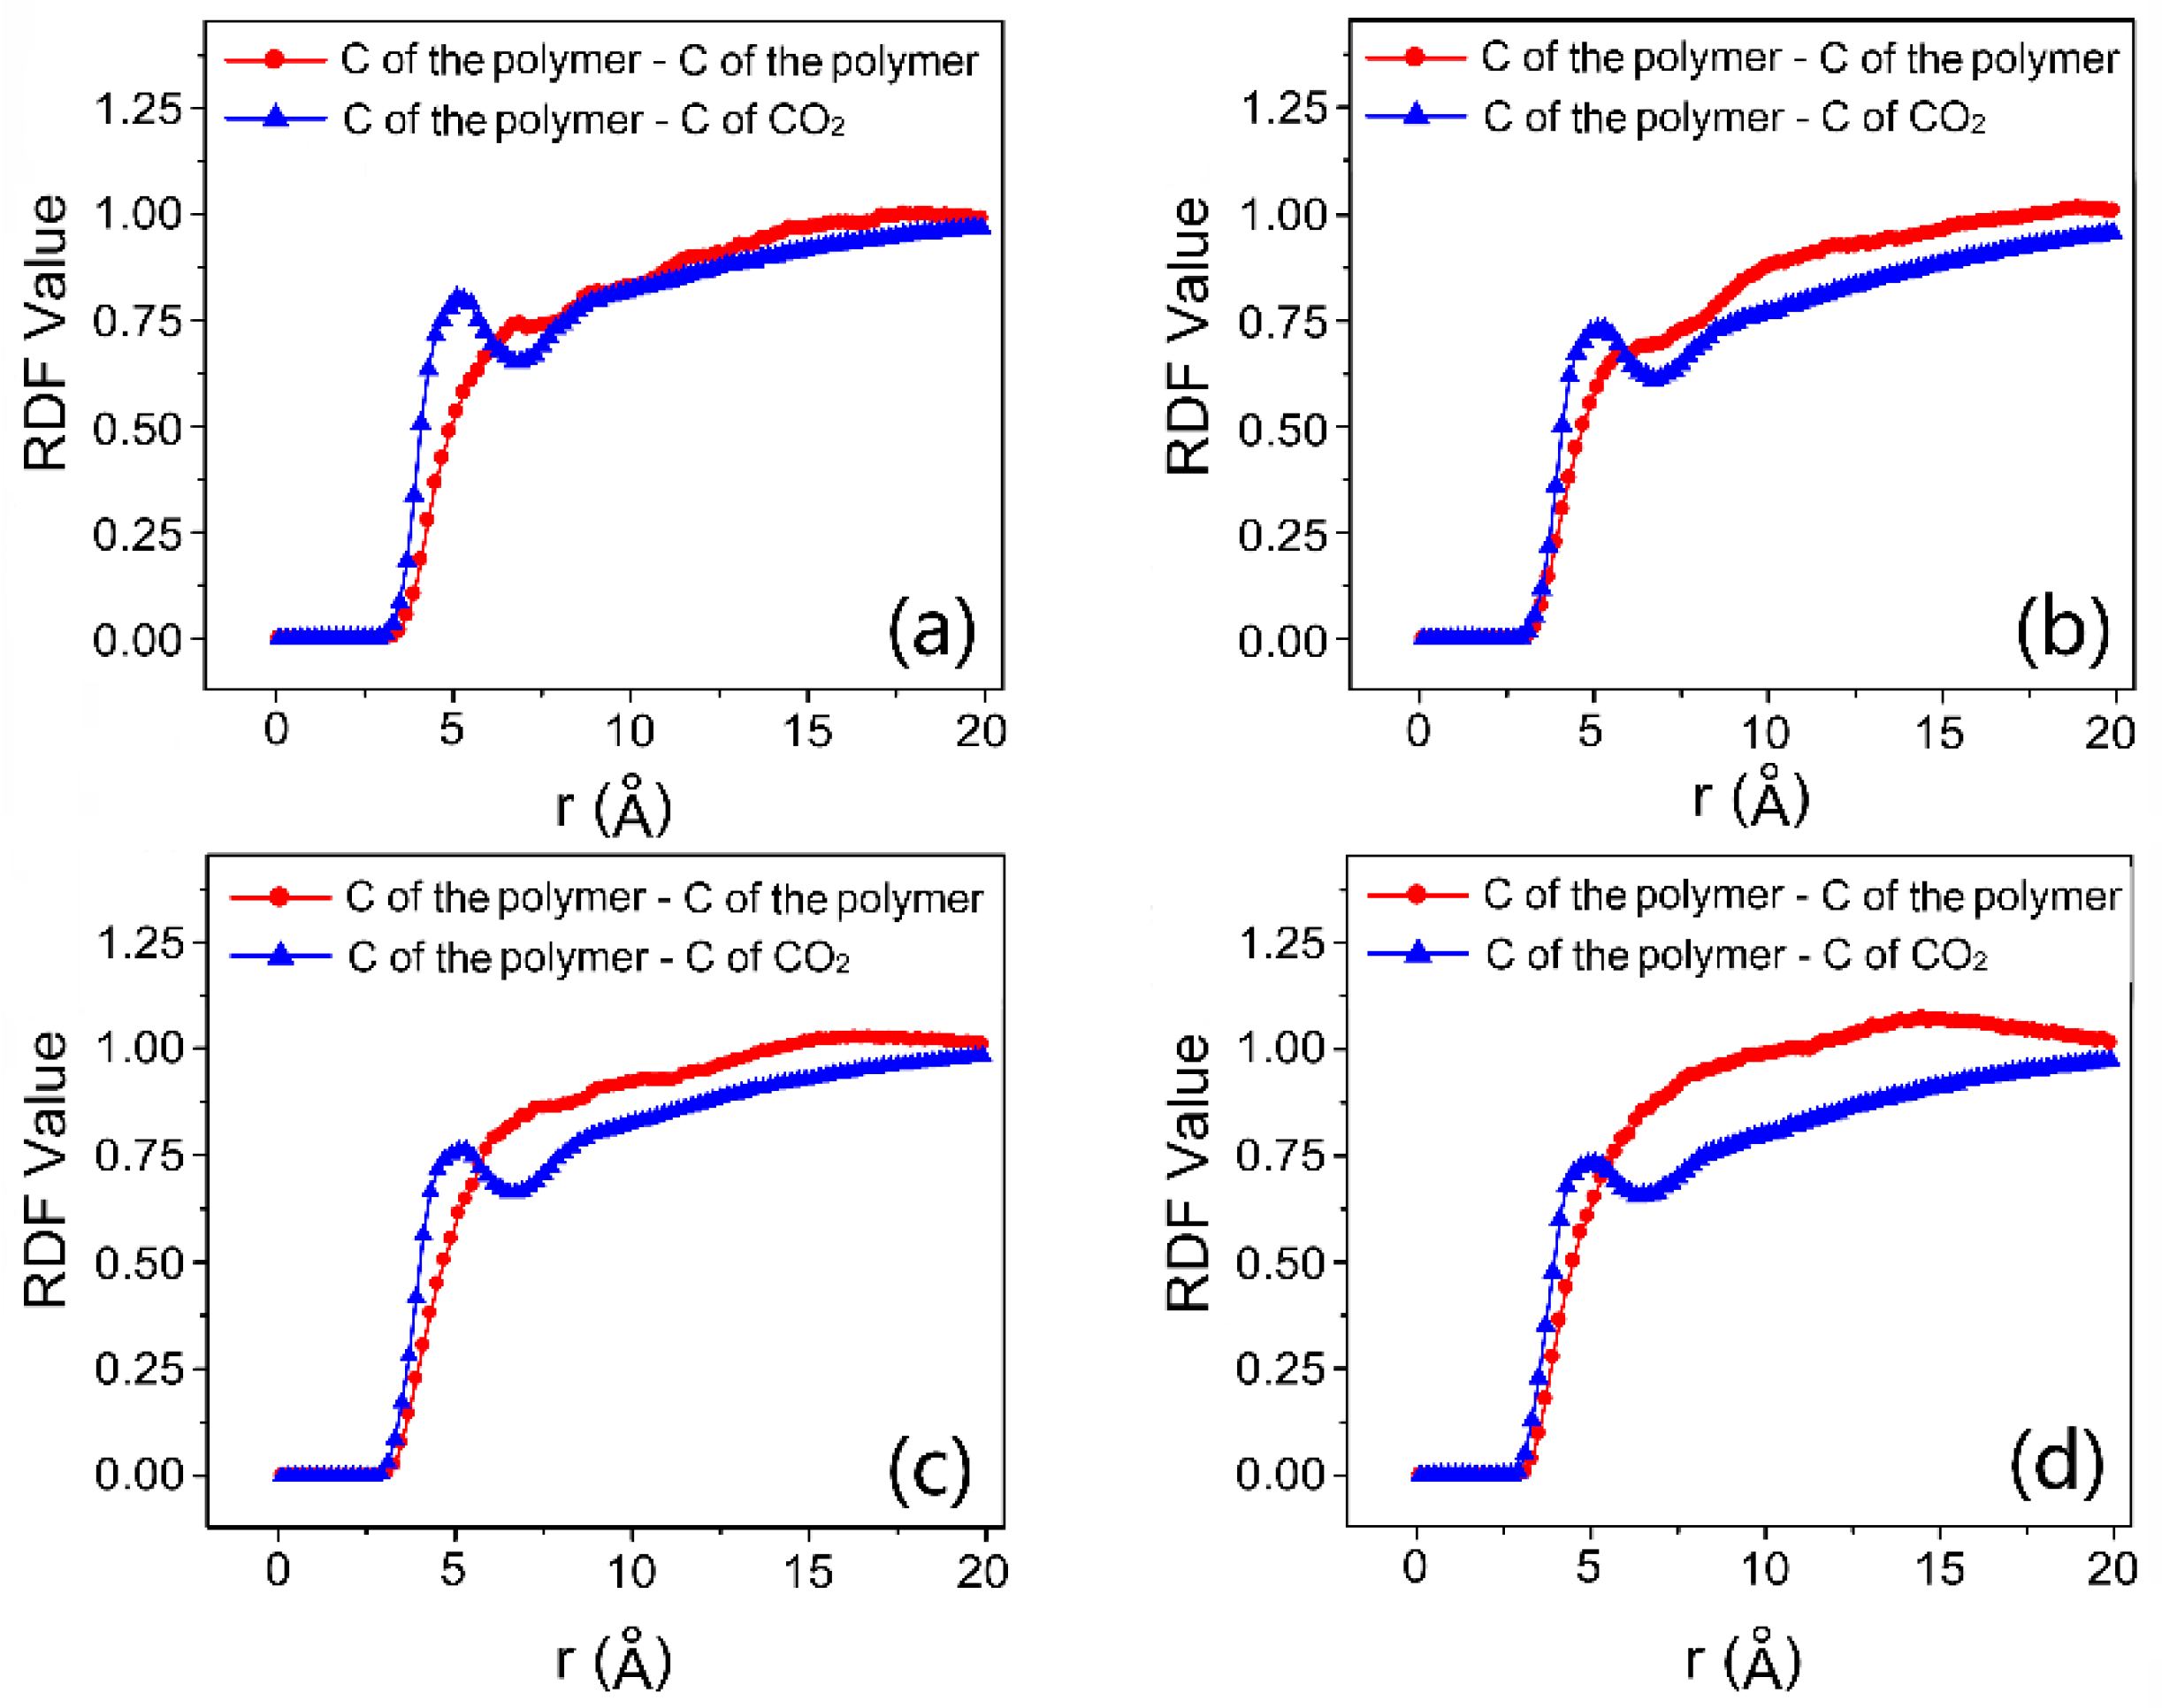
2.3. Molecular Dynamics Simulation

Two types of systems, which are namely the system with eight chains of co-polymer as well as the co-polymer–CO2 system with eight chains of co-polymer and 2000 molecules of CO2, were simulated by the Material Studio 7.0 (MS) package. All the force-field parameters of CO2 and polymers were determined by the COMPASS force-field. Firstly, HFDA and VBe repeat units were established. Four molecular modelings of P(HFDA-co-VBe) random co-polymers were constructed with different molar ratios of HFDA to VBe. PHFDA homopolymer was constructed with HFDA repeat units. The molecular modeling of P(HFDA-co-VBe) co-polymer is shown in Scheme 3.
Then, CO2 and polymer molecules were optimized by the Smart Minimizer of the Discover module. After this, the systems were constructed by the Amorphous Cell module. This module makes the boxes have periodic boundary conditions and constructs quasi-infinite system to represent the macro system precisely. The different systems simulated are shown in Table 1.
Five cycles of annealing calculation from 300 to 500 K was calculated by Anneal in the Forcite module to delay the systems. The optimized conformation of co-polymer–CO2 system is shown in Figure 2.
The MD simulation with 2000 ps was carried out in the NPT (constant-pressure, constant-temperature) ensemble at 25 MPa and 308.2 K. The electrostatic interactions were calculated using the Ewald summing algorithm and the van der Waals interactions were calculated using the atom-based summation. The time step was 1 fs and the frame output interval was 5000 ps. Andersen method was used for the temperature control and Berendsen method was used for the pressure control [33,34]. The final 500 ps equilibrium conformations were used for data analysis.

3. Results and Discussion

3.1. Synthesis and Characterization

The experimental results of the synthesis and physical properties of the co-polymer samples are shown in Table 2. With the enhancement of the molar ratio of VBe, the surface tension and glass transition temperature increased gradually. The molar mass measurement results showed that the differences of molar mass between the co-polymer samples were small, so the effects of molar mass on cloud point pressure and viscosification were not considered in this paper. The co-polymer compositions were determined by comparing the peak intensities of phenyl protons at 6.8 and 7.1 ppm (a and b) and methylene protons at 1.9 ppm (h). Taking the spectrum of P(HFDA0.87-co-VBe0.13) shown in Figure 3a as an example, the chemical shift of the H atoms in HFDA group at the point h was in the range of 1.8–2.0 ppm, while the chemical shift of the H atoms in VBe group at the point a and b was in the range of 6.5–7.2 ppm. The integral relative intensity of the peaks of h to a + b, was equal to the molar ratio of the two groups, which was HFDA/VBe = x:y = h/2:(a + b)/5 = 0.87:0.13 [32,33,34,35,36]. The co-polymerization ratios of the other co-polymers were obtained by the same method, which is shown in Figure 3b–d.

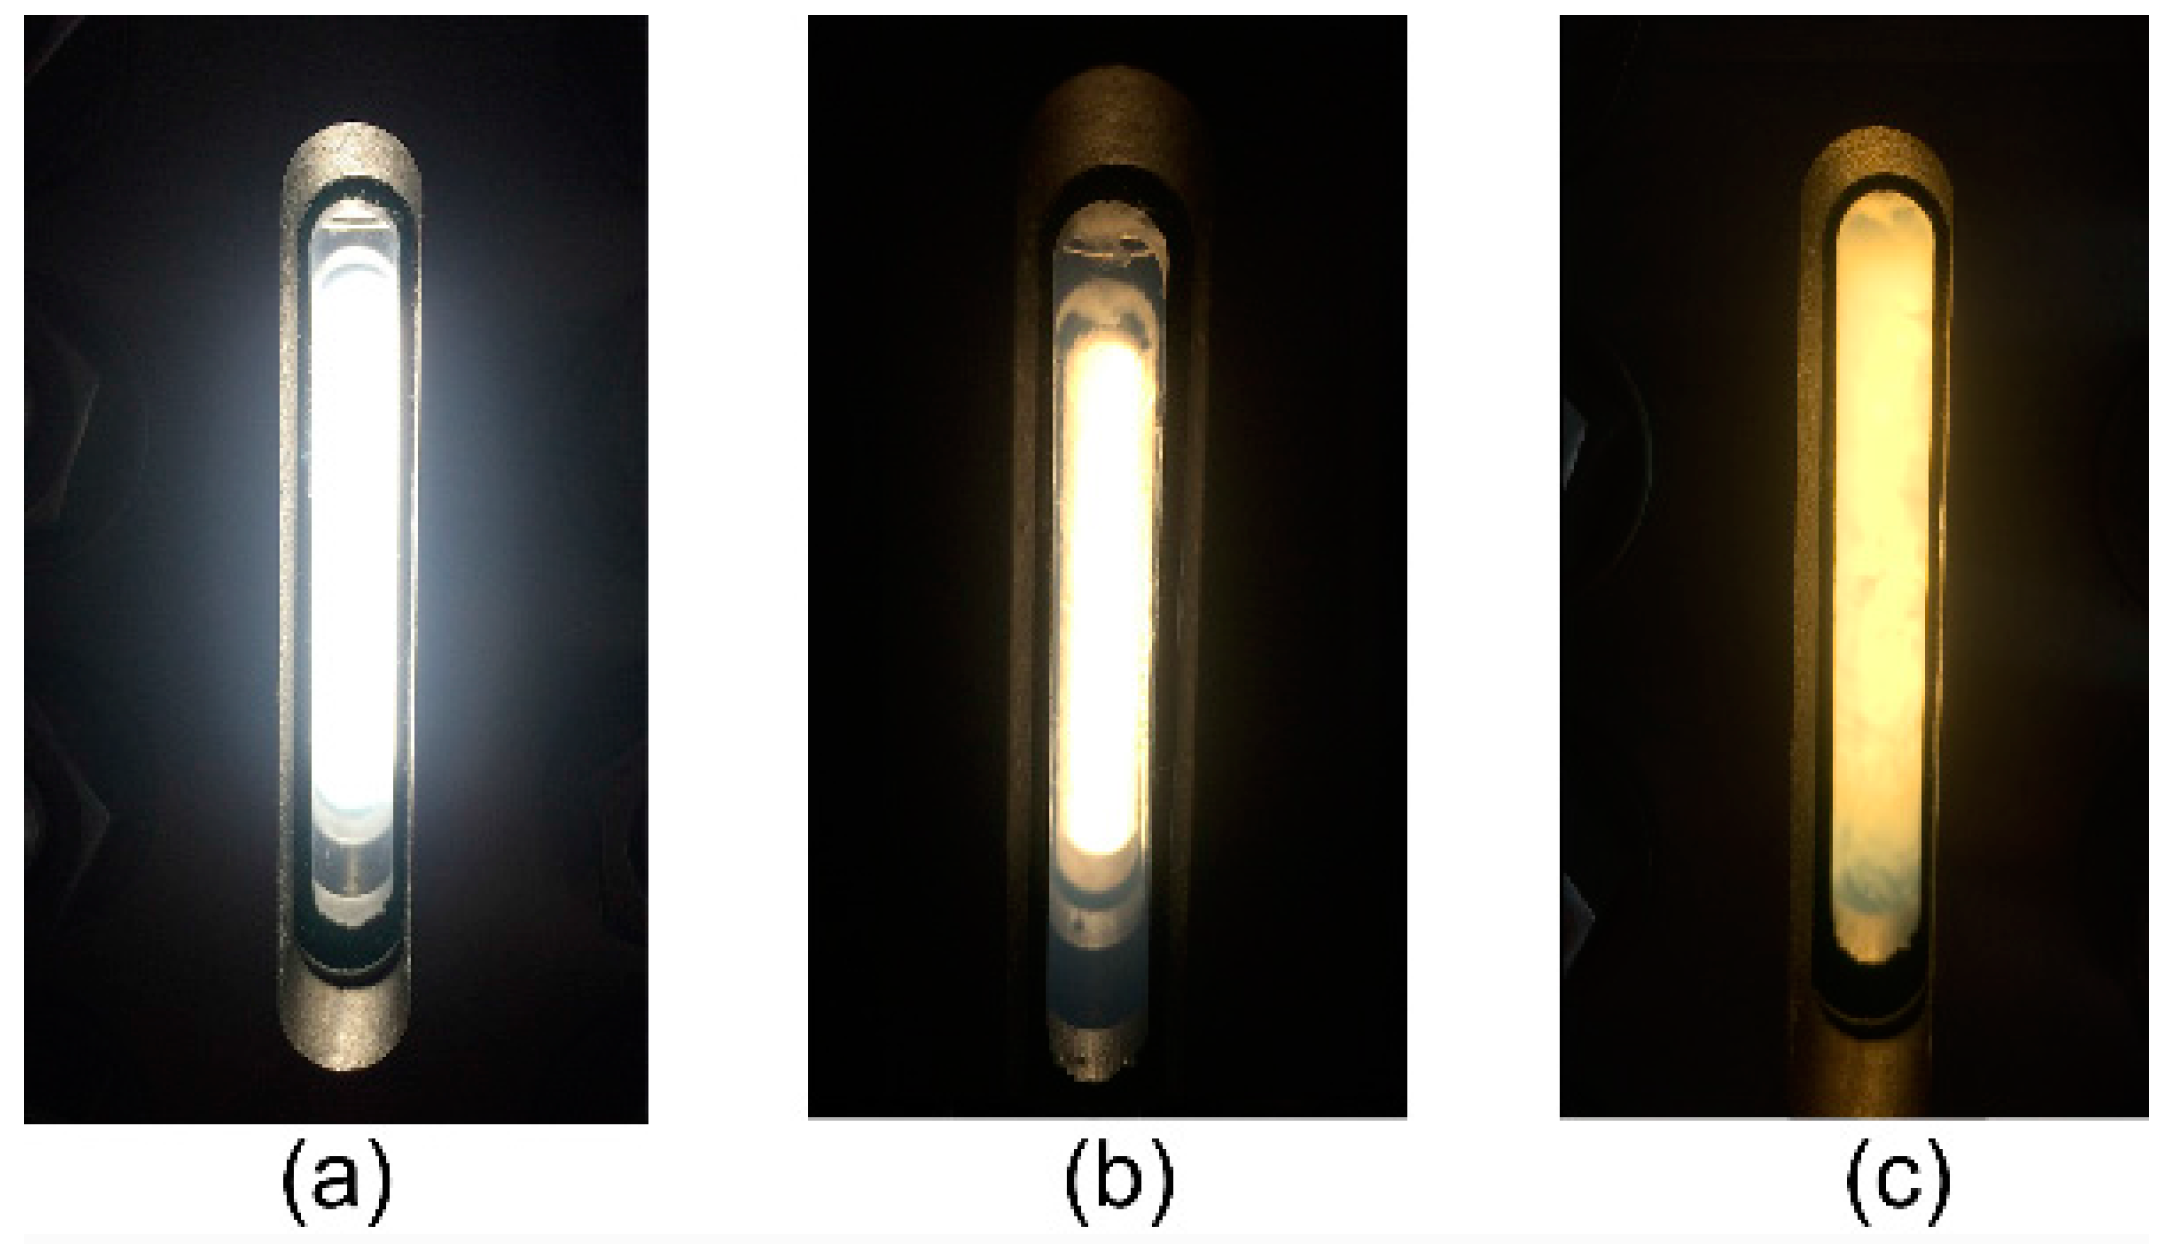
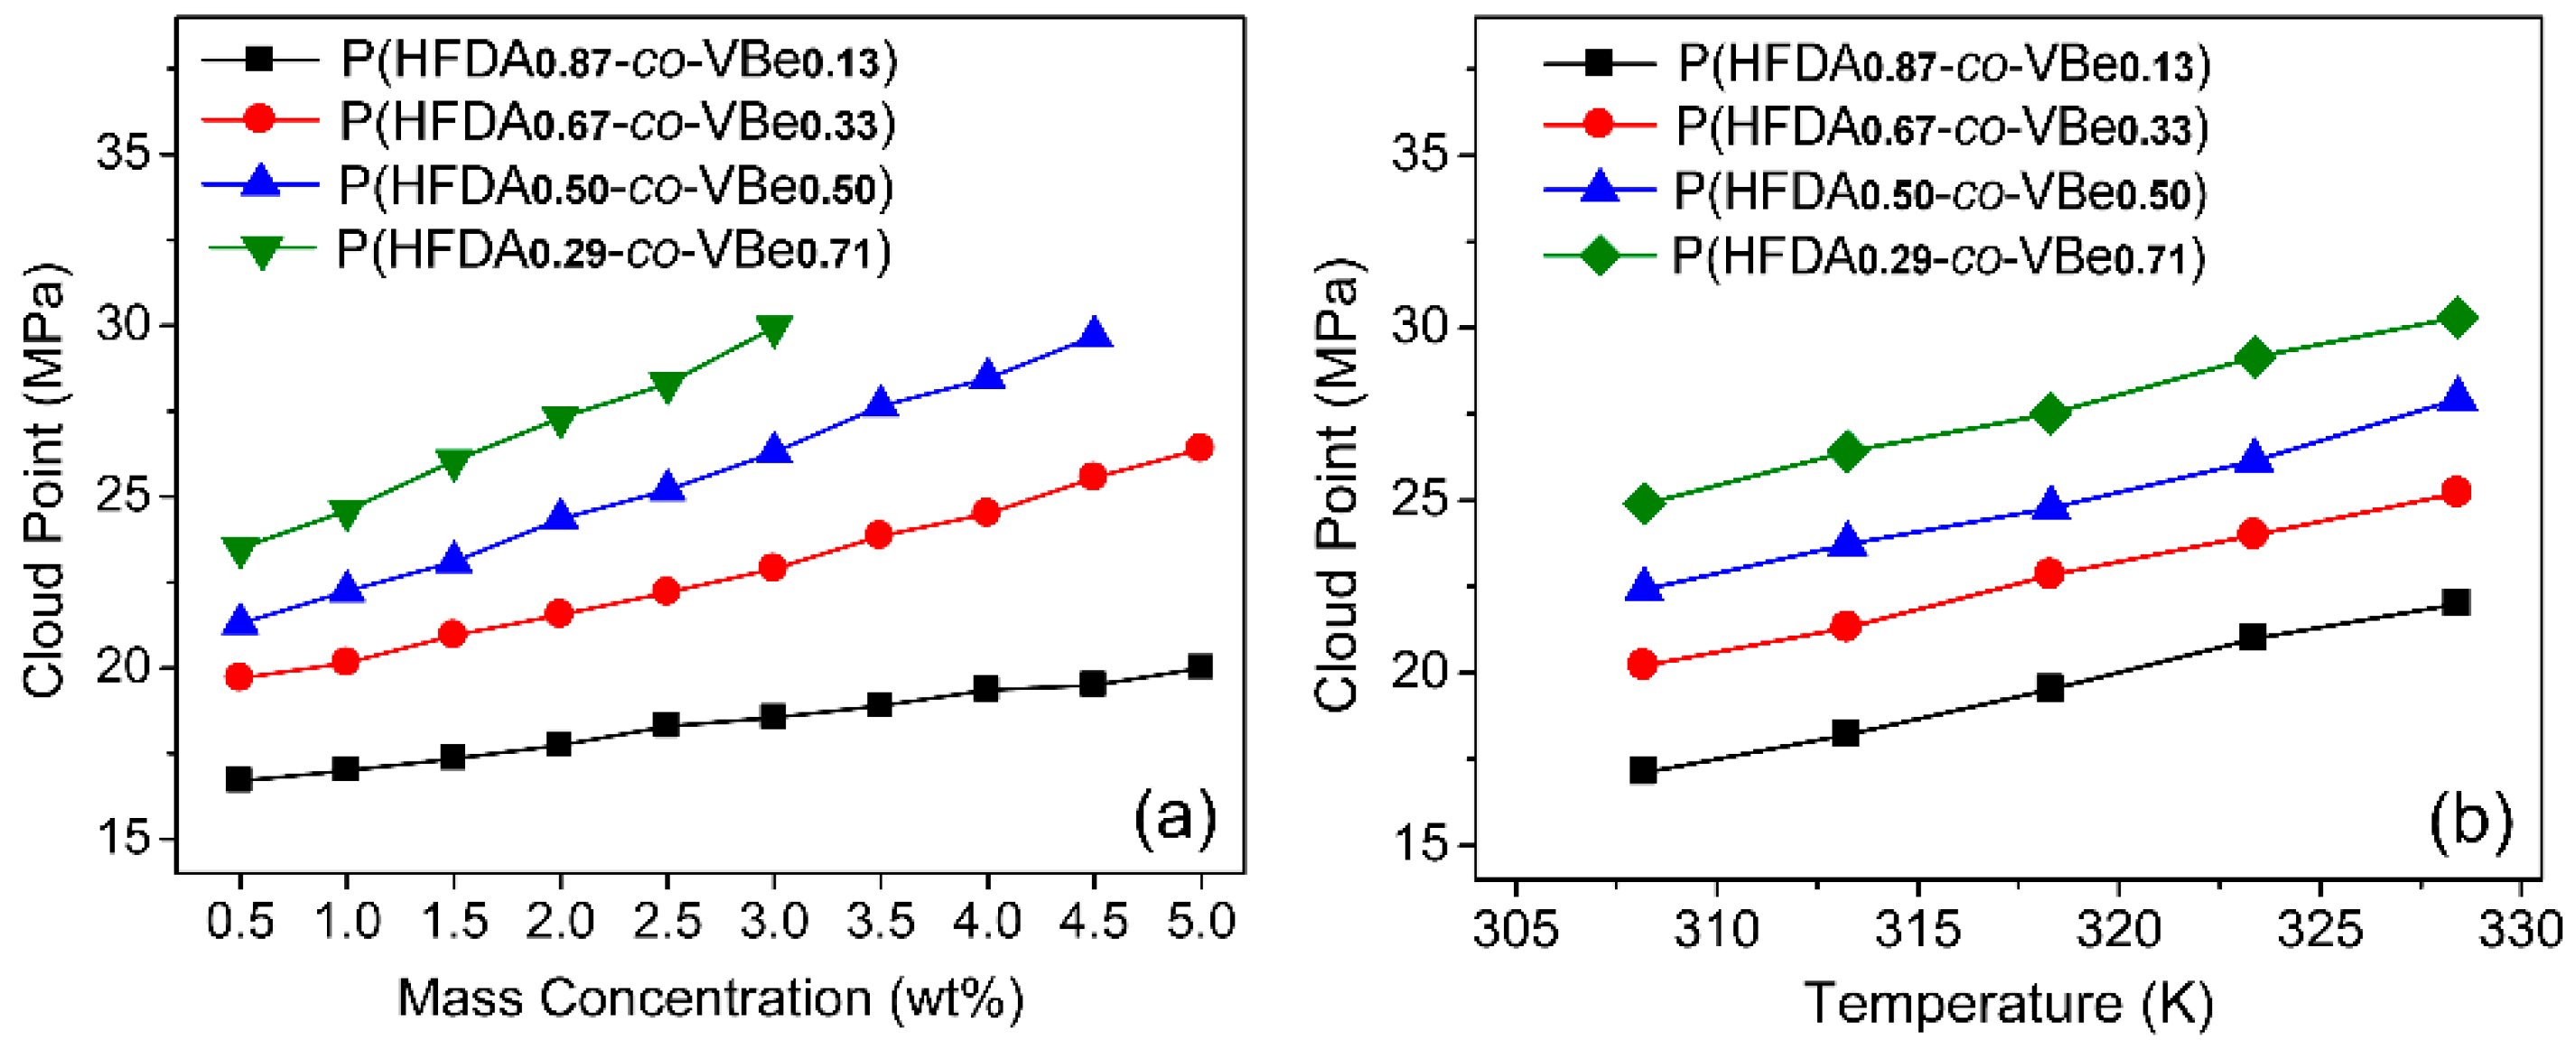
3.2. Solubility of Co-Polymers in SC-CO2

The cloud point pressure of the co-polymer–CO2 solution with mass concentration at 308.2 K and temperature at 1 wt. % of concentration are shown in Figure 4. As observed in Figure 4a, the cloud point pressures of the co-polymers gradually enhanced with an increase in the mass concentration. The cloud point curves also reflected the influence of the VBe molar ratio on cloud point pressures. With an increase in the molar ratio of VBe, the cloud point pressures of the co-polymers increased rapidly. It seemed that the VBe content had greater effect than the mass concentration in determining the solubility of the co-polymers. The cloud point pressure of the co-polymers increased with an increase in temperature, which is shown in Figure 4b. With the temperature rose from 308.2 K to 328.2 K, the cloud point pressures of the four co-polymers were found to increase by about 5 MPa equivalently. Obviously, the temperature has a significant effect on the solubility of the co-polymers in SC-CO2. This may be related to the change of CO2 properties caused by the change in temperature. When the temperature rose, the density and dielectric constant of CO2 decreased, so its dissolubility decreased [52]. To counteract the downfall of CO2 dissolubility, the pressure must be increased to enhance the co-polymer–CO2 interactions, which helped to balance the intermolecular interactions in the solutions [53].
The radial distribution function (RDF) is a common function used to study the microstructures and evaluate the intermolecular interactions, which refers to the spherically symmetric distribution probability of other particles in a space centered on a given particle. This can be calculated as follows [54,55]:
g α β ( r ) = V N α N β i = 1 N α n i β ( r ) 4 π r 2 Δ r ,
where gαβ(r) is the value of radial distribution function, Nα is the number of α particles; Nβ is the number of β particle; V is the volume of box simulated; and n(r) is the number of β particles in the space of (r, r + Δr) centered on α particles.
Solvation plays an important role in controlling the solubility of polymer in SC-CO2 [56]. The solvation behavior of the polymer in SC-CO2 depends on the relative strength of the solute-solvent interaction to the solvent-solvent interaction [57]. The enrichment or dispersion of CO2 around the polymer would determine the tendency of the polymer to gather or disperse in CO2 [58]. Intermolecular RDF has been used to evaluate the miscibility of polymer–solvent systems by investigating the solvation behavior. If the RDF values of atom pairs between polymer and solvent are greater than or almost equal to those of polymers, indicating the richness of the solvent around the polymer, the polymer would dissolve easily and may exhibit good solubility in the solvent [19,59,60]. The RDF statistical results for the C of the polymer–C of the polymer and C of the polymer–C of CO2 are shown in Figure 5. For the system of P(HFDA0.87-co-VBe0.13)-CO2, the RDF curve of C of the polymer–C of CO2 was almost equal to that of C of the polymer–C of the polymer as observed in Figure 5a. For the other three co-polymers, the RDF curves of C of the polymer–C of CO2 became significantly lower than that of C of the polymer–C of the polymer as shown in Figure 5b–d. With an increase in VBe content, the curve gaps between C of the polymer–C of CO2 and C of the polymer–C of the polymer increased gradually. The RDF results showed that the co-polymers with lower VBe content were more likely to be surrounded and solvated by CO2, thus indicating that they were more soluble in CO2.
Generally speaking, the solubility of polymers in SC-CO2 is dominated by polymer–CO2 interactions, polymer–polymer interaction and chain flexibility. The CO2-soluble polymers have strong polymer–CO2 interaction and weak polymer–polymer interactions, which is reflected by low surface tension. In addition, the high chain flexibility results in the polymers exhibiting the high entropy of mixing in CO2, which is reflected by the low glass transition temperature (Tg). The experimental results in Table 2 showed that with an increase of the molar ratio of VBe, the surface tension and Tg increased gradually, which indicated that the enhancement of polymer–polymer interaction and the decrease of chain flexibility. The polymer–CO2 interaction strength could be characterized by the interaction energy quantitatively, with a greater absolute value of the interaction energy indicating a stronger polymer–CO2 interaction. The interaction energies of co-polymer–CO2 and PHFDA–CO2 were examined by MD. As shown in Table 3, the interaction energy of PHFDA–CO2 was significantly greater than those of the four co-polymers. The interaction energy of co-polymer–CO2 trended downward along with the VBe molar ratio. This indicated that the import of VBe weakened the co-polymer–CO2 interaction.
In summary, with an increase in VBe content, the co-polymer–CO2 interaction energy decreased, the polymer–polymer interaction enhanced, the chain flexibility declined and resulted in unfavorable entropy of mixing, which resulted in a decrease the co-polymer solubility and an increase in the cloud point pressure of the co-polymer–CO2 system.

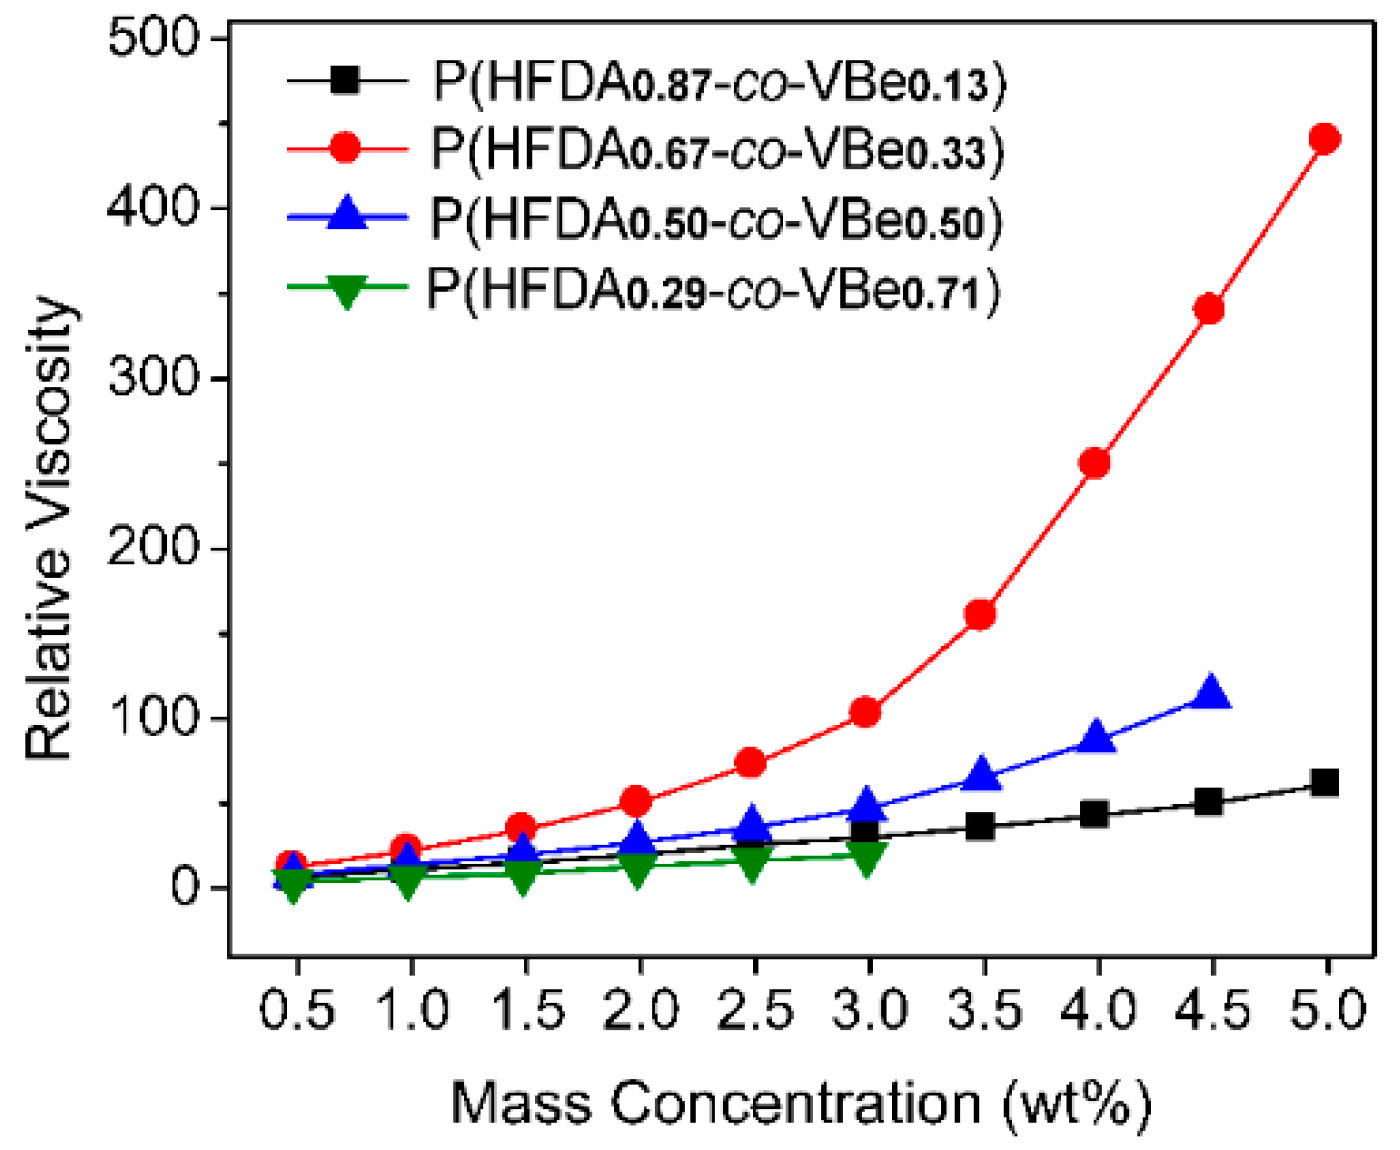
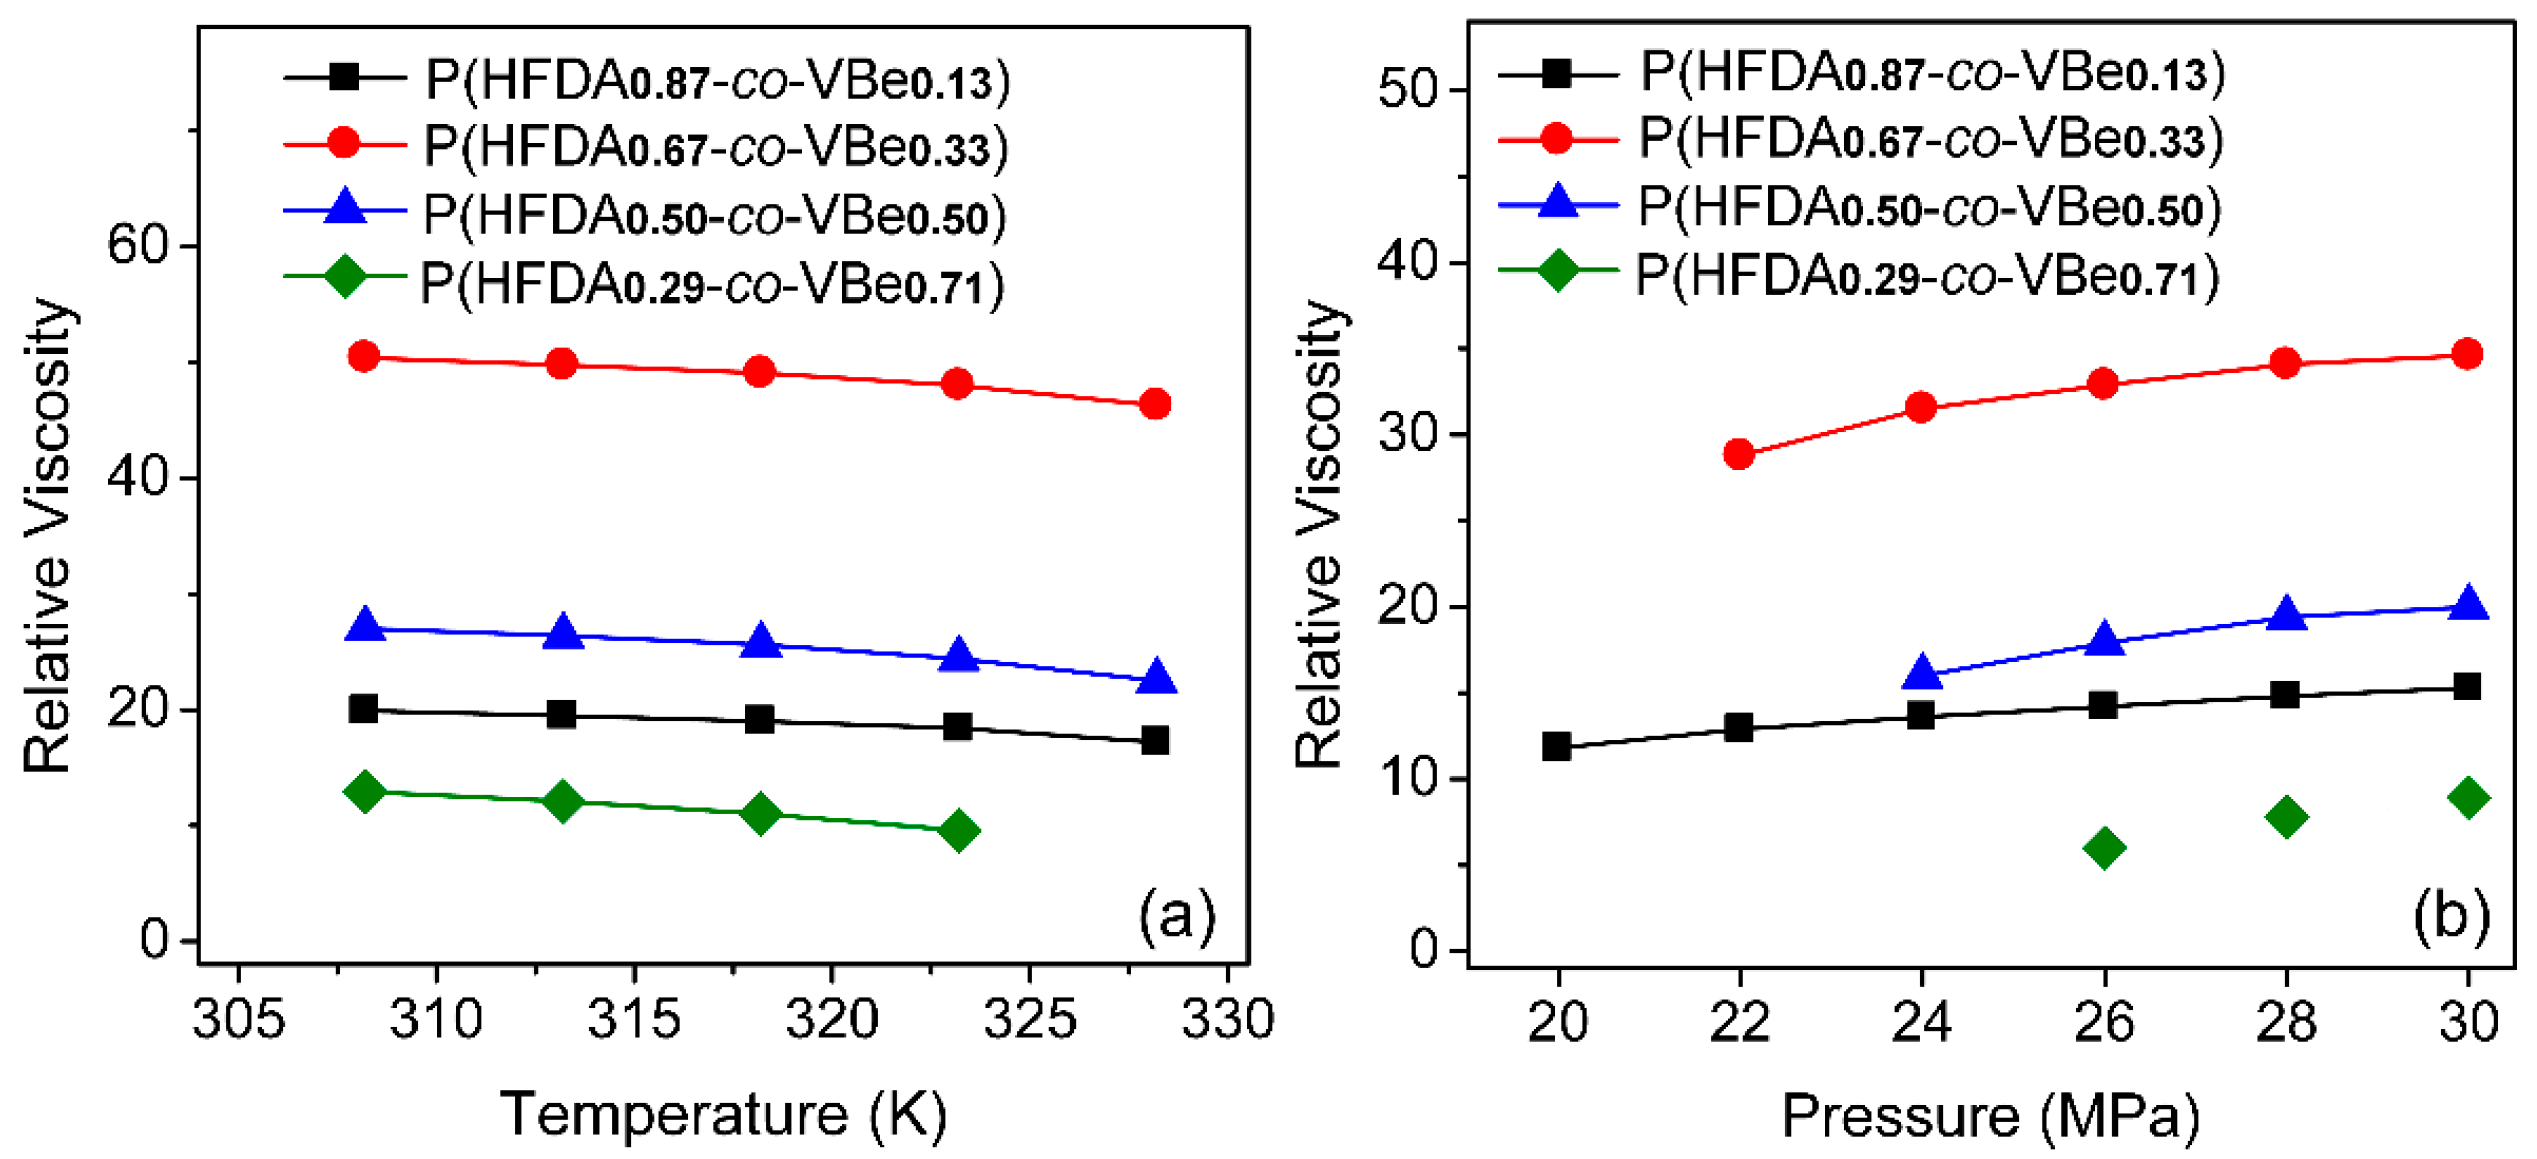
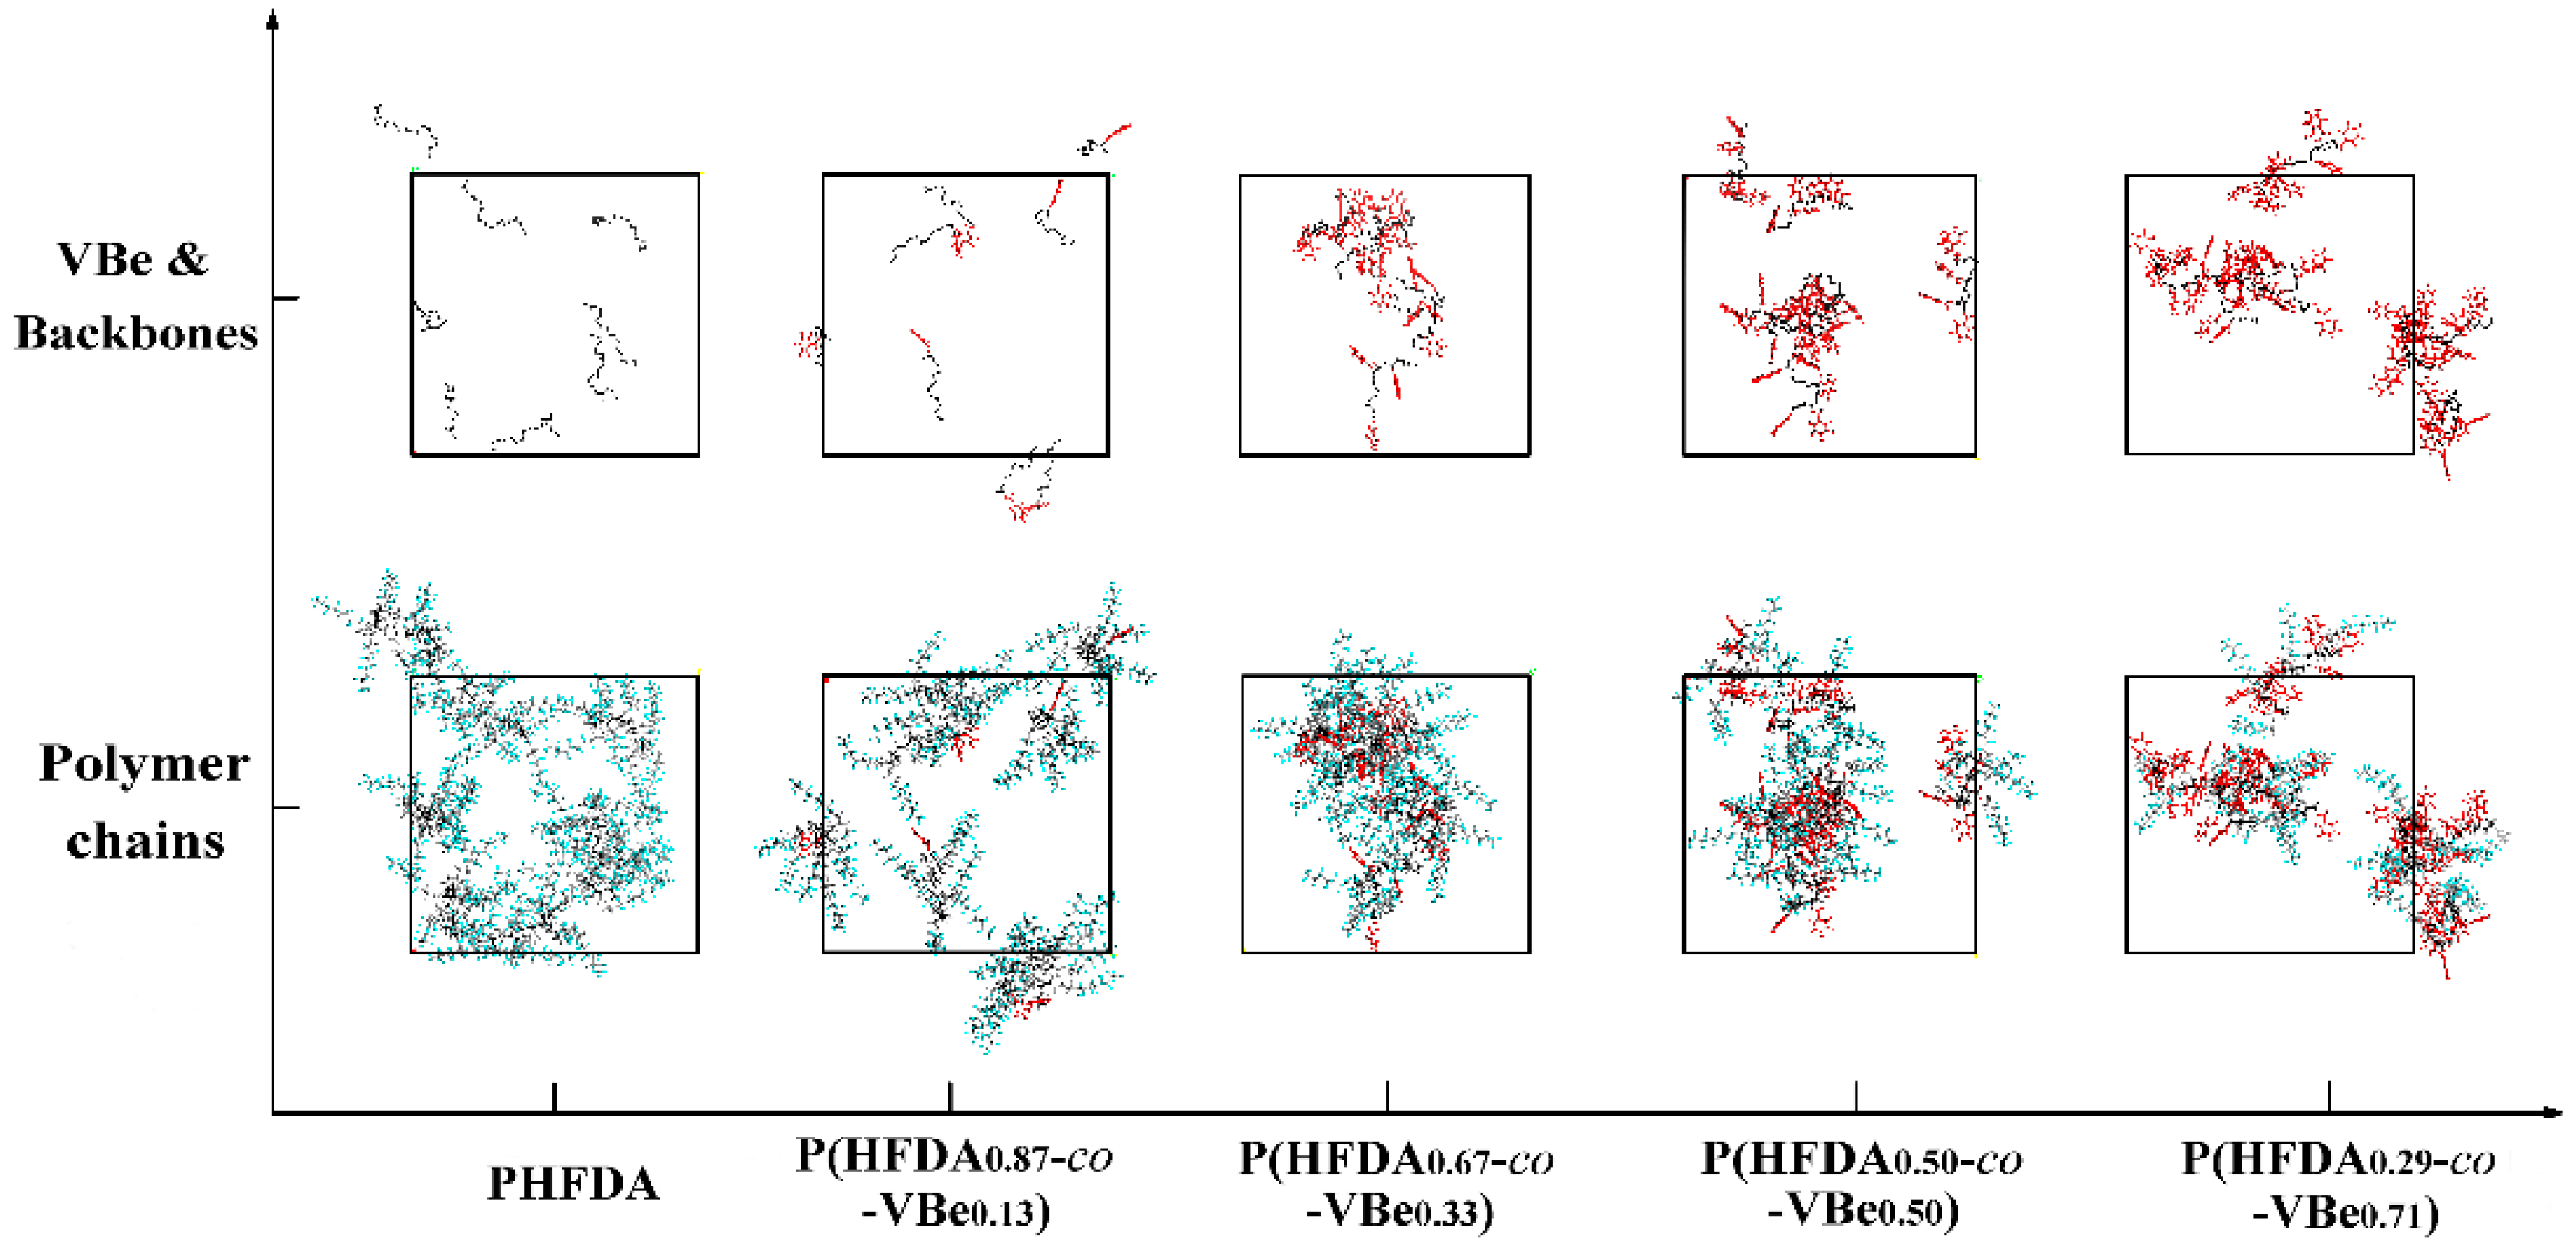
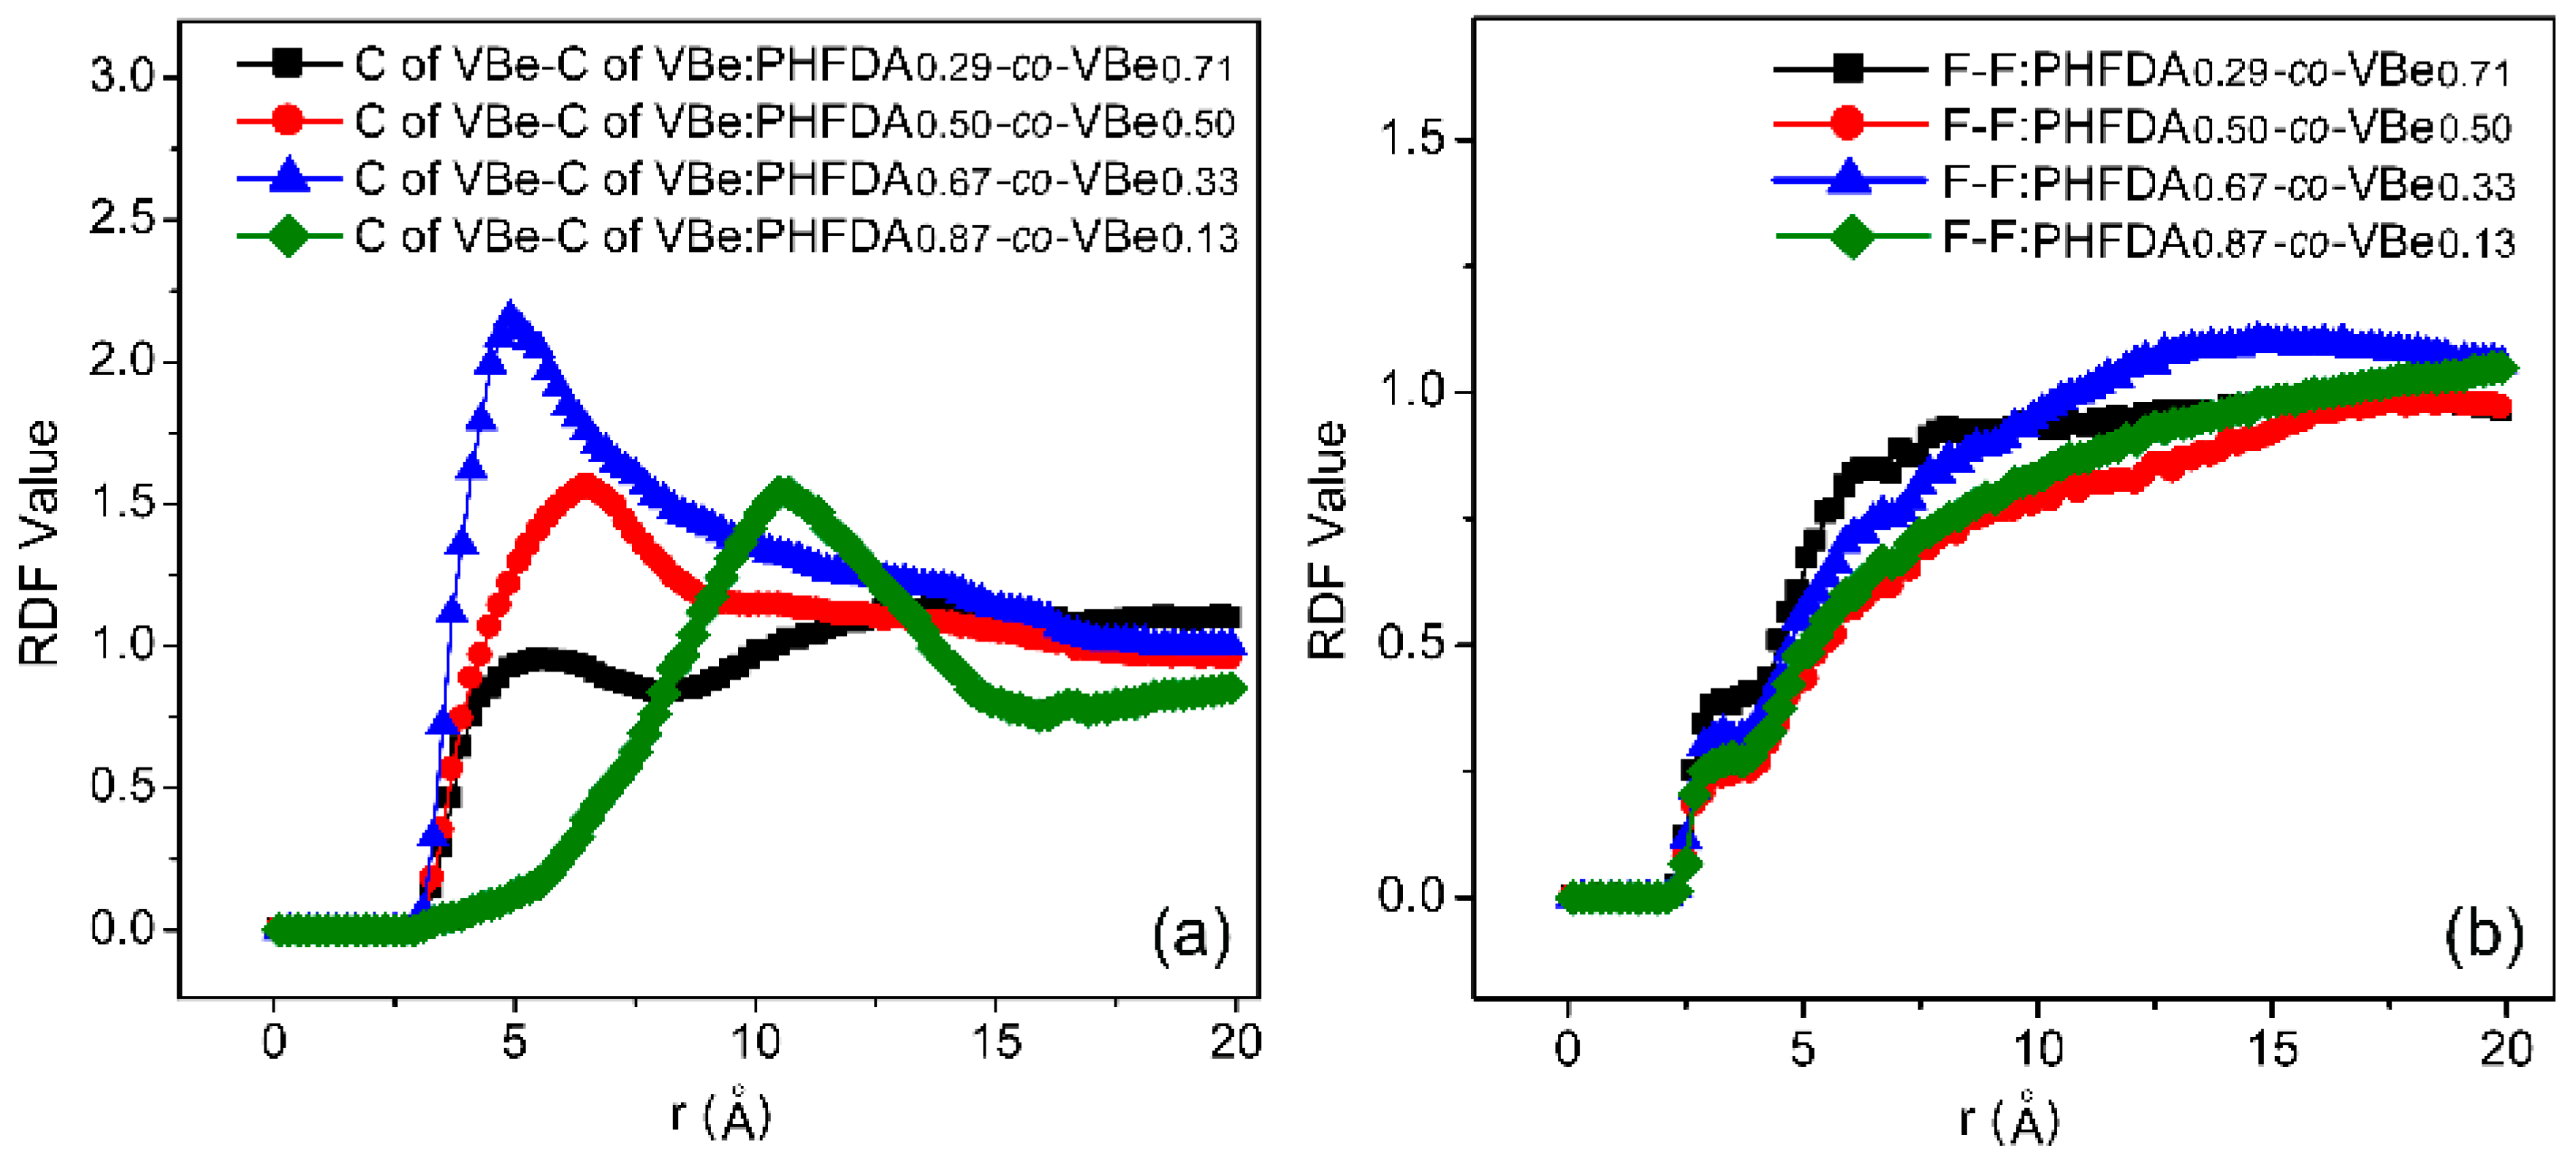
3.3. Thickening Capability of Co-Polymers in SC-CO2

The variations of the relative viscosity of the co-polymer–CO2 solutions against mass concentration at 308.2 K and 30 MPa were used to evaluate the viscosification, which is shown in Figure 6. This indicated that all the co-polymers could thicken SC-CO2 and the thickening capability increased with greater mass concentration. Unlike the solubility, the thickening capability did not vary with the VBe molar ratio linearly with a maximum occurring at 33.0 mol %. The P(HFDA0.67-co-VBe0.33) could enhance the viscosity of SC-CO2 by 438 times at 5 wt. %. The P(HFDA0.87-co-VBe0.13) with lower content of VBe did not enhance the viscosity of SC-CO2 significantly, while the thickening capabilities of P(HFDA0.29-co-VBe0.71) and P(HFDA0.50-co-VBe0.50) with higher content of VBe were also limited.
Figure 7a,b showed the relative viscosity of co-polymer–CO2 solution with 2 wt. % of concentration versus temperature at 30 MPa and versus pressure at 35 °C, respectively. As shown in the figure, the relative viscosity diminished with an increase in temperature, although this was enhanced with an increase in pressure. With an increase in temperature, the dissolubility of CO2 decreased, the co-polymer chains crimped, and the size of hydrodynamics became smaller, so the degree of intermolecular association decreased, leading to a decrease in thickening capability. At higher pressures, the solubility parameter and dissolubility of CO2 was enhanced [52,53], and the co-polymer chains were more stretched in solution, with the larger hydrodynamic size allowing the generation of stronger thickening capability through more intermolecular association.
To understand the thickening capability of the co-polymers intuitively, the equilibrium conformations of the co-polymers and the PHFDA in SC-CO2 obtained by molecular dynamics simulation were analyzed. As shown in Figure 8, there was no effective aggregation between the polymer chains for the PHFDA. The co-polymers containing VBe groups exhibited aggregation between polymer chains in different levels. It may be inferred that PHFDA lacked the basic power of triggering intermolecular association due to the weak polymer–polymer interaction, while the VBe group in the co-polymers could provide the driving power. The most obvious intermolecular association was initiated by P(HFDA0.67-co-VBe0.33), which formed effective molecular aggregates. The P(HFDA0.87-co-VBe0.13) with lower VBe content exhibited less inter-chain aggregation compared to P(HFDA0.67-co-VBe0.33). It was inferred that its poor thickening capabilities rooted in the lack intermolecular aggregation was due to the shortage of VBe groups. However, the excess of VBe groups would generate more intramolecular π-π stacking and a decrease in intermolecular π-π stacking, just as the equilibrium conformations shown in Figure 8. Therefore, the thickening capabilities of P(HFDA0.50-co-VBe0.50) and P(HFDA0.29-co-VBe0.71) with higher VBe content were not as good as P(HFDA0.67-co-VBe0.33). In this work, 33.0 mol % of VBe content of the co-polymer was the optimum value for generating the strongest intermolecular association and thus the best thickening performance.
The peak position and peak value of the radial distribution function could indicate the strength of the inter-group interaction indirectly. A smaller peak position and higher peak value represented the stronger interaction strength. Intermolecular RDFs for C-C pairs of the VBe groups and F-F pairs of the HFDA groups were used to further investigate the microstructure of the four co-polymer–CO2 systems quantitatively, with the results shown in Figure 9. As shown in Figure 9a, the distance of the RDF curves that achieved the values of greater than zero was about 2.9 Å. This indicated that the intermolecular interactions of VBe groups in the co-polymers were dominated by van der Waals forces. The RDF values and positions of the peaks were significantly different for the four polymer–CO2 systems. The RDF curve peak of P(HFDA0.67-co-VBe0.33) was the highest, while a peak appeared at the distance of 4.9 Å. The RDF curve peak heights of P(HFDA0.87-co-VBe0.13) and P(HFDA0.50-co-VBe0.50) were almost the same, but the peak of the former appeared at 10.7 Å, which was farther away than the 6.5 Å of the latter. No peak could be observed in the RDF curve of P(HFDA0.29-co-VBe0.71), which had the smallest RDF value. As shown in Figure 9b, all the curves showed similar trend and no obvious peak was observed. This indicated that the intermolecular interaction between HFDA groups in co-polymer was not strong enough to generate effective intermolecular associations. It may be related to the strong electronegativity and fluorine repulsion of F atoms in the HFDA group. By comparing the data in Figure 5 and Figure 9, it is not difficult to find that intermolecular aggregation occurs between the VBe groups not between HFDA groups. According to the results of experiments and simulations, the thickening capabilities of the co-polymers in SC-CO2 should be attributed to the π-π stacking of VBe group.

4. Conclusions

Four P(HFDA-co-VBe) co-polymers with different compositions were synthesized and evaluated. The molecular models of co-polymer–CO2 systems were established to study the molecular behaviors and intermolecular interactions by the all-atom MD simulation. We found that the π-π stacking of the VBe group played a decisive role in thickening SC-CO2. The solubility of the co-polymers decreased with an increase in VBe content, while the thickening capability did not vary with the VBe molar ratio linearly. The relative viscosity of the co-polymers reached its maximum of 438 at a VBe molar ratio of 33.0% in this work. Less VBe content resulted in the lack of intermolecular π-π stacking, while excessive VBe content generated more intramolecular π-π stacking and less intermolecular π-π stacking. This work provided the molecular insights into the relationship of co-polymer structure with the activity by the study of intermolecular interactions. The thickening capability of ternary co-polymer or polymer surfactant in SC-CO2 will be discussed in future studies.

Acknowledgments

The authors acknowledge the support from the Key Program of National Natural Science Foundation of China (No. U1262202), Changjiang scholars and innovation corps development plan of China’s ministry of education (No. IRT_14R58).

Author Contributions

Wenchao Sun and Baojiang Sun conceived and designed the experiments; Wenchao Sun performed the experiments; Wenchao Sun, Ying Li and Haoyang Sun performed the molecular simulations; Wenchao Sun, Baojiang Sun, Ying Li, Xiaonan Huang and Haiming Fan analyzed the data; Haiming Fan, Wenxia Sun and Xinxin Zhao contributed reagents/materials/analysis tools; Wenchao Sun and Baojiang Sun wrote the paper.

Conflicts of Interest

The authors declare no conflict of interest.

References

  1. Sampath, K.H.S.M.; Perera, M.S.A.; Ranjith, P.G.; Matthai, S.K.; Rathnaweer, T.; Zhang, G.; Tao, X. CH4-CO2 gas exchange and supercritical CO2 based hydraulic fracturing as CBM production-accelerating techniques: A review. J. CO2 Util. 2017, 22, 212–230. [Google Scholar] [CrossRef]
  2. Hou, L.; Sun, B.; Geng, X.; Jiang, T.; Wang, Z. Study of the slippage of particle/supercritical CO2 two-phase flow. J. Supercrit. Fluids 2017, 120, 173–180. [Google Scholar] [CrossRef]
  3. Middleton, R.S.; Carey, J.W.; Currier, R.P.; Hyman, D.; Kang, Q.; Karra, S.; Jiménez-Martínez, J.M.; Porter, L.; Viswanathan, H.S. Shale gas and non-aqueous fracturing fluids: Opportunities and challenges for supercritical CO2. Appl. Energy 2015, 147, 500–509. [Google Scholar] [CrossRef]
  4. Xu, J. CO2 Thickening Agents for Reduced CO2 Mobility; University of Pittsburgh: Pittsburgh, PA, USA, 2003. [Google Scholar]
  5. Hou, L.; Sun, B.; Wang, Z.; Li, Q. Experimental study of particle settling in supercritical carbon dioxide. J. Supercrit. Fluids 2015, 100, 121–128. [Google Scholar] [CrossRef]
  6. Xu, J.; Wlaschin, A.; Enick, R.M. Thickening carbon dioxide with the fluoroacrylate-styrene copolymer. SPE J. 2003, 8, 85–91. [Google Scholar] [CrossRef]
  7. Hou, L.; Jiang, T.; Liu, H.; Geng, X.; Sun, B.; Li, G.; Meng, S. An evaluation method of supercritical CO2 thickening result for particle transporting. J. CO2 Util. 2017, 21, 247–252. [Google Scholar] [CrossRef]
  8. O’Neill, M.L.; Cao, Q.; Fang, A.M.; Johnston, K.P.; Wilkinson, S.P.; Smith, C.D.; Kerschner, J.L.; Jureller, S.H. Solubility of Homopolymers and Copolymers in Carbon Dioxide. Ind. Eng. Chem. Res. 1998, 37, 3067–3079. [Google Scholar] [CrossRef]
  9. Sarbu, T.; Styranec, T.J.; Beckman, E.J. Design and Synthesis of Low Cost, Sustainable CO2-philes. Ind. Eng. Chem. Res. 2000, 39, 4678–4683. [Google Scholar] [CrossRef]
  10. Guan, Z.; Combes, J.R.; Menceloglu, Y.Z.; Desimone, J.M. Homogeneous free radical polymerizations in supercritical carbon dioxide. Macromolecules 1993, 26, 2663–2669. [Google Scholar] [CrossRef]
  11. McHugh, M.A.; Park, I.H.; Reisinger, J.J.; Ren, Y.; Lodge, T.P.; Hillmyer, M.A. Solubility of CF2-modified polybutadiene and polyisoprene in supercritical carbon dioxide. Macromolecules 2002, 35, 4653–4657. [Google Scholar] [CrossRef]
  12. Kazarian, S.G.; Vincent, M.F.; Bright, F.V.; Lioota, C.L.; Eckert, C.A. Specific intermolecular interaction of carbon dioxide with polymers. J. Am. Chem. Soc. 1996, 118, 1729–1736. [Google Scholar] [CrossRef]
  13. Wang, Y.; Hong, L.; Tapriyal, D.; Kim, I.C.; Paik, I.-H.; Crosthwaite, J.M.; Hamilton, A.D.; Thies, M.C.; Beckman, E.J.; Enick, R.M.; et al. Design and evaluation of nonfluorous CO2-soluble oligomers and polymers. J. Phys. Chem. B 2009, 113, 14971–14980. [Google Scholar] [CrossRef] [PubMed]
  14. Raveendran, P.; Wallen, S.L. Cooperative C–H···O hydrogen bonding in CO2 lewis base complexes: Implications for solvation in supercritical CO2. J. Am. Chem. Soc. 2002, 124, 12590–12599. [Google Scholar] [CrossRef] [PubMed]
  15. Blatchford, M.A.; Raveendran, P.; Wallen, S.L. Spectroscopic studies of model carbonyl compounds in CO2: Evidence for cooperative C–H···O interactions. J. Phys. Chem. A 2003, 107, 10311–10323. [Google Scholar] [CrossRef]
  16. Blatchford, M.A.; Raveendran, P.; Wallen, S.L. Raman spectroscopic evidence for cooperative C–H···O interactions in the acetaldehyde-CO2 complex. J. Am. Chem. Soc. 2002, 124, 14818–14819. [Google Scholar] [CrossRef] [PubMed]
  17. Girard, E.; Tassaing, T.; Marty, J.-D.; Destarac, M. Influence of macromolecular characteristics of RAFT/MADIX poly(vinyl acetate)-based (co)polymers on their solubility in supercritical carbon dioxide. Polym. Chem. 2011, 2, 2222–2230. [Google Scholar] [CrossRef]
  18. Gregorowicz, J.; Wawrzyńska, E.P.; Parzuchowski, P.G.; Fraś, Z.; Rokicki, G.; Wojciechowski, K.; Wieczorek, S.A.; Wiśniewska, A.; Plichta, A.; Dąbrowski, K.; et al. Synthesis, characterization, and solubility in supercritical carbon dioxide of hyperbranched copolyesters. Macromolecules 2013, 46, 7180–7195. [Google Scholar] [CrossRef]
  19. Clancy, T.C.; Mattice, W.L. Miscibility of poly(vinyl chloride) melts composed of mixtures of chains with differing stereochemical composition and stereochemical sequence. Macromolecules 2001, 34, 6482–6486. [Google Scholar] [CrossRef]
  20. Baradie, B.; Shoichet, M.S.; Shen, Z.; McHugh, M.; Hong, L.; Wang, Y.; Johnson, J.K.; Beckman, E.J.; Enick, R.M. Synthesis and solubility of linear poly(tetrafluoroethylene-co-vinyl acetate) in dense CO2: Experimental and molecular modeling results. Macromolecules 2004, 37, 7799–7807. [Google Scholar] [CrossRef]
  21. Huang, Z.; Shi, C.; Xu, J.; Kilic, S.; Enick, R.M.; Beckman, E.J. Enhancement of the viscosity of carbon dioxide using styrene/fluoroacrylate copolymers. Macromolecules 2000, 33, 5437–5442. [Google Scholar] [CrossRef]
  22. Zhang, S.; Luo, Y.; Yang, H.; Yang, H.-J.; Tan, B. Functional oligo(vinyl acetate) bearing bipyridine moieties by RAFT polymerization and extraction of metal ions in supercritical carbon dioxide. Polym. Chem. 2013, 4, 3507–3513. [Google Scholar] [CrossRef]
  23. Foltran, S.; Maisonneuve, L.; Cloutet, E.; Gadenne, B.; Alfos, C.; Tassaing, T.; Cramail, H. Solubility in CO2 and swelling studies by in situ IR spectroscopy of vegetable-based epoxidized oils as polyurethane precursors. Polym. Chem. 2012, 3, 525–532. [Google Scholar] [CrossRef]
  24. Jennings, J.; Bassett, S.P.; Hermida-Merino, D.; Portale, G.; Bras, W.; Knight, L.; Titman, J.; Higuchi, T.; Jinnaic, H.; Howdle, S.M. How does dense phase CO2 influence the phase behavior of block copolymers synthesised by dispersion polymerisation? Polym. Chem. 2016, 7, 905–916. [Google Scholar] [CrossRef]
  25. Sarbu, T.; Styranec, T.; Beckman, E.J. Non-fluorous polymers with very high solubility in supercritical CO2 down to low pressures. Nature 2000, 405, 165–168. [Google Scholar] [CrossRef] [PubMed]
  26. Kilic, S.; Michalik, S.; Wang, Y.; Johnson, J.K.; Enick, R.M.; Beckman, E.J. Effect of grafted lewis base groups on the phase behavior of model Poly(dimethyl siloxanes) in CO2. Ind. Eng. Chem. Res. 2003, 42, 6415–6424. [Google Scholar] [CrossRef]
  27. Maisonneuve, L.; Lebarbe, T.; Grau, E.; Cramail, H. Structure-properties relationship of fatty acid-based thermoplastics as synthetic polymer mimics. Polym. Chem. 2013, 4, 5472–5517. [Google Scholar] [CrossRef]
  28. Girard, E.; Liu, X.; Marty, J.-D.; Destarac, M. RAFT/MADIX (co)polymerization of vinyl trifl uoroacetate: A means to many ends. Polym. Chem. 2014, 5, 1013–1022. [Google Scholar] [CrossRef]
  29. Kilic, S.; Wang, Y.; Johnson, J.K.; Beckman, E.J.; Enick, R.M. Influence of tert-amine groups on the solubility of polymers in CO2. Polymer 2009, 50, 2436–2444. [Google Scholar] [CrossRef]
  30. Hu, D.; Sun, S.; Yuan, P.; Zhao, L.; Liu, T. Evaluation of CO2-philicity of poly(vinyl acetate) and poly(vinyl acetate-alt-maleate) copolymers through molecular modeling and dissolution behavior measurement. J. Phys. Chem. B 2015, 119, 3194–3204. [Google Scholar] [CrossRef] [PubMed]
  31. Hu, D.; Sun, S.; Yuan, P.; Zhao, L.; Liu, T. Effect of molecular weight on CO2-philicity of poly(vinyl acetate) with different molecular chain structure. J. Supercrit. Fluids 2016, 118, 96–106. [Google Scholar] [CrossRef]
  32. Pandiyan, S.; Brown, D.; Neyertz, S.; van der Vegt, N.F. Carbon dioxide solubility in three fluorinated polyimides studied by molecular dynamics simulations. Macromolecules 2010, 43, 2605–2621. [Google Scholar] [CrossRef]
  33. Hu, D.; Sun, S.; Yuan, P.; Zhao, L.; Liu, T. Exploration of CO2-philicity of poly(vinyl acetate-co-alkyl vinyl ether) through molecular modeling and dissolution behavior measurement. J. Phys. Chem. B 2015, 119, 12490–12501. [Google Scholar] [CrossRef] [PubMed]
  34. Sun, W.; Sun, B.; Li, Y.; Fan, H.; Gao, Y.; Sun, H.; Li, G. Microcosmic understanding on thickening capability of copolymers in supercritical carbon dioxide: The key role of π-π stacking. RSC Adv. 2017, 7, 34567–34573. [Google Scholar] [CrossRef]
  35. Birkin, N.A.; Wildig, O.J.; Howdle, S.M. Effects of poly(vinyl pivalate)-based stabilizer architecture on CO2-solubility and stabilising ability in dispersion polymerisation of N-vinyl pyrrolidone. Polym. Chem. 2013, 4, 3791–3799. [Google Scholar] [CrossRef]
  36. Girard, E.; Tassaing, T.; Ladavière, C.; Marty, J.-D.; Destarac, M. Distinctive features of solubility of RAFT/MADIX-derived partially trifluoromethylated poly(vinyl acetate) in supercritical CO2. Macromolecules 2012, 45, 9674–9681. [Google Scholar] [CrossRef]
  37. Girard, E.; Tassaing, T.; Camy, S.; Condoret, J.S.; Marty, J.D.; Destarac, M. Enhancement of poly(vinyl ester) solubility in supercritical CO2 by partial fluorination: The key role of polymer–polymer interactions. J. Am. Chem. Soc. 2012, 134, 11920–11923. [Google Scholar] [CrossRef] [PubMed]
  38. Meyer, A.; Jones, N.; Lyle, S.; Venkataramani, S.; Clark, J.; Kranbuehl, D. Laser light-scattering molecular weight analysis of a poly(fluoroacrylate). J. Appl. Polym. Sci. 2010, 91, 3447–3454. [Google Scholar] [CrossRef]
  39. Evain, K.; Illien, B.; Chabanel, M.; Beignon, M. Comparison of proutière and Carr-Zimm theories for static light-scattering molecular weight determination: Application to surfactants in solution. J. Phys. Chem. B 2007, 111, 1597–1603. [Google Scholar] [CrossRef] [PubMed]
  40. Li, X.; Monsuur, F.; Denoulet, B.; Dobrak, A.; Vandezande, P.; Vankelecom, I.J. Evaporative light scattering detector: Toward a general molecular weight cutoff characterization of nanofiltration membranes. Anal. Chem. 2009, 81, 1801–1809. [Google Scholar] [CrossRef] [PubMed]
  41. Li, X.; Mya, K.Y.; Ni, X.; He, C.; Leong, K.W.; Li, J. Dynamic and static light scattering studies on self-aggregation behavior of biodegradable amphiphilic poly(ethylene oxide)-poly[(R)-3-hydroxybutyrate]−poly(ethylene oxide) triblock copolymers in aqueous solution. J. Phys. Chem. B 2006, 110, 5920–5926. [Google Scholar] [CrossRef] [PubMed]
  42. Pencer, J.; Hallett, F.R. Effects of vesicle size and shape on static and dynamic light scattering measurements. Langmuir 2003, 19, 7488–7497. [Google Scholar] [CrossRef]
  43. Schatz, C.; Pichot, C.; Delair, T.; Viton, A.C.; Domard, A. Static light scattering studies on chitosan solutions: From macromolecular chains to colloidal dispersions. Langmuir 2003, 19, 9896–9903. [Google Scholar] [CrossRef]
  44. And, GL.; Yan, X.; Duncan, S. Polystyrene-block-polyisoprene nanofiber fractions. 1. Preparation and static light-scattering study. Macromolecules 2002, 35, 9788–9793. [Google Scholar]
  45. Lavi, B.; Marmur, A.; Bachmann, J. Porous media characterization by the Two-Liquid method: Effect of dynamic contact angle and inertia. Langmuir 2008, 24, 1918–1923. [Google Scholar] [CrossRef] [PubMed]
  46. Tamai, Y.; Matsunaga, T.; Horiuchi, K. Surface energy analysis of several organic polymers: Comparison of the two-liquid-contact-angle method with the one-liquid-contact-angle method. J. Colloid Interface Sci. 1977, 60, 112–116. [Google Scholar] [CrossRef]
  47. Katoh, K.; Yu, T.; Yamamoto, M.; Azuma, T.; Fujita, H. A new method for measuring contact angle and liquid surface tension applying detachment of Two-Dimensional meniscus. J. Colloid Interface Sci. 1998, 202, 54–62. [Google Scholar] [CrossRef]
  48. Tan, B.; Bray, C.L.; Cooper, A.I. Fractionation of poly(vinyl acetate) and the phase behavior of end-group modified oligo(vinyl acetate)s in CO2. Macromolecules 2009, 42, 7945–7952. [Google Scholar] [CrossRef]
  49. Shi, C.; Huang, Z.; Beckman, E.J.; Enick, R.M.; Kim, S.-Y.; Curran, D.P. Semi-Fluorinated trialkyltin fluorides and fluorinated telechelic ionomers as viscosity-enhancing agents for carbon dioxide. Ind. Eng. Chem. Res. 2001, 40, 908–913. [Google Scholar] [CrossRef]
  50. Matsuda, H.; Yamamoto, H.; Kurihara, K.; Tochigi, K. Computer-aided reverse design for ionic liquids by QSPR using descriptors of group contribution type for ionic conductivities and viscosities. Fluid Phase Equilibria 2007, 261, 434–443. [Google Scholar] [CrossRef]
  51. Fang, Z.; Qiao, Y.; Di, Z.; Huo, Y.; Ma, P.; Xia, S. Viscosities of p-Xylene, Acetic Acid, and p-Xylene + Acetic Acid at (313.15 to 473.15)K and (0.10 to 3.20)MPa: Determined by the Rolling-Ball Method. J. Chem. Eng. Data 2008, 53, 2787–2792. [Google Scholar] [CrossRef]
  52. Costa, G.M.N.; Rocha, P.S.D.M.V.; Ribeiro, A.L.C.; de Menezes, P.R.F.; de Lima, R.C.A.; Costa, P.U.O.; de Almeida Rodrigues, E. An improved method for calculating CO2 minimum miscibility pressure based on solubility parameter. J. Petrol. Sci. Eng. 2012, 98–99, 144–155. [Google Scholar] [CrossRef]
  53. Zhou, G.; Chen, J.; Wang, M.; Zhang, M.; Guo, J.; Shen, S.; Liu, Z.; Liu, Z.; Jiang, J.; Lu, J. Insight into the role of intermolecular interactions on the enhanced solubility of fluorinated epoxide oligomers in supercritical CO2. Green Chem. 2015, 17, 4489–4498. [Google Scholar] [CrossRef]
  54. Chremos, A.; Glynos, E.; Green, P.F. Structure and dynamical intra-molecular heterogeneity of star polymer melts above glass transition temperature. J. Chem. Phys. 2015, 142, 572–946. [Google Scholar] [CrossRef] [PubMed]
  55. Kolev, V.; Freger, V. Hydration, porosity and water dynamics in the polyamide layer ofreverse osmosis membranes: A molecular dynamics study. Polymer 2014, 55, 1420–1426. [Google Scholar]
  56. Hou, M.; Zhang, X.; Han, B.; Song, J.; Liu, G.; Zhang, Z.; Zhang, J. New topic of supercritical fluids: Local activity coefficients of supercritical solvent and cosolvent around solute. J. Chem. Phys. 2008, 10, 104510. [Google Scholar] [CrossRef] [PubMed]
  57. Chen, J.; Liu, X.; Liu, Z.; Hu, D.; Zhang, C.; Xue, D.; Xiao, J.; Liu, Z. Intermolecular-interaction-dominated solvation behaviors of liquid monomers and polymers in gaseous and supercritical carbon dioxide. Macromolecules 2012, 45, 4907–4919. [Google Scholar] [CrossRef]
  58. Lal, M.; Plummer, M.; Smith, W. Solvent density effects on the solvation behavior and configurational structure of bare and passivated 38-Atom gold nanoparticle in supercritical ethane. J. Phys. Chem. B 2006, 110, 20879–20888. [Google Scholar] [CrossRef] [PubMed]
  59. Gestoso, P.; Brisson, J. Towards the simulation of poly(vinyl phenol)/poly(vinyl methyl ether) blends by atomistic molecular modelling. Polymer 2003, 44, 2321–2329. [Google Scholar] [CrossRef]
  60. Fu, Y.; Liao, L.; Yang, L.; Lan, Y.; Mei, L.; Liu, Y.; Hu, S. Molecular dynamics and dissipative particle dynamics simulations for prediction of miscibility in polyethylene terephthalate/polylactide blends. Mol. Simul. 2013, 39, 415–422. [Google Scholar] [CrossRef]
Scheme 1. Synthetic procedure of the P(HFDA-co-VBe) co-polymer, where x: the molar ratio of HFDA and y: the molar ratio of VBe.
Polymers 10 00268 sch001
Scheme 2. High-temperature and high-pressure visual unit used for cloud point and viscosity measurements.
Polymers 10 00268 sch002
Figure 1. The phase transitions of supercritical CO2–polymer system under constant temperature, (a) single phase (above cloud point); (b) the appearance of the mist (cloud point); and (c) two phase (below cloud point).
Polymers 10 00268 g001
Scheme 3. The molecular modeling of P(HFDA-co-VBe) co-polymer.
Polymers 10 00268 sch003
Figure 2. Optimized conformation of the polymer–CO2 system (CO2 was marked as blue line molecular; while polymer chain was marked as ball and stick figure).
Polymers 10 00268 g002
Figure 3. 1H-NMR spectrums for P(HFDA-co-VBe) co-polymers. (a) P(HFDA0.87-co-VBe0.13); (b) P(HFDA0.67-co-VBe0.33); (c) P(HFDA0.50-co-VBe0.50); (d) P(HFDA0.29-co-VBe0.71).
Polymers 10 00268 g003
Figure 4. Cloud point pressures of the co-polymer–CO2 solutions versus mass concentration at 308.2 K (a) and temperature (b) at 1 wt. % of concentration.
Polymers 10 00268 g004
Figure 5. Intermolecular RDFs of the carbon-carbon pairs of polymer–polymer and polymer–CO2. (a) P(HFDA0.87-co-VBe0.13); (b) P(HFDA0.67-co-VBe0.33); (c) P(HFDA0.50-co-VBe0.50); (d) P(HFDA0.29-co-VBe0.71).
Polymers 10 00268 g005
Figure 6. Relative viscosities of the co-polymer–CO2 systems at 308.2 K and 30 MPa versus mass concentration.
Polymers 10 00268 g006
Figure 7. Relative viscosities of the co-polymer–CO2 systems versus temperature (a) and pressure (b).
Polymers 10 00268 g007
Figure 8. Equilibrium conformations of five CO2–polymer systems at 308.2 K and 25 MPa. All the CO2 molecules were deleted to highlight the polymer chains (lower) and the specific functional groups and backbones (upper).
Polymers 10 00268 g008
Figure 9. Radial distribution functions of the intermolecular C-C pairs of VBe groups (a) and F-F pairs of HFDA groups (b).
Polymers 10 00268 g009
Table 1. The systems simulated by all-atom molecular dynamics.
RunSystemMn of One ChainNumber of ChainsNumber of HFDA Units in One ChainNumber of VBe Units in One ChainNumber of CO2
1CO2+PHFDA36308702000
2CO2+P(HFDA0.87-co-VBe0.13)37778712000
3CO2+P(HFDA0.67-co-VBe0.33)35558632000
4CO2+P(HFDA0.50-co-VBe0.50)33338552000
5CO2+P(HFDA0.29-co-VBe0.71)355684102000
6PHFDA36308700
7P(HFDA0.87-co-VBe0.13)37778710
8P(HFDA0.67-co-VBe0.33)35558630
9P(HFDA0.50-co-VBe0.50)33338550
10P(HFDA0.29-co-VBe0.71)355684100
Table 2. Experimental results for the synthesis and physical properties of the co-polymers.
RunSampleMw (g/mol) aComposition bFeed RatioTg (°C) cγ (mN/m−1) d
HFDA:VBeHFDA:VBe
1P(HFDA0.87-co-VBe0.13)152,10087:3385:1552.627.4
2P(HFDA0.67-co-VBe0.33)145,60067:3370:3055.429.7
3P(HFDA0.50-co-VBe0.50)142,90050:5050:5058.132.5
4P(HFDA0.29-co-VBe0.71)150,40029:7130:7062.835.8
a Measured with Wyatt DAWN HELEOS Multi-Angle Static Light Scattering Scatter; b Determined by 1H-NMR using Bruker-400 MHz NMR; c Measured by Mettler-Toledo Differential Scanning Calorimeter; d Determined by contact angle measurements of water-polymer and hexadecane-polymer with Krishna DSAHT Contact Angle Meter.
Table 3. Absolute value of the interaction energy between polymer chains and CO2 at 308.2 K and 25 MPa (energy unit: kJ/mol).
RunSystemEchain−CO2EchainECO2Einter
1CO2+PHFDA4341.631357.221556.011428.40
2CO2+P(HFDA0.87-co-VBe0.13)3986.581089.341698.631198.61
3CO2+P(HFDA0.67-co-VBe0.33)3643.29773.121805.421064.75
4CO2+P(HFDA0.50-co-VBe0.50)3327.36680.631718.76927.98
5CO2+P(HFDA0.29-co-VBe0.71)3438.42769.191960.29708.4

