Thermal and Chemical Expansion in Proton Ceramic Electrolytes and Compatible Electrodes


1
Centre for Earth Evolution and Dynamics, University of Oslo, N-0315 Oslo, Norway
2
Jotun Performance Coatings, Jotun A/S, N-3202 Sandefjord, Norway
3
Department of Mechanical Engineering, Colorado School of Mines, Golden, CO 80401, USA
4
Department of Solid State Physics, Faculty of Applied Physics and Mathematics, Gdańsk University of Technology, 80233 Gdańsk, Poland
*
Author to whom correspondence should be addressed.
Crystals 2018, 8(9), 365; https://doi.org/10.3390/cryst8090365
Submission received: 18 August 2018
/
Revised: 5 September 2018
/
Accepted: 6 September 2018
/
Published: 14 September 2018
(This article belongs to the Special Issue Ceramic Conductors)
Abstract
:This review paper focuses on the phenomenon of thermochemical expansion of two specific categories of conducting ceramics: Proton Conducting Ceramics (PCC) and Mixed Ionic-Electronic Conductors (MIEC). The theory of thermal expansion of ceramics is underlined from microscopic to macroscopic points of view while the chemical expansion is explained based on crystallography and defect chemistry. Modelling methods are used to predict the thermochemical expansion of PCCs and MIECs with two examples: hydration of barium zirconate (BaZr1−xYxO3−δ) and oxidation/reduction of La1−xSrxCo0.2Fe0.8O3−δ. While it is unusual for a review paper, we conducted experiments to evaluate the influence of the heating rate in determining expansion coefficients experimentally. This was motivated by the discrepancy of some values in literature. The conclusions are that the heating rate has little to no effect on the obtained values. Models for the expansion coefficients of a composite material are presented and include the effect of porosity. A set of data comprising thermal and chemical expansion coefficients has been gathered from the literature and presented here divided into two groups: protonic electrolytes and mixed ionic-electronic conductors. Finally, the methods of mitigation of the thermal mismatch problem are discussed.
1. Introduction
The expansion of a solid upon the exposure to heat is a phenomenon known to mankind for centuries. This process is called thermal expansion and examples of scientists studying thermal expansion can be dated back as far as 1730, when Petrus van Musschenbroek [1] measured the expansion of metals used in pendulum clocks. This posed a significant problem for time measurements at the time, as the length of the pendulum would change with small temperature variations, inducing a change in the period of the oscillating pendulum of up to ±0.05% [2]. With passing decades, the search for reliable pendulum clocks became less relevant for the scientific community, mostly due to the arrival of cheaper synchronous electric clocks in the 1930s. Nevertheless, changes in the size and shape of solids upon heating still remain a large obstacle in applied science and engineering today, often being an underlying cause for device failures. In this review, we will specifically address and discuss expansion processes that are relevant for applications involving Proton Conducting Ceramics (PCCs).
Proton Conducting Ceramics are a group of materials exhibiting protonic conductivity at elevated temperatures (400–700 °C). The group can be divided in two classes; materials which are predominantly protonic with low transport numbers for other charged species, and mixed protonic conductors where the conductivity is dominated by protons and at least one other type of charge carrier contributing to the overall total conductivity. The former are often referred to as Proton Ceramic Electrolytes (PCEs) or High Temperature Proton Conductors (HTPCs) [3,4], where typical examples are acceptor doped barium zirconates [5] and cerates [6]. The mixed-conducting class can be further divided into two subclasses: mixed protonic-electronic conductors, conducting protons and electrons or electron holes, and the so-called Triple Conducting Oxides (TCO) [7]—a group of oxides exhibiting high levels of conductivity of three charge carriers; protons, oxygen ions and electron holes (or electrons).
In recent years, PCCs have become increasingly more popular, mostly stemming from the large number of potential applications [7,8,9,10,11,12,13,14,15,16,17], of which gas sensors [13,14,15,16,17,18,19,20,21], hydrogen separation membranes [22,23,24,25], fuel cells [7,9,11,14,15,16,26] and electrolysers [13,17,27] are typical examples. However a constant evolution of the field has also led to new exciting developments such as electrochemical synthesis of ammonia [28,29], conversion of methane into aromatics in a membrane reactor [8] or thermo-electrochemical production of hydrogen from methane [10]. Especially, the two latter applications seem to be particularly interesting—the first enables efficient production of elementary petrochemicals from methane, while the second may be a new cost-efficient source of compressed hydrogen, useful for instance for hydrogen-fueled vehicles, exhibiting superior energy efficiency and lower greenhouse gas emissions compared to battery electric vehicles [30]. Recent efforts in the development of PCCs have also demonstrated that fuel cells based on a PCC, Proton Ceramic Fuel Cells (PCFCs), can operate with high efficiencies, while remaining cost-competitive in the medium temperature range of 300–600 °C compared to traditional Solid Oxide Fuel Cells (SOFCs) operating at 800–1000 °C [7,31,32]. The advances made in the field in recent years clearly show that PCCs deserve a broader attention from the scientific community to enable the implementation of these in future applications.
At this point it is important to note that each of the previously described devices is in fact a sort of electrochemical cell, which typically has a sandwich-type construction consisting of at least three layers; an anode, a cathode and an electrolyte. Additional layers that could be present but are not as often considered in lab-scale tests, are interconnects, sealing, current collectors or other functional layers. These devices typically operate at elevated temperatures, for example, 300–800 °C, making thermal mismatch between the layers a challenge. Differences in the thermal expansion coefficients between the layers will cause thermal stresses in the materials, leading to cracks, delamination and—in extreme cases—a total failure of the device. Moreover, chemical expansion—a result of defect formation caused by chemical reactions between the material and its surroundings—may also lead to similar degradation processes in the cells. In the case of Proton Conducting Ceramics, a chemical expansion is caused predominantly by hydration—a reaction in which protonic defects are formed in the oxide. Although a full assessment of the stability and durability of an electrochemical device requires a number of different input parameters, the thermal and chemical expansion coefficients provide a very strong indicator whether individual electrochemical cell components will be compatible. Thus, a prerequisite for any electrochemical device is to ensure that each component exhibits similar expansion coefficients under the operating conditions of interest.
Unfortunately, many of the works studying thermal mismatch in electrochemical cells are done for SOFCs in which the electrolytes conduct oxygen ions [33,34,35,36,37]. In the field of Proton Conducting Ceramics, the availability of necessary data is limited. Moreover, the literature presents thermal expansion coefficients determined by different measurement/simulation techniques and at different conditions, resulting in data sets with different physical meaning, which should not necessarily be compared. In addition, effects of chemical expansion can also obscure the picture. For the electrolytes, it is specifically a chemical expansion due to the hydration reaction, given in (1), causing an additional expansion of the crystal lattice upon the incorporation of water vapor. This can in turn lead to additional mismatch between the individual material components in an electrochemical device. However, chemical expansion is not restricted to the hydration reaction, as any chemical reaction can also cause an expansion or contraction of the lattice. For instance, for electrode materials often containing high concentrations of transition metals, chemical expansion upon oxidation/reduction should also be accounted for.
This work aims to gather the existing data of thermal and chemical expansion of Proton Conducting Ceramics. The underlying theory of the phenomena will be explained and discussed to give a proper basis for analysis and comparison of expansion coefficients determined in various ways and conditions. Additionally, the essential guidelines for selecting matching materials and managing thermal mismatch will be provided.
2. Theory of Expansion of Solids
2.1. Basic Principles of Thermal Expansion
Thermal expansion of solids is a known and well-described phenomenon and its theoretical description can be found in many textbooks [2,38,39,40,41,42,43]. The most important parameter for this phenomenon is the thermal expansion coefficient, denoted as TEC, or alternatively as the coefficient of thermal expansion, CTE. In this work, to avoid misconceptions, we are consistently using as the symbol for thermal expansion coefficients.
As there are many ways of determining , distinct differences may arise in the evaluated parameters unless proper re-calculations are applied. For instance, if the solid expands anisotropically, or if measurements are conducted under conditions in which the lattice is contracting or expanding due to a chemical reaction, the determined values of may differ significantly. Moreover, solid matter is, in itself, a very broad category and the expansion of different types of solids (e.g., glasses, single crystals and polycrystals) should be approached in a different way. Especially in polycrystalline ceramics, which are typically used in the context intended in this review, many phenomena can overlap leading to distorted values, overshadowing the true meaning of the obtained data. Therefore, extra caution should be taken when comparing different data sets—both self-measured and obtained from the literature. A thorough and complete understanding of the underlying theory is required and this will be outlined and discussed in the current section.
Thermal expansion can be considered from two separate perspectives; macroscopically and microscopically. The former is the expansion of a bulk material, being useful for technical applications, whereas the latter reflects the expansion of the crystal lattice due to atomic vibrations. This difference in perspective is an important distinction, and although they are highly correlated, they carry essentially different information of the material as we shall see in the following sections, starting with thermal expansion of bulk materials.
2.1.1. Thermal Expansion of Bulk Materials
A macroscopic bulk material will generally expand upon exposure to heat and along one selected direction, the mean coefficient of linear thermal expansion is phenomenologically defined as:
where and are material lengths at temperatures, and , respectively. This relation can also be expressed in differential form:
In this case the coefficient is defined for a given temperature and is thus no longer a mean value. For that reason, this parameter is referred to as the true coefficient, or simply the coefficient of thermal expansion [2]. Similar considerations can be done for two or three dimensions, for example, the volumetric expansion coefficient, , can be given in its mean form:
where and now refer to the material volume at and , respectively. In differential form, we arrive at the true thermal coefficient of volumetric expansion:
If the bulk material is isotropic then the relation between the true coefficients in (3) and (5) can be given as:
For anisotropic materials, where the bulk material expands differently in each direction, the volumetric expansion coefficient is expressed by the sum of the true linear expansion coefficients measured along three orthogonal directions, , and [2]:
2.1.2. Crystal Lattice Thermal Expansion
Moving away from the macroscopic perspective, we now consider the material at an atomic level consisting of a periodic three-dimensional array of species (atoms, ions or molecules) making up the crystal lattice. At a finite temperature, each species is vibrating around its equilibrium position in a potential well. The shape of this well is given by the interatomic interactions and in the simplest approximation (harmonic), it is expressed by a simple parabolic function. While the harmonic approximation successfully predicts the heat capacity at constant volume of real solids at finite temperatures, it cannot account for the existence of thermal expansion, which is an anharmonic effect. In textbooks [2,40,41,42], the anharmonic well is typically given by the potential:
where and are non-negative constants. Then, the time-averaged position, , is expressed by [2,40]:
The average position increases proportionally with respect to temperature , constituting an expression for thermal expansion from a simple lattice model, where the proportionality constant, , is the thermal expansion coefficient. Using this basic thermodynamic model, one may extend these considerations to a crystal lattice of a given symmetry, where we now consider the expansion of the unit cell parameters, , and , as a function of temperature:
Additionally, the true volumetric thermal expansion can be defined, respectively, as follows:
where is the unit cell volume. For a cubic crystal, where and the crystal properties are isotropic, only one thermal expansion coefficient is sufficient to describe the thermal expansion of the entire crystal lattice, analogously to an isotropic bulk material given in (6):
For crystals possessing lower symmetries with orthogonal principal axes, for example, orthorhombic or tetragonal, the relation instead becomes:
For anisotropic crystals exhibiting non-orthogonal principle axes, for example, monoclinic or triclinic, relations between the linear and volumetric thermal expansion coefficients can unfortunately not be expressed in such a simple manner, also requiring temperature dependencies of the unit cell angles [2,44,45].
2.1.3. Significance and Relation between Bulk and Lattice Expansion
In the two previous subsections, we have briefly described thermal expansion from a macroscopic and microscopic perspective. Although thermal expansion coefficients of a bulk polycrystalline sample (macroscopic) and a crystal lattice unit cell (microscopic) are often very similar, the values are not necessarily interchangeable, underlining the importance of keeping this distinction.
While bulk coefficients are more important with respect to device fabrication and applications, the thermal expansion of a unit cell provides fundamental characteristics of the crystal itself. The thermal expansion of a crystal depends on bond strength and collective lattice vibrations (phonons), linking it to many other physical properties of the material. For instance, the coefficient of thermal expansion along a specific direction can be defined phenomenologically in terms of uniaxial strain [46,47]:
where and represent the length and temperature of the crystal, respectively. Other factors, such as heat capacity at constant pressure [2,48], Debye temperature [2,49], Grüneisen parameter [2] and anharmonic terms of lattice vibrations [50,51,52], are also correlated to thermal expansion. Thus, the thermal expansion of a crystal lattice provides a set of fundamental properties of a given system.
A problem emerges when one would like to extrapolate crystal lattice expansion parameters to bulk material properties. Although the values are correlated and sometimes similar, the lattice thermal expansion coefficients can only be extrapolated accurately for a macroscopic body in the case of an isotropic single crystal. However, Proton Conducting Ceramics (PCCs) are predominantly polycrystalline materials, exhibiting different microstructures and thermal expansion coefficients can for instance be affected by the grain size [53,54] and texturing effects [55,56]. It becomes even more complicated for a composite material, consisting of two or more different material phases.
Several theoretical models have been proposed to predict the bulk thermal expansion coefficient of a composite material (some of which are described in detail in Section 4.2). This is useful to model the thermal expansion of certain electrode materials, requiring high ionic and electronic conductivity. For instance, for mixed protonic-electronic conduction, a cermet consisting of Ni and BaCe0.9−xZrxY0.1O3−δ—providing electronic and protonic conductivity, respectively—can typically be used in a proton ceramic electrochemical cell [7,8,10]. These models can also be applied to polycrystalline single-phase materials composed of anisotropic grains with random crystal orientations and thermal expansion coefficients. Similarly for textured ceramics, where one or more crystal directions are preferred, such models can be implemented to predict the thermal expansion coefficient. However, extrapolating values from thermal expansion coefficients of a crystal lattice is not necessarily trivial and some caution must be taken upon choosing the appropriate model and assumptions.
2.2. Chemical Expansion in Proton Conducting Oxides
While thermal expansion in materials is related to a change in their inherent vibrational properties, chemical expansion arises from a change in the materials’ chemical composition. We can divide chemical expansion into stoichiometric and phase change expansion processes, where the former reflects a continuous change in the lattice parameter with composition, whereas a phase change expansion typically induces an abrupt change in the lattice parameter due to a phase change or phase separation. An example of a stoichiometric expansion include the gradual expansion of CeO2−δ with increasing oxygen nonstoichiometry, δ [57,58,59,60], while the oxidation of Ni to NiO [61,62] and the phase transition from the monoclinic to tetragonal polymorph of LaNbO4 [63,64,65], constitute phase change expansions. We can envisage both processes for the cubic proton conducting oxide, BaZr1−xYxO3−δ, where the lower valent Y3+-cation is substitutionally replacing Zr4+. Starting from , the volume will first increase with increasing Y-content in correspondence with Vegard’s law [66], as more and more of the larger Y3+ cations replace the host (Zr4+). If this concentration is increased further, we will eventually reach what is known as the solubility limit, where the volume of the system will abruptly change, as it becomes energetically more favorable for the system to separate into Y2O3 and Y-substituted BaZrO3. This volume change corresponds to the start of a miscibility gap in the BaZrO3-Y2O3 phase diagram, being an example of a phase change expansion. Further increasing the yttria content will then only result in a larger proportion of Y2O3 at the expense of the amount of Y-substituted BaZrO3. The Y2O3 solubility limit for BaZrO3 has typically been estimated to be around 30 mol% [67], such that all chemical expansion processes below this limit will be that of a stoichiometric expansion. As most commercial developments in the usage of PCCs typically use oxides with up to 10–20 mol% acceptor dopants, we will for simplicity primarily focus on stoichiometric expansion for the remaining part of the paper, unless specified otherwise.
Pure proton conductors, such as Y-doped BaZrO3, will typically only chemically expand upon hydration, whereas mixed protonic electronic conductors, often consisting of one or more transition metal cations, may also expand due to reduction at higher temperatures. As such, both expansion processes are relevant for this review and we will start by considering chemical expansion due to hydration.
2.2.1. Chemical Expansion upon Hydration
A stoichiometric volumetric chemical expansion coefficient can for any defect, i, be expressed by
where constitutes the defect concentration in mole fractions, whereas and are the final and initial volume of the material, respectively. Thus, for the formation of a proton, , the volumetric chemical expansion will be
For proton conductors such as acceptor doped BaZrO3 and BaCeO3, the concentration of protons, , will typically be fixed by the acceptor concentration, , under moist conditions at lower temperatures, i.e., . The chemical expansion upon acceptor doping per mol acceptor (volume or linear) can then be expressed by
where represents the chemical expansion coefficient upon the introduction of an acceptor and is given by (16). While the formation of a hydroxide ion generally results in a volume contraction, due to its smaller size (ionic radius of 1.37 Å compared to 1.4 Å for O2−) [68], the sign and magnitude of depends on the relative size difference between the acceptor and the host ion. Reverting back to our example of acceptor doped BaZrO3, will be positive, i.e., the lattice expands, for larger trivalent cations such as Y3+ or Gd3+ with ionic radii of 0.9 and 0.938 Å (coordination VI), respectively, whereas the host cation Zr4+ has a radius of 0.72 Å [68]. On the other hand, will be much smaller in magnitude, being close to zero or even negative for smaller cations such as Sc3+ (0.745 Å). In fact, we can, for the smaller cations, often set , resulting in , such that the resulting lattice parameter (or volume) upon acceptor doping is very close to that of an undoped specimen. This is the case for Sc-doped BaZrO3, where the lattice parameter changes minimally with Sc-content. While undoped BaZrO3 has a reported lattice parameter of 4.193–4.194 Å [69,70,71], remarkably similar lattice parameters have been determined for Sc-doped BaZrO3, being 4.194–4.195 Å with 6 mol% Sc [72] and 4.193–4.197 and 4.191 Å for 10 mol% and 19 mol%, respectively [73,74,75]. There is a remarkable difference in the lattice parameters for the same samples if we instead expose them to dry conditions or high temperatures. Under such conditions, the acceptors will instead be charge compensated by oxygen vacancies, i.e., . The change in the lattice parameter (or volume) per mol acceptor is then expressed by
where is the chemical expansion upon the removal of an oxide ion, which induces a crystal lattice contraction due to the smaller size of (1.16–1.18 Å estimated for CeO2−δ, BaZrO3 and BaCeO3 [59,76,77]) compared to O2− (1.4 Å [68]), that is, . The two expansion processes in (18) are generally competing processes, where the volume contraction from an oxygen vacancy overshadows the expansion caused by the acceptor substitution, i.e., . Note that the factor in (18) simply stems from the imposed electroneutrality condition, where each acceptor is charge compensated by .
We have now described the chemical expansion processes upon acceptor doping under moist and dry conditions, in (17) and (18), respectively. By subtraction of these two expressions, we arrive at the chemical expansion upon hydration of oxygen vacancies per mol water:
Although, both defects induce crystal lattice contractions, the difference in their magnitudes causes the lattice to expand upon hydration, i.e., the lattice contraction of a single oxygen vacancy is larger than the contraction of two protons, . For most proton conducting oxides, has been determined in the region of 0.05–0.2 [75,77,78,79,80,81,82,83,84,85,86]. This corresponds to a volume increase of +0.25–1.0% upon hydration for a proton concentration of 10 mol%.
Note that we have explicitly not accounted for any defect interactions, making our treatment strictly only applicable in a dilute limit. The interactions of defects can in principle also introduce changes to the volume, which may subsequently alter the chemical expansion coefficients. We can consider the following defect associations for an acceptor () doped oxide:
For the sake of simplicity, we will neglect larger defect clusters consisting of three or more defects, such as two acceptors and an oxygen vacancy, , although studies have indicated that such configurations may be present in In-doped BaCeO3 and BaZrO3 [87,88,89]. However, the concentration of such clusters will generally be lower than the corresponding concentrations of the defect associate pairs, and [89], thus minimizing their effect on chemical expansion.
If we consider and to dominate at lower temperatures, i.e., no defects are unassociated, then the chemical expansion upon hydration becomes
where and represent the chemical expansion coefficients for the defect associates and , respectively. Such defect associations will only affect the chemical expansion upon hydration if and/or differ significantly from the corresponding chemical expansion coefficients for the isolated proton and oxygen vacancy, and , respectively. Although there is little data available specifically addressing the effects of different dopants on , there appears to be a general tendency for the chemical expansion coefficient upon hydration to increase with increasing dopant size [83,85]. Furthermore, such defect associations may also impose a temperature dependence on , as experiments may be conducted under conditions where the oxygen vacancies and/or protons are partially associated to the acceptors. In such a case, a sample would exhibit an apparent chemical expansion coefficient upon hydration, varying from at lower temperatures, where all defects are associated, to at higher temperatures, where the protons and/or oxygen vacancies are completely unassociated. This also means that if and are distinctly different, then measurements conducted with different on the same sample will exhibit different volumetric expansions upon hydration. This can in other words be a source for small discrepancies in measured volume changes upon hydration.
2.2.2. Chemical Expansion upon Reduction
Although the chemical expansion in Proton Conducting Ceramics (PCCs) is generally due to hydration, compositions displaying mixed protonic electronic conductivity may also expand due to reduction at higher temperatures. This is mostly encountered for electrode type materials consisting of one or more transition metal cations, which display different oxidation states depending on the conditions that they are exposed to. To illustrate the chemical expansion upon reduction, we will consider the reduction of CeO2−δ, which has already been addressed in great detail in the literature [59,60,90,91,92]:
This equilibrium clearly demonstrates that with decreasing and/or increasing temperature, we form more oxygen vacancies, , charge compensated by reduced cerium, . The associated chemical expansion coefficient per mol for (24) is given by:
where and represent the chemical expansion coefficients for the formation of an oxygen vacancy and the reduction of Ce4+ to Ce3+, respectively. As discussed in the preceding Section 2.2.1, the formation of an oxygen vacancy results in a lattice contraction, that is, is negative. , on the other hand, is positive, stemming from the increase in the cation radius going from Ce4+ to Ce3+. In total, the expansion due to the reduction of cerium is larger in magnitude than the contraction upon forming an oxygen vacancy, i.e., , resulting in a net expansion of the crystal lattice upon reduction.
We can also extend the chemical expansion due to reduction to more complicated examples, such as La1−xSrxCoyFe1−yO3−δ (LSCF), which has been used as a cathode in SOFCs [93,94,95] and PCFCs [96,97]. Although Fe and Co are both redox active elements, previous work has shown that they both can be treated as an indistinguishable elements, B, in the defect chemical analysis [98,99,100]. Both elements can be present in three oxidation states; B2+, B3+ or B4+. Assigning B3+ as the reference state, , the oxidation states +2 and +4 become effectively negative, and positive, , respectively, whereas Sr and La are consistently +2 and +3, respectively. The reduction of LSCF can then be considered to involve the reduction of B4+ to B3+, accompanied by the formation of oxygen vacancies:
Further reduction of B3+ to B2+ is also possible, forming even more oxygen vacancies:
Note that by subtracting (26) with (25), we obtain a disproportionation reaction for B:
The complete chemical expansion coefficient upon reduction of LCSF per mol then becomes:
where , and are the chemical expansion coefficients for the formation of , and , respectively. Thus, to completely describe the chemical expansion upon reduction of LCSF, we need the defect concentrations of all three species: , and . This requires a defect chemical model, where the thermodynamics of two of the equilibria, (25)–(27), are known. An electroneutrality condition is imposed:
along with a site restriction to conserve the total number of regular B and oxide ion sites
Note that is considered to be constant in this model. The volume upon reduction of LCSF is thereby expressed by a combination of the previous set of equations, along with two of the equilibrium constants for reactions (25)–(27).
3. Methods of Determining Expansion Coefficients
We will treat the methods of determining expansion of materials by again considering the material from a macroscopic and microscopic perspective, adhering with Section 2.2.1 and Section 2.2.2, respectively.
3.1. Bulk Thermal Expansion Coefficient Measurement
There are several methods available to measure the thermal expansion coefficient of a bulk specimen [2,101]. These can be divided into methods measuring either absolute or relative thermal expansion coefficients. While the absolute methods directly measure the thermal expansion coefficient, relative methods rely on data of other material samples, using them as a reference during the measurement. Examples of the former include interferometry, twin-telemicroscopy or scissors-type dilatometry, while push-rod dilatometry is an example of the latter and is by far the most popular technique amongst materials scientists and will also be the focus of this review [101]. Push-rod dilatometry has several advantages, being both a simple and reliable technique but it is also easily automated, which has resulted in a number of commercial measurement systems ready to be used in laboratories across the globe. In a push-rod dilatometer, the push rod is in direct contact with the sample, protruding a displacement resulting from the expansion of the specimen. As this is a relative measurement, it requires the use of a reference sample, such that the expansion of the reference is subtracted from that of the sample. This is typically done in succession, measuring the expansion of the specimen and the reference in separate steps under the same conditions, but some dilatometers can also do this simultaneously by measuring the sample and reference using two separate push-rods.
3.2. Measuring Thermal Expansion of Crystal Lattice
To measure the thermal expansion of a crystal lattice, any method determining the unit cell parameters as a function of temperature can be used. Although this can be achieved by several different techniques, common diffraction methods, such as powder X-ray Diffraction (XRD) [63,64,77,102] or Neutron Diffraction (ND) [103], are typically used. Resulting diffraction patterns are refined by the Rietveld [104] or Le Bail [105] method yielding unit cell parameters. Plotting their evolution against temperature and determining the slope or differentiating the unit cell parameter change with respect to temperature leads to the determination of the mean or true thermal expansion coefficients, respectively.
3.3. Chemical Expansion Coefficient Measurement
While thermal expansion coefficients can be obtained directly from dilatometry or XRD, the determination of chemical expansion coefficients requires the input of several different data sets measured under different conditions, along with detailed knowledge about the chemical composition of the sample. For instance, the expansion of a Proton Conducting Ceramic (PCC) can be measured under wet and dry conditions, where the volume difference between the two stems from chemical expansion upon hydration. By relating this difference in volume with the specific change in the proton concentration, the chemical expansion coefficient can be determined. The proton concentration is typically measured by thermogravimetric analysis (TG), where relative mass changes are evaluated at different temperatures and water vapor partial pressures.
For chemical expansion coefficients upon reduction, the procedure is very similar (weight or lattice changes as a function of ), although it may require a more complicated defect chemical model due to the presence of one or more transition metals, which can be present in several oxidation states (see Section 2.2.2, where LSCF is treated as an example). The volume changes due to reduction are then related to changes in the oxygen nonstoichiometry, which can be determined by TG, coloumetric [106,107] or iodometric titration [107,108,109].
3.4. Chemical Expansion Coefficients from Computational Modelling
Unlike experiments, where chemical expansion coefficients require the combination of different data sets and measurement techniques, computational approaches, such as density functional theory (DFT), have the advantage of having the chemical composition controlled entirely by the user. This means that volume changes with respect to small changes in the stoichiometry of the material can easily be obtained. To demonstrate the benefit of this, we will briefly discuss the chemical expansion upon reduction in CeO2−δ, where computational modelling was recently used to provide valuable insight to the underlying expansion mechanism [59]. The volume expansion upon reduction of CeO2−δ was for a very long time debated in the literature [57,90,92]. It was hypothesized whether the expansion stemmed from an increase in the volume due to repulsive interactions between the oxygen vacancies or cerium cations, or from the increase in the cationic radius of cerium upon the reduction from Ce4+ to Ce3+. By using first principles calculations, Marrocchelli et al. [59] were able to distinguish these processes, and for the first time systematically demonstrate that the chemical expansion upon reduction arises primarily from the volume expansion from reducing Ce4+ to Ce3+, while the formation of oxygen vacancies actually results in a volume contraction. The superposition of these two effects results in an overall expansion of the lattice as the magnitude of volume expansion from cerium reduction overshadows the volume contraction induced by the oxygen vacancy formation.
3.5. Thermal Expansion Coefficients from Computational Modelling
Determining thermal expansion coefficients computationally can be achieved by calculating harmonic phonon spectra for a set of different volumes (lattice parameters), through the so-called quasi-harmonic approximation (QHA). This approximation is based on the assumption that the harmonic approximation (HA) holds at each and every volume and each atom/ion is considered to be a non-interacting harmonic oscillator. Phonon frequencies at each volume can then be determined by perturbation theory [110] or the finite displacements technique [111], providing vibrational thermodynamics, such as the Helmholtz free energy,
where represents the number of degrees of freedom (3 directions × number of atoms, ), while and are the wave vector and band index, respectively. is the phonon frequency at the specific and , while is the Boltzmann constant.
By repetition for multiple volumes, the Gibbs free energy, , is determined by the unique minimum of the sum of the total electronic energy, , the Helmholtz vibrational energy, in (33) and work with respect to volume given by:
By fitting the thermodynamic functions on the right hand side of (33) to an equation of state (EoS) for solids, such as the Rose-Vinet EoS [112] or the third order Birch-Murnaghan EoS [113], all thermodynamic parameters are obtained. More importantly, the fitting procedure also provides equilibrium volumes at finite temperatures, which subsequently yields volumetric thermal expansion coefficients.
The overall procedure to calculate thermal expansion coefficients computationally can be quite strenuous and time-consuming, requiring strict convergence criteria to obtain reliable forces. As an example, we will briefly indicate the computational cost involved in the QHA to calculate the thermal expansion coefficient for orthorhombic BaCeO3. In the finite displacement method, which is generally the method of choice in the literature, ions in the crystal system are sequentially shifted slightly from their equilibrium positions (by ~0.01 Å). The resulting forces from such displacements are then used to calculate the phonon spectra at each volume. By taking advantage of crystal symmetry, the number of displacements can be effectively reduced and for a BaCeO3 supercell (160 atoms), only 17 displacements are required for each volume. The QHA typically requires at least 10 volume points for the EoS fitting to be scientifically sound, such that almost 200 static calculations are necessary to obtain the thermal expansion coefficient. While this is not too costly in itself, the situation worsens for lower symmetries, which can arise by the introduction of defects. For a single or , the symmetry reduces to the monoclinic space group , requiring more than 500 displacements for each volume. Thus, the computational cost rises by a factor of 30 to calculate the thermal expansion coefficient for a defective supercell compared to that of the pristine bulk system. For a completely non-symmetric system, the force matrix is obtained by displacing every ion in all 6 directions, which amounts to a total of 10,000 displacements to calculate the thermal expansion coefficient for a supercell of 160 atoms. For this reason, there are very few computational studies using the QHA to calculate thermal expansion of low symmetry systems.
An alternative computational method to calculate thermal expansion is by running Molecular Dynamics (MD) simulations, where the trajectories of a set of interacting ions/atoms are calculated as a function of time by integrating their Newtonian equations of motion. The system is then heated up to the desired temperature by employing a computational thermostat, for example, the Nosé-Hoover algorithm [114,115,116], providing constant temperature conditions. The pressure can similarly be controlled by, for example, a Berendsen barostat [117]. Although the principles of MD simulations are relatively simple, they typically require long simulation times (several picoseconds) to ensure that the system is equilibrated and that there is enough statistics to determine specific properties, such as the volume. Thermal expansion coefficients are then determined by running a series of MD simulations at a range of desired temperatures and/or pressures. Because MD simulations are more or less unaffected by crystal symmetry, the method is particularly advantageous for low symmetry systems, where the QHA is very computationally expensive.
3.6. Assessment of the Influence of Heating Rate on the Thermal Expansion Coefficient—Experimental Details
While this work is intended to be a review, experiments have been conducted to assess the influence of the heating/cooling rates on the resulting expansion coefficients, as a large variety of heating rates are typically employed in the literature. To do so bulk samples of BaZr0.7Ce0.2Y0.1O3−δ (BZCY72) and ZrO2 with 8 mol% Y2O3 (YSZ) have been studied by the means of dilatometry. The former is a typical example of a High Temperature Proton Conductor (HTPC), while YSZ is used as a reference material as it does not undergo chemical expansion due to hydration or reduction.
BZCY72 extruded rods were prepared by solid state reactive sintering using precursor oxides (ZrO2 (Neo Performance Materials (AMR Ltd.)), CeO2 (Neo Performance Materials (AMR Ltd.), ≥99.5%), Y2O3 (HJD Intl. 99.99+%) and barium carbonate (Alfa Aesar, tech grade, 99.6%)). The appropriate amounts of precursors were mixed with 2 wt.% NiO (Inco Grade F) and ball milled in deionized water for 24 h. The mixture was subsequently dried in air and sieved through a 40-mesh screen. The resulting powder was blended with water-soluble acrylic and a cellulosic-ether plasticizer and pelletized for wet-extrusion processing. Green rods were extruded through and encapsulated die set, dried and fired in air at 1600 °C for 6 h. The final sample had a cylindrical shape with a length of 25 mm and a diameter of 3 mm.
YSZ bars were prepared by sintering commercial YSZ powder (Tosoh). First the powders were pressed into pellets under a pressure of 12 MPa. The green bodies were sintered at 1400 °C for 2 h. The bars were cut from pellets using a diamond wire saw and were 22 mm long, 4 mm wide and had a thickness of 1 mm.
The linear expansion of the bulk samples was measured as a function of temperature using a Netzsch DIL 402 PC/4 dilatometer. To eliminate the influence of chemical expansion upon hydration, all measurements were performed in a flow of dry Ar. All measurements were carried out by pre-drying the samples at 1000 °C for 8 h, followed by cooling to 100 °C. A total of five heating/cooling rates were used for each sample: 1, 3, 5, 10 and 20 K min−1.
4. Challenges in Assessing Measurement Data—Effects of Thermochemical Expansion, Non-Constant Thermal Expansion, Heating Rates and Porosity
In this section, we will address some of the challenges associated with measuring expansion data experimentally. First, we investigate and discuss the influence of chemical expansion on the determination of thermal expansion coefficients, before analyzing how to appropriately predict the thermal expansion coefficient of a composite material and lastly assessing how factors such as heating rate and porosity can affect thermal expansion.
4.1. Decoupling Thermal and Chemical Expansion Coefficients—Impossible?
As we have addressed in the preceding sections, a material can expand thermally and chemically and because these expansion processes typically occur simultaneously during a measurement, analyzing measurement data of expansion can often be non-trivial. It will typically result in a non-linearity in the volume (or lattice parameter) with respect to temperature, such that authors tend to report apparent expansion coefficients for different temperature intervals. To illustrate the difficulties in decoupling chemical and thermal expansion coefficients from a single data set, we will consider the thermochemical expansion of two typically used compositions; Y-doped BaZrO3 (BZY) and La1−xSrxCo0.2Fe0.8O3−δ (LSCF). While BZY expands upon hydration under wet conditions at lower temperatures, LSCF expands upon reduction at high temperatures and reducing conditions (see Section 2.2.1 and Section 2.2.2 for more details). Lastly, we assess and discuss the effects of having a non-constant thermal expansion coefficient, which has been demonstrated to affect the interpretation of chemical expansion due to hydration in BaCeO3 [86].
4.1.1. Thermochemical Expansion upon Hydration—Case of Y-Doped BaZrO3 (BZY)
To model the thermochemical expansion upon hydration for BZY, a constant linear thermal expansion coefficient of 8 × 10⁻⁶ K−1 is used, which is in correspondence with the majority of values reported for acceptor doped BaZrO3 [77,80,118,119]. To account for the chemical expansion upon hydration, the proton and oxygen vacancy concentration is modelled based on standard hydration thermodynamics determined by Kreuer et al. on BaZr0.9Y0.1O3−δ; = −79.5 kJ mol−1 and = −88.9 J K−1 mol−1 [73], and these parameters are used for all BZY compositions. Note that is assumed to be constant and is only charge-compensated by protons and oxygen vacancies for this model, i.e., all other charge carriers are considered to have a negligible concentration. A constant linear chemical expansion coefficient upon hydration, , of 0.042 (volumetric coefficient of 0.125 divided by 3) is used based on work by Bjørheim et al. [83]. This value is generally consistent with other chemical expansion coefficients reported for BZY [77,78,80,82,84].
Figure 1 shows the linear expansion of BZY as a function of temperature under wet conditions ( = 0.03 atm) with 10 mol% and 20 mol% yttrium in (a), while (b) gives the corresponding thermal, chemical and the combined thermochemical expansion coefficients as a function of temperature. The expansion of BZY under dry conditions (no chemical expansion) is given for reference. As Figure 1a demonstrates, the linear expansion is the same for both compositions at higher temperatures (above 1000 °C), where the change in the lattice parameter with respect to temperature is only due to thermal expansion. Upon cooling from ~1000 °C, the lattice starts to chemically expand due to hydration until the acceptors are fully charge compensated by protons, which is achieved around 300 °C. The lattice expansion due to chemical expansion increases in magnitude with increasing dopant concentration, . The resulting expansion coefficients, given in Figure 1b, show how the apparent expansion of the lattice is affected by chemical expansion. We see that the thermochemical expansion coefficient equals that of the thermal expansion coefficient (8 × 10⁻⁶ K−1) at very low and high temperatures, while it becomes effectively diminished between 250 and 1200 °C. This suggests that extracting thermal expansion coefficients from an experimental data set conducted under humid conditions will very easily result in a lower apparent expansion coefficient. Although this becomes extreme in the case of large proton concentrations such as 20 mol%, it may be overlooked for samples with less protons or for measurements conducted under non-equilibrium conditions, where hydration is kinetically limited in certain temperature intervals. Overall, this demonstrates the need for additional measurements in order to completely decouple chemical and thermal expansion. This can be achieved by either measuring the expansion under dry conditions, or by relating the expansion to the level of hydration as a function of temperature by for example, thermogravimetry. Note that the latter is specifically needed to accurately determine the chemical expansion coefficient upon hydration.
Further, it is important to be aware that the overall thermochemical expansion of a PCC might also depend on the sample history due to kinetics. This is illustrated with HT-XRD data collected on a BZY20 sample [120]. Lattice changes were recorded in dry O2, on one sample kept in a desiccator prior to the measurements and on the same sample previously hydrated. The results show a significant change in the dehydration temperature between the two sets of experiments, which can be attributed to slow hydration (or dehydration) kinetics. This aspect becomes even more important during cell fabrication when different layers of the electrochemical device are co-sintered.
4.1.2. Thermochemical Expansion upon Reduction—Case of La1−xSrxCo0.2Fe0.8O3−δ (LSCF)
Unlike the thermochemical expansion upon hydration, where the lattice expansion is effectively lowered, reduction causes a non-linearity in the lattice expansion with increasing temperature yielding a higher apparent expansion coefficient. This will be demonstrated in the case of LSCF, where a constant thermal expansion coefficient of 14 × 10−6 K−1 is used based on Bishop et al. [99]. This is generally consistent with the coefficients determined by other groups for the same and similar compositions [100,121,122,123,124,125]. The chemical expansion of the lattice is determined using the defect chemical model outlined in Section 2.2.2, along with oxidation (opposite of reduction) and disproportionation thermodynamics for the reactions (25) and (27) determined by Bishop et al. [98] on La0.6Sr0.4Co0.2Fe0.8O3−δ; = −111 kJ mol−1, = −64.5 J K−1 mol−1, = +19.3 kJ mol−1 and = −37.3 J K−1 mol−1. The same thermodynamic parameters are also used to model the defect concentrations for x = 0.2. The linear chemical expansion coefficient upon reduction is consistently set to 0.031 [99,122].
Figure 2 shows the linear expansion of LSCF with increasing temperature in air ( = 0.21 atm) with 20 mol% and 40 mol% strontium in (a), while (b) gives the corresponding thermal, chemical and the combined thermochemical expansion coefficients as a function of temperature. Thermal expansion of LSCF (no chemical expansion) is given for reference. As the figure demonstrates, at lower temperatures (below 600 °C), the lattice expansion is primarily due to thermal expansion. As the temperature increases further, the lattice starts to chemically expand upon reduction, yielding a higher thermochemical expansion coefficient, which increases with increasing Sr-content. Chemical expansion constitutes around 20% and 30% of the total thermochemical expansion for 20 mol% and 40 mol% Sr, respectively, such that the linear expansion coefficient is ~19 × 10−6 and ~21 × 10−6 K−1 in the temperature region 800–1200 °C.
To decouple thermal and chemical expansion for LSCF, it is first and foremost clearly necessary to measure the lattice expansion at lower temperatures (below 600 °C) under oxidizing conditions, for example, air or O2, to extract the thermal expansion coefficient. The deviation from linearity at higher temperatures can then be attributed to chemical expansion. To accurately determine the chemical expansion coefficient, a defect chemical model is required, where the oxygen nonstoichiometry is expressed as a function of temperature and . As this requires at least two sets of thermodynamic parameters and some underlying assumptions (see Section 2.2.2 for details), extensive work involving coloumetric titration or thermogravimetry is often needed. Although, it may be tempting to rely on previous studies for the defect thermodynamics, small differences in the chemical composition and/or conditions can very easily result in discrepancies. It is therefore recommended that the defect chemical model be tested on a separate defect concentration data set to ensure its validity before curve-fitting the thermochemical expansion upon reduction.
4.1.3. Non-Constant Thermal Expansion Coefficient
Thermal expansion coefficients are generally assumed to be constant, such that changes in the slope of the linear expansion with respect to temperature are considered to only reflect chemical expansion (see Figure 1 and Figure 2). However, recent first principles calculations [86] have shown that this may not necessarily be the case and the thermal expansion coefficient may in fact change upon hydration. In the case of BaCeO3, the thermal expansion coefficient was shown to increase from 10.6 × 10⁻⁶ to 12.2 × 10⁻⁶ K−1 for a dry and fully protonated specimen, respectfully [86]. This has also been seen experimentally for BaCe0.8Y0.2O3−δ and BaZr0.7Ce0.2Y0.1O3−δ, where the thermal expansion coefficients increase upon hydration from 9.9 × 10⁻⁶ and 12.7 × 10⁻⁶ K−1 to 11.1 × 10⁻⁶ and 15.0 × 10⁻⁶ K−1, respectively [77,126]. This means that a sample will contract and expand to a greater extent with respect to temperature when exposed to wet conditions compared to that of dry conditions. The change in volume upon hydration thus stems from a superposition of two effects; chemical expansion and an increase in the thermal expansion coefficient. By assuming that the thermal expansion coefficient remains unchanged upon cooling, where the value of α is taken from the change in volume (or lattice parameter) at high temperatures, the chemical expansion coefficient will be underestimated. Such an underestimation will increase with decreasing proton concentration, yielding apparent expansion coefficients that are 27% and 55% lower for 20 mol% and 10 mol% protons in BaCeO3 [86], respectively. A way of circumventing this underestimation can be to measure the chemical expansion isothermally, thus eliminating any effects of thermal expansion. Nonetheless, having a non-constant thermal expansion coefficient will definitely make it more complicated to separate the lattice expansion into thermal and chemical expansion contributions. For that reason, it can, for the sake of simplicity, be easier to assume a constant thermal expansion coefficient, although this can also lead to some discrepancies between different studies. This will not be focused on any further in this review due to the large number of other uncertainties that need to be accounted for, but the reader should be aware that a non-constant thermal expansion coefficient can be a potential source of error, although often neglected.
4.2. Thermal Expansion of a Composite
Up until now, all expansion phenomena have only been described for materials of a single phase. However, most electrochemical devices will more often than not employ a composite, consisting of two or more phases, for at least one of its electrodes. In such cases, it is important to understand how to describe the thermal expansion of the composite material and in this section, we will go through some of the basic models that exist in the literature. We will often consider a typical SOFC anode material NiO/YSZ and its PCFC analogue—NiO/BZY as examples.
It is important to note that all models presented here assume a composite sphere assemblage (CSA), where all particles of the composite are considered to be spherical and that any action on a particle is transmitted through a spherical interphase shell. Using this as a basis, the combined thermal expansion coefficient of a composite material, , can be predicted from the coefficients values of the individual phases of the composite. An example of this is through Kerner’s model [127] with a random distribution of spherical grains of one phase (phase 1) in a continuous matrix of phase 2:
where , and are the average volumetric thermal expansion coefficient, volume fraction, shear modulus and bulk modulus, respectively. The equation can often be simplified, as in the case of NiO/YSZ and BZY/NiO, where the differences in bulk moduli are negligible, such that the second term becomes zero [128]:
Thus, for a sintered composite BZY/NiO, the expression for the thermal expansion becomes:
Upon reducing the sintered composite BZY/NiO, porosity is introduced into the cermet and the resulting amount of porosity will depend on the initial volume fraction of NiO used [128].
An important question to address before continuing is how and to what extent porosity affects thermal expansion. Although this has not been considered in great detail in the literature, some studies have attempted to answer this question. Coble and Kingery [129] assessed the influence of porosity on the physical properties of alumina using samples with 5% and 50% porosity (isolated pores). Their results demonstrated that the thermal expansion coefficient was unaffected by the amount of porosity, although increasing porosity decreased the strength and elastic modulus of the material. Similar results have also been reported on cordierite [130]. For porous ceramic composites, there are no systematic studies but we can use data from Mori et al. [131] on NiO/YSZ and Ni/YSZ composites to confirm that expansion coefficients are independent of the amount of porosity. NiO/YSZ composites prepared with 40 vol.% and 60 vol.% of NiO end up with 20% and 33% porosity upon reduction, respectively. Using (36) for NiO/YSZ, along with the following thermal expansion coefficients; = 10.3 × 10⁻⁶ K−1 and = 13 × 10−6 K−1, αcomp after reduction is 11.4 and 11.9 for the 40 vol.% and 60 vol.% of NiO composite, respectively, without explicitly accounting for porosity. This is in good agreement with the values determined experimentally by Mori et al. (11.3 and 12.2, respectively). Now, if we were to attempt to account for the porosity in (36) by adding an additional term for the volume fraction of the porosity and assuming αpore = 0, the calculated αcomp becomes 9.1 and 8.0, respectively, i.e., much lower than the measured values. Based on this, porosity can be considered to have a negligible effect on the thermal expansion, and also probably the chemical expansion, of a material.
A slightly different approach to Kerner’s model was formulated by Schapery, where the effective thermal expansion coefficient of an isotropic composite employing extremum principles of thermoelasticity [132]:
Note that this equation will generally only provide upper and lower bounds of , as the bulk modulus of the composite, , will generally be varied in the range of to . In the case of , then reduces to , while similarly simplifies (37) to .
Another popular model for composites is Turner’s model [132]:
Note that, upon applying the assumption that the difference between the bulk moduli of the different phases is negligible, (38) reduces to the same as (35).
Elomari et al. [132] compared all three models in their study of the composite Al/SiC/SiO2 and found that their experimentally measured thermal expansion coefficient agreed well with the values predicted by the Schapery model at low temperature (<150 °C), while Kerner’s model was better suited at higher temperatures (>400 °C). In general, all models will often provide a satisfactory way of describing the thermal expansion behavior of a composite, although knowing the bulk moduli of the individual phases is necessary before using the simplified expressions. Other models have also been proposed and are described in Reference [133].
One could argue that the geometry used for the above-mentioned models (spheres in a matrix) does not represent typical geometries of actual ceramic-ceramic or ceramic-metal composites, or that none of the models account for particle size. Despite these limitations, Kerner’s model has been shown to successfully predict the thermal expansion of several composites, such as the YSZ/NiO and YSZ/Ni [131].
4.3. The Effect of Heating Rate on the Bulk Expansion Coefficients
This section summarizes and discusses the results of the measurements conducted in this work, where the influence of the heating rate on the thermal expansion coefficients has been explored (see Section 3.6 for details regarding the measurement procedure). To ensure that each measurement had identical starting conditions, we have only used the data obtained upon cooling.
The linear expansion as a function of temperature and the corresponding derivative, for YSZ is presented in Figure 3. Upon first inspection, the linear expansion curves appear to be similar, being almost completely parallel for all heating rates used, thus indicating an absence of changes in the expansion coefficients. This is similarly observed in the derivative, given in (b), where the true thermal expansion coefficient changes a little with respect to temperature but is unaffected by the change in heating rate. Overall, the thermal expansion coefficient is found to change continuously with respect to temperature, being in the range of 9–12 × 10−6 K−1, which is in good correspondence with previous work [134].
The results for BZCY72 are presented in a similar way to that of YSZ (Figure 3), and given in Figure 4. Again, we find that the linear expansion is similar for all heating rates. Note that 20 K min−1 has been excluded here, as it deviated considerably from the other heating rates used, which can possibly be attributed to incomplete drying at 1000 °C prior to cooling. Unlike YSZ, the true thermal expansion coefficient of BZCY72 does not change considerably with increasing temperature, although it exhibits two distinct temperature intervals with a constant TEC, above and below ~750 °C. At temperatures close to 1000 °C, a rapid increase of thermal expansion coefficient is observed. The temperature threshold of this phenomenon shifts to lower temperatures with increasing heating rate. This is only an experimental artifact, stemming from the transition from the isotherm (1000 °C) to the cooling segment during the measurement. An additional experiment (not shown) was also conducted with a drying segment at 1100 °C, whereupon the experimental artefact was in fact shifted to 1100 °C.
Average thermal expansion coefficients of BZCY72 for the two respective temperature intervals, being above and below ~750 °C, are presented in Table 1 for all heating rates employed. It increases from 8.5–8.8 × 10⁻⁶ to around 9.3 × 10⁻⁶ K−1. The distinct difference in the coefficients could be due to partial hydration of the sample at lower temperatures, stemming from small gas leakages allowing water vapor from ambient atmosphere to enter the measurement cell. A slower cooling rate will then give the sample more time to react (and possibly even equilibrate), such that it hydrates to a greater extent, ultimately affecting the measurement (see Section 2.2.1 for more details of thermochemical expansion upon hydration). This shows how important it is to perform thermal expansion measurements in controlled conditions when measuring samples that are prone to undergo chemical expansion.
5. Thermal and Chemical Expansion of Proton Conducting Ceramics (PCCs)
The preceding sections have provided the theoretical basis for thermal and chemical expansion, described experimental and computational methods to determine the corresponding coefficients, while Section 4 has gone through and discussed the challenges and influencing factors when measuring thermal and chemical expansion coefficients. In this section, we present and review literature values for the thermal and chemical expansion coefficients for a series of PCCs in a systematic manner. Following the constituents of an electrochemical cell, the coefficients will first be presented for electrolyte type materials, where protons are the dominating charge carriers, before moving onto materials employed as electrodes, which display both electronic and ionic conductivity.
5.1. Proton Conducting Solid Electrolytes
The proton conducting electrolyte type materials can be separated into a few major groups of oxides: perovskites and perovskite-related compounds, ABO4 oxides and pyrochlore- and fluorite-related materials [3,22,80,135,136,137,138]. Although, this is not a complete list by any means, these materials cover the majority of research activity within the field of solid state high temperature proton conductors. We would like to remind the reader that only chemical expansion due to hydration is presented in this section as PCC materials will generally not exhibit -induced expansion [139,140].
5.1.1. ABO3 Perovskites and Perovskite-Related Materials
5.1.1.1. Barium Cerate and Barium Zirconate Based Perovskites
Out of all High Temperature Proton Conductors (HTPCs) that have been worked on over the last four decades, none have been studied in more detail than acceptor doped BaZrO3 or BaCeO3, or even a solid solution of the two. This is mostly due to their superior proton conductivity, reaching levels of ~0.02 S cm−1 at intermediate temperatures under humid conditions (400–600 °C) [73,137,141,142,143,144]. Due to their popularity, significant work has also been devoted to describing their thermal and chemical expansion behavior. Table 2 lists thermal expansion coefficients of barium zirconate and barium cerate based perovskites, along with some comments regarding the measurement technique and conditions. To avoid effects of chemical expansion upon hydration (see Section 2.2.1 for details), we primarily give coefficients determined under dry conditions and/or high temperatures, especially from studies reporting several coefficients for different temperature intervals and/or conditions. Although there are discrepancies between the values reported in the literature, Table 2 demonstrates a general trend, in which <α> increases with increasing yttrium content, x, for BaZr1−xYxO3−δ (BZY), varying from around ~8 × 10⁻⁶ K−1 in BaZrO3 to around ~10 × 10−6 K−1 when acceptor doped by 20–30 mol% yttrium. For BaCeO3, it is less clear due to the smaller data set available but the thermal expansion coefficients are generally higher in magnitude than BZY, typically being about 11 × 10−6 K−1 and appear to be independent of the amount of yttrium. The solid solutions of Y-doped BaZrO3-BaCeO3 similarly reflect this changeover in thermal expansion coefficients, with <α> decreasing systematically with increasing Zr-content. Overall, these trends offer a potential way of tailoring the thermal expansion coefficient of the electrolyte to avoid thermal mismatch with the other components in the electrochemical device. <α> can for instance be increased by either increasing the proportion of Ce in the BaZrO3-BaCeO3 solid solution, or by increasing the amount of yttrium dopant.
Due to the large concentrations of protons in acceptor doped BaZrO3 and BaCeO3, typically being around 10–20 mol% when fully saturated at lower temperatures, chemical expansion upon hydration poses a serious challenge for device fabrication. A detailed description of the effect of chemical expansion on the linear expansion of Y-doped BaZrO3 (BZY) has already been provided in Section 2.2.1, assuming a constant volumetric chemical expansion coefficient, , of 0.125. However, this coefficient only represents a mean value of what can already be found in the literature and we will here attempt to collectively describe the changes in chemical expansion upon hydration in a more systematic manner, by first going through available data on BZY. To reduce uncertainties, only studies where the proton concentrations have been determined will be included, i.e., work assuming the proton concentration to be equal to the nominal doping concentration are neglected.
Figure 5 presents experimentally determined volumetric chemical expansion coefficients upon hydration, , as a function of the proton concentration for BZY (top), along with the corresponding linear expansion of the lattice (bottom). The dashed lines represent a completely linear regime, where is constant, for reference. For the data by Han et al. [78], volume changes and proton concentrations have been determined at two separate temperatures; 300 and 600 °C, thus giving two values for . These data are represented by full and open squares, respectively. Although there is significant scattering in the values presented, the top panel of the figure clearly demonstrates a trend in , which decreases with increasing proton concentration. At a proton concentration of ~0.07 mole fractions, appears to reach a plateau, whereupon stays constant (0.136) with increasing , that is, the lattice expands linearly with increasing above 7 mol%. At lower proton concentrations, is significantly higher, being 0.272 at ~0.02 mole fractions, i.e. double of the constant value at higher , 0.136. This results in a non-linear lattice expansion below 7 mol% , as is demonstrated in the bottom panel of the figure. In other words, the incorporation of the first few protons induces a larger chemical expansion of the lattice, compared to the protons formed when BZY is close to its level of saturation, where . Although we have limited knowledge as to why there is a change in the chemical expansion coefficient upon hydration, we wish to propose a possible explanation for this change.
For BZY, protons can be formed by protonating and filling oxide ions, and oxygen vacancies, , or by protonating and filling their associated counterparts, and . These hydration mechanisms will in turn result in unassociated or associated protons, and , respectively. Thus, we have to consider a total of six defects, , , , , and , each of which may chemically expand or contract the lattice differently. At lower temperatures (<400 °C), where full hydration generally is achieved, all defects can be considered to be associated, such that hydration only proceeds by:
As the temperature is raised, BZY will start to dehydrate but this will simultaneously be accompanied by the destabilization of the associated defects, and , causing them to break up into their constituent defects; , and . The overall hydration mechanism at higher temperatures will thus be a combination of several defect equilibria. This change in hydration mechanisms could therefore be the reason for the change in as the proton concentration increases.
Although we have now presented an apparent trend for for BZY, there is far less available data to extend this analysis to other materials. For BaCeO3, the reported values for vary dramatically—between 0.030 and 0.151 [77,79], making it difficult to make any direct comparison to the work on BZY. In such cases, first principles calculations can be particularly valuable and Bjørheim et al. [84] were recently able to clearly demonstrate that decreases in the order BaZrO3 → BaSnO3 → BaCeO3 → SrZrO3, suggesting that orthorhombic perovskites (BaCeO3 and SrZrO3) will typically display less chemical expansion than their cubic counterparts (BaZrO3 and BaSnO3). Based on this, addition of cerium in the solid solution BaZrO3—BaCeO3 can be a useful way of reducing the chemical expansion upon hydration. Interestingly, this is in good correspondence with work by Kreuer [80], who showed that the chemical expansion of BaZr0.8075Ce0.0425Y0.15O3−δ is significantly smaller than that of BaZr0.85Y0.15O3−δ.
5.1.1.2. Other Perovskites and Perovskite-Related Compounds
Although barium zirconates and cerates have received considerable interest in the literature over the last few decades, a number of other promising proton conducting perovskites and perovskite-related compounds have also been studied and these will be the focus of the remaining part of this sub-section.
A common denominator for all perovskites in general is that they are typically acceptor doped by a few to tens of mol%, which is required for them to exhibit protonic conductivity under humid conditions. This means that their lattice will chemically expand upon hydration at lower temperatures. However, due to the lack of literature data on chemical expansion due to hydration in general, being limited to Y-doped BaZrO3 and BaCeO3, the main emphasis will be to describe and review the thermal expansion coefficients of other perovskites. Table 3 lists thermal expansion coefficients of a number of different proton conducting perovskite oxides, along with total conductivities under moist conditions at 600 °C as an indication of their overall performance. Some additional perovskites have also been included for reference, for example, BaUO3, although they have not been shown to conduct protons.
As shown in Table 3, the AIIBIVO3 perovskites appear to exhibit similar thermal expansion coefficients to that of undoped and acceptor doped BaZrO3 and BaCeO3 (Table 2), with values ranging from 7 to 11 × 10−6 K−1. For the LaREO3 series on the other hand, the values scatter quite significantly, being especially low for LaLuO3, and we can only speculate whether these large differences in TECs may stem from influences of chemical expansion due to hydration.
From the data presented in Table 2 and Table 3, we see that there appears to be a general tendency for the cubic perovskites, for example, BaZrO3, BaSnO3 and SrMoO3, to display lower thermal expansion coefficients compared to their orthorhombic counterparts. In an attempt to quantitatively describe this trend, we use the Goldschmidt tolerance factor, which effectively accounts for deviations from a cubic structure based on the ionic radii of the constituent ions [176]. Figure 6 presents experimentally determined linear thermal expansion coefficients for more than 20 Ba-based perovskite compositions as a function of the tolerance factor in (a), while (b) shows the same coefficients plotted versus the deviation from the perfect cubic structure, defined as the absolute value of (tolerance factor—1). Note that non Ba-based perovskites, such as CaZrO3 and LaScO3, have been disregarded to limit the number of discrepancies, although they appear to show some of the same tendencies. For BaZr1−xYxO3−δ (BZY) and solid solutions of BaZr1−xYxO3−δ and BaCe1−xYxO3−δ (BZY-BCY) from Table 2, where numerous expansion coefficients are reported, only values by Han et al. [78] and Lyagaeva et al. [151], respectively, are used, as their work cover a wide range of compositions. As demonstrated in the figure, the thermal expansion coefficient shows an apparent trend, increasing with decreasing tolerance factor, ranging from ~7 × 10⁻⁶ K−1 for a cubic structure (tolerance factor close to 1) to 11 × 10−6 K−1 for a tolerance factor of ~0.9. This trend can be rationalized on the basis of work by Zhao et al. [118,177], who previously described the thermal expansion of perovskites to be a combination of two effects: an elongation of the B-O bonds upon heating and a change in the octahedral tilting angle with temperature. The volumetric thermal expansion coefficient of an ABO3 perovskite can then be expressed by
where and represent the B-O bond length and octahedral tilting angle, respectively. For cubic perovskites, where the octahedral tilting angle is consistently zero, the equation reduces to only the first term and the expansion upon heating is then only related to changes in the B-O bond length. Perovskites of a lower symmetry, such as orthorhombic SrZrO3, will therefore have a higher thermal expansion coefficient due to the inclusion of the second term of (40), accounting for the change in octahedral tilting with temperature. In fact, Zhao et al. [118] estimated that the change in the tilting angle accounts for 40–60% of the total thermal expansion of the tetragonal and orthorhombic polymorphs of SrZrO3. Overall, the results shown in Figure 6 suggest that the tolerance factor may be used to estimate the thermal expansion coefficient of a perovskite, at least to a first approximation.
As a final part of this subsection on the ABO3 perovskites, we will now briefly review some other structurally related proton conducting compounds, namely the complex perovskites and the brownmillerites. Both of these structural classes are related to one another, in which the complex perovskites consist of two or more ordered layers of the perovskite structure, for example, the double perovskite A2B′B″O6 consisting of alternating layers of AB′O3 and AB″O3, while the brownmillerites represent a heavily oxygen deficient perovskite with the general formula ABO2.5. The brownmillerites can also be considered to be a subset of the complex perovskites, composed of alternating layers of ABO3 and ABO2, where the B-site cation is both tetrahedrally and octahedrally coordinated to the oxide ions within the same structure.
For the proton conducting complex perovskites, most of the work has been devoted to the Ba3Ca1+xNb2−xO9−δ (BCN) series, where larger proportions of Ca introduce a higher oxygen nonstoichiometry and thus more protons upon hydration. The proton conductivity of these compounds peaks at ~3 mS cm−1 at around 400 °C [178], falling a little short of the performance of acceptor doped BaZrO3 and BaCeO3. The poorer proton conductivity is mainly attributed to the less favorable hydration thermodynamics of the BCN series compared to that of Y-doped BaZrO3 and BaCeO3 [73,179,180], destabilizing the protons at higher temperatures. Attempts at increasing the proton conductivity of the BCN series by Ce and K substitutions have therefore been tried, although this has only led to minor improvements [181,182]. The thermal expansion coefficients of BCN increase slightly with increasing x, ranging from 10 × 10−6 to 12 × 10−6 K−1 [183]. These values are very similar to most regular ABO3 perovskites, albeit in the higher end of the scale (see for example, Figure 6). Due to the fairly high proton concentrations of these materials, being up to 0.18 mol per mol Ba3Ca(1+x)/3Nb(2−x)/3O3−δ, chemical expansion upon hydration also poses a significant challenge in terms of device fabrication. We estimate the chemical expansion coefficient upon hydration, , to be consistently 0.14 per mol H2O for the entire series based on lattice parameters determined by Schober and his coworkers [180,184,185], being comparable to that of BZY (cf. Figure 5).
This similarity may be attributed to the fact that both BCN and BZY are both cubic perovskites, generally showing higher chemical expansion coefficients upon hydration compared to orthorhombic perovskites such as BaCeO3 and SrZrO3 [84].
Unlike the ABO3 perovskites and the complex perovskites, which may at maximum incorporate ~20–30 mol% protons, the brownmillerites are capable of absorbing up to 1 mol H2O per mol oxide due to their large oxygen deficiencies. As proton conductors, they perform reasonably well, with their proton conductivity peaking at around 4–6 mS cm−1 at 400–600 °C for Ti-substituted Ba2In2O5 and Ba2Sc2O5 [186,187,188,189,190,191,192]. However, due to the large concentrations of protons, these materials display significant chemical expansion, with corresponding volume expansions of more than +3% for pure Ba2In2O5 upon hydration. Based on the work by Quarez et al. on Ba2In1.6Ti0.4O6−δ [189], is estimated to be 0.067 per mol H2O, that is, approximately half of the value determined for BZY (Figure 5). However, due to significantly higher proton concentrations in this system, the volume will chemically expand more than twice the amount compared to that of 20 mol% Y-doped BaZrO3 (Figure 5 bottom panel). Thus, for the successful realization of brownmillerite type electrolytes in an electrochemical device, additional care must be taken to minimize chemical expansion. In terms of the thermal expansion of the brownmillerites, the coefficient has been shown to increase upon hydration, being 12.5 × 10⁻⁶ K−1 for a completely dry specimen, increasing to 14.1 × 10⁻⁶ K−1 when fully hydrated. Note that both of these values are larger than all other proton conducting perovskites that have been covered in this review (Table 2 and Table 3) and the brownmillerites may as such represent an alternative electrolyte to Y-doped BaZrO3, being more compatible with electrodes exhibiting higher thermal expansion coefficients.
5.1.2. ABO4 Oxides
Several representatives of the ABO4 oxides have been studied as potential candidates for proton conducting electrolytes. These materials are typically composed of a trivalent rare earth element on the A-site [65,193,194,195,196,197,198,199], while the B-site element is a pentavalent cation from group 5 [65,193,194,195] or 15 [196,197,198,199] of the periodic table. Unlike the perovskites (Section 5.1.1), these oxides show a much lower solubility for acceptor dopants, typically being limited to ~1–2 mol% on both the A- and B-site [65,194,200,201,202,203,204,205]. For this reason, chemical expansion upon hydration can be completely neglected for the ABO4 oxides and we will hereafter only consider thermal expansion for this material system.
The ABO4 oxides can adapt a number of different structures, where zircon (I41/amd), wolframite (P21/c), monazite (P21/n), scheelite (I41/a) and fergusonite (I2/a) are among the most commonly found in literature [206,207]. The thermal expansion coefficient of each of these structures has been shown to be distinctly different, with coefficients in the range of 4–6 × 10⁻⁶ K−1 for oxides exhibiting the wolframite structure, whereas the corresponding values for the scheelite- and zircon-type structured oxides will generally be above 10 × 10−6 K−1 [208]. Li et al. [208] demonstrated that these differences can be rationalized in terms of changes in the coordination number of the A-site cation and A-O bond length, while the BO4 (scheelite and zircon) and BO6 (wolframite) polyhedra remain rigid with respect to temperature and do therefore not contribute to thermal expansion. The increase in α upon going from the wolframite to the scheelite/zircon structure is therefore argued to stem from an increase in the coordination number of the A-site cations, varying from 6 to 8. Overall, their work suggests that the thermal expansion coefficient can be tailored by changing or partially substituting the A-site cation with a different element. Such a substitution will alter the A-O bond length and may also change its coordination number, both of which contribute to the thermal expansion of these oxides.
Another important aspect of the ABO4 oxides is that they often undergo a structural phase transition, causing an abrupt change to the thermal expansion coefficient [209,210]. A notable example of this is demonstrated for LaNbO4, which goes from a monoclinic fergusonite structure to a tetragonal scheelite-type structure at ~500 °C. The corresponding thermal expansion coefficient halves upon this transition, from 15–17 × 10−6 to 7–8 × 10⁻⁶ K−1, respectively [63,103,200]. Such a large change in α poses a serious challenge in finding compatible materials for device fabrication, requiring additional care to minimize thermal mismatch.
Most of the work in the literature on the ABO4 oxides has primarily been focused on acceptor doped LaNbO4, following the promising proton conductivity of ~10−3 S cm−1 measured by Haugsrud and Norby in 2006 [65,194]. At the time, it was considered somewhat of a breakthrough, as LaNbO4 represented a new oxide system posing as an alternative electrolyte material to the traditional Y-doped BaZrO3 or BaCeO3 perovskites. Following that paper, significant attempts went into optimizing the performance of the oxide by investigating alternative doping strategies [63,64,200,201,205,211,212,213,214], as well as different synthesis routes and conditions [202,215,216,217,218,219]. However, most of this work ultimately resulted in minimal improvements compared to the original work by Haugsrud and Norby. Although much less interest is currently being devoted to acceptor doped LaNbO4, recent developments have shown great promise, reaching total conductivities of 2 × 10⁻³ S cm−1 at 720 °C [202], indicating that LaNbO4 should not be written off as a potential proton conducting electrolyte yet. Table 4 lists thermal expansion coefficients for undoped and cation-substituted LaNbO4, along with their total electrical conductivity at 800 °C in moist atmospheres and their structure type in specific temperature intervals for reference.
As already mentioned, undoped and acceptor doped LaNbO4 undergoes a phase transition from fergusonite to scheelite at ~500 °C [103,210,223,224,225], whereupon the thermal expansion coefficient decreases by a factor of 2. As these two phases display significantly different thermal expansion coefficients, it is important to understand how various cation substitutions may influence this phase transition temperature. From the data given in Table 4, we see that acceptor doping (<3 mol%) appears to have no effect on the phase transition, while isovalent substitutions of ~30 mol% V, As and Sb on the Nb-site lower the transition temperature to below RT, such that these compositions consistently adopt the scheelite structure. Ta has the opposite effect and acts as fergusonite-stabilizer, shifting the phase transition temperature up to 800 °C for 40 mol% Ta. In terms of the thermal expansion coefficients, values for the specific polymorphs are generally quite similar, regardless of composition, being around 12–14 × 10−6 K−1 for the low temperature monoclinic fergusonite structure, while the corresponding coefficients for the high temperature tetragonal scheelite polymorph are in the range of 8–9 × 10⁻⁶ K−1. Lastly, we want to underline that although isovalent substitutions on the Nb-site appear to be promising in that they can effectively change the phase transition temperature by several hundred degrees, the same compositions are often poorer proton conductors. For instance, LaNbO4 substituted by either 40 mol% Ta or 30 mol% Sb both display total conductivities of 8 × 10⁻⁵ S cm−1, which is 1 order of magnitude lower than corresponding compositions without Ta or Sb [65,194,202].
Although LaNbO4 is the most well studied proton conducting oxide within the ABO4 group, several other proton conductors with similar proton conductivities have also been identified, such as the rare-earth orthophosphates, REPO4, LaAsO4 and NdNbO4 to mention a few. Table 5 summarizes the thermal expansion coefficients of these oxides, along with their total conductivity at 800 °C under wet conditions and their structure for reference. Note that in contrast to LaNbO4, most of these oxides have the benefit of retaining their structure up to relatively high temperatures (>800 °C), that is, they do not undergo a phase transition. The table therefore only includes one structure for each of the oxides presented.
The table demonstrates distinct differences in the thermal expansion coefficients between the different structure types, generally increasing in the order xenotime → monazite → fergusonite. Further, for each structure type, the changes in the thermal expansion coefficients appear to scale inversely with the size of the A-site cation. For instance, for the fergusonite-structured oxides, α increases in the order NdTaO4 → GdTaO4 and in the order NdNbO4 → ErNbO4, i.e. with decreasing size of the lanthanide cation.
5.1.3. Pyrochlore- and Fluorite-Related Structures
Another family of oxides that has been investigated as possible alternatives to Y-doped BaZrO3 and BaCeO3 are the pyrochlores with the general formula A2B2O7. These oxides typically consist of a trivalent rare-earth cation on the A-site, while the B-site cation is tetravalent. Similar to the ABO4 oxides, the pyrochlores tend to display low proton concentrations, peaking at around 0.08 mol per mol oxide for Ca-doped La2Sn2O7 [236], although this will be lower than 0.05 mol for most compositions [236,237,238,239,240]. Thus, for the majority of the systems presented here, chemical expansion upon hydration will be minimal and we will therefore only focus on thermal expansion for the A2B2O7 oxides due to the limited data available. In terms of proton conduction, the best performing pyrochlore to date is acceptor doped La2Zr2O7 with a maximum proton conductivity of ~10−3 S cm−1 [241,242]. Most studies on pyrochlore structured oxides are therefore devoted to La2Zr2O7 or some derivative of this material. Table 6 summarizes linear thermal expansion coefficients (α) for various A2B2O7 compounds in the 400 to 1000 °C range. It should be noted that La2Ce2O7, unlike the other oxides in Table 6, is not a pyrochlore and instead adopts a disordered fluorite type structure, where the cations are randomly distributed in the cation sublattice [243,244,245,246].
Overall, the changes in the thermal expansion coefficients for the A2B2O7 oxides given in Table 6 are small, with the majority of them having a coefficient of ~9 × 10⁻⁶ K−1. Further, we find that there appears to be a linear correlation between the thermal expansion coefficient and the cation radius ratio, , as shown in Figure 7. The figure indicates that the thermal expansion coefficient increases with decreasing , ranging from 7.9 × 10⁻⁶ to 11.4 × 10⁻⁶ K−1 as the cation radius ratio decreases from 1.7 to 1.3, respectively. On the basis of this, we suggest that adjustments to the thermal expansion coefficients of the A2B2O7 oxides can be achieved by partially substituting smaller or larger cations to alter the cation radius ratio, .
Other related oxides that have recently emerged as promising proton conducting ceramics are the fluorite-related lanthanum tungstates (LWO), with the general formula La28−xW4+xO54+δ. This class of oxides has been shown to only be single phase for approximate La/W ratios between 5.3 and 5.7, correspondingly making them inherently oxygen deficient. Undoped samples display proton conductivities in the order of 3–5 × 10⁻³ S cm−1 [249], whereas acceptor doping on the B-site increases the ionic conductivity to ~0.01 S cm−1 at 800 °C [250] but it is not clear whether this increase stems from oxide ions or protons [251].
In terms of expansion, no quantitative study has determined the chemical expansion coefficient upon hydration for the lanthanum tungstates. However, we can estimate the coefficient using high temperature neutron diffraction (HT-ND) data on LWO56 (LWO where La/W = 5.6) by Magrasó et al. [252], along with corresponding proton concentrations from TG data by Hancke et al. [253]. The lattice parameter for LWO56 has been shown to increase by 0.14% upon hydration [252], while the proton concentration reaches an upper limit of 0.96 mol per mol oxide, that is, a hydration level where 66% of all oxygen vacancies (0.48 out of 0.73) in the structure hydrate [253]. Combining these data results in a chemical expansion coefficient due to hydration, , of 0.0088 per mol oxygen vacancy, which is much lower than that of the acceptor doped perovskites (see Section 5.1.1). Note that this value is only a lower limit for , as the HT-ND data by Magrasó et al. [252] may not be entirely at equilibrium at lower temperatures (≤400 °C). This is based on the shorter equilibration times used for their measurements (1–2 h), whereas Hancke et al. [253] equilibrated their samples up to ~3.5 h at each temperature for their thermogravimetric analysis. Nonetheless, the data clearly indicates a much lower chemical expansion due to hydration for the lanthanum tungstates compared to Y-doped BaZrO3 and BaCeO3.
Thermal expansion coefficients of the lanthanum tungstates have been shown to be in the order of 11 × 10−6 K−1, being slightly higher (~11.5 × 10⁻⁶ K−1) under dry conditions [252,254,255,256]. These small differences could be related to small contributions from chemical expansion upon hydration, which reduce the expansion coefficients (see for example, Figure 1). Insignificant changes to α are observed upon doping on both the A- and B-site. Moreover, the coefficients are also independent of , reflecting that LWO does not undergo a redox reaction, being primarily an ionic conductor [252].
5.2. Mixed Ionic Electronic Conductors
Moving away from the oxides that are predominantly proton conductors, this section focuses on Mixed Ionic Electronic Conductors (MIECs), which exhibit both electronic and ionic conductivity and are thus useful as electrodes or gas separation membranes. First, a list of MIEC electrodes (single-phase and composite) studied on proton conducting ceramics (PCCs) is provided, before summarizing the thermal and chemical expansion coefficients for the most widely studied MIECs.
5.2.1. Electrode Materials Used on PCCs
The topic of mixed protonic-electronic conductors and triple conducting oxides in high temperature electrochemical cells is much younger than the field of proton conducting oxides itself. First attempts to develop suitable electrodes for electrochemical cells operating with high temperature proton conductors as an electrolyte focused on, either mimicking, or even using the exact same materials as those used for SOFCs. Although this worked fairly well in the beginning, these electrodes generally do not conduct protons, restricting the electrode reactions to the triple phase boundaries—confined spatial sites where the electrode, electrolyte and gas are in contact. Thus, most of the current efforts in the PCFC/PCEC community are devoted to developing electrode materials that also conduct protons, ensuring that the whole electrode surface is electrochemically active [7,26,135,257]. Merkle et al. [258] estimated that a proton conductivity in the order of 10−5 S cm−1 should be enough to make large parts of the electrode active. Although this may seem simple to achieve, it is experimentally difficult to verify whether these material systems are actually mixed protonic electronic conductors, or just mixed oxide ion and electron conductors and this remains a source for discussion and controversy in the literature, being for instance the topic of a recent paper by Téllez et al. [259]. Much of this controversy is related to the fact that the proton concentrations appear to be very low, peaking in the region of 1–3 mol% for BaGd0.8La0.2Co2O6−δ and BaCo0.4Fe0.4Zr0.2O3−δ [260,261]. Our intention is not to contribute in this discussion but to rather, highlight some of the ongoing discussion regarding proton conducting electrode materials.
Table 7 summarizes various electrodes (non-exhaustive list) that have been studied on proton-conducting ceramic electrolytes, separated by their specific application, for example, as anodes for Proton Ceramic Electrolyser Cells (PCECs). As the table demonstrates, a significant number of materials have been investigated over the years, underlining the immense workload involved. As it is virtually impossible to go through each of these studies individually, we will only describe some of the general trends for these materials, treating a few of the more successful electrode systems as examples.
5.2.2. Expansion of Air Electrodes
Air-side electrodes are typically composed of at least one transition metal (cf. Table 7), which means that they may chemically expand due to reduction at higher temperatures (cf. Section 2.2.2 and Section 4.1.2 for details). Further, a few of the materials may also hydrate, resulting in a chemical expansion at lower temperatures (cf. Section 2.2.1 and Section 4.1.1). However, due to low proton concentrations, the volume expansion due to hydration will generally be negligible. In total, the volume (or lattice parameter) of air electrodes can therefore be considered to only change due to thermal expansion and/or chemical expansion upon reduction.
One of the challenges when reviewing thermal and chemical expansion coefficients in the literature, lies in the ambiguity in the use of the term “thermal expansion”. Some authors simply use it as a collective term to describe the change in volume (or lattice parameter) upon a change in temperature. However, as already detailed in Section 4.1, such an approach completely neglects effects of chemical expansion, which in the case of electrode materials, results in a non-linearity beyond a certain temperature, T*. At higher temperatures, where T > T*, the expansion of the material stems from a sum of both chemical and thermal contributions, while only thermal expansion contributes when T < T* (cf. Figure 2). For that reason, it has become common practice for many authors to divide expansion data in different temperature intervals, reporting average expansion coefficients for each region [119]. In what follows, we use the general term ‘expansion coefficient’ when data are not sufficient to extract whether it is thermal or chemical, or when it is the sum of thermal and chemical.
5.2.2.1. General Trends
Although the list of studied electrode materials on PCCs is extensive (Table 7), some general trends in terms of their expansion can be identified. For instance, Co is notorious for resulting in high thermal expansion coefficients, although it often improves the catalytic activity needed for the surface exchange reactions [273,324,325,326,327]. This is clearly demonstrated for La0.8Sr0.2Co1−yFeyO3−δ, where the thermal expansion coefficient generally decreases with increasing Fe-content (y), ranging from 20.7 to 12.6 × 10⁻⁶ K−1 throughout the entire range 0 ≤ y ≤ 1 [328]. Ni and Mn as substituents for Co have also been shown to decrease α, even though this is usually also at the expense of the electrochemical performance [329,330,331,332]. One of the reasons why Co-containing oxides have higher thermal expansion coefficients than other transition metals is that the Co ions may undergo a spin transition as the temperature is raised. Such a spin transition, for example from low to high spin, will increase the ionic radius of the Co-ions, resulting in an effectively higher thermal expansion coefficient [333,334]. In fact, Radaelli et al. [333] demonstrated that the spin transition from high to low spin in LaCoO3 accounts for approximately half of the total lattice expansion at elevated temperatures. Thus, most strategies to lower the thermal expansion coefficient have attempted to substitute Co for another element, although this tends to have an adverse effect on the conductivity and catalytic activity of the material. In fact, such a trade-off is very typically found for electrode-type materials and was well demonstrated in a review by Ullmann et al. [335], who showed an inverse empirical relationship between the thermal expansion coefficient and the oxide ion conductivity, expressed by the following expression
where is the linear thermal expansion coefficient in 10−6 K−1, while is the oxide ion conductivity in S cm−1. Note that this correlation specifically applies to the SOFC/SOEC community but it is tempting to consider whether similar correlations may exist for the proton conductivity of PCFCs/PCECs electrodes. Nevertheless, the correlation does suggest a potential problem, in that the better performing electrodes generally tend to be less thermally compatible with the best electrolyte materials. An alternative and popular strategy to mitigate this problem is therefore to use composite materials, composed of a good-performing electrode and the electrolyte [16,317,319,320,336,337,338,339].
Other efforts have also indicated that the thermal expansion coefficient can be linked to ionicity, where more ionic bonds tend to result in higher α-values. For instance, in the system BaRECo2O6−δ, α decreases with decreasing size of the rare earth cation (La > Nd > Sm > Gd > Y), reflecting a reduction in the ionic character of the RE-O bond [340]. A similar trend has also been demonstrated for Sr0.4RE0.6CoO3−δ, Sr0.2RE0.8Fe0.8Co0.2O3−δ, Sr0.3RE0.65MnO3−δ and BaRECuFeO6−δ [34,324,341,342,343,344,345]. Ionicity can also be used to rationalize the general tendency for Sr-containing perovskites to exhibit high thermal expansion coefficients. For instance, in the system La1−xSrxMnO3−δ, a larger proportion of Sr results in higher thermal expansion coefficients [346]. This can be explained on the basis of electronegativity, where the less electronegative element, which in this case is Sr (0.99 versus 1.08 for La in the Allred-Rochow scale), will induce a higher ionic character of the A-O bond. However, it should be noted that increasing the amount of Sr will also result in a larger oxygen nonstoichiometry, subsequently leading to a higher chemical expansion upon reduction at higher temperatures.
5.2.2.2. Selected Air Side Electrode Materials
This section will cover some of the more well-studied compositions used as air side electrodes on PCFCs and PCECs, starting with Ba1−xSrxCo0.8Fe0.2O3−δ (BSCF).
Ba1−xSrxCo0.8Fe0.2O3−δ (BSCF) Based Materials
Ba0.5Sr0.5Co0.8Fe0.2O3−δ was originally introduced as a dense ceramic membrane for oxygen separation [347,348] but was soon after shown to also display excellent properties as a SOFC cathode on Sm0.15Ce0.85O2−δ [349]. This sparked an immediate interest within the research community to study related compositions, making BSCF one of the most studied electrode materials to this day. A few years later, in 2008, Lin et al. [350] also showed that BSCF could perform exceptionally well as a PCFC cathode, using it on a proton conducting Y-doped BaCeO3 electrolyte. Due to its popularity, several studies have described its thermal and chemical expansion.
Figure 8 shows the thermal expansion coefficients determined for BSCF as a function of the Sr-content (x), along with the specific values and references given in Table 8. In studies reporting more than one coefficient, we only use values determined at lower temperatures to avoid influences of chemical expansion upon reduction. As the figure and table demonstrate, the literature values for α vary tremendously, spanning a range from 11.5 to 24.4 × 10⁻⁶ K−1 [351,352,353,354,355,356] with the majority lying in the range of ~20 × 10−6 K−1. While the higher values (>20 × 10−6 K−1) can be rationalized on the basis of an additional chemical expansion due to reduction at higher temperatures, the lower expansion coefficients, reported for instance by Patra et al. [351], appear to be anomalous. We suspect that their measurements could stem from an unusual thermal history, where the samples have already been reduced, causing them to re-oxidize upon heating at lower temperatures (<300 °C). This would effectively reduce the expansion coefficient, thus explaining why their values are particularly low. The thermal expansion coefficient of Ba1−xSrxCo0.8Fe0.2O3−δ appears to otherwise be fairly independent with respect to changes in the A-site composition, that is, α is similar for the entire BaCo0.8Fe0.2O3−δ—SrCo0.8Fe0.2O3−δ system.
In terms of the linear chemical expansion of BSCF, values for are also scattered, varying in the region of 0.008–0.026 per mol oxygen vacancy [353,354]. Interestingly, we see that these values differ depending on the specific nonstoichiometry of the oxide and tend to average to around 0.012–0.016 for larger changes in δ. Thus, for most work dealing with modelling the thermochemical expansion of BCSF, values of 0.012–0.016 should be appropriate. Note that these -values are very small, being just slightly more than a quarter of the corresponding chemical expansion coefficient upon hydration determined for BZY (linear = 0.045, see Section 5.1.1.1 for details). Overall, this suggests that chemical expansion upon reduction should not pose a large issue in terms of thermally matching BCSF with other device components.
La1−xSrxCoyFe1−yO3−δ (LSCF) Based Materials
Another popular electrode material, which has received considerable interest in both the SOFC/SOEC and PCFC/PCEC communities, is La1−xSrxCoyFe1−yO3−δ (LSCF), where it is especially the composition La0.6Sr0.4Co0.2Fe0.8O3−δ (LSCF-6428) that has been studied extensively [95,96,271,300,357]. As for most cobalt-containing electrode materials, increasing the Co/Fe ratio tends to increase the thermal expansion coefficient, being no different in case of LSCF. This is exemplified in a study by Tai et al. [328], where the thermal expansion coefficient increases from 12.6 to 19.7 × 10⁻⁶ K−1 with increasing Co-content for the La0.8Sr0.2CoyFe1−yO3−δ system.
The effect of A-site compositional changes on the thermal expansion coefficient in LSCF is far less understood, although some authors suggest that the coefficient increases with increasing Sr-content [327,358]. However, most reviews and studies on the subject are far more careful in attempting to draw such links, as Sr also increases the oxygen nonstoichiometry of the oxide. This will subsequently lead to a larger influence of chemical expansion upon reduction, which will very easily distort the results. To shed some light on the subject, all available thermal expansion coefficients for varying La/Sr ratios for a fixed B-site composition of 20 mol% and 80 mol% Co and Fe, respectively, are summarized in Table 9 and plotted as a function of the Sr-content in Figure 9. This compositional range is particularly sensible to choose as it takes advantage of the large number of studies on LSCF-6428 [47,99,327,359,360,361,362,363]. Further, we only choose thermal expansion coefficients determined at lower temperatures for studies reporting more than one coefficient to limit the influence of chemical expansion. As seen in Figure 9, there appears to be no apparent trend in the thermal expansion coefficient with respect to Sr-content, averaging out to be around 15–16 × 10−6 K−1 for all compositions. This suggests that variations in the La/Sr ratio will therefore only affect the amount of chemical expansion in LSCF. We otherwise note that the thermal expansion coefficient of LSCF is clearly lower than that of BSCF (cf. Figure 8 and Table 8) but still somewhat higher than typical electrolyte materials, where the coefficients are in the range of 8–12 × 10−6 K−1 (cf. Figure 6 and Figure 7 and Table 2, Table 3, Table 4, Table 5 and Table 6). A potential way of mitigating this small thermal mismatch between LSCF and potential electrolytes, such as BZY, could be to intentionally have a small A-site deficiency in LSCF (La and/or Sr), as this has been demonstrated to lower the thermal expansion coefficient [363]. However, an A-site deficiency will undoubtedly again lead to a higher oxygen nonstoichiometry, subsequently resulting in more chemical expansion upon reduction.
The chemical expansion coefficient upon reduction, , for LSCF is high, lying in the region of 0.02–0.06 per mol (versus ~0.012–0.016 for BSCF) [47,99,121,122,123,364,365]. Table 10 lists all linear chemical expansion coefficients of LSCF in the order of increasing Co-content. Although it is hard to navigate through the specific values presented, there appears to be a general tendency for LSCF to have a higher -value for higher Fe-contents. Thus, the role of Fe in LSCF seems to be rather complicated, in that more Fe increases , while a higher proportion of Fe also lowers the thermal expansion coefficient. Although this indicates a possible trade-off between the two expansion processes, we will not dwell on this further due to the limited data available. seems to otherwise be insensitive to changes in the La/Sr ratio, which means that the amount of chemical expansion of LSCF can easily be decreased by increasing the La/Sr ration (less Sr). This is for instance demonstrated in Figure 2 showing the thermochemical expansion of LSCF upon heating in air ( = 0.21 atm). is fixed to 0.031, while the amount of Sr is varied from 0.2 to 0.4 mole fractions, clearly demonstrating less chemical expansion for lower Sr-content due to a smaller oxygen nonstoichiometry.
Other Single Perovskite Materials
Table 11 lists the thermal expansion coefficients for other single perovskite materials commonly used as air electrodes, based on lanthanum or barium on the A-site and transition metals on the B-site (Ni, Co, Fe, Mn). Most of the thermal expansion coefficients summarized in the table are averaged over a wide temperature range and are thus overestimated as they also include a chemical expansion contribution. As observed for most other oxides, increasing the Co content leads to an increase in the expansion coefficient, being no different in the case of these perovskites. The lowest expansion coefficients are thus obtained for cobalt free compositions such as La0.8Sr0.2MnO3−δ and LaNi1−xFexO3−δ. It is otherwise interesting to note that α decreases with increasing Fe content in the LaNi1−xFexO3−δ system.
Complex Perovskites
Although we briefly introduced the complex perovskites in Section 5.1.1.2 as electrolyte type materials, their usage is far more common in the field of electronics. Within this family of oxides, we find the so-called double perovskites, with the general formula A′A″B′B″O6−δ, where the A-sites are typically occupied by alkaline earth elements (often Ba or Sr), and/or by rare earth elements such as La and Y, while the B-site cations tend to be a transition metal, for example, Co, Fe, Mn, Mo, Ni or Cu [329,371,372]. A distinguishing feature of the double perovskites, compared to that of the simple perovskites, ABO3, is that they exhibit cation ordering, either on the A- or B-site. Such ordering means that the cations are distributed in separate alternating crystallographic layers, where only the A′ or A″ cations (or B′ or B″ cations) are present in each layer. It should be noted that double perovskites cannot have cation ordering on both sites simultaneously as this results in a higher order complex perovskite. Similarly, no cation ordering reduces the double perovskite to a simple perovskite, ABO3, where the cations are randomly distributed in each of the cation sublattices. Double perovskites are therefore more conveniently expressed by A′A″B2O6−δ or A2B′B″O6−δ for A- and B-site ordered systems, respectively.
Before continuing it is important to clarify that for the double perovskites two alternative notations of the composition are used in the literature. The first one is based on the fact that a high understoichiometry of the oxygen sublattice is expected in these compounds, such that the oxygen content is often closer to 5 than 6. Thus, many authors choose to express the composition as A′A″B′B″O5+δ. An alternative approach, which is exclusively used here, is based on the premise that all deviations in stoichiometry use the ideal defect-free structure as a frame of reference and the composition is then expressed as A′A″B′B″O6−δ. This distinction is important, as δ in both notations will have different numerical values, which can easily lead to some confusion.
Out of all the double perovskites, none have been studied more intensively than the Ba-based layered cobaltites, with the general formula BaRECo2−xMxO6−δ (RE: rare earth, M: other transition metal). These have been shown to offer high catalytic activity and excellent electrochemical performances [329,373]. However, as with all cobalt-containing electrodes, their thermal expansion coefficients are high, typically lying in the range of ~20 × 10−6 K−1. Additionally, they also exhibit considerable chemical expansion upon reduction, which effectively increases the total lattice expansion at higher temperatures (see for example, Section 4.1.2 for more details). Several studies have therefore been devoted to understanding the role of various cation substitutions on the thermal expansion of BaRECo2−xMxO6−δ and we will therefore focus on these efforts here.
Thermal expansion coefficients of BaRECo2−xMxO6−δ and some related compositions from the literature are listed in Table 12. Note that due to the influence of chemical expansion upon reduction, values have been separated to reflect whether the coefficients are purely thermal, extracted from different temperature intervals, for example, low and high temperatures, or simply averages over a wide range. For the discussion of trends in thermal expansion coefficients for this class of oxides, we will primarily use values that are purely thermal or that are determined at lower temperatures.
Using the values presented in Table 12, we see that the thermal expansion coefficient of BaRECo2O6−δ decreases with decreasing size of the rare earth elements (RE), in the order La → Nd → Sm → Gd → Y, varying from 24.3 to 15.8 × 10⁻⁶ K−1 in the entire series. This can be attributed to a reduction of the ionic character of the RE-O bond [34,324,329,341,344,345]. Other work investigating A-site compositional changes have involved partially substituting Sr for Ba. This has been largely ineffective, with larger proportions of Sr in the system Ba1−xSrxLnCoCuO6−δ (0 ≤ x ≤ 0.75) (Ln = Nd or Gd) resulting in insignificant changes to the thermal expansion coefficient [374,375]. However, the introduction of Sr seems to induce a small increase of the chemical expansion upon reduction, although this was only demonstrated for a few of the compositions studied.
Most of the work involved in altering the thermal expansion coefficient of BaRECo2−xMxO6−δ has been devoted to B-site substitutions, as the reduction of the Co-content generally reduces α. This has been demonstrated for a myriad of elements (M) including but not limited to Sc, Mn, Ni and Cu, where a larger proportion of M reduces the coefficient [376,377,378,379,380,381,382]. The attentive reader may here question why Fe has been excluded from the list of examples but this was done intentionally as the effect of Fe substitutions on thermal expansion has been contradictory [373,383,384,385,386,387,388]. We will therefore now focus on the system BaRECo2−xFexO6−δ in attempt to rationalize the contradicting studies. Although the majority of work studying the thermal expansion of Fe substituted BaRECo2O6−δ demonstrates that α either decreases or remains unchanged with increasing Fe-content, there are some notable exceptions. For instance, Zhao et al. [385] report that in BaPrCo2−xFexO6−δ, the thermal expansion coefficient first increases as x is increased from 0 to 0.5, from 24.6 to 26 × 10−6 K−1, whereupon it starts to readily decrease finally reaching a coefficient of 17.2 × 10⁻⁶ K−1 for x = 2. The problem with this erratic trend is that the values determined by Zhao et al. [385] are average coefficients, taken over a wide temperature range (RT–800 °C) and thus reflect a combination of thermal and chemical expansion. Estimating pure thermal expansion coefficients from a lower temperature regime (before an apparent chemical expansion onset of ~250 °C) using the dilatometry data presented, we find a clear systematic trend with respect to Fe content, decreasing from 19.3 to 13.4 × 10⁻⁶ K−1 upon going from x = 0 to 2. Similarly, in a study by Xue et al. [389], α was also reported to increase for higher Fe content in BaYCo2−xFexO6−δ increasing from 16.3 to 18.0 × 10⁻⁶ K−1 when x increased from 0 to 0.4. However, again we find that these coefficients are just average values for the entire temperature range studied (30–900 °C) and the lower temperature value of α (<250 °C) appears to be constant (~17.9 × 10⁻⁶ K−1), irrespective of the Fe concentration. Thus, most of the confusion regarding the effect of Fe on the thermal expansion of BaRECo2−xFexO6−δ seems to stem from the misusage of the term “thermal expansion coefficient”.
Although there are several studies that have investigated the lattice expansion of BaRECo2−xMxO6−δ, there is still a surprising lack of systematic work where the extent of chemical expansion has been determined. Most studies will just report differences in expansion coefficients (sum of thermal and chemical) upon varying the composition, but such changes can stem from a change in the chemical expansion coefficient, , and/or a change in the oxygen nonstoichiometry, δ. We can estimate for the system BaNdCo2−xFexO6−δ from the data by Cherepanov et al. [373] and find that the linear coefficient lies in the region of 0.005–0.008 per mol . If we assume that these compositions are representative for the layered double perovskite cobaltites, it means that this class of oxides displays a significantly lower chemical expansion coefficient upon reduction compared to the well-established electrodes BSCF ( ~0.012–0.016) and LSCF ( = 0.02–0.06).
Ruddlesden-Popper Structures
Ruddlesden-Popper is the name of a whole class of structures with general formula An+1BnO3n+1, where A is either an alkaline earth or a rare earth element, while B is generally a transition metal. Ruddlesden-Popper structures are composed of alternating layers of n rock-salt layers (AO) wedged in between a single perovskite slab (ABO3). Thus, the number n expresses the ratio of rock salt to perovskite layers (n = AO/ABO3).
From the transition metal point of view the most popular electrode materials with Ruddlesden-Popper structure would be ferrites, cobaltites, nickelates and cuprites [396]. The coefficients of thermal expansion for compounds of the Ruddlesden-Popper family are summarized in Table 13. The highest expansion coefficients are observed for cobaltites (>20 × 10−6 K−1) [397], slightly lower for ferrites (around 20 × 10−6 K−1) [398], whereas in case of nickelates and cuprates the coefficients are typically in the range of 11–14 × 10−6 K−1 [399,400,401,402,403]. Among all of the compounds with Ruddlesden-Popper structure nickelates are the most widely studied as the cathode materials due to their high diffusion coefficient of the oxygen ions and good electronic conductivity [400].
Similar to other compounds, the thermal expansion coefficient can be decreased by changing the ionicity of the A-O bond. This can be done by partial or full replacement of the alkali metal by a rare earth element [397,398]. The effect of decreasing the ionic radius of the rare earth element is not as clear as it is, for example, in the case of double perovskites. In the Ln2NiO4 series the thermal expansion coefficient decreases in the order Pr < La < Nd [399]. In another study, however [404], substitution of La by Pr in La2−xPrxNiO4+δ (0 ≤ x ≤ 2) had almost no effect on the thermal expansion coefficient which was in the range of 13.0–13.5 × 10⁻⁶ K−1 for all studied compositions. The reason for this discrepancy can be a result of two effects. First of all, Pr can either display a +3 or +4 oxidation state, each of which have different ionic radii. The second reason lies in changes in the crystal symmetry observed for this material system. As indicated by Flura et al. [399], the Ln2NiO4+δ structure can exist in at least three different space group symmetries: two orthorhombic types—Bmab (no. 64) or Fmmm (no. 69)—and a tetragonal one—I4/mmm (no. 139). Starting with La, the symmetry of the La2NiO4+δ cell changes from orthorhombic Fmmm to tetragonal I4/mmm but the coefficient stays constant and equal to 13 × 10−6 K−1. Pr2NiO4+δ on the other hand undergoes a structural change from Bmab to I4/mmm at around 400 °C, which results in a decrease in the expansion coefficient from 14.2 to 13.4 × 10⁻⁶ K−1. A transition similar to the case of the La-based compound is observed for Nd2NiO4+δ at around 400 °C, where the structure changes from an orthorhombic Fmmm to tetragonal I4/mmm. However, in this case the transition is associated with a change in the thermal expansion coefficient from 11.1 to 12.4 × 10⁻⁶ K−1.
All in all, the general rule for the nickelates is that thermal expansion coefficient is lower than in the case of other electrode materials. This seems to be true not only for Ruddlesden-Popper structures with n = 1 but also for higher order structures. Amow et al. [401] performed a comparative study of Lan+1NinO3n+1 for n = 1, 2 and 3 and found that the thermal expansion coefficient is 13.8 × 10⁻⁶ K−1 for n = 1, while it hardly changes for n = 2 or 3, displaying values of 13.2 × 10⁻⁶ K−1.
Interestingly, the chemical expansion upon reduction in Ruddlesden-Popper electrode materials is very low [399,405], differentiating them from other electrode materials. It is important to note that there is a fundamental difference between oxygen nonstoichiometry in Ruddlesden-Popper structure types and, for instance, perovskite electrodes. The former has an excess of oxygen ions, in the form of oxygen interstitials, whereas in the latter oxygen vacancies are formed and the material exhibits oxygen deficiency. The interstitial defects are formed to compensate high structural stress arising from competing A-O and B-O bonds, which are present between perovskite and rock salt layers. The affinity of oxygen incorporation is so high that the compounds can incorporate excess oxygen even at room temperature [403]. As a result fast oxygen diffusion paths for oxygen transport are formed in the material and the unit cell changes anisotropically as δ increases. Kharton et al. [405] showed that the lattice parameter a increases while the corresponding lattice parameter c decreases with increasing oxygen nonstoichiometry. As a result of this, the total chemical expansion of Ruddlesden-Popper compounds is nearly zero—the chemical contribution to the apparent thermochemical expansion coefficient does not exceed 5%.
5.2.3. Expansion of Fuel Side Electrodes
Unlike the air-side electrodes, which have been studied extensively, much less has been done on the fuel side electrodes. A major reason for this is from the benefit of having reducing atmospheres, enabling the use of composites composed of the proton or oxide ion conducting electrolyte and an electronically conducting metal. Under reducing atmospheres, the metal will no longer run the risk of oxidizing, which would very easily lower its performance and possibly lead to device failure. The majority of reducing atmosphere electrodes is therefore based on ceramic-metal composites, cermets, and these will be the focus of the remaining part of this section.
A key benefit of using cermets as electrodes is that they tend to display minimal thermal mismatch with the electrolyte, as the ceramic part is generally based on the same composition. The metallic component is typically a transition metal, with Ni being by far the most popular choice, mostly due to its excellent catalytic activity towards H2 oxidation. Unfortunately, limited work has investigated the thermal and chemical expansion of these cermets, relying mostly on the use of simple expressions, for example, (36) in Section 4.2. As many success stories from the SOFC/SOEC community tend to make their way into the PCFC/PCEC community, we choose to take advantage of the work that has been done on the widely successful YSZ/Ni cermet and will draw parallels to the proton conducting analogue, BZCY/Ni cermet.
Before continuing, it is important to describe how these fuel side electrode cermets are fabricated. The most common practice is to co-sinter a thin electrolyte (YSZ or BZCY) onto a composite support composed of NiO and the electrolyte material [32,407,408,409,410], YSZ on YSZ/NiO for SOFCs, or BZCY on BZCY/NiO in the case of PCFCs. The co-sintering takes place in oxidizing atmospheres at temperatures above 1300 °C, followed by a reduction step to reduce NiO to Ni. Consequently, the expansion of the whole device needs to be understood with both NiO and Ni.
Figure 10a shows the thermal expansion coefficients as a function temperature for the case of an SOFC/SOEC system and all its components, including Ni, NiO, YSZ, as well as the composites Ni/YSZ and NiO/YSZ, while (b) provides the PCFC/PCEC equivalent system replacing YSZ with BZCY. For the YSZ-system in (a), the data has been taken from Mori et al. [131], in which the composites had 52 vol% and 40 vol% NiO and Ni, respectively. For the BZCY equivalent, we use the data from Figure 4b for BZCY and (36) to calculate the expansion of NiO/BZCY composite. We used the same proportions between NiO and BZCY phases as in the case of NiO/YSZ for the sake of simplicity. Unfortunately, such a simple model cannot be used to calculate the expansion of Ni/BCZY and this will be explained in detail in the next paragraphs upon dealing with the thermal expansion of the Ni/YSZ cermet as an example.
As expected, a linear dependence between the amount of NiO in the anode and the thermal expansion of NiO/YSZ composites was observed in the experimental data presented [131,411]. This goes in line with the model described by Equation (36). This assures the validity of calculation of thermal expansion coefficients of NiO/BZCY composite. Therefore, in both cases, the effective expansion coefficient will be proportional to the thermal expansion of both NiO and the electrolyte material, and the relative volume proportion between the two. It can be seen that the antiferromagnetic-to-paramagnetic transition of NiO strongly affects also the properties of both NiO/YSZ and NiO/BZCY.
Cermets obtained after reduction of the composites will exhibit different properties. The expansion of Ni/YSZ is dominated by the electrolyte backbone. The anomalous peak due to the ferromagnetic-to-paramagnetic transition of Ni is not observed in the thermal expansion coefficient of the cermet and as the temperature increases the influence of Ni on the total expansion of cermet diminishes completely, such that the thermal expansion coefficient of the cermet approaches that of the electrolyte. This is caused by the ductility of metallic Ni. The strain caused by the thermal mismatch between the ceramic and metallic part of the composite causes the metal part to plastically deform. The situation is very different than in the case where two ceramic materials form a composite, as in the case of the NiO-based composites. For that reason, Equation (36) could not be used to calculate thermal expansion of Ni/BZCY, because the model on which it is based does not account for such effects. However, it can be assumed that Ni/BZCY will behave similar to Ni/YSZ. Namely, at lower temperatures some effects of Ni presence will be observed, whereas at higher temperatures the thermal expansion of the cermet will equal that of BZCY. All in all, in the whole temperature range the thermal expansion coefficient of Ni/BZCY should be expected to be rather close to the values of BZCY.
One of the main challenges of these electrodes lies in the redox cycles caused by an interruption of fuel [412]. Based on their molar volumes, the oxidation of Ni to NiO is accompanied by an increase of solid volume by 69.9%. Strategies to alleviate this problem are to increase the porosity of the anode or to use an uneven distribution of the electrolyte grain size. Nasani et al. [413] studied the redox behavior of the anode Ni/BZY cermet and showed a similar expansion of NiO upon reoxidation as the one observed for YSZ/NiO. Their microstructural analysis proved that the microcracks and delamination observed were due to the nickel expansion phase upon reoxidation.
A recent study focused on the preparation on Ni/BZY20 anodes, varying the amount of NiO [414]. The co-sintering of the BZY20 onto BZY20/NiO supports failed for 80 wt.% of NiO, due to the difference in thermal expansion coefficients between NiO and BZY20. Indeed, the NiO-BZY20 supports shrink more than the thin BZY20 electrolyte upon cooling. The authors recommend supports BZY20/NiO with <70 wt.% NiO. While the ratio NiO to BZCY is of importance, the composition of the PCC material also appears to be an important parameter. Stability of Ni-BaCe0.8Y0.2O3−d (Ni-BCY) and Ni-BaCe0.6Zr0.2Y0.2O3−d (Ni-BCZY) after reduction and oxidation (redox) cycles at 800 °C showed that NiO particles had a stronger bonding with BCZY particles than with BCY particles. SEM images after redox cycles showed larger and more cracks for BCY than BCZY [310].
One difference to consider is that contrary to YSZ, proton conducting oxides used in the cermet electrodes of PCFCs exhibit chemical expansion upon hydration (see Section 2.2.1, Section 4.1.1 and Section 5.1.1), i.e., the lattice expands upon the incorporation of protonic defects into the lattice. The hydration of BZY/NiO supports with BZY thin membranes is very critical. Onishi et al. reported that the hydration of BZY20 should be carried out at higher temperatures to alleviate compressive stress [414]. This observation is based on the observation of cells (60 wt.%NiO/BZY20 with thin BZY20 electrolyte) heated to 100 or 200 °C in dry Ar and then up to 600 °C in 3% H2O in Ar. Cracks are observed only on the cells hydrated at 100 °C.
Finally, the hydration of the proton conducting ceramic also influences the strength of the material. Sazinas et al. [415] reported enhanced fracture toughness for hydrated samples compared to dehydrated samples.
6. Thermal Compatibility and Mismatch: Symmetries, Issues, Methods of Mitigation
The previous sections compiled expansion coefficients for different classes of electrolytes and electrode materials (both air side and reducing atmosphere electrodes). In this part, guidelines to minimize expansion coefficient mismatch between the different layers of a PCFC, PCEC or membrane reactor are proposed. First, different parameters that can lead to cell failure are listed, before moving to mitigating strategies summarized in Figure 11.
6.1. Issues That Can Lead to Cell Failure
Results on both SOFC and PCFC studies are used for the following list, as work on the PCFCs is scarcer. It is, however, important to note that the operating temperature of protonic ceramic based devices is significantly lower than that of SOFCs (500–600 °C versus 800–1000 °C). As a result, the chemical expansion upon reduction observed in typical SOFC cathodes (BSCF and LSCF) is much lower at 500–600 °C than at 800–1000 °C (see Figure 2) and should thus pose much less of a problem.
Typically, the most critical issue lays in the large mismatch between the coefficient of expansion of the different layers. As indicated in previous sections thermal expansion coefficients of different layers of the electrochemical cell can span from the range 8–12 × 10−6 K−1 for the electrolytes (Section 5.1) up to 25 × 10−6 K−1 for the electrodes (Section 5.2). This will result in cracks or delamination between the different layers.
Another issue stems from chemical expansion caused either by hydration or reduction of a material. The former will appear in PCCs during either the treatment in conditions where water vapor partial pressures are changing, or as a result of exposing material with thermochemical history to conditions of different humidity (e.g., material pre-dried or pre-saturated with protons exposed respectively to humid or dry gas). In the case of varying water vapor pressure PCC will expand/contract due to hydration/drying. As a result, stresses will appear on the interfaces between the PCC and the other layers of the electrochemical device. In another case, device failure can be observed when a PCC with a thermal history is exposed to conditions different to the one it was previously treated in. An example could be a dry proton conductor, that is, completely dehydrated, being co-sintered with an electrode material in humid conditions. This will cause the PCC material to expand due to hydration. Chemical expansion upon reduction will result in similar issues as those presented for hydration, although this will be typically restricted to electrode materials and will be present at higher temperatures.
Although cell failures tend to stem from mismatches in expansion coefficients between the different components, microstructural changes can also pose a significant problem for the integrity of the electrochemical cell. This is typically encountered when electrodes composed of composites are used. A degradation of the cell can thus be caused by significant changes in the composite’s microstructure during fabrication, as the volume fractions of the individual components will change, which subsequently alters the overall thermal expansion coefficient. Further, one may experience chemical mixing due to ion diffusion at elevated temperatures, resulting in a poorer performance of the composite.
6.2. Mitigating Strategies
The best strategy to mitigate the mismatch depends on the reason of the interfacial stresses. If the reason lies only in the difference of thermal expansion coefficients, then the simplest strategy would be choosing materials with a smaller difference. Expansion coefficients for the different electrolyte materials and electrodes materials can be extracted from Figure 5, Figure 6, Figure 7, Figure 8 and Figure 9 and Table 2, Table 3, Table 4, Table 5, Table 6, Table 7, Table 8, Table 9, Table 10, Table 11, Table 12 and Table 13. The coefficients can be tailored by choosing an adequate dopant, dopant content, substituent and tolerance factor. As already mentioned in Section 4.1.1, the history of the materials used for cell fabrication will also influence their thermal and chemical expansions due to kinetic effects. It is hard to predict the exact thermal expansion coefficients mismatch that a cell can withstand, because this is related not only to the difference of coefficient values but also to other mechanical properties of ceramics, such as Young’s modulus, tensile strength or fracture toughness and these can vary significantly from one case to another. However, Zhang and Xia [416] presented a model for calculating the durability of a fuel cell on the basis of the performance of the electrode. They conclude that with a high restriction of durability (performance loss expressed as an increase of polarization resistance that does not exceed 1% over 100 thermal cycles from RT to 800 °C), the upper limit for the thermal expansion coefficient of an electrode material should be 15.1 × 10⁻⁶ K−1 for the case of an electrolyte with α equal to 10.8 × 10⁻⁶ K−1. On this basis, we can estimate that the safety limit in which the performance of an electrochemical device should not be obstructed is for a thermal expansion mismatch of less than 50%.
Another strategy of mitigating the mismatch problem is to fabricate electrolyte-electrode composites. Several methods have previously been used to synthesize such composites, including direct mixing of the two phases as well as infiltration/impregnation based techniques [16,317,319,320,336,337,338,339]. These composites can be used as interlayers with intermediate thermal expansion coefficient, which will reduce the mismatch that would appear if the electrode was in direct contact with the electrolyte.
A further development of that idea would be to produce a composite electrode with a graded composition. Graded electrodes have been studied for both SOFC and PCFC anodes [417,418,419,420] and have been reported to decrease the probability of failure [421]. Continuously graded BaCe0.5Zr0.35Y0.15O3−d (BCZY)/NiO anode functional layers were prepared by electrostatic slurry spray deposition with a rotation stage [420]. In addition to extending the active three-phase boundary (TPB) length, this functionally and continuously gradient layer also helps to reduce the undesirable discontinuities of thermal expansion coefficients, which would contribute to enhance chemical and mechanical stabilities.
An approach to limit crack formation and warping during the half-cell fabrication consists in depositing an electrolyte layer on both sides of the electrode material. After co-sintering, the sacrificial electrolyte layer is removed [32,318,422].
The stability of the cell can be further tailored by controlling microstructure of its layers. For instance, as already mentioned in Section 5.2.3, high porosity reducing atmosphere electrodes show improved stability upon redox cycles. Moreover, an uneven distribution of the electrolyte grain size in the composite also improves the stability of the electrochemical cell upon redox cycling [412].
The stability can be also controlled by geometry features. Majumdar et al. reported that varying the thickness and thickness ratio of the cell components can be used to tolerate thermal expansion mismatch [411]. For instance, it was observed that 600-mm-thick samples Ni/YSZ were approximately 60% stronger after 8 h of reduction than 900-mm-thick samples [423].
The problem of chemical expansion can be tackled by a careful control of the fabrication conditions in terms of temperature, oxygen and water vapor partial pressures. This requires detailed insight to the thermal and chemical expansion of each of the cell components. This knowledge can be used to mitigate the problem of degradation of the cell. For instance, to prevent cracks on BZCY/Ni with a thin BZCY electrolyte, it has been advised to heat the sample in dry atmosphere and then switch to moist conditions when the operating temperature has been reached [119,414,424]. The stability of Ni-based composites can also be improved by controlling the reduction process: Ni et al. [386] studied the influence of the anode reduction temperature (8 h 700 °C, 6 h 800 °C, 4 h 900 °C and 2 h at 1000 °C) on the mechanical properties of Ni-YSZ and found improved strength (~12%) and enhanced elastic moduli at elevated reduction temperatures. This phenomenon was explained by promoted mass diffusion among Ni particles at higher temperature and healing of the defects/flaws within the material.
Lastly using supporting layers should be considered as a potential improvement of the cell stability. Metal supported cells have been developed for SOFCs and a similar approach is also being developed for PCFC/PCECs [425]. Tucker [339] discussed the coefficient of thermal expansion mismatch between the electrolyte and metal support as a function of temperature. At the operating temperature, initial thermal stresses in the cell due to coefficient of thermal expansion mismatch are expected to dissipate via metal creep and a “zero-stress” state is achieved after a sufficient time period. As the thermal expansion coefficient of the metal support is generally higher than that of the electrolyte (also valid for PCFC), the electrolyte is held in compression during cooling, a desirable situation for the mechanical integrity of the cell.
7. Summary
This work provides a set of theory and data for thermochemical expansion of Proton Conducting Ceramics (PCCs). The theory of thermal expansion of a solid from microscopic and macroscopic points of view is provided. The influence of chemical expansion upon hydration and oxidation/reduction of PCCs is analyzed and presented so that the chemical and thermal expansion can be decoupled. The importance of precisely controlling the atmosphere conditions, while studying the expansion of PCCs is explained in the context of chemical expansion.
Experiment conducted within this study show that, as long as atmospheric conditions are controlled and the rate is not too fast (<20 K min−1), the heating/cooling rate has little to no effect in determining thermal expansion coefficients experimentally.
The literature data is given for PCCs, which in this study are divided into two groups: oxides in which protons are dominating charged species—the electrolyte,s and mixed ionic and electronic conductors (MIECs). Data is predominantly gathered from the studies presenting dilatometry results, since this measurement gives the bulk expansion coefficient, which, as discussed in the theory section, is more useful from an application point of view.
The aspect of thermal compatibility in the electrochemical cells based on PCCs is discussed and measures to avoid the thermal mismatch problem are given.
The interest in the research field of PCCs has been continuously increasing and efforts are now directed towards upscaling, where expansion and thermal mismatch become more critical. It is clear from this review that there is only limited available work on the expansion behavior of electrodes compatible with PCCs (both reducing and air sides). This area thus represents an opportunity for high impact research.
Funding
The Polish contribution was supported by two projects: 2015/17/N/ST5/02813 funded by the National Science Centre, Poland and 2016/22/Z/ST5/00691 funded by the European Commission and National Science Centre, Poland via M-era.Net network. AL wishes to express gratitude to the Centre for Earth Evolution and Dynamics, through the CoE grant from the Research Council of Norway, for funding and support. The US contribution was supported by the Colorado School of Mines Foundation via the Angel Research Fund.
Acknowledgments
The authors would like to thank Tadeusz Miruszewski and Bartosz Kamecki from Gdańsk University of Technology for their support during this work.
Conflicts of Interest
The authors declare no conflicts of interest.
Abbreviations and Symbols List
| Abbr. | Meaning |
| a, b, c | lattice parameters |
| Acc | acceptor dopant |
| BCN | Ba3Ca1+xNb2−xO9−δ |
| BCY | BaCe1−xYxO3−δ |
| BZCY | BaZr1−x−yCexYyO3−δ |
| BZCY72 | BaZr0.7Ce0.2Y0.1O3−δ |
| BSCF | Ba1−xSrxCo0.8Fe0.2O3−δ |
| BZO | barium zirconate |
| BZY | BaZr1−xYxO3−δ |
| cercer | ceramic ceramic composite |
| cermet | ceramic metal composite |
| CTE | coefficient of thermal expansion |
| DFT | density functional theory |
| DIL | Dilatometry |
| EoS | equation of state |
| G | Gibbs free energy |
| HA | harmonic approximation |
| HT | high temperature |
| HTPC | high temperature proton conductor |
| HT-XRD | high temperature X-ray diffraction |
| hydr | hydration/hydrated |
| K | bulk modulus |
| L | Length |
| LSCF | La1−xSrxCoyFe1−yO3−δ |
| Ln | lanthanide |
| LT | low temperature |
| LWO | lanthanum tungstate |
| MD | molecular dynamics |
| MIEC | mixed ionic electronic conductor |
| ND | neutron diffraction |
| PCC | proton conducting ceramic |
| PCE | proton ceramic electrolyte |
| PCEC | proton ceramic electrolyser cell |
| PCFC | proton ceramic fuel cell |
| QHA | quasi-harmonic approximation |
| RE | rare earth |
| RT | room temperature |
| SOEC | solid oxide electrolyser cell |
| SOFC | solid oxide fuel cell |
| ΔhydrH | standard hydration enthalpy |
| ΔhydrSo | standard hydration entropy |
| T | temperature |
| t | transport number |
| TCO | triple conducting oxide |
| TEC | thermal expansion coefficient |
| TG | thermogravimetric analysis |
| TPB | triple-phase boundary |
| V | volume |
| XRD | X-ray diffraction |
| YSZ | yttria stabilized zirconia |
| α | coefficient of thermal expansion |
| β | coefficient of chemical expansion |
| δ | oxygen non-stoichiometry |
| ε | uniaxial strain |
| μ | shear modulus |
| v | volume fraction |
References
- Desaguliers, J.T. A Course of Experimental Philosophy; W. Innys: London, UK, 1745. [Google Scholar]
- Touloukian, Y.S.; Kirby, R.K.; Taylor, R.E.; Desai, P.D. Thermal Expansion; Springer US: Boston, MA, USA, 1975; ISBN 978-1-4757-1624-5. [Google Scholar]
- Marrony, M.; Berger, P.; Mauvy, F.; Grenier, J.C.; Sata, N.; Magrasó, A.; Haugsrud, R.; Slater, P.R.; Taillades, G.; Roziere, J.; et al. Proton-Conducting Ceramics. From Fundamentals to Applied Research; Marrony, M., Ed.; Pan Stanford Publishing: Singapore, 2016; ISBN 978-981-4613-84-2. [Google Scholar]
- Colomban, P. Proton Conductors: Solids, Membranes and Gels-Materials and Devices; Cambridge University Press: Cambridge, UK, 1992. [Google Scholar]
- Iwahara, H.; Yajima, T.; Hibino, T.; Ozaki, K.; Suzuki, H. Protonic conduction in calcium, strontium and barium zirconates. Solid State Ion. 1993, 61, 65–69. [Google Scholar] [CrossRef]
- Iwahara, H.; Uchida, H.; Ono, K.; Ogaki, K. Proton Conduction in Sintered Oxides Based on BaCeO3. J. Electrochem. Soc. 1988, 135, 529–533. [Google Scholar] [CrossRef]
- Duan, C.; Tong, J.; Shang, M.; Nikodemski, S.; Sanders, M.; Ricote, S.; Almansoori, A.; OHayre, R.; O’Hayre, R. Readily processed protonic ceramic fuel cells with high performance at low temperatures. Science 2015, 349, 1321–1326. [Google Scholar] [CrossRef] [PubMed]
- Morejudo, S.H.; Zanón, R.; Escolástico, S.; Yuste-Tirados, I.; Malerød-Fjeld, H.; Vestre, P.K.; Coors, W.G.; Martínez, A.; Norby, T.; Serra, J.M.; et al. Direct conversion of methane to aromatics in a catalytic co-ionic membrane reactor. Science 2016, 353, 563–566. [Google Scholar] [CrossRef] [PubMed] [Green Version]
- Coors, W.G. Protonic ceramic fuel cells for high-efficiency operation with methane. J. Power Sources 2003, 118, 150–156. [Google Scholar] [CrossRef]
- Malerød-Fjeld, H.; Clark, D.; Yuste-Tirados, I.; Zanón, R.; Catalán-Martinez, D.; Beeaff, D.; Morejudo, S.H.; Vestre, P.K.; Norby, T.; Haugsrud, R.; et al. Thermo-electrochemical production of compressed hydrogen from methane with near-zero energy loss. Nat. Energy 2017, 2, 923–931. [Google Scholar] [CrossRef]
- Iwahara, H. High temperature proton conducting oxides and their applications to solid electrolyte fuel cells and steam electrolyzer for hydrogen production. Solid State Ion. 1988, 28–30, 573–578. [Google Scholar] [CrossRef]
- Molenda, J.; Kupecki, J.; Baron, R.; Blesznowski, M.; Brus, G.; Brylewski, T.; Bucko, M.; Chmielowiec, J.; Cwieka, K.; Gazda, M.; et al. Status report on high temperature fuel cells in Poland—Recent advances and achievements. Int. J. Hydrog. Energy 2017, 42, 4366–4403. [Google Scholar] [CrossRef]
- Iwahara, H. Proton conducting ceramics and their applications. Solid State Ion. 1996, 86–88, 9–15. [Google Scholar] [CrossRef]
- Norby, T. Solid-state protonic conductors: Principles, properties, progress and prospects. Solid State Ion. 1999, 125, 1–11. [Google Scholar] [CrossRef]
- Zagórski, K.; Wachowski, S.; Szymczewska, D.; Mielewczyk-Gryń, A.; Jasiński, P.; Gazda, M. Performance of a single layer fuel cell based on a mixed proton-electron conducting composite. J. Power Sources 2017, 353, 230–236. [Google Scholar] [CrossRef]
- Wachowski, S.; Li, Z.; Polfus, J.M.; Norby, T. Performance and stability in H2S of SrFe0.75Mo0.25O3−δ as electrode in proton ceramic fuel cells. J. Eur. Ceram. Soc. 2018, 38, 163–171. [Google Scholar] [CrossRef]
- Sakai, T.; Matsushita, S.; Matsumoto, H.; Okada, S.; Hashimoto, S.; Ishihara, T. Intermediate temperature steam electrolysis using strontium zirconate-based protonic conductors. Int. J. Hydrog. Energy 2009, 34, 56–63. [Google Scholar] [CrossRef]
- Katahira, K.; Matsumoto, H.; Iwahara, H.; Koide, K.; Iwamoto, T. Solid electrolyte hydrogen sensor with an electrochemically-supplied hydrogen standard. Sens. Actuators B Chem. 2001, 73, 130–134. [Google Scholar] [CrossRef]
- Yajima, T.; Koide, K.; Takai, H.; Fukatsu, N.; Iwahara, H. Application of hydrogen sensor using proton conductive ceramics as a solid electrolyte to aluminum casting industries. Solid State Ion. 1995, 79, 333–337. [Google Scholar] [CrossRef]
- Serret, P.; Colominas, S.; Reyes, G.; Abellà, J. Characterization of ceramic materials for electrochemical hydrogen sensors. Fusion Eng. Des. 2011, 86, 2446–2449. [Google Scholar] [CrossRef]
- Volkov, A.; Gorbova, E.; Vylkov, A.; Medvedev, D.; Demin, A.; Tsiakaras, P. Design and applications of potentiometric sensors based on proton-conducting ceramic materials. A brief review. Sens. Actuators B Chem. 2017, 244, 1004–1015. [Google Scholar] [CrossRef]
- Phair, J.W.; Badwal, S.P.S. Review of proton conductors for hydrogen separation. Ionics 2006, 12, 103–115. [Google Scholar] [CrossRef] [Green Version]
- Lundin, S.T.B.; Patki, N.S.; Fuerst, T.F.; Ricote, S.; Wolden, C.A.; Way, J.D. Dense Inorganic Membranes for Hydrogen Separation. In Membranes for Gas Separations; World Scientific: Singapore, 2017; pp. 271–363. [Google Scholar]
- Tao, Z.; Yan, L.; Qiao, J.; Wang, B.; Zhang, L.; Zhang, J. A review of advanced proton-conducting materials for hydrogen separation. Prog. Mater. Sci. 2015, 74, 1–50. [Google Scholar] [CrossRef]
- Fontaine, M.L.; Norby, T.; Larring, Y.; Grande, T.; Bredesen, R. Oxygen and Hydrogen Separation Membranes Based on Dense Ceramic Conductors. Membr. Sci. Technol. 2008, 13, 401–458. [Google Scholar] [CrossRef]
- Choi, S.; Kucharczyk, C.J.; Liang, Y.; Zhang, X.; Takeuchi, I.; Ji, H.I.; Haile, S.M. Exceptional power density and stability at intermediate temperatures in protonic ceramic fuel cells. Nat. Energy 2018, 3, 202–210. [Google Scholar] [CrossRef] [Green Version]
- Iwahara, H.; Esaka, T.; Uchida, H.; Maeda, N. Proton conduction in sintered oxides and its application to steam electrolysis for hydrogen production. Solid State Ion. 1981, 3–4, 359–363. [Google Scholar] [CrossRef]
- Vasileiou, E.; Kyriakou, V.; Garagounis, I.; Vourros, A.; Stoukides, M. Ammonia synthesis at atmospheric pressure in a BaCe0.2Zr0.7Y0.1O2.9 solid electrolyte cell. Solid State Ion. 2015, 275, 110–116. [Google Scholar] [CrossRef]
- Marnellos, G.; Stoukides, M. Ammonia Synthesis at Atmospheric Pressure. Science 1998, 282, 98–100. [Google Scholar] [CrossRef] [PubMed]
- Gocha, A. CeramicTechToday from The American Ceramic Society; The American Ceramic Society: Westerville, OH, USA, 2017. [Google Scholar]
- Dubois, A.; Ricote, S.; Braun, R.J. Benchmarking the expected stack manufacturing cost of next generation, intermediate-temperature protonic ceramic fuel cells with solid oxide fuel cell technology. J. Power Sources 2017, 369, 65–77. [Google Scholar] [CrossRef]
- Duan, C.; Kee, R.J.; Zhu, H.; Karakaya, C.; Chen, Y.; Ricote, S.; Jarry, A.; Crumlin, E.J.; Hook, D.; Braun, R.; et al. Highly durable, coking and sulfur tolerant, fuel-flexible protonic ceramic fuel cells. Nature 2018, 557, 217–222. [Google Scholar] [CrossRef] [PubMed]
- Nakajo, A.; Stiller, C.; Härkegård, G.; Bolland, O. Modeling of thermal stresses and probability of survival of tubular SOFC. J. Power Sources 2006, 158, 287–294. [Google Scholar] [CrossRef]
- Tietz, F. Thermal expansion of SOFC materials. Ionics 1999, 5, 129–139. [Google Scholar] [CrossRef]
- Selimovic, A.; Kemm, M.; Torisson, T.; Assadi, M. Steady state and transient thermal stress analysis in planar solid oxide fuel cells. J. Power Sources 2005, 145, 463–469. [Google Scholar] [CrossRef]
- Lin, C.K.; Chen, T.T.; Chyou, Y.P.; Chiang, L.K. Thermal stress analysis of a planar SOFC stack. J. Power Sources 2007, 164, 238–251. [Google Scholar] [CrossRef]
- Laurencin, J.; Delette, G.; Lefebvre-Joud, F.; Dupeux, M. A numerical tool to estimate SOFC mechanical degradation: Case of the planar cell configuration. J. Eur. Ceram. Soc. 2008, 28, 1857–1869. [Google Scholar] [CrossRef]
- Carter, B.; Norton, G. Ceramic Materials; Springer: New York, NY, USA, 2007; ISBN 978-0-387-46270-7. [Google Scholar]
- Kingery, W.D.; Bowen, H.K.; Uhlmann, D.R. Introduction to Ceramics, 2nd ed.; Wiley: Hoboken, NJ, USA, 1976; ISBN 978-0-471-47860-7. [Google Scholar]
- Kittel, C.; McEuen, P. Introduction to Solid State Physics; Willey: Hoboken, NJ, USA, 1998; Volume 8, ISBN 047141526X. [Google Scholar]
- Levy, R.A. Principles of Solid State Physics; Academic Press: Cambridge, MA, USA, 1968; ISBN 9780124457508. [Google Scholar]
- Brown, F.C. The Physics of Solids; W.A. Benjamin: New York, NY, USA, 1967. [Google Scholar]
- Krishnan, R.S.; Srinivasan, R.; Devanarayan, S. Thermal Expansion of Crystals; Pergamon Press: Oxford, UK, 1979; ISBN 0-08-021405-3. [Google Scholar]
- Belousov, R.I.; Filatov, S.K. Algorithm for calculating the thermal expansion tensor and constructing the thermal expansion diagram for crystals. Glas. Phys. Chem. 2007, 33, 271–275. [Google Scholar] [CrossRef]
- Paufler, P.; Weber, T. On the determination of linear expansion coefficients of triclinic crystals using X-ray diffraction. Eur. J. Mineral. 1999, 11, 721–730. [Google Scholar] [CrossRef]
- Branson, D.L. Thermal Expansion Coefficients of Zirconate Ceramics. J. Am. Ceram. Soc. 1965, 48, 441–442. [Google Scholar] [CrossRef]
- Adler, S.B. Chemical Expansivity of Electrochemical Ceramics. J. Am. Ceram. Soc. 2004, 84, 2117–2119. [Google Scholar] [CrossRef]
- Garai, J. Correlation between thermal expansion and heat capacity. Calphad 2006, 30, 354–356. [Google Scholar] [CrossRef] [Green Version]
- Mohazzabi, P.; Behroozi, F. Thermal expansion of solids: A simple classical model. Eur. J. Phys. 1997, 18, 237–240. [Google Scholar] [CrossRef]
- Suzuki, I. Thermal expansion of periclase and olivine and their anharmonic properties. In Elastic Properties and Equations of State; American Geophysical Union: Washington, DC, USA, 1988; Volume 23, pp. 361–375. ISBN 0875902405. [Google Scholar]
- Samara, G.A.; Morosin, B. Anharmonic Effects in KTaO3: Ferroelectric Mode, Thermal Expansion, and Compressibility. Phys. Rev. B 1973, 8, 1256–1264. [Google Scholar] [CrossRef]
- Li, C.W.; Tang, X.; Muñoz, J.A.; Keith, J.B.; Tracy, S.J.; Abernathy, D.L.; Fultz, B. Structural Relationship between Negative Thermal Expansion and Quartic Anharmonicity of Cubic ScF3. Phys. Rev. Lett. 2011, 107, 195504. [Google Scholar] [CrossRef] [PubMed]
- Janio de Castro Lima, J.; Paraguassu, A.B. Linear thermal expansion of granitic rocks: Influence of apparent porosity, grain size and quartz content. Bull. Eng. Geol. Environ. 2004, 63, 215–220. [Google Scholar] [CrossRef]
- Parker, F.J.; Rice, R.W. Correlation between Grain Size and Thermal Expansion for Aluminum Titanate Materials. J. Am. Ceram. Soc. 1989, 72, 2364–2366. [Google Scholar] [CrossRef]
- Antal, D.; Húlan, T.; Štubňa, I.; Záleská, M.; Trník, A. The influence of texture on elastic and thermophysical properties of kaolin- and illite-based ceramic bodies. Ceram. Int. 2017, 43, 2730–2736. [Google Scholar] [CrossRef]
- Paulik, S.W.; Faber, K.T.; Fuller, E.R. Development of Textured Microstructures in Ceramics with Large Thermal Expansion Anisotropy. J. Am. Ceram. Soc. 1994, 77, 454–458. [Google Scholar] [CrossRef]
- Mogensen, M.; Sammes, N.M.; Tompsett, G.A. Physical, chemical and electrochemical properties of pure and doped ceria. Solid State Ion. 2000, 129, 63–94. [Google Scholar] [CrossRef]
- Marrocchelli, D.; Perry, N.H.; Bishop, S.R. Understanding chemical expansion in perovskite-structured oxides. Phys. Chem. Chem. Phys. 2015, 17, 10028–10039. [Google Scholar] [CrossRef] [PubMed]
- Marrocchelli, D.; Bishop, S.R.; Tuller, H.L.; Yildiz, B. Understanding Chemical Expansion in Non-Stoichiometric Oxides: Ceria and Zirconia Case Studies. Adv. Funct. Mater. 2012, 22, 1958–1965. [Google Scholar] [CrossRef]
- Marrocchelli, D.; Bishop, S.R.; Tuller, H.L.; Watson, G.W.; Yildiz, B. Charge localization increases chemical expansion in cerium-based oxides. Phys. Chem. Chem. Phys. 2012, 14, 12070–12074. [Google Scholar] [CrossRef] [PubMed]
- Haugsrud, R. On the high-temperature oxidation of nickel. Corros. Sci. 2003, 45, 211–235. [Google Scholar] [CrossRef]
- Richardson, J.T.; Scates, R.; Twigg, M.V. X-ray diffraction study of nickel oxide reduction by hydrogen. Appl. Catal. A Gen. 2003, 246, 137–150. [Google Scholar] [CrossRef]
- Vullum, F.; Nitsche, F.; Selbach, S.M.; Grande, T. Solid solubility and phase transitions in the system LaNb1−xTaxO4. J. Solid State Chem. 2008, 181, 2580–2585. [Google Scholar] [CrossRef]
- Wachowski, S.; Mielewczyk-Gryn, A.; Gazda, M. Effect of isovalent substitution on microstructure and phase transition of LaNb1−xMxO4 (M = Sb, V or Ta; x = 0.05–0.3). J. Solid State Chem. 2014, 219, 201–209. [Google Scholar] [CrossRef]
- Haugsrud, R.; Norby, T. High-temperature proton conductivity in acceptor-doped LaNbO4. Solid State Ion. 2006, 177, 1129–1135. [Google Scholar] [CrossRef]
- Vegard, L. Die Konstitution der Mischkristalle und die Raumfüllung der Atome. Z. Phys. 1921, 5, 17–26. [Google Scholar] [CrossRef]
- Yamazaki, Y.; Yang, C.K.; Haile, S.M. Unraveling the defect chemistry and proton uptake of yttrium-doped barium zirconate. Scr. Mater. 2011, 65, 102–107. [Google Scholar] [CrossRef]
- Shannon, R.D. Revised effective ionic radii and systematic studies of interatomic distances in halides and chalcogenides. Acta Crystallogr. Sect. A 1976, 32, 751–767. [Google Scholar] [CrossRef] [Green Version]
- Omata, T.; Noguchi, Y.; Otsuka-Yao-Matsuo, S. Infrared Study of High-Temperature Proton-Conducting Aliovalently Doped SrZrO3 and BaZrO3. J. Electrochem. Soc. 2005, 152, E200–E205. [Google Scholar] [CrossRef]
- Imashuku, S.; Uda, T.; Nose, Y.; Awakura, Y. To journal of phase equilibria and diffusion phase relationship of the BaO-ZrO2-YO1.5 system at 1500 and 1600 °C. J. Phase Equilibria Diffus. 2010, 31, 348–356. [Google Scholar] [CrossRef]
- Giannici, F.; Shirpour, M.; Longo, A.; Martorana, A.; Merkle, R.; Maier, J. Long-range and short-range structure of proton-conducting Y:BaZrO3. Chem. Mater. 2011, 23, 2994–3002. [Google Scholar] [CrossRef] [Green Version]
- Shirpour, M.; Rahmati, B.; Sigle, W.; Van Aken, P.A.; Merkle, R.; Maier, J. Dopant segregation and space charge effects in proton-conducting BaZrO3 perovskites. J. Phys. Chem. C 2012, 116, 2453–2461. [Google Scholar] [CrossRef]
- Kreuer, K.D.; Adams, S.; Münch, W.; Fuchs, A.; Klock, U.; Maier, J. Proton conducting alkaline earth zirconates and titanates for high drain electrochemical applications. Solid State Ion. 2001, 145, 295–306. [Google Scholar] [CrossRef]
- Oikawa, I.; Takamura, H. Correlation among Oxygen Vacancies, Protonic Defects, and the Acceptor Dopant in Sc-Doped BaZrO3 Studied by 45Sc Nuclear Magnetic Resonance. Chem. Mater. 2015, 27, 6660–6667. [Google Scholar] [CrossRef]
- Han, D.; Shinoda, K.; Uda, T. Dopant Site Occupancy and Chemical Expansion in Rare Earth-Doped Barium Zirconate. J. Am. Ceram. Soc. 2014, 97, 643–650. [Google Scholar] [CrossRef] [Green Version]
- Hong, S.J.; Virkar, A.V. Lattice Parameters and Densities of Rare-Earth Oxide Doped Ceria Electrolytes. J. Am. Ceram. Soc. 1995, 78, 433–439. [Google Scholar] [CrossRef]
- Andersson, A.K.E.; Selbach, S.M.; Knee, C.S.; Grande, T. Chemical Expansion Due to Hydration of Proton-Conducting Perovskite Oxide Ceramics. J. Am. Ceram. Soc. 2014, 97, 2654–2661. [Google Scholar] [CrossRef] [Green Version]
- Han, D.; Hatada, N.; Uda, T. Chemical Expansion of Yttrium-Doped Barium Zirconate and Correlation with Proton Concentration and Conductivity. J. Am. Ceram. Soc. 2016, 99, 3745–3753. [Google Scholar] [CrossRef]
- Yamaguchi, S.; Yamada, N. Thermal lattice expansion behavior of Yb-doped BaCeO3. Solid State Ion. 2003, 162–163, 23–29. [Google Scholar] [CrossRef]
- Kreuer, K.D. Proton-conducting oxides. Annu. Rev. Mater. Res. 2003, 33, 333–359. [Google Scholar] [CrossRef]
- Kinyanjui, F.G.; Norberg, S.T.; Ahmed, I.; Eriksson, S.G.; Hull, S. In-situ conductivity and hydration studies of proton conductors using neutron powder diffraction. Solid State Ion. 2012, 225, 312–316. [Google Scholar] [CrossRef]
- Jedvik, E.; Lindman, A.; Benediktsson, M.Þ.; Wahnström, G. Size and shape of oxygen vacancies and protons in acceptor-doped barium zirconate. Solid State Ion. 2015, 275, 2–8. [Google Scholar] [CrossRef] [Green Version]
- Bjørheim, T.S.; Kotomin, E.A.; Maier, J. Hydration entropy of BaZrO3 from first principles phonon calculations. J. Mater. Chem. A 2015, 3, 7639–7648. [Google Scholar] [CrossRef]
- Bjørheim, T.S.; Løken, A.; Haugsrud, R. On the relationship between chemical expansion and hydration thermodynamics of proton conducting perovskites. J. Mater. Chem. A 2016, 4, 5917–5924. [Google Scholar] [CrossRef] [Green Version]
- Løken, A.; Saeed, S.W.; Getz, M.N.; Liu, X.; Bjørheim, T.S. Alkali metals as efficient A-site acceptor dopants in proton conducting BaZrO3. J. Mater. Chem. A 2016, 4, 9229–9235. [Google Scholar] [CrossRef]
- Løken, A.; Haugsrud, R.; Bjørheim, T.S. Unravelling the fundamentals of thermal and chemical expansion of BaCeO3 from first principles phonon calculations. Phys. Chem. Chem. Phys. 2016, 18, 31296–31303. [Google Scholar] [CrossRef] [PubMed]
- Løken, A.; Bjørheim, T.S.; Haugsrud, R. The pivotal role of the dopant choice on the thermodynamics of hydration and associations in proton conducting BaCe0.9X0.1O3−δ (X = Sc, Ga, Y, In, Gd and Er). J. Mater. Chem. A 2015, 3, 23289–23298. [Google Scholar] [CrossRef]
- Kim, H.S.; Jang, A.; Choi, S.Y.; Jung, W.; Chung, S.Y. Vacancy-Induced Electronic Structure Variation of Acceptors and Correlation with Proton Conduction in Perovskite Oxides. Angew. Chem. Int. Ed. 2016, 55, 13499–13503. [Google Scholar] [CrossRef] [PubMed]
- Løken, A. Hydration Thermodynamics of Oxides. Effects of Defect Associations. Ph.D. Thesis, University of Oslo, Oslo, Norway, 2017. [Google Scholar]
- Bishop, S.R.; Duncan, K.L.; Wachsman, E.D. Defect equilibria and chemical expansion in non-stoichiometric undoped and gadolinium-doped cerium oxide. Electrochim. Acta 2009, 54, 1436–1443. [Google Scholar] [CrossRef]
- Marrocchelli, D.; Chatzichristodoulou, C.; Bishop, S.R. Defining chemical expansion: The choice of units for the stoichiometric expansion coefficient. Phys. Chem. Chem. Phys. 2014, 16, 9229–9232. [Google Scholar] [CrossRef] [PubMed]
- Atkinson, A.; Ramos, T.M.G.M. Chemically-induced stresses in ceramic oxygen ion-conducting membranes. Solid State Ion. 2000, 129, 259–269. [Google Scholar] [CrossRef]
- Jiang, S.P. A comparison of O2 reduction reactions on porous (La,Sr)MnO3 and (La,Sr)(Co,Fe)O3 electrodes. Solid State Ion. 2002, 146, 1–22. [Google Scholar] [CrossRef]
- Esquirol, A.; Brandon, N.P.; Kilner, J.A.; Mogensen, M. Electrochemical Characterization of La0.6Sr0.4Co0.2Fe0.8O3 Cathodes for Intermediate-Temperature SOFCs. J. Electrochem. Soc. 2004, 151, A1847–A1855. [Google Scholar] [CrossRef]
- Tietz, F.; Haanappel, V.A.C.; Mai, A.; Mertens, J.; Stöver, D. Performance of LSCF cathodes in cell tests. J. Power Sources 2006, 156, 20–22. [Google Scholar] [CrossRef]
- Ricote, S.; Bonanos, N.; Rørvik, P.M.; Haavik, C. Microstructure and performance of La0.58Sr0.4Co0.2Fe0.8O3−δ cathodes deposited on BaCe0.2Zr0.7Y0.1O3−δ by infiltration and spray pyrolysis. J. Power Sources 2012, 209, 172–179. [Google Scholar] [CrossRef]
- Sun, S.; Cheng, Z. Electrochemical Behaviors for Ag, LSCF and BSCF as Oxygen Electrodes for Proton Conducting IT-SOFC. J. Electrochem. Soc. 2017, 164, F3104–F3113. [Google Scholar] [CrossRef] [Green Version]
- Bishop, S.R.; Duncan, K.L.; Wachsman, E.D. Surface and Bulk Defect Equilibria in Strontium-Doped Lanthanum Cobalt Iron Oxide. J. Electrochem. Soc. 2009, 156, B1242–B1248. [Google Scholar] [CrossRef]
- Bishop, S.R.; Duncan, K.L.; Wachsman, E.D. Thermo-Chemical Expansion in Strontium-Doped Lanthanum Cobalt Iron Oxide. J. Am. Ceram. Soc. 2010, 93, 4115–4121. [Google Scholar] [CrossRef]
- Kuhn, M.; Hashimoto, S.; Sato, K.; Yashiro, K.; Mizusaki, J. Thermo-chemical lattice expansion in La0.6Sr0.4Co1−yFeyO3−δ. Solid State Ion. 2013, 241, 12–16. [Google Scholar] [CrossRef]
- James, J.D.; Spittle, J.A.; Brown, S.G.R.; Evans, R.W. A review of measurement techniques for the thermal expansion coefficient of metals and alloys at elevated temperatures. Meas. Sci. Technol. 2001, 12, R1–R15. [Google Scholar] [CrossRef]
- Mielewczyk-Gryn, A.; Gdula-Kasica, K.; Kusz, B.; Gazda, M. High temperature monoclinic-to-tetragonal phase transition in magnesium doped lanthanum ortho-niobate. Ceram. Int. 2013, 39, 4239–4244. [Google Scholar] [CrossRef]
- Huse, M.; Skilbred, A.W.B.; Karlsson, M.; Eriksson, S.G.; Norby, T.; Haugsrud, R.; Knee, C.S. Neutron diffraction study of the monoclinic to tetragonal structural transition in LaNbO4 and its relation to proton mobility. J. Solid State Chem. 2012, 187, 27–34. [Google Scholar] [CrossRef]
- Rietveld, H.M. A profile refinement method for nuclear and magnetic structures. J. Appl. Crystallogr. 1969, 2, 65–71. [Google Scholar] [CrossRef] [Green Version]
- Le Bail, A.; Duroy, H.; Fourquet, J.L. Ab-initio structure determination of LiSbWO6 by X-ray powder diffraction. Mater. Res. Bull. 1988, 23, 447–452. [Google Scholar] [CrossRef]
- Tsvetkov, D.S.; Sereda, V.V.; Zuev, A.Y. Oxygen nonstoichiometry and defect structure of the double perovskite GdBaCo2O6−δ. Solid State Ion. 2010, 180, 1620–1625. [Google Scholar] [CrossRef]
- Zuev, A.Y.; Tsvetkov, D.S. Conventional Methods for Measurements of Chemo-Mechanical Coupling. In Electro-Chemo-Mechanics of Solids; Bishop, S.R., Perry, N.H., Marrocchelli, D., Sheldon, B., Eds.; Springer: New York, NY, USA, 2017; pp. 5–33. ISBN 9783319514055. [Google Scholar]
- Nedeltcheva, T.; Simeonova, P.; Lovchinov, V. Improved iodometric method for simultaneous determination of non-stoichiometric oxygen and total copper content in YBCO superconductors. Anal. Chim. Acta 1995, 312, 227–229. [Google Scholar] [CrossRef]
- Rørmark, L.; Wiik, K.; Stølen, S.; Grande, T. Oxygen stoichiometry and structural properties of La1−xAxMnO3±δ (A = Ca or Sr and 0 ≤ x ≤ 1). J. Mater. Chem. 2002, 12, 1058–1067. [Google Scholar] [CrossRef]
- Baroni, S.; de Gironcoli, S.; Dal Corso, A.; Giannozzi, P. Phonons and related crystal properties from density-functional perturbation theory. Rev. Mod. Phys. 2001, 73, 515–562. [Google Scholar] [CrossRef] [Green Version]
- Togo, A.; Tanaka, I. First principles phonon calculations in materials science. Scr. Mater. 2015, 108, 1–5. [Google Scholar] [CrossRef] [Green Version]
- Vinet, P.; Smith, J.R.; Ferrante, J.; Rose, J.H. Temperature effects on the universal equation of state of solids. Phys. Rev. B 1987, 35, 1945–1953. [Google Scholar] [CrossRef] [Green Version]
- Birch, F. Finite Elastic Strain of Cubic Crystals. Phys. Rev. 1947, 71, 809–824. [Google Scholar] [CrossRef]
- Nosé, S. A unified formulation of the constant temperature molecular dynamics methods. J. Chem. Phys. 1984, 81, 511–519. [Google Scholar] [CrossRef]
- Nosé, S. A molecular dynamics method for simulations in the canonical ensemble. Mol. Phys. 1984, 52, 255–268. [Google Scholar] [CrossRef]
- Hoover, W.G. Canonical dynamics: Equilibrium phase-space distributions. Phys. Rev. A 1985, 31, 1695–1697. [Google Scholar] [CrossRef]
- Berendsen, H.J.C.; Postma, J.P.M.; van Gunsteren, W.F.; DiNola, A.; Haak, J.R. Molecular dynamics with coupling to an external bath. J. Chem. Phys. 1984, 81, 3684–3690. [Google Scholar] [CrossRef]
- Zhao, Y.; Weidner, D.J. Thermal expansion of SrZrO3 and BaZrO3 perovskites. Phys. Chem. Miner. 1991, 18, 294–301. [Google Scholar] [CrossRef]
- Hudish, G.; Manerbino, A.; Coors, W.G.; Ricote, S. Chemical expansion in BaZr0.9−xCexY0.1O3−δ (x = 0 and 0.2) upon hydration determined by high-temperature X-ray diffraction. J. Am. Ceram. Soc. 2018, 101, 1298–1309. [Google Scholar] [CrossRef]
- Hiraiwa, C.; Han, D.; Kuramitsu, A.; Kuwabara, A.; Takeuchi, H.; Majima, M.; Uda, T. Chemical Expansion and Change in Lattice Constant of Y-Doped BaZrO3 by Hydration/Dehydration Reaction and Final Heat-Treating Temperature. J. Am. Ceram. Soc. 2013, 96, 879–884. [Google Scholar] [CrossRef]
- Lein, H.L.; Wiik, K.; Grande, T. Thermal and chemical expansion of mixed conducting La0.5Sr0.5Fe1−xCoxO3−δ materials. Solid State Ion. 2006, 177, 1795–1798. [Google Scholar] [CrossRef]
- Chen, X.; Yu, J.; Adler, S.B. Thermal and Chemical Expansion of Sr-Doped Lanthanum Cobalt Oxide (La1−xSrxCoO3−δ). Chem. Mater. 2005, 17, 4537–4546. [Google Scholar] [CrossRef]
- Fossdal, A.; Menon, M.; Waernhus, I.; Wiik, K.; Einarsrud, M.A.; Grande, T. Crystal Structure and Thermal Expansion of La1−xSrxFeO3−δ Materials. J. Am. Ceram. Soc. 2005, 87, 1952–1958. [Google Scholar] [CrossRef]
- Hashimoto, S.; Fukuda, Y.; Kuhn, M.; Sato, K.; Yashiro, K.; Mizusaki, J. Thermal and chemical lattice expansibility of La0.6Sr0.4Co1−yFeyO3−δ (y = 0.2, 0.4, 0.6 and 0.8). Solid State Ion. 2011, 186, 37–43. [Google Scholar] [CrossRef]
- Kuhn, M.; Hashimoto, S.; Sato, K.; Yashiro, K.; Mizusaki, J. Oxygen nonstoichiometry, thermo-chemical stability and lattice expansion of La0.6Sr0.4FeO3−δ. Solid State Ion. 2011, 195, 7–15. [Google Scholar] [CrossRef]
- Mather, G.C.; Heras-Juaristi, G.; Ritter, C.; Fuentes, R.O.; Chinelatto, A.L.; Pérez-Coll, D.; Amador, U. Phase Transitions, Chemical Expansion, and Deuteron Sites in the BaZr0.7Ce0.2Y0.1O3−δ Proton Conductor. Chem. Mater. 2016, 28, 4292–4299. [Google Scholar] [CrossRef]
- Kerner, E.H. The Elastic and Thermo-elastic Properties of Composite Media. Proc. Phys. Soc. Sect. B 1956, 69, 808–813. [Google Scholar] [CrossRef]
- Pratihar, S.K.; Dassharma, A.; Maiti, H.S. Properties of Ni/YSZ porous cermets prepared by electroless coating technique for SOFC anode application. J. Mater. Sci. 2007, 42, 7220–7226. [Google Scholar] [CrossRef] [Green Version]
- Coble, R.L.; Kingery, W.D. Effect of Porosity on Physical Properties of Sintered Alumina. J. Am. Ceram. Soc. 1956, 39, 377–385. [Google Scholar] [CrossRef]
- Shyam, A.; Bruno, G.; Watkins, T.R.; Pandey, A.; Lara-curzio, E.; Parish, C.M.; Stafford, R.J. Journal of the European Ceramic Society The effect of porosity and microcracking on the thermomechanical properties of cordierite. J. Eur. Ceram. Soc. 2015, 35, 4557–4566. [Google Scholar] [CrossRef]
- Mori, M.; Yamamoto, T.; Itoh, H.; Inaba, H.; Tagawa, H. Thermal Expansion of Nickel-Zirconia Anodes in Solid Oxide Fuel Cells during Fabrication and Operation. J. Electrochem. Soc. 1998, 145, 1374–1381. [Google Scholar] [CrossRef]
- Elomari, S.; Skibo, M.D.; Sundarrajan, A.; Richards, H. Thermal expansion behavior of particulate metal-matrix composites. Compos. Sci. Technol. 1998, 58, 369–376. [Google Scholar] [CrossRef]
- Sevostianov, I. On the thermal expansion of composite materials and cross-property connection between thermal expansion and thermal conductivity. Mech. Mater. 2012, 45, 20–33. [Google Scholar] [CrossRef]
- Hayashi, H.; Saitou, T.; Maruyama, N.; Inaba, H.; Kawamura, K.; Mori, M. Thermal expansion coefficient of yttria stabilized zirconia for various yttria contents. Solid State Ion. 2005, 176, 613–619. [Google Scholar] [CrossRef]
- Fabbri, E.; Pergolesi, D.; Traversa, E. Materials challenges toward proton-conducting oxide fuel cells: A critical review. Chem. Soc. Rev. 2010, 39, 4355–4369. [Google Scholar] [CrossRef] [PubMed]
- Malavasi, L.; Fisher, C.A.J.; Islam, M.S. Oxide-ion and proton conducting electrolyte materials for clean energy applications: Structural and mechanistic features. Chem. Soc. Rev. 2010, 39, 4370–4387. [Google Scholar] [CrossRef] [PubMed]
- Norby, T. Proton Conductivity in Perovskite Oxides. In Perovskite Oxide for Solid Oxide Fuel Cells; Ishihara, T., Ed.; Springer: Boston, MA, USA, 2009; pp. 217–241. ISBN 978-0-387-77708-5. [Google Scholar]
- Hossain, S.; Abdalla, A.M.; Jamain, S.N.B.; Zaini, J.H.; Azad, A.K. A review on proton conducting electrolytes for clean energy and intermediate temperature-solid oxide fuel cells. Renew. Sustain. Energy Rev. 2017, 79, 750–764. [Google Scholar] [CrossRef]
- Wang, S.; Zhao, F.; Zhang, L.; Chen, F. Synthesis of BaCe0.7Zr0.1Y0.1Yb0.1O3−δ proton conducting ceramic by a modified Pechini method. Solid State Ion. 2012, 213, 29–35. [Google Scholar] [CrossRef]
- Lagaeva, J.; Medvedev, D.; Demin, A.; Tsiakaras, P. Insights on thermal and transport features of BaCe0.8−xZrxY0.2O3−δ proton-conducting materials. J. Power Sources 2015, 278, 436–444. [Google Scholar] [CrossRef]
- Yamazaki, Y.; Hernandez-Sanchez, R.; Haile, S.M. High Total Proton Conductivity in Large-Grained Yttrium-Doped Barium Zirconate. Chem. Mater. 2009, 21, 2755–2762. [Google Scholar] [CrossRef]
- Yamazaki, Y.; Blanc, F.; Okuyama, Y.; Buannic, L.; Lucio-Vega, J.C.; Grey, C.P.; Haile, S.M. Proton trapping in yttrium-doped barium zirconate. Nat. Mater. 2013, 12, 647–651. [Google Scholar] [CrossRef] [PubMed] [Green Version]
- Ryu, K.H.; Haile, S.M. Chemical stability and proton conductivity of doped BaCeO3–BaZrO3 solid solutions. Solid State Ion. 1999, 125, 355–367. [Google Scholar] [CrossRef]
- Haugsrud, R. High Temperature Proton Conductors—Fundamentals and Functionalities. Diffus. Found. 2016, 8, 31–79. [Google Scholar] [CrossRef]
- Akbarzadeh, A.R.; Kornev, I.; Malibert, C.; Bellaiche, L.; Kiat, J.M. Combined theoretical and experimental study of the low-temperature properties of BaZrO3. Phys. Rev. B 2005, 72, 205104. [Google Scholar] [CrossRef]
- Yamanaka, S.; Fujikane, M.; Hamaguchi, T.; Muta, H.; Oyama, T.; Matsuda, T.; Kobayashi, S.; Kurosaki, K. Thermophysical properties of BaZrO3 and BaCeO3. J. Alloys Compd. 2003, 359, 109–113. [Google Scholar] [CrossRef]
- Mathews, M.D.; Mirza, E.B.; Momin, A.C. High-temperature X-ray diffractometric studies of CaZrO3, SrZrO3 and BaZrO3. J. Mater. Sci. Lett. 1991, 10, 305–306. [Google Scholar] [CrossRef]
- Taglieri, G.; Tersigni, M.; Villa, P.L.; Mondelli, C. Synthesis by the citrate route and characterisation of BaZrO3, a high tech ceramic oxide: Preliminary results. Int. J. Ind. Chem. 1999, 1, 103–110. [Google Scholar] [CrossRef]
- Braun, A.; Ovalle, A.; Pomjakushin, V.; Cervellino, A.; Erat, S.; Stolte, W.C.; Graule, T. Yttrium and hydrogen superstructure and correlation of lattice expansion and proton conductivity in the BaZr0.9Y0.1O2.95 proton conductor. Appl. Phys. Lett. 2009, 95, 224103. [Google Scholar] [CrossRef]
- Goupil, G.; Delahaye, T.; Gauthier, G.; Sala, B.; Joud, F.L. Stability study of possible air electrode materials for proton conducting electrochemical cells. Solid State Ion. 2012, 209–210, 36–42. [Google Scholar] [CrossRef]
- Lyagaeva, Y.G.; Medvedev, D.A.; Demin, A.K.; Tsiakaras, P.; Reznitskikh, O.G. Thermal expansion of materials in the barium cerate-zirconate system. Phys. Solid State 2015, 57, 285–289. [Google Scholar] [CrossRef]
- Han, D.; Majima, M.; Uda, T. Structure analysis of BaCe0.8Y0.2O3−δ in dry and wet atmospheres by high-temperature X-ray diffraction measurement. J. Solid State Chem. 2013, 205, 122–128. [Google Scholar] [CrossRef]
- Malavasi, L.; Ritter, C.; Chiodelli, G. Correlation between Thermal Properties, Electrical Conductivity, and Crystal Structure in the BaCe0.80Y0.20O2.9 Proton Conductor. Chem. Mater. 2008, 20, 2343–2351. [Google Scholar] [CrossRef]
- Zhu, Z.; Tao, Z.; Bi, L.; Liu, W. Investigation of SmBaCuCoO5+δ double-perovskite as cathode for proton-conducting solid oxide fuel cells. Mater. Res. Bull. 2010, 45, 1771–1774. [Google Scholar] [CrossRef]
- Zhou, X.; Liu, L.; Zhen, J.; Zhu, S.; Li, B.; Sun, K.; Wang, P. Ionic conductivity, sintering and thermal expansion behaviors of mixed ion conductor BaZr0.1Ce0.7Y0.1Yb0.1O3−δ prepared by ethylene diamine tetraacetic acid assisted glycine nitrate process. J. Power Sources 2011, 196, 5000–5006. [Google Scholar] [CrossRef]
- Gorelov, V.P.; Balakireva, V.B.; Kuz’min, A.V.; Plaksin, S.V. Electrical conductivity of CaZr1−xScxO3-delta (x = 0.01–0.20) in dry and humid air. Inorg. Mater. 2014, 50, 495–502. [Google Scholar] [CrossRef]
- Yajima, T.; Suzuki, H.; Yogo, T.; Iwahara, H. Protonic conduction in SrZrO3- based oxides. Solid State Ion. 1992, 51, 101–107. [Google Scholar] [CrossRef]
- Hibino, T.; Mizutani, K.; Yajima, T.; Iwahara, H. Evaluation of proton conductivity in SrCeO3, BaCeO3, CaZrO3 and SrZrO3 by temperature programmed desorption method. Solid State Ion. 1992, 57, 303–306. [Google Scholar] [CrossRef]
- Matsuda, T.; Yamanaka, S.; Kurosaki, K.; Kobayashi, S. High temperature phase transitions of SrZrO3. J. Alloys Compd. 2003, 351, 43–46. [Google Scholar] [CrossRef]
- Iwahara, H.; Esaka, T.; Uchida, H.; Yamauchi, T.; Ogaki, K. High temperature type protonic conductor based on SrCeO3 and its application to the extraction of hydrogen gas. Solid State Ion. 1986, 18–19, 1003–1007. [Google Scholar] [CrossRef]
- Yamanaka, S.; Kurosaki, K.; Maekawa, T.; Matsuda, T.; Kobayashi, S.; Uno, M. Thermochemical and thermophysical properties of alkaline-earth perovskites. J. Nucl. Mater. 2005, 344, 61–66. [Google Scholar] [CrossRef]
- Li, L.; Nino, J.C. Proton-conducting barium stannates: Doping strategies and transport properties. Int. J. Hydrog. Energy 2013, 38, 1598–1606. [Google Scholar] [CrossRef]
- Maekawa, T.; Kurosaki, K.; Yamanaka, S. Thermal and mechanical properties of polycrystalline BaSnO3. J. Alloys Compd. 2006, 416, 214–217. [Google Scholar] [CrossRef]
- Snijkers, F.M.M.; Buekenhoudt, A.; Luyten, J.J.; Cooymans, J.; Mertens, M. Proton conductivity in perovskite type yttrium doped barium hafnate. Scr. Mater. 2004, 51, 1129–1134. [Google Scholar] [CrossRef]
- Maekawa, T.; Kurosaki, K.; Yamanaka, S. Thermal and mechanical properties of perovskite-type barium hafnate. J. Alloys Compd. 2006, 407, 44–48. [Google Scholar] [CrossRef]
- Furøy, K.A.; Haugsrud, R.; Hänsel, M.; Magrasó, A.; Norby, T. Role of protons in the electrical conductivity of acceptor-doped BaPrO3, BaTbO3, and BaThO3. Solid State Ion. 2007, 178, 461–467. [Google Scholar] [CrossRef]
- Purohit, R.D.; Tyagi, A.K.; Mathews, M.D.; Saha, S. Combustion synthesis and bulk thermal expansion studies of Ba and Sr thorates. J. Nucl. Mater. 2000, 280, 51–55. [Google Scholar] [CrossRef]
- Fu, W.T.; Visser, D.; Knight, K.S.; IJdo, D.J.W. Temperature-induced phase transitions in BaTbO3. J. Solid State Chem. 2004, 177, 1667–1671. [Google Scholar] [CrossRef]
- Nomura, K.; Takeuchi, T.; Tanase, S.; Kageyama, H.; Tanimoto, K.; Miyazaki, Y. Proton conduction in (La0.9Sr0.1)MIIIO3−d (MIII = Sc, In, and Lu) perovskites. Solid State Ion. 2002, 155, 647–652. [Google Scholar] [CrossRef]
- Gorelov, V.P.; Stroeva, A.Y. Solid proton conducting electrolytes based on LaScO3. Russ. J. Electrochem. 2012, 48, 949–960. [Google Scholar] [CrossRef]
- Okuyama, Y.; Kozai, T.; Ikeda, S.; Matsuka, M.; Sakai, T.; Matsumoto, H. Incorporation and conduction of proton in Sr-doped LaMO3 (M = Al, Sc, In, Yb, Y). Electrochim. Acta 2014, 125, 443–449. [Google Scholar] [CrossRef]
- Danilov, N.; Vdovin, G.; Reznitskikh, O.; Medvedev, D.; Demin, A.; Tsiakaras, P. Physicо-chemical characterization and transport features of proton-conducting Sr-doped LaYO3 electrolyte ceramics. J. Eur. Ceram. Soc. 2016, 36, 2795–2800. [Google Scholar] [CrossRef]
- Dietrich, M.; Vassen, R.; Stover, D. LaYbO3, A Candidate for Thermal Barrier Coating Materials. In 27th Annual Cocoa Beach Conference on Advanced Ceramics and Composites: A: Ceramic Engineering and Science Proceedings, Volume 24, Issue 3; John Wiley & Sons, Inc.: Hoboken, NJ, USA, 2003; pp. 637–643. [Google Scholar]
- Ovanesyan, K.; Petrosyan, A.; Shirinyan, G.; Pedrini, C.; Zhang, L. Czochralski single crystal growth of Ce- and Pr-doped LaLuO3 double oxide. J. Cryst. Growth 1999, 198–199, 497–500. [Google Scholar] [CrossRef]
- Inaba, H.; Hayashi, H.; Suzuki, M. Structural phase transition of perovskite oxides LaMO3 and La0.9Sr0.1MO3 with different size of B-site ions. Solid State Ion. 2001, 144, 99–108. [Google Scholar] [CrossRef]
- Goldschmidt, V.M. Die Gesetze der Krystallochemie. Naturwissenschaften 1926, 14, 477–485. [Google Scholar] [CrossRef]
- Zhao, Y.; Weidner, D.J.; Parise, J.B.; Cox, D.E. Thermal expansion and structural distortion of perovskite—Data for NaMgF3 perovskite. Part I. Phys. Earth Planet. Inter. 1993, 76, 1–16. [Google Scholar] [CrossRef]
- Bohn, H.; Schober, T.; Mono, T.; Schilling, W. The high temperature proton conductor Ba3Ca1.18Nb1.82O9−δ. I. Electrical conductivity. Solid State Ion. 1999, 117, 219–228. [Google Scholar] [CrossRef]
- Krug, F.; Schober, T. The high-temperature proton conductor Ba3(Ca1.18Nb1.82)O9−gd: Thermogravimetry of the water uptake. Solid State Ion. 1996, 92, 297–302. [Google Scholar] [CrossRef]
- Schober, T.; Friedrich, J. The mixed perovskites BaCa(1+x)/3Nb(2−x)/3O3−x/2 (x = 0…0.18): Proton uptake. Solid State Ion. 2000, 136–137, 161–165. [Google Scholar] [CrossRef]
- Bhella, S.S.; Thangadurai, V. Investigations on the thermo-chemical stability and electrical conductivity of K-doped Ba3−xKxCaNb2O9−δ (x = 0.5, 0.75, 1, 1.25). Solid State Ion. 2011, 192, 229–234. [Google Scholar] [CrossRef]
- Wang, S.; Zhao, F.; Zhang, L.; Brinkman, K.; Chen, F. Doping effects on complex perovskite Ba3Ca1.18Nb1.82O9−δ intermediate temperature proton conductor. J. Power Sources 2011, 196, 7917–7923. [Google Scholar] [CrossRef]
- Hassan, D.; Janes, S.; Clasen, R. Proton-conducting ceramics as electrode/electrolyte materials for SOFC’s-part I: Preparation, mechanical and thermal properties of sintered bodies. J. Eur. Ceram. Soc. 2003, 23, 221–228. [Google Scholar] [CrossRef]
- Mono, T.; Schober, T. Lattice parameter change in water vapor exposed Ba3Ca1.18Nb1.82O9−δ. Solid State Ion. 1996, 91, 155–159. [Google Scholar] [CrossRef]
- Schober, T.; Friedrich, J.; Triefenbach, D.; Tietz, F. Dilatometry of the high-temperature proton conductor Ba3Ca1.18Nb1.82O9−δ. Solid State Ion. 1997, 100, 173–181. [Google Scholar] [CrossRef]
- Jayaraman, V.; Magrez, A.; Caldes, M.; Joubert, O.; Ganne, M.; Piffard, Y.; Brohan, L. Characterization of perovskite systems derived from Ba2In2O5□: Part I: The oxygen-deficient Ba2In2(1−x)Ti2xO5+x□1−x (0 ≤ x ≤ 1) compounds. Solid State Ion. 2004, 170, 17–24. [Google Scholar] [CrossRef]
- Bjørheim, T.S.; Rahman, S.M.H.; Eriksson, S.G.; Knee, C.S.; Haugsrud, R. Hydration Thermodynamics of the Proton Conducting Oxygen-Deficient Perovskite Series BaTi1−xMxO3−x/2 with M = In or Sc. Inorg. Chem. 2015, 54, 2858–2865. [Google Scholar] [CrossRef] [PubMed]
- Rahman, S.M.H.; Knee, C.S.; Ahmed, I.; Eriksson, S.G.; Haugsrud, R. 50 mol% indium substituted BaTiO3: Characterization of structure and conductivity. Int. J. Hydrog. Energy 2012, 37, 7975–7982. [Google Scholar] [CrossRef]
- Quarez, E.; Noirault, S.; Caldes, M.T.; Joubert, O. Water incorporation and proton conductivity in titanium substituted barium indate. J. Power Sources 2010, 195, 1136–1141. [Google Scholar] [CrossRef]
- Rahman, S.M.H.; Ahmed, I.; Haugsrud, R.; Eriksson, S.G.; Knee, C.S. Characterisation of structure and conductivity of BaTi0.5Sc0.5O3−δ. Solid State Ion. 2014, 255, 140–146. [Google Scholar] [CrossRef]
- Rahman, S.M.H.; Norberg, S.T.; Knee, C.S.; Biendicho, J.J.; Hull, S.; Eriksson, S.G. Proton conductivity of hexagonal and cubic BaTi1−xScxO3−δ (0.1 ≤ x ≤ 0.8). Dalton Trans. 2014, 43, 15055–15064. [Google Scholar] [CrossRef] [PubMed]
- Noirault, S.; Quarez, E.; Piffard, Y.; Joubert, O. Water incorporation into the Ba2(In1−xMx)2O5 (M = Sc3+ 0 ≤ x < 0.5 and M = Y3+ 0 ≤ x < 0.35) system and protonic conduction. Solid State Ion. 2009, 180, 1157–1163. [Google Scholar] [CrossRef]
- Haugsrud, R.; Norby, T. High-Temperature Proton Conductivity in Acceptor-Substituted Rare-Earth Ortho-Tantalates, LnTaO4. J. Am. Ceram. Soc. 2007, 90, 1116–1121. [Google Scholar] [CrossRef]
- Haugsrud, R.; Norby, T. Proton conduction in rare-earth ortho-niobates and ortho-tantalates. Nat. Mater. 2006, 5, 193–196. [Google Scholar] [CrossRef]
- Bi, Z.; Bridges, C.A.; Kim, J.H.; Huq, A.; Paranthaman, M.P. Phase stability and electrical conductivity of Ca-doped LaNb1−xTaxO4−δ high temperature proton conductors. J. Power Sources 2011, 196, 7395–7403. [Google Scholar] [CrossRef]
- Norby, T.; Christiansen, N. Proton conduction in Ca- and Sr-substituted LaPO4. Solid State Ion. 1995, 77, 240–243. [Google Scholar] [CrossRef]
- Bjørheim, T.S.; Norby, T.; Haugsrud, R. Hydration and proton conductivity in LaAsO4. J. Mater. Chem. 2012, 22, 1652–1661. [Google Scholar] [CrossRef]
- Toyoura, K.; Matsunaga, K. Hydrogen Bond Dynamics in Proton-Conducting Lanthanum Arsenate. J. Phys. Chem. C 2013, 117, 18006–18012. [Google Scholar] [CrossRef]
- Amezawa, K.; Tomii, Y.; Yamamoto, N. High temperature protonic conduction in Ca-doped YPO4. Solid State Ion. 2003, 162–163, 175–180. [Google Scholar] [CrossRef]
- Mokkelbost, T.; Lein, H.L.; Vullum, P.E.; Holmestad, R.; Grande, T.; Einarsrud, M.A. Thermal and mechanical properties of LaNbO4-based ceramics. Ceram. Int. 2009, 35, 2877–2883. [Google Scholar] [CrossRef]
- Fjeld, H.; Kepaptsoglou, D.M.; Haugsrud, R.; Norby, T. Charge carriers in grain boundaries of 0.5% Sr-doped LaNbO4. Solid State Ion. 2010, 181, 104–109. [Google Scholar] [CrossRef]
- Mielewczyk-Gryn, A.; Wachowski, S.; Zagórski, K.; Jasiński, P.; Gazda, M. Characterization of magnesium doped lanthanum orthoniobate synthesized by molten salt route. Ceram. Int. 2015, 41, 7847–7852. [Google Scholar] [CrossRef]
- Brandão, A.D.; Gracio, J.; Mather, G.C.; Kharton, V.V.; Fagg, D.P. B-site substitutions in LaNb1−xMxO4−δ materials in the search for potential proton conductors (M = Ga, Ge, Si, B, Ti, Zr, P, Al). J. Solid State Chem. 2011, 184, 863–870. [Google Scholar] [CrossRef]
- Syvertsen, G.E.; Magrasó, A.; Haugsrud, R.; Einarsrud, M.A.; Grande, T. The effect of cation non-stoichiometry in LaNbO4 materials. Int. J. Hydrog. Energy 2012, 37, 8017–8026. [Google Scholar] [CrossRef]
- Huse, M.; Norby, T.; Haugsrud, R. Effects of A and B site acceptor doping on hydration and proton mobility of LaNbO4. Int. J. Hydrog. Energy 2012, 37, 8004–8016. [Google Scholar] [CrossRef]
- Depero, L.E.; Sangaletti, L. Cation Sublattice and Coordination Polyhedra in ABO4 type of Structures. J. Solid State Chem. 1997, 129, 82–91. [Google Scholar] [CrossRef]
- Errandonea, D.; Manjon, F. Pressure effects on the structural and electronic properties of ABX4 scintillating crystals. Prog. Mater. Sci. 2008, 53, 711–773. [Google Scholar] [CrossRef]
- Li, H.; Zhou, S.; Zhang, S. The relationship between the thermal expansions and structures of ABO4 oxides. J. Solid State Chem. 2007, 180, 589–595. [Google Scholar] [CrossRef]
- Ishibashi, Y.; Hara, K.; Sawada, A. The ferroelastic transition in some scheelite-type crystals. Phys. B+C 1988, 150, 258–264. [Google Scholar] [CrossRef]
- David, W.I.F. High Resolution Neutron Powder Diffraction Studies of the Ferroelastic Phase Transition in LaNbO4. MRS Proc. 1989, 166, 203. [Google Scholar] [CrossRef]
- Mokkelbost, T.; Kaus, I.; Haugsrud, R.; Norby, T.; Grande, T.; Einarsrud, M.A. High-Temperature Proton-Conducting Lanthanum Ortho-Niobate-Based Materials. Part II: Sintering Properties and Solubility of Alkaline Earth Oxides. J. Am. Ceram. Soc. 2008, 91, 879–886. [Google Scholar] [CrossRef]
- Ivanova, M.; Ricote, S.; Meulenberg, W.A.; Haugsrud, R.; Ziegner, M. Effects of A- and B-site (co-)acceptor doping on the structure and proton conductivity of LaNbO4. Solid State Ion. 2012, 213, 45–52. [Google Scholar] [CrossRef]
- Mielewczyk-Gryn, A.; Wachowski, S.; Strychalska, J.; Zagórski, K.; Klimczuk, T.; Navrotsky, A.; Gazda, M. Heat capacities and thermodynamic properties of antimony substituted lanthanum orthoniobates. Ceram. Int. 2016, 42, 7054–7059. [Google Scholar] [CrossRef]
- Wachowski, S.; Mielewczyk-Gryń, A.; Zagórski, K.; Li, C.; Jasiński, P.; Skinner, S.J.; Haugsrud, R.; Gazda, M. Influence of Sb-substitution on ionic transport in lanthanum orthoniobates. J. Mater. Chem. A 2016, 4, 11696–11707. [Google Scholar] [CrossRef] [Green Version]
- Syvertsen, G.E.; Estournès, C.; Fjeld, H.; Haugsrud, R.; Einarsrud, M.; Grande, T.; Menon, M. Spark Plasma Sintering and Hot Pressing of Hetero-Doped LaNbO4. J. Am. Ceram. Soc. 2012, 95, 1563–1571. [Google Scholar] [CrossRef]
- Mokkelbost, T.; Andersen, Ø.; Strøm, R.A.; Wiik, K.; Grande, T.; Einarsrud, M. High-Temperature Proton-Conducting LaNbO4-Based Materials: Powder Synthesis by Spray Pyrolysis. J. Am. Ceram. Soc. 2007, 90, 3395–3400. [Google Scholar] [CrossRef]
- Magrasó, A.; Xuriguera, H.; Varela, M.; Sunding, M.F.; Strandbakke, R.; Haugsrud, R.; Norby, T. Novel Fabrication of Ca-Doped LaNbO4 Thin-Film Proton-Conducting Fuel Cells by Pulsed Laser Deposition. J. Am. Ceram. Soc. 2010, 93, 1874–1878. [Google Scholar] [CrossRef]
- Amsif, M.; Marrero-López, D.; Ruiz-Morales, J.C.; Savvin, S.; Núñez, P. Low temperature sintering of LaNbO4 proton conductors from freeze-dried precursors. J. Eur. Ceram. Soc. 2012, 32, 1235–1244. [Google Scholar] [CrossRef]
- Mielewczyk-Gryń, A.; Gdula, K.; Molin, S.; Jasinski, P.; Kusz, B.; Gazda, M. Structure and electrical properties of ceramic proton conductors obtained with molten-salt and solid-state synthesis methods. J. Non. Cryst. Solids 2010, 356, 1976–1979. [Google Scholar] [CrossRef]
- Brandão, A.D.; Antunes, I.; Frade, J.R.; Torre, J.; Kharton, V.V.; Fagg, D.P. Enhanced Low-Temperature Proton Conduction in Sr0.02La0.98NbO4−δ by Scheelite Phase Retention. Chem. Mater. 2010, 22, 6673–6683. [Google Scholar] [CrossRef]
- Santibáñez-Mendieta, A.B.; Fabbri, E.; Licoccia, S.; Traversa, E. Tailoring phase stability and electrical conductivity of Sr0.02La0.98Nb1−xTaxO4 for intermediate temperature fuel cell proton conducting electrolytes. Solid State Ion. 2012, 216, 6–10. [Google Scholar] [CrossRef] [Green Version]
- Wachowski, S.L.; Kamecki, B.; Winiarz, P.; Dzierzgowski, K.; Mielewczyk-Gryń, A.; Gazda, M.; Wachowski, S.L.; Jasiński, P.; Witkowska, A.; Gazda, M.; et al. Tailoring structural properties of lanthanum orthoniobates through an isovalent substitution on the Nb-site. Inorg. Chem. Front. 2018, 24, 1–16. [Google Scholar] [CrossRef]
- Jian, L.; Wayman, C.M. Compressive behavior and domain-related shape memory effect in LaNbO4 ceramics. Mater. Lett. 1996, 26, 1–7. [Google Scholar] [CrossRef]
- Parlinski, K.; Hashi, Y.; Tsunekawa, S.; Kawazoe, Y. Computer simulation of ferroelastic phase transition in LaNbO4. J. Mater. Res. 1997, 12, 2428–2437. [Google Scholar] [CrossRef]
- Sarin, P.; Hughes, R.W.; Lowry, D.R.; Apostolov, Z.D.; Kriven, W.M. High-Temperature Properties and Ferroelastic Phase Transitions in Rare-Earth Niobates (LnNbO4). J. Am. Ceram. Soc. 2014, 97, 3307–3319. [Google Scholar] [CrossRef]
- Hikichi, Y.; Ota, T.; Daimon, K.; Hattori, T. Thermal, Mechanical, and Chemical Properties of Sintered Xenotime-Type RPO4 (R = Y, Er, Yb, or Lu). J. Am. Ceram. Soc. 1998, 81, 2216–2218. [Google Scholar] [CrossRef]
- Bayer, G. Thermal expansion of ABO4-compounds with zircon-and scheelite structures. J. Less Common Met. 1972, 26, 255–262. [Google Scholar] [CrossRef]
- Hikichi, Y.; Ota, T.; Hattori, T. Thermal, mechanical and chemical properties of sintered monazite-(La, Ce, Nd or Sm). Mineral. J. 1997, 19, 123–130. [Google Scholar] [CrossRef]
- Omori, M.; Kobayashi, Y.; Hirai, T. Dilatometric behavior of martensitic transformation of NdNbO4 polycrystals. J. Mater. Sci. 2000, 35, 719–721. [Google Scholar] [CrossRef]
- Filatov, S.K. General concept of increasing crystal symmetry with an increase in temperature. Crystallogr. Rep. 2011, 56, 953–961. [Google Scholar] [CrossRef]
- Akiyama, K.; Nagano, I.; Shida, M.; Ota, S. Thermal Barrier Coating Material. U.S. Patent No. 7,622,411, 24 November 2009. [Google Scholar]
- Yang, H.; Peng, F.; Zhang, Q.; Guo, C.; Shi, C.; Liu, W.; Sun, G.; Zhao, Y.; Zhang, D.; Sun, D.; et al. A promising high-density scintillator of GdTaO4 single crystal. CrystEngComm 2014, 16, 2480–2485. [Google Scholar] [CrossRef]
- Li, H.; Zhang, S.; Zhou, S.; Cao, X. Bonding characteristics, thermal expansibility, and compressibility of RXO4 (R = Rare Earths, X = P, As) within monazite and zircon structures. Inorg. Chem. 2009, 48, 4542–4548. [Google Scholar] [CrossRef] [PubMed]
- Huse, M.; Norby, T.; Haugsrud, R. Proton Conductivity in Acceptor-Doped LaVO4. J. Electrochem. Soc. 2011, 158, B857–B865. [Google Scholar] [CrossRef]
- Zhang, S.; Zhou, S.; Li, H.; Li, N. Investigation of thermal expansion and compressibility of rare-earth orthovanadates using a dielectric chemical bond method. Inorg. Chem. 2008, 47, 7863–7867. [Google Scholar] [CrossRef] [PubMed]
- Bjørheim, T.S.; Besikiotis, V.; Haugsrud, R. Hydration thermodynamics of pyrochlore structured oxides from TG and first principles calculations. Dalton Trans. 2012, 41, 13343–13351. [Google Scholar] [CrossRef] [PubMed] [Green Version]
- Omata, T.; Ikeda, K.; Tokashiki, R.; Otsuka-Yao-Matsuo, S. Proton solubility for La2Zr2O7 with a pyrochlore structure doped with a series of alkaline-earth ions. Solid State Ion. 2004, 167, 389–397. [Google Scholar] [CrossRef]
- Eurenius, K.E.J.; Ahlberg, E.; Knee, C.S. Proton conductivity in Ln1.96Ca0.04Sn2O7−δ(Ln = La, Sm, Yb) pyrochlores as a function of the lanthanide size. Solid State Ion. 2010, 181, 1258–1263. [Google Scholar] [CrossRef]
- Eurenius, K.E.J.; Ahlberg, E.; Ahmed, I.; Eriksson, S.G.; Knee, C.S. Investigation of proton conductivity in Sm1.92Ca0.08Ti2O7−δ and Sm2Ti1.92Y0.08O7−δ pyrochlores. Solid State Ion. 2010, 181, 148–153. [Google Scholar] [CrossRef]
- Eurenius, K.E.J.; Ahlberg, E.; Knee, C.S. Proton conductivity in Sm2Sn2O7 pyrochlores. Solid State Ion. 2010, 181, 1577–1585. [Google Scholar] [CrossRef]
- Omata, T.; Otsuka-Yao-Matsuo, S. Electrical Properties of Proton-Conducting Ca-Doped La2Zr2O7 with a Pyrochlore-Type Structure. J. Electrochem. Soc. 2001, 148, E252–E261. [Google Scholar] [CrossRef]
- Shimura, T.; Komori, M.; Iwahara, H. Ionic conduction in pyrochlore-type oxides containing rare earth elements at high temperature. Solid State Ion. 1996, 86–88, 685–689. [Google Scholar] [CrossRef]
- Ma, W.; Gong, S.; Xu, H.; Cao, X. On improving the phase stability and thermal expansion coefficients of lanthanum cerium oxide solid solutions. Scr. Mater. 2006, 54, 1505–1508. [Google Scholar] [CrossRef]
- Besikiotis, V.; Ricote, S.; Jensen, M.H.; Norby, T.; Haugsrud, R. Conductivity and hydration trends in disordered fluorite and pyrochlore oxides: A study on lanthanum cerate–zirconate based compounds. Solid State Ion. 2012, 229, 26–32. [Google Scholar] [CrossRef] [Green Version]
- Kalland, L.E.; Norberg, S.T.; Kyrklund, J.; Hull, S.; Eriksson, S.G.; Norby, T.; Mohn, C.E.; Knee, C.S. C-type related order in the defective fluorites La2Ce2O7 and Nd2Ce2O7 studied by neutron scattering and ab initio MD simulations. Phys. Chem. Chem. Phys. 2016, 18, 24070–24080. [Google Scholar] [CrossRef] [PubMed]
- Zhang, F.X.X.; Tracy, C.L.L.; Lang, M.; Ewing, R.C.C. Stability of fluorite-type La2Ce2O7 under extreme conditions. J. Alloys Compd. 2016, 674, 168–173. [Google Scholar] [CrossRef]
- Wang, J.; Bai, S.; Zhang, H.; Zhang, C. The structure, thermal expansion coefficient and sintering behavior of Nd3+-doped La2Zr2O7 for thermal barrier coatings. J. Alloys Compd. 2009, 476, 89–91. [Google Scholar] [CrossRef]
- Lehmann, H.; Pitzer, D.; Pracht, G.; Vassen, R.; Stöver, D. Thermal conductivity and thermal expansion coefficients of the lanthanum rare-earth-element zirconate system. J. Am. Ceram. Soc. 2003, 86, 1338–1344. [Google Scholar] [CrossRef]
- Haugsrud, R. Defects and transport properties in Ln6WO12 (Ln = La, Nd, Gd, Er). Solid State Ion. 2007, 178, 555–560. [Google Scholar] [CrossRef]
- Zayas-Rey, M.J.; dos Santos-Gómez, L.; Marrero-López, D.; León-Reina, L.; Canales-Vázquez, J.; Aranda, M.A.G.; Losilla, E.R. Structural and Conducting Features of Niobium-Doped Lanthanum Tungstate, La27(W1−xNbx)5O55.55−δ. Chem. Mater. 2013, 25, 448–456. [Google Scholar] [CrossRef]
- Magrasó, A.; Haugsrud, R. Effects of the La/W ratio and doping on the structure, defect structure, stability and functional properties of proton-conducting lanthanum tungstate La28−xW4+xO54+δ. A review. J. Mater. Chem. A 2014, 2, 12630–12641. [Google Scholar] [CrossRef]
- Magrasó, A.; Hervoches, C.H.; Ahmed, I.; Hull, S.; Nordström, J.; Skilbred, A.W.B.; Haugsrud, R. In situ high temperature powder neutron diffraction study of undoped and Ca-doped La28−xW4+xO54+3x/2 (x = 0.85). J. Mater. Chem. A 2013, 1, 3774–3782. [Google Scholar] [CrossRef]
- Hancke, R.; Magrasó, A.; Norby, T.; Haugsrud, R. Hydration of lanthanum tungstate (La/W=5.6 and 5.3) studied by TG and simultaneous TG–DSC. Solid State Ion. 2013, 231, 25–29. [Google Scholar] [CrossRef]
- Quarez, E.; Kravchyk, K.V.; Joubert, O. Compatibility of proton conducting La6WO12 electrolyte with standard cathode materials. Solid State Ion. 2012, 216, 19–24. [Google Scholar] [CrossRef]
- Seeger, J.; Ivanova, M.E.; Meulenberg, W.A.; Sebold, D.; Stöver, D.; Scherb, T.; Schumacher, G.; Escolástico, S.; Solís, C.; Serra, J.M. Synthesis and characterization of nonsubstituted and substituted proton-conducting La6−xWO12−y. Inorg. Chem. 2013, 52, 10375–10386. [Google Scholar] [CrossRef] [PubMed]
- Zayas-Rey, M.J.; dos Santos-Gómez, L.; Cabeza, A.; Marrero-López, D.; Losilla, E.R. Proton conductors based on alkaline-earth substituted La28−xW4+xO54+3x/2. Dalton Trans. 2014, 43, 6490–6499. [Google Scholar] [CrossRef] [PubMed]
- Peng, R.; Wu, T.; Liu, W.; Liu, X.; Meng, G. Cathode processes and materials for solid oxide fuel cells with proton conductors as electrolytes. J. Mater. Chem. 2010, 20, 6218–6225. [Google Scholar] [CrossRef]
- Merkle, R.; Poetzsch, D.; Maier, J. Oxygen Reduction Reaction at Cathodes on Proton Conducting Oxide Electrolytes: Contribution from Three Phase Boundary Compared to Bulk Path. ECS Trans. 2015, 66, 95–102. [Google Scholar] [CrossRef]
- Téllez Lozano, H.; Druce, J.; Cooper, S.J.; Kilner, J.A. Double perovskite cathodes for proton-conducting ceramic fuel cells: Are they triple mixed ionic electronic conductors? Sci. Technol. Adv. Mater. 2017, 18, 977–986. [Google Scholar] [CrossRef] [PubMed]
- Strandbakke, R.; Cherepanov, V.A.; Zuev, A.Y.; Tsvetkov, D.S.; Argirusis, C.; Sourkouni, G.; Prünte, S.; Norby, T. Gd- and Pr-based double perovskite cobaltites as oxygen electrodes for proton ceramic fuel cells and electrolyser cells. Solid State Ion. 2015, 278, 120–132. [Google Scholar] [CrossRef]
- Zohourian, R.; Merkle, R.; Maier, J. Proton uptake into the protonic cathode material BaCo0.4Fe0.4Zr0.2O3−δ and comparison to protonic electrolyte materials. Solid State Ion. 2017, 299, 64–69. [Google Scholar] [CrossRef]
- Bernuy-Lopez, C.; Rioja-Monllor, L.; Nakamura, T.; Ricote, S.; O’Hayre, R.; Amezawa, K.; Einarsrud, M.A.; Grande, T. Effect of Cation Ordering on the Performance and Chemical Stability of Layered Double Perovskite Cathodes. Materials 2018, 11, 196. [Google Scholar] [CrossRef] [PubMed]
- Zhao, L.; He, B.; Ling, Y.; Xun, Z.; Peng, R.; Meng, G.; Liu, X. Cobalt-free oxide Ba0.5Sr0.5Fe0.8Cu0.2O3−δ for proton-conducting solid oxide fuel cell cathode. Int. J. Hydrog. Energy 2010, 35, 3769–3774. [Google Scholar] [CrossRef]
- Grimaud, A.; Mauvy, F.; Bassat, J.M.; Fourcade, S.; Rocheron, L.; Marrony, M.; Grenier, J.C. Hydration Properties and Rate Determining Steps of the Oxygen Reduction Reaction of Perovskite-Related Oxides as H+-SOFC Cathodes. J. Electrochem. Soc. 2012, 159, B683–B694. [Google Scholar] [CrossRef]
- Dailly, J.; Fourcade, S.; Largeteau, A.; Mauvy, F.; Grenier, J.C.; Marrony, M. Perovskite and A2MO4-type oxides as new cathode materials for protonic solid oxide fuel cells. Electrochim. Acta 2010, 55, 5847–5853. [Google Scholar] [CrossRef]
- Shang, M.; Tong, J.; O’Hayre, R. A promising cathode for intermediate temperature protonic ceramic fuel cells: BaCo0.4Fe0.4Zr0.2O3−δ. RSC Adv. 2013, 3, 15769–15775. [Google Scholar] [CrossRef]
- Tao, Z.; Bi, L.; Zhu, Z.; Liu, W. Novel cobalt-free cathode materials BaCexFe1−xO3−δ for proton-conducting solid oxide fuel cells. J. Power Sources 2009, 194, 801–804. [Google Scholar] [CrossRef]
- Poetzsch, D.; Merkle, R.; Maier, J. Proton conductivity in mixed-conducting BSFZ perovskite from thermogravimetric relaxation. Phys. Chem. Chem. Phys. 2014, 16, 16446–16453. [Google Scholar] [CrossRef] [PubMed]
- Poetzsch, D.; Merkle, R.; Maier, J. Proton uptake in the H+-SOFC cathode material Ba0.5Sr0.5Fe0.8Zn0.2O3−δ: Transition from hydration to hydrogenation with increasing oxygen partial pressure. Faraday Discuss. 2015, 182, 129–143. [Google Scholar] [CrossRef] [PubMed]
- Mukundan, R.; Davies, P.K.; Worrell, W.L. Electrochemical Characterization of Mixed Conducting Ba(Ce0.8−yPryGd0.2)O2.9 Cathodes. J. Electrochem. Soc. 2001, 148, A82–A86. [Google Scholar] [CrossRef]
- Yang, L.; Liu, Z.; Wang, S.; Choi, Y.; Zuo, C.; Liu, M. A mixed proton, oxygen ion, and electron conducting cathode for SOFCs based on oxide proton conductors. J. Power Sources 2010, 195, 471–474. [Google Scholar] [CrossRef]
- Tao, Z.; Bi, L.; Yan, L.; Sun, W.; Zhu, Z.; Peng, R.; Liu, W. A novel single phase cathode material for a proton-conducting SOFC. Electrochem. Commun. 2009, 11, 688–690. [Google Scholar] [CrossRef]
- Wu, T.; Zhao, Y.; Peng, R.; Xia, C. Nano-sized Sm0.5Sr0.5CoO3−δ as the cathode for solid oxide fuel cells with proton-conducting electrolytes of BaCe0.8Sm0.2O2.9. Electrochim. Acta 2009, 54, 4888–4892. [Google Scholar] [CrossRef]
- Upasen, S.; Batocchi, P.; Mauvy, F.; Slodczyk, A.; Colomban, P. Chemical and structural stability of La0.6Sr0.4Co0.2Fe0.8O3−δ ceramic vs. medium/high water vapor pressure. Ceram. Int. 2015, 41, 14137–14147. [Google Scholar] [CrossRef]
- Pu, T.; Tan, W.; Shi, H.; Na, Y.; Lu, J.; Zhu, B. Steam/CO2 electrolysis in symmetric solid oxide electrolysis cell with barium cerate-carbonate composite electrolyte. Electrochim. Acta 2016, 190, 193–198. [Google Scholar] [CrossRef]
- Lin, B.; Dong, Y.; Yan, R.; Zhang, S.; Hu, M.; Zhou, Y.; Meng, G. In situ screen-printed BaZr0.1Ce0.7Y0.2O3−δ electrolyte-based protonic ceramic membrane fuel cells with layered SmBaCo2O5+x cathode. J. Power Sources 2009, 186, 446–449. [Google Scholar] [CrossRef]
- Kim, J.; Sengodan, S.; Kwon, G.; Ding, D.; Shin, J.; Liu, M.; Kim, G. Triple-Conducting Layered Perovskites as Cathode Materials for Proton-Conducting Solid Oxide Fuel Cells. ChemSusChem 2014, 7, 2811–2815. [Google Scholar] [CrossRef] [PubMed]
- Lin, B.; Zhang, S.; Bi, L.; Ding, H.; Liu, X.; Gao, J.; Meng, G. Prontonic ceramic membrane fuel cells with layered GdBaCo2O5+x cathode prepared by gel-casting and suspension spray. J. Power Sources 2008, 177, 330–333. [Google Scholar] [CrossRef]
- Brieuc, F.; Dezanneau, G.; Hayoun, M.; Dammak, H. Proton diffusion mechanisms in the double perovskite cathode material GdBaCo2O5.5: A molecular dynamics study. Solid State Ion. 2017, 309, 187–191. [Google Scholar] [CrossRef]
- Zhao, L.; He, B.; Lin, B.; Ding, H.; Wang, S.; Ling, Y.; Peng, R.; Meng, G.; Liu, X. High performance of proton-conducting solid oxide fuel cell with a layered PrBaCo2O5+δ cathode. J. Power Sources 2009, 194, 835–837. [Google Scholar] [CrossRef]
- Ding, H.; Xue, X.; Liu, X.; Meng, G. A novel layered perovskite cathode for proton conducting solid oxide fuel cells. J. Power Sources 2010, 195, 775–778. [Google Scholar] [CrossRef]
- Nian, Q.; Zhao, L.; He, B.; Lin, B.; Peng, R.; Meng, G.; Liu, X. Layered SmBaCuCoO5+δ and SmBaCuFeO5+δ perovskite oxides as cathode materials for proton-conducting SOFCs. J. Alloys Compd. 2010, 492, 291–294. [Google Scholar] [CrossRef]
- Zhao, L.; He, B.; Nian, Q.; Xun, Z.; Peng, R.; Meng, G.; Liu, X. In situ drop-coated BaZr0.1Ce0.7Y0.2O3−δ electrolyte-based proton-conductor solid oxide fuel cells with a novel layered PrBaCuFeO5+δ cathode. J. Power Sources 2009, 194, 291–294. [Google Scholar] [CrossRef]
- Taillades, G.; Dailly, J.; Taillades-Jacquin, M.; Mauvy, F.; Essouhmi, A.; Marrony, M.; Lalanne, C.; Fourcade, S.; Jones, D.J.; Grenier, J.C.; et al. Intermediate temperature anode-supported fuel cell based on BaCe0.9Y0.1O3 electrolyte with novel Pr2NiO4 cathode. Fuel Cells 2010, 10, 166–173. [Google Scholar] [CrossRef]
- Nasani, N.; Ramasamy, D.; Mikhalev, S.; Kovalevsky, A.V.; Fagg, D.P. Fabrication and electrochemical performance of a stable, anode supported thin BaCe0.4Zr0.4Y0.2O3−δ electrolyte Protonic Ceramic Fuel Cell. J. Power Sources 2015, 278, 582–589. [Google Scholar] [CrossRef]
- Upasen, S.; Batocchi, P.; Mauvy, F.; Slodczyk, A.; Colomban, P. Protonation and structural/chemical stability of Ln2NiO4+δ ceramics vs. H2O/CO2: High temperature/water pressure ageing tests. J. Alloys Compd. 2014, 622, 1074–1085. [Google Scholar] [CrossRef]
- Zhao, H.; Mauvy, F.; Lalanne, C.; Bassat, J.M.; Fourcade, S.; Grenier, J.C. New cathode materials for ITSOFC: Phase stability, oxygen exchange and cathode properties of La2−xNiO4+δ. Solid State Ion. 2008, 179, 2000–2005. [Google Scholar] [CrossRef]
- Wang, J.; Zhou, J.; Wang, T.; Chen, G.; Wu, K.; Cheng, Y. Decreasing the polarization resistance of LaSrCoO4 cathode by Fe substitution for Ba(Zr0.1Ce0.7Y0.2)O3 based protonic ceramic fuel cells. J. Alloys Compd. 2016, 689, 581–586. [Google Scholar] [CrossRef]
- Acuña, W.; Tellez, J.F.; Macías, M.A.; Roussel, P.; Ricote, S.; Gauthier, G.H. Synthesis and characterization of BaGa2O4 and Ba3Co2O6(CO3)0.6 compounds in the search of alternative materials for Proton Ceramic Fuel Cell (PCFC). Solid State Sci. 2017, 71, 61–68. [Google Scholar] [CrossRef]
- Danilov, N.A.; Tarutin, A.P.; Lyagaeva, J.G.; Pikalova, E.Y.; Murashkina, A.A.; Medvedev, D.A.; Patrakeev, M.V.; Demin, A.K. Affinity of YBaCo4O7+δ-based layered cobaltites with protonic conductors of cerate-zirconate family. Ceram. Int. 2017, 43, 15418–15423. [Google Scholar] [CrossRef]
- Kinyanjui, F.G.; Norberg, S.T.; Knee, C.S.; Eriksson, S.G. Proton conduction in oxygen deficient Ba3In1.4Y0.3M0.3ZrO8 (M = Ga3+ or Gd3+) perovskites. J. Alloys Compd. 2014, 605, 56–62. [Google Scholar] [CrossRef]
- Yahia, H.B.; Mauvy, F.; Grenier, J.C. Ca3−xLaxCo4O9+δ (x = 0, 0.3): New cobaltite materials as cathodes for proton conducting solid oxide fuel cell. J. Solid State Chem. 2010, 183, 527–531. [Google Scholar] [CrossRef]
- Macias, M.A.; Sandoval, M.V.; Martinez, N.G.; Vázquez-Cuadriello, S.; Suescun, L.; Roussel, P.; Świerczek, K.; Gauthier, G.H. Synthesis and preliminary study of La4BaCu5O13+δ and La6.4Sr1.6Cu8O20±δ ordered perovskites as SOFC/PCFC electrode materials. Solid State Ion. 2016, 288, 68–75. [Google Scholar] [CrossRef]
- Lin, B.; Ding, H.; Dong, Y.; Wang, S.; Zhang, X.; Fang, D.; Meng, G. Intermediate-to-low temperature protonic ceramic membrane fuel cells with Ba0.5Sr0.5Co0.8Fe0.2O3−δ-BaZr0.1Ce0.7Y0.2O3−δ composite cathode. J. Power Sources 2009, 186, 58–61. [Google Scholar] [CrossRef]
- Yang, L.; Wang, S.; Lou, X.; Liu, M. Electrical conductivity and electrochemical performance of cobalt-doped BaZr0.1Ce0.7Y0.2O3−δ cathode. Int. J. Hydrog. Energy 2011, 36, 2266–2270. [Google Scholar] [CrossRef]
- Sun, W.; Yan, L.; Lin, B.; Zhang, S.; Liu, W. High performance proton-conducting solid oxide fuel cells with a stable Sm0.5Sr0.5Co3−δ–Ce0.8Sm0.2O2−δ composite cathode. J. Power Sources 2010, 195, 3155–3158. [Google Scholar] [CrossRef]
- Sun, W.; Zhu, Z.; Jiang, Y.; Shi, Z.; Yan, L.; Liu, W. Optimization of BaZr0.1Ce0.7Y0.2O3−δ-based proton-conducting solid oxide fuel cells with a cobalt-free proton-blocking La0.7Sr0.3FeO3−δ–Ce0.8Sm0.2O2−δ composite cathode. Int. J. Hydrog. Energy 2011, 36, 9956–9966. [Google Scholar] [CrossRef]
- Fabbri, E.; Licoccia, S.; Traversa, E.; Wachsman, E.D. Composite cathodes for proton conducting electrolytes. Fuel Cells 2009, 9, 128–138. [Google Scholar] [CrossRef]
- Yang, C.; Xu, Q. A functionally graded cathode for proton-conducting solid oxide fuel cells. J. Power Sources 2012, 212, 186–191. [Google Scholar] [CrossRef]
- Fabbri, E.; Bi, L.; Pergolesi, D.; Traversa, E. High-performance composite cathodes with tailored mixed conductivity for intermediate temperature solid oxide fuel cells using proton conducting electrolytes. Energy Environ. Sci. 2011, 4, 4984–4993. [Google Scholar] [CrossRef]
- Vert, V.B.; Solís, C.; Serra, J.M. Electrochemical properties of PSFC-BCYb composites as cathodes for proton conducting solid oxide fuel cells. Fuel Cells 2011, 11, 81–90. [Google Scholar] [CrossRef]
- Yang, C.; Zhang, X.; Zhao, H.; Shen, Y.; Du, Z.; Zhang, C. Electrochemical properties of BaZr0.1Ce0.7Y0.1Yb0.1O3−δ-Nd1.95NiO4+δ composite cathode for protonic ceramic fuel cells. Int. J. Hydrog. Energy 2015, 40, 2800–2807. [Google Scholar] [CrossRef]
- Dailly, J.; Taillades, G.; Ancelin, M.; Pers, P.; Marrony, M. High performing BaCe0.8Zr0.1Y0.1O3−δ-Sm0.5Sr0.5CoO3−δ based protonic ceramic fuel cell. J. Power Sources 2017, 361, 221–226. [Google Scholar] [CrossRef]
- Li, G.; Zhang, Y.; Ling, Y.; He, B.; Xu, J.; Zhao, L. Probing novel triple phase conducting composite cathode for high performance protonic ceramic fuel cells. Int. J. Hydrog. Energy 2016, 41, 5074–5083. [Google Scholar] [CrossRef]
- Bausá, N.; Solís, C.; Strandbakke, R.; Serra, J.M. Development of composite steam electrodes for electrolyzers based on barium zirconate. Solid State Ion. 2017, 306, 62–68. [Google Scholar] [CrossRef]
- Li, H.; Chen, X.; Chen, S.; Wu, Y.; Xie, K. Composite manganate oxygen electrode enhanced with iron oxide nanocatalyst for high temperature steam electrolysis in a proton-conducting solid oxide electrolyzer. Int. J. Hydrog. Energy 2015, 40, 7920–7931. [Google Scholar] [CrossRef]
- Ding, H.; Sullivan, N.P.; Ricote, S. Double perovskite Ba2FeMoO6−δ as fuel electrode for protonic-ceramic membranes. Solid State Ion. 2017, 306, 97–103. [Google Scholar] [CrossRef]
- Robinson, S.; Manerbino, A.; Coors, W.G. Galvanic hydrogen pumping in the protonic ceramic perovskite BaCe0.2Zr0.7Y0.1O3−δ. J. Membr. Sci. 2013, 446, 99–105. [Google Scholar] [CrossRef]
- Kyriakou, V.; Garagounis, I.; Vourros, A.; Vasileiou, E.; Manerbino, A.; Coors, W.G.; Stoukides, M. Methane steam reforming at low temperatures in a BaZr0.7Ce0.2Y0.1O2.9 proton conducting membrane reactor. Appl. Catal. B Environ. 2016, 186, 1–9. [Google Scholar] [CrossRef]
- Shen, C.T.; Lee, Y.H.; Xie, K.; Yen, C.P.; Jhuang, J.W.; Lee, K.R.; Lee, S.W.; Tseng, C.J. Correlation between microstructure and catalytic and mechanical properties during redox cycling for Ni-BCY and Ni-BCZY composites. Ceram. Int. 2017, 43, S671–S674. [Google Scholar] [CrossRef]
- Nasani, N.; Ramasamy, D.; Antunes, I.; Perez, J.; Fagg, D.P. Electrochemical behaviour of Ni-BZO and Ni-BZY cermet anodes for Protonic Ceramic Fuel Cells (PCFCs)—A comparative study. Electrochim. Acta 2015, 154, 387–396. [Google Scholar] [CrossRef]
- Nasani, N.; Ramasamy, D.; Brandão, A.D.; Yaremchenko, A.A.; Fagg, D.P. The impact of porosity, pH2 and pH2O on the polarisation resistance of Ni–BaZr0.85Y0.15O3−δ cermet anodes for Protonic Ceramic Fuel Cells (PCFCs). Int. J. Hydrog. Energy 2014, 39, 21231–21241. [Google Scholar] [CrossRef]
- Pikalova, E.; Medvedev, D. Effect of anode gas mixture humidification on the electrochemical performance of the BaCeO3-based protonic ceramic fuel cell. Int. J. Hydrog. Energy 2016, 41, 4016–4025. [Google Scholar] [CrossRef]
- Park, Y.E.; Ji, H.I.; Kim, B.K.; Lee, J.H.; Lee, H.W.; Park, J.S. Pore structure improvement in cermet for anode-supported protonic ceramic fuel cells. Ceram. Int. 2013, 39, 2581–2587. [Google Scholar] [CrossRef]
- Taillades, G.; Pers, P.; Mao, V.; Taillades, M. High performance anode-supported proton ceramic fuel cell elaborated by wet powder spraying. Int. J. Hydrog. Energy 2016, 41, 12330–12336. [Google Scholar] [CrossRef]
- Li, G.; Jin, H.; Cui, Y.; Gui, L.; He, B.; Zhao, L. Application of a novel (Pr0.9La0.1)2(Ni0.74Cu0.21Nb0.05)O4+δ-infiltrated BaZr0.1Ce0.7Y0.2O3−δ cathode for high performance protonic ceramic fuel cells. J. Power Sources 2017, 341, 192–198. [Google Scholar] [CrossRef]
- Ricote, S.; Bonanos, N.; Lenrick, F.; Wallenberg, R. LaCoO3: Promising cathode material for protonic ceramic fuel cells based on BaCe0.2Zr0.7Y0.1O3-delta electrolyte. J. Power Sources 2012, 218, 313–319. [Google Scholar] [CrossRef]
- Babiniec, S.M.; Ricote, S.; Sullivan, N.P. Characterization of ionic transport through BaCe0.2Zr0.7Y0.1O3−δ membranes in galvanic and electrolytic operation. Int. J. Hydrog. Energy 2015, 40, 9278–9286. [Google Scholar] [CrossRef]
- Strandbakke, R.; Vøllestad, E.; Robinson, S.A.; Fontaine, M.L.; Norby, T. Ba0.5Gd0.8La0.7Co2O6−δ Infiltrated in Porous BaZr0.7Ce0.2Y0.1O3 Backbones as Electrode Material for Proton Ceramic Electrolytes. J. Electrochem. Soc. 2017, 164, F196–F202. [Google Scholar] [CrossRef]
- Song, S.H.; Yoon, S.E.; Choi, J.; Kim, B.K.; Park, J.S. A high-performance ceramic composite anode for protonic ceramic fuel cells based on lanthanum strontium vanadate. Int. J. Hydrog. Energy 2014, 39, 16534–16540. [Google Scholar] [CrossRef]
- Lapina, A.; Chatzichristodoulou, C.; Holtappels, P.; Mogensen, M. Composite Fe-BaCe0.2Zr0.6Y0.2O2.9 Anodes for Proton Conductor Fuel Cells. J. Electrochem. Soc. 2014, 161, F833–F837. [Google Scholar] [CrossRef]
- Miyazaki, K.; Okanishi, T.; Muroyama, H.; Matsui, T.; Eguchi, K. Development of Ni–Ba(Zr,Y)O3 cermet anodes for direct ammonia-fueled solid oxide fuel cells. J. Power Sources 2017, 365, 148–154. [Google Scholar] [CrossRef]
- Rioja-Monllor, L. In Situ Exsolution Synthesis of Composite Cathodes for Protonic Ceramic Fuel Cells. Ph.D. Thesis, Norwegian University of Science and Technology, Trondheim, Norway, 2018. [Google Scholar]
- Lee, K.T.; Manthiram, A. Comparison of Ln0.6Sr0.4CoO3−δ (Ln = La, Pr, Nd, Sm, and Gd) as Cathode Materials for Intermediate Temperature Solid Oxide Fuel Cells. J. Electrochem. Soc. 2006, 153, A794–A798. [Google Scholar] [CrossRef]
- Taguchi, H.; Komatsu, T.; Chiba, R.; Nozawa, K.; Orui, H.; Arai, H. Characterization of LaNixCoyFe1−x−yO3 as a cathode material for solid oxide fuel cells. Solid State Ion. 2011, 182, 127–132. [Google Scholar] [CrossRef]
- Tietz, F.; Arul Raj, I.; Zahid, M.; Stöver, D. Electrical conductivity and thermal expansion of La0.8Sr0.2(Mn,Fe,Co)O3−δ perovskites. Solid State Ion. 2006, 177, 1753–1756. [Google Scholar] [CrossRef]
- Petric, A.; Huang, P.; Tietz, F. Evaluation of La–Sr–Co–Fe–O perovskites for solid oxide fuel cells and gas separation membranes. Solid State Ion. 2000, 135, 719–725. [Google Scholar] [CrossRef]
- Tai, L.W.; Nasrallah, M.M.; Anderson, H.U.; Sparlin, D.M.; Sehlin, S.R. Structure and electrical properties of La1−xSrxCo1−yFeyO3. Part 1. The system La0.8Sr0.2Co1−yFeyO3. Solid State Ion. 1995, 76, 259–271. [Google Scholar] [CrossRef]
- Pelosato, R.; Cordaro, G.; Stucchi, D.; Cristiani, C.; Dotelli, G. Cobalt based layered perovskites as cathode material for intermediate temperature Solid Oxide Fuel Cells: A brief review. J. Power Sources 2015, 298, 46–67. [Google Scholar] [CrossRef]
- Rath, M.K.; Lee, K.T. Investigation of aliovalent transition metal doped La0.7Ca0.3Cr0.8X0.2O3−δ (X = Ti, Mn, Fe, Co, and Ni) as electrode materials for symmetric solid oxide fuel cells. Ceram. Int. 2015, 41, 10878–10890. [Google Scholar] [CrossRef]
- Wei, B.; Lü, Z.; Jia, D.; Huang, X.; Zhang, Y.; Su, W. Thermal expansion and electrochemical properties of Ni-doped GdBaCo2O5+δ double-perovskite type oxides. Int. J. Hydrog. Energy 2010, 35, 3775–3782. [Google Scholar] [CrossRef]
- Kharton, V.; Naumovich, E.; Kovalevsky, A.; Viskup, A.; Figueiredo, F.; Bashmakov, I.; Marques, F.M. Mixed electronic and ionic conductivity of LaCo(M)O3 (M = Ga, Cr, Fe or Ni): IV. Effect of preparation method on oxygen transport in LaCoO3−δ. Solid State Ion. 2000, 138, 135–148. [Google Scholar] [CrossRef]
- Radaelli, P.G.; Cheong, S.W. Structural phenomena associated with the spin-state transition in LaCoO3. Phys. Rev. B 2002, 66, 094408. [Google Scholar] [CrossRef]
- Zobel, C.; Kriener, M.; Bruns, D.; Baier, J.; Grüninger, M.; Lorenz, T.; Reutler, P.; Revcolevschi, A. Evidence for a low-spin to intermediate-spin state transition in (formula presented). Phys. Rev. B Condens. Matter Mater. Phys. 2002, 66, 1–4. [Google Scholar] [CrossRef]
- Ullmann, H.; Trofimenko, N.; Tietz, F.; Stöver, D.; Ahmad-Khanlou, A. Correlation between thermal expansion and oxide ion transport in mixed conducting perovskite-type oxides for SOFC cathodes. Solid State Ion. 2000, 138, 79–90. [Google Scholar] [CrossRef]
- Thommy, L.; Joubert, O.; Hamon, J.; Caldes, M.T. Impregnation versus exsolution: Using metal catalysts to improve electrocatalytic properties of LSCM-based anodes operating at 600 °C. Int. J. Hydrog. Energy 2016, 41, 14207–14216. [Google Scholar] [CrossRef]
- Jiang, Z.; Xia, C.; Chen, F. Nano-structured composite cathodes for intermediate-temperature solid oxide fuel cells via an infiltration/impregnation technique. Electrochim. Acta 2010, 55, 3595–3605. [Google Scholar] [CrossRef]
- Li, G.; He, B.; Ling, Y.; Xu, J.; Zhao, L. Highly active YSB infiltrated LSCF cathode for proton conducting solid oxide fuel cells. Int. J. Hydrog. Energy 2015, 40, 13576–13582. [Google Scholar] [CrossRef]
- Tucker, M.C. Progress in metal-supported solid oxide fuel cells: A review. J. Power Sources 2010, 195, 4570–4582. [Google Scholar] [CrossRef]
- Kim, J.-H.; Manthiram, A. LnBaCo2O5+δ Oxides as Cathodes for Intermediate-Temperature Solid Oxide Fuel Cells. J. Electrochem. Soc. 2008, 155, B385–B390. [Google Scholar] [CrossRef]
- Riza, F.; Ftikos, C.; Tietz, F.; Fischer, W. Preparation and characterization of Ln0.8Sr0.2Fe0.8Co0.2O3−δ (Ln = La, Pr, Nd, Sm, Eu, Gd). J. Eur. Ceram. Soc. 2001, 21, 1769–1773. [Google Scholar] [CrossRef]
- Klyndyuk, A.I. Thermal and chemical expansion of LnBaCuFeO5+δ (Ln = La, Pr, Gd) ferrocuprates and LaBa0.75Sr0.25CuFeO5+δ solid solution. Russ. J. Inorg. Chem. 2007, 52, 1343–1349. [Google Scholar] [CrossRef]
- Klyndyuk, A.I.; Chizhova, E.A. Properties of perovskite-like phases LnBaCuFeO5+δ (Ln = La, Pr). Glass Phys. Chem. 2008, 34, 313–318. [Google Scholar] [CrossRef]
- Jin, F.; Xu, H.; Long, W.; Shen, Y.; He, T. Characterization and evaluation of double perovskites LnBaCoFeO5+δ (Ln = Pr and Nd) as intermediate-temperature solid oxide fuel cell cathodes. J. Power Sources 2013, 243, 10–18. [Google Scholar] [CrossRef]
- Che, X.; Shen, Y.; Li, H.; He, T. Assessment of LnBaCo1.6Ni0.4O5+δ (Ln = Pr, Nd, and Sm) double-perovskites as cathodes for intermediate-temperature solid-oxide fuel cells. J. Power Sources 2013, 222, 288–293. [Google Scholar] [CrossRef]
- Mori, M.; Hiei, Y.; Sammes, N.M.; Tompsett, G.A. Thermal-Expansion Behaviors and Mechanisms for Ca- or Sr-Doped Lanthanum Manganite Perovskites under Oxidizing Atmospheres. J. Electrochem. Soc. 2000, 147, 1295–1302. [Google Scholar] [CrossRef]
- Shao, Z.; Yang, W.; Cong, Y.; Dong, H.; Tong, J.; Xiong, G. Investigation of the permeation behavior and stability of a Ba0.5Sr0.5Co0.8Fe0.2O3−δ oxygen membrane. J. Membr. Sci. 2000, 172, 177–188. [Google Scholar] [CrossRef]
- Shao, Z.; Dong, H.; Xiong, G.; Cong, Y.; Yang, W. Performance of a mixed-conducting ceramic membrane reactor with high oxygen permeability for methane conversion. J. Membr. Sci. 2001, 183, 181–192. [Google Scholar] [CrossRef] [Green Version]
- Shao, Z.; Haile, S.M. A high-performance cathode for the next generation of solid-oxide fuel cells. Nature 2004, 431, 170–173. [Google Scholar] [CrossRef] [PubMed]
- Lin, Y.; Ran, R.; Zheng, Y.; Shao, Z.; Jin, W.; Xu, N.; Ahn, J. Evaluation of Ba0.5Sr0.5Co0.8Fe0.2O3−δ as a potential cathode for an anode-supported proton-conducting solid-oxide fuel cell. J. Power Sources 2008, 180, 15–22. [Google Scholar] [CrossRef]
- Patra, H.; Rout, S.K.; Pratihar, S.K.; Bhattacharya, S. Thermal, electrical and electrochemical characteristics of Ba1−xSrxCo0.8Fe0.2O3−δ cathode material for intermediate temperature solid oxide fuel cells. Int. J. Hydrog. Energy 2011, 36, 11904–11913. [Google Scholar] [CrossRef]
- Wei, B.; Lü, Z.; Huang, X.; Miao, J.; Sha, X.; Xin, X.; Su, W. Crystal structure, thermal expansion and electrical conductivity of perovskite oxides BaxSr1−xCo0.8Fe0.2O3−δ (0.3 ≤ x ≤ 0.7). J. Eur. Ceram. Soc. 2006, 26, 2827–2832. [Google Scholar] [CrossRef]
- McIntosh, S.; Vente, J.F.; Haije, W.G.; Blank, D.H.A.; Bouwmeester, H.J.M. Oxygen Stoichiometry and Chemical Expansion of Ba0.5Sr0.5Co0.8Fe0.2O3−δ Measured by in Situ Neutron Diffraction. Chem. Mater. 2006, 18, 2187–2193. [Google Scholar] [CrossRef]
- Kriegel, R.; Kircheisen, R.; Töpfer, J. Oxygen stoichiometry and expansion behavior of Ba0.5Sr0.5Co0.8Fe0.2O3−δ. Solid State Ion. 2010, 181, 64–70. [Google Scholar] [CrossRef]
- Zhu, Q.; Jin, T.; Wang, Y. Thermal expansion behavior and chemical compatibility of BaxSr1−xCo1−yFeyO3−δ with 8YSZ and 20GDC. Solid State Ion. 2006, 177, 1199–1204. [Google Scholar] [CrossRef]
- Wang, H.; Tablet, C.; Feldhoff, A.; Caro, J. Investigation of phase structure, sintering, and permeability of perovskite-type Ba0.5Sr0.5Co0.8Fe0.2O3−δ membranes. J. Membr. Sci. 2005, 262, 20–26. [Google Scholar] [CrossRef]
- Hwang, H.J.; Moon, J.W.; Lee, S.; Lee, E.A. Electrochemical performance of LSCF-based composite cathodes for intermediate temperature SOFCs. J. Power Sources 2005, 145, 243–248. [Google Scholar] [CrossRef]
- Richter, J.; Holtappels, P.; Graule, T.; Nakamura, T.; Gauckler, L.J. Materials design for perovskite SOFC cathodes. Monatshefte für Chemie 2009, 140, 985–999. [Google Scholar] [CrossRef]
- Tai, L.W.; Nasrallah, M.M.; Anderson, H.U.; Sparlin, D.M.; Sehlin, S.R. Structure and electrical properties of La1−xSrxCo1−yFeyO3. Part 2. The system La1−xSrxCo0.2Fe0.8O3. Solid State Ion. 1995, 76, 273–283. [Google Scholar] [CrossRef]
- Xu, Q.; Huang, D.; Zhang, F.; Chen, W.; Chen, M.; Liu, H. Structure, electrical conducting and thermal expansion properties of La0.6Sr0.4Co0.8Fe0.2O3−δ–Ce0.8Sm0.2O2−δ composite cathodes. J. Alloys Compd. 2008, 454, 460–465. [Google Scholar] [CrossRef]
- Fan, B.; Yan, J.; Yan, X. The ionic conductivity, thermal expansion behavior, and chemical compatibility of La0.54Sr0.44Co0.2Fe0.8O3−δ as SOFC cathode material. Solid State Sci. 2011, 13, 1835–1839. [Google Scholar] [CrossRef]
- Kim, S.; Kim, S.H.; Lee, K.S.; Yu, J.H.; Seong, Y.H.; Han, I.S. Mechanical properties of LSCF (La0.6Sr0.4Co0.2Fe0.8O3−δ)–GDC (Ce0.9Gd0.1O2−δ) for oxygen transport membranes. Ceram. Int. 2017, 43, 1916–1921. [Google Scholar] [CrossRef]
- Kostogloudis, G.C.; Ftikos, C. Properties of A-site-deficient La0.6Sr0.4Co0.2Fe0.8O3−δ-based perovskite oxides. Solid State Ion. 1999, 126, 143–151. [Google Scholar] [CrossRef]
- Kharton, V.V.; Yaremchenko, A.A.; Patrakeev, M.V.; Naumovich, E.N.; Marques, F.M.B. Thermal and chemical induced expansion of La0.3Sr0.7(Fe,Ga)O3−δ ceramics. J. Eur. Ceram. Soc. 2003, 23, 1417–1426. [Google Scholar] [CrossRef]
- Wang, S.; Katsuki, M.; Dokiya, M.; Hashimoto, T. High temperature properties of La0.6Sr0.4Co0.8Fe0.2O3−δ phase structure and electrical conductivity. Solid State Ion. 2003, 159, 71–78. [Google Scholar] [CrossRef]
- Duan, C.; Hook, D.; Chen, Y.; Tong, J.; O’Hayre, R. Zr and Y co-doped perovskite as a stable, high performance cathode for solid oxide fuel cells operating below 500 °C. Energy Environ. Sci. 2017, 10, 176–182. [Google Scholar] [CrossRef]
- Wang, F.; Yan, D.; Zhang, W.; Chi, B.; Pu, J.; Jian, L. LaCo0.6Ni0.4O3−δ as cathode contact material for intermediate temperature solid oxide fuel cells. Int. J. Hydrog. Energy 2013, 38, 646–651. [Google Scholar] [CrossRef]
- Kharton, V.; Viskup, A.P.; Bochkoc, D.M.; Naumovich, E.N.; Reut, O.P. Mixed electronic and ionic conductivity of LaCo(M)O3 (M = Ga, Cr, Fe or Ni) III. Diffusion of oxygen through LaCo1−x−yFexNiyO3 ceramics. Solid State Ion. 1998, 110, 61–68. [Google Scholar] [CrossRef]
- Chiba, R.; Yoshimura, F.; Sakurai, Y. An investigation of LaNi1−xFexO3 as a cathode material for solid oxide fuel cells. Solid State Ion. 1999, 124, 281–288. [Google Scholar] [CrossRef]
- Grande, T.; Tolchard, J.R.; Selbach, S.M. Anisotropic Thermal and Chemical Expansion in Sr-Substituted LaMnO3+δ: Implications for Chemical Strain Relaxation. Chem. Mater. 2012, 24, 338–345. [Google Scholar] [CrossRef]
- Huang, Y.; Dass, R.; Xing, Z.; Goodenough, J. Double perovskites as anode materials for solid-oxide fuel cells. Science 2006, 312, 254–257. [Google Scholar] [CrossRef] [PubMed]
- Wei, T.; Zhang, Q.; Huang, Y.H.; Goodenough, J.B. Cobalt-based double-perovskite symmetrical electrodes with low thermal expansion for solid oxidefuel cells. J. Mater. Chem. 2012, 22, 225–231. [Google Scholar] [CrossRef]
- Cherepanov, V.A.; Aksenova, T.V.; Gavrilova, L.Y.; Mikhaleva, K.N. Structure, nonstoichiometry and thermal expansion of the NdBa(Co,Fe)2O5+δ layered perovskite. Solid State Ion. 2011, 188, 53–57. [Google Scholar] [CrossRef]
- West, M.; Manthiram, A. Layered LnBa1−xSrxCoCuO5+δ (Ln = Nd and Gd) perovskite cathodes for intermediate temperature solid oxide fuel cells. Int. J. Hydrog. Energy 2013, 38, 3364–3372. [Google Scholar] [CrossRef]
- Kim, J.H.; Irvine, J.T.S. Characterization of layered perovskite oxides NdBa1−xSrxCo2O5+δ (x = 0 and 0.5) as cathode materials for IT-SOFC. Int. J. Hydrog. Energy 2012, 37, 5920–5929. [Google Scholar] [CrossRef]
- Li, X.; Jiang, X.; Xu, H.; Xu, Q.; Jiang, L.; Shi, Y.; Zhang, Q. Scandium-doped PrBaCo2−xScxO6−δ oxides as cathode material for intermediate-temperature solid oxide fuel cells. Int. J. Hydrog. Energy 2013, 38, 12035–12042. [Google Scholar] [CrossRef]
- Kim, J.; Choi, S.; Park, S.; Kim, C.; Shin, J.; Kim, G. Effect of Mn on the electrochemical properties of a layered perovskite NdBa0.5Sr0.5Co2−xMnxO5+δ (x = 0, 0.25, and 0.5) for intermediate-temperature solid oxide fuel cells. Electrochim. Acta 2013, 112, 712–718. [Google Scholar] [CrossRef]
- Wang, Y.; Zhao, X.; Lü, S.; Meng, X.; Zhang, Y.; Yu, B.; Li, X.; Sui, Y.; Yang, J.; Fu, C.; et al. Synthesis and characterization of SmSrCo2−xMnxO5+δ (x = 0.0, 0.2, 0.4, 0.6, 0.8, 1.0) cathode materials for intermediate-temperature solid-oxide fuel cells. Ceram. Int. 2014, 40, 11343–11350. [Google Scholar] [CrossRef]
- Phillipps, M.B.; Sammes, N.M.; Yamamoto, O. Gd1−xAxCo1−yMnyO3 (A = Sr, Ca) as a cathode for the SOFC. Solid State Ion. 1999, 123, 131–138. [Google Scholar] [CrossRef]
- Liu, L.; Guo, R.; Wang, S.; Yang, Y.; Yin, D. Synthesis and characterization of PrBa0.5Sr0.5Co2−xNixO5+δ (x = 0.1, 0.2 and 0.3) cathodes for intermediate temperature SOFCs. Ceram. Int. 2014, 40, 16393–16398. [Google Scholar] [CrossRef]
- Jo, S.H.; Muralidharan, P.; Kim, D.K. Enhancement of electrochemical performance and thermal compatibility of GdBaCo2/3Fe2/3Cu2/3O5+δ cathode on Ce1.9Gd0.1O1.95 electrolyte for IT-SOFCs. Electrochem. Commun. 2009, 11, 2085–2088. [Google Scholar] [CrossRef]
- Zhang, Y.; Yu, B.; Lü, S.; Meng, X.; Zhao, X.; Ji, Y.; Wang, Y.; Fu, C.; Liu, X.; Li, X.; et al. Effect of Cu doping on YBaCo2O5+δ as cathode for intermediate-temperature solid oxide fuel cells. Electrochim. Acta 2014, 134, 107–115. [Google Scholar] [CrossRef]
- Jin, F.; Shen, Y.; Wang, R.; He, T. Double-perovskite PrBaCo2/3Fe2/3Cu2/3O5+δ as cathode material for intermediate-temperature solid-oxide fuel cells. J. Power Sources 2013, 234, 244–251. [Google Scholar] [CrossRef]
- Jiang, L.; Wei, T.; Zeng, R.; Zhang, W.X.; Huang, Y.H. Thermal and electrochemical properties of PrBa0.5Sr0.5Co2−xFexO5+δ (x = 0.5, 1.0, 1.5) cathode materials for solid-oxide fuel cells. J. Power Sources 2013, 232, 279–285. [Google Scholar] [CrossRef]
- Zhao, L.; Shen, J.; He, B.; Chen, F.; Xia, C. Synthesis, characterization and evaluation of PrBaCo2−xFexO5+δ as cathodes for intermediate-temperature solid oxide fuel cells. Int. J. Hydrog. Energy 2011, 36, 3658–3665. [Google Scholar] [CrossRef]
- Ni, D.W.; Charlas, B.; Kwok, K.; Molla, T.T.; Hendriksen, P.V.; Frandsen, H.L. Influence of temperature and atmosphere on the strength and elastic modulus of solid oxide fuel cell anode supports. J. Power Sources 2016, 311, 1–12. [Google Scholar] [CrossRef] [Green Version]
- Kim, Y.N.; Kim, J.H.; Manthiram, A. Effect of Fe substitution on the structure and properties of LnBaCo2−xFexO5+δ (Ln = Nd and Gd) cathodes. J. Power Sources 2010, 195, 6411–6419. [Google Scholar] [CrossRef]
- Volkova, N.E.; Gavrilova, L.Y.; Cherepanov, V.A.; Aksenova, T.V.; Kolotygin, V.A.; Kharton, V.V. Synthesis, crystal structure and properties of SmBaCo2−xFexO5+δ. J. Solid State Chem. 2013, 204, 219–223. [Google Scholar] [CrossRef]
- Xue, J.; Shen, Y.; He, T. Double-perovskites YBaCo2−xFexO5+δ cathodes for intermediate-temperature solid oxide fuel cells. J. Power Sources 2011, 196, 3729–3735. [Google Scholar] [CrossRef]
- Zhou, Q.; Wei, W.C.J.; Guo, Y.; Jia, D. LaSrMnCoO5+δ as cathode for intermediate-temperature solid oxide fuel cells. Electrochem. Commun. 2012, 19, 36–38. [Google Scholar] [CrossRef]
- Aksenova, T.V.; Gavrilova, L.Y.; Yaremchenko, A.A.; Cherepanov, V.A.; Kharton, V.V. Oxygen nonstoichiometry, thermal expansion and high-temperature electrical properties of layered NdBaCo2O5+δ and SmBaCo2O5+δ. Mater. Res. Bull. 2010, 45, 1288–1292. [Google Scholar] [CrossRef]
- Zhao, H.; Zheng, Y.; Yang, C.; Shen, Y.; Du, Z.; Świerczek, K. Electrochemical performance of Pr1−xYxBaCo2O5+δ layered perovskites as cathode materials for intermediate-temperature solid oxide fuel cells. Int. J. Hydrog. Energy 2013, 38, 16365–16372. [Google Scholar] [CrossRef]
- Zhao, L.; Nian, Q.; He, B.; Lin, B.; Ding, H.; Wang, S.; Peng, R.; Meng, G.; Liu, X. Novel layered perovskite oxide PrBaCuCoO5+δ as a potential cathode for intermediate-temperature solid oxide fuel cells. J. Power Sources 2010, 195, 453–456. [Google Scholar] [CrossRef]
- Mogni, L.; Prado, F.; Jiménez, C.; Caneiro, A. Oxygen order-disorder phase transition in layered GdBaCo2O5+δ perovskite: Thermodynamic and transport properties. Solid State Ion. 2013, 240, 19–28. [Google Scholar] [CrossRef]
- Kuroda, C.; Zheng, K.; Świerczek, K. Characterization of novel GdBa0.5Sr0.5Co2−xFexO5+δ perovskites for application in IT-SOFC cells. Int. J. Hydrog. Energy 2013, 38, 1027–1038. [Google Scholar] [CrossRef]
- Tarancón, A.; Burriel, M.; Santiso, J.; Skinner, S.J.; Kilner, J.A. Advances in layered oxide cathodes for intermediate temperature solid oxide fuel cells. J. Mater. Chem. 2010, 20, 3799–3813. [Google Scholar] [CrossRef]
- Hu, Y.; Bouffanais, Y.; Almar, L.; Morata, A.; Tarancon, A.; Dezanneau, G. La2−xSrxCoO4−δ (x = 0.9, 1.0, 1.1) Ruddlesden-Popper-type layered cobaltites as cathode materials for IT-SOFC application. Int. J. Hydrog. Energy 2013, 38, 3064–3072. [Google Scholar] [CrossRef]
- Prado, F.; Mogni, L.; Cuello, G.J.; Caneiro, A. Neutron powder diffraction study at high temperature of the Ruddlesden-Popper phase Sr3Fe2O6+δ. Solid State Ion. 2007, 178, 77–82. [Google Scholar] [CrossRef]
- Flura, A.; Dru, S.; Nicollet, C.; Vibhu, V.; Fourcade, S.; Lebraud, E.; Rougier, A.; Bassat, J.M.; Grenier, J.C. Chemical and structural changes in Ln2NiO4+δ (Ln = La, Pr or Nd) lanthanide nickelates as a function of oxygen partial pressure at high temperature. J. Solid State Chem. 2015, 228, 189–198. [Google Scholar] [CrossRef]
- Amow, G.; Skinner, S.J. Recent developments in Ruddlesden-Popper nickelate systems for solid oxide fuel cell cathodes. J. Solid State Electrochem. 2006, 10, 538–546. [Google Scholar] [CrossRef]
- Amow, G.; Davidson, I.J.; Skinner, S.J. A comparative study of the Ruddlesden-Popper series, Lan+1NinO3n+1 (n = 1, 2 and 3), for solid-oxide fuel-cell cathode applications. Solid State Ion. 2006, 177, 1205–1210. [Google Scholar] [CrossRef]
- Skinner, S.J.; Kilner, J.A. Oxygen diffusion and surface exchange in La2−xSrxNiO4+δ. Solid State Ion. 2000, 135, 709–712. [Google Scholar] [CrossRef]
- Boehm, E.; Bassat, J.M.; Steil, M.C.; Dordor, P.; Mauvy, F.; Grenier, J.C. Oxygen transport properties of La2Ni1−xCuxO4+δ mixed conducting oxides. Solid State Sci. 2003, 5, 973–981. [Google Scholar] [CrossRef]
- Vibhu, V.; Rougier, A.; Nicollet, C.; Flura, A.; Grenier, J.C.; Bassat, J.M. La2−xPrxNiO4+δ as suitable cathodes for metal supported SOFCs. Solid State Ion. 2015, 278, 32–37. [Google Scholar] [CrossRef]
- Kharton, V.V.; Kovalevsky, A.V.; Avdeev, M.; Tsipis, E.V.; Patrakeev, M.V.; Yaremchenko, A.A.; Naumovich, E.N.; Frade, J.R. Chemically induced expansion of La2NiO4+δ-based materials. Chem. Mater. 2007, 19, 2027–2033. [Google Scholar] [CrossRef]
- Boehm, E.; Bassat, J.M.; Dordor, P.; Mauvy, F.; Grenier, J.C.; Stevens, P. Oxygen diffusion and transport properties in non-stoichiometric Ln2−xNiO4+δ oxides. Solid State Ion. 2005, 176, 2717–2725. [Google Scholar] [CrossRef]
- Lee, S.; Lee, K.; Jang, Y.H.; Bae, J. Fabrication of solid oxide fuel cells (SOFCs) by solvent-controlled co-tape casting technique. Int. J. Hydrog. Energy 2017, 42, 1648–1660. [Google Scholar] [CrossRef]
- Dailly, J.; Ancelin, M.; Marrony, M. Long term testing of BCZY-based protonic ceramic fuel cell PCFC: Micro-generation profile and reversible production of hydrogen and electricity. Solid State Ion. 2017, 306, 69–75. [Google Scholar] [CrossRef]
- Mahata, T.; Nair, S.R.; Lenka, R.K.; Sinha, P.K. Fabrication of Ni-YSZ anode supported tubular SOFC through iso-pressing and co-firing route. Int. J. Hydrog. Energy 2012, 37, 3874–3882. [Google Scholar] [CrossRef]
- Ramousse, S.; Menon, M.; Brodersen, K.; Knudsen, J.; Rahbek, U.; Larsen, P.H. Manufacturing of anode-supported SOFC’s: Processing parameters and their influence. ECS Trans. 2007, 7, 317–327. [Google Scholar] [CrossRef]
- Majumdar, S.; Claar, T.; Flandermeyer, B. Stress and Fracture Behavior of Monolithic Fuel Cell Tapes. J. Am. Ceram. Soc. 1986, 69, 628–633. [Google Scholar] [CrossRef]
- Prakash, B.S.; Kumar, S.S.; Aruna, S.T. Properties and development of Ni/YSZ as an anode material in solid oxide fuel cell: A review. Renew. Sustain. Energy Rev. 2014, 36, 149–179. [Google Scholar] [CrossRef]
- Nasani, N.; Wang, Z.J.; Willinger, M.G.; Yaremchenko, A.A.; Fagg, D.P. In-situ redox cycling behaviour of NieBaZr0.85Y0.15O3−δ cermet anodes for Protonic Ceramic Fuel Cells. Int. J. Hydrog. Energy 2014, 39, 19780–19788. [Google Scholar] [CrossRef]
- Onishi, T.; Han, D.; Noda, Y.; Hatada, N.; Majima, M.; Uda, T. Evaluation of performance and durability of Ni-BZY cermet electrodes with BZY electrolyte. Solid State Ion. 2018, 317, 127–135. [Google Scholar] [CrossRef]
- Sažinas, R.; Einarsrud, M.A.; Grande, T. Toughening of Y-doped BaZrO3 proton conducting electrolytes by hydration. J. Mater. Chem. A 2017, 5, 5846–5857. [Google Scholar] [CrossRef]
- Zhang, Y.; Xia, C. A durability model for solid oxide fuel cell electrodes in thermal cycle processes. J. Power Sources 2010, 195, 6611–6618. [Google Scholar] [CrossRef]
- Lee, K.T.; Vito, N.J.; Wachsman, E.D. Comprehensive quantification of Ni-Gd0.1Ce0.9O1.95 anode functional layer microstructures by three-dimensional reconstruction using a FIB/SEM dual beam system. J. Power Sources 2013, 228, 220–228. [Google Scholar] [CrossRef]
- Atkinson, A.; Barnett, S.; Gorte, R.J.; Irvine, J.T.S.; McEvoy, A.J.; Mogensen, M.; Singhal, S.C.; Vohs, J. Advanced anodes for high-temperature fuel cells. Nat. Mater. 2004, 3, 17–27. [Google Scholar] [CrossRef] [PubMed] [Green Version]
- Zhu, W.Z.; Deevi, S.C. A review on the status of anode materials for solid oxide fuel cells. Mater. Sci. Eng. A 2003, 362, 228–239. [Google Scholar] [CrossRef]
- Lee, S.; Park, I.; Lee, H.; Shin, D. Continuously gradient anode functional layer for BCZY based proton-conducting fuel cells. Int. J. Hydrog. Energy 2014, 39, 14342–14348. [Google Scholar] [CrossRef]
- Anandakumar, G.; Li, N.; Verma, A.; Singh, P.; Kim, J.H. Thermal stress and probability of failure analyses of functionally graded solid oxide fuel cells. J. Power Sources 2010, 195, 6659–6670. [Google Scholar] [CrossRef]
- Dippon, M.; Babiniec, S.M.; Ding, H.; Ricote, S.; Sullivan, N.P. Exploring electronic conduction through BaCexZr0.9−xY0.1O3-d proton-conducting ceramics. Solid State Ion. 2016, 286. [Google Scholar] [CrossRef]
- Biswas, S.; Nithyanantham, T.; Nambiappan Thangavel, S.; Bandopadhyay, S. High-temperature mechanical properties of reduced NiO–8YSZ anode-supported bi-layer SOFC structures in ambient air and reducing environments. Ceram. Int. 2013, 39, 3103–3111. [Google Scholar] [CrossRef]
- Patki, N.S.; Manerbino, A.; Way, J.D.; Ricote, S. Galvanic hydrogen pumping performance of copper electrodes fabricated by electroless plating on a BaZr0.9−xCexY0.1O3−δ proton-conducting ceramic membrane. Solid State Ion. 2018, 317, 256–262. [Google Scholar] [CrossRef]
- Stange, M.; Stefan, E.; Denonville, C.; Larring, Y.; Rørvik, P.M.; Haugsrud, R. Development of novel metal-supported proton ceramic electrolyser cell with thin film BZY15–Ni electrode and BZY15 electrolyte. Int. J. Hydrog. Energy 2017, 42, 13454–13462. [Google Scholar] [CrossRef]
Figure 1.
Linear expansion of BaZr1−xYxO3−δ (BZY) as a function of temperature under humid conditions ( = 0.03 atm) for 10–20 mol% yttrium and = 0.042 in (a) and the corresponding thermal, chemical and thermochemical expansion coefficients in (b). The expansion of BZY under dry conditions (no chemical expansion) is given for reference. The linear thermal expansion coefficient is consistently 8 × 10⁻⁶ K−1.
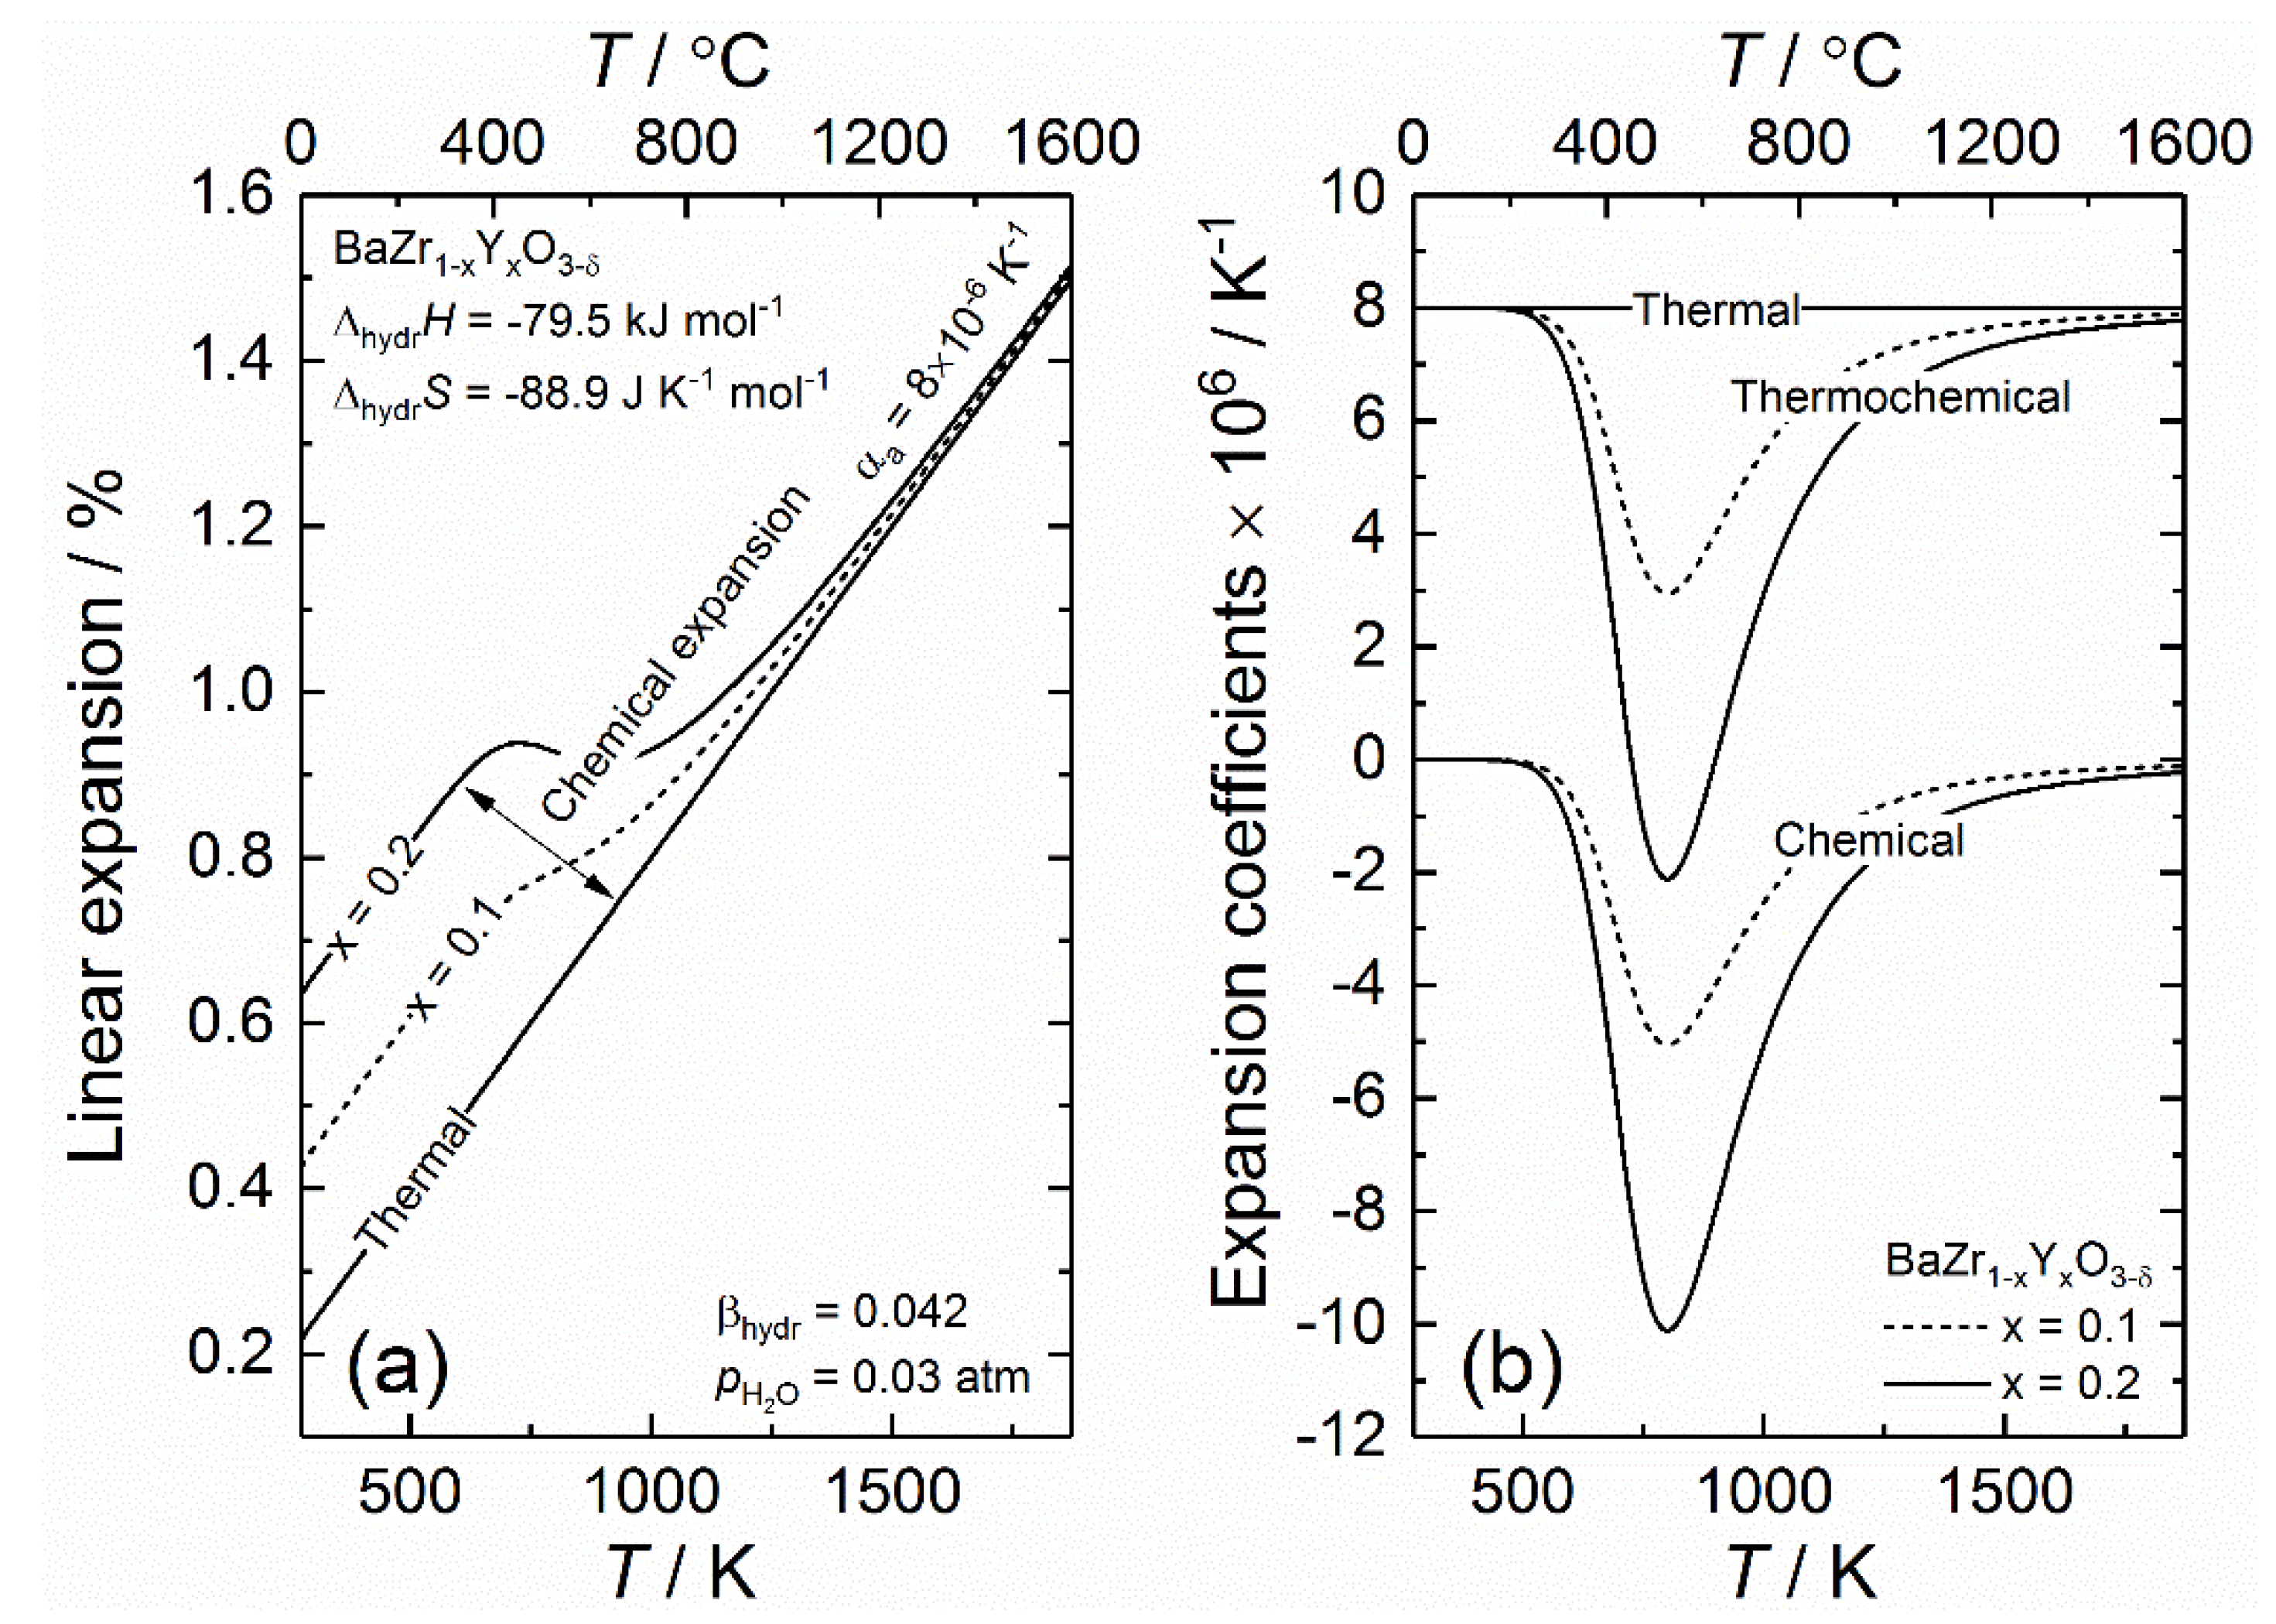
Figure 2.
Linear expansion of La1−xSrxCo0.2Fe0.8O3−δ (LSCF) as a function of temperature in air ( = 0.21 atm) for 20 mol% and 40 mol% strontium and = 0.031 in (a) and the corresponding thermal, chemical and thermochemical expansion coefficients in (b). Pure thermal expansion of LSCF (no chemical expansion) is given for reference. The linear thermal expansion coefficient is consistently set to 14 × 10−6 K−1.

Figure 3.
Linear expansion (a) and its corresponding first order derivative in (b), plotted as a function of temperature for YSZ for all cooling rates (1–20 K min−1), dry Ar.
Figure 3.
Linear expansion (a) and its corresponding first order derivative in (b), plotted as a function of temperature for YSZ for all cooling rates (1–20 K min−1), dry Ar.

Figure 4.
Linear expansion (a) and its corresponding first order derivative (b) plotted as a function of temperature for BZCY72 for all heating rates except 20 K min−1 (1–10 K min−1), dry Ar.
Figure 4.
Linear expansion (a) and its corresponding first order derivative (b) plotted as a function of temperature for BZCY72 for all heating rates except 20 K min−1 (1–10 K min−1), dry Ar.

Figure 5.
Experimentally determined chemical expansion coefficients upon hydration per mol H2O, , for BaZr1−xYxO3−δ as a function of the proton concentration, in the top panel, along with the corresponding linear expansion of the lattice in the bottom panel [77,78,80]. The solid lines are based on an exponential decay function fitted to all values of (top panel) and the same function is used to express the linear expansion (bottom panel). The dashed lines represent the chemical expansion when is constant (0.136).

Figure 6.
Linear thermal expansion coefficients for Ba-based perovskites from Table 2 and Table 3 as a function of the Goldschmidt tolerance factor in (a), while (b) shows the same coefficients plotted versus the deviation from the perfect cubic structure, defined as the absolute value of (tolerance factor—1).

Figure 7.
Linear thermal expansion coefficients of the A2B2O7 oxides as a function of their cation radii ratio. The coefficients have been taken from Table 6 and the uncertainties represent the respective ranges in values given.
Figure 7.
Linear thermal expansion coefficients of the A2B2O7 oxides as a function of their cation radii ratio. The coefficients have been taken from Table 6 and the uncertainties represent the respective ranges in values given.

Figure 8.
Linear thermal expansion coefficients of Ba1−xSrxCo0.8Fe0.2O3−δ (BSCF) as a function of Sr-content, x. All values are summarized in Table 8 along with the references used. We have used average values for the data by Kriegel et al. [354] and McIntosh et al. [353].

Figure 9.
Linear thermal expansion coefficients of La1−xSrxCo0.2Fe0.8O3−δ (LSCF) as a function of Sr-content, x. All values are summarized in Table 9 along with the references used. Average values have been used for studies where only ranges in the thermal expansion coefficient are provided.
Figure 9.
Linear thermal expansion coefficients of La1−xSrxCo0.2Fe0.8O3−δ (LSCF) as a function of Sr-content, x. All values are summarized in Table 9 along with the references used. Average values have been used for studies where only ranges in the thermal expansion coefficient are provided.

Figure 10.
Thermal expansion coefficients (α) of (a) NiO, YSZ, YSZ/NiO with 52 vol% NiO, Ni and YSZ/Ni with 40 vol% Ni [131] and (b) NiO, BZCY72 (from Figure 4b), BZCY72/NiO with 52 vol% NiO and Ni. Note that the thermal expansion coefficient for the cermet BZCY72/Ni is not included as described in the text.

Figure 11.
Summary of the different strategies when cells are failing due to mismatch between the expansion coefficients of the different layers.
Figure 11.
Summary of the different strategies when cells are failing due to mismatch between the expansion coefficients of the different layers.


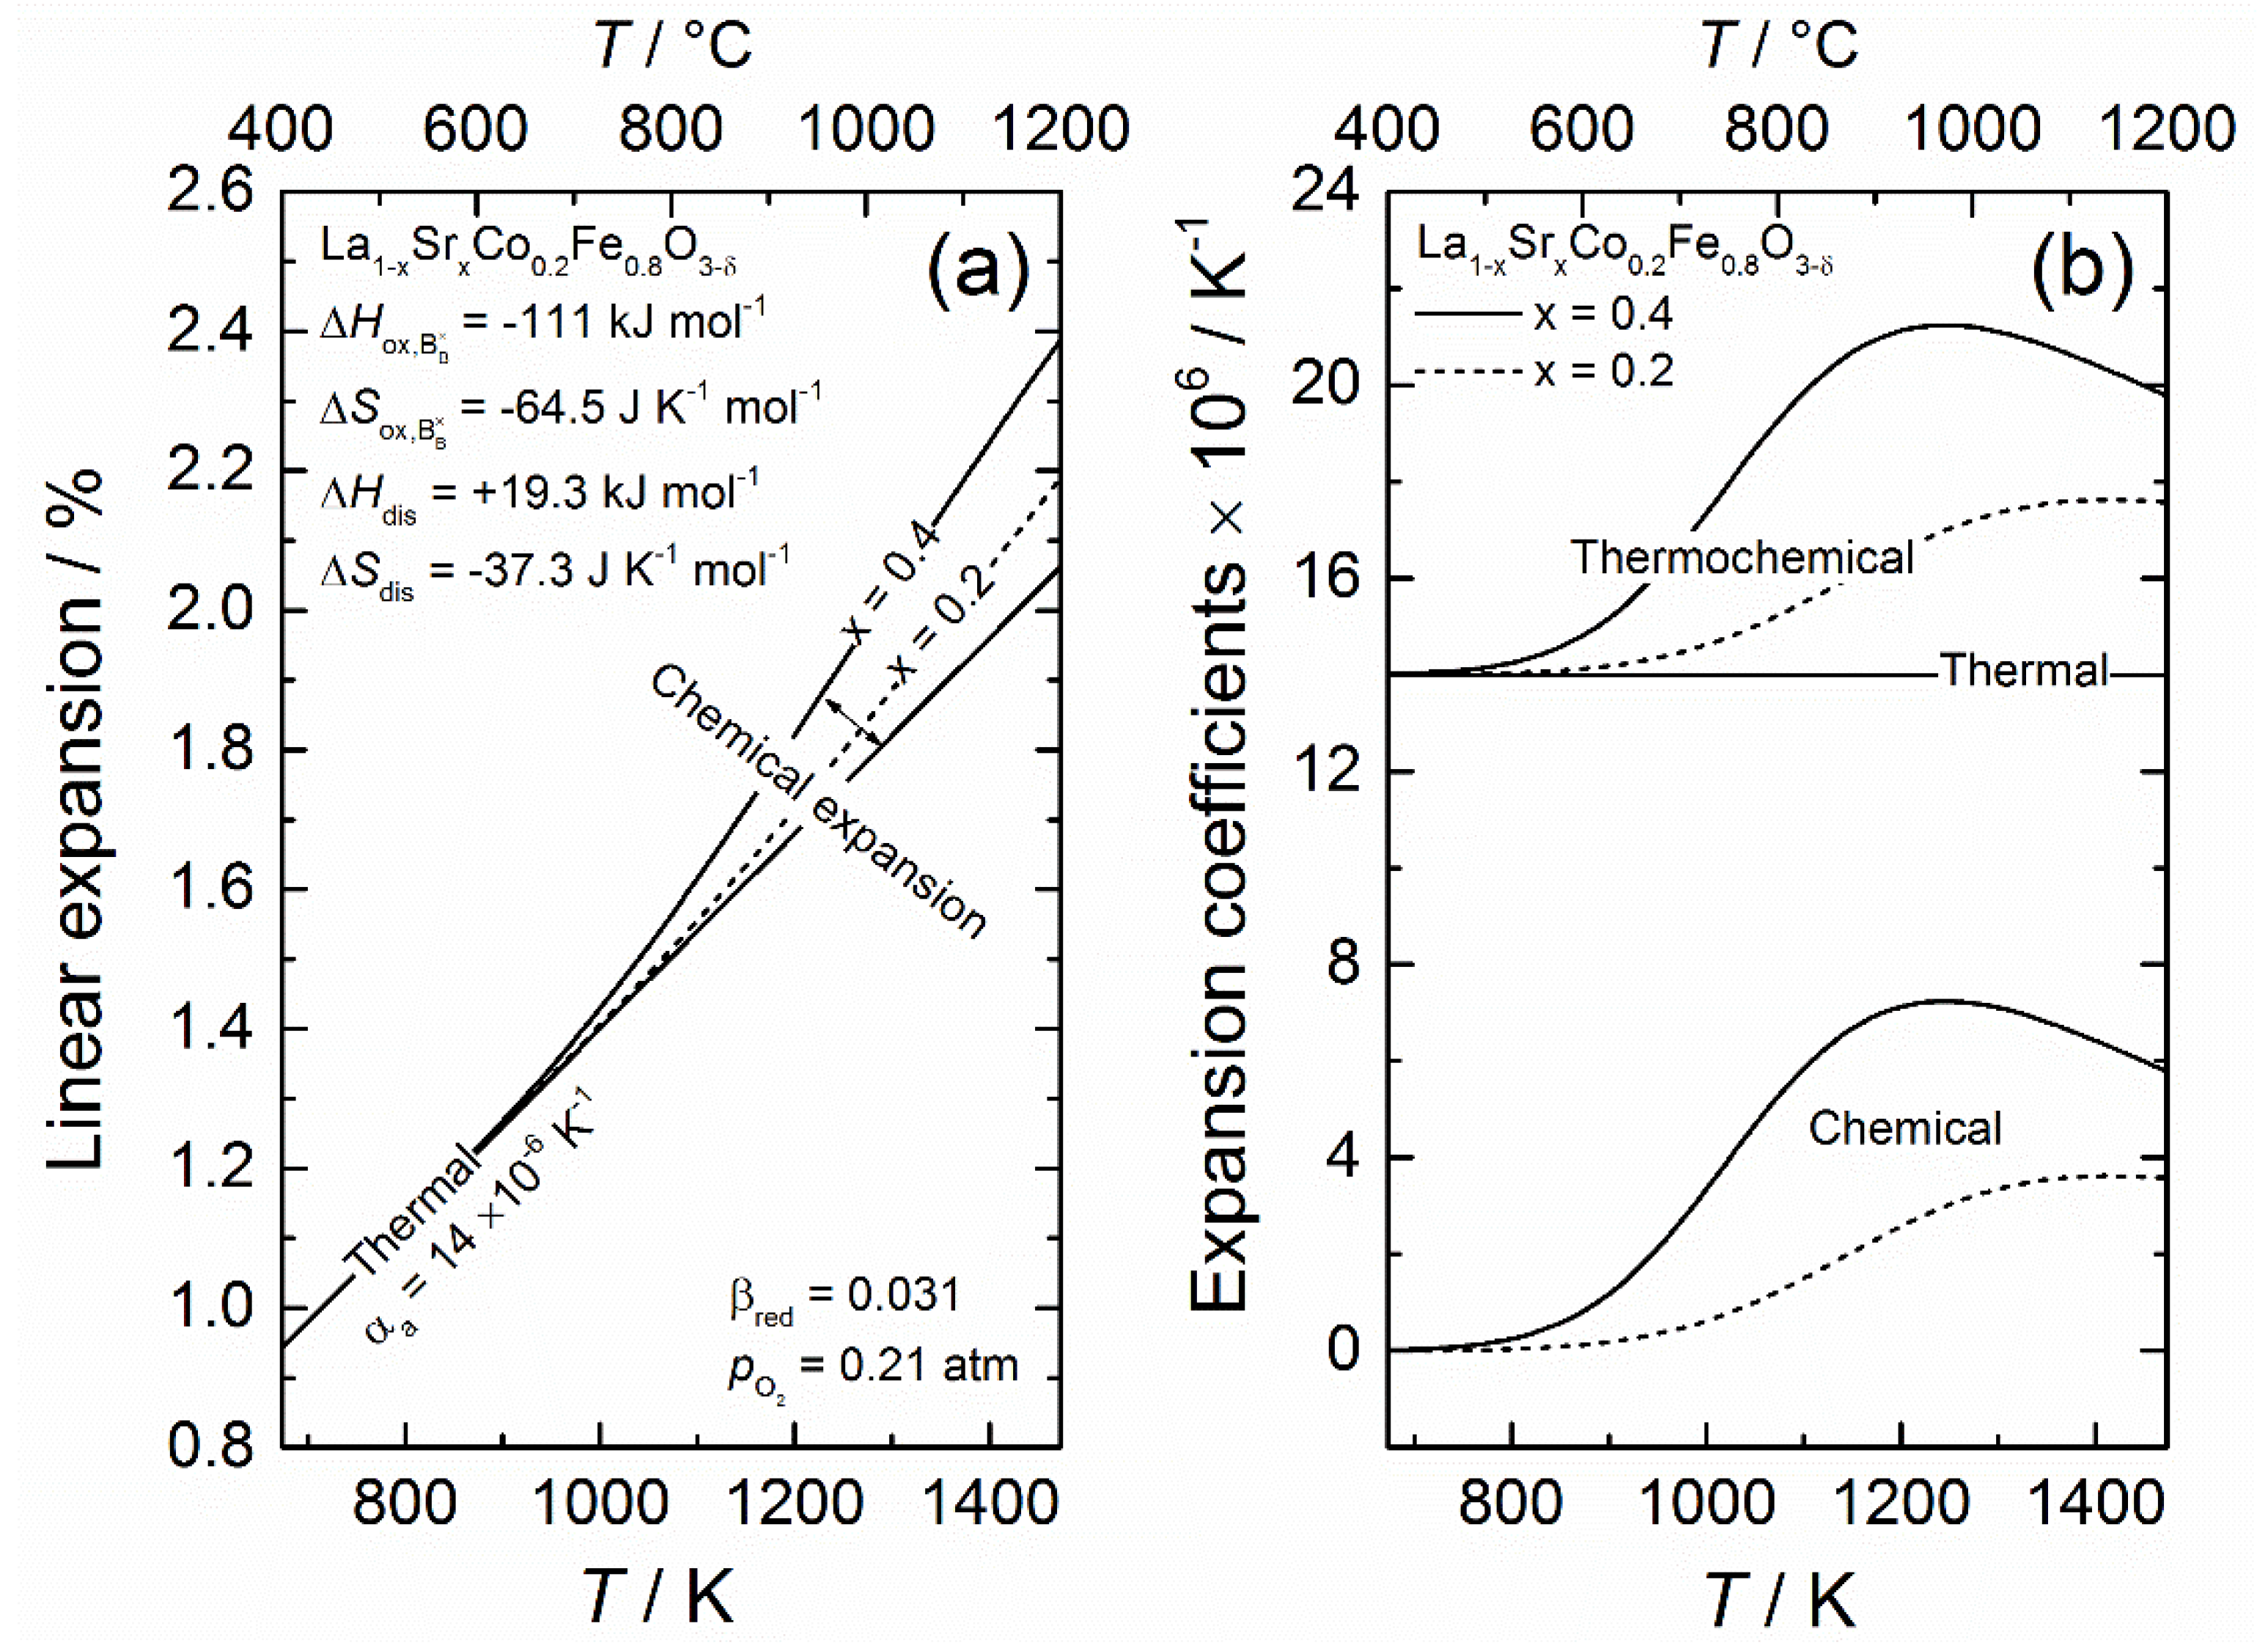
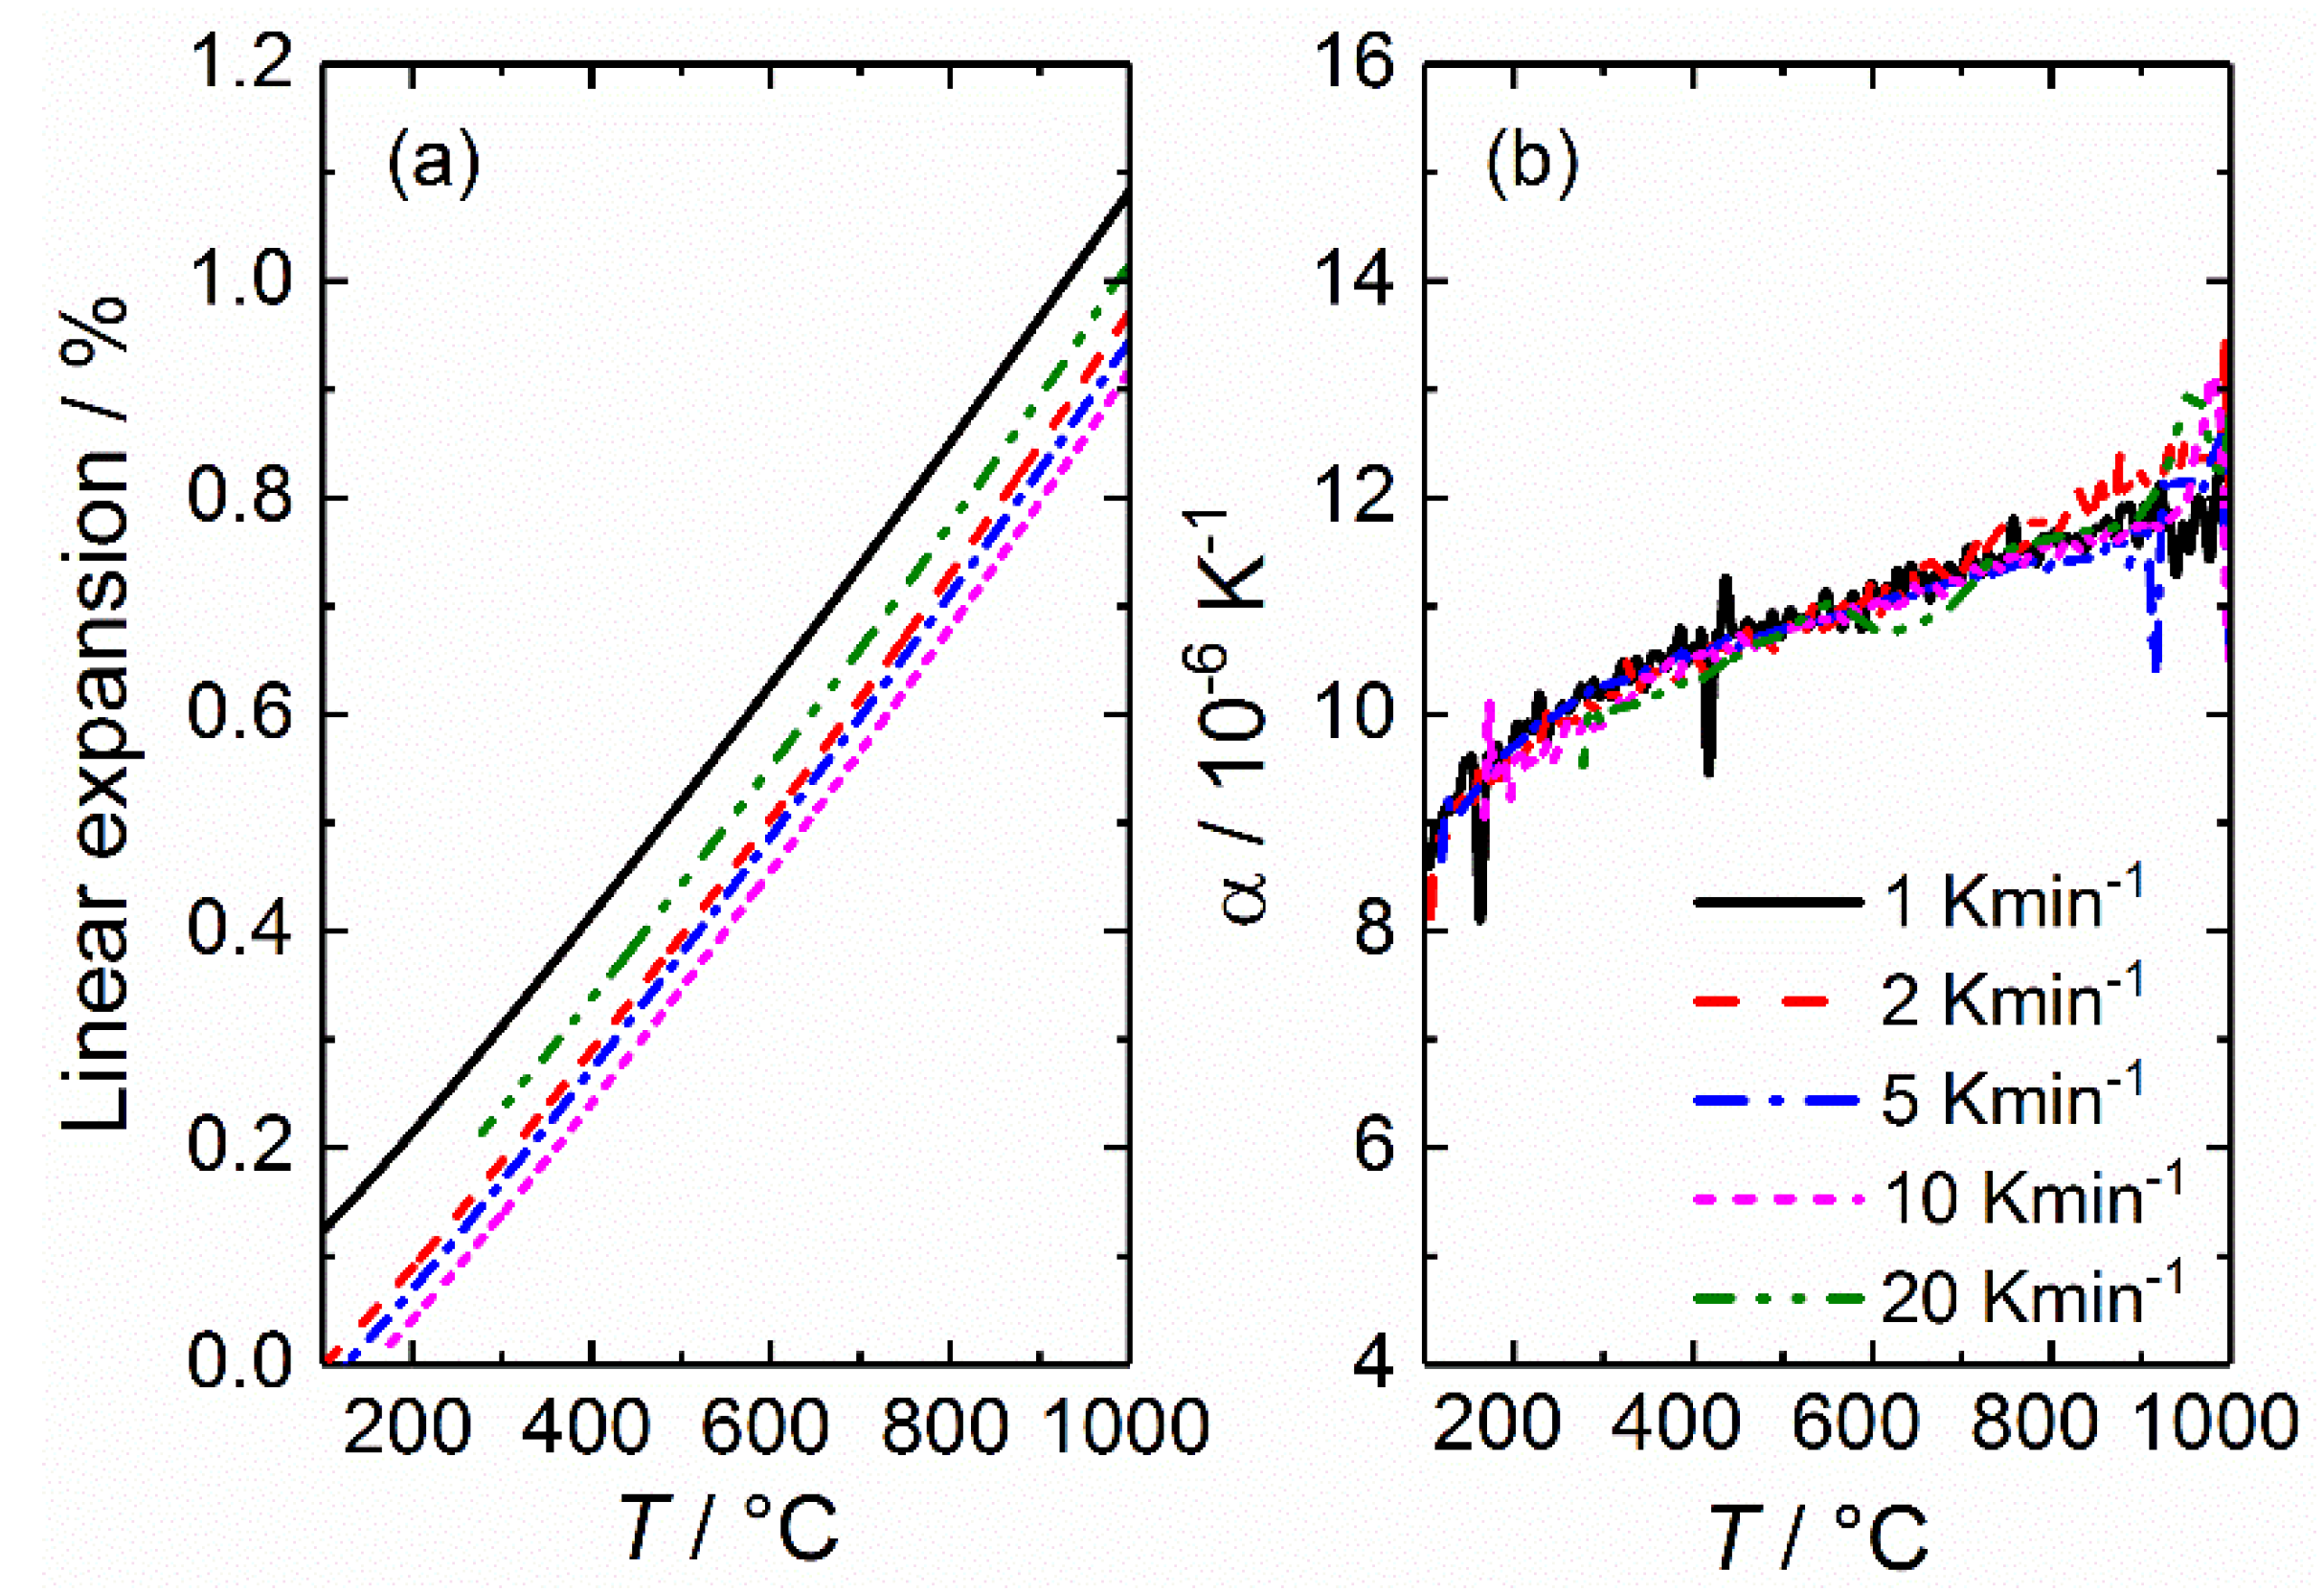
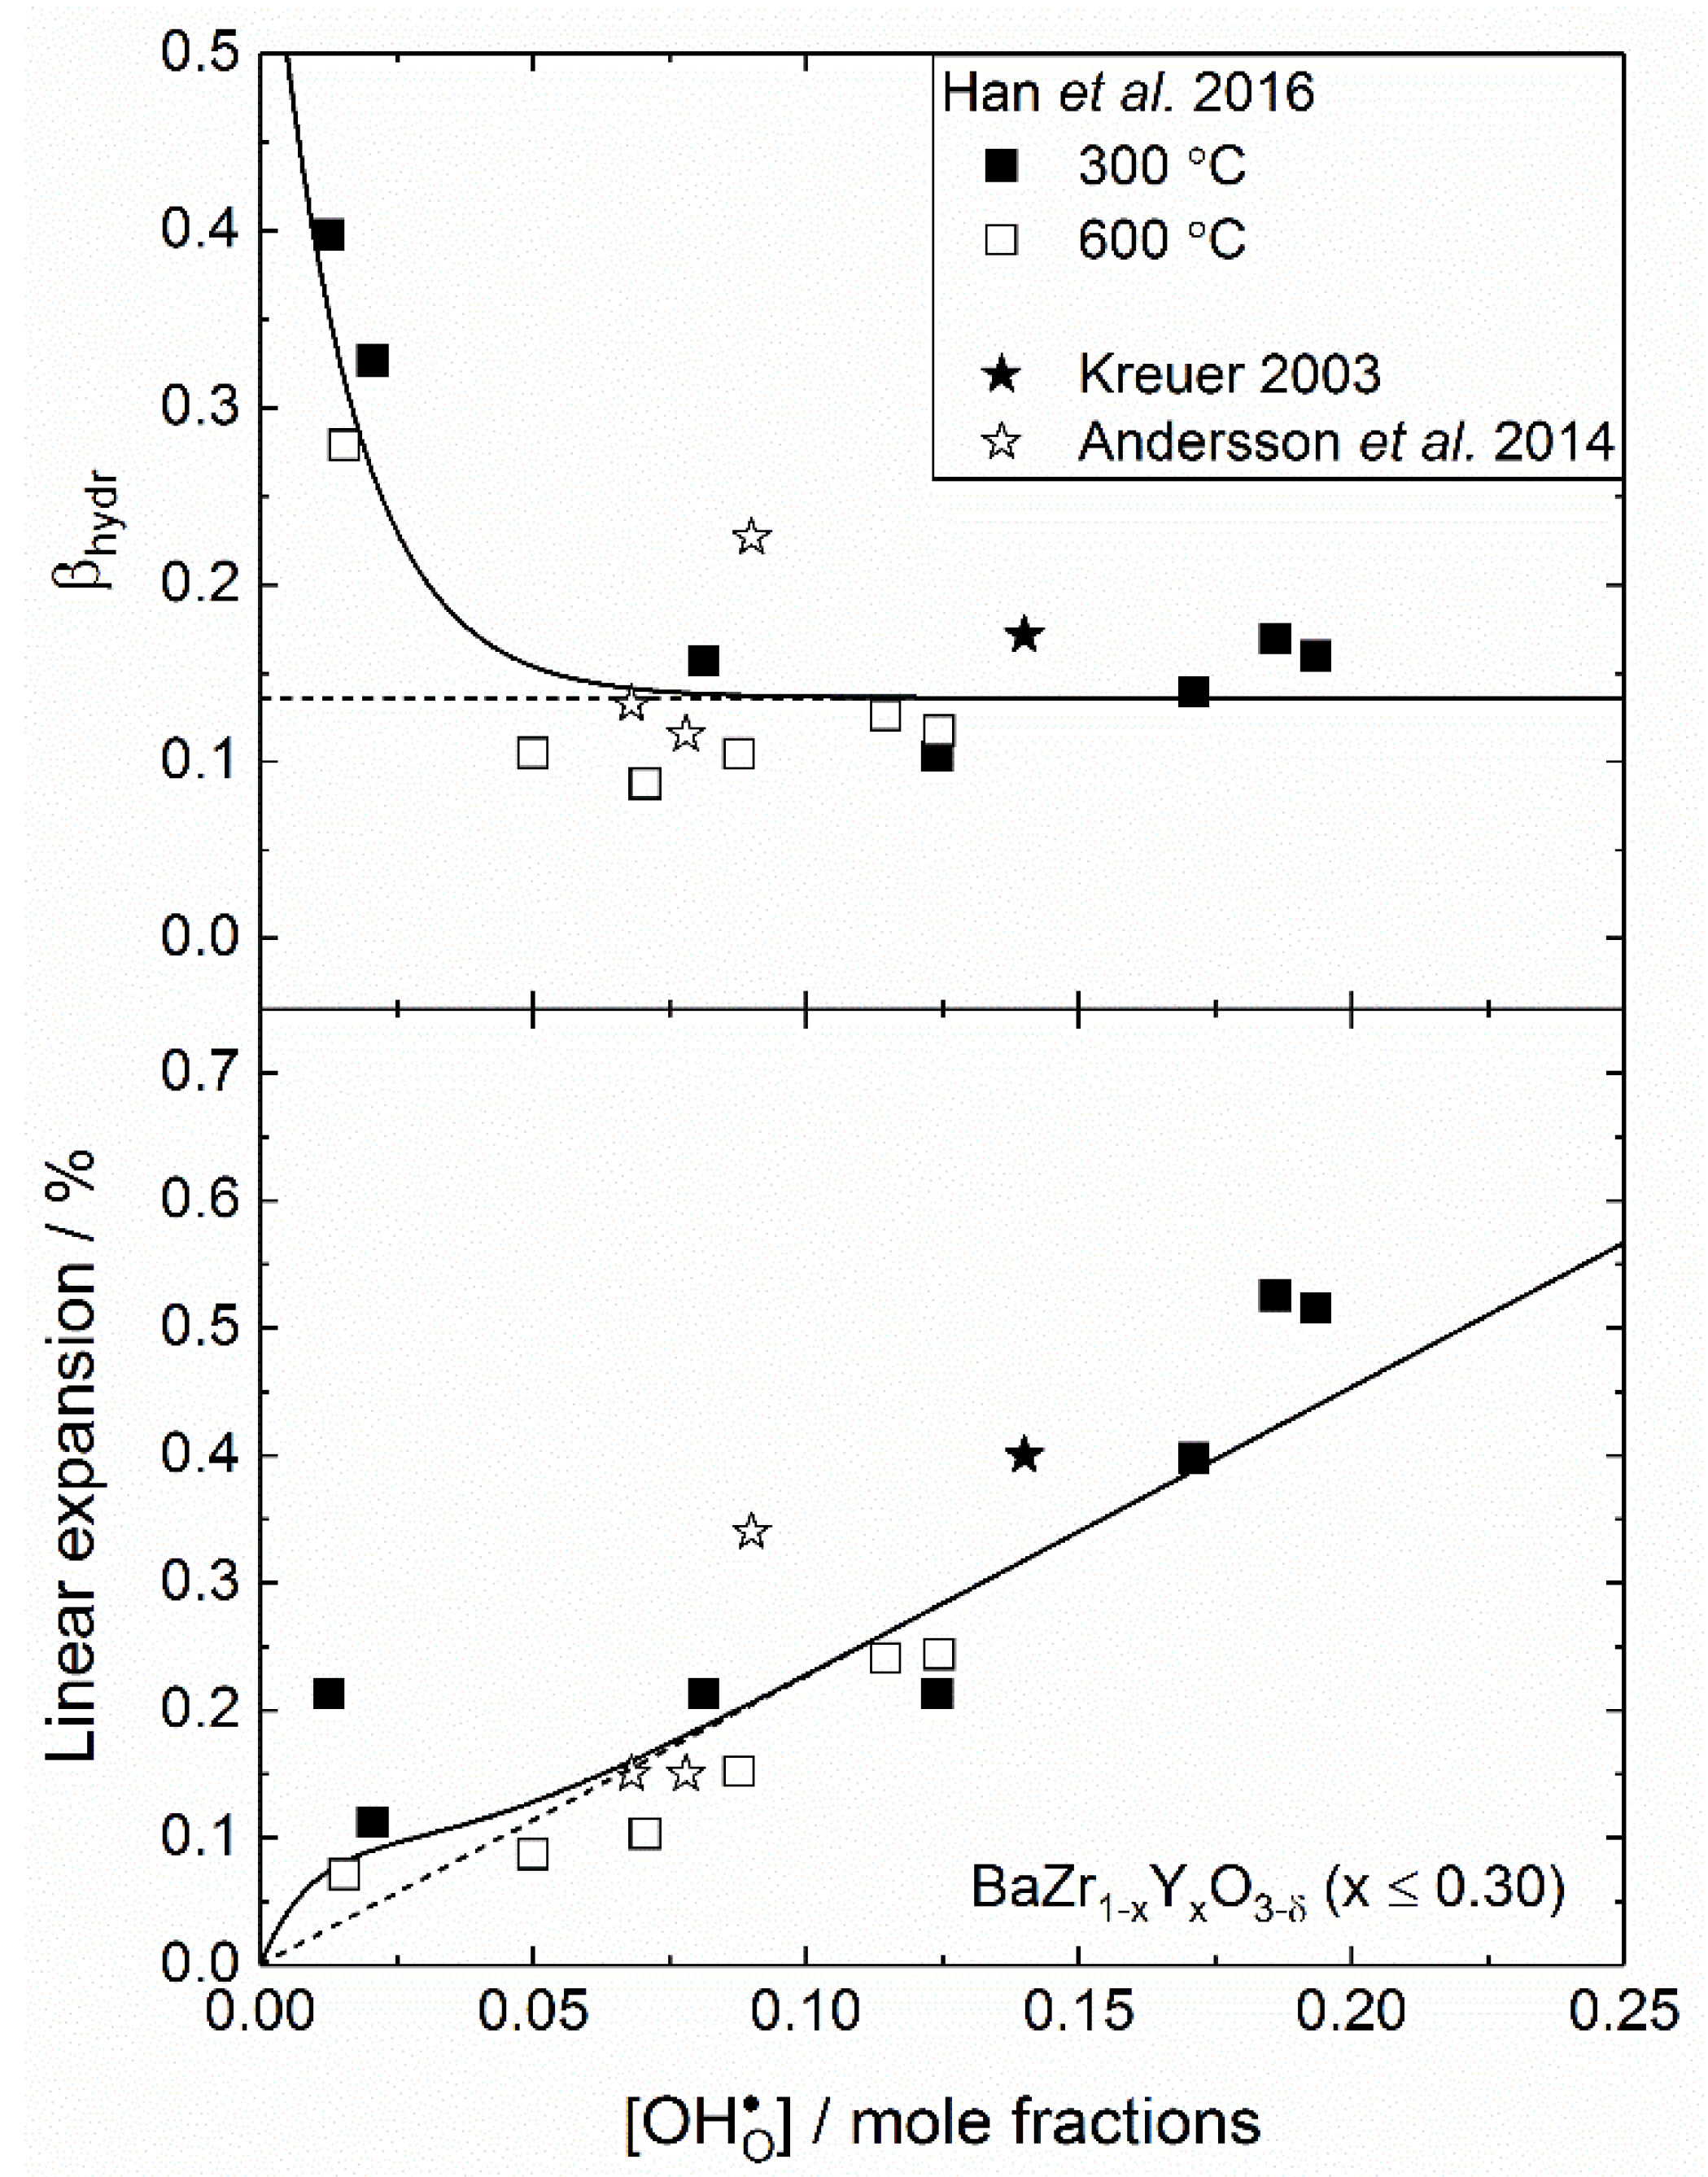
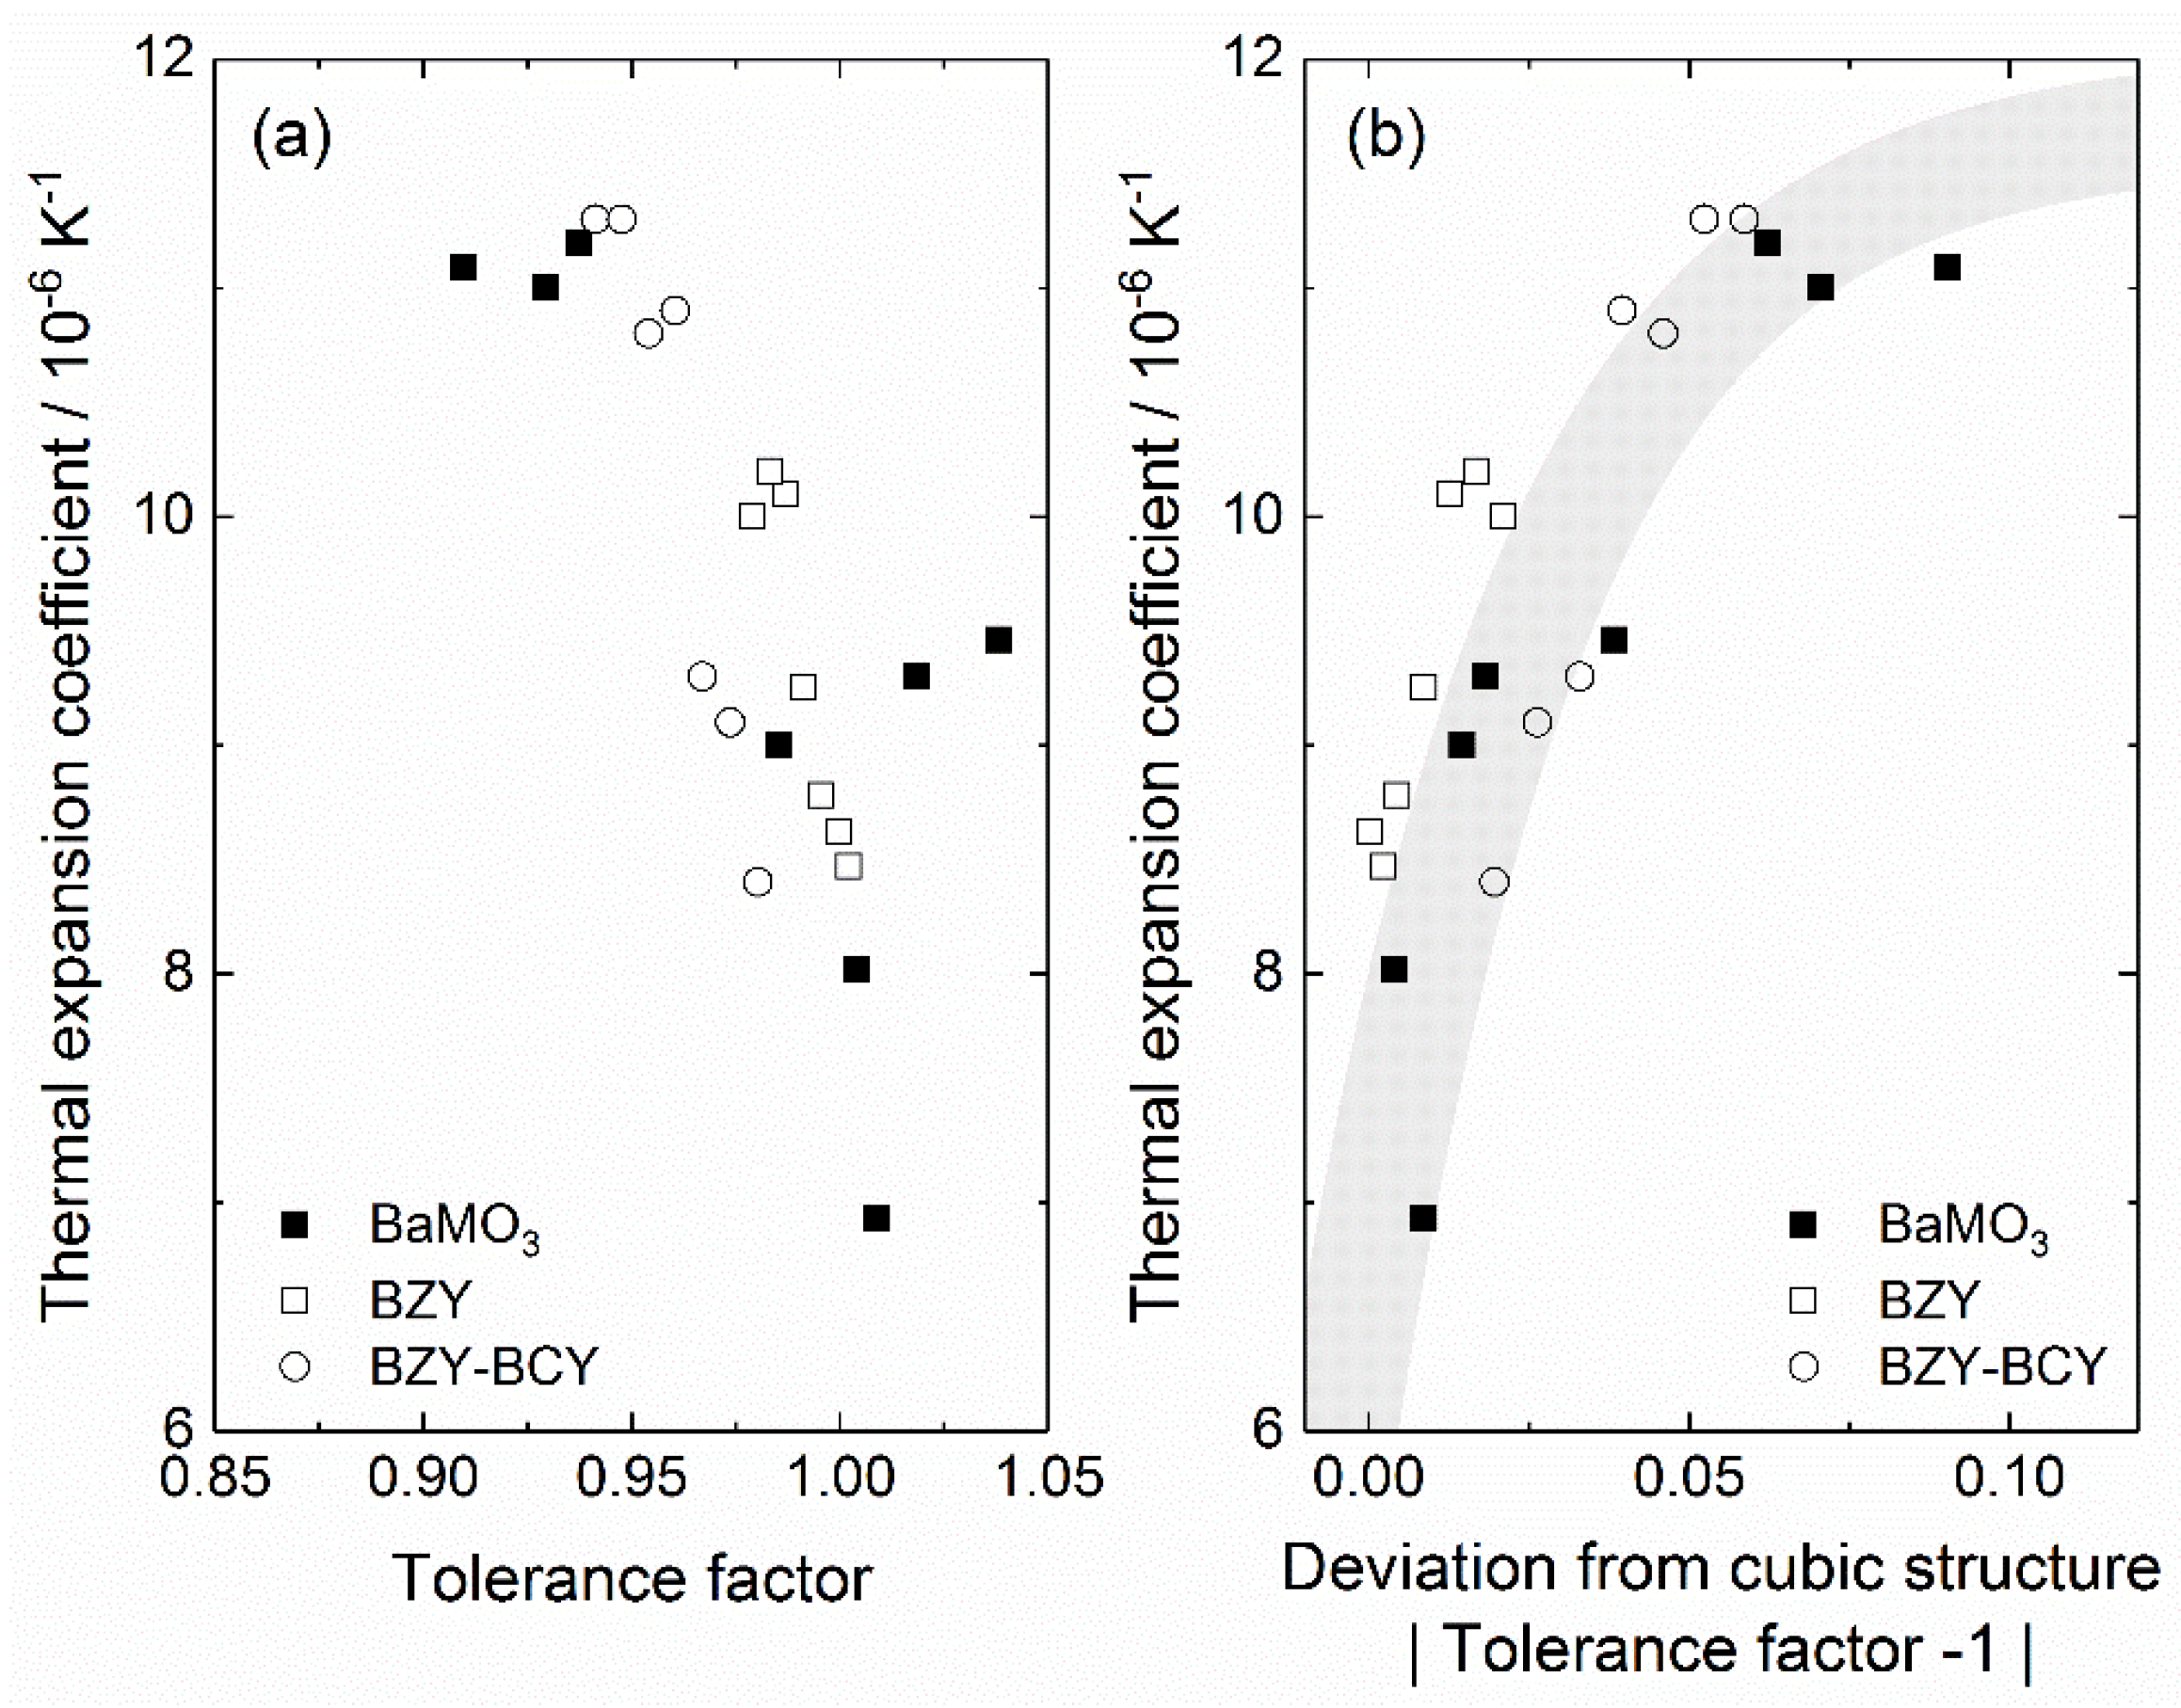
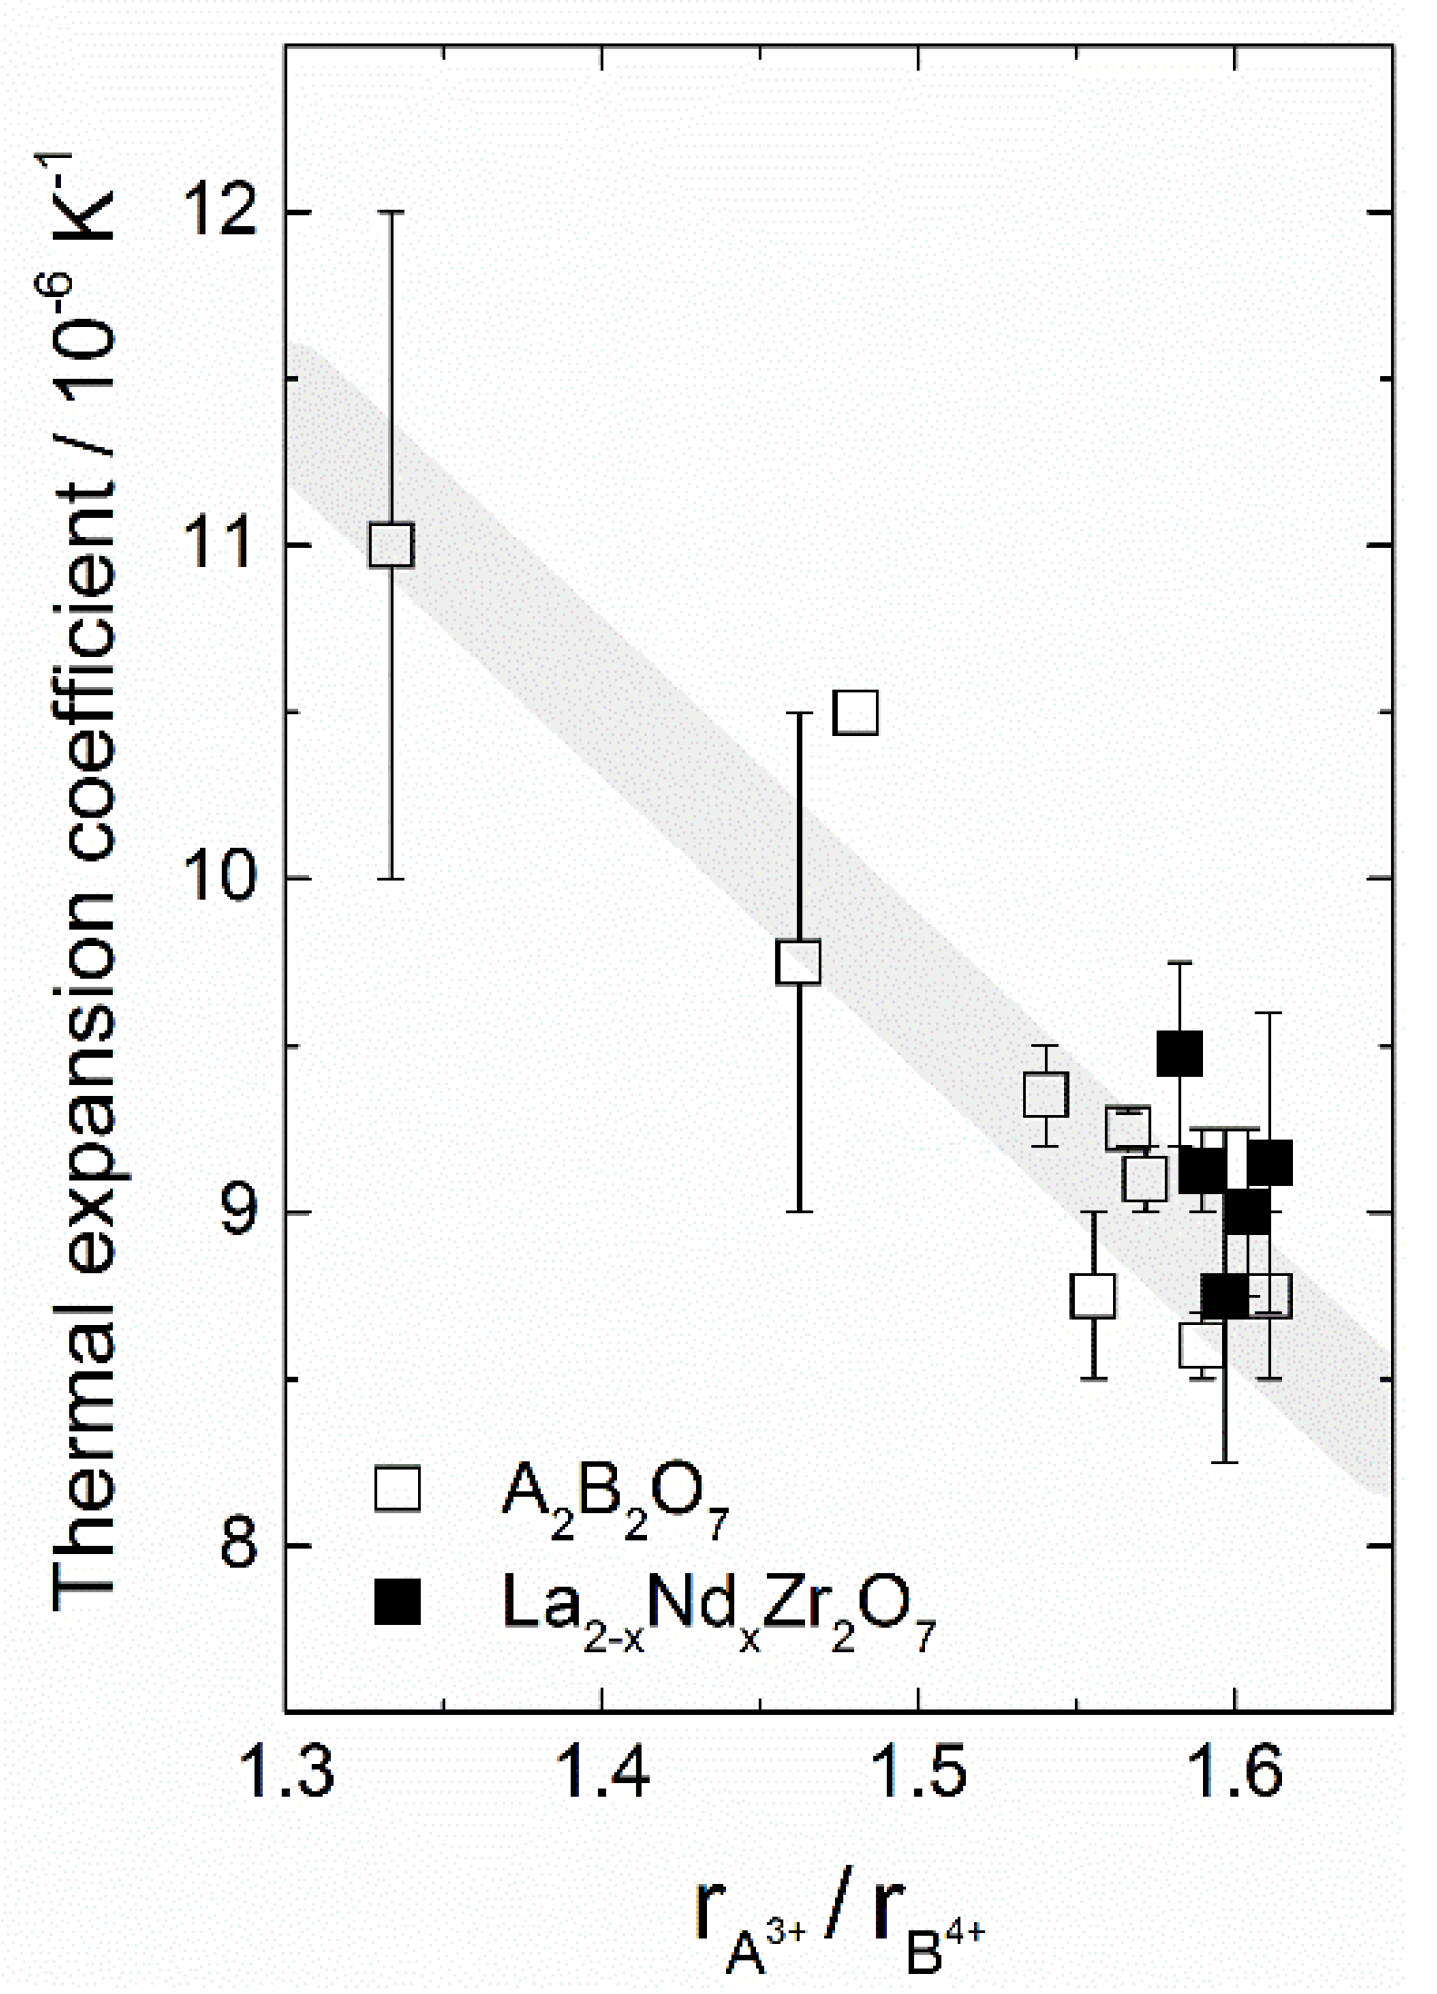
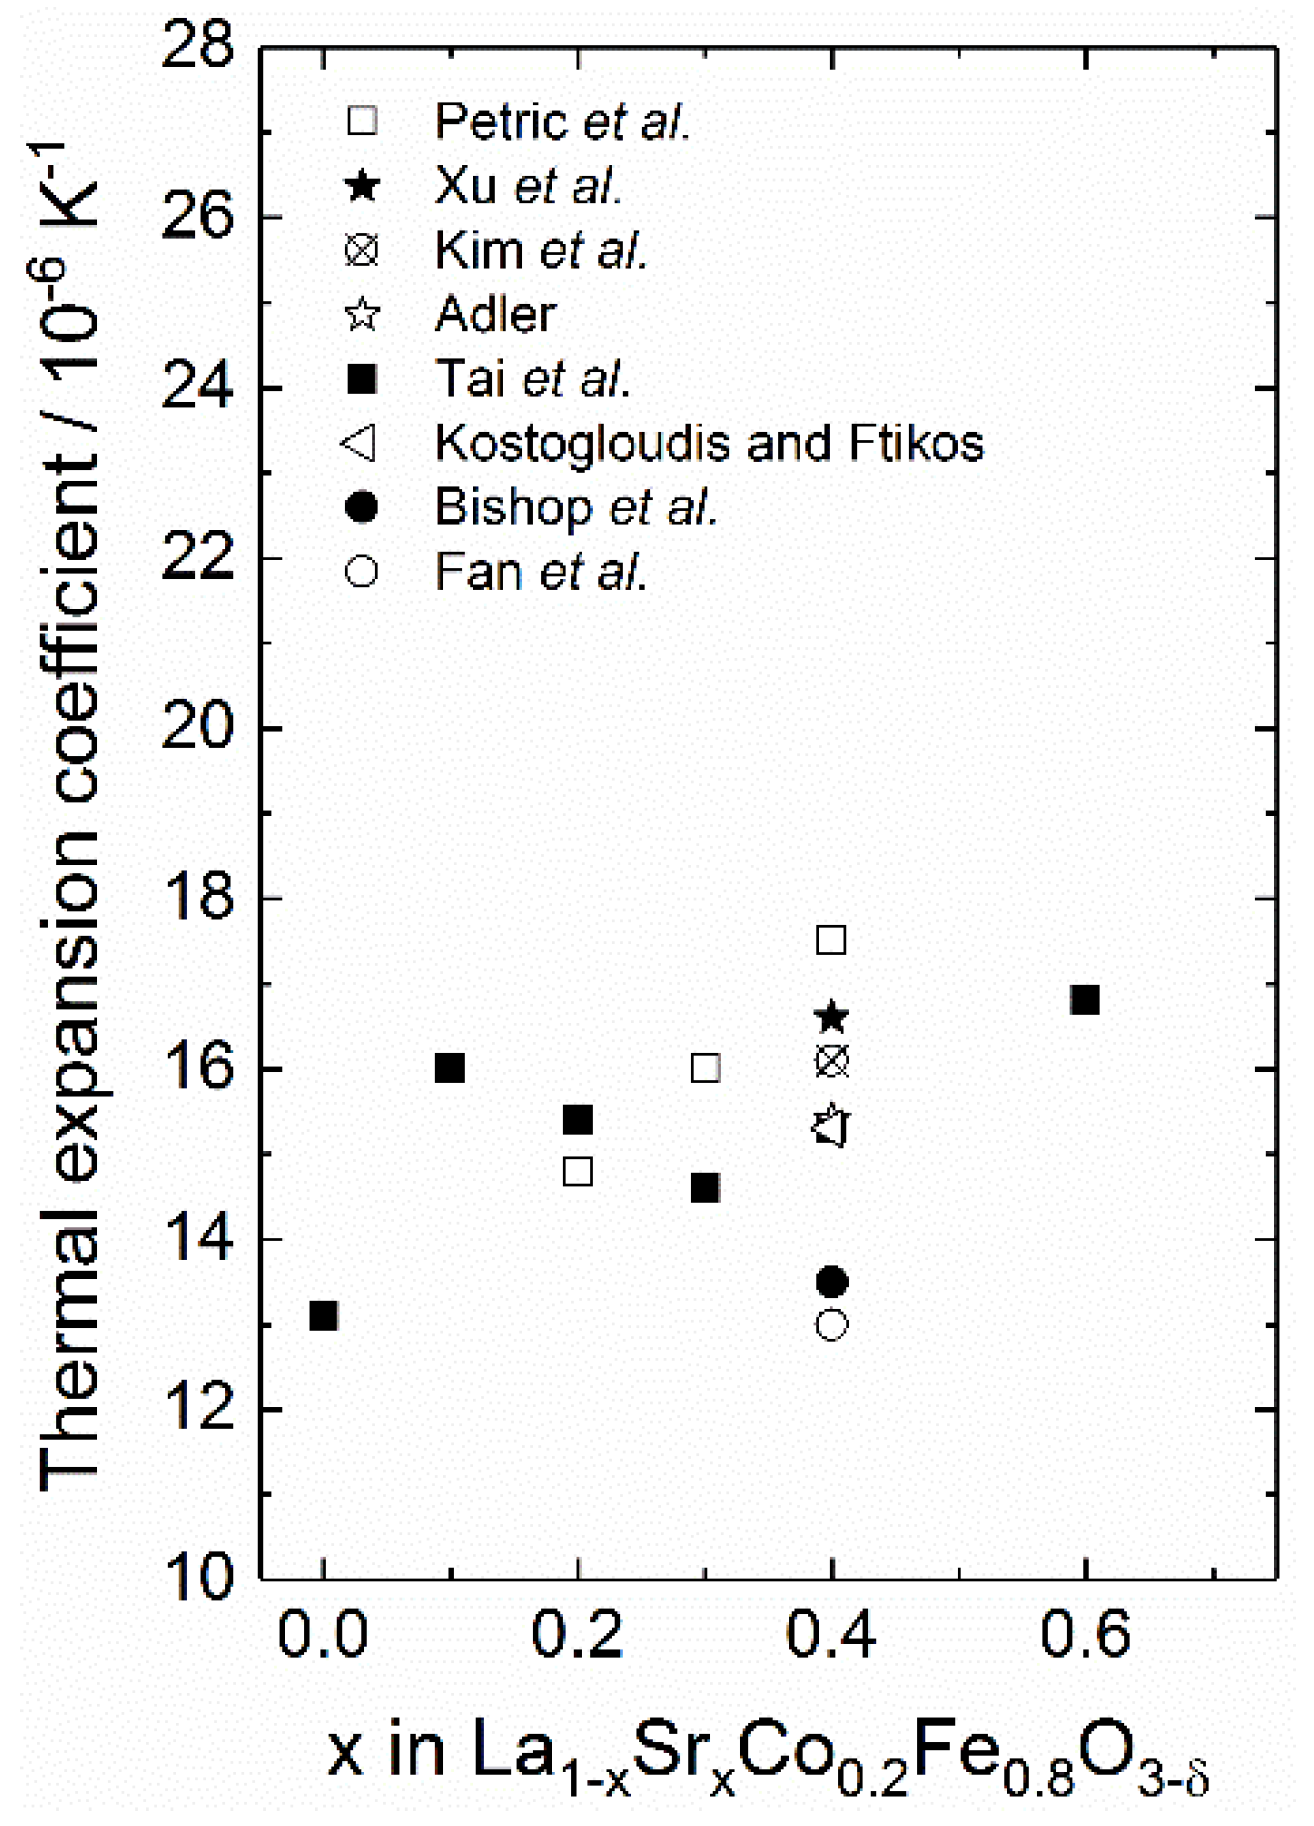
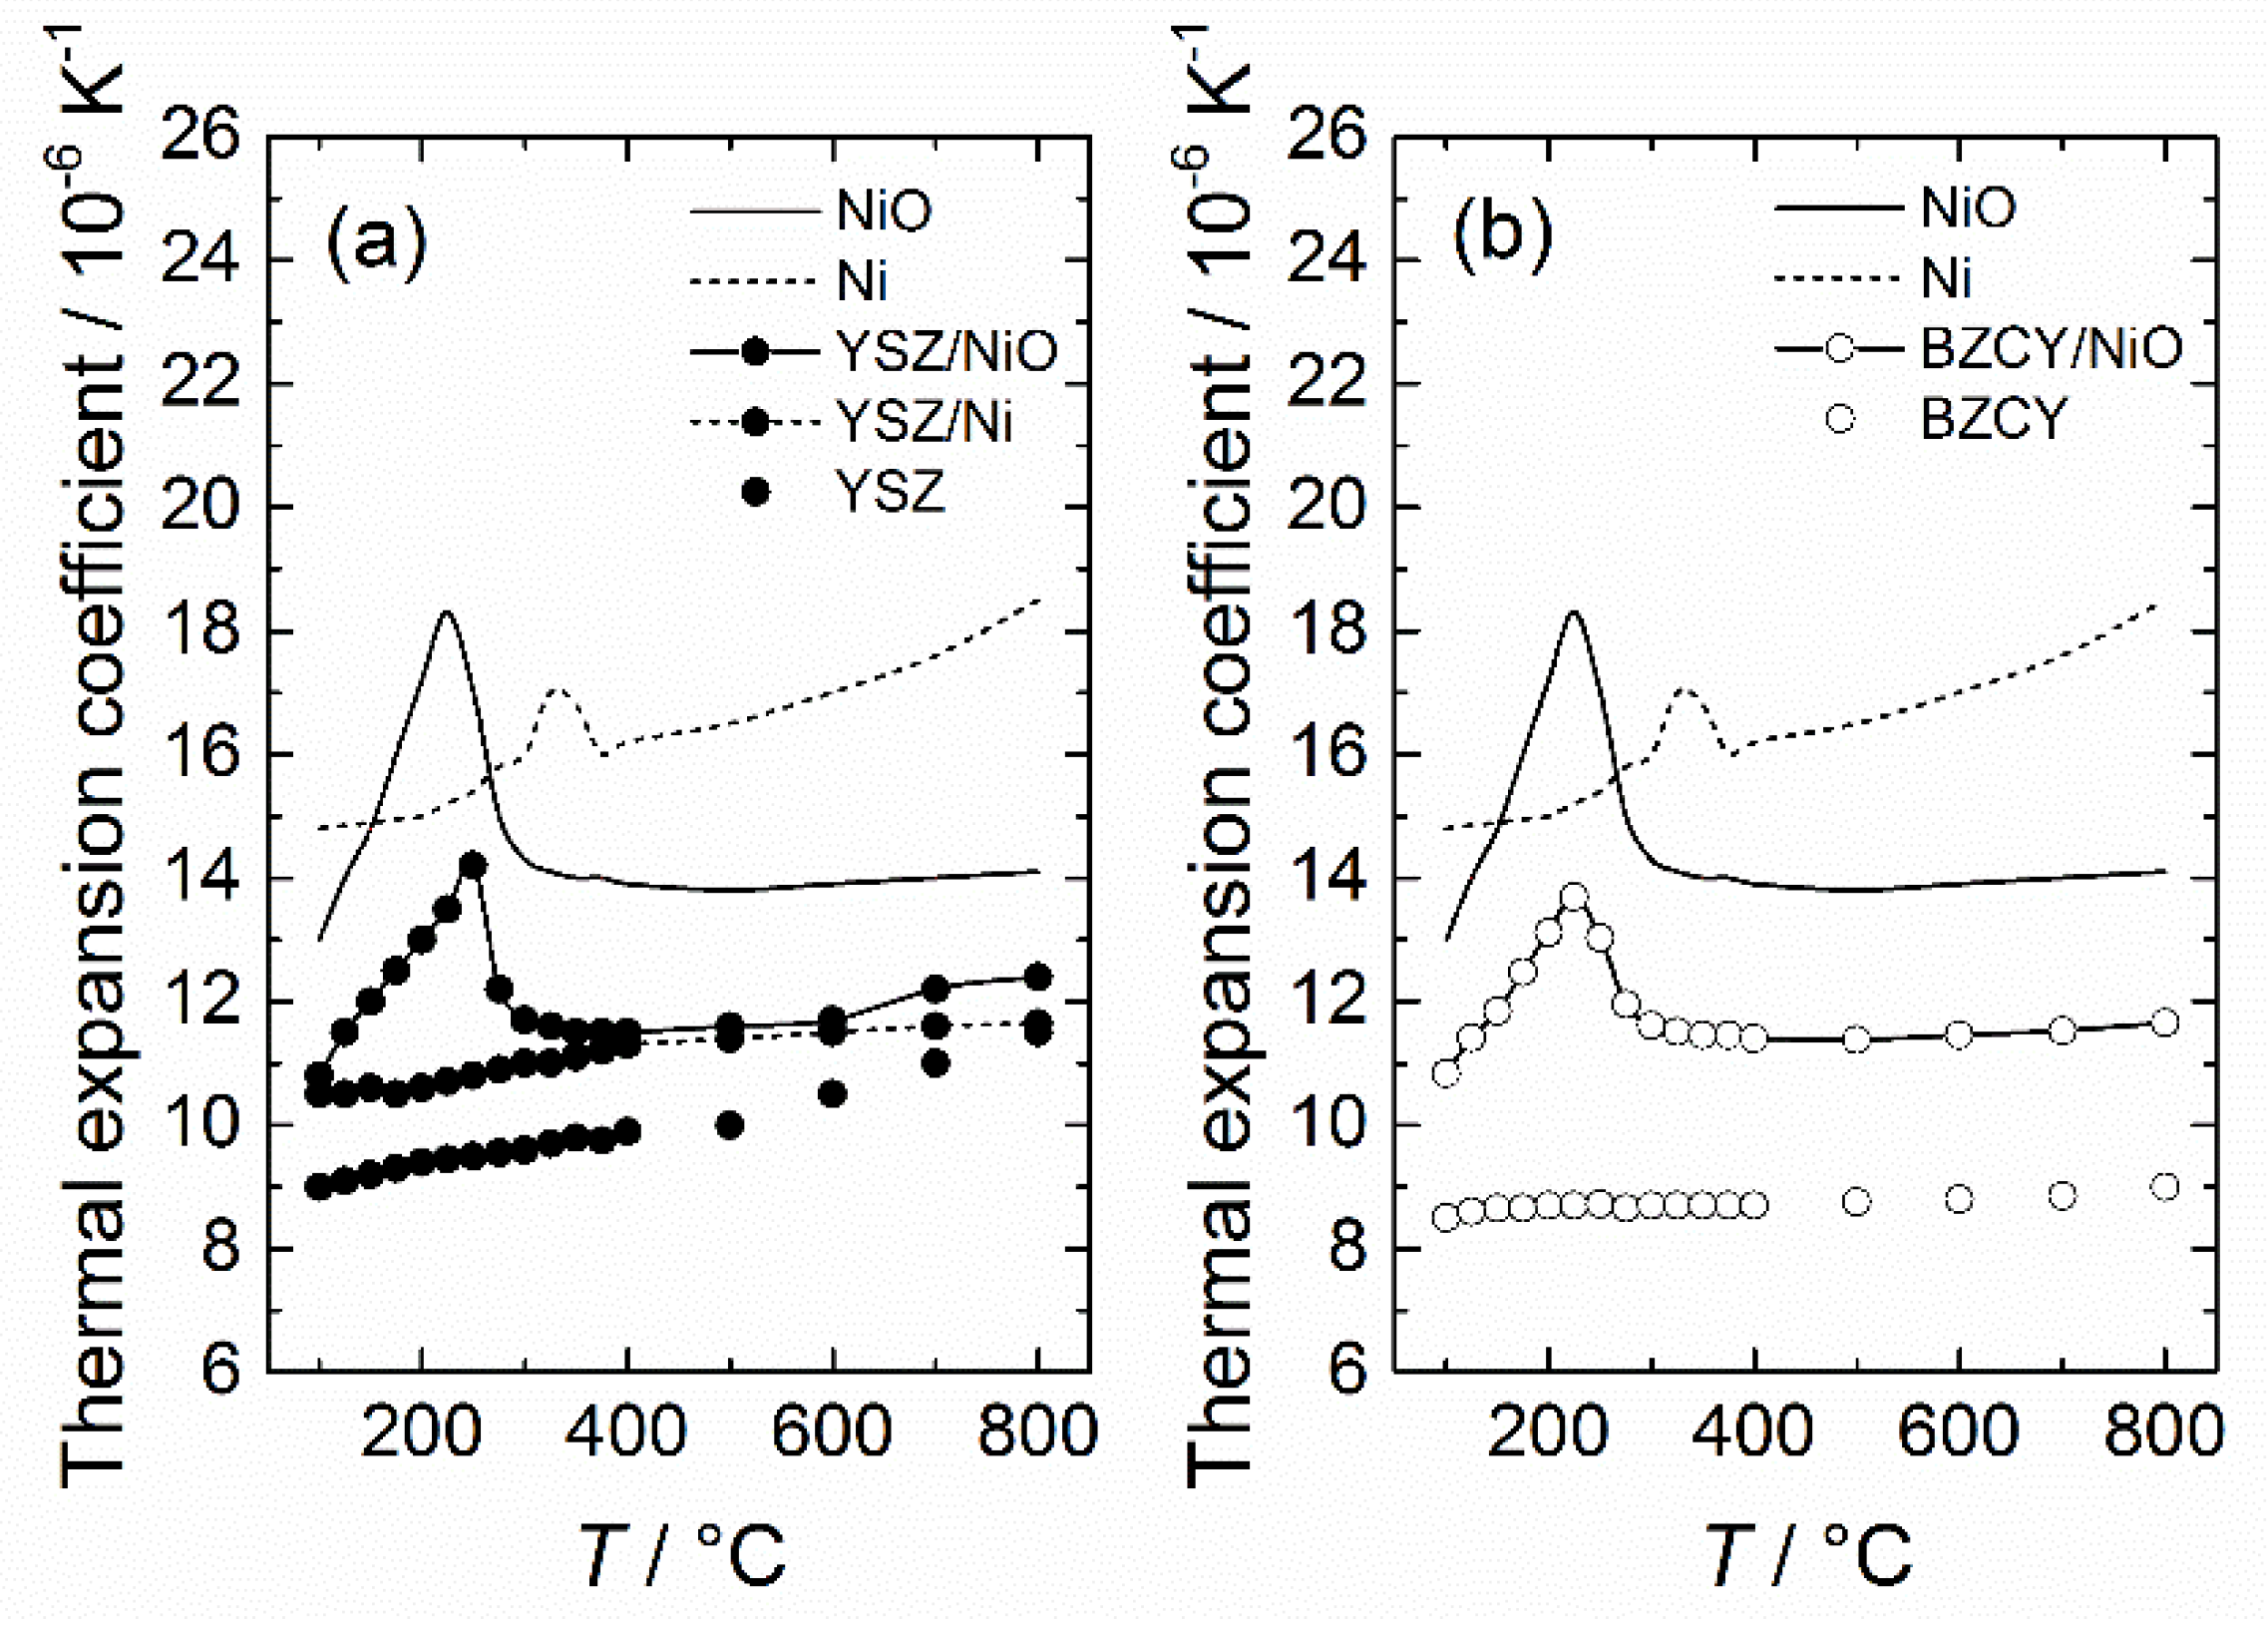
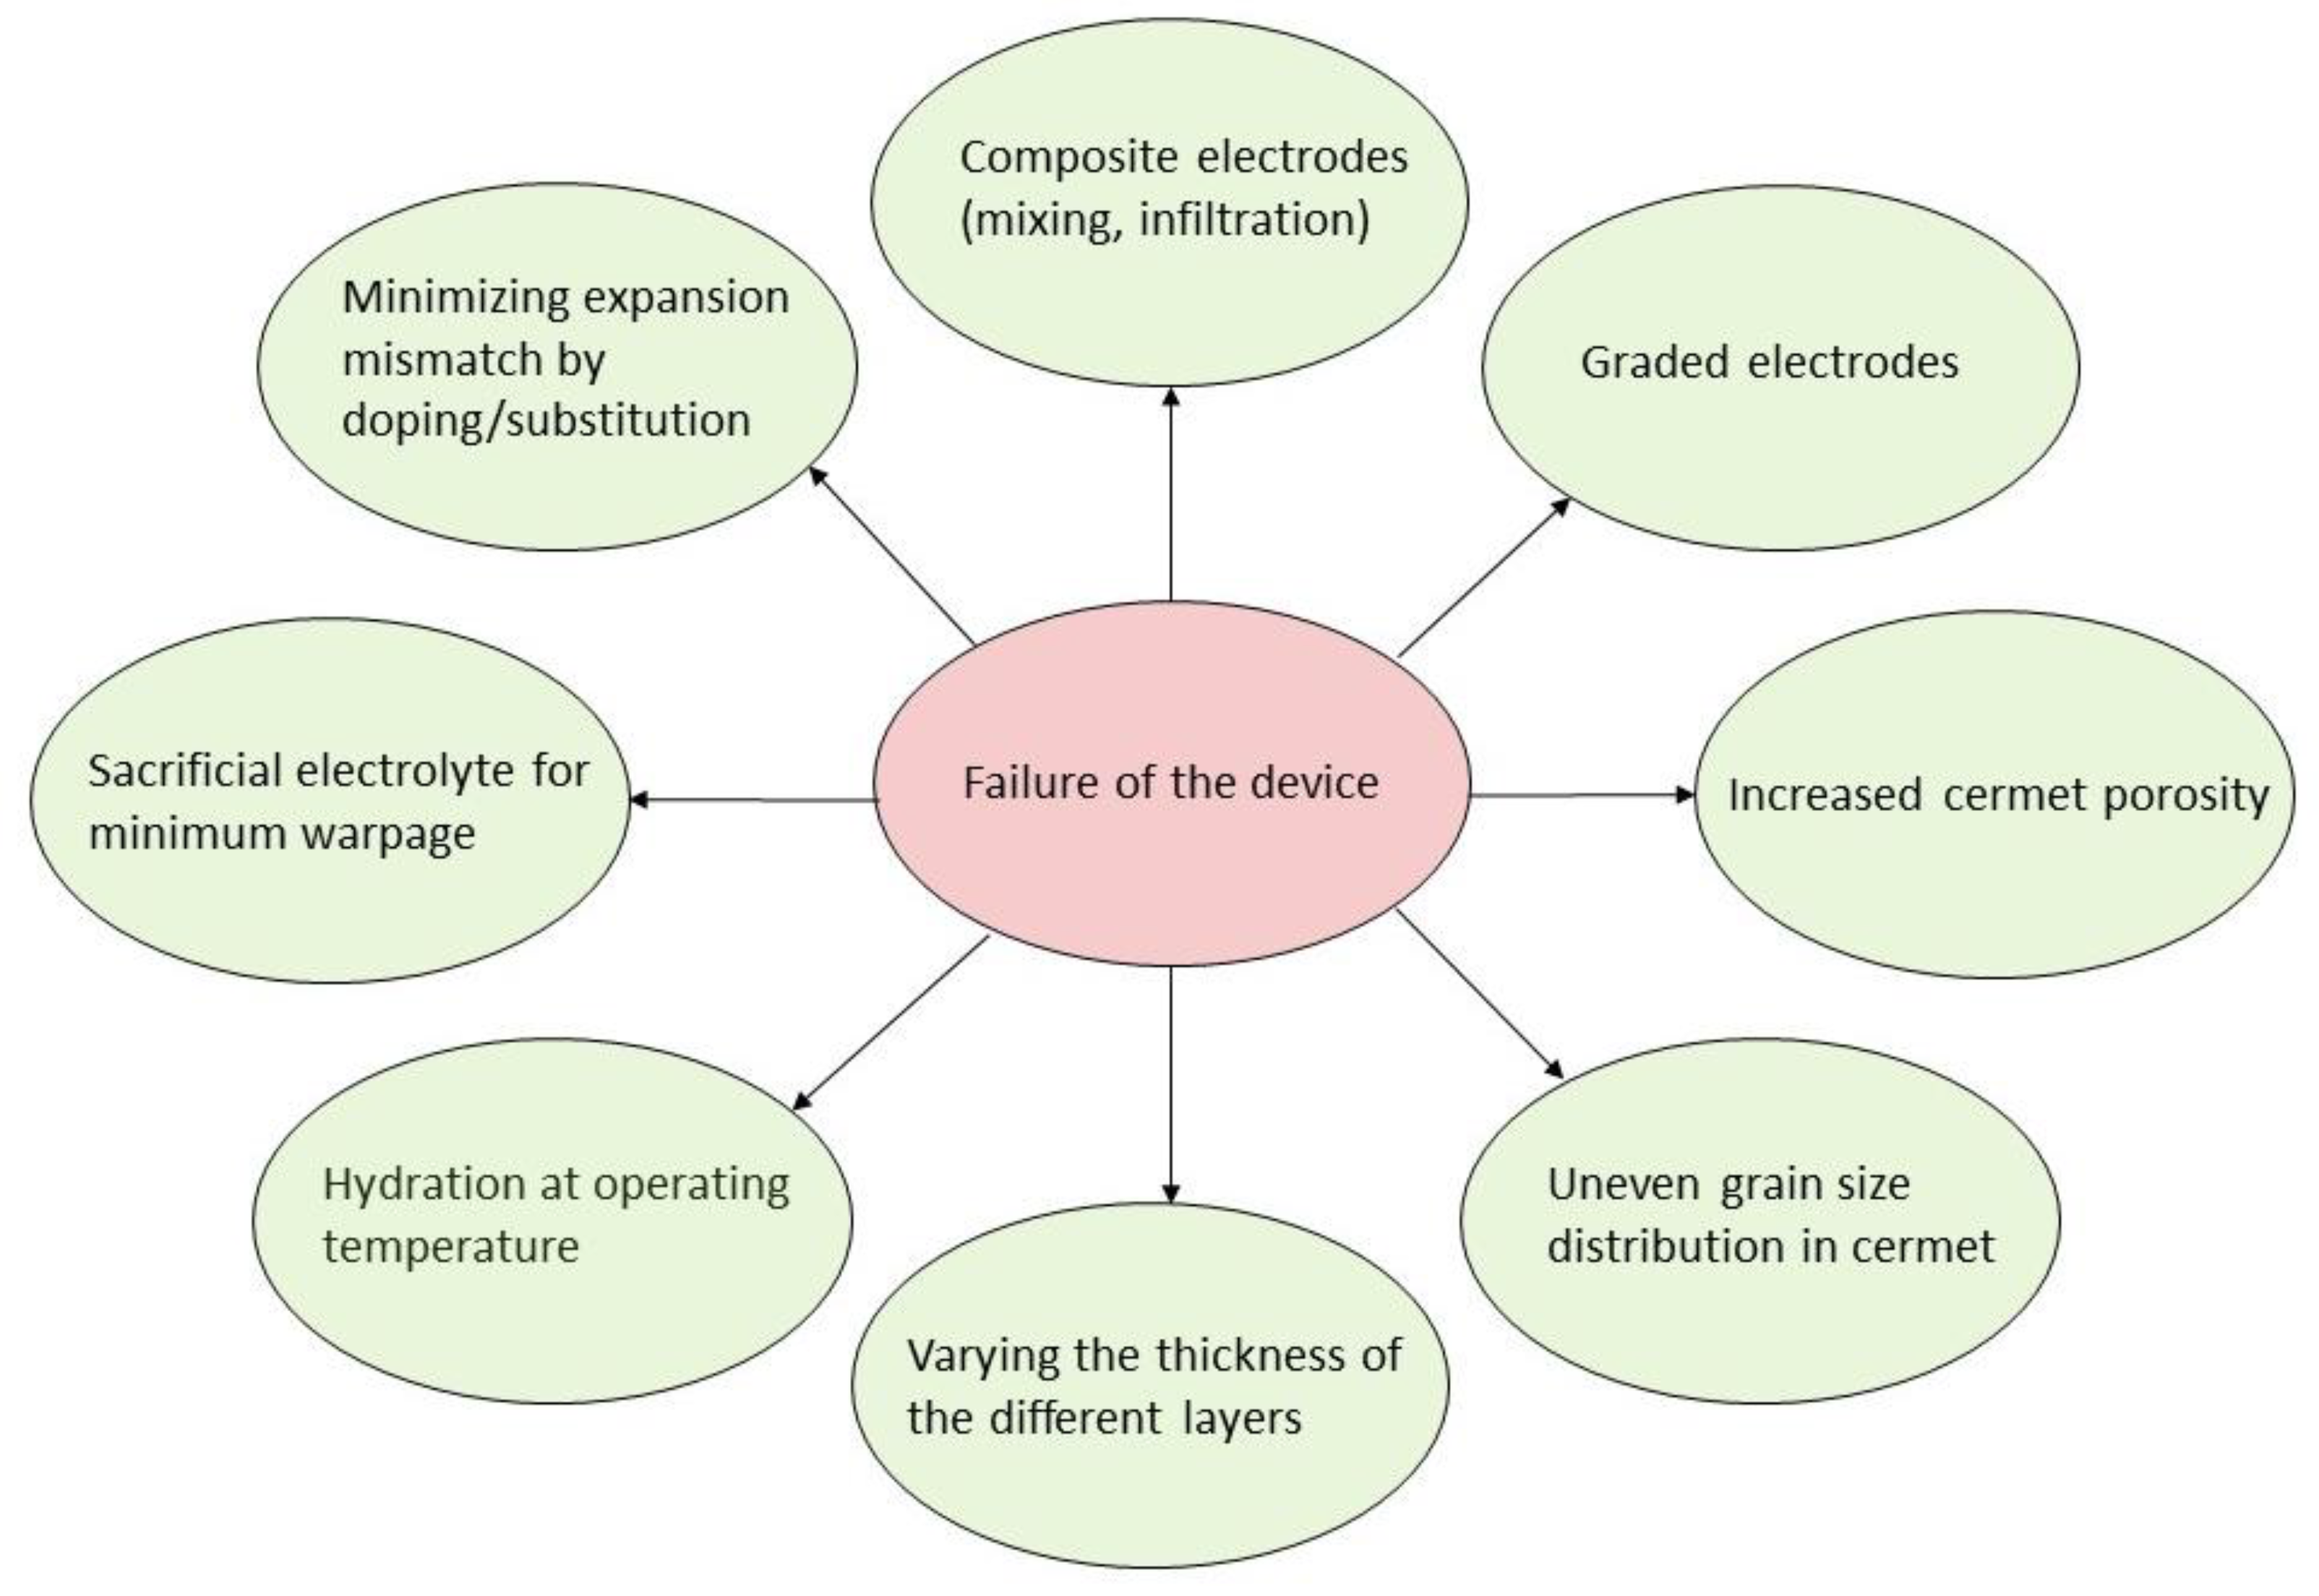
Table 1.
The mean thermal expansion coefficients, <α>, determined for BZCY72 in dry Ar.
| Cooling Rate K∙min−1 | Temperature Range °C | <α> 10−6 K−1 |
|---|---|---|
| 1 | 750–1000 | 9.3(2) |
| 3 | 750–980 | 9.3(2) |
| 5 | 750–960 | 9.3(2) |
| 10 | 750–935 | 9.2(2) |
| 1 | 100–750 | 8.5(3) |
| 3 | 110–750 | 8.8(3) |
| 5 | 120–750 | 8.7(2) |
| 10 | 170–750 | 8.5(2) |
Table 2.
Thermal expansion coefficients of barium zirconate and barium cerate based perovskites.
| Compounds | <α> (10−6 K−1) | Comments and References |
|---|---|---|
| Undoped and Y-doped BaZrO3 | ||
| BaZrO3 | 4.7 1) 6.87 2) 7.13 3) 7.5(2) 4) 8.02 5) 7.89 6) 8.65 7) | 1) Neutron scattering, 100–300 K, gas composition not specified [145] 2) HT-XRD, estimated by αV/3 (αV = 20.6 × 10⁻⁶ K−1), RT–600 °C, gas composition not specified [118] 3) Dilatometry, RT–1000 °C, reducing conditions—not specified [146] 4) HT-XRD, 298–1675 K, air [147] 5) HT-XRD, 30–1000 °C, dry Ar [78] 6) Dilatometry, temperature range used for <α> not clear, sample made by citrate method [148] 7) Dilatometry, temperature range used for <α> not clear, sample made by solid state synthesis [148] |
| BaZr0.98Y0.02O3−δ | 8.47 1) | 1) HT-XRD, 30–1000 °C, dry Ar [78] |
| BaZr0.95Y0.05O3−δ | 8.62 1) 8.75 2) | 1) HT-XRD, 30–1000 °C, dry Ar [78] 2) HT-XRD, 373–1123 K, vacuum conditions (0.1 mbar) [77] |
| BaZr0.9Y0.1O3−δ | 6.19 1) 8.45 2) 8.78 3) 8.80 4) 13 5) | 1) HT-ND, 300–773 K, dry N2 [149] 2) HT-XRD, 650–1000 °C, dry 4% H2 in Ar [119] 3) HT-XRD, 30–1000 °C, dry Ar [78] 4) HT-XRD, 373–1123 K, vacuum conditions (0.1 mbar) [77] 5) Dilatometry, 30–1000 °C, air [150] |
| BaZr0.85Y0.15O3−δ | 8 1) 8.7 2) 9.25 3) | 1) Dilatometry, dry and wet ( = 0.023 bar) give same result [80] 2) Dilatometry, Estimate made from thermal expansion LT (RT–320 °C), air [120] 3) HT-XRD, 30–1000 °C, dry Ar [78] |
| BaZr0.8Y0.2O3−δ | 8.2 1) 9.65 2) 10.1 3) | 1) HT-XRD, 100–900 °C, air [151] 2) HT-XRD, 373–1123 K, vacuum conditions (0.1 mbar) [77] 3) HT-XRD, 30–1000 °C, dry Ar [78] |
| BaZr0.75Y0.25O3−δ | 10.2 1) | 1) HT-XRD, 30–1000 °C, dry Ar [78] |
| BaZr0.7Y0.3O3−δ | 10.0 1) | 1) HT-XRD, 30–1000 °C, dry Ar [78] |
| Acceptor doped BaZrO3 (other elements than Y) | ||
| BaZr0.8Sc0.2O3−δ | 9.4 1) | 1) HT-XRD, Estimate made for lattice expansion at HT (600–1000 °C) under dry conditions [75] |
| BaZr0.8Sm0.2O3−δ | 9.2 1) | 1) HT-XRD, Estimate made for lattice expansion at HT (600–1000 °C) under dry conditions [75] |
| BaZr0.8Eu0.2O3−δ | 9.9 1) | 1) HT-XRD, Estimate made for lattice expansion at HT (600–1000 °C) under dry conditions [75] |
| BaZr0.8Dy0.2O3−δ | 10.5 1) | 1) HT-XRD, Estimate made for lattice expansion at HT (600–1000 °C) under dry conditions [75] |
| Undoped and acceptor doped BaCeO3 | ||
| BaCeO3 | 11.2 1) 12.2 2) | 1) Dilatometry, RT–1000 °C, reducing conditions—not specified [146] 2) DFT, QHA, 300 K, conditions not applicable [86] |
| BaCe0.8Y0.2O3−δ | 11.6 1) 9.94 2) 10.5 3) 11.6 4) | 1) HT-XRD, 100–900 °C, air [151] 2) HT-XRD, 373–1123 K, vacuum conditions (0.1 mbar) [77] 3) HT-XRD, RT–1000 °C, dry O2, estimate made based on changes in pseudo-cubic volume [152] 4) HT-ND, 30–800 °C, air, estimate made based on changes in pseudo-cubic volume [153] |
| Y:BaZrO3-BaCeO3 solid solutions (in order of increasing Zr-content) | ||
| BaZr0.1Ce0.7Y0.2O3−δ | 11.3 1) 12.1 2) | 1) HT-XRD, 600–900 °C, air [151] 2) Dilatometry, 50–900 °C, air, <α> extracted for 50–600 °C where the expansion is linear [154] |
| BaZr0.1Ce0.7Y0.1Yb0.1O3−δ | 9.07 1) 11.60 2) | 1) Dilatometry, 720–1100 °C, Ar, not indicated [155] 2) Dilatometry, 800–1100 °C, air, not indicated [155] |
| BaZr0.2Ce0.6Y0.2O3−δ | 11.3 1) | 1) HT-XRD, 600–900 °C, air [151] |
| BaZr0.3Ce0.5Y0.2O3−δ | 10.8 1) | 1) HT-XRD, 600–900 °C, air [151] |
| BaZr0.4Ce0.4Y0.2O3−δ | 10.9 1) | 1) HT-XRD, 600–900 °C, air [151] |
| BaZr0.5Ce0.3Y0.2O3−δ | 9.3 1) | 1) HT-XRD, 600–900 °C, air [151] |
| BaZr0.6Ce0.2Y0.2O3−δ | 9.1 1) | 1) HT-XRD, 600–900 °C, air [151] |
| BaZr0.7Ce0.1Y0.2O3−δ | 8.4 1) | 1) HT-XRD, 600–900 °C, air [151] |
| BaZr0.7Ce0.2Y0.1O3−δ | 12.7 1) 10.2 2) 9.3 3) | 1) HT-ND, pre-hydrated sample, estimated to be 0.001 atm based on thermodynamic modelling [126] 2) HT-XRD, 650–1000 °C, dry 4% H2 in Ar [119] 3) Dilatometry, this work, dry Ar, see Section 3.6 for more details |
| BaZr0.8075Ce0.0425Y0.15O3−δ | 8 1) | 1) Dilatometry, dry and wet ( = 0.023 bar) give same result [80] |
Table 3.
Thermal expansion and total conductivity under wet conditions (600 °C) in proton conducting perovskites other than barium cerates and zirconates. The coefficients of some other perovskites are included for completeness, although these have not explicitly been shown to conduct protons. Their conductivities are therefore denoted by N.A.
| Compounds | Conductivity at 600 °C (10−3 S cm−1) | <α> (10−6 K−1) | Comments and References |
|---|---|---|---|
| Ca- and Sr-based perovskites | |||
| CaZrO3 | 0.3 in air 1) | 8.02 + 0.005 × T 2) 8.92 + 0.003 × T 3) T: temperature | 1) for 3 mol% Sc-doped specimen [156] 2) Dilatometry, dry ( = 0.0004 atm) air, nonlinear thermal expansion [156] 3) Dilatometry, moist ( = 0.025 atm) air, nonlinear thermal expansion [156] |
| SrZrO3 | 0.8 in H2 1) | 9.69 2) | 1) for 5 mol% Y-doped specimen [157,158] 2) Dilatometry, gas conditions not specified, undoped sample [159] |
| SrCeO3 | 2 in H2 1) | 11.1 2) | 1) for 5 mol% Yb-doped specimen [27,160] 2) Dilatometry and HT-XRD under reducing conditions and helium, respectively, undoped sample [161] |
| SrMoO3 | N.A. | 7.98 1) | 1) Dilatometry and HT-XRD under reducing conditions and helium, respectively, undoped sample [161] |
| SrHfO3 | N.A. | 11.3 1) | 1) Dilatometry and HT-XRD under reducing conditions and helium, respectively, undoped sample [161] |
| SrRuO3 | N.A. | 10.3 1) | 1) Dilatometry and HT-XRD under reducing conditions and helium, respectively, undoped sample [161] |
| Ba-based perovskites | |||
| BaSnO3 | 0.05 in air 1) | 9.3 2) | 1) tOH ≈ 0.75, doped with 10 mol% Lu, measured at 450 °C [162] 2) Dilatometry, gas composition not specified, undoped sample [163] |
| BaHfO3 | 0.05 in air 1) | 6.93 2) | 1) tOH unknown, doped with 10 mol% Y, measured at 450 °C [164] 2) Dilatometry, gas composition not specified, undoped sample [165] |
| BaThO3 | 6 in Ar 1) | 11.09 2) | 1) tOH ≈ 0.55, doped with 5 mol% Nd [166] 2) Dilatometry, gas composition not specified, undoped sample [167] |
| BaTbO3 | 6 in Ar 1) | 9 2) | 1) tOH not specified, doped with 5 mol% Yb [166] 2) Estimated from HT-XRD data for temperature range 280–800 K, undoped sample [168] |
| BaMoO3 | N.A. | 9.46 1) | 1) Dilatometry and HT-XRD under reducing conditions and helium, respectively, undoped sample [161] |
| BaUO3 | N.A. | 11.0 1) | 1) Dilatometry and HT-XRD under reducing conditions and helium, respectively, undoped sample [161] |
| LaREO3 series | |||
| LaScO3 | 4 in H2 1) | 8 2) | 1) tOH ≈ 1, doped with 10 mol% Sr [169] 2) Estimated from dilatometry plot, gas composition not specified, sample doped with 10 mol% Sr [170] |
| LaYO3 | 0.8 in air 1) | 11.1(1) 2) 11.4(3) 3) | 1) tOH ≈ 1, doped with 10 mol% Sr [171] 2) Dilatometry, dry ( = 0.001 atm) air, sample doped with 10 mol% Sr [172] 3) Dilatometry, moist ( = 0.025 atm) air, sample doped with 10 mol% Sr [172] |
| LaYbO3 | 0.8 in air 1) | 8.95 2) | 1) tOH ≈ 1, doped with 10 mol% Sr [171] 2) Dilatometry, gas composition not specified, undoped sample [173] |
| LaLuO3 | 0.7 in H2 1) | 4.5 2) | 1) tOH ≈ 1, doped with 10 mol% Sr [169] 2) Estimation of αV/3, undoped LaLuO3 single crystal measured by HT XRD camera in temperature range from RT–1000 °C [174] |
| LaInO3 | 3 in air 1) | 6–9 2) | 1) tOH ≈ 0.9, for 10 mol% Sr-doped specimen [171] 2) The range of true coefficient calculated from dilatometry in the temperature range 250–873 K, gas composition not specified, undoped sample [175] |
Table 4.
Thermal expansion coefficients of undoped and cation-substituted LaNbO4 compounds, along with their total conductivity at 800 °C under wet conditions and their structure type for reference. Note that acceptor dopants are generally on the La-site unless specified otherwise.
Table 4.
Thermal expansion coefficients of undoped and cation-substituted LaNbO4 compounds, along with their total conductivity at 800 °C under wet conditions and their structure type for reference. Note that acceptor dopants are generally on the La-site unless specified otherwise.
| Compound | Conductivity at 800 °C (10−3 S cm−1) | Temp. Range (°C) | Structure Type | <α> (10−6 K−1) | Comments and References |
|---|---|---|---|---|---|
| Acceptor doped LaNbO4 (maximum 2–3 mol% dopant) | |||||
| undoped | 0.02 in H2 1) | RT to ~500 | fergusonite | 14 2)/15.3 3) 17.1 4)/17.3 5) | 1) tOH not specified [211] 2) Dilatometry, measured upon cooling, gas conditions not specified [200] 3) Dilatometry, measured upon cooling in moist Ar [103] 4) Expansion of the unit cell measured by ND [103] 5) Expansion of the unit cell measured or HT-XRD [63] |
| ~500–1000 | scheelite | 8.4 2)/8.8 3) 4.2 4)/7.1 5) | |||
| Ca-doped | 0.8 in O2 1) 0.7 in H2 1) | RT to ~500 | fergusonite | 12 2) | 1) tOH ≈ 1; doped with 1 mol% Ca [65] 2) Dilatometry, measured upon cooling, gas conditions not specified, sample doped with 2 mol% Ca [200] |
| ~500–1000 | scheelite | 8.3 2) | |||
| Ba- or Sr-doped | 0.4 in H2 1) | RT to ~500 | fergusonite | 14 2) | 1) tOH ≈ 1; for 2 mol% Sr [211] 2) Dilatometry, averaged for all compositions, measurement upon cooling, gas conditions not specified [200] |
| ~500–1000 | scheelite | 8.6(5) 2) | |||
| Mg-doped | 2 in H2 1) | RT to 490 | fergusonite | 12 2)/17.7 3) | 1) at 720 °C, tOH not specified, for 2 mol% Mg [202] 2) Dilatometry, gas conditions not specified [102] 3) Expansion of the unit cell measured by HT-XRD [102] |
| 490–1000 | scheelite | 8 2)/10.8 3) | |||
| Ti-doped (Nb-site) | 0.1 in N2 and O2 1) | RT to ~500 | fergusonite | 13 2) | 1) tOH not specified, 2–3 mol% Ti [203] 2) Dilatometry, gas conditions not specified [203] |
| ~500–1000 | scheelite | 7 2) | |||
| Acceptor doped LaNb1−xMx O4 (M = V, Ta or Sb)—M and Nb are isovalent | |||||
| LaNb1−xVxO4 | 1) tOH estimated to 0.7–0.9, sample acceptor doped with 2 mol% Sr [220] 2) Dilatometry, gas composition not specified [220] | ||||
| x = 0.3 | 0.1 in O2 1) | RT–1000 | scheelite | 8 2) | |
| LaNb1−xTaxO4 | 1) tOH not specified, acceptor doped with 1 mol% Ca [221] 2) Expansion of the unit cell measured by HT-XRD, sample without acceptor dopants [63] | ||||
| x = 0.2 | 0.3 in Ar 1) | RT–670 | fergusonite | 15.7(3) 2) | |
| 670–1000 | scheelite | 9.1(1) 2) | |||
| x = 0.4 | 0.08 in Ar 1) | RT–800 | fergusonite | 14.0(2) 2) | |
| 800–1000 | scheelite | 11.5(1) 2) | |||
| LaNb1−xSbxO4 | 1) tOH ≈ 1, sample acceptor doped with 2 mol% Ca [214] 2) Dilatometry, dry Ar, measured on sample without acceptors [64] | ||||
| x = 0.1 | 0.3 in air 1) | RT–351 | fergusonite | 16.7(4) 2) | |
| 351–1000 | scheelite | 9.1(7) 2) | |||
| x = 0.3 | 0.08 in air 1) | RT–1000 | scheelite | 8.1(3) 2) | |
| LaNb1−xAsxO4 | |||||
| x = 0.1 | N/A | RT–340 | fergusonite | 13.9(1) 1) | 1) Dilatometry, dry Ar, measured on sample without acceptors [222] |
| 340–1000 | scheelite | 8.6(2) 1) | |||
| x = 0.3 | N/A | RT–1000 | scheelite | 8.3(1) 1) | |
Table 5.
Other ABO4 compounds and their crystal structure, conductivity at 800 °C in moist conditions and thermal expansion coefficient.
Table 5.
Other ABO4 compounds and their crystal structure, conductivity at 800 °C in moist conditions and thermal expansion coefficient.
| Compounds | Conductivity at 800 °C (10−3 S cm−1) | Structure Type | <α> (10−6 K−1) | Comments and References |
|---|---|---|---|---|
| Rare earth orthophosphates | ||||
| YPO4 | 0.09 in O2 1) | xenotime | 6.2 2)/5.4 3) | 1) tOH ≈ 1, doped with 3 mol% Ca [199] 2) Dilatometry, gas conditions not specified, undoped sample [226] 3) Expansion of the unit cell measured by HT-XRD [227] |
| LaPO4 | 0.03 in air 1) | monazite | 10.0 2) | 1) tOH ≈ 1, doped with 4 mol% Sr [196] 2) Dilatometry, gas conditions not specified, undoped sample [228] |
| Lanthanide orthoniobates (La is excluded) | ||||
| NdNbO4 | 0.5 in H2 1) | fergusonite | 10.3 2) | 1) tOH ≈ 1, doped with 1 mol% Ca [194] 2) Dilatometry, gas composition not specified, undoped sample [229] |
| ErNbO4 | 0.04 in H2 1) | fergusonite | 12.0 2) | 1) tOH ≈ 1, doped with 1 mol% Ca [194] 2) Expansion of the unit cell measured by HT-XRD, undoped sample [230] |
| Lanthanide orthotantalates | ||||
| LaTaO4 | 0.2 in H2 1) | layered perovskite | 5.33 2) | 1) tOH ≈ 1, doped with 1 mol% Ca [193] 2) Dilatometry, gas composition not specified, undoped sample [231] |
| NdTaO4 | 0.07 in H2 1) | fergusonite | 9.87 2) | 1) tOH ≈ 1, doped with 1 mol% Ca [193] 2) Dilatometry, gas composition not specified, undoped sample [231] |
| GdTaO4 | 0.03 in H2 1) | fergusonite | a 6.17 2) b 12.12 2) c 13.40 2) average 10.6 3) | 1) tOH ≈ 0.7, doped with 1 mol% Ca [193] 2) Dilatometry, gas conditions not specified, measured for an undoped single crystal along a, b and c axis [232] 3) Calculated for comparative reasons |
| Others | ||||
| LaAsO4 | 0.03 in O2 1) | monazite | 7.7 2) | 1) tOH ≈ 1, doped with 1 mol% Sr [197] 2) Calculated from the chemical bond theory of dielectric description, undoped material [233] |
| LaVO4 | 0.3 in O2 1) | monazite | 6.1 2) | 1) tOH ≈ 0.15, doped with 1 mol% Ca, at this temperature predominantly oxygen ion conductor, protonic conductivity dominates below 500 °C [234] 2) Calculated from the chemical bond theory of dielectric description, undoped material [235] |
Table 6.
Linear thermal expansion coefficients (α) for various A2B2O7 oxides in the temperature range 400 to 1000 °C.
Table 6.
Linear thermal expansion coefficients (α) for various A2B2O7 oxides in the temperature range 400 to 1000 °C.
| Composition | <α> 10−6 K−1 | Reference |
|---|---|---|
| La2Ce2O7 | 10–12 | [243] |
| La2Zr2O7 | 8.7–9.6 | [247] |
| La1.8Nd0.2Zr2O7 La1.6Nd0.4Zr2O7 La1.4Nd0.6Zr2O7 La1.2Nd0.8Zr2O7 | 8.75–9.25 8.25–9.25 9–9.25 9.2–9.75 | [247] [247] [247] [247] |
| La2Zr2O7 | 8.5–9 | [248] |
| Nd2Zr2O7 | 9.2–9.5 | [248] |
| Eu2Zr2O7 | 10.5 | [248] |
| Gd2Zr2O7 | 9–10.5 | [248] |
| La1.4Nd0.6Zr2O7 | 8.5–8.7 | [248] |
| La1.4Eu0.6Zr2O7 | 9–9.2 | [248] |
| La1.4Gd0.6Zr2O7 La1.7Dy0.3Zr2O7 | 9.2–9.3 8.5–9 | [248] [248] |
Table 7.
List of materials used as electrodes in electrochemical cells based on proton conducting ceramics.
Table 7.
List of materials used as electrodes in electrochemical cells based on proton conducting ceramics.
| Type | Composition | Reference | Application |
|---|---|---|---|
| Single phase | Materials with perovskite structure | ||
| BaCoO3−δ | [150] | PCFC cathode | |
| Ba0.5Sr0.5CoO3−δ | |||
| Ba0.5La0.5CoO3−δ | [150,262] | ||
| Ba0.5Sr0.5Co0.8Fe0.2O3−δ | [263,264,265] | ||
| BaCo0.4Fe0.4Zr0.2O3−δ | [266] | ||
| BaCo0.4Fe0.4Zr0.1Y0.1O3−δ | [7] | ||
| BaCo0.4Fe0.4Zr0.2O3−δ | [261] | ||
| BaCexFe1−xO3−δ | [267] | ||
| Ba0.5Sr0.5Fe0.8Zn0.2O3−δ | [268,269] | ||
| BaPr0.8Gd0.2O3−δ | [270] | ||
| BaCe0.4Pr0.4Y0.2O3−δ | [271] | ||
| BaCe0.5Bi0.5O3−δ | [272] | ||
| SrCoO3−δ | [150] | ||
| Sr0.5Sm0.5CoO3−δ | [273] | ||
| Sr0.5La0.5CoO3−δ | [150] | ||
| LaCoO3−δ | |||
| La0.6Sr0.4Co0.2Fe0.8O3−δ | [264,265] | ||
| La0.58Sr0.4Co0.2Fe0.8O3−δ | [96] | ||
| La0.8Sr0.2MnO3−δ | [265] | ||
| La0.6Sr0.4Fe0.8Ni0.2O3−δ | [265,274] | ||
| SrFe0.75Mo0.25O3−δ | [16] | PCFC cathode/PCFC anode | |
| Sr0.5Sm0.5CoO3−δ | [17] | PCEC anode | |
| (La0.75Sr0.25)0.97Cr0.5Mn0.5O3−δ | [275] | ||
| Layered perovskites and perovskite-related structures | |||
| PrBaCo2O6−δ | [264] | PCFC cathode | |
| PrBa0.5Sr0.5Co1.5Fe0.5O6−δ | [26] | ||
| SmBaCo2O6−δ | [276] | ||
| NdBa0.5Sr0.5Co1.5Fe0.5O6−δ | [277] | ||
| GdBaCo2O6−δ | [278,279] | ||
| LaBaCo2O6−δ | [262] | ||
| PrBaCo2O6−δ | [280] | ||
| SmBa0.5Sr0.5Co2O6−δ | [281] | ||
| SmBaCuCoO6−δ | [282] | ||
| PrBaCuFeO6−δ | [283] | ||
| SmBaCuFeO6−δ | [282] | ||
| PrBaCuFeO6−δ | [283] | ||
| BaPrCo2O6−δ | [260] | PCFC cathode/PCEC anode | |
| BaGd0.8La0.2Co2O6−δ | |||
| BaGdCo1.8Fe0.2O6−δ | |||
| BaPrCo1.4Fe0.6O6−δ | |||
| Ruddlesden-Popper structure A2NiO4+δ | |||
| Pr2NiO4+δ | [264,265,284,285,286] | PCFC cathode | |
| La2NiO4+δ | [265,287] | ||
| Nd2NiO4+δ | |||
| LaSrNiO4±δ | [265] | ||
| LaSrCo0.5Fe0.5O4−δ | [288] | ||
| Other structures | |||
| BaGa2O4 | [289] | PCFC cathode | |
| Ba3Co2O6(CO3)0.6 | |||
| YBaCo3.5Zn0.5O7+δ | [290] | ||
| Ba3In1.4Y0.3M0.3ZrO8 (M = Gd3+/Ga3+) | [291] | ||
| Ca3−xLaxCo4O9+δ (x = 0, 0.3) | [292] | ||
| La4BaCu5O13+δ | [293] | ||
| La6.4Sr1.6Cu8O20±δ | |||
| Composite by mixing | Cercer composites | ||
| Ba0.5Sr0.5Co0.5Fe0.5O3−δ /BZCY (3:2) | [294] | PCFC cathode | |
| Sm0.5Sr0.5CoO3−δ/BZCY (7:3) | [295] | ||
| Sm0.5Sr0.5CoO3−δ /Ce0.8Sm0.2O2−δ (6:4) | [296] | ||
| La0.7Sr0.3FeO3−δ /Ce0.8Sm0.2O2−δ | [297] | ||
| SrCe0.9Yb0.1O3–δ or BaCe0.9Yb0.1O3–δ/La0.6Sr0.4Co0.2Fe0.8O3−δ | [298] | ||
| 50% PrBaCo2O6−δ/50% BZCY and 75–25 graded | [299] | ||
| Ba(Zr0.1Ce0.7Y0.2)O3−δ and La0.6Sr0.4Co0.2Fe0.8O3−δ | [271] | ||
| La0.6Sr0.4Co0.2Fe0.8O3−δ/BaZr0.5Pr0.3Y0.2O3−δ | [300] | ||
| Pr0.58Sr0.4Fe0.8Co0.2O3–δ/BaCe0.9Yb0.1O3–δ | [301] | ||
| Sm0.5Sr0.5CoO3−δ/BaCe0.8Sm0.2O3−δ | [257] | ||
| BaZr0.1Ce0.7Y0.1Yb0.1O3−δ/Nd1.95NiO4+δ | [302] | ||
| BaCe0.8Zr0.1Y0.1O3−δ/Sm0.5Sr0.5CoO3−δ | [303] | ||
| Gd0.1Ce0.9O2−δ infiltrated PrBaCo2O6−δ and BaZr0.1Ce0.7Y0.2O3−δ | [304] | ||
| La0.6Sr0.4Co0.2Fe0.8O3−δ/BZCY72 | [305] | PCEC anode | |
| La2NiO4+δ/BZCY72 | |||
| La0.87Sr0.13CrO4/BZCY72 | |||
| La0.8Sr0.2MnO3−δ/BZCY72 | |||
| La0.8Sr0.2MnO3−δ/BaCe0.5Zr0.3Y0.16Zn0.04O3−δ with Fe2O3 nanoparticles | [306] | ||
| Ba2FeMoO6−δ/BaZr0.1Ce0.7Y0.1Yb0.1O3−δ for methane dehydro-aromatization | [307] | Electrodes for membrane reactors | |
| Cermet composites | |||
| 65 wt.% NiO–35 wt.% BZCY72 | [308] | PCFC anode/PCEC cathode | |
| 65 wt.% NiO–35 wt.% BZCY72 | [309] | ||
| BaCe0.8Y0.2O3−δ and BaCe0.6Zr0.2Y0.2O3−δ with NiO 50:50 | [310] | ||
| BZCY72-Ni | [8] | ||
| NiO-BZO and NiO-BZY15 (40 vol% Ni) | [311] | ||
| 65 wt.% NiO–35 wt.% BZCY72 | [28] | ||
| NiO-BZY cermet anodes (40 vol% Ni) | [312] | ||
| 60 wt% NiO + 40 wt% BCGCu with functional layer 45 wt% NiO + 55 wt% BCGCu and BCGCu electrolyte BaCe0.89Gd0.1Cu0.01O3–δ | [313] | ||
| Ba(Zr0.85Yb0.15)O3−δ and NiO the volume ratio of Ni to the total bulk volume in the reduced composite was designed to be around 40 vol% | [314] | ||
| NiO-BaZr0.1Ce0.7Y0.1Yb0.1O3−δ (60:40 wt.%) | [315] | ||
| Composite by infiltration | Cercer composites | ||
| (Pr0.9La0.1)2(Ni0.74Cu0.21Nb0.05)O4+δinfiltrated in BaZr0.1Ce0.7Y0.2O3−δ | [316] | PCFC cathode | |
| La0.58Sr0.4Co0.2Fe0.8O3−δ infiltrated in BZCY72 | [96] | ||
| LaCoO3 infiltrated in BZCY72 | [317] | ||
| Ba0.5Sr0.5Co0.8Fe0.2O3−δ infiltrated in BZCY72 | [305] | PCEC anode | |
| La2NiO4+δ infiltrated in BZCY72 | [318] | ||
| Ba0.5Gd0.8La0.7Co2O6−δ infiltrated in BZCY72 | [319] | ||
| (La0.7Sr0.3)V0.90O3−δ infiltrated in Ba(Ce0.51Zr0.30Y0.15Zn0.04)O3−δ | [320] | PCFC anode/PCEC cathode | |
| Cermet composites | |||
| Fe infiltrated in BaCe0.2Zr0.6Y0.2O2.9 | [321] | PCFC anode/PCEC cathode | |
| Ni infiltrated in BaCe0.9Y0.1O3−δ and BaZr1−xYxO3−δ (x = 0.10, 0.20) | [322] | ||
| Exsolution | Cercer composites | ||
| La0.5Ba0.5Co1/3Mn1/3Fe1/3O3−δ/BaZr1−zYzO3−δ | [323] | PCFC cathode | |
Table 8.
Thermal expansion coefficients of Ba1−xSrxCo0.8Fe0.2O3−δ (BSCF).
| x | Thermal Expansion Coefficient/10−6 K−1 | Temperature Range | References |
|---|---|---|---|
| 0.3 | 12.4 1) | RT–300 °C | 1) Patra et al. [351] |
| 20.4 2) | 50–1000 °C | 2) Wei et al. [352] | |
| 0.4 | 14.6 1) | RT–300 °C | 1) Patra et al. [351] |
| 20.1 2) | 50–1000 °C | 2) Wei et al. [352] | |
| 19.6 3) | RT–850 °C | 3) Zhu et al. [355] | |
| 0.5 | 14.2 1) | RT–300 °C | 1) Patra et al. [351] |
| 20.0 2) | 50–1000 °C | 2) Wei et al. [352] | |
| 19.0–20.8 3) * | 50–1000 °C | 3) McIntosh et al. [353] | |
| 18.5–24.4 4) * | 600–900 °C | 4) Kriegel et al. [354] | |
| 19.2 5) | RT–1000 °C | 5) Zhu et al. [355] | |
| 11.5 6) | RT–850 °C | 6) Wang et al. [356] | |
| 0.6 | 13.0 1) | RT–300 °C | 1) Patra et al. [351] |
| 20.2 2) | 50–1000 °C | 2) Wei et al. [352] | |
| 19.1 3) | RT–850 °C | 3) Zhu et al. [355] | |
| 0.7 | 15.4 1) | RT–300 °C | 1) Patra et al. [351] |
| 20.3 2) | 50–1000 °C | 2) Wei et al. [352] | |
| 19.7 3) | RT–850 °C | 3) Zhu et al. [355] | |
| 0.8 | 12.4 1) | RT–300 °C | 1) Patra et al. [351] |
| 22.0 2) | RT–850 °C | 2) Zhu et al. [355] | |
| 0.9 | 22.1 1) | RT–850 °C | 1) Zhu et al. [355] |
| 1.0 | 19.6 1) | RT–850 °C | 1) Zhu et al. [355] |
* These studies have determined thermal and chemical expansion coefficients, and are thus less prone to overestimating the thermal expansion coefficient, which can be an issue at higher temperatures due to the influence of a chemical expansion upon reduction.
Table 9.
Linear thermal expansion coefficients of La1−xSrxCo0.2Fe0.8O3−δ (LSCF).
| x | Thermal Expansion Coefficient/10−6 K−1 | Temperature Range | References |
|---|---|---|---|
| 0 | 13.1 1) | 100–500 °C | 1) Tai et al. [359] |
| 0.1 | 16.0 1) | 300–900 °C | 1) Tai et al. [359] |
| 0.2 | 15.4 1) | 100–800 °C | 1) Tai et al. [359] |
| 14.8 2) | 30–1000 °C | 2) Petric et al. [327] | |
| 0.3 | 16.0 1) | 30–1000 °C | 1) Petric et al. [327] |
| 0.4 | 15.3 1) | 100–600 °C | 1) Tai et al. [359] |
| 17.5 2) | 30–1000 °C | 2) Petric et al. [327] | |
| 16.6 3) | 100–650 °C | 3) Xu et al. [360] | |
| 11–15 4) | 100–700 °C | 4) Fan et al. [361] | |
| 13–14 5) * | RT–950 °C | 5) Bishop et al. [99] | |
| 15.4 6) * | 100–600 °C | 6) Adler [47] | |
| 16.1 7) | Not given | 7) Kim et al. [362] | |
| 15.3 8) | 20–700 °C | 8) Kostogloudis and Ftikos [363] | |
| 0.6 | 16.8 1) | 100–400 °C | 1) Tai et al. [359] |
* These studies have determined thermal and chemical expansion coefficients and are thus less prone to overestimating the thermal expansion coefficient, which can be an issue at higher temperatures due to the influence of a chemical expansion upon reduction.
Table 10.
Linear chemical expansion coefficients upon reduction, , for La1−xSrxCoyFe1−yO3−δ (LSCF) in the order of increasing Co-content (y).
Table 10.
Linear chemical expansion coefficients upon reduction, , for La1−xSrxCoyFe1−yO3−δ (LSCF) in the order of increasing Co-content (y).
| y | Composition | Linear Chemical Expansion Coefficient | Temperature | References |
|---|---|---|---|---|
| 0 | La0.5Sr0.5FeO3−δ La0.3Sr0.7FeO3−δ | 0.059 1) 0.017–0.047 2) | 800 °C 650–875 °C | 1) Fossdal et al. [123] 2) Kharton et al. [364] |
| 0.2 | La0.6Sr0.4Co0.2Fe0.8O3−δ | 0.031 1) 0.032 2) | 700–900 °C 700–890 °C | 1) Bishop et al. [99] 2) Adler [47] |
| 0.5 | La0.5Sr0.5Co0.5Fe0.5O3−δ | 0.036–0.039 1) | 800–1000 °C | 1) Lein et al. [121] |
| 0.8 | La0.6Sr0.4Co0.8Fe0.2O3−δ | 0.022 1) | 800 °C | 1) Wang et al. [365] |
| 1 | La1−xSrxCoO3−δ (x = 0.2–0.7) La0.5Sr0.5CoO3−δ | 0.023–0.024 1) 0.035 2) | 600–900 °C 800 °C | 1) Chen et al. [122] 2) Lein et al. [121] |
Table 11.
Linear thermal expansion coefficients of single perovskite electrode materials, other than LSCF and BSCF.
Table 11.
Linear thermal expansion coefficients of single perovskite electrode materials, other than LSCF and BSCF.
| Composition | Thermal Expansion Coefficient/10−6 K−1 | Temperature Range | References |
|---|---|---|---|
| BaCo0.4Fe0.4Zr0.2O3−δ | 21.9 | 300–700 °C | Duan et al. [366] |
| BaCo0.4Fe0.4Zr0.1Y0.1O3−δ | 21.6 | 300–700 °C | Duan et al. [366] |
| LaNi0.4Co0.2Fe0.4O3−δ LaNi0.3Co0.3Fe0.4O3−δ LaNi0.2Co0.4Fe0.4O3−δ | 14.3 15.5 17.2 | RT–900 °C | Taguchi et al. [325] |
| LaCo0.6Ni0.4O3−δ | 17.2 | RT–900 °C | Wang et al. [367] |
| LaCo0.8Fe0.1Ni0.1O3−δ LaCo0.7Fe0.1Ni0.2O3−δ LaCo0.6Fe0.2Ni0.2O3−δ LaCo0.5Fe0.2Ni0.3O3−δ | 20.8 18.6 19.2 18 | RT–827 °C | Kharton et al. [368] |
| LaNiO3−δ LaNi0.8Fe0.2O3−δ LaNi0.6Fe0.4O3−δ LaNi0.4Fe0.6O3−δ LaNi0.2Fe0.8O3−δ LaFeO3−δ | 12.3 11.5 11 9.9 9.4 9.7 | RT–800 °C | Chiba et al. [369] |
| La0.8Sr0.2MnO3−δ | 11.8 | 30–1000 °C | Tietz et al. [326] |
| La0.8Sr0.2MnO3+δ La0.7Sr0.3MnO3+δ | 14.2 * 14.2 * | RT–400 °C RT–500 °C | Grande et al. [370] |
* These studies have determined expansion coefficients in two temperature ranges: we only use values determined at lower temperatures to avoid influences of chemical expansion upon reduction.
Table 12.
Linear thermal expansion coefficients of BaRECo2−xMxO6−δ and some related double perovskites. The data are separated in different categories: no chemical expansion reported (thermal only, linear over the entire temperature range), separation in different temperature ranges (low temperature LT and high temperature HT) and average over a large temperature range.
| Composition | Thermal Expansion Coefficient/10−6 K−1 | Temperature Range | References |
|---|---|---|---|
| Thermal only | |||
| LaSrMnCoO6−δ | 15.8 | RT–1000 °C | Zhou et al. [390] |
| BaSmCo1.4Fe0.6O6−δ BaSmCo1.2Fe0.8O6−δ | 21.1 21.0 | RT–1100 °C | Volkova et al. [388] |
| BaSmCo2O6−δ | 21.0 | RT–1100 °C | Aksenova et al. [391] |
| BaPr0.7Y0.3Co2O6−δ BaPr0.5Y0.5Co2O6−δ | 17.6 17.2 | 50–800 °C | Zhao et al. [392] |
| BaPrCoCuO6−δ | 15.2 | RT–1000 °C | Zhao et al. [393] |
| LT/HT | |||
| BaLaCo2O6−δ | 24.3 29.8 | 80–900 °C 500–900 °C | Kim et al. [340] |
| BaNdCo2O6−δ | 19.1 21.1 | 80–900 °C 500–900 °C | |
| BaSmCo2O6−δ | 17.1 18.7 | 80–900 °C 500–900 °C | |
| BaGdCo2O6−δ | 16.6 16.8 | 80–900 °C 500–900 °C | |
| BaYCo2O6−δ | 15.8 14.9 | 80–900 °C 500–900 °C | |
| BaPrCo1.95Sc0.05O6−δ | 17.0 27.0 | 30–300 °C 300–1000 °C | Li et al. [376] |
| BaPrCo1.9Sc0.10O6−δ | 16.0 26.0 | 30–300 °C 300–1000 °C | |
| BaPrCo1.8Sc0.20O6−δ | 15.8 25.8 | 30–300 °C 300–1000 °C | |
| BaSmCo1.6Fe0.4O6−δ | 19.0 20.8 | 30–400 °C 400–1100 °C | Volkova et al. [388] |
| BaSmCo1.8Fe0.2O6−δ | 18.4 20.4 | 30–470 °C 470–1100 °C | |
| BaSmCo1.9Fe0.1O6−δ | 18.7 21.1 | 30–500 °C 500–1100 °C | |
| BaGdCo2O6−δ | 18.0 19.6 | 100–350 °C 600–900 °C | Jo et al. [381] |
| BaGdCo2/3Fe2/3Ni2/3O6−δ | 15.2 16.8 | 100–350 °C 600–900 °C | |
| BaGdCo2/3Fe2/3Cu2/3O6−δ | 13.6 15.7 | 100–350 °C 600–900 °C | |
| BaGdCoCuO6−δ | 14.0 12.8 | 100–350 °C 600–900 °C | |
| BaGdCo2O6−δ | 17.6 19.0 | RT–450 °C 500–900 °C | Mogni et al. [394] |
| Ba0.5Sr0.5GdCo1.5Fe0.5O6−δ | 15.4 21.8 | RT–200 °C 300–800 °C | Kuroda et al. [395] |
| BaNdCo2O6−δ | 17.9 22.9 | RT–300 °C RT–900 °C | Kim et al. [375] |
| Ba1.5Sr0.5NdCo2O6−δ | 17.2 26.3 | RT–300 °C RT–900 °C | |
| BaNdCo2O6−δ | 18.3 23.8 | RT–250 °C 350–1000 °C | Cherepanov et al. [373] |
| BaNdCo1.8Fe0.2O6−δ | 18.8 21.9 | RT–250 °C 350–1000 °C | |
| BaNdCo1.6Fe0.4O6−δ | 18.9 21.9 | RT–250 °C 350–1000 °C | |
| BaNdCo1.4Fe0.6O6−δ | 18.3 22.1 | RT–250 °C 350–1000 °C | |
| BaNdCo1.2Fe0.8O6−δ | 18.4 21.9 | RT–250 °C 350–1000 °C | |
| Average over whole T range | |||
| BaPrCo2/3Fe2/3Cu2/3O6−δ | 16.6 | 30–850 °C | Jin et al. [383] |
| BaPrCo1.6Ni0.4O6−δ BaNdCo1.6Ni0.4O6−δ BaSmCo1.6Ni0.4O6−δ | 20.6 19.4 16.6 | 30–1000 °C | Che et al. [345] |
| BaPrCo2O6−δ | 21.5 | 50–800 °C | Zhao et al. [392] |
| BaPrCuCoO6−δ | 24.1 | 30–1000 °C | Zhao et al. [393] |
| Ba0.5Sr0.5PrCo1.5Fe0.5O6−δ Ba0.5Sr0.5PrCo0.5Fe1.5O6−δ | 21.3 19.2 | RT–900 °C | Jiang et al. [384] |
| BaPrCo2O6−δ BaPrCo1.5Fe0.5O6−δ BaPrCoFeO6−δ BaPrCo0.5Fe1.5O6−δ BaPrFe2O6−δ | 24.6 26.0 25.0 19.1 17.2 | 20–800 °C | Zhao et al. [385] |
| Ba0.5Sr0.5PrCo1.9Ni0.1O6−δ Ba0.5Sr0.5PrCo1.7Ni0.3O6−δ | 21.9 19.7 | 30–900 °C | Liu et al. [380] |
| BaPrCoFeO6−δ BaNdCoFeO6−δ | 21.0 19.5 | 30–1000 °C | Jin et al. [344] |
| BaNdCo2O6−δ | 23.0 | RT–1100 °C | Aksenova et al. [391] |
| Ba0.5Sr0.5NdCo2O6−δ Ba0.5Sr0.5NdCo1.75Mn0.25O6−δ Ba0.5Sr0.5NdCo1.5Mn0.5O6−δ | 20.3 16.4 14.3 | RT–900 °C | Kim et al. [377] |
| BaNdCo2O6−δ BaNdFe2O6−δ BaGdCo2O6−δ BaGdFe2O6−δ | 21.5 18.3 19.9 18.8 | 80–900 °C | Kim et al. [387] |
| BaGdCoCuO6−δ Ba0.25Sr0.75GdCoCuO6−δ Ba0.25Sr0.75NdCoCuO6−δ | 16.3 16.0 17.0 | RT–900 °C | West et al. [374] |
| BaGdCo1.9Ni0.1O6−δ BaGdCo1.7Ni0.3O6−δ | 18.9 15.5 | 30–900 °C | Wei et al. [331] |
| BaYCo2O6−δ BaYCo1.8Cu0.2O6−δ BaYCo1.6Cu0.4O6−δ BaYCo1.4Cu0.6O6−δ BaYCo1.2Cu0.8O6−δ | 17.8 16.7 15.7 14.7 13.4 | 30–850 °C | Zhang et al. [382] |
| BaYCo2O6−δ BaYCo1.6Fe0.4O6−δ | 16.3 18.0 | 30–900 °C | Xue et al. [389] |
| SrSmCo2O6−δ SrSmCo1.8Mn0.2O6−δ SrSmCo1.6Mn0.4O6−δ SrSmCo1.4Mn0.6O6−δ SrSmCo1.2Mn0.8O6−δ SrSmCoMnO6−δ | 22.6 21.0 20.8 18.0 17.5 13.7 | RT–850 °C | Wang et al. [378] |
Table 13.
Linear thermal expansion coefficients of Ruddlesden-Popper structured oxides.
| Composition | Thermal Expansion Coefficient/10−6 K−1 | Temperature Range | References | |
|---|---|---|---|---|
| LaSrCoO4−δ La0.9Sr1.1CoO4−δ La1.1Sr0.9CoO4−δ | 25.3 24.3 25.4 | 300–700 °C | Hu et al. [397] | |
| Sr3Fe2O6+δ | 20 | RT–900 °C | Prado et al. [398] | |
| Pr2NiO4+δ La2NiO4+δ Nd2NiO4+δ | 13.4 13 12.4 | 400–1000 °C | Flura et al. [399] | |
| La2NiO4+δ Pr2NiO4+δ Nd2NiO4+δ | 13 13.6 12.7 | RT–950 °C | Boehm et al. [406] | |
| La2NiO4+δ | 13.7 | RT–900 °C | Skinner et al. [402] | |
| La2Ni0.5Cu0.5O4+δ La2NiCuO4+δ | 12.8 8.6 13.6 | RT–950 °C RT–250 °C 250–900 °C | Boehm et al. [403] | |
| Lan+1NinO3n+1 | n = 1 n = 2 n = 3 | 13.8 13.2 13.2 | RT–900 °C | Amow et al. [400,401] |
| La2−xPrxNiO4+δ 0≤ x ≤ 0.2 | 13–13.5 | RT–1000 °C | Vibhu et al. [404] | |
© 2018 by the authors. Licensee MDPI, Basel, Switzerland. This article is an open access article distributed under the terms and conditions of the Creative Commons Attribution (CC BY) license (http://creativecommons.org/licenses/by/4.0/).
Share and Cite
MDPI and ACS Style
Løken, A.; Ricote, S.; Wachowski, S. Thermal and Chemical Expansion in Proton Ceramic Electrolytes and Compatible Electrodes. Crystals 2018, 8, 365. https://doi.org/10.3390/cryst8090365
AMA Style
Løken A, Ricote S, Wachowski S. Thermal and Chemical Expansion in Proton Ceramic Electrolytes and Compatible Electrodes. Crystals. 2018; 8(9):365. https://doi.org/10.3390/cryst8090365
Chicago/Turabian StyleLøken, Andreas, Sandrine Ricote, and Sebastian Wachowski. 2018. "Thermal and Chemical Expansion in Proton Ceramic Electrolytes and Compatible Electrodes" Crystals 8, no. 9: 365. https://doi.org/10.3390/cryst8090365
Note that from the first issue of 2016, this journal uses article numbers instead of page numbers. See further details here.