Article

Investigation of Approaches to Control the Compositions of Zn(Se,OH) Buffers Prepared by Chemical Bath Deposition Process for Cu(In,Ga)Se2 (CIGS) Solar Cells

Department of Electrical Engineering, National Dong Hwa University, No. 1, Section 2, University Road, ShouFeng, Hualien 97401, Taiwan
*
Author to whom correspondence should be addressed.
Crystals 2018, 8(9), 343; https://doi.org/10.3390/cryst8090343
Submission received: 31 July 2018 / Revised: 20 August 2018 / Accepted: 23 August 2018 / Published: 26 August 2018

Abstract

:
We deposited zinc-based films with various ammonia (ammonium hydroxide; NH4OH) and selenourea concentrations, at the bath temperature of 80 °C, on soda-lime glass substrates using the chemical bath deposition (CBD) process. We analyzed the results using X-ray photoelectron spectroscopy (XPS), which showed binding energies of zinc, selenium, and oxygen. The as-deposited films, containing zinc selenide, zinc oxide, and zinc hydroxide, were also verified. The films prepared in this investigation can be referred to a zinc compound, characterized as Zn(Se,OH). A conformal coverage of the Zn(Se,OH) films, with the smooth surface morphologies, was obtained by optimizing the ammonia or selenourea concentrations in the deposition solutions. The Zn(Se,OH) films had a preferred (111) orientation, corresponding to a cubic crystal structure. The bandgap energies of the as-deposited Zn(Se,OH) films were determined from the optical absorption data, suggesting a dependence of the bandgap energies on the atomic percentages of ZnSe, Zn(OH)2 and ZnO in the films. The same variation tendency of the compositions and the bandgap energies for the films, deposited with an increment in the ammonia or selenourea concentrations was achieved, attributing to the facilitation of ZnSe formation. These results show that the compositions, and therefore the bandgap energies, can be controlled by the ammonia concentrations, or selenourea concentrations.

Graphical Abstract

1. Introduction

The Cu(In,Ga)Se2 (CIGS) solar cells prepared by the co-evaporation process [1], and the Cu(In,Ga)(Se,S)2 (CIGSS) solar cells prepared by the sulfurization after selenization (SAS) process [2], employed a thin CdS film as the buffers have reached the conversion efficiencies of over 22%. Even though various II-VI semiconductor compounds, including CdS, (Cd,Zn)S, ZnS, Zn(O,S,OH)x, ZnO, ZnSe, Inx(OH,S)y, In2S3, etc., have been prepared by different deposition methods of chemical bath deposition (CBD), such as atomic layer deposition (ALD), ionic layer gas atomic reaction (ILGAR), metal organic chemical vapor deposition (MOCVD), physical vapor deposition (PVD), or other deposition processes [3,4,5], the CdS buffer layers prepared by the CBD method achieved the best performance of CIGS-based solar cells. The CBD method is a favorite process for mass production of CIGS-based modules, providing a simple and cost-effective approach for large-area fabrication.
The CIGS-based solar cells, with the CBD CdS buffers, have reached the efficiencies of greater than 22% [1,2]. Although the CdS buffers play a critical role for CIGS-based solar cells, the demand of the wider bandgap materials, as well as the toxicity of cadmium, motivate to search for the Cd-free buffers as a replacement for the CIGS-based solar cells. The Zn(O,S,OH)x buffers for the CIGSS solar cells have reached the efficiency of 22.0% [6]. In addition, the In(OH)xSy buffer layers have achieved the efficiency of 15.7% as well [7]. Besides the ZnS-based and the InS-based buffers, the ZnSe buffers prepared by CBD process have been applied for the CIGS-based solar cells [8,9,10,11,12,13]. The active-area efficiency of the CIGSS solar cell with the ZnSe buffer was reported to be 15.7% [9,10]. W. Eisele et al. employed a Zn(OH)2/Zn(Se,OH) buffer for the CIGSS solar cells, and achieved the total-area efficiency of 14.4% [11]. An investigation of Zn(Se,O) buffers on the CuInS2 solar cells was carried out as well [14]. Although the wide bandgap buffers allow the absorbers of the CIGS-based solar cells to absorb more short-wavelength photons and improve the short-circuit current density, the band offset at the interface between the buffers and the CIGS-based absorbers play a critical role in impacting the interface recombination of the CIGS-based solar cells, which has been addressed in the literature [15,16,17,18]. On the other hand, the effects of the band alignment between the n-type emitters and the CdTe absorbers for the CdTe thin-film solar cells were discussed [19]. Furthermore, the studies to quantify the interface recombination losses of the CIGS-based and the CdTe thin-film solar cells have been reported [20,21].
To take the advantages of the wide bandgap buffers of the Zn(Se,OH) compounds, we conducted a systematic study on the CBD Zn(Se,OH) films. The ammonia concentrations and selenourea concentrations were employed as the variables to study their impacts on the characteristics of the Zn(Se,OH) films including the surface morphologies, compositions, and bandgap energies. In terms of efficiency for the CIGS solar cells, the buffer layers are required to provide a uniform coverage on the top of the CIGS films, and to avoid the formation of the shunt path between the CIGS and the ZnO:Al (AZO) layers. The coverage of buffers was assessed by analyzing the FESEM (field emission scanning electron microscopy) images of surface morphology for the as-deposited Zn(Se,OH) films.

2. Experimental Details

The chemical-bath-deposited Zn(Se,OH) films were grown on the soda-lime glass substrates with zinc sulfate (ZnSO4, Alfa Aesar, Ward Hill, MA, USA), selenourea (SeC(NH2)2, SU, Alfa Aesar, Ward Hill, MA, USA), hydrazine hydrate (N2H4, Alfa Aesar, Ward Hill, MA, USA), and ammonia (Alfa Aesar, Ward Hill, MA, USA) at the bath temperature of 80 °C. The zinc sulfate and selenourea served as the zinc source and selenium source, respectively. Both hydrazine hydrate and ammonia acted as the complex agents for the chemical reaction. In addition, the ammonia was employed to adjust the pH values of the deposition solutions. The deposition time was 15 min. We separately controlled the ammonia concentrations and the selenourea concentrations in the deposition solutions to deposit the films, and investigate their impacts on the characteristics of the films. The variation ranges of the ammonia concentrations and the selenourea concentrations were from 0.6 M to 2.6 M and from 0.0075 M to 0.075 M, respectively.
The surface morphologies and the crystal structures of the as-deposited films were studied by field emission scanning electron microscopy and X-ray diffraction (XRD, D/Max-2500V, Rigaku Corporation, Tokyo, Japan) analysis, respectively. The XPS analysis was conducted by using an XPS system (Thermo Scientific, Waltham, MA, USA), equipped with an Al Kα X-ray source, and a double-focusing hemispherical analyzer, whose corresponding energy and wavelength were 1486.7 eV and 0.834 nm, respectively. The optical transmittances of films were measured with an UV/VIS spectrophotometer (V-650, JASCO Corporation, Tokyo, Japan) in the wavelength range of 300–900 nm.

3. Results and Discussion

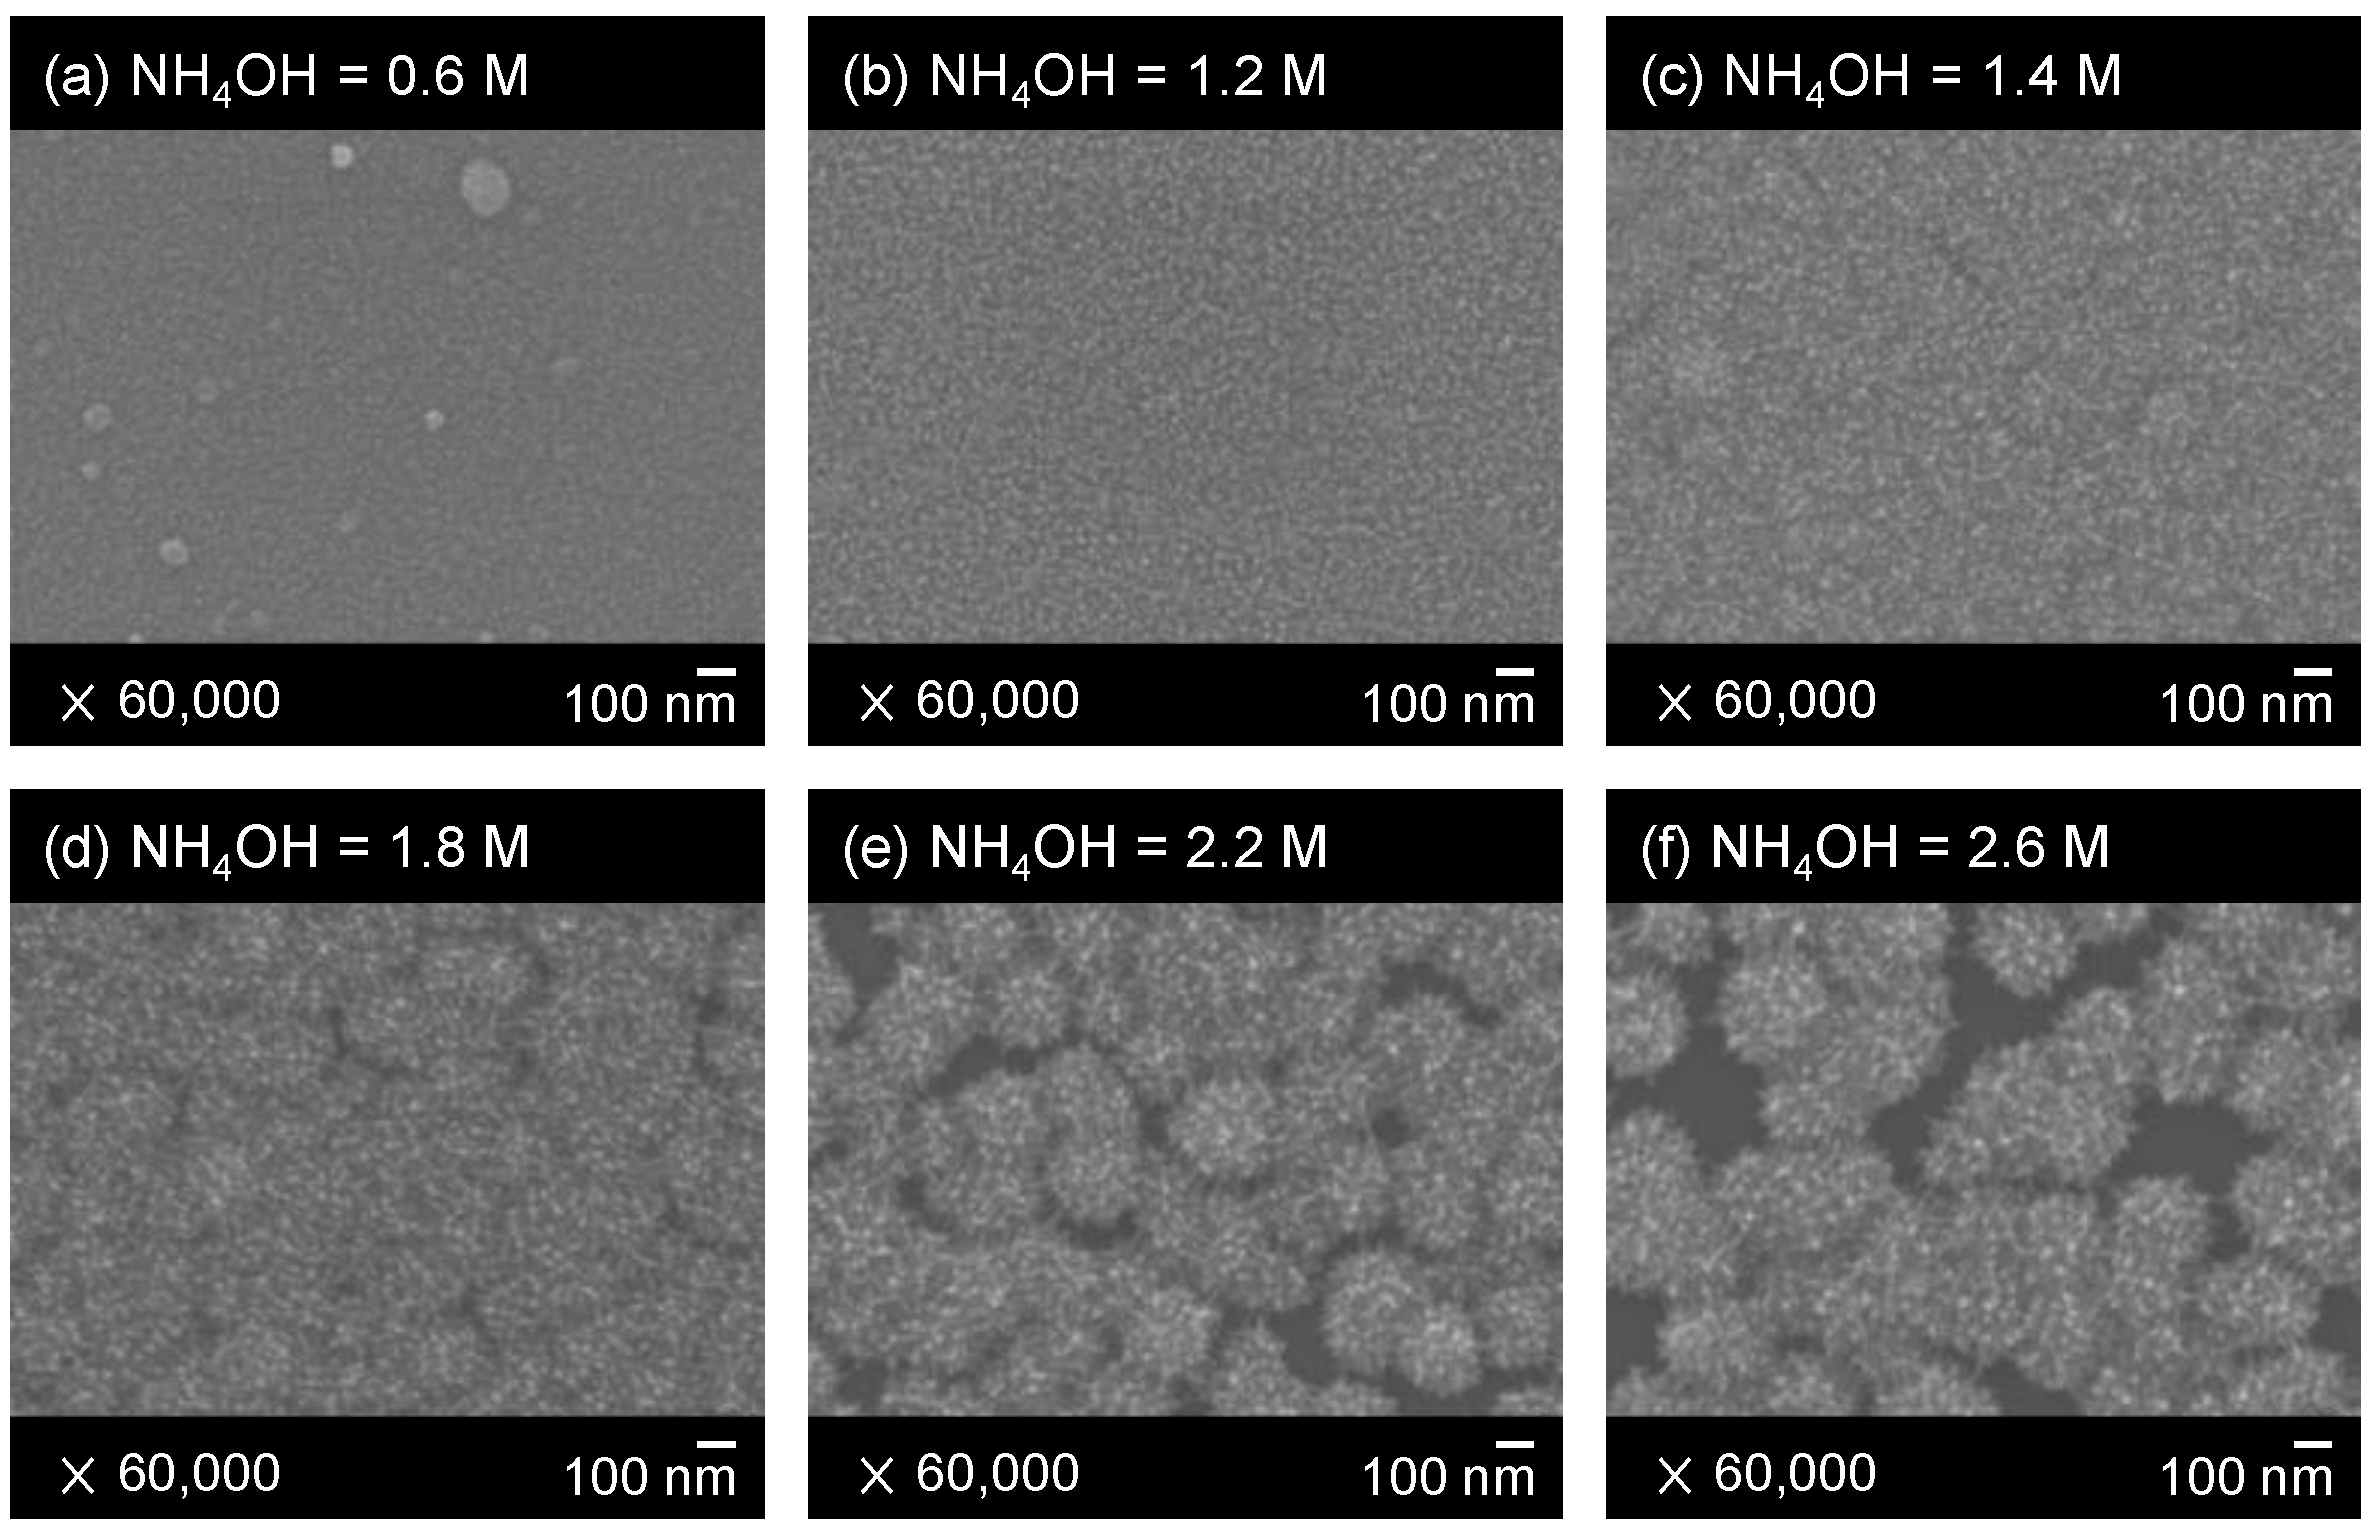
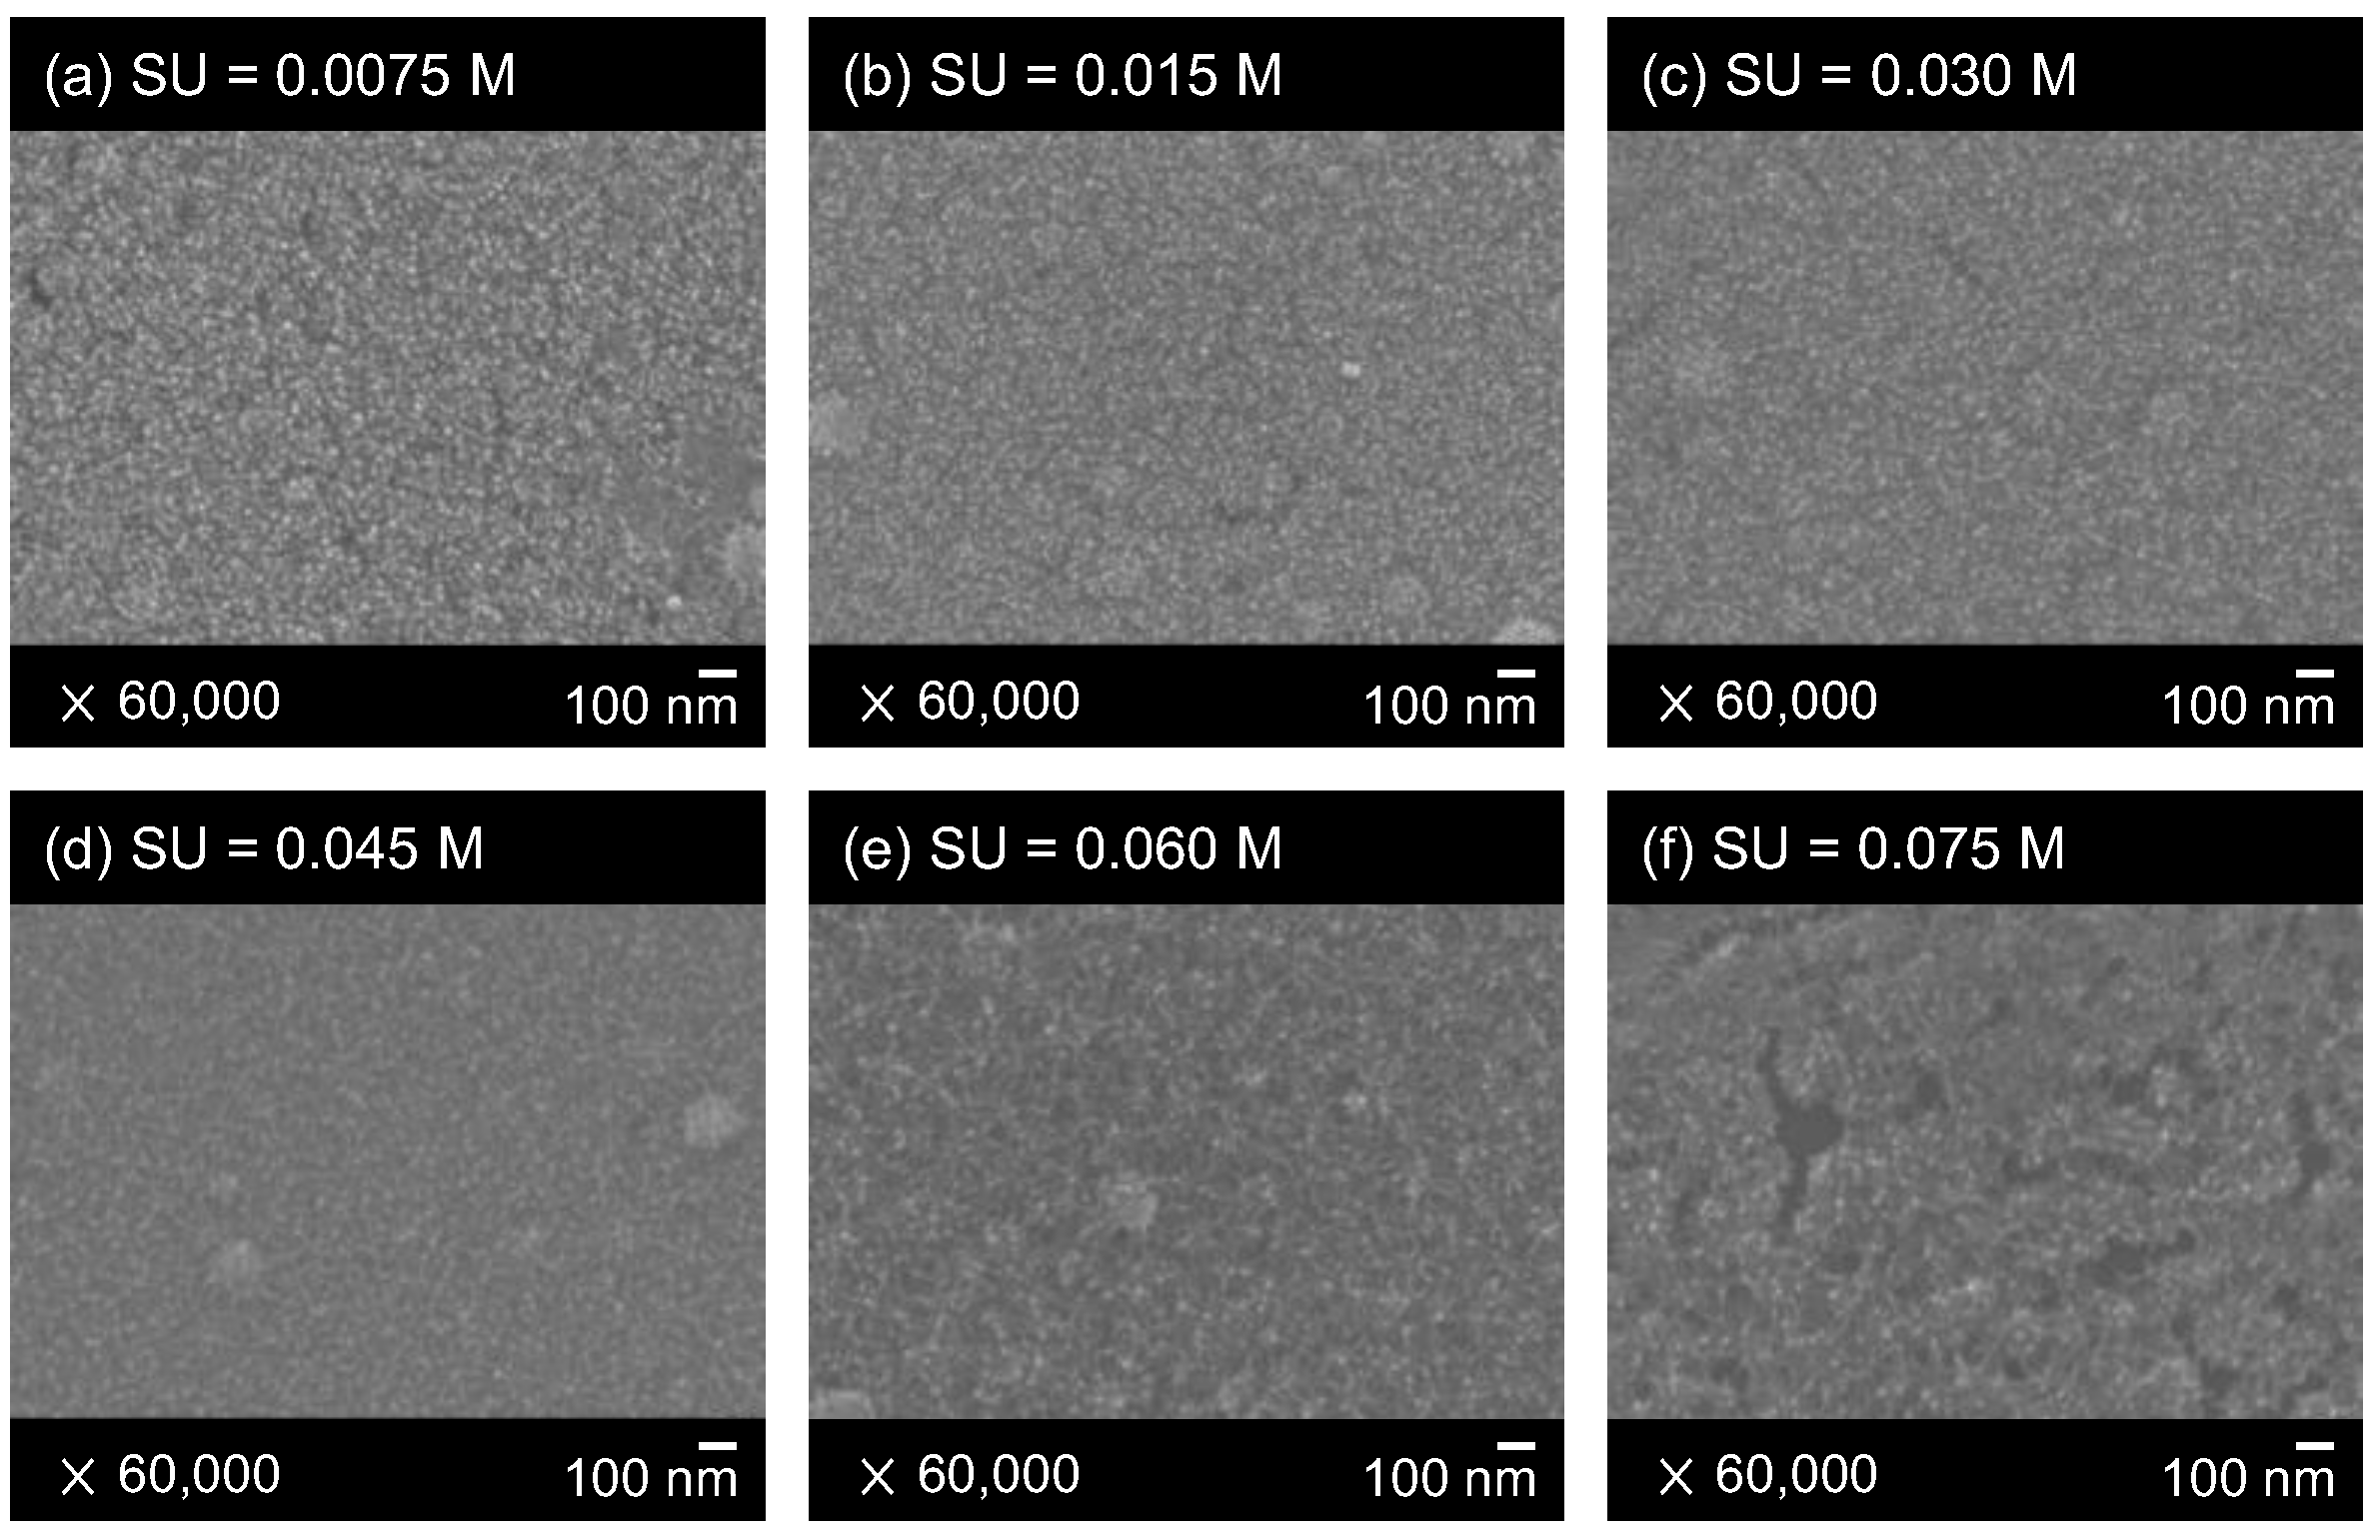
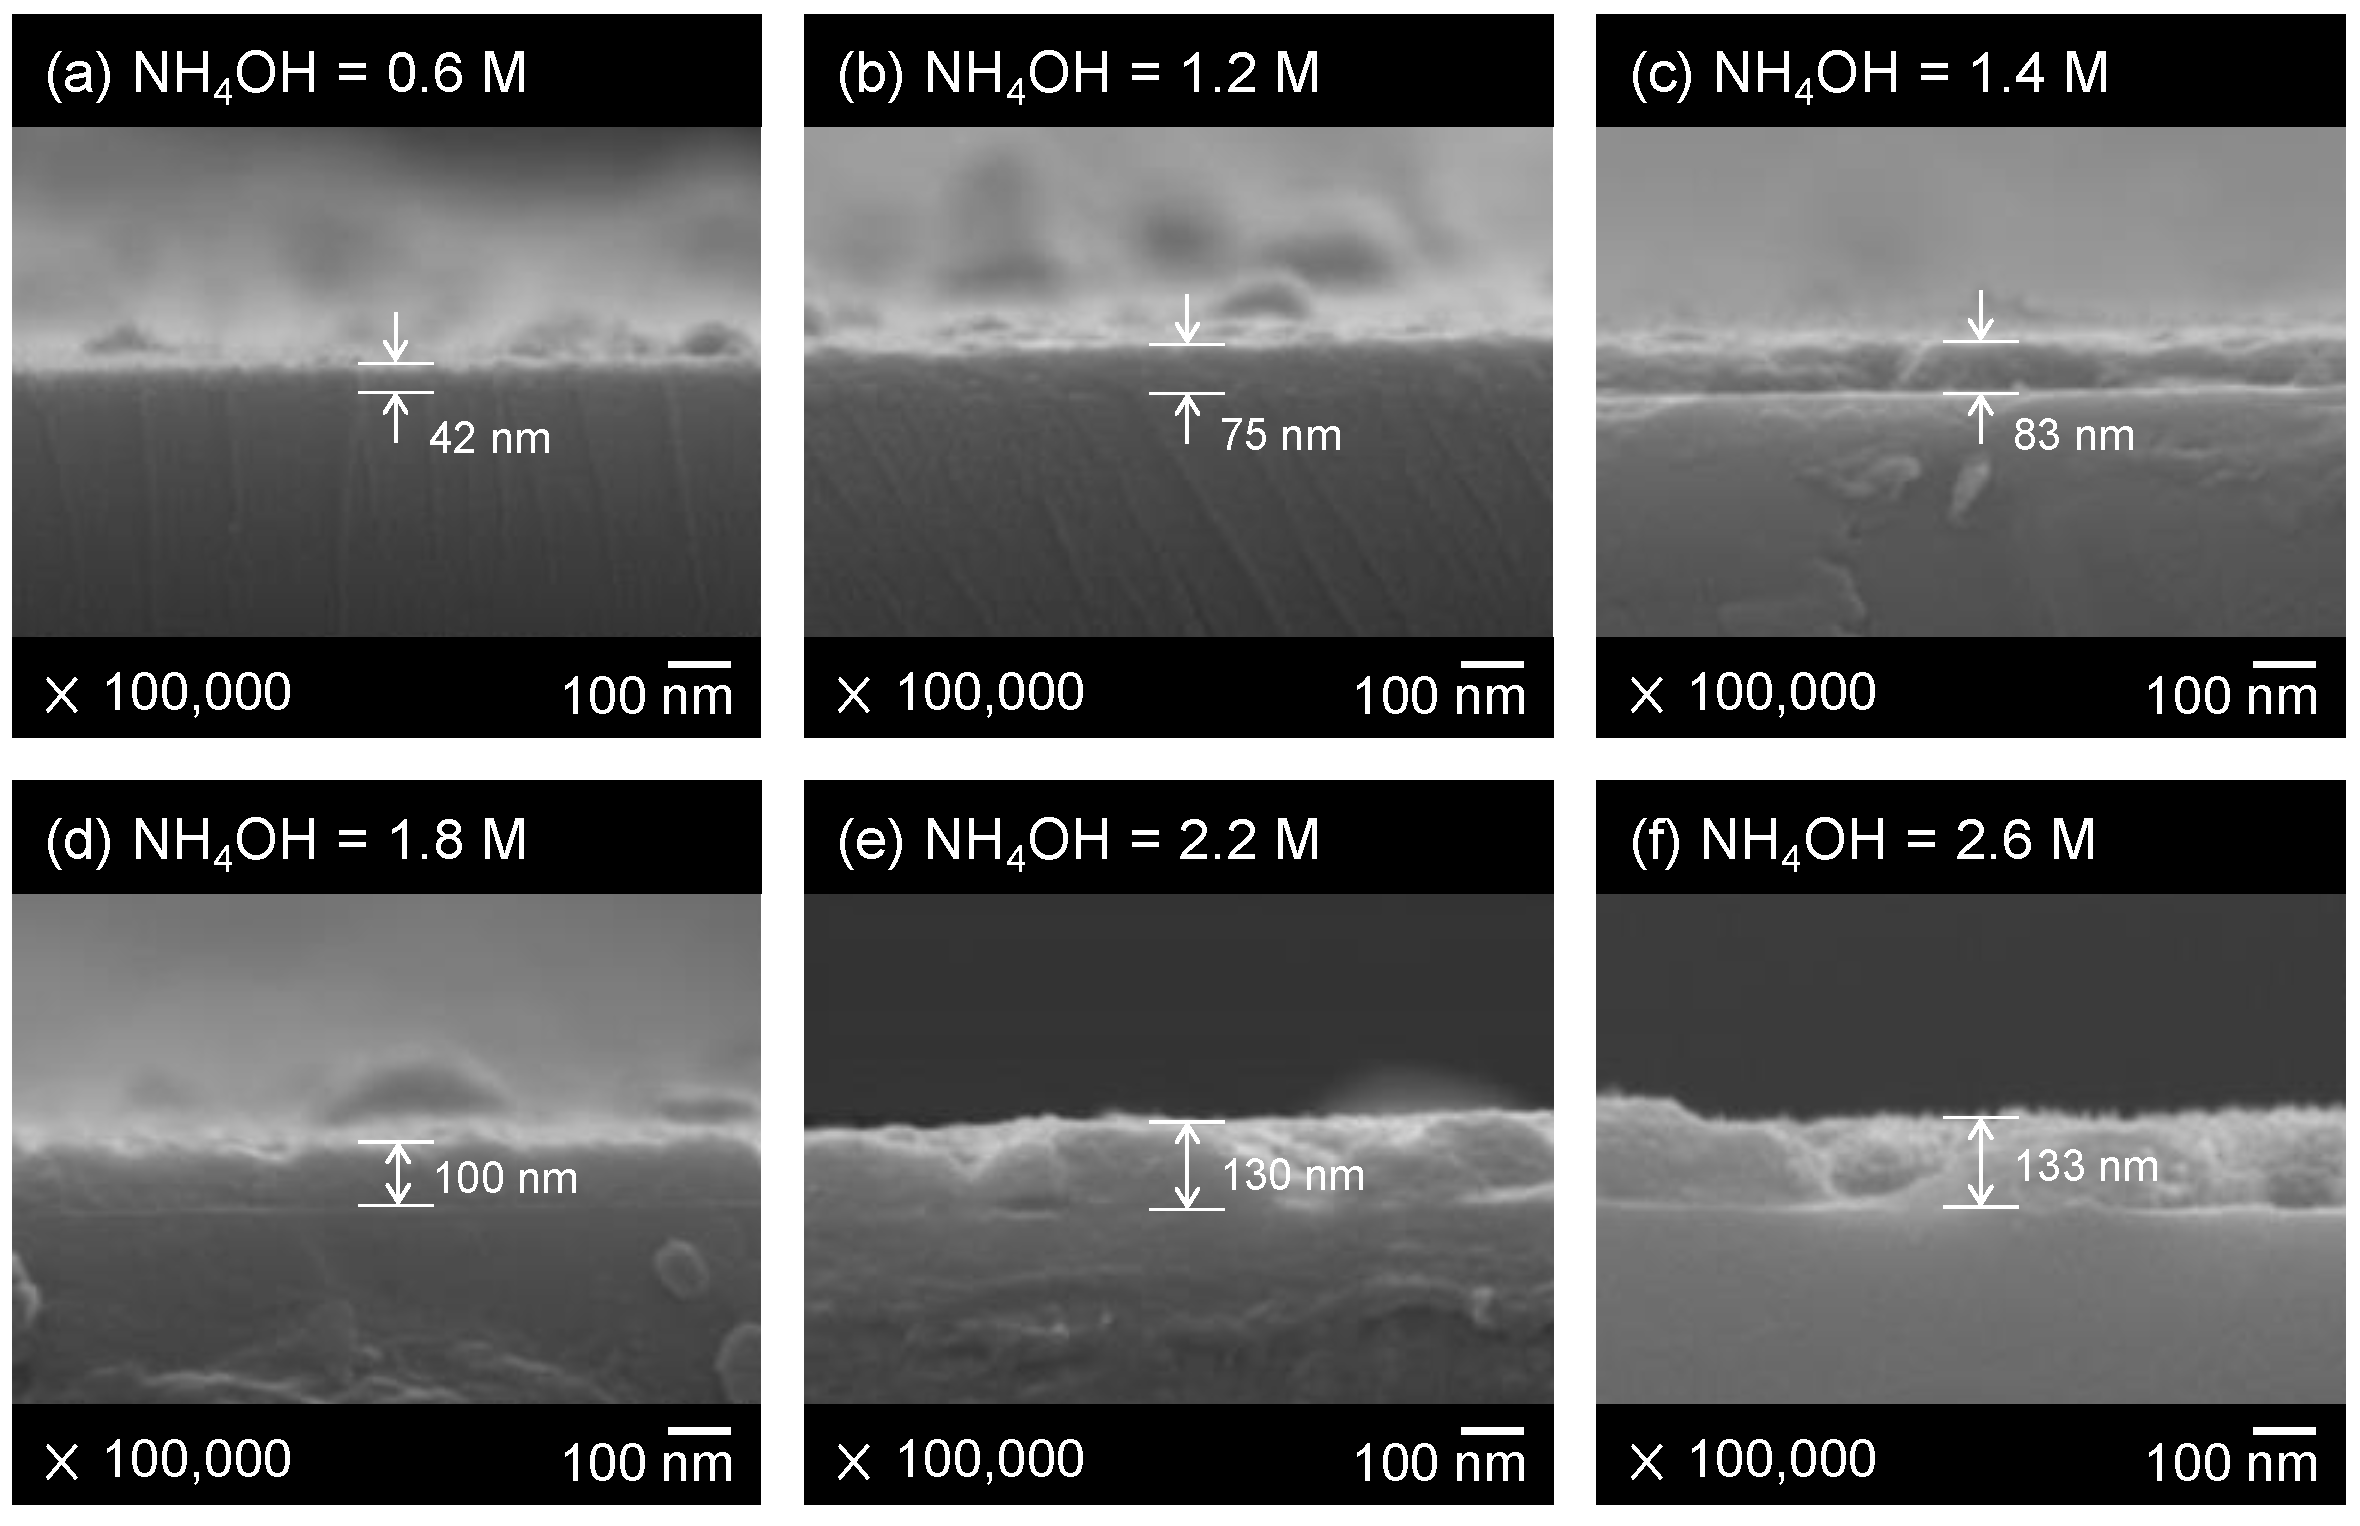
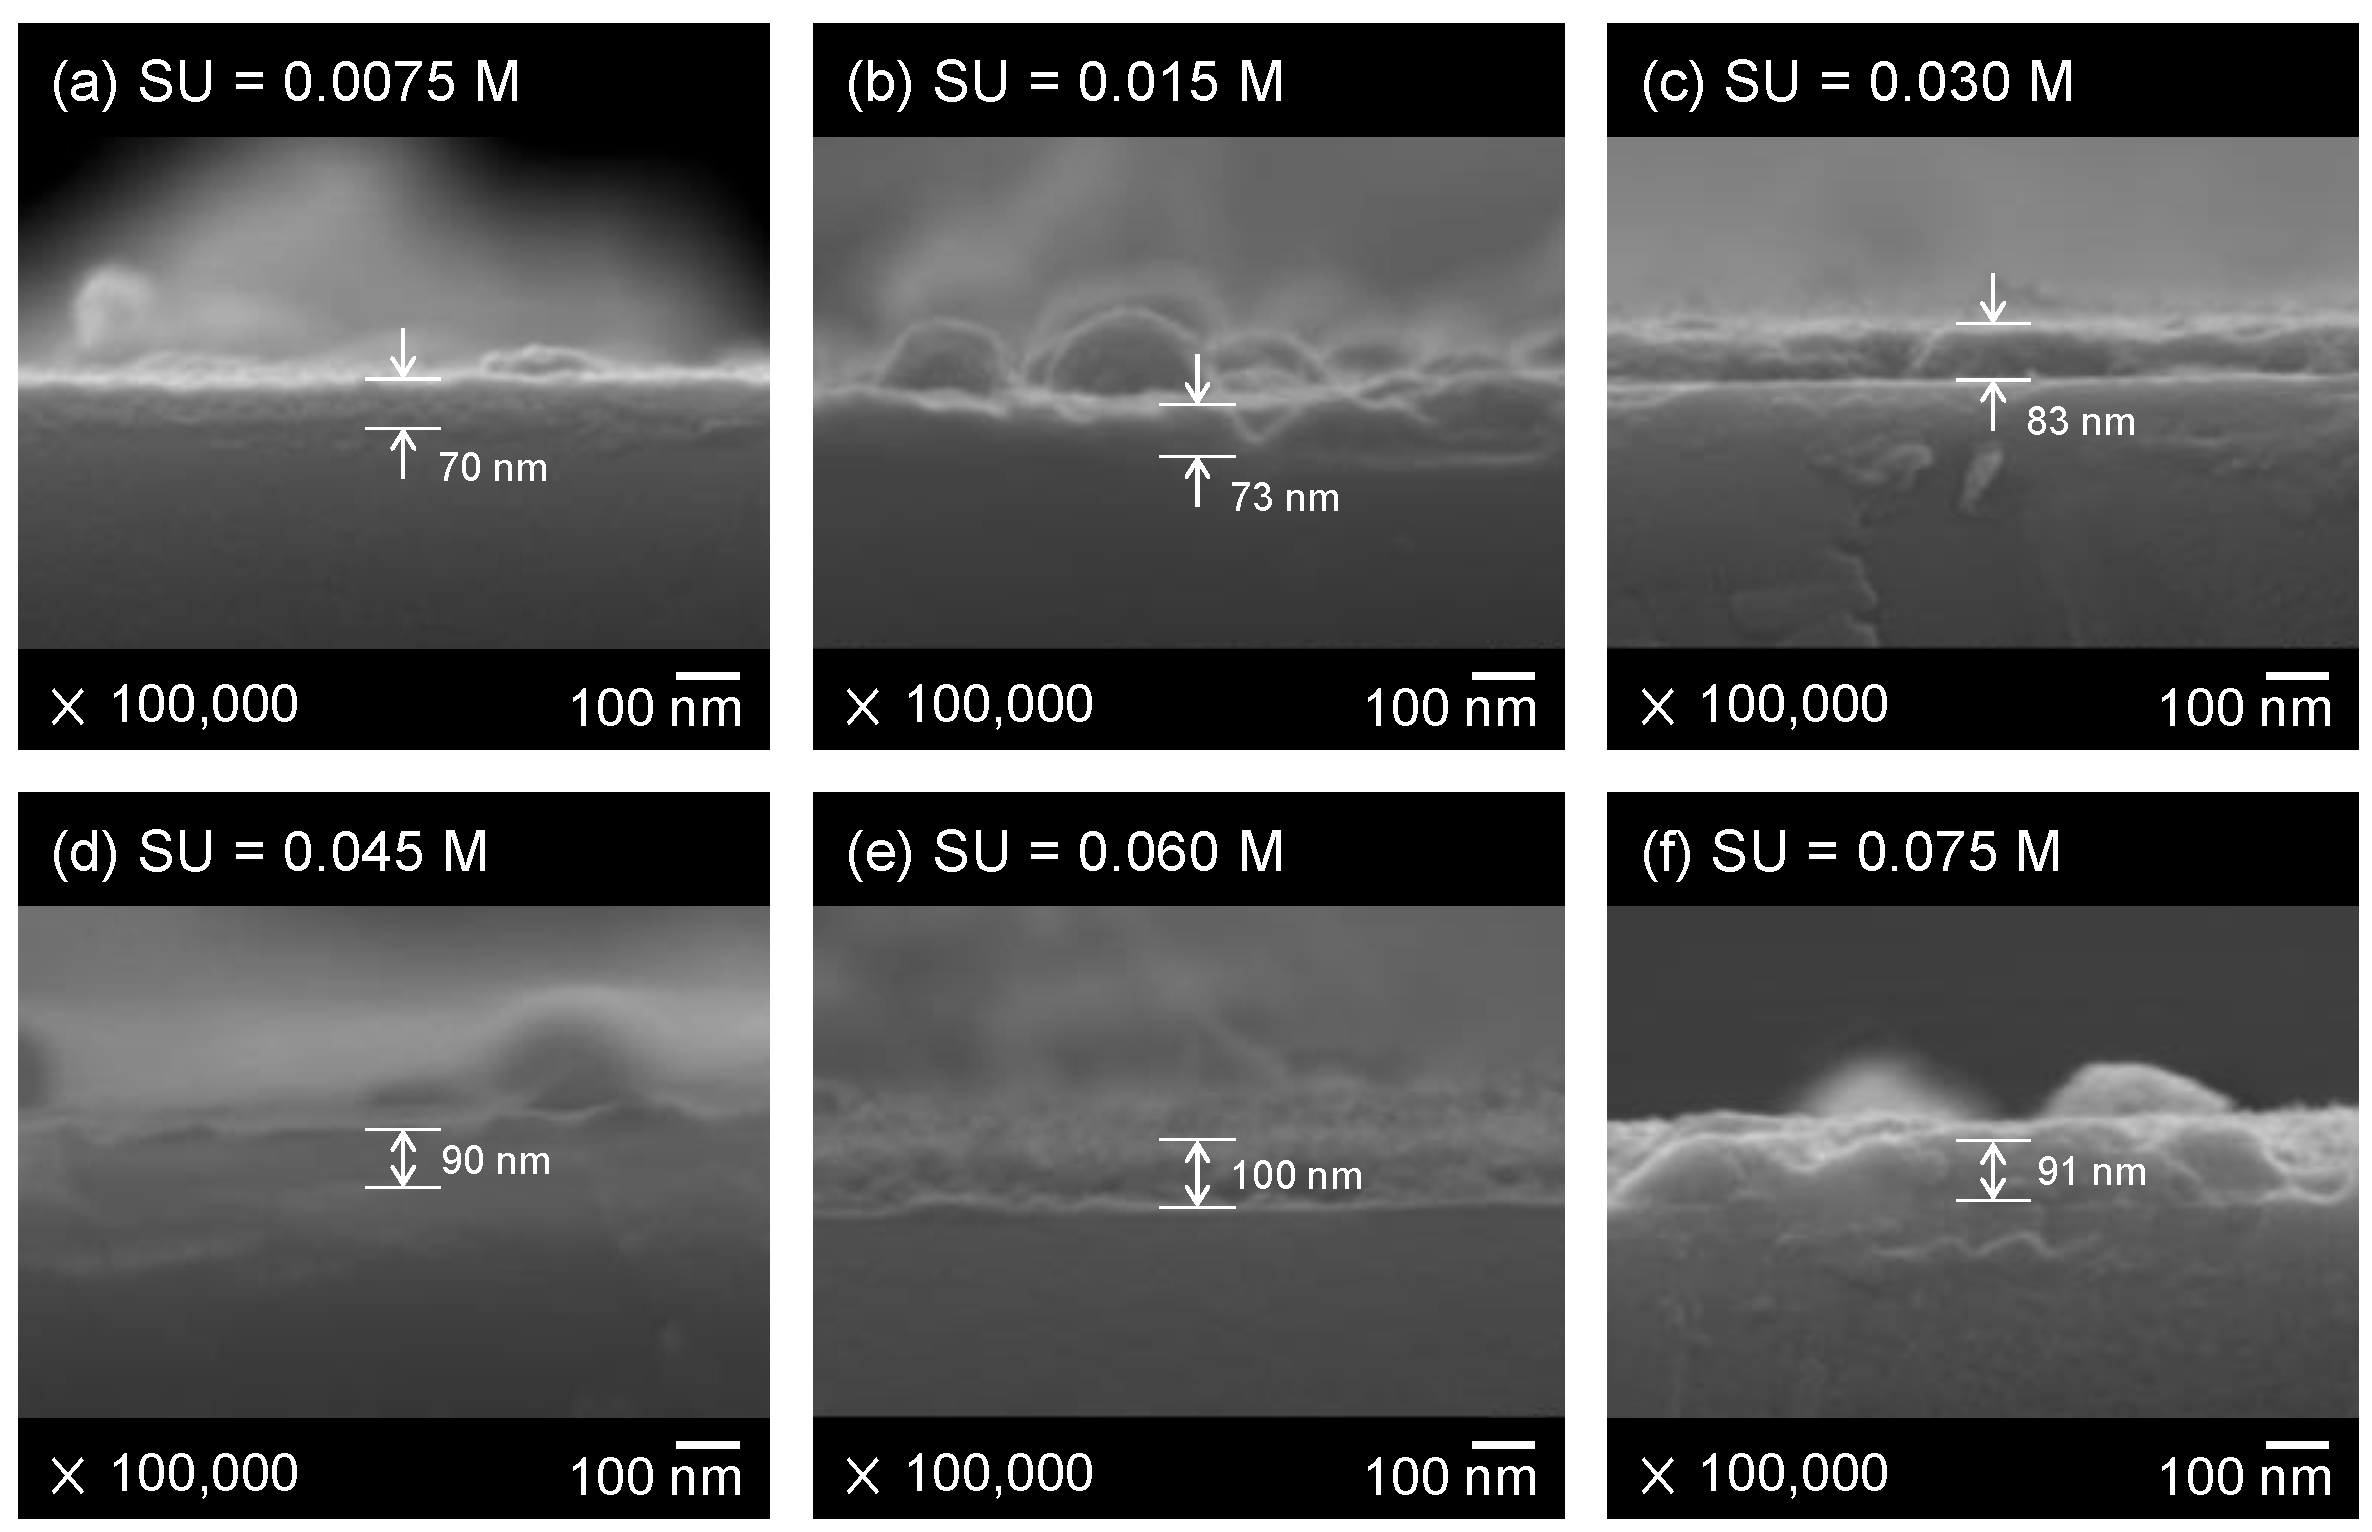
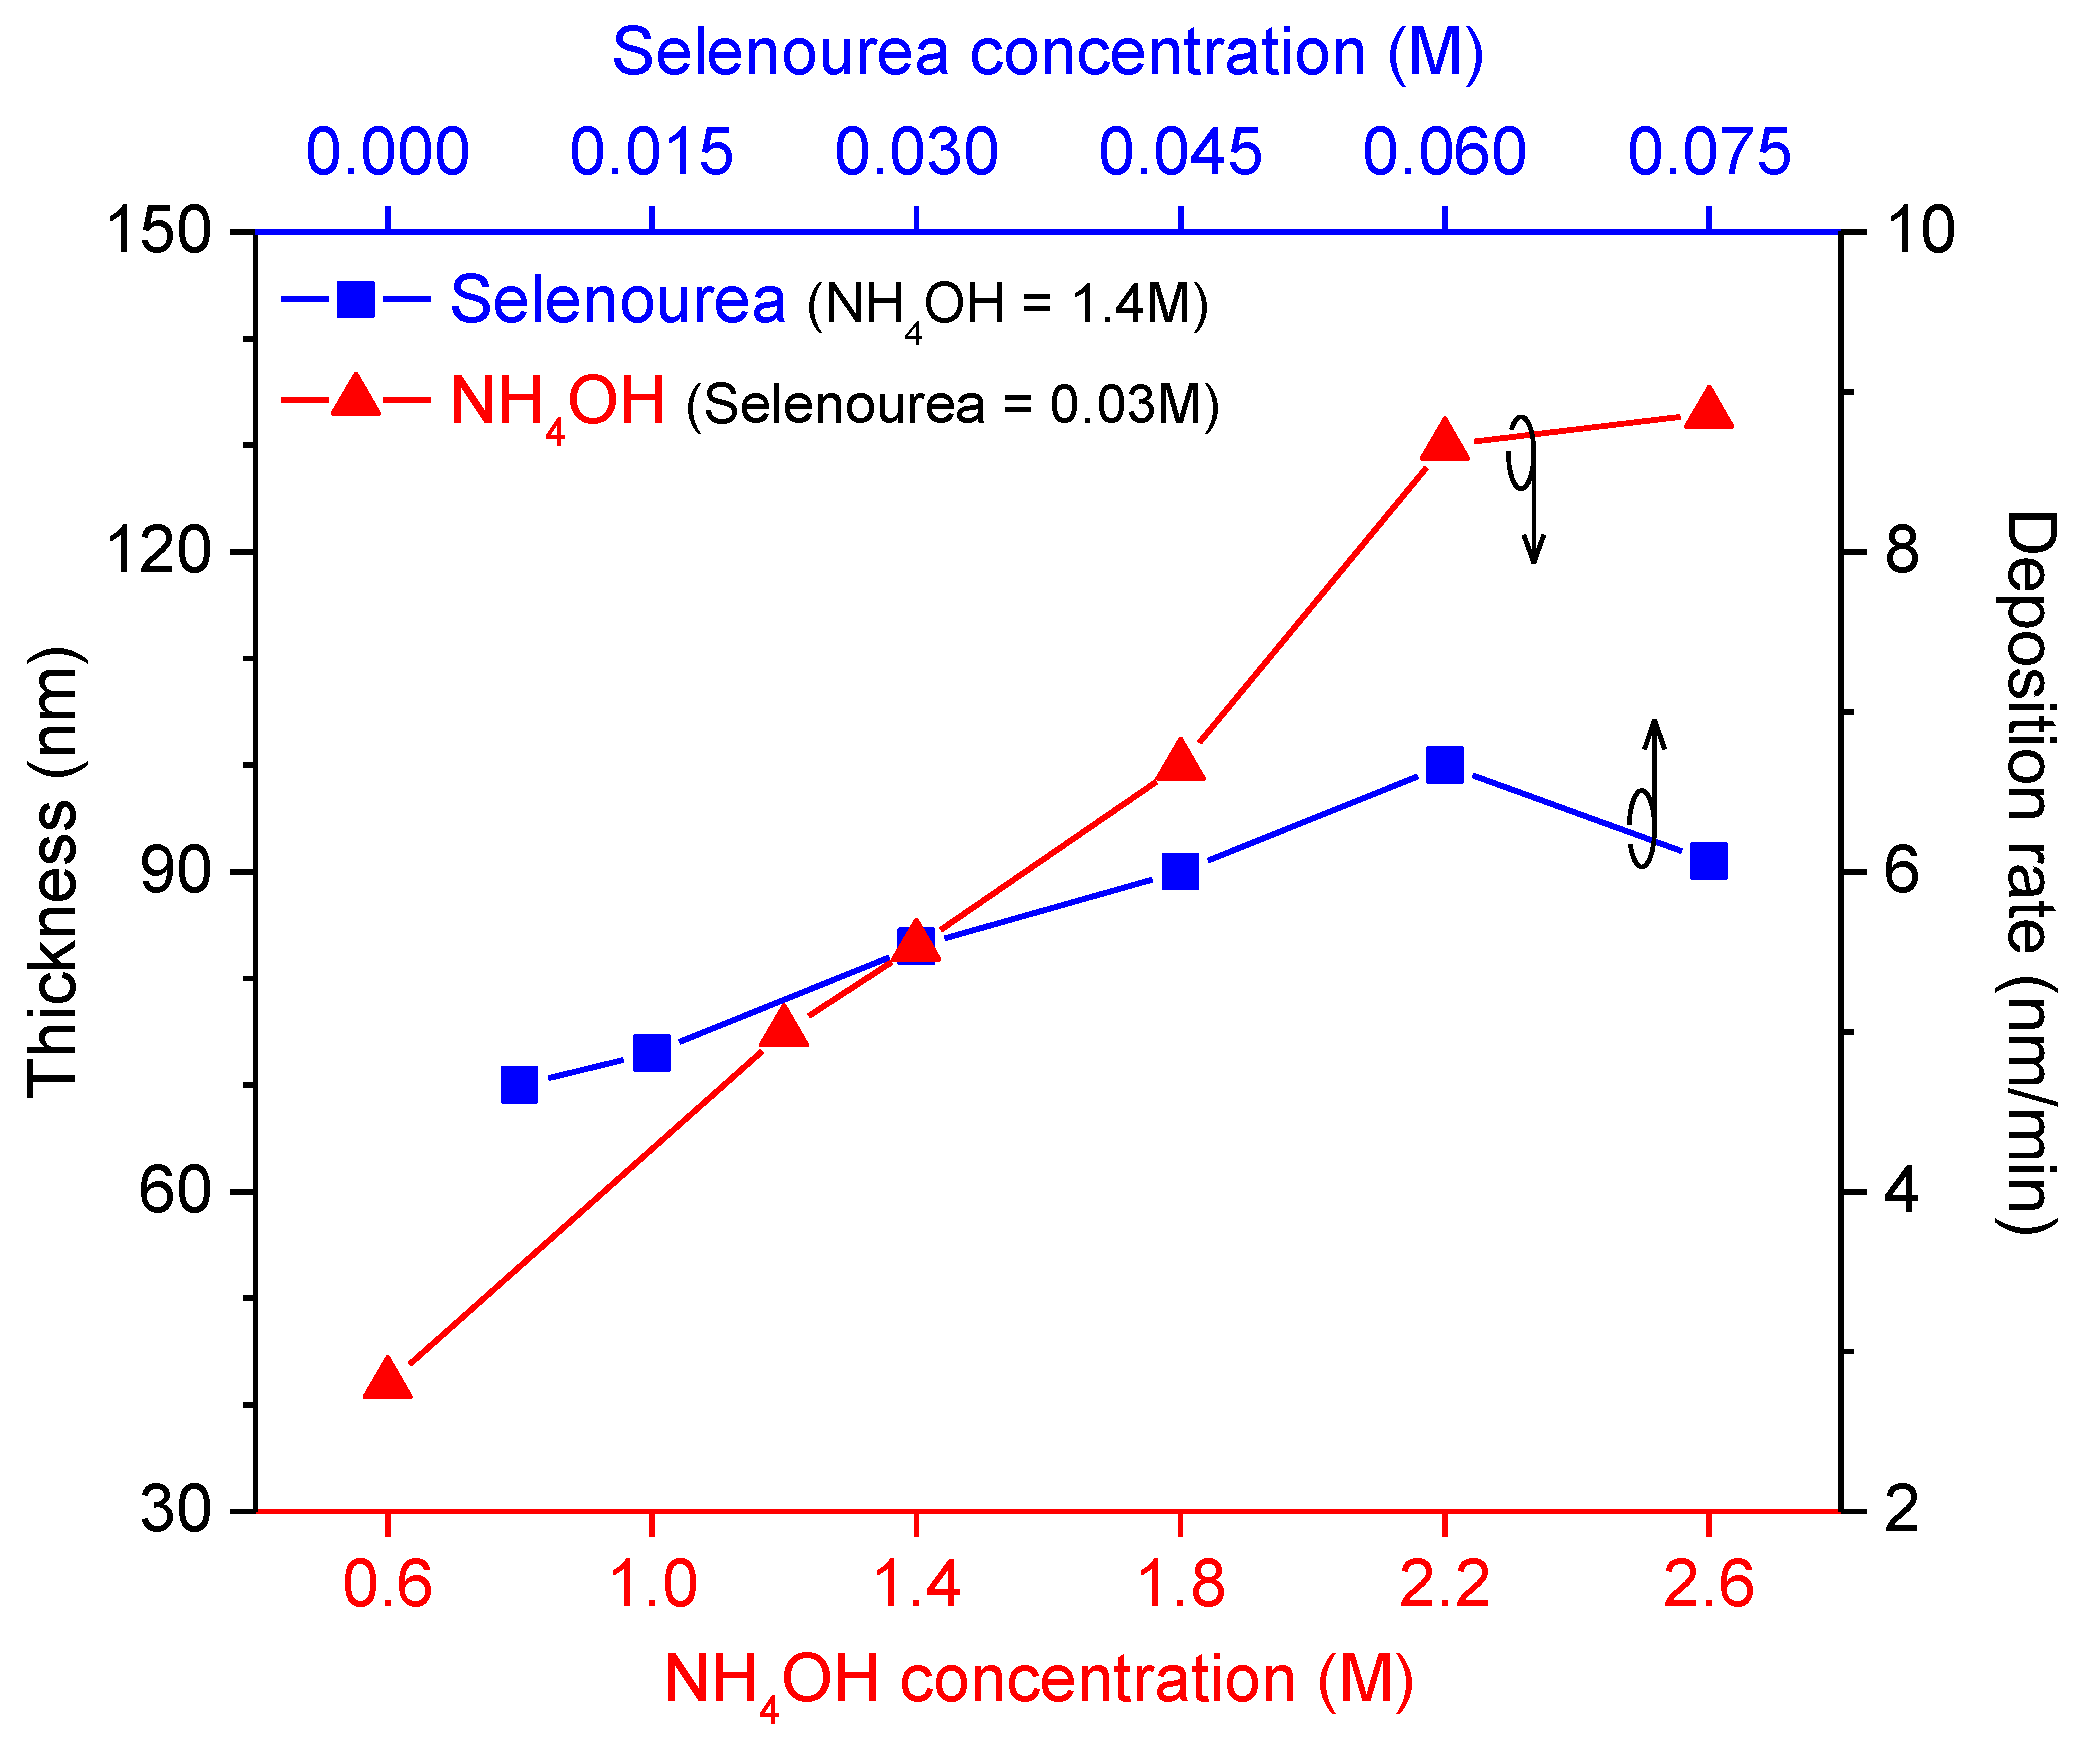
3.1. Surface Morphologies

One of the important requirements for the buffers of the CIGS solar cells is to provide a well coverage on the top of CIGS films, which not only facilitates the formation of the electric junction but also prohibits the formation of the shunt path between the AZO and CIGS layers. Since the sputtering processes of the window layers may cause the potential bombarding effects, the buffers are able to act as a protection layer to avoid the possible damage on the surface of the CIGS absorbers. The coverage of buffers was examined by studying the top views of the FESEM images for the as-deposited Zn(Se,OH) films. The effects of ammonia and selenourea concentrations on the surface morphologies of the Zn(Se,OH) films, prepared on the soda-lime glass substrates by the CBD process, were investigated.
Figure 1 shows the surface morphologies of the Zn(Se,OH) films deposited with a constant selenourea concentration of 0.03 M and the ammonia concentrations varying from 0.6 M to 2.6 M. The impact of the ammonia concentrations on the grain sizes of the Zn(Se,OH) films was not significant. The Zn(Se,OH) films deposited with the ammonia concentrations of 0.6 M to 1.4 M had the better surface morphologies. Whereas the ammonia concentration was increased to 1.8 M or greater, the grains started to aggregate, which could not provide a good coverage of the as-deposited films on the glass substrates, as shown in Figure 1d–f. The clusters of the grains were even formed for the greater ammonia concentrations of 2.2 M and 2.6 M.
On the other hand, for the ammonia concentration kept at 1.4 M, the selenourea concentrations were employed as a variable to study its impacts on the surface morphologies of the Zn(Se,OH) films. As exhibited in Figure 2, the dependence of the grain sizes of the films on the selenourea concentrations was not obvious. A better coverage of the Zn(Se,OH) films was achieved for the selenourea concentrations varying from 0.03 M to 0.06 M. For the surface morphologies of the Zn(Se,OH) films shown in Figure 2a,f, either the high concentration of the excess Se ions or the low concentration of the insufficient Se ions did not favor to form a good coverage of the as-deposited films on the glass substrates. Thus, for the selenourea concentrations of 0.0075 M and 0.075 M, the as-deposited Zn(Se,OH) films could not fully cover the glass substrates. For the given deposition conditions, the best surface morphology has been achieved for the Zn(Se,OH) film deposited with the selenourea concentration of 0.045 M.
The cross-sectional views of the Zn(Se,OH) films deposited with a constant selenourea concentration of 0.03 M and the ammonia concentrations of 0.6 M to 2.6 M is depicted in Figure 3. Besides, Figure 4 displays the cross-sectional views of the Zn(Se,OH) films deposited with a constant ammonia concentration of 1.4 M and the selenourea concentration of 0.0075 M to 0.075 M. The thicknesses of the films were determined from the FESEM images of cross-sectional views for the Zn(Se,OH) films deposited with a constant period of 15 min, and therefore the average deposition rates were calculated. The results are illustrated in Figure 5, where the film thicknesses and the deposition rates for each ammonia concentration or selenourea concentration are shown on the right and left axes, respectively. For the films deposited with a constant selenourea concentration of 0.03 M and the ammonia concentrations varying from 0.6 M to 2.6 M, the corresponding thicknesses of the films increased from 42 nm to 133 nm. There was a nearly linear dependence of the film thicknesses on the increase of the ammonia concentrations for the given deposition conditions except the greatest ammonia concentration of 2.6 M. For the closely linear relation between the film thicknesses and the ammonia concentrations, the deposition rates were increased from 2.8 nm/min to 8.7 nm/min for the ammonia concentrations rising from 0.6 M to 2.2 M. As for the films deposited with a constant ammonia concentration of 1.4 M and the selenourea concentrations varying from 0.0075 M to 0.075 M, the thicknesses of Zn(Se,OH) films increased with an increase in the selenourea concentrations from 0.0075 M to 0.06 M, but decreased at the selenourea concentration of 0.075 M, which suggested that the exceedingly high selenourea concentration hinder the growth of the Zn(Se,OH) films in the deposition solutions. Similarly, the variation of the film thicknesses showed an approximately linear relationship with the increase in the selenourea concentrations. The greater deposition rates of the Zn(Se,OH) films were achieved for an increase in the ammonia concentrations, demonstrating that the variation of the ammonia concentrations had a greater impact on the deposition rates than that of selenourea concentrations.

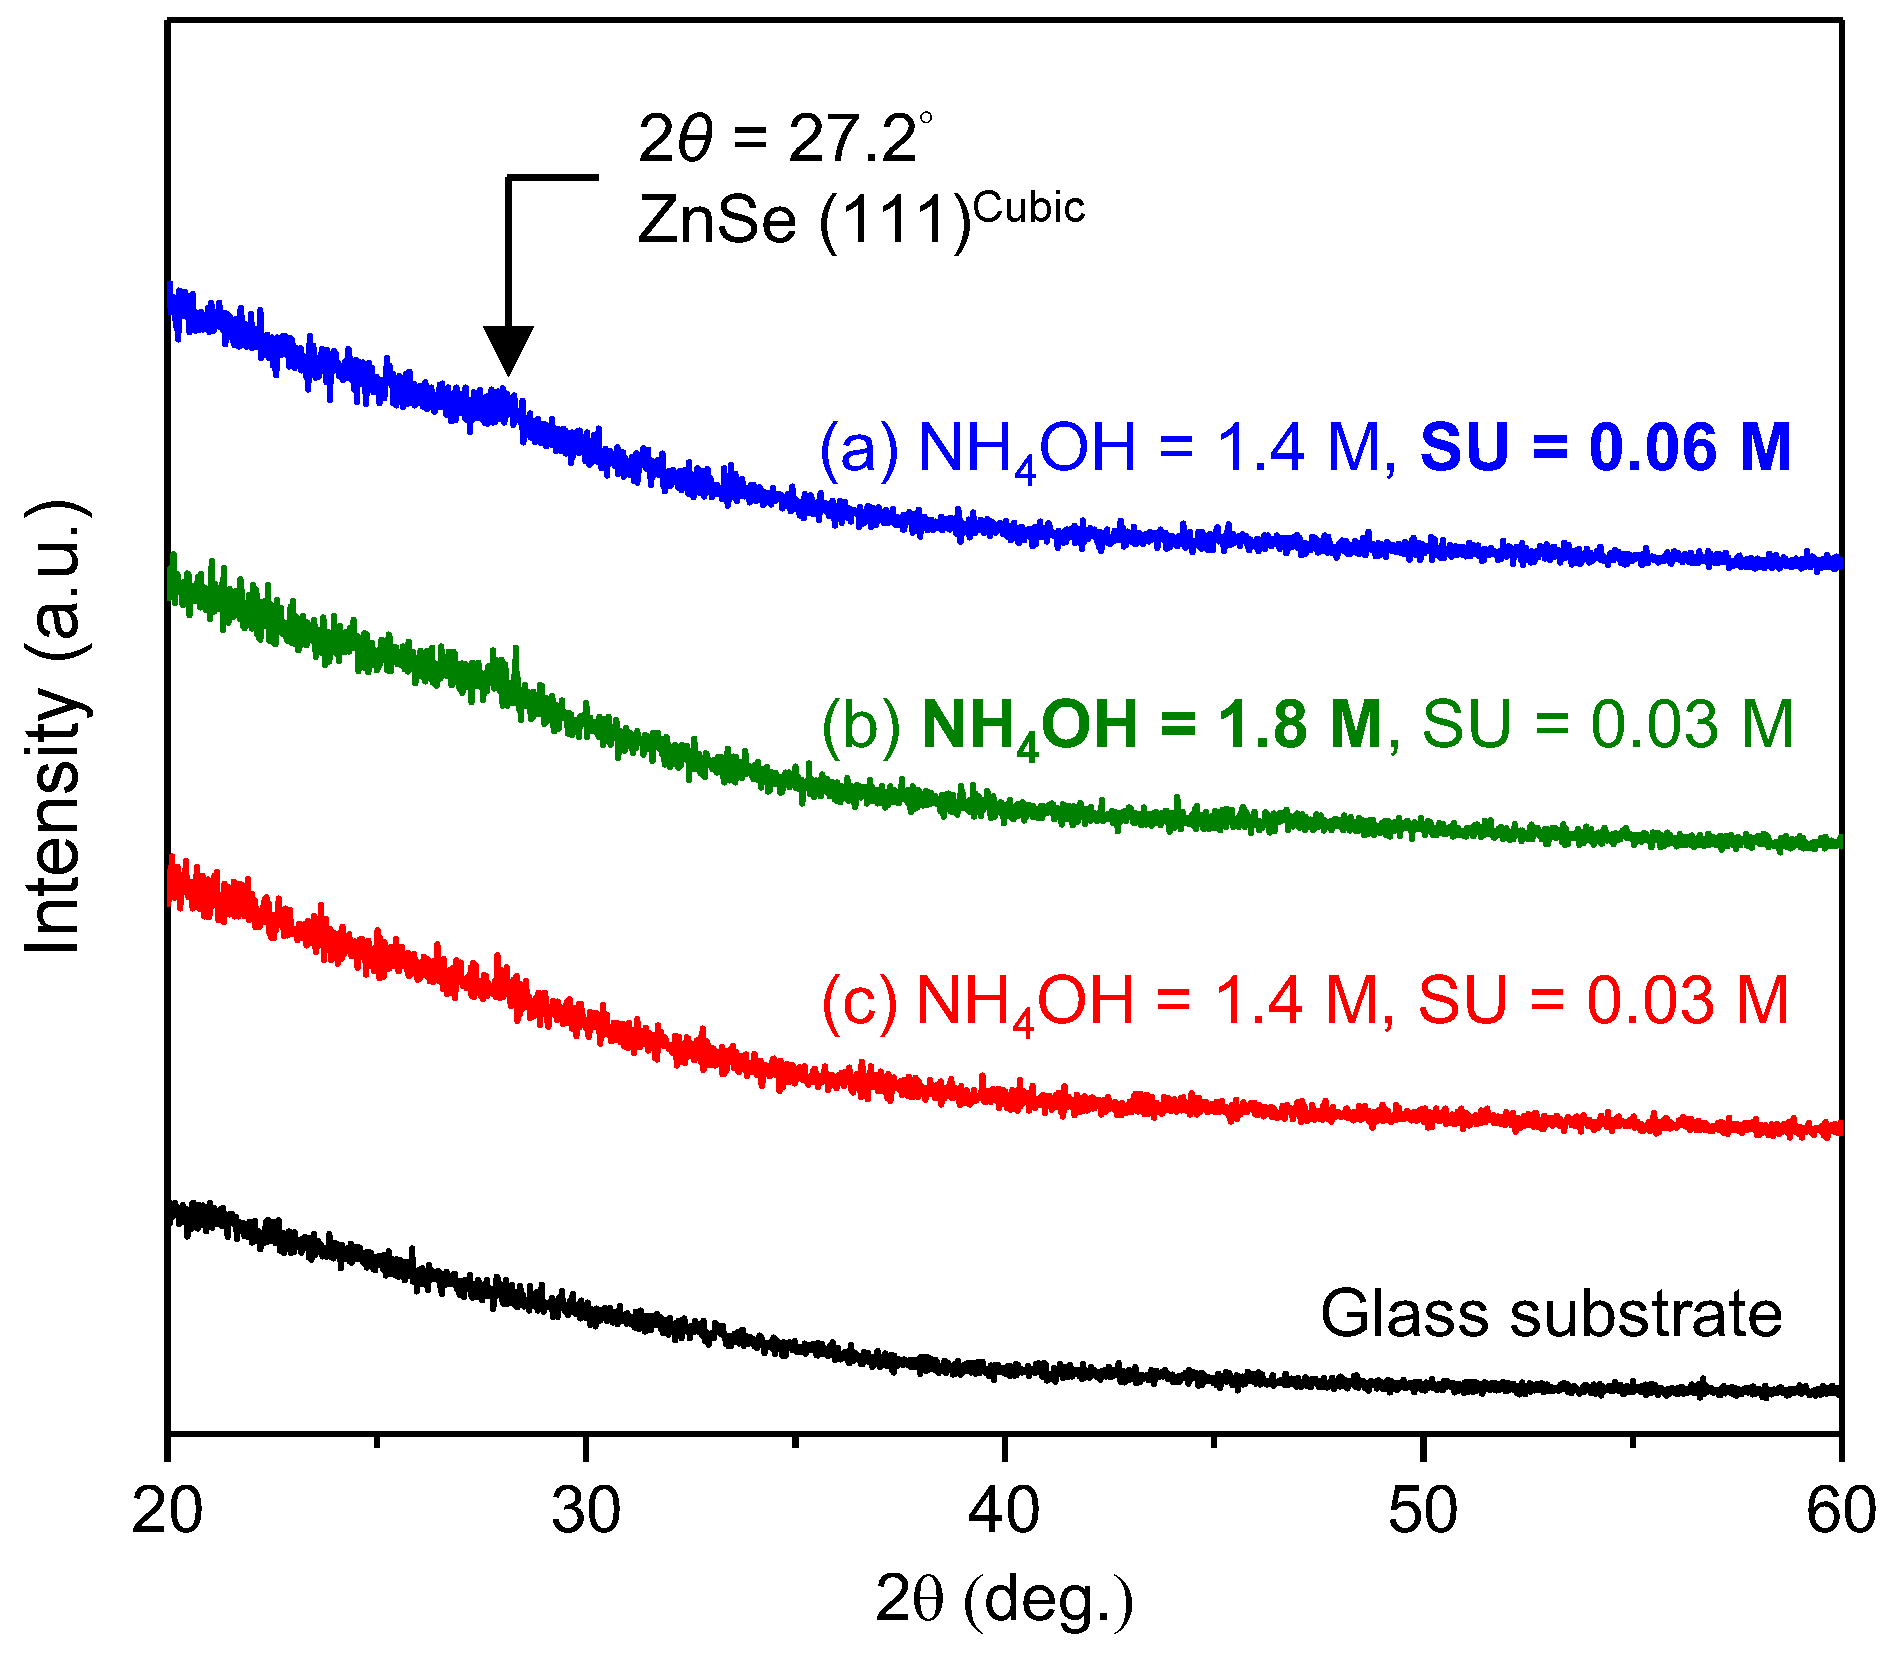
3.2. Crystal Structures
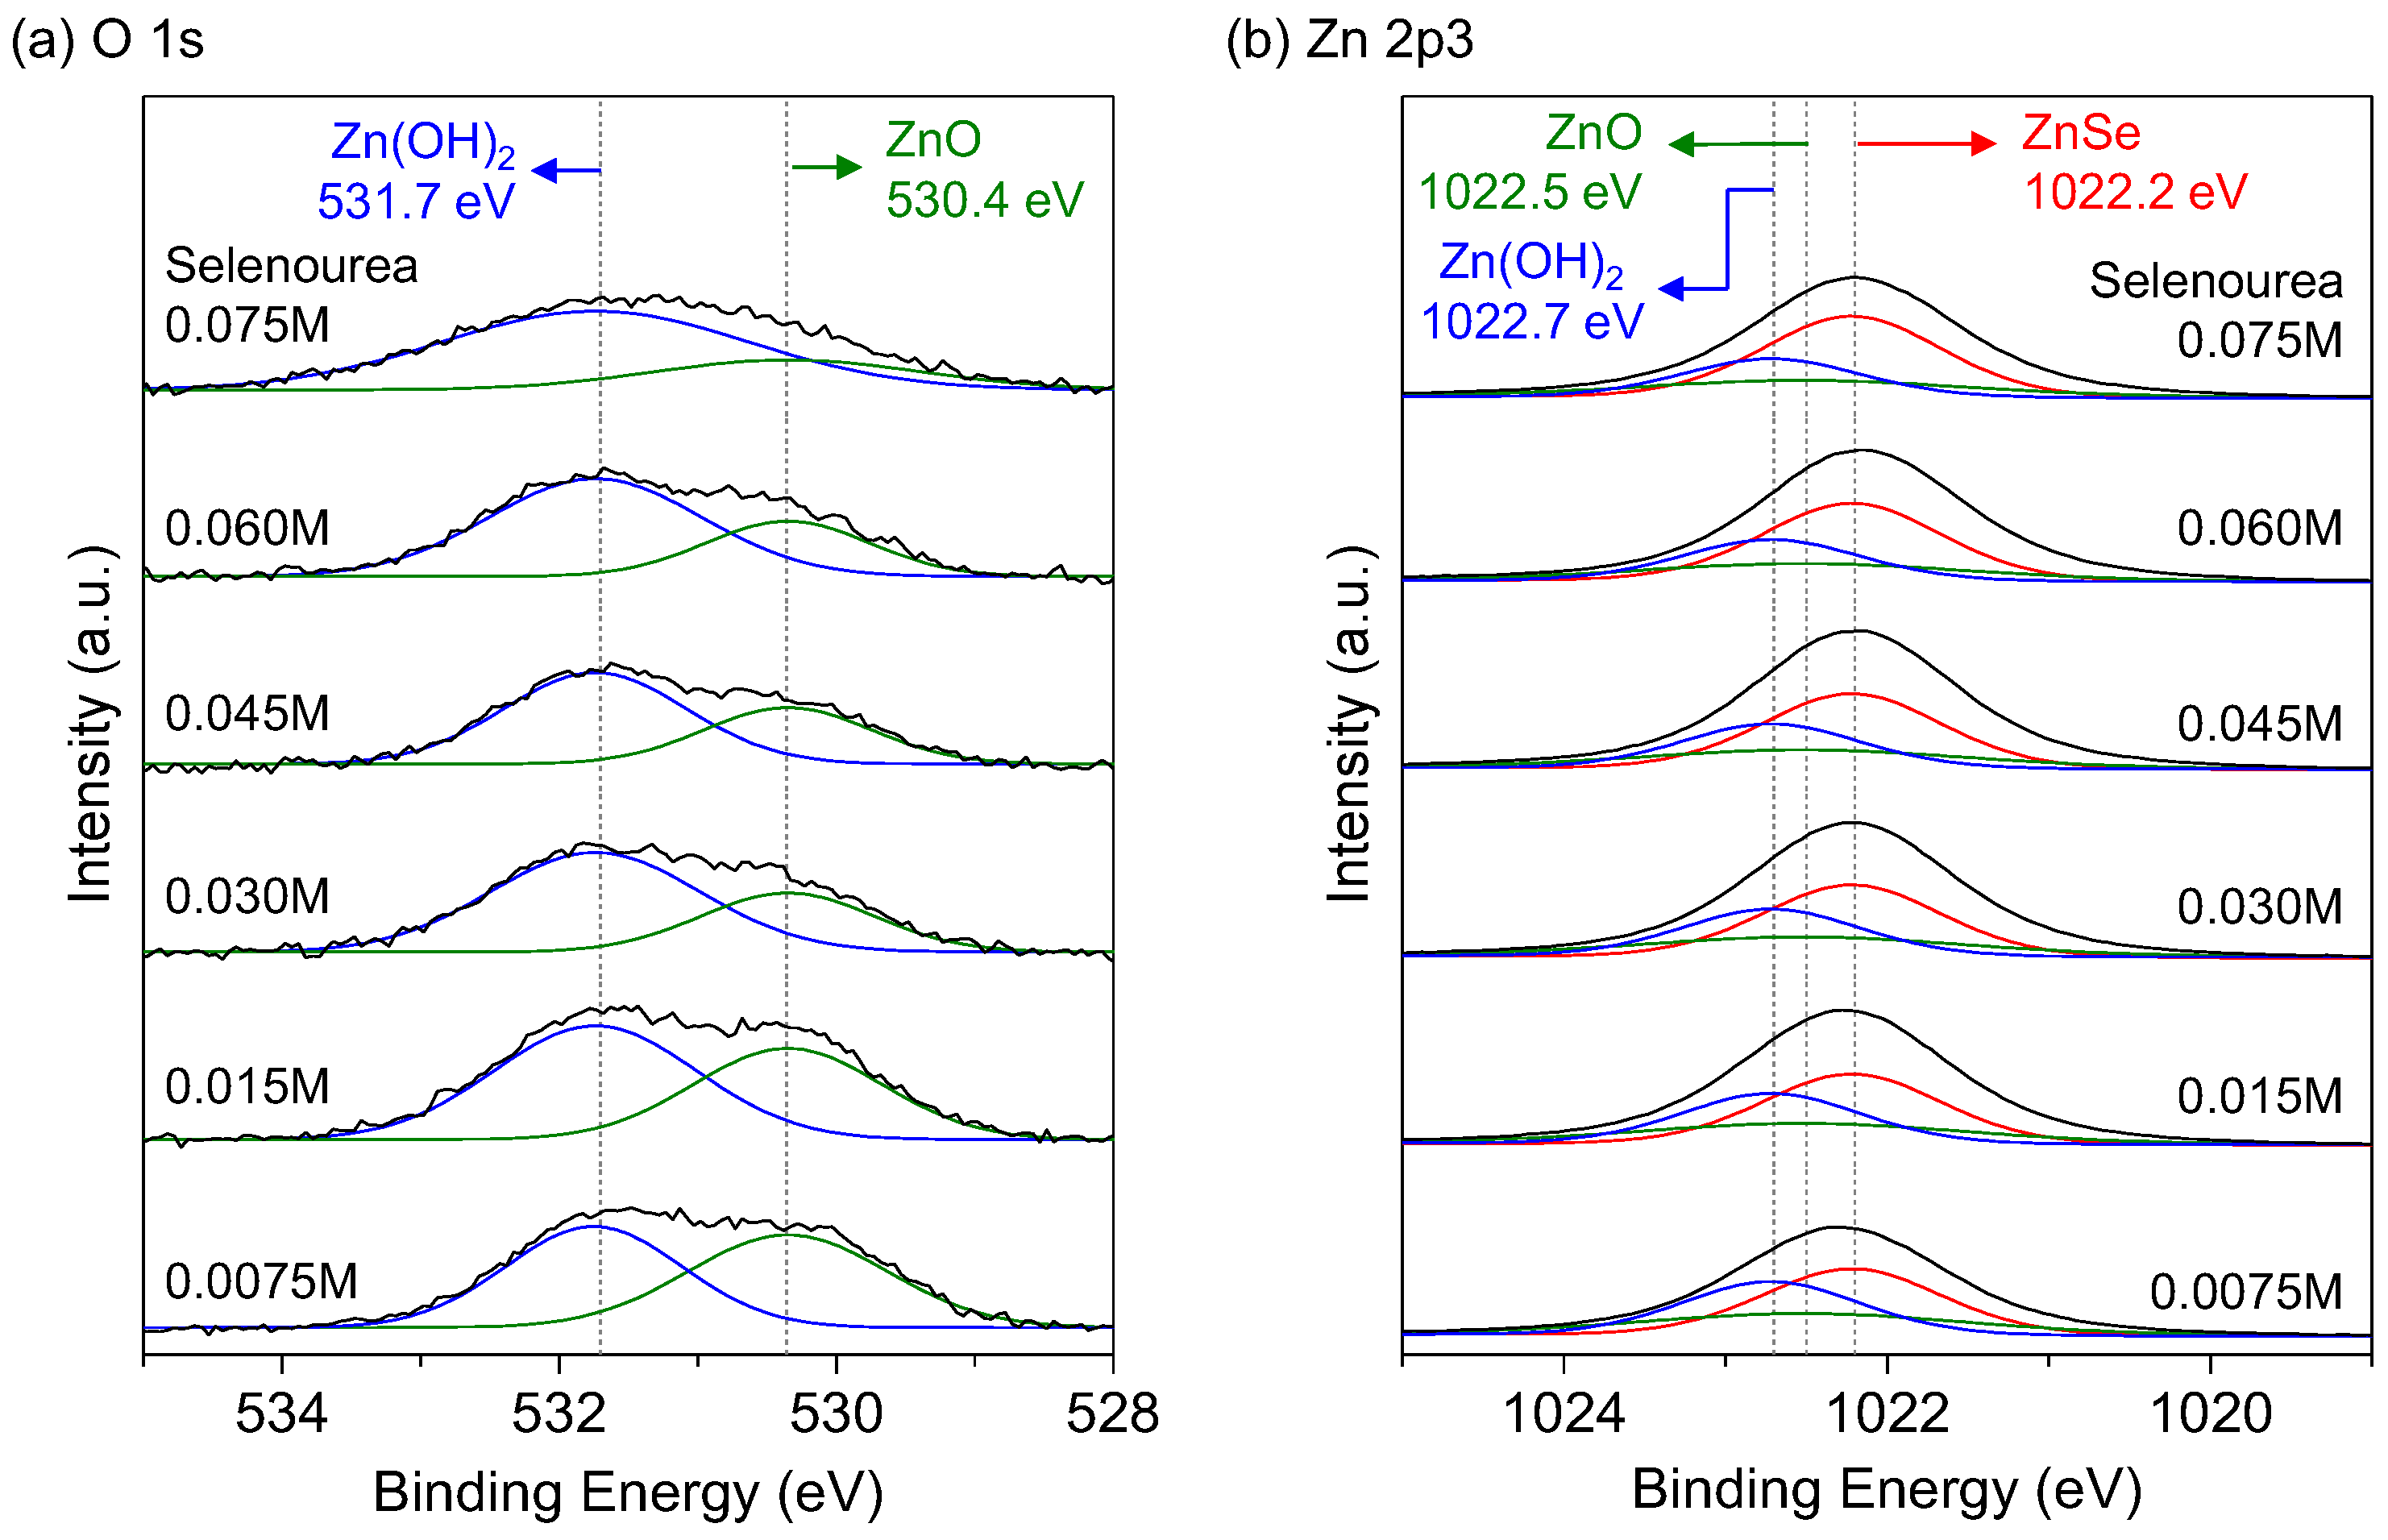
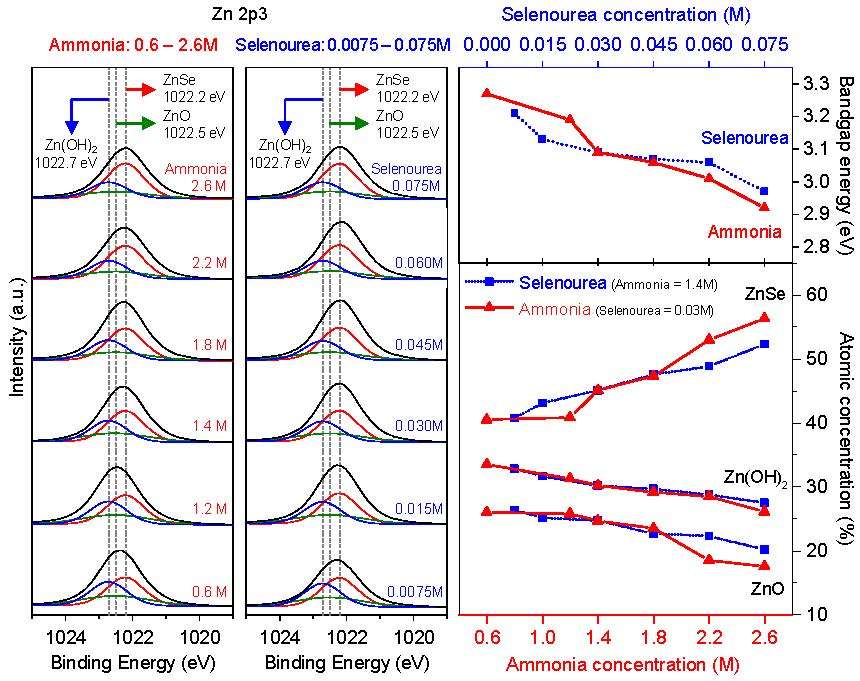
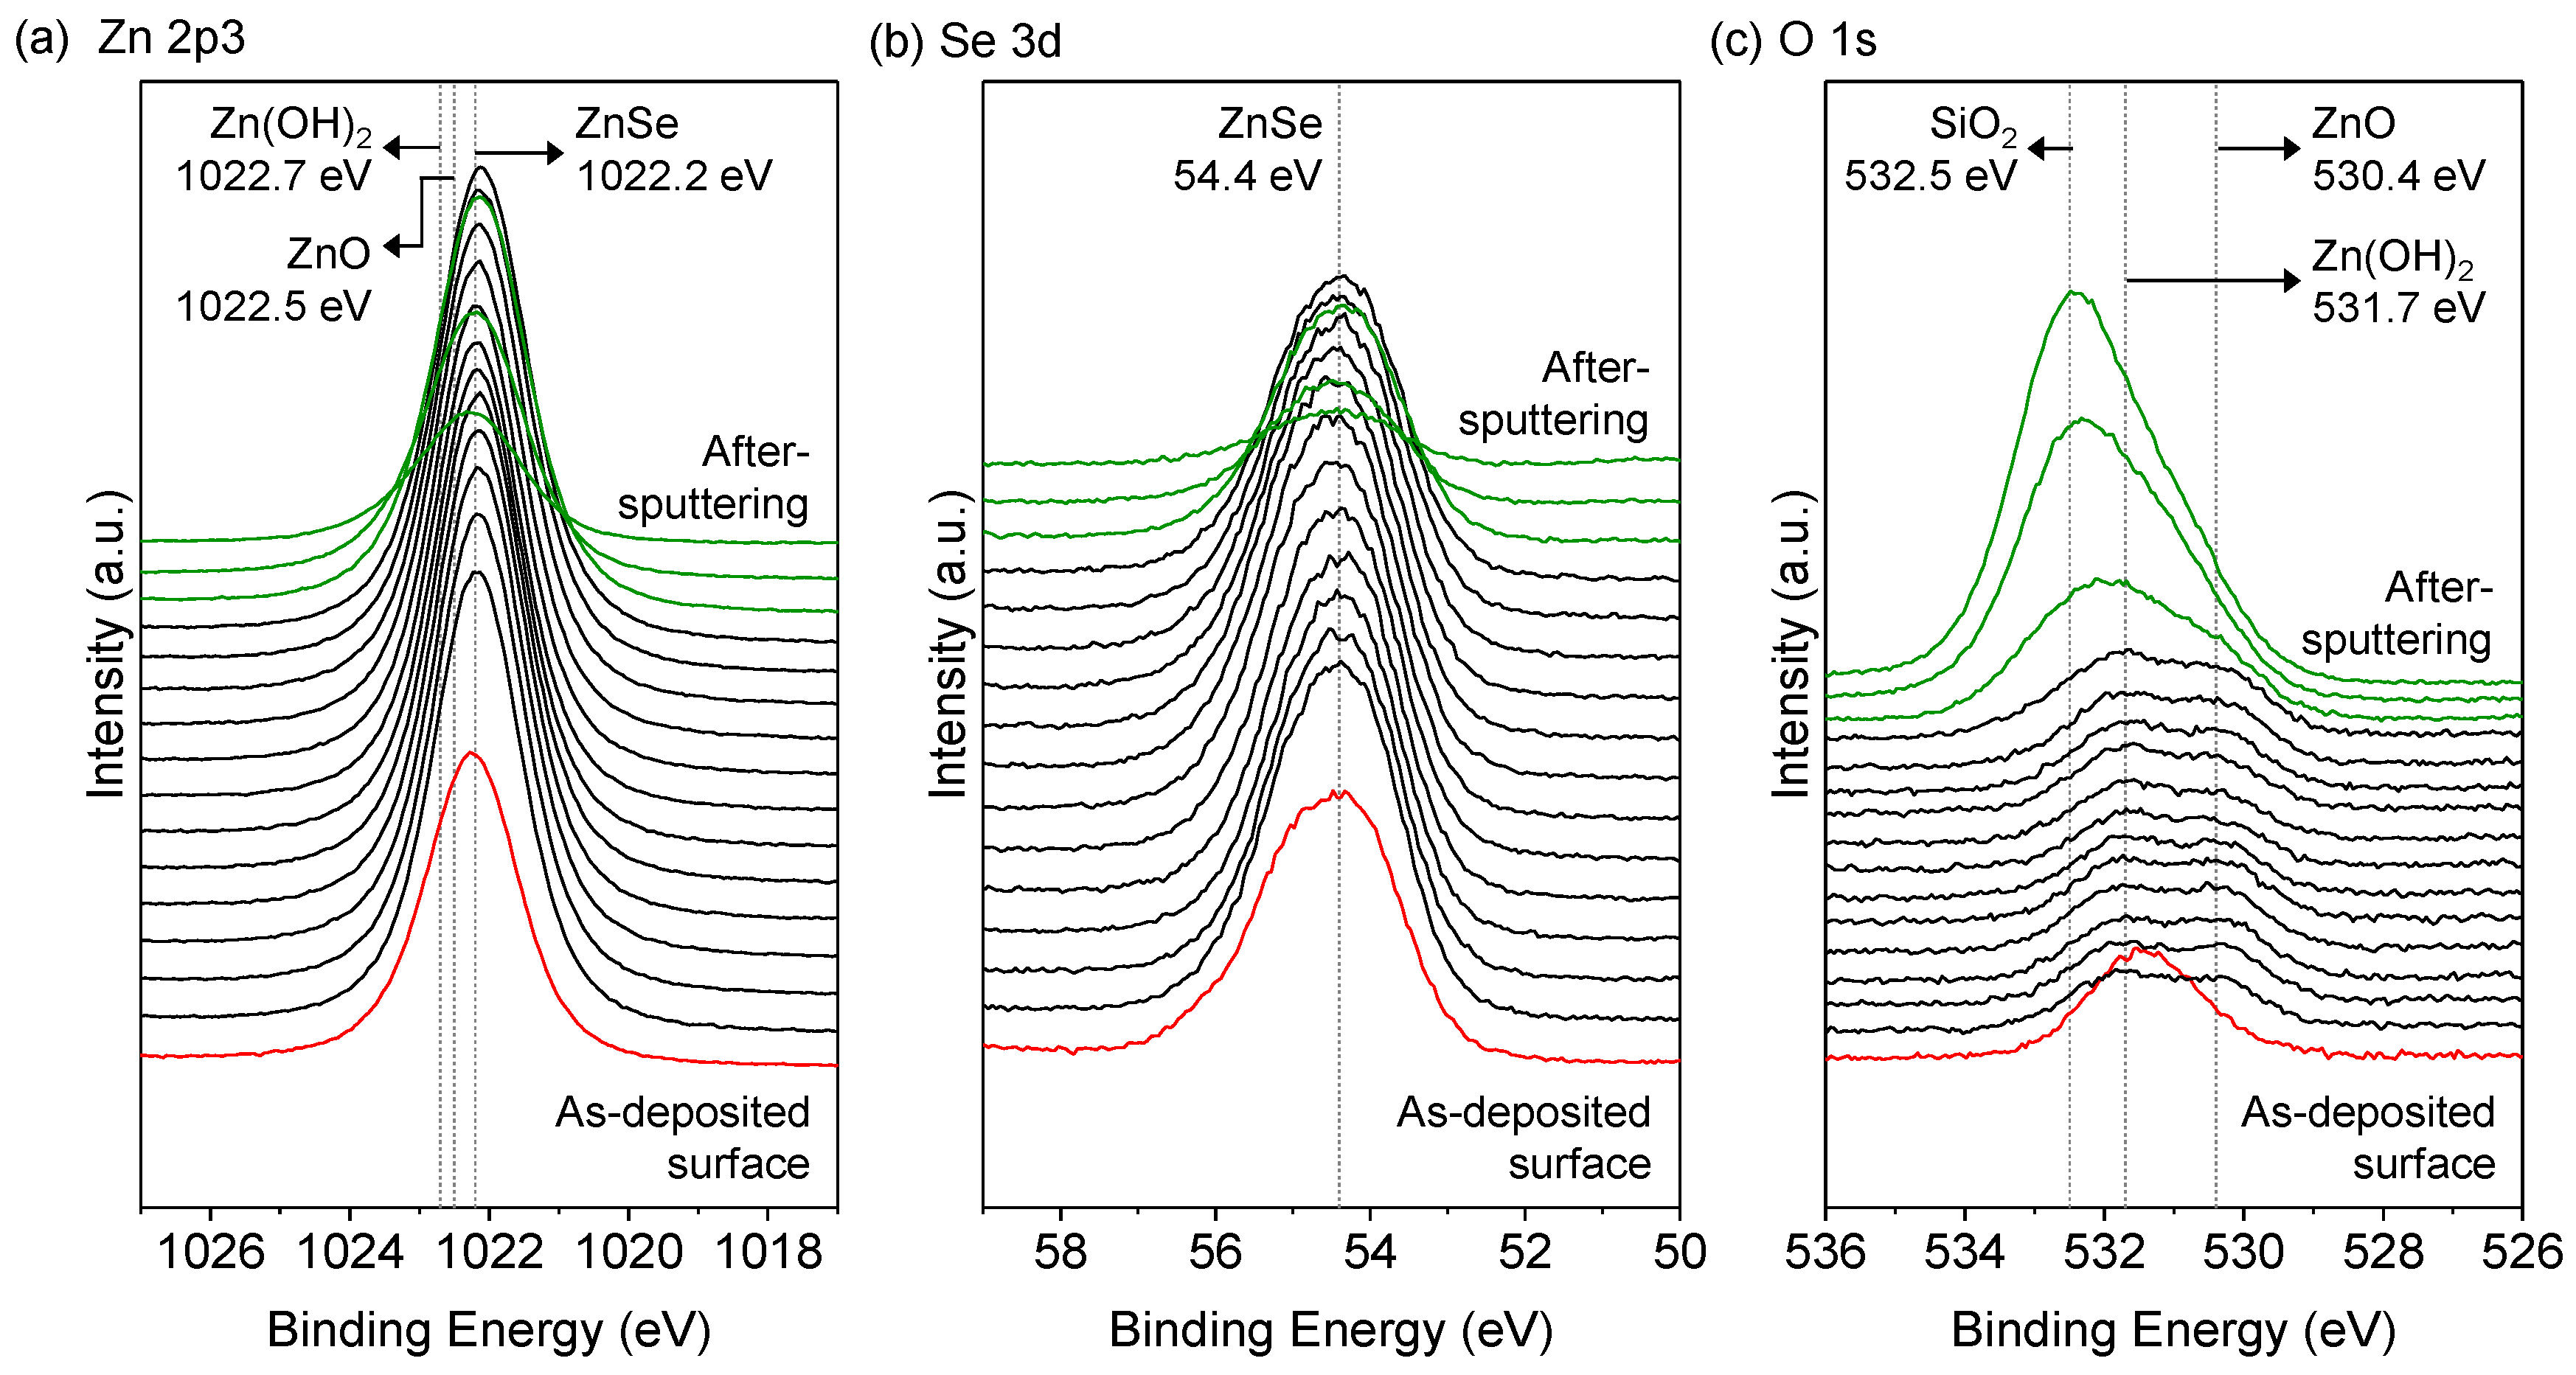
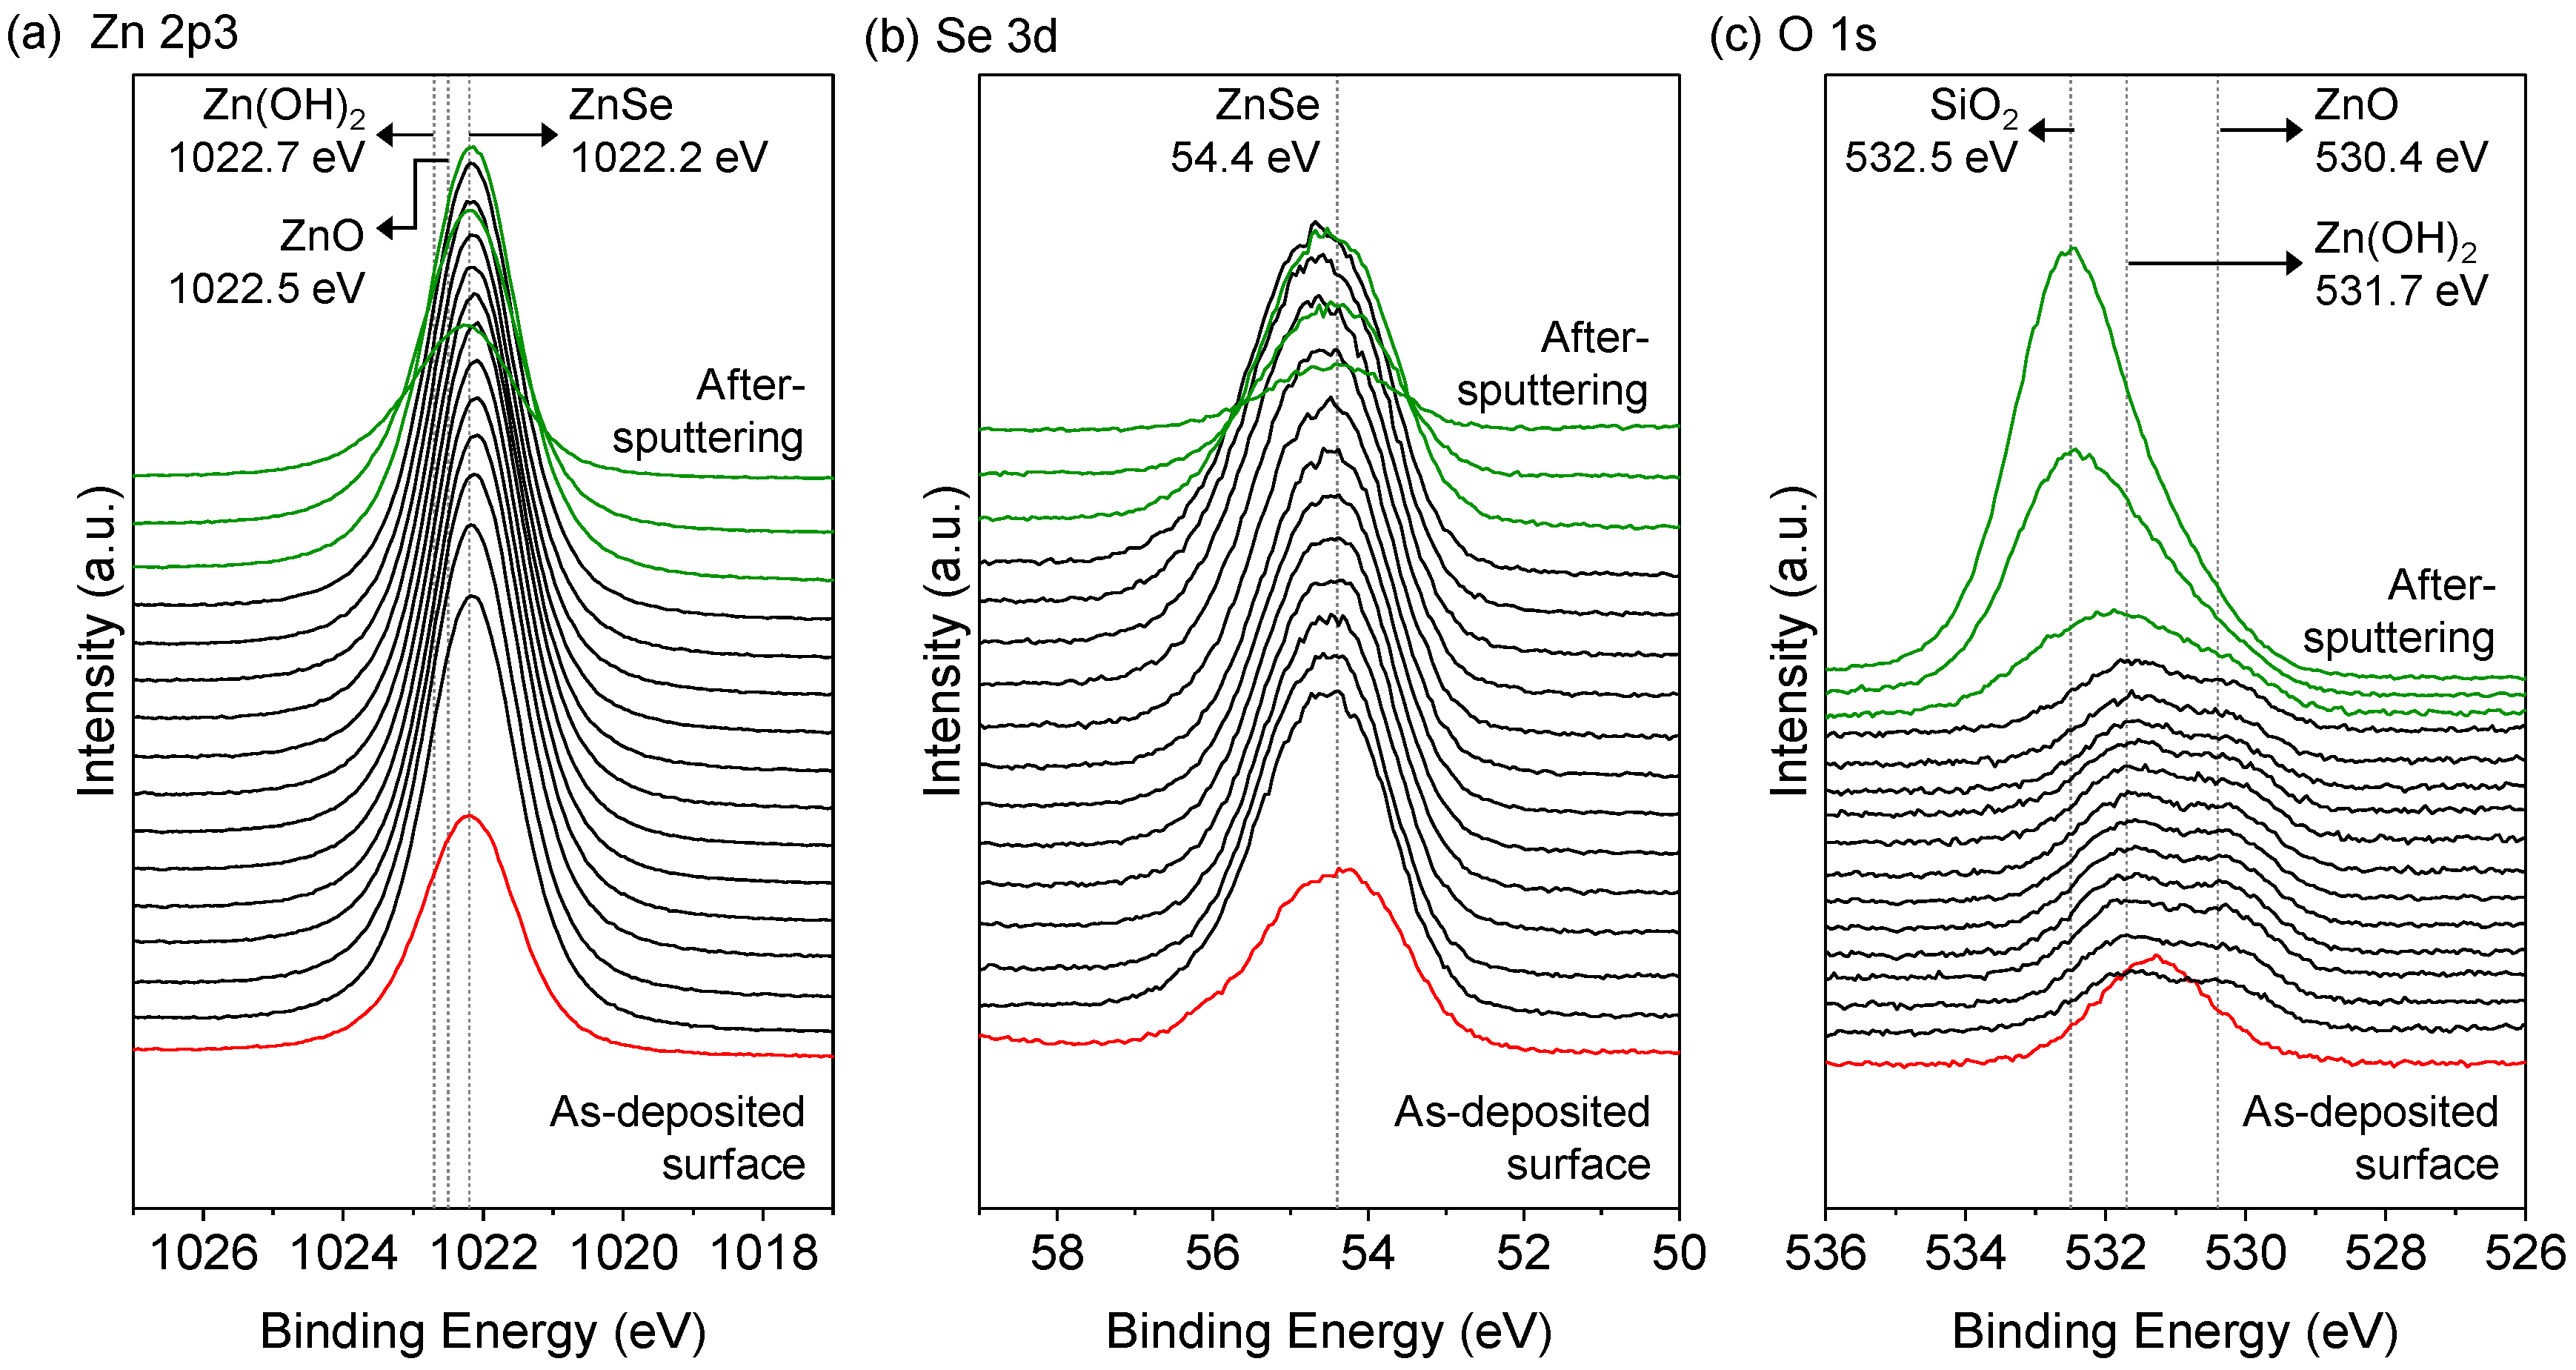
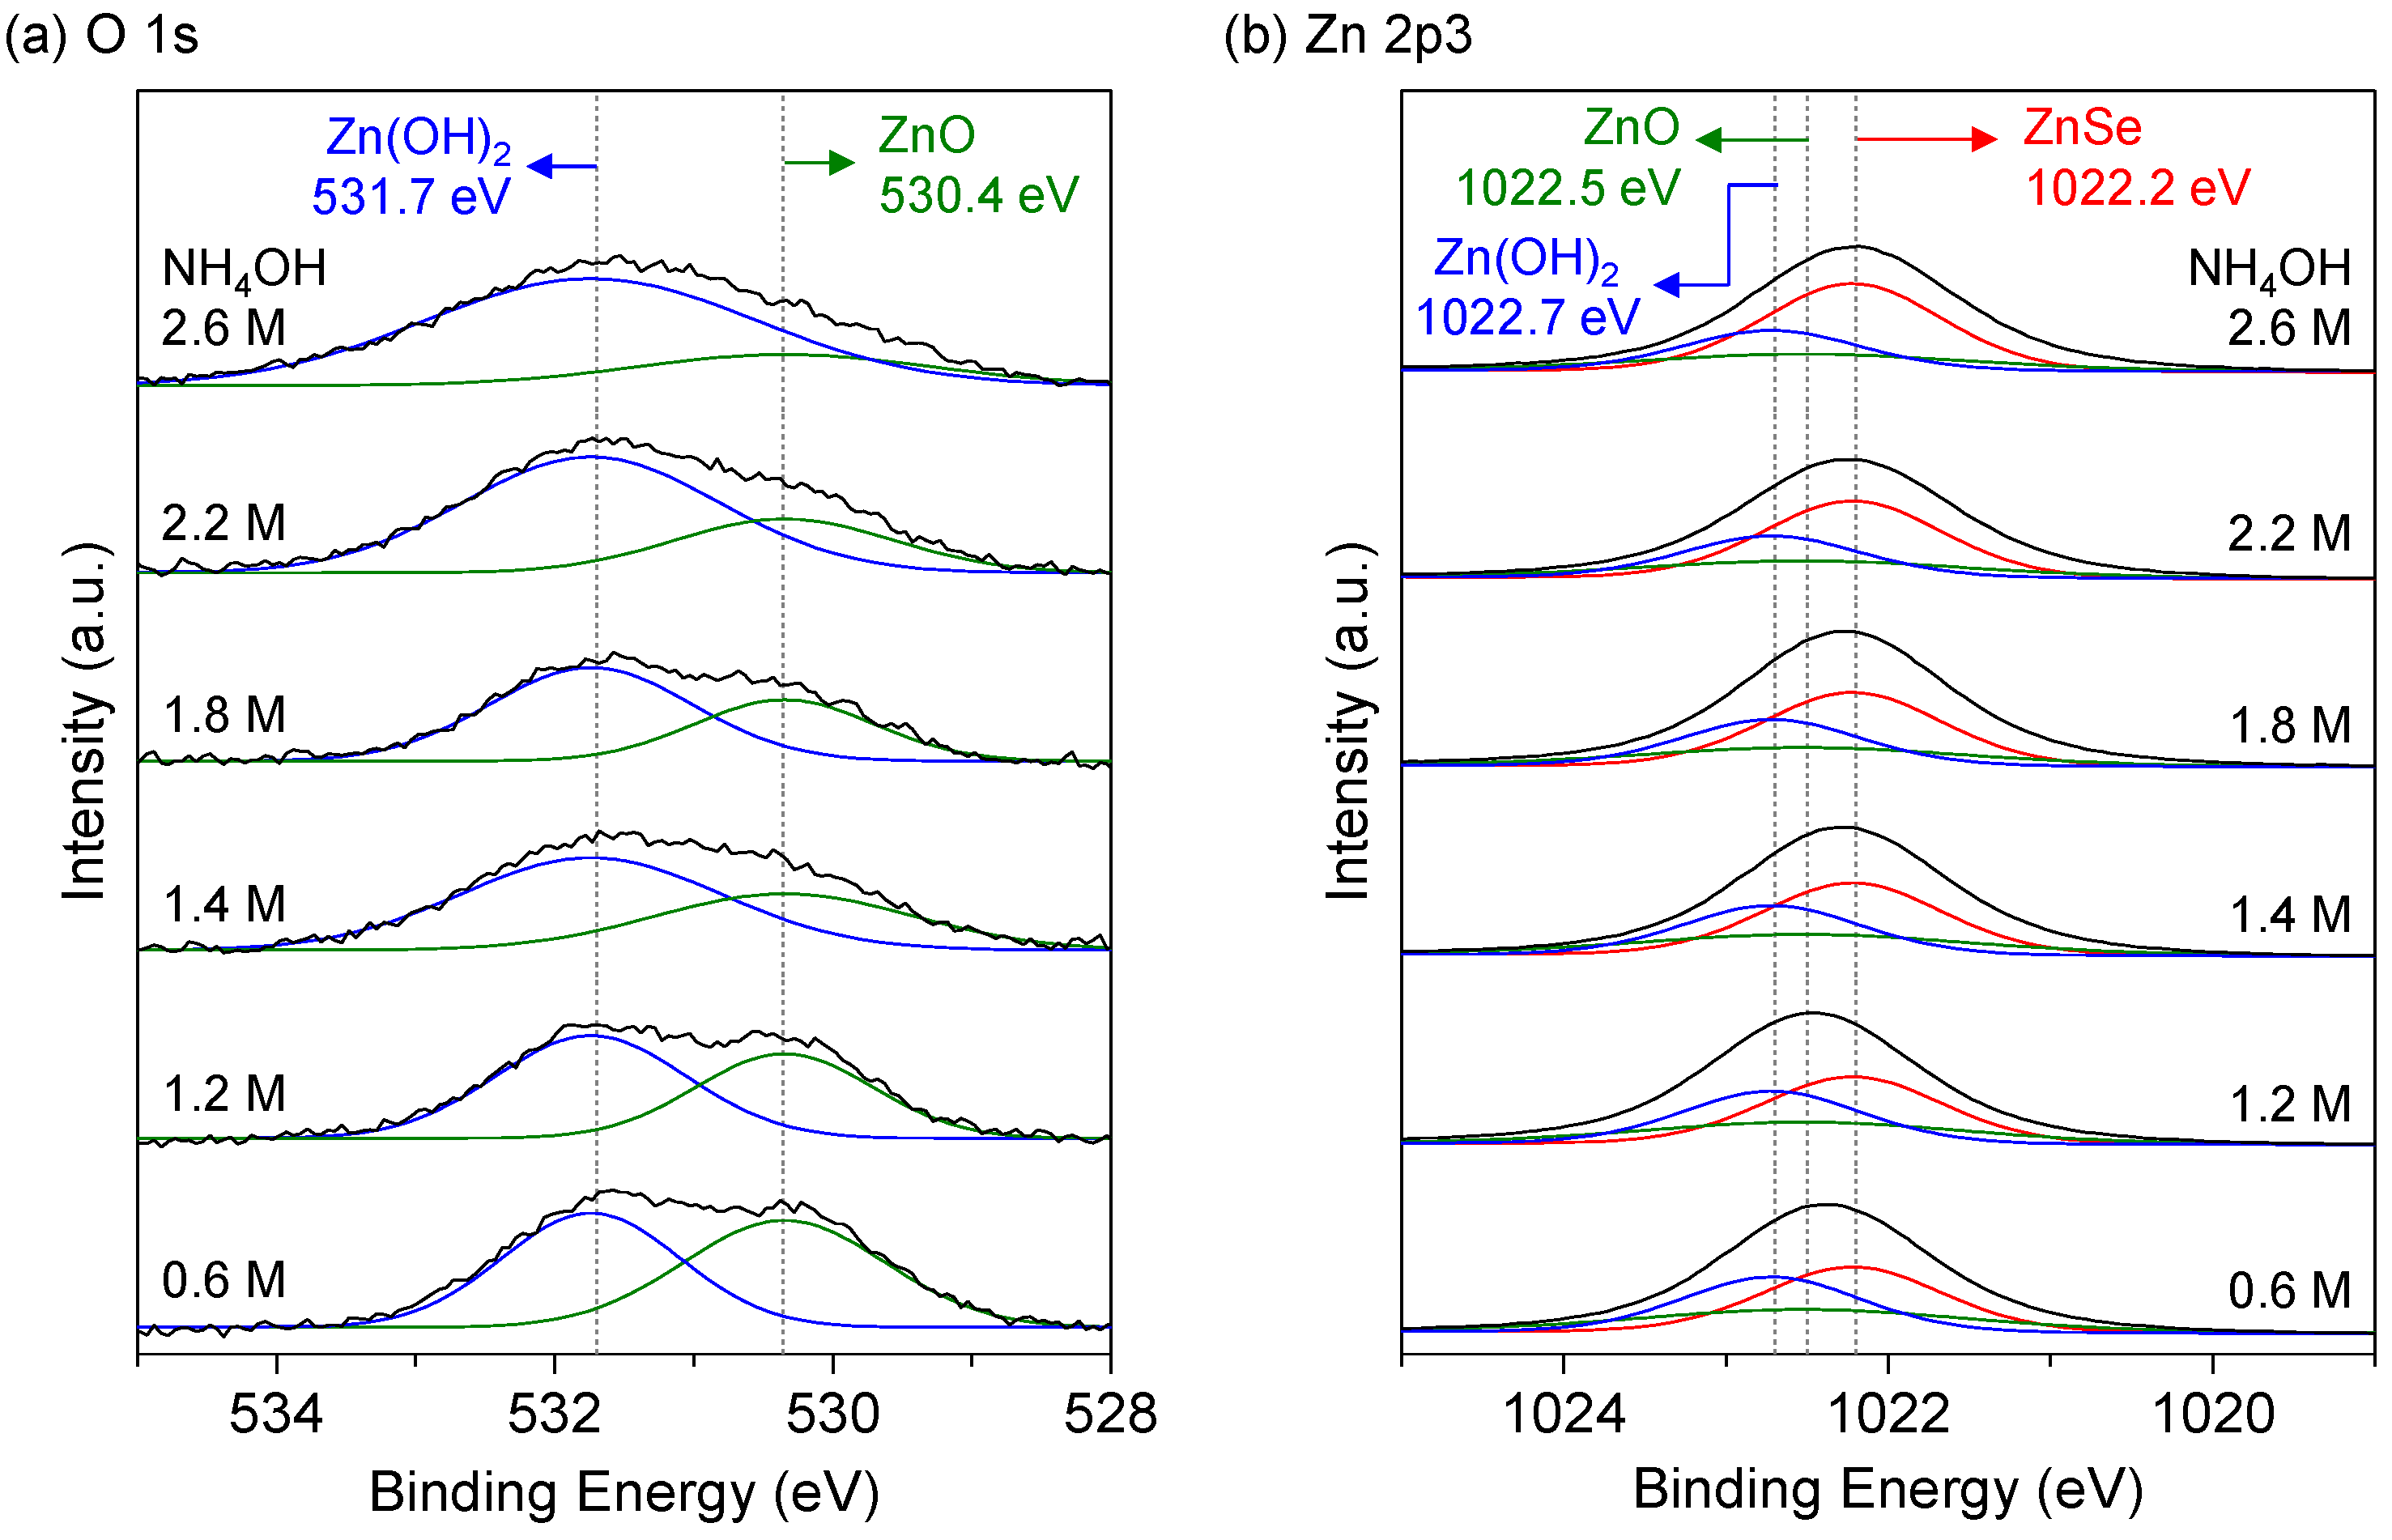
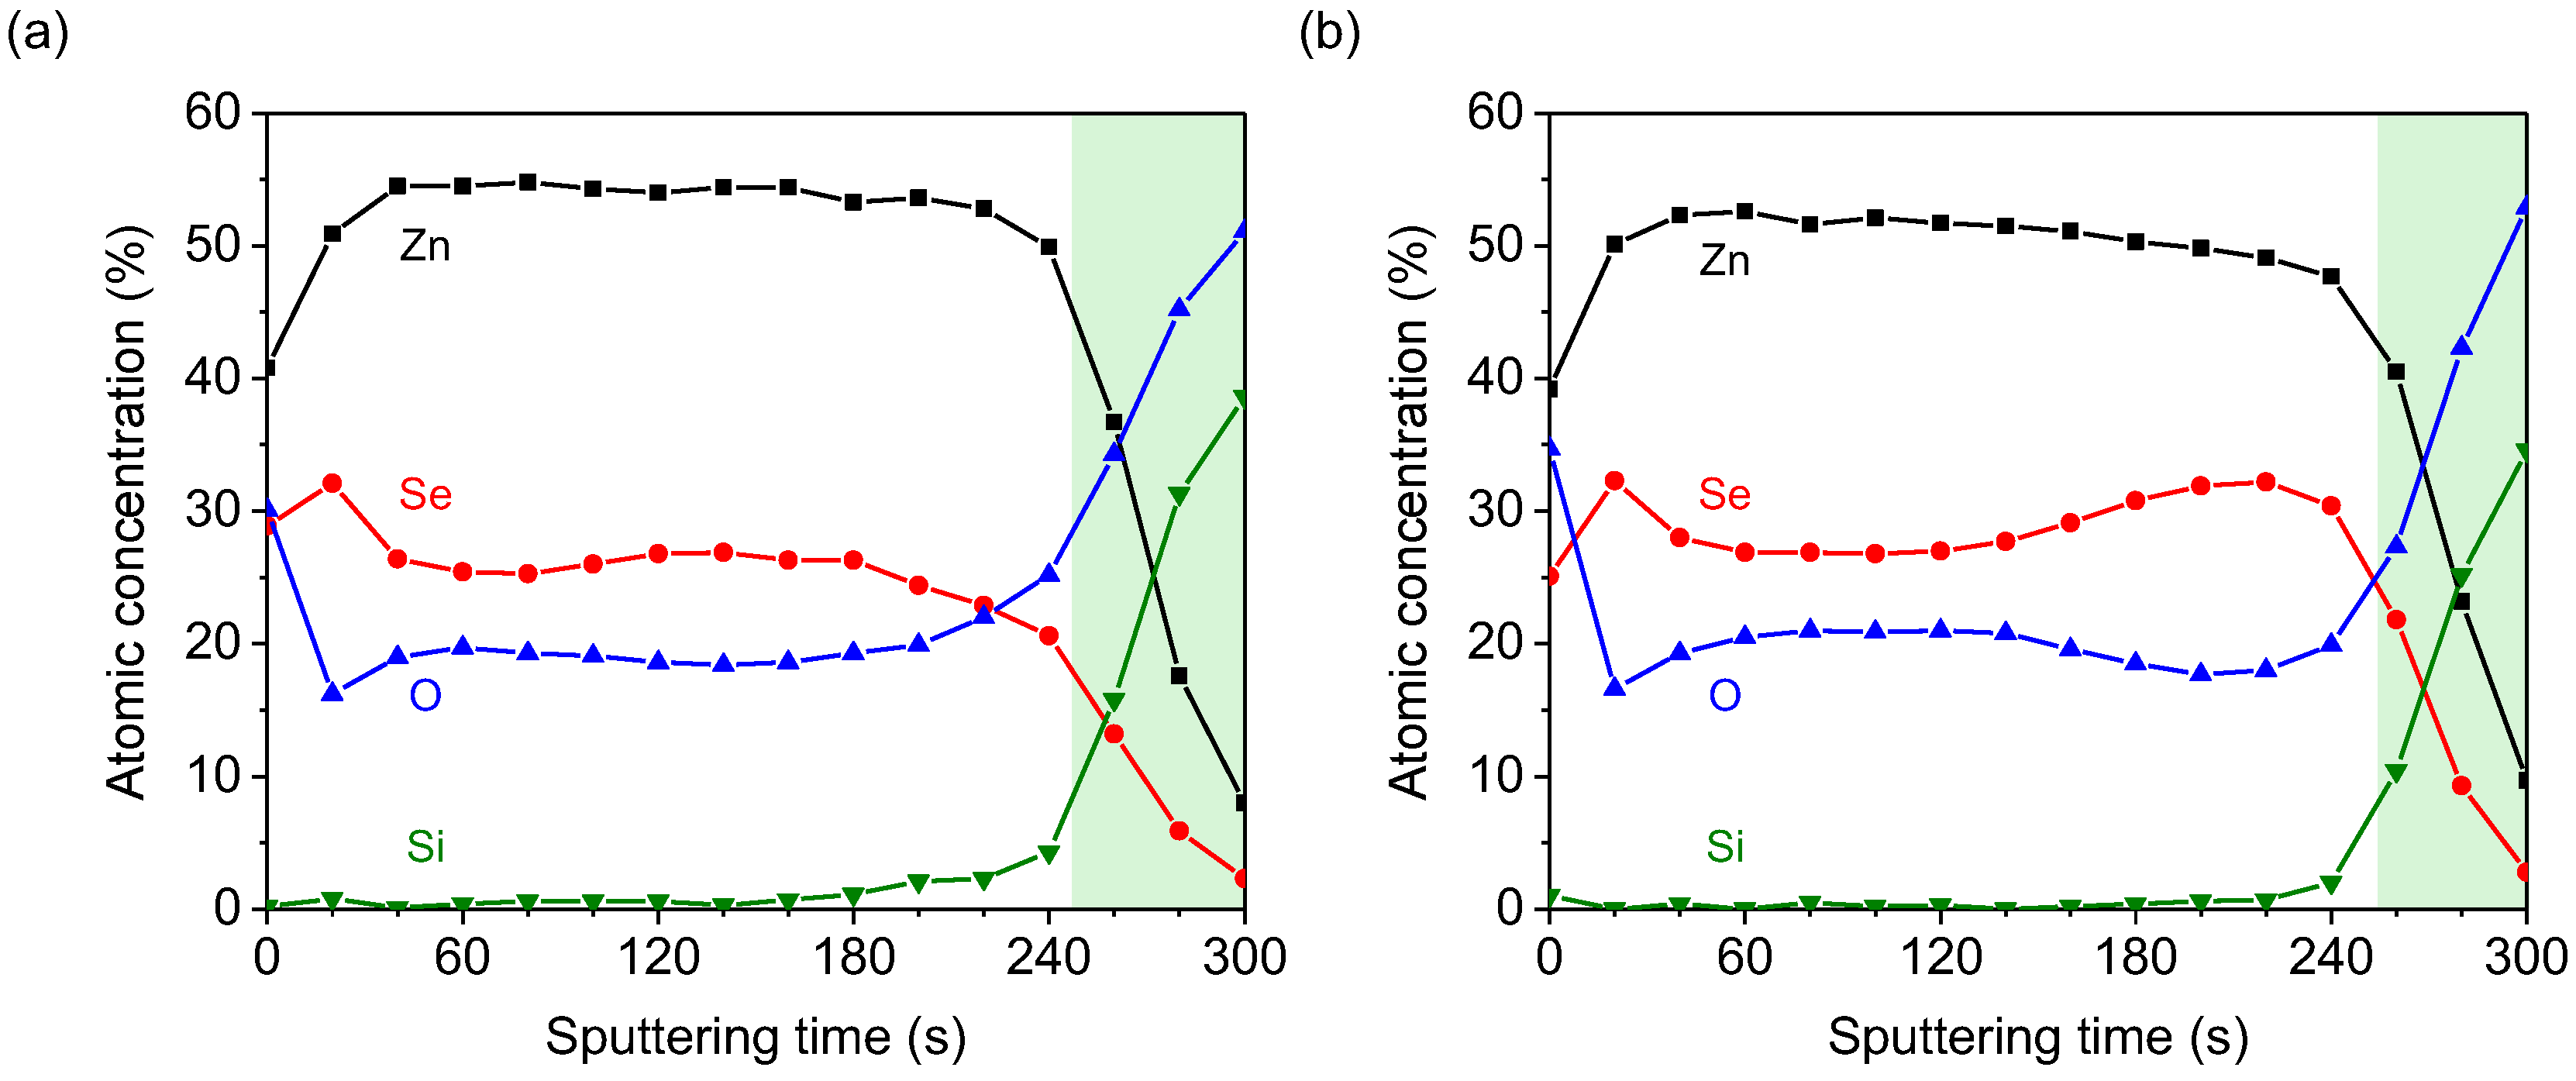
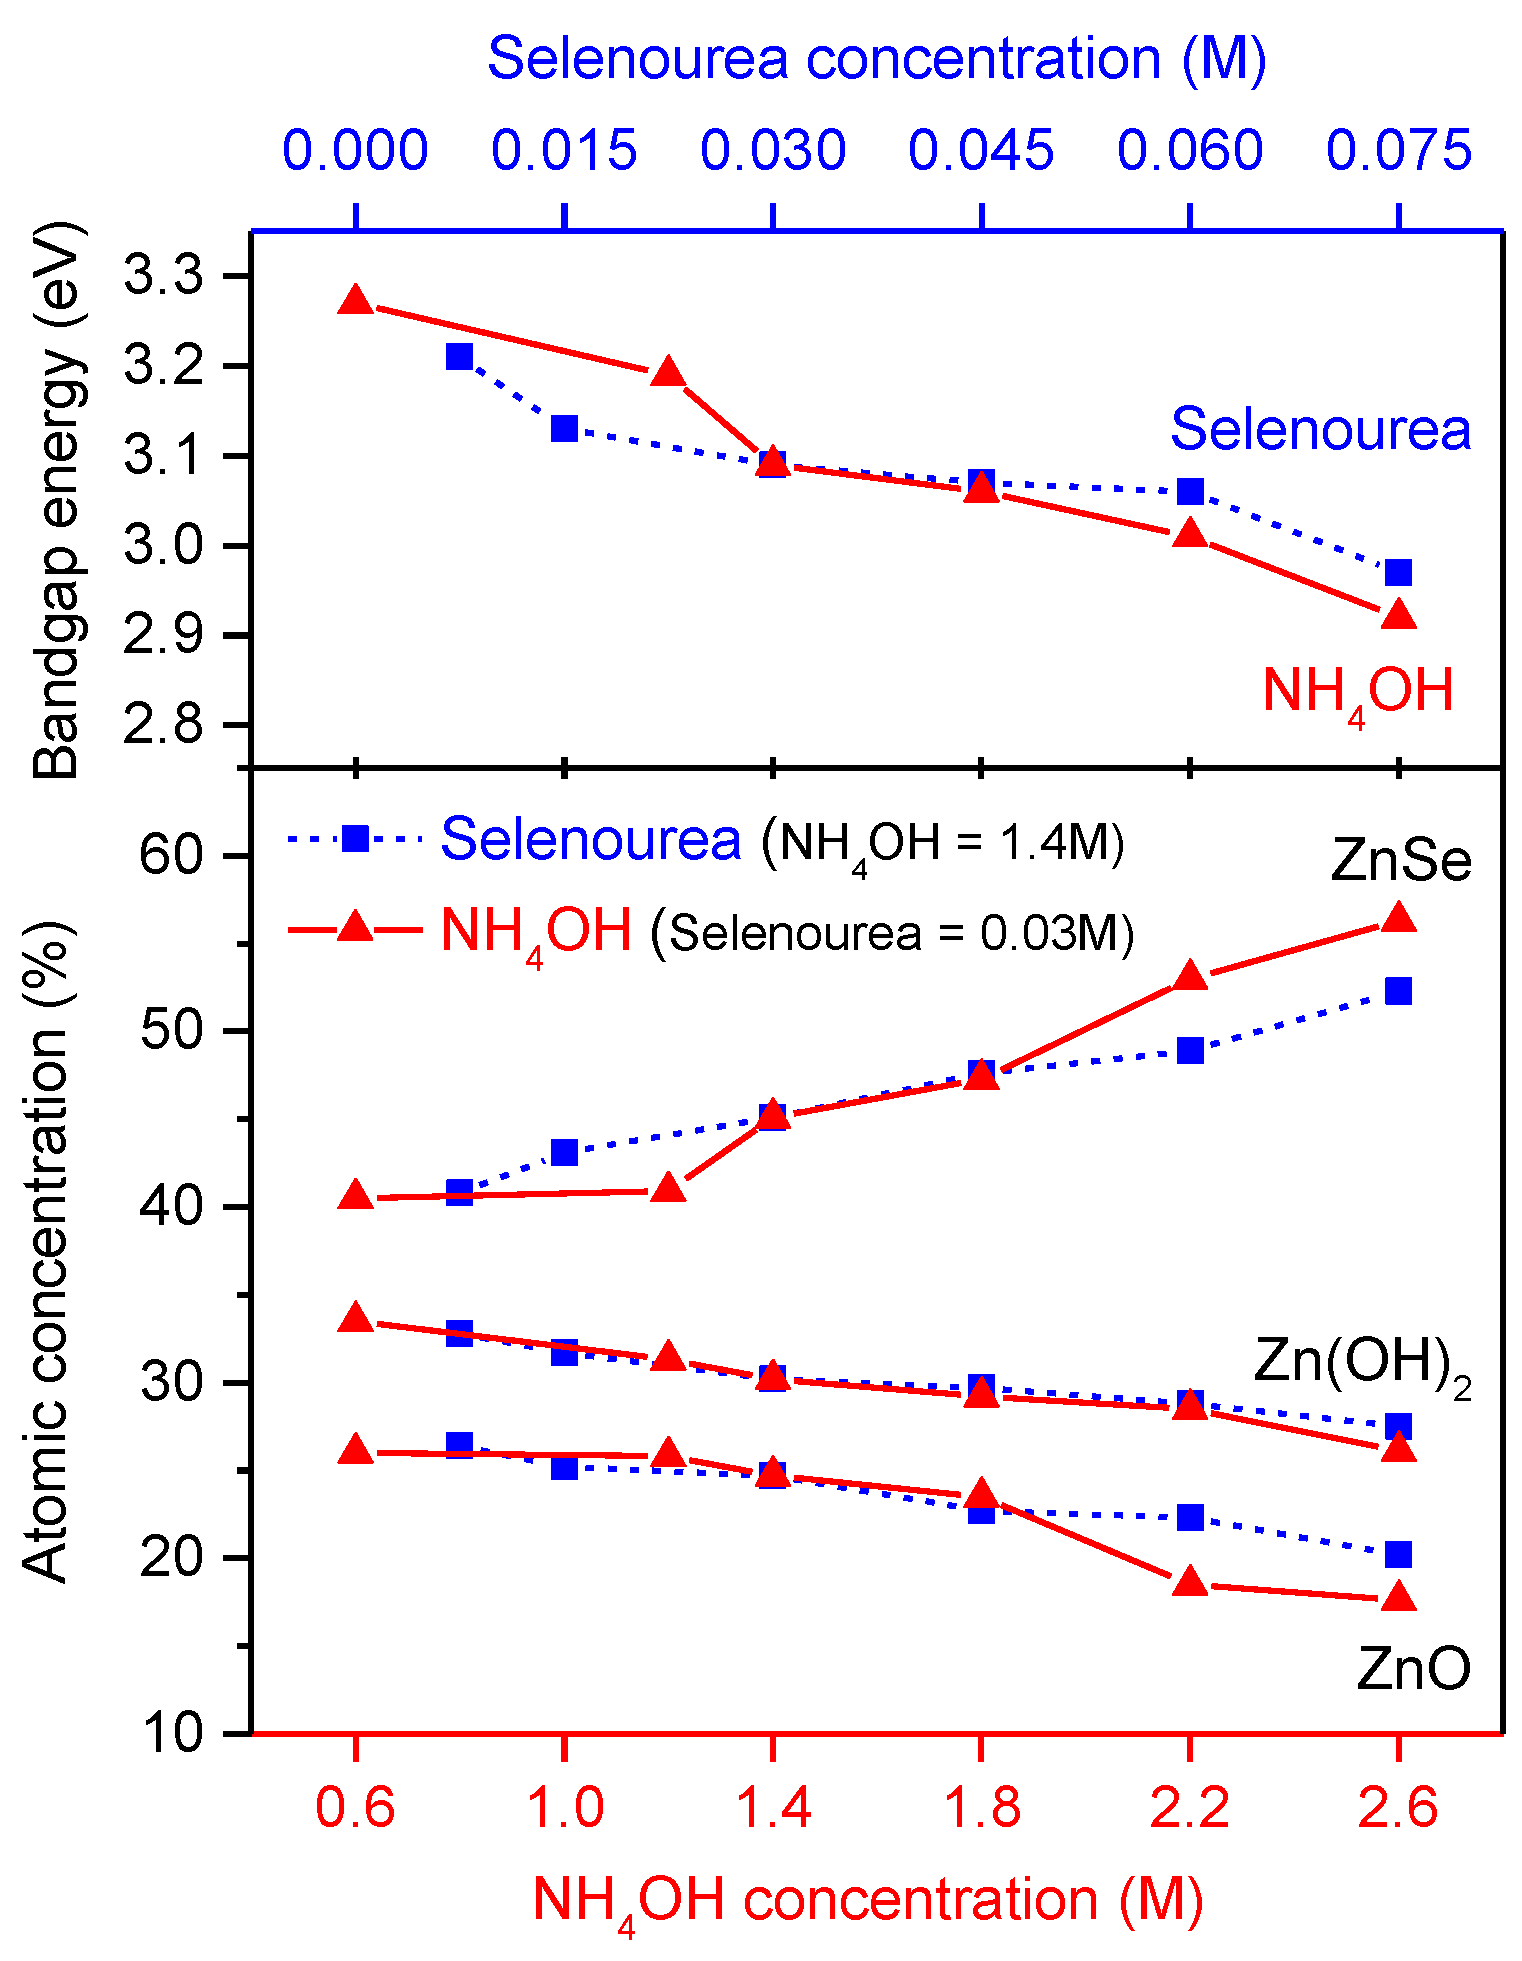
The XRD diffraction patterns of the Zn(Se,OH) films deposited with three different combinations of ammonia and selenourea concentrations are presented in Figure 6, where the XRD pattern of a soda-lime glass substrate is shown as a reference. As illustrated in Figure 6, a characteristic peak of 2θ at 27.2° could still be identified for the as-deposited Zn(Se,OH) film, deposited with the condition (a) ammonia concentration of 1.4 M and selenourea concentration of 0.06 M, which corresponds to the (111) plane of the cubic crystal structure for ZnSe; although the characteristic peaks of the films deposited with the conditions (b) and (c) were not quite obvious. As the as-deposited Zn(Se,OH) films possessed the features of the very thin thicknesses and the nano-crystalline, the characteristic peaks of the XRD diffraction patterns for the Zn(Se,OH)x films were not sharp. Similar results of the weak characteristic peaks of XRD patterns at 2θ of around 27.5° or 27.9° for the CBD ZnSe films with the thicknesses between 60 and 195 nm have been reported in the literature [22,23].

3.3. Compositions

We employed an X-ray photoelectron spectroscopy system (Thermo Scientific) equipped with a monochromatic Al Kα X-ray source and a double-focusing hemispherical analyzer to perform XPS analysis for the Zn(Se,OH) films deposited on the soda-lime glass substrates. Moreover, the depth profiling was carried out with an argon ion source operating at a beam energy of 3 KeV. The charging effects were taken into account by referring the measured spectra to the binding energy peak of C 1s at 284.8 eV. Carbon was initially present for all films deposited by the CBD process but became undetectable during sputter depth profiling, indicating that little carbon was incorporated around the surface region of the films during exposure to the air. The XPS photoelectron binding energy spectra were fitted with Gaussian-Lorentzian curves to analyze the compositions of the Zn(Se,OH) films. Besides carbon, the elements of zinc, selenium, and oxygen were also identified for the as-deposited films. The binding energies of ZnSe, ZnO, and Zn(OH)2 for the photoelectron line positions of Zn 2p3, Se 3d, and O 1s reported in the literature are summarized in Table 1 [24,25,26,27].
As illustrated in Figure 1b, the Zn(Se,OH) film deposited with the ammonia concentration of 1.2 M had the better surface morphology. We selected this sample to demonstrate the XPS depth profiling of Zn 2p3, Se 3d, and O 1s core levels, as presented in Figure 7. For the montage of Zn 2p3 binding energy spectrum from 1017 eV to 1027 eV as shown in Figure 7a, no significant shift of the peaks was found. As illustrated in Figure 7b, the peaks of Se 3d binding-energy curves kept nearly at the same binding energy of 54.4 eV, suggesting that the compound of ZnSe was formed in the films [24]. For the O 1s binding-energy spectrum, a peak at the binding energy close to 531.7 eV was observed for the as-deposited surface of the Zn(Se,OH) films. In contrast, the broad peaks of the binding-energy spectrum were found in the bulk of the films, suggesting that the compounds of Zn(OH)2 and ZnO existed simultaneously in the films. The peaks of the after-sputtering curves shown in the background shifted to the binding energy of SiO2 at 532.5 eV [25], revealing that the glass substrate has been reached after the sputtering.
The sample deposited with the selenourea concentration of 0.045 M, which had the better surface morphology as shown in Figure 3d, was selected to perform the XPS depth profiling. The results of the photoelectron binding-energy spectra for the depth profiles of Zn 2p3, Se 3d, and O 1s are exhibited in Figure 8. As illustrated in Figure 8a, the peaks of Zn 2p3 binding-energy curves were at the binding energy of 1022.2 eV, indicating the formation of ZnSe in the films [24]. The peaks of Se 3d binding-energy spectra remained at the binding energy of 54.4 eV without altering. Moreover, the O 1s binding-energy spectra showed the broad peaks, which consisted of the peaks of Zn(OH)2 [27] and ZnO [25] compounds, in the films except the as-deposited surface and the background. Due to that the sample was exposed to the air before the measurements, evidently the shape of the O 1s binding-energy spectrum at the as-deposited surface was different from those in the bulk of the film. Since the glass substrate was sputtered, the peak at the SiO2 binding energy of 532.5 eV showed in the background.
As shown in Figure 7 and Figure 8, the peak positions of Zn 2p3 and Se 3d barely drifted and the shapes of the O 1s binding energy spectra kept approximately unchanged except for the as-deposited surface and the background spectra. The compositions of the films were studied by analyzing the XPS spectra after sputtering the films for 120 s, which corresponded to the middle region of the films along the depth and represented the nominal compositions of the films. The O 1s and Zn 2p3 binding-energy spectra of Zn(Se,OH) films deposited with a selenourea concentration of 0.03 M and the ammonia concentration in the range of 0.6 to 2.6 M are shown in Figure 9a,b, respectively. Moreover, the deconvolution of the spectra is exhibited in Figure 9 as well. The compositions of the Zn(Se,OH) films were altered with the variation of the ammonia concentrations in the chemical solutions. Evidently, more zinc hydroxide than zinc oxide was obtained for the Zn(Se,OH) films deposited with the higher ammonia concentrations. In contrast, the contents of zinc hydroxide and zinc oxide of the Zn(Se,OH) films deposited with the low ammonia concentration of 0.6 M were roughly the same. For the Zn 2p3 binding-energy spectrum shown in Figure 9b, the peaks of the curves shifted to the binding energy of ZnSe at 1022.2 eV, implying that there was more zinc selenide than the other compounds in the films deposited with an increment in the ammonia concentrations. The ratios of zinc hydroxide and zinc oxide in the Zn(Se,OH) films can be controlled by the ammonia concentrations in the deposition solutions. A conclusion could be drawn that the amount of zinc selenide in the chemical-bath-deposited Zn(Se,OH) films increased with an increase in the ammonia concentrations.
Figure 10a shows the oxygen 1s binding energy curves of the Zn(Se,OH) films deposited with an ammonia concentration of 0.03 M and the selenourea concentrations varying from 0.0075 M to 0.075 M. The deconvolution of the oxygen 1s displayed two peaks, which were attributed to zinc hydroxide and zinc oxide. Clearly, the content ratios of zinc hydroxide to zinc oxide were increased with an increase in the selenourea concentrations for the as-deposited Zn(Se,OH) films. For Figure 10b, the peaks of these binding energy curves were shifted toward the lower binding energies with an increase in the selenourea concentrations in the solutions. With the same variation tendency as comparing to the results shown in Figure 9b, the peaks of Zn 2p3 binding-energy spectra were shifted from around 1022.5 eV (binding energy of Zn-O [25]), to the binding energies of Zn-Se bonds for the Zn(Se,OH) films, deposited with the selenourea concentrations varying from 0.0075 M to 0.075 M in the deposition solutions. This indicates that the compositions of the Zn(Se,OH) films can be controlled by the variation of selenourea concentrations for the CBD process.
For the results presented in Figure 9 and Figure 10, interestingly, the increase in the ammonia or selenourea concentrations led to the similar variation patterns of the oxygen 1s and zinc 2p3 binding-energy spectra for the as-deposited Zn(Se,OH) films.
The compositions of the Zn(Se,OH) films deposited with various ammonia or selenourea concentrations were analyzed by conducting the deconvolution of the photoelectron binding energy spectra as follows. The oxygen 1s, selenium 3d, and zinc 2p3 photoelectron binding energy spectra for the films were fitted with Gaussian-Lorentzian curves, as shown in Figure 11a–c, respectively. For the analysis of oxygen 1s binding-energy curve as illustrated in Figure 11a, two peaks at 530.4 eV and 531.7 eV obtained from the deconvolution of oxygen 1s binding-energy curve demonstrated that the film consisted of the chemical bonds of Zn-O [25] and Zn-OH [27], respectively. The selenium 3d spectrum fitted well with a single peak of ZnSe at 54.4 eV is shown in Figure 11b. As exhibited in Figure 11c, three fitted peaks at 1022.2 eV, 1022.5 eV, and 1022.7 eV, corresponding to ZnSe, Zn(OH)2, and ZnO, respectively, were present in the zinc 2p3 curve for the film after sputtering for 120 s. The as-deposited film containing the compounds of ZnSe, Zn(OH)2, and ZnO was verified. Furthermore, the atomic percentages of ZnSe, Zn(OH)2, and ZnO in the films can thus be estimated from these results, and will be discussed in the following sections.
With the best surface morphologies of Zn(Se,OH) films shown in Figure 1b and Figure 3d, the XPS depth profiles of the Zn(Se,OH) films deposited with selenourea concentration of 0.03 M and the ammonia concentration of 1.2 M, and deposited with selenourea concentration of 0.045 M and the ammonia concentration of 1.4 M are demonstrated in Figure 12a,b, respectively. Before sputtering, more oxygen than selenium was found for the Zn(Se,OH) films deposited with either process condition owing to the films exposing to the air. After sputtering, the atomic concentrations of oxygen dropped for both films. More Se contents were found than oxygen contents in the films, revealing that more ZnSe as well as less Zn(OH)2 and ZnO were formed during the process. The XPS depth profiles show that the zinc, oxygen, and selenium contents were nearly constant within the films. The rising Si concentrations indicated that the glass substrates had been reached, which is shown in the shaded region of Figure 12.

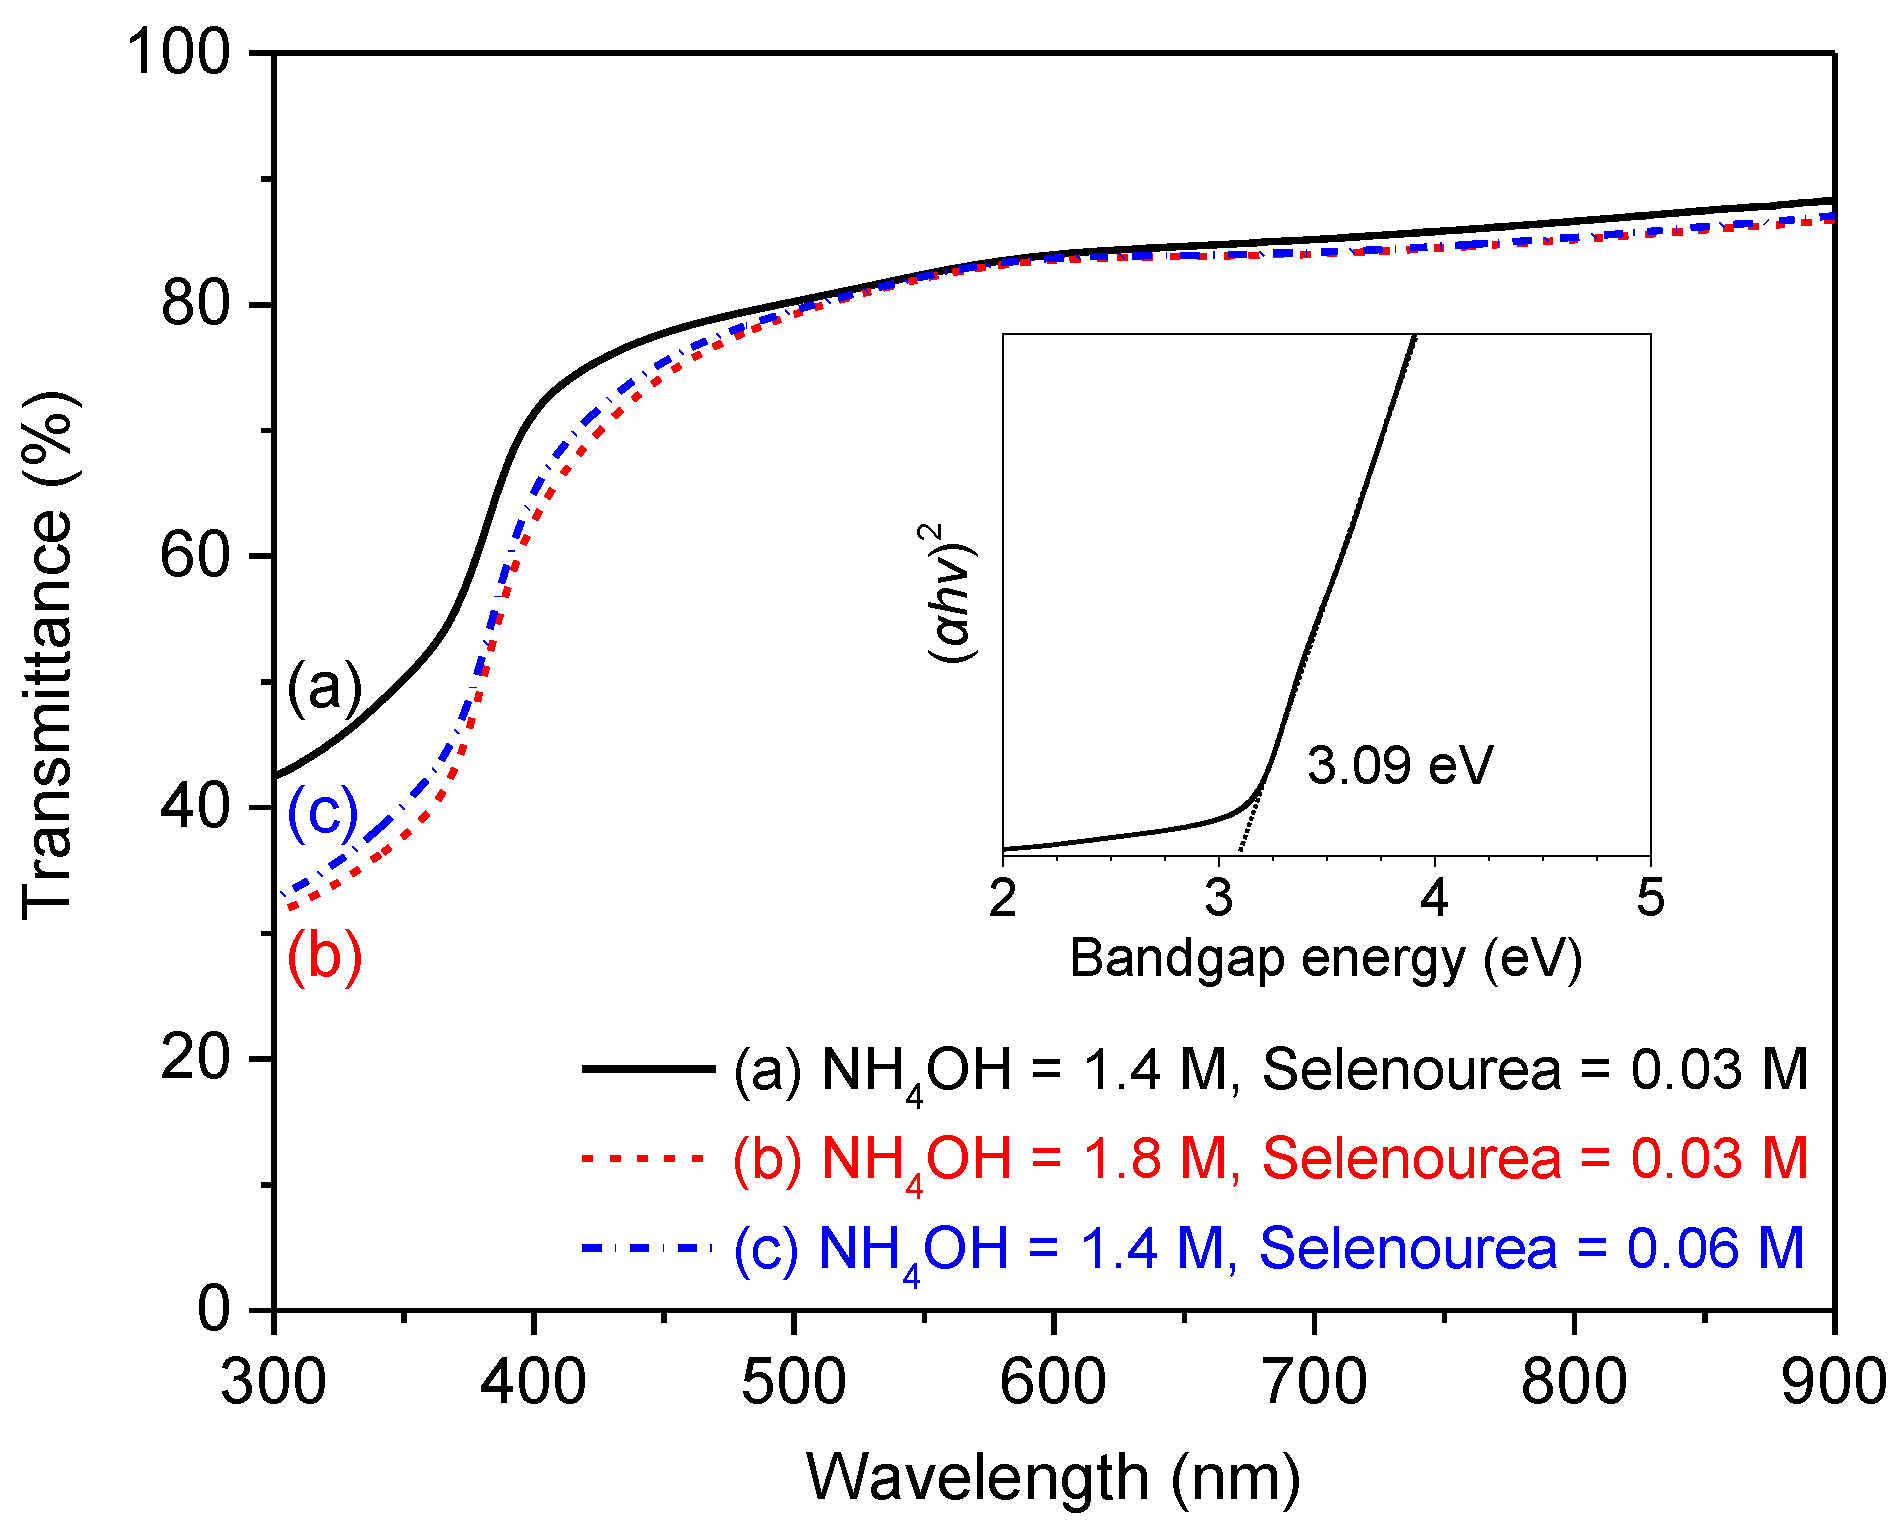
3.4. Optical Properties

The spectral transmittance of Zn(Se,OH) films deposited on the soda-lime glass substrates in the wavelength range of 300–900 nm, which was measured using a spectrophotometer. For the CBD Zn(Se,OH) films with a thickness of around 80–100 nm determined from the cross-sectional view of FESEM images, the transmittance as high as 88% in the wavelength range of 300–900 nm was obtained, as exhibited in Figure 13, where there was a sharp drop in the spectral transmittance for the wavelength below 400 nm. The bandgap energy of Zn(Se,OH) films was determined from the optical absorption data. It has been reported that the CBD ZnSe films is a direct bandgap semiconductor [22,28,29,30]. To obtain the direct transition, (αhν)2 was plotted against for the Zn(Se,OH) films deposited on the glass substrates by the CBD process, as shown in the inset of Figure 13, where α, h, and ν are the absorption coefficient, Planck constant, and optical frequency, respectively. The optical bandgap energy of the Zn(Se,OH) film deposited with the ammonia concentration of 1.4 M, and the selenourea concentration of 0.03 M was estimated around 3.09 V from the intercept of this plot.

3.5. Bandgap Energies

The bandgap energies of the Zn(Se,OH) films were determined from the optical properties. For the atomic percentages of ZnSe, Zn(OH)2, and ZnO determined from the deconvolution of Zn 2p3 binding energy spectra for the Zn(Se,OH) films as discussed previously, the bandgap energies and atomic percentages of ZnSe, Zn(OH)2, and ZnO of the Zn(Se,OH) films as a function of the selenourea concentrations and the ammonia concentrations are illustrated in Figure 14. The dependence of the bandgap energies on the ammonia concentrations or the selenourea concentrations was evident. The increment in the selenourea concentrations or the ammonia concentrations showed the same variation trends of the bandgap energies for the chemical-bath-deposited Zn(Se,OH) films.
As hydrazine hydrate and ammonia acted as the complexing agents, the zinc ions were released by the decomplexation of Zn(NH3)42+ and Zn(N2H4)32+, and then reacted with the selenium ions released from the hydrolysis of selenourea under the basic condition. Thus, the ZnSe films were formed on the substrates. In addition, the zinc hydroxide was formed for the presence of zinc ions in the aqueous alkaline solution. The nucleation centers were typically formed by the absorption of zinc hydroxy species on the surface of substrates. The initial layer of the thin film was formed through the replacement of hydroxy group by the oxide and Se ions, and subsequently the solid film was grown by the condensation of metal and Se ions onto the top of initial layer. As a result, the Zn(Se,OH) films were grown on the substrates. The global reaction of the process can be expressed as follows [9,10,31]:
Zn ( NH 3 ) 4 2 + + SeC ( NH 2 ) 2 + 2 OH ZnSe + 4 NH 3 + 2 H 2 O + CN 2 H 2
The chemical reaction (1) implies that the increment in either the ammonia concentrations or the selenourea concentrations favor the formation of ZnSe. Consequently, the atomic percentages of ZnSe in the Zn(Se,OH) films increased, as exhibited in Figure 14. The same variation trend of the bandgap energies for the chemical-bath-deposited Zn(Se,OH) films could be achieved by controlling the selenourea concentrations or the ammonia concentrations. Nonetheless, a wider range of bandgap energies was achieved for the films deposited with the specified range of the ammonia concentrations, which suggested that the ammonia concentrations had more substantial impacts on the compositions and thus the bandgap energies than the selenourea concentrations.
The bandgap energies of ZnSe and ZnO are 2.7 eV [32] and 3.3 eV [33], respectively. Ernits et al. reported that the bandgap energy of Zn(OH)2 was greater than 3.3 eV [34]. Among ZnSe, Zn(OH)2, and ZnO, ZnSe has the smallest bandgap energy of 2.7 eV. As depicted in Figure 14, the atomic percentages of Zn(OH)2 and ZnO in the films varied mildly with the increase in the selenourea concentrations or the ammonia concentrations. In contrast, the contents of ZnSe for the films increased significantly with the increase in the selenourea concentrations or the ammonia concentrations, which caused a reduction in the bandgap energies of the films toward 2.7 eV. The compound of ZnSe became the dominant contents of the Zn(Se,OH) films as the selenourea concentrations or the ammonia concentrations increased. Therefore, the bandgap energies of the Zn(Se,OH)x films decreased with an increase in the selenourea concentrations or the ammonia concentrations. It is concluded that the bandgap energies of the films depended on the compositions. For the given ammonia concentrations, the bandgap energies of 2.92 eV to 3.27 eV for the Zn(Se,OH) films were achieved. On the other hand, the bandgap energies of 2.97 eV to 3.21 eV for the Zn(Se,OH) films were obtained for the selenourea concentrations altering from 0.0075 M to 0.075 M.

4. Summary and Conclusions

The Zn(Se,OH) films have been deposited with various ammonia concentrations or selenourea concentrations by the CBD process on the soda-lime glass substrates. The surface morphologies and crystal structure of CBD Zn(Se,OH) films as the buffer layers for CIGS solar cells were analyzed. The conformal coverage of the Zn(Se,OH) films on the glass substrates was achieved for the ammonia concentrations of 0.6 M to 1.4 M, or the selenourea concentrations of 0.03 M to 0.06 M. The XRD results revealed that the CBD Zn(Se,OH) films had the preferred orientation of (111), corresponding to the cubic crystal structure.
The chemical species and the formed compounds in the as-deposited films were verified by the XPS analysis. Zinc selenide, zinc hydroxide, and zinc oxide were found in the films. The effects of ammonium concentrations and the selenourea concentrations on the composition of the as-deposited Zn(Se,OH) films were clear.
For the Zn(Se,OH) films deposited with the ammonia concentrations ranging from 0.6 M to 2.6 M and selenourea concentrations altering from 0.0075 M to 0.075 M, the bandgap energies of 2.92 eV to 3.27 eV and 2.97 eV to 3.21 eV were achieved, respectively. The dependence of the bandgap energies on the compositions of the films was acquired. ZnSe had the greater atomic percentages than Zn(OH)2 and ZnO in the Zn(Se,OH) films deposited with the given ammonia concentrations and selenourea concentrations, and therefore dominantly determined the bandgap energies of Zn(Se,OH) films. With an increase in the selenourea concentrations and the ammonia concentrations, the presence of the greater Se contents and less oxygen contents in the films led to more ZnSe as well as less Zn(OH)2 and ZnO in the films, resulting in a decrease in the bandgap energies due to that ZnSe has the smallest bandgap energy among ZnSe, Zn(OH)2, and ZnO. Consequently, the compositions and the bandgap energies of the films can be controlled by tuning the ammonia concentrations or the selenourea concentrations. The identical variation tendency of the compositions and the bandgap energies for the increment in the ammonia concentrations or the selenourea concentrations was concluded, which could be explained by the chemical reaction (1). For the specified deposition conditions, the ammonia concentrations had the more profound impacts than the selenourea concentrations on the variation of the compositions and the bandgap energies for the Zn(Se,OH) films.

Author Contributions

Data curation, W.-J.C.; Funding acquisition, C.-H.H.; Investigation, C.-H.H., Y.-L.J., W.-J.C. and P.-T.L.; Methodology, C.-H.H., Y.-L.J. and W.-J.C.; Resources, Y.-L.J.; Supervision, C.-H.H.; Visualization, W.-J.C.; Writing–original draft, C.-H.H.; Writing–review & editing, C.-H.H. and W.-J.C.

Funding

This research was funded by Ministry of Science and Technology (MOST), Taiwan under the contract number of 105-2221-E-259-023-MY2.

Acknowledgments

The authors would like to thank for the financial support of Ministry of Science and Technology (MOST), Taiwan under the contract number of 105-2221-E-259-023-MY2.

Conflicts of Interest

The authors declare no conflict of interest. The funders had no role in the design of the study; in the collection, analyses, or interpretation of data; in the writing of the manuscript, and in the decision to publish the results.

References

  1. Jackson, P.; Wuerz, R.; Hariskos, D.; Lotter, E.; Witte, W.; Powalla, M. Effects of heavy alkali elements in Cu(In,Ga)Se2 solar cells with efficiencies up to 22.6%. Phys. Status Solidi-Rapid Res. Lett. 2016, 10, 583–586. [Google Scholar] [CrossRef]
  2. Green, M.A.; Hishikawa, Y.; Dunlop, E.D.; Levi, D.H.; Hohl-Ebinger, J.; Ho-Baillie, A.W.Y. Solar cell efficiency tables (version 52). Prog. Photovolt. Res. Appl. 2018, 26, 427–436. [Google Scholar] [CrossRef]
  3. Mughal, M.A.; Engelken, R.; Sharma, R. Progress in indium (III) sulfide (In2S3) buffer layer deposition techniques for CIS, CIGS, and CdTe-based thin film solar cells. Sol. Energy 2015, 120, 131–146. [Google Scholar] [CrossRef]
  4. Pawar, S.M.; Pawar, B.S.; Kim, J.H.; Joo, O.-S.; Lokhande, C.D. Recent status of chemical bath deposited metal chalcogenide and metal oxide thin films. Curr. Appl. Phys. 2011, 11, 117–161. [Google Scholar] [CrossRef]
  5. Naghavi, N.; Abou-Ras, D.; Allsop, N.; Barreau, N.; Bücheler, S.; Ennaoui, A.; Fischer, C.H.; Guillen, C.; Hariskos, D.; Herrero, J.; et al. Buffer layers and transparent conducting oxides for chalcopyrite Cu(In,Ga)(S,Se)2 based thin film photovoltaics: Present status and current developments. Prog. Photovolt. Res. Appl. 2010, 18, 411–433. [Google Scholar] [CrossRef]
  6. Kato, T. Cu(In,Ga)(Se,S)2 solar cell research in Solar Frontier: Progress and current status. Jpn. J. Appl. Phys. 2017, 56, 04CA02. [Google Scholar] [CrossRef]
  7. Hariskos, D.; Ruckh, M.; Rühle, U.; Walter, T.; Schock, H.W.; Hedström, J.; Stolt, L. A novel cadmium free buffer layer for Cu(In,Ga)Se2 based solar cells. Sol. Energy Mater. Sol. Cell 1996, 41–42, 345–353. [Google Scholar] [CrossRef]
  8. Ennaoui, A.; Blieske, U.; Lux-Steiner, M.C. 13.7%-efficient Zn(Se,OH)x/Cu(In,Ga)(S,Se)2 thin-film solar cell. Prog. Photovolt. Res. Appl. 1998, 6, 447–451. [Google Scholar] [CrossRef]
  9. Ennaoui, A.; Weber, M.; Saad, M.; Harneit, W.; Lux-Steiner, M.C.; Karg, F. Chemical bath deposited Zn(Se,OH)x on Cu(In,Ga)(S,Se)2 for high efficiency thin film solar cells: Growth kinetics, electronic properties, device performance and loss analysis. Thin Solid Films 2000, 361, 450–453. [Google Scholar] [CrossRef]
  10. Ennaoui, A.; Siebentritt, S.; Lux-Steiner, M.C.; Riedl, W.; Karg, F. High-efficiency Cd-free CIGSS thin-film solar cells with solution grown zinc compound buffer layers. Sol. Energy Mater. Sol. Cell 2001, 67, 31–40. [Google Scholar] [CrossRef]
  11. Eisele, W.; Ennaoui, A.; Schubert-Bischoff, P.; Giersig, M.; Pettenkofer, C.; Krauser, J.; Lux-Steiner, M.; Zweigart, S.; Karg, F. XPS, TEM and NRA investigations of Zn(Se,OH)/Zn(OH)2 films on Cu(In,Ga)(S,Se)2 substrates for highly efficient solar cells. Sol. Energy Mater. Sol. Cell 2003, 75, 17–26. [Google Scholar] [CrossRef]
  12. Ennaoui, A.; Eisele, W.; Lux-Steiner, M.; Niesen, T.P.; Karg, F. Highly efficient Cu(Ga,In)(S,Se)2 thin film solar cells with zinc-compound buffer layers. Thin Solid Films 2003, 431–432, 335–339. [Google Scholar] [CrossRef]
  13. Chaparro, A.; Maffiotte, C.; Gutiérrez, M.; Herrero, J.; Klaer, J.; Siemer, K.; Bräunig, D. Characterisation of CuInS2/ZnSe junctions by XPS and electroreflectance. Thin Solid Films 2001, 387, 104–107. [Google Scholar] [CrossRef]
  14. Chaparro, A.M.; Gutiérrez, M.T.; Herrero, J.; Klaer, J.; Romero, M.J.; Al-Jassim, M.M. Characterisation of CuInS2/Zn(Se,O)/ZnO solar cells as a function of Zn(Se,O) buffer deposition kinetics in a chemical bath. Prog. Photovolt. Res. Appl. 2002, 10, 465–480. [Google Scholar] [CrossRef]
  15. Kanevce, A.; Ramanathan, K.; Contreras, M. Impact of buffer and absorber properties in the vicinity of the interface on wide-gap Cu(In,Ga)Se2 solar cell performance. In Proceedings of the 40th IEEE Photovoltaic Specialist Conference, Denver, CO, USA, 8–13 June 2014; pp. 382–386. [Google Scholar]
  16. Niemegeers, A.; Burgelman, M.; De Vos, A. On the CdS/CuInSe2 conduction band discontinuity. Appl. Phys. Lett. 1995, 67, 843–845. [Google Scholar] [CrossRef]
  17. Klenk, R. Characterisation and modelling of chalcopyrite solar cells. Thin Solid Films 2001, 387, 135–140. [Google Scholar] [CrossRef]
  18. Gloeckler, M.; Sites, J.R. Efficiency limitations for wide-band-gap chalcopyrite solar cells. Thin Solid Films 2005, 480–481, 241–245. [Google Scholar] [CrossRef]
  19. Song, T.; Kanevce, A.; Sites, J.R. Emitter/absorber interface of CdTe solar cells. J. Appl. Phys. 2016, 119, 233104. [Google Scholar] [CrossRef] [Green Version]
  20. Li, J.V.; Grover, S.; Contreras, M.A.; Ramanathan, K.; Kuciauskas, D.; Noufi, R. A recombination analysis of Cu(In,Ga)Se2 solar cells with low and high ga compositions. Sol. Energy Mater. Sol. Cell 2014, 124, 143–149. [Google Scholar] [CrossRef]
  21. Paul, S.; Grover, S.; Repins, I.L.; Keyes, B.M.; Contreras, M.A.; Ramanathan, K.; Noufi, R.; Zhao, Z.; Liao, F.; Li, J.V. Analysis of back-contact interface recombination in thin-film solar cells. IEEE J. Photovolt. 2018, 8, 871–878. [Google Scholar] [CrossRef]
  22. Agawane, G.L.; Shin, S.W.; Suryawanshi, M.P.; Gurav, K.V.; Moholkar, A.V.; Lee, J.Y.; Patil, P.S.; Yun, J.H.; Kim, J.H. Novel reduced toxic route synthesis and characterization of chemical bath deposited ZnSe thin films. Ceram. Int. 2014, 40, 367–374. [Google Scholar] [CrossRef]
  23. Agawane, G.L.; Wook Shin, S.; Suryawanshi, M.P.; Gurav, K.V.; Moholkar, A.V.; Yong Lee, J.; Patil, P.S.; Ho Yun, J.; Hyeok Kim, J. Preparation and characterization of chemical bath deposited nanocrystalline ZnSe thin films using Na3-citrate and hydrazine hydrate: A comparative study. Mater. Lett. 2013, 106, 186–189. [Google Scholar] [CrossRef]
  24. Islam, R.; Rao, D.R. X-ray photoelectron spectroscopy of Zn1−xCdxSe thin films. J. Electron. Spectrosc. 1996, 81, 69–77. [Google Scholar] [CrossRef]
  25. Moulder, J.F.; Stickle, W.F.; Sobol, P.E.; Bomben, K.D. Appendix B. In Handbook of X-ray Photoelectron Spectroscopy; Physical Electronics Inc.: Eden Prairie, MN, USA, 1995; pp. 231–232, 242. ISBN 0-9648124-1-X. [Google Scholar]
  26. Dake, L.S.; Baer, D.R.; Zachara, J.M. Auger parameter measurements of zinc compounds relevant to zinc transport in the environment. Surf. Interface Anal. 1989, 14, 71–75. [Google Scholar] [CrossRef]
  27. Guimon, M.F.; Pfister-Guillouzo, G.; Bremont, M.; Brockmann, W.; Quet, C.; Chenard, J.Y. Application of X-ray photoelectron spectroscopy to the study of degradation mechanisms of epoxy-bonded joints of zinc coated steel. Appl. Surf. Sci. 1997, 108, 149–157. [Google Scholar] [CrossRef]
  28. Sadekar, H.K.; Ghule, A.V.; Sharma, R. Nanocrystalline ZnSe thin films prepared by solution growth technique for photosensor application. Compos. Part B-Eng. 2013, 44, 553–557. [Google Scholar] [CrossRef]
  29. Wei, A.; Zhao, X.; Liu, J.; Zhao, Y. Investigation on the structure and optical properties of chemically deposited ZnSe nanocrystalline thin films. Physica B 2013, 410, 120–125. [Google Scholar] [CrossRef]
  30. Chen, L.; Zhang, D.; Zhai, G.; Zhang, J. Comparative study of ZnSe thin films deposited from modified chemical bath solutions with ammonia-containing and ammonia-free precursors. Mater. Chem. Phys. 2010, 120, 456–460. [Google Scholar] [CrossRef]
  31. Lokhande, C.D.; Patil, P.S.; Tributsch, H.; Ennaoui, A. ZnSe thin films by chemical bath deposition method. Sol. Energy Mater. Sol. Cell 1998, 55, 379–393. [Google Scholar] [CrossRef]
  32. Srikant, V.; Clarke, D.R. Optical absorption edge of ZnO thin films: The effect of substrate. J. Appl. Phys. 1997, 81, 6357–6364. [Google Scholar] [CrossRef]
  33. Ernits, K.; Muska, K.; Danilson, M.; Raudoja, J.; Varema, T.; Volobujeva, O.; Altosaar, M. Anion effect of zinc source on chemically deposited ZnS(O,OH) films. Adv. Mater. Sci. Eng. 2009, 2009. [Google Scholar] [CrossRef]
  34. Doña, J.M.; Herrero, J. Chemical-bath deposition of ZnSe thin films process and material characterization. J. Electrochem. Soc. 1995, 142, 764–770. [Google Scholar] [CrossRef]
Figure 1. Surface morphologies of Zn(Se,OH) films deposited with a constant selenourea concentration of 0.03 M, and the ammonia concentrations of (a) 0.6 M; (b) 1.2 M; (c) 1.4 M; (d) 1.8 M; (e) 2.2 M and (f) 2.6 M.
Crystals 08 00343 g001
Figure 2. Surface morphologies of Zn(Se,OH) films deposited with a constant ammonia concentration of 1.4 M, and the selenourea concentrations of (a) 0.0075 M; (b) 0.015 M; (c) 0.03 M; (d) 0.045 M; (e) 0.06 M and (f) 0.075 M.
Crystals 08 00343 g002
Figure 3. FESEM images of cross-sectional views for Zn(Se,OH) films deposited with a constant selenourea concentration of 0.03 M, and the NH4OH concentrations of (a) 0.6 M; (b) 1.2 M; (c) 1.4 M; (d) 1.8 M; (e) 2.2 M and (f) 2.6 M.
Crystals 08 00343 g003
Figure 4. FESEM images of cross-sectional views for Zn(Se,OH) films deposited with a constant ammonia concentration of 1.4 M, and the selenourea concentrations of (a) 0.0075 M; (b) 0.015 M; (c) 0.03 M; (d) 0.045 M; (e) 0.06 M and (f) 0.075 M.
Crystals 08 00343 g004
Figure 5. Thicknesses and deposition rates of Zn(Se,OH) films deposited with various ammonia concentrations and selenourea concentrations.
Crystals 08 00343 g005
Figure 6. XRD patterns of a soda-lime glass substrate and Zn(Se,OH) films deposited with (a) ammonia concentration of 1.4 M and selenourea concentration of 0.06 M; (b) ammonia concentration of 1.8 M and selenourea concentration of 0.03 M and (c) ammonia concentration of 1.4 M and selenourea concentration of 0.03 M.
Crystals 08 00343 g006
Figure 7. Montage of photoelectron binding-energy spectra for the depth profiles of Zn 2p3, Se 3d, and O 1s of a Zn(Se,OH) film, deposited with NH4OH concentration of 1.2 M (view with after-sputtering curve in the background).
Crystals 08 00343 g007
Figure 8. Montage of photoelectron binding-energy spectra for the depth profiles of Zn 2p3, Se 3d, and O 1s of a Zn(Se,OH) film, deposited with selenourea concentration of 0.045 M (view with after-sputtering curve in the background).
Crystals 08 00343 g008
Figure 9. After sputtering for 120 s, (a) oxygen 1s and (b) zinc 2p3 binding-energy spectra of Zn(Se,OH) films deposited with selenourea concentration of 0.03 M and ammonia concentrations in the range of 0.6 to 2.6 M.
Crystals 08 00343 g009
Figure 10. After sputtering for 120 s, (a) oxygen 1s and (b) zinc 2p3 binding-energy spectra of Zn(Se,OH) films, deposited with ammonia concentration of 0.03 M and selenourea concentrations in the range of 0.0075 to 0.075 M.
Crystals 08 00343 g010
Figure 11. For a Zn(Se,OH) film deposited with NH4OH concentration of 1.2 M after sputtering for 120 s, (a) the oxygen 1s; (b) the selenium 3d, and (c) the zinc 2p3 photoelectron binding energy spectra.
Crystals 08 00343 g011
Figure 12. XPS depth profiles of Zn(Se,OH) films (a) deposited with selenourea concentration of 0.03 M and the ammonia concentration of 1.2 M, and (b) deposited with selenourea concentration of 0.045 M and the ammonia concentration of 1.4 M.
Crystals 08 00343 g012
Figure 13. Spectral dependence of optical transmittance for the Zn(Se,OH) films grown on soda-lime glass substrates. Inset is the plot of (αhν)2 versus for the Zn(Se,OH) film deposited on the glass substrate.
Crystals 08 00343 g013
Figure 14. Bandgap energies and atomic percentages of ZnSe, Zn(OH)2, and ZnO of Zn(Se,OH) films as a function of selenourea concentrations and ammonia concentrations.
Crystals 08 00343 g014
Table 1. Binding energies of ZnSe, ZnO, and Zn(OH)2 for the photoelectron line positions of Zn 2p3, Se 3d, and O 1s.
Photoelectron Line PositionCompoundBinding Energy (eV)Reference
Zn 2p3ZnSe1022.2[24]
ZnO1022.5[25]
Zn(OH)21022.7[26]
Se 3dZnSe54.4[24]
O 1sZnO530.4[25]
Zn(OH)2531.7[27]
SiO2532.5[25]

