Article

Comparative Study on the Sand Bioconsolidation through Calcium Carbonate Precipitation by Sporosarcina pasteurii and Bacillus subtilis

1
Department of Chemical Engineering, National Chung Cheng University, Chiayi 62102, Taiwan
2
Department of Civil Engineering, National Chung-Hsing University, Taichung 40227, Taiwan
3
Department of Biomedical Sciences, National Chung Cheng University, Chiayi 62102, Taiwan
4
Department of Civil Engineering, National Taipei University of Technology, Taipei 10655, Taiwan
5
Department of Biotechnology, National Kaohsiung Normal University, Kaohsiung 82444, Taiwan
6
Department of Earth and Environmental Sciences, National Chung Cheng University, Chiayi 62102, Taiwan
7
Center for Innovative Research on Aging Society, National Chung Cheng University, Chiayi 62102, Taiwan
*
Author to whom correspondence should be addressed.
Crystals 2018, 8(5), 189; https://doi.org/10.3390/cryst8050189
Submission received: 11 November 2017 / Revised: 20 March 2018 / Accepted: 21 April 2018 / Published: 27 April 2018
(This article belongs to the Special Issue Carbonates)

Abstract

:
To investigate potential implications of microbial activity on sand bioconsolidation and subsurface environments, two ureolytic strains, Sporosarcina pasteurii and Bacillus subtilis were tested for the production of calcium carbonate (CaCO3). Laboratory experiments with monoculture S. pasteurii (column 1) and coculture S. pasteurii-B. subtilis (column 2) were conducted to determine urea and calcium chloride reactivity and volumetric carbonate formation. Both columns were able to consolidate sand, whereas, column 1 induced greater CaCO3 precipitation. X-ray diffraction (XRD) and scanning electron microscopy (SEM) showed two columns with different mineralogy with calcite, and vaterite formation. Column 1 showed rhombohedral and trigonal crystals morphology, whereas column 2 developed the prismatic calcite and the spherulite vaterite crystals might be due to the differences of the micro-environment caused by the urease expression of these bacterial species. These results indicate the possibility of using those crystals to cement loose sand whereas, highlighted the importance of combining these techniques to understand the geomicrobiology found in the subsurface environments.

1. Introduction

Calcium carbonate (CaCO3) biogenic precipitation is considered as an important process in nature with respect to its role in early diagenesis of marine sediments, hydrochemical evolution of karst streams, application of Geological and Civil Engineering and environmental treatments [1]. From a geotechnical point of view, the potential of microbial carbonate precipitation (MCP) has been identified as a means of adapting soil properties to suit desired land-uses [2]. The reaction is widely distributed in soil, freshwater, marine and subsurface environments. MCP can occur via a variety of processes whereby microbial activities results in the generation of carbonate in a calcium rich environment. The urea hydrolysis by the enzyme urease of microorganisms in a calcium-rich environment is the most commonly MCP studied. The CO32− and NH4+ from the hydrolysis of urea increase of the pH and carbonates concentration, which lead to the precipitation of calcium carbonate.
CO(NH2)2 + 2H2O → 2NH4+ + CO32−
Ca2+ + CO32− → CaCO3
Through MCP, microbes play an important role in promoting calcite precipitation. Some mechanisms studied by researchers that can induce CaCO3 deposition are: (1) the depositing particles are captured or adhered to by microbial mat or biofilm; (2) extracellular polymeric substances (EPS) can absorb Ca2+ so that carbonate microcrystals form on the surface of the biofilm and result in CaCO3 formation; (3) in the environment with higher content of dissolved inorganic carbon (DIC), EPS degradation will release the Ca2+ ions that are chelated inside it, so that the supersaturation degree of Ca2+ in the environment will be continuously enhanced, resulting in promoting the precipitation of CaCO3; (4) Some bacteria can induce precipitation of CaCO3 extracellularly through such processes as photosynthesis, ammonification, denitrification, sulfate reduction and anaerobic sulfide oxidation; (5) degradation of urea by urea-decomposing bacteria increases pH and alkalinity of the environment, leading to CaCO3 precipitation [3,4,5,6,7,8,9]. Mechanisms 1, 2 and 3 are defined as passive forms of precipitation in the presence of organic matter and mechanisms 4 and 5 involve indirect modifications of chemical conditions [4,6]
Considerable research on MCP has been performed using ureolytic bacteria, which influence the precipitation of CaCO3, by the production of the enzyme urease. Urease catalyzes the hydrolysis of urea to CO2 and ammonia. The resulting CaCO3 precipitation is governed by (1) calcium concentration; (2) carbonate concentration; (3) pH and (4) the use of nucleation sites [10]. The fact that hydrolysis of urea is a straightforward common microbial process and that a wide variety of microorganisms produce the urease enzyme makes it ideally suited for biotechnological applications. Urease activity is widespread among bacteria and this has been the approach most often applied for MCP for the production of calcite [11,12]. Urease-producing bacteria can be grouped into two categories according to their urease response to ammonium; those whose urease activity is not repressed (S. pasteurii, Helicobacter pyroli) and those whose urease activity is repressed (Psuedomonas aeruginosa, Klensiella aerogenes) [13,14]. Because high concentrations of urea are hydrolyzed during biocementation, only those microorganisms whose urease activity is not repressed by ammonium are useful. As well as meeting the needs for biocementation, the organism must also meet the needs for safe environmental application. In order to maintain the microbial ecological system in the environment, it will be suitable to apply and release those strains with non-pathogenic, non-genetically modified and non-transferable elements.
S. pasteurii has been widely used as a model organism for the MCP process because this strain is non-pathogenic with significantly high level of urease activity [15]. Calcium carbonate precipitation, a widespread phenomenon among bacteria, has been investigated due to its wide range of scientific and technological implications. Calcite formation by B. subtilis (which is a model laboratory bacterium that can produce calcite precipitates on suitable media supplemented with a calcium source) has also been studied [16]. It is also well known that B. subtilis was used to produce the varieties of exopolymeric substances, for example, biosurfactants of surfactin. At present, some studies have been done on the role of B. subtilis in calcite precipitation. However, there are no adequate studies on the role of calcite precipitation by B. subtilis in coculture environments for sand bioconsolidation. We selected B. subtilis to study the influence of growth and metabolism of S. pasteurii for biocementation processes. In order to clarify the contribution and influence of B. subtilis, the monoculture S. pasteurii and the coculture S. pasteurii-B. subtilis were studied in two different experimental systems. A main part of this research focuses on studying coculture environment for sand bioconsolidation through carbonate precipitation and geomicrobiology in the subsurface environment.

2. Results and Discussion

The effect of two types of microbial systems were evaluated to study the distribution of their activity and calcium carbonate precipitation in sand column through a number of steps elaborated in Table 1.
Initially, immobilization of bacteria in the column was achieved by a two-phase injection. In order to fill the column volume, bacteria were injected. When bacteria were visualized in the outlet as seen by turbidity, 300 mL of 50 mM calcium chloride solution was injected into the column to immobilize the bacteria in a moving reaction front in the column. To start the cementation, 1.1 M equimolar urea and calcium chloride was injected. Samples were collected at regular intervals to measure OD, pH, urease activity, calcium ammonium concentration measurement [2].

2.1. Optical Density and Urease Activity

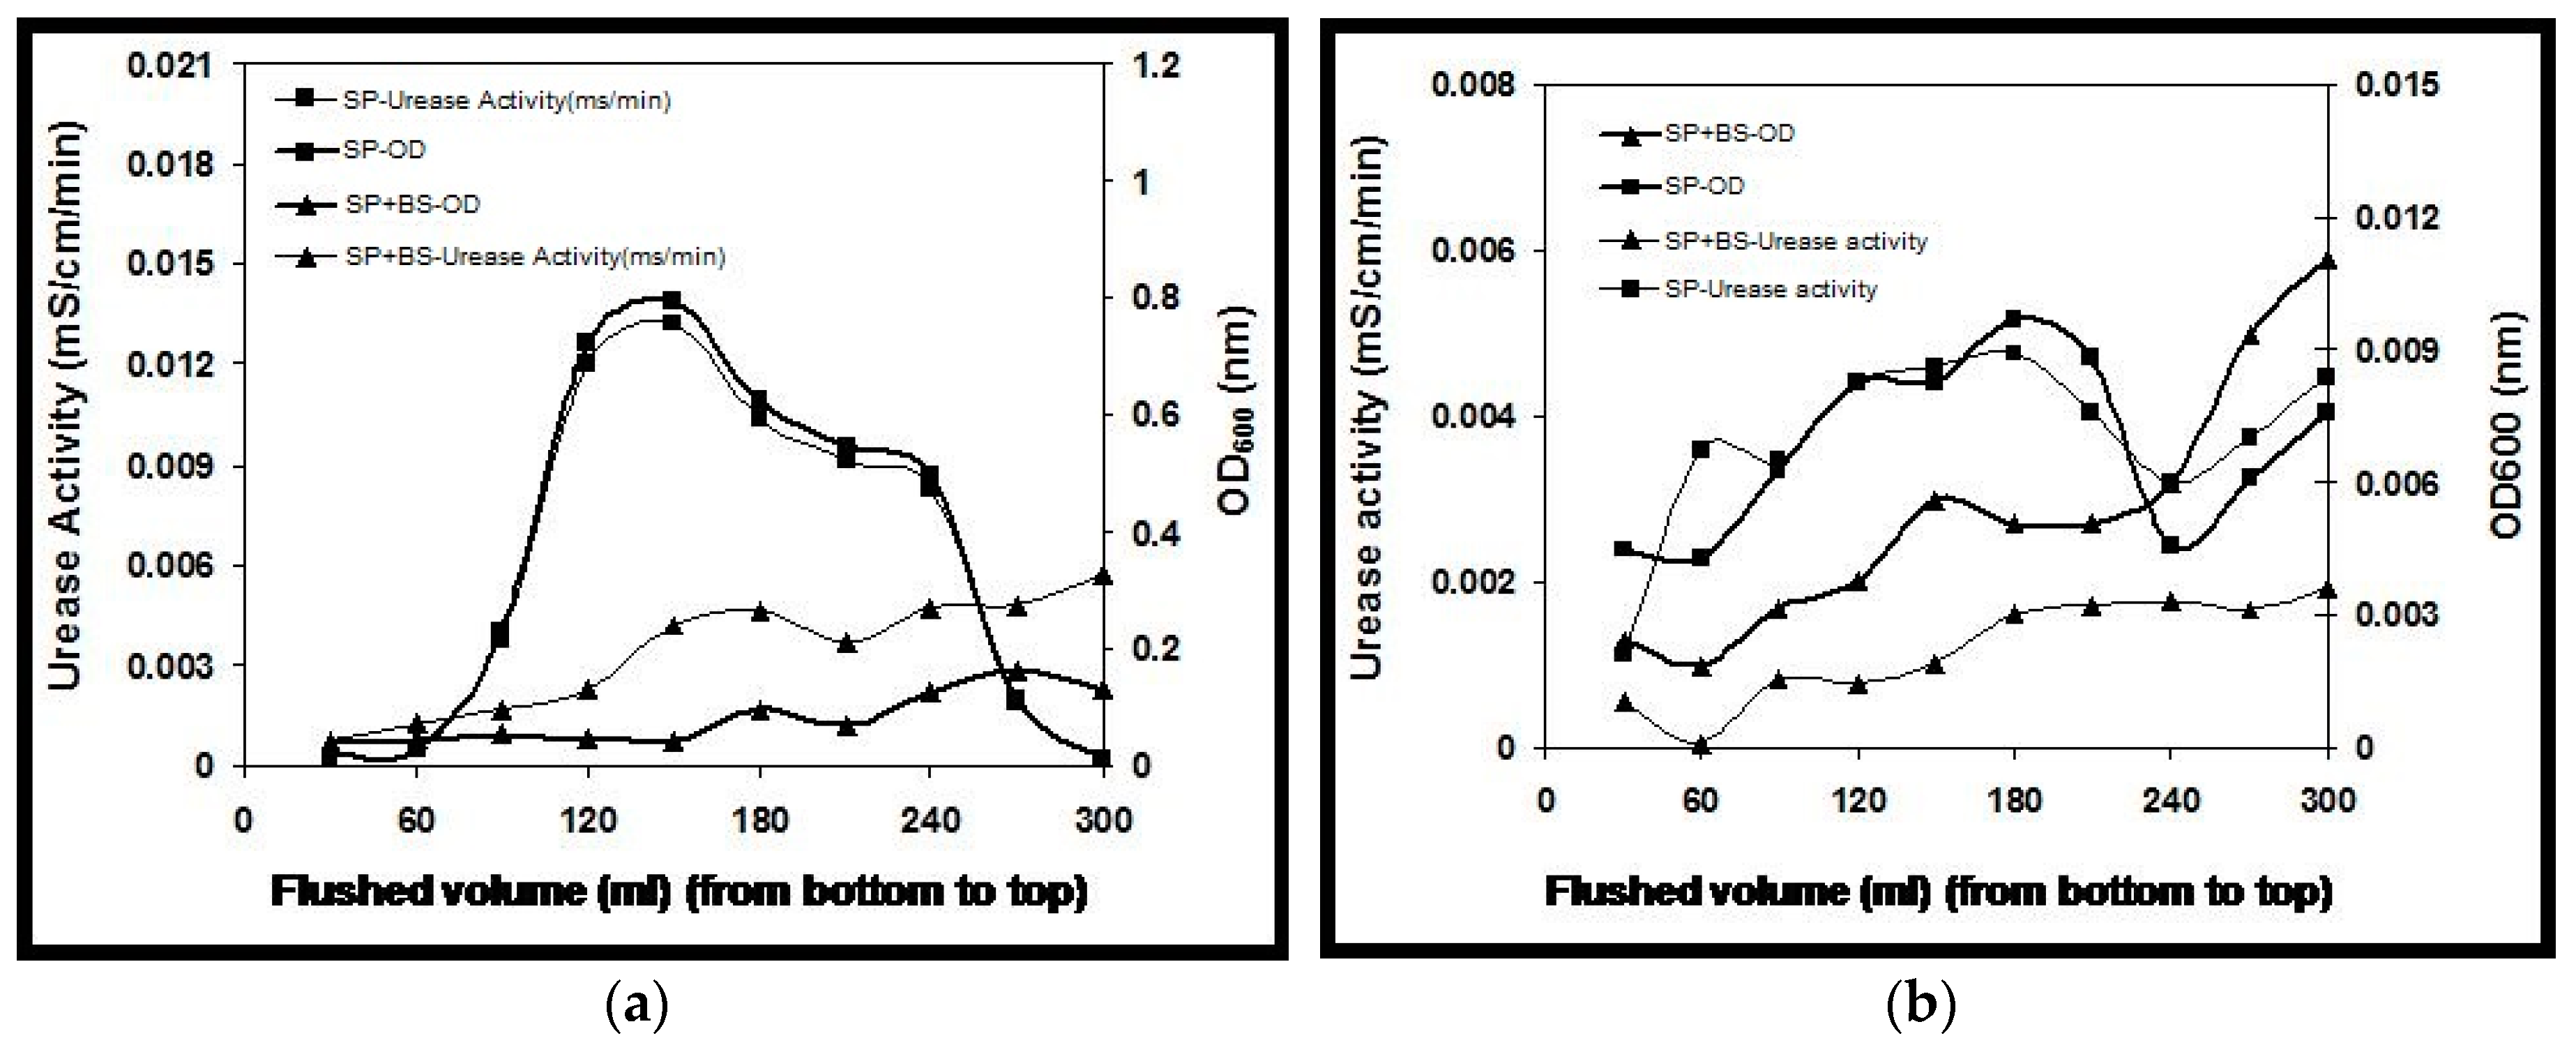
Column 1 and column 2 with monoculture and coculture bacteria were studied to elucidate the distribution of urease activity and optical density over the column length. While flushing 300 mL of bacterial suspension, immediately followed by 300 mL fixation fluid of 50 mM CaCl2 solution, measurement of both optical density and urease activity in the effluent of the sand column showed that a large proportion of the injected bacteria was retained in the column (Figure 1a). Further, after injecting the cementation solution, no noticeable activity or bacteria were observed in the effluent (Figure 1b). The effluent measurements showed that bacteria in the monoculture experiment resulted in more wash-out of cells and activity corresponding to that of coculture. This retainment of more urease activity and optical density in coculture may be attributed to the synergistic relationship between S. pasteurii and B. subtilis, where, in the environment with nutrient limiting conditions or microbes living in deep subsurface, majority of the populations can thrive without any input from the earth’s surface. This might be due to the symbiotic association for their survival where organic compounds or metabolites produced by one bacterial species may be utilized by the other to adapt to the harsh environment.

2.2. Solution Chemistry

The experiments conducted with monoculture and coculture ureolytic bacterial species were monitored for the measurements of pH and NH4+ after the column flush. Monoculture S. pasteurii and coculture S. pasteurii-B. subtilis show almost similar trend in pH over time. During the first batch flush of cementation fluid, the higher pH for column 1 (around 8.6 ± 1) and only a small pH increase (around 8.3 ± 1) in coculture experiments for column 2 were observed. Results obtained for the second and third batch flush also correspond to first batch flush with a slight increase of one-two unit pH, which indicates that S. pasteurii alone have a strong ureolytic capability to break down the urea while releasing NH4+ ions and increasing the solution pH. Similarly, an increase in solution pH for the coculture experiment also shows the strong urease activity in column 2. The control experiment evidenced no change in pH without any bacterial species.
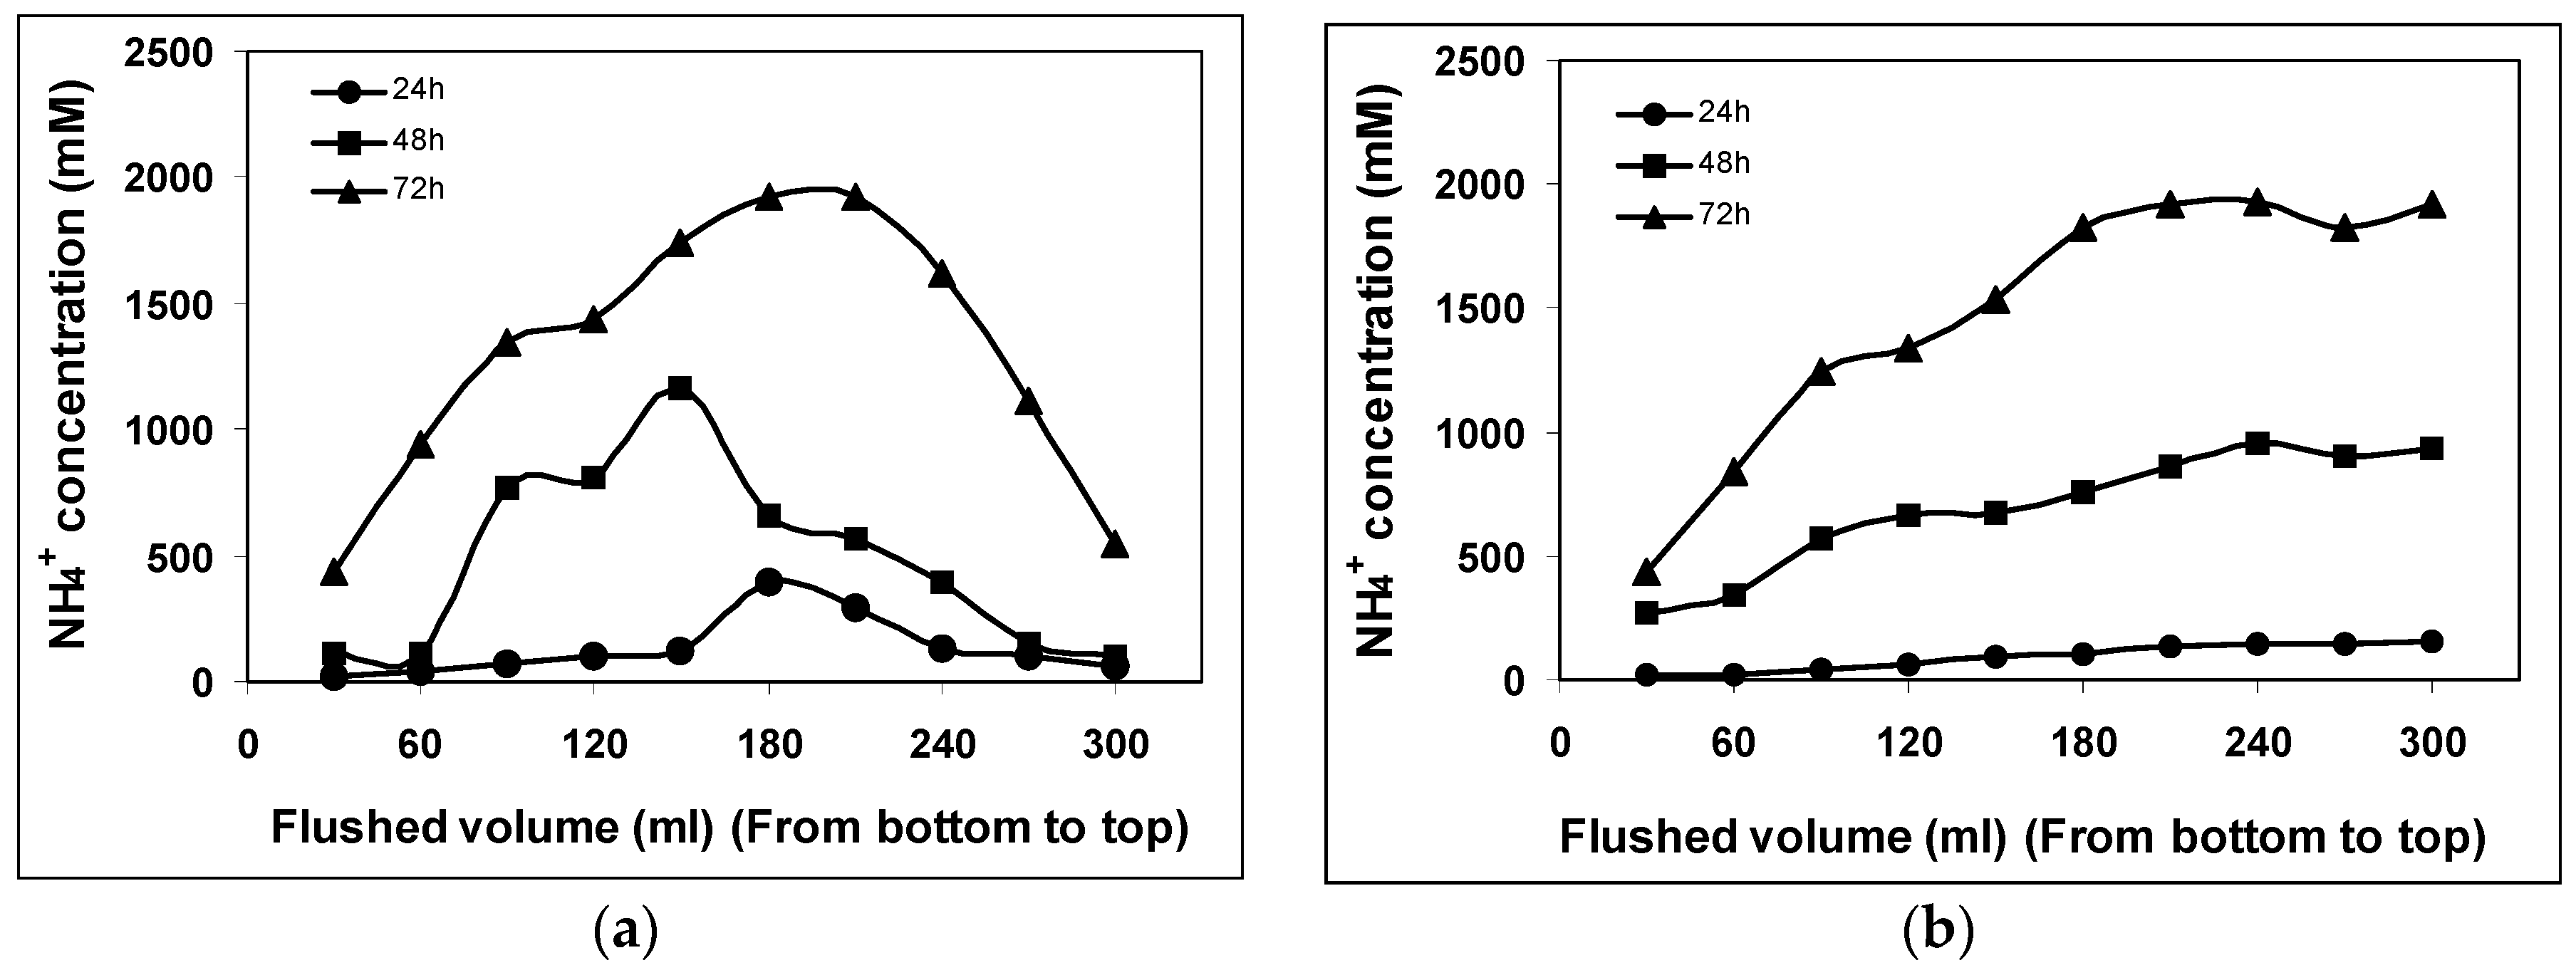
The change in NH4+ concentration over time caused by urea hydrolysis for S. pasteurii is shown in Figure 2. These values of urea hydrolysis are calculated from measured ammonium concentrations using the stoichiometric equation by Whiffin et al. [2]. One mole of urea is assumed to hydrolyze into two moles of ammonium, and therefore, the amount of urea hydrolyzed at any given time is assumed to be equal to half the amount of ammonia produced. During the first batch flush of cementation, i.e., after 24 h, the maximum NH4+ ions produced by S. pasteurii in monoculture experiment was 398 mM which further increased to 1160 mM during the second batch flush after 48 h and 1921 mM during the third batch flush after 72 h respectively (Figure 2a). However, the NH4+ concentration increased linearly with flushed volume for the entire three-batch flush. To determine the urea hydrolysis under the influence of B. subtilis in column 2, a detailed analysis of NH4+ ion production was performed. Figure 2b presents the corresponding NH4+ concentration values determined during a period of 24, 48 and 72 h. The NH4+ concentration does not increase above 157 mM until 24 h during the first batch flush. During the second batch flush with this experiment, NH4+ concentration was found to increase to 953 mM, still lower than column 1, whereas, the third batch flush was shown to convert the urea to almost equimolar proportion with a further increase up to 1929 mM. This conclusively shows that urea hydrolysis is occurring for this system and that mono as well as coculture systems can convert the total urea with almost the same rate at the end of the experiment of around 72 h. The NH4+ profiles shown in Figure 2a demonstrate that bacterial growth was at its peak in the center of the column where the highest NH4+ concentration was measured. In contrast to this, column 2 where no significant bacterial wash out was observed, showed higher NH4+ concentrations at the top of the column and was lowest at the bottom.
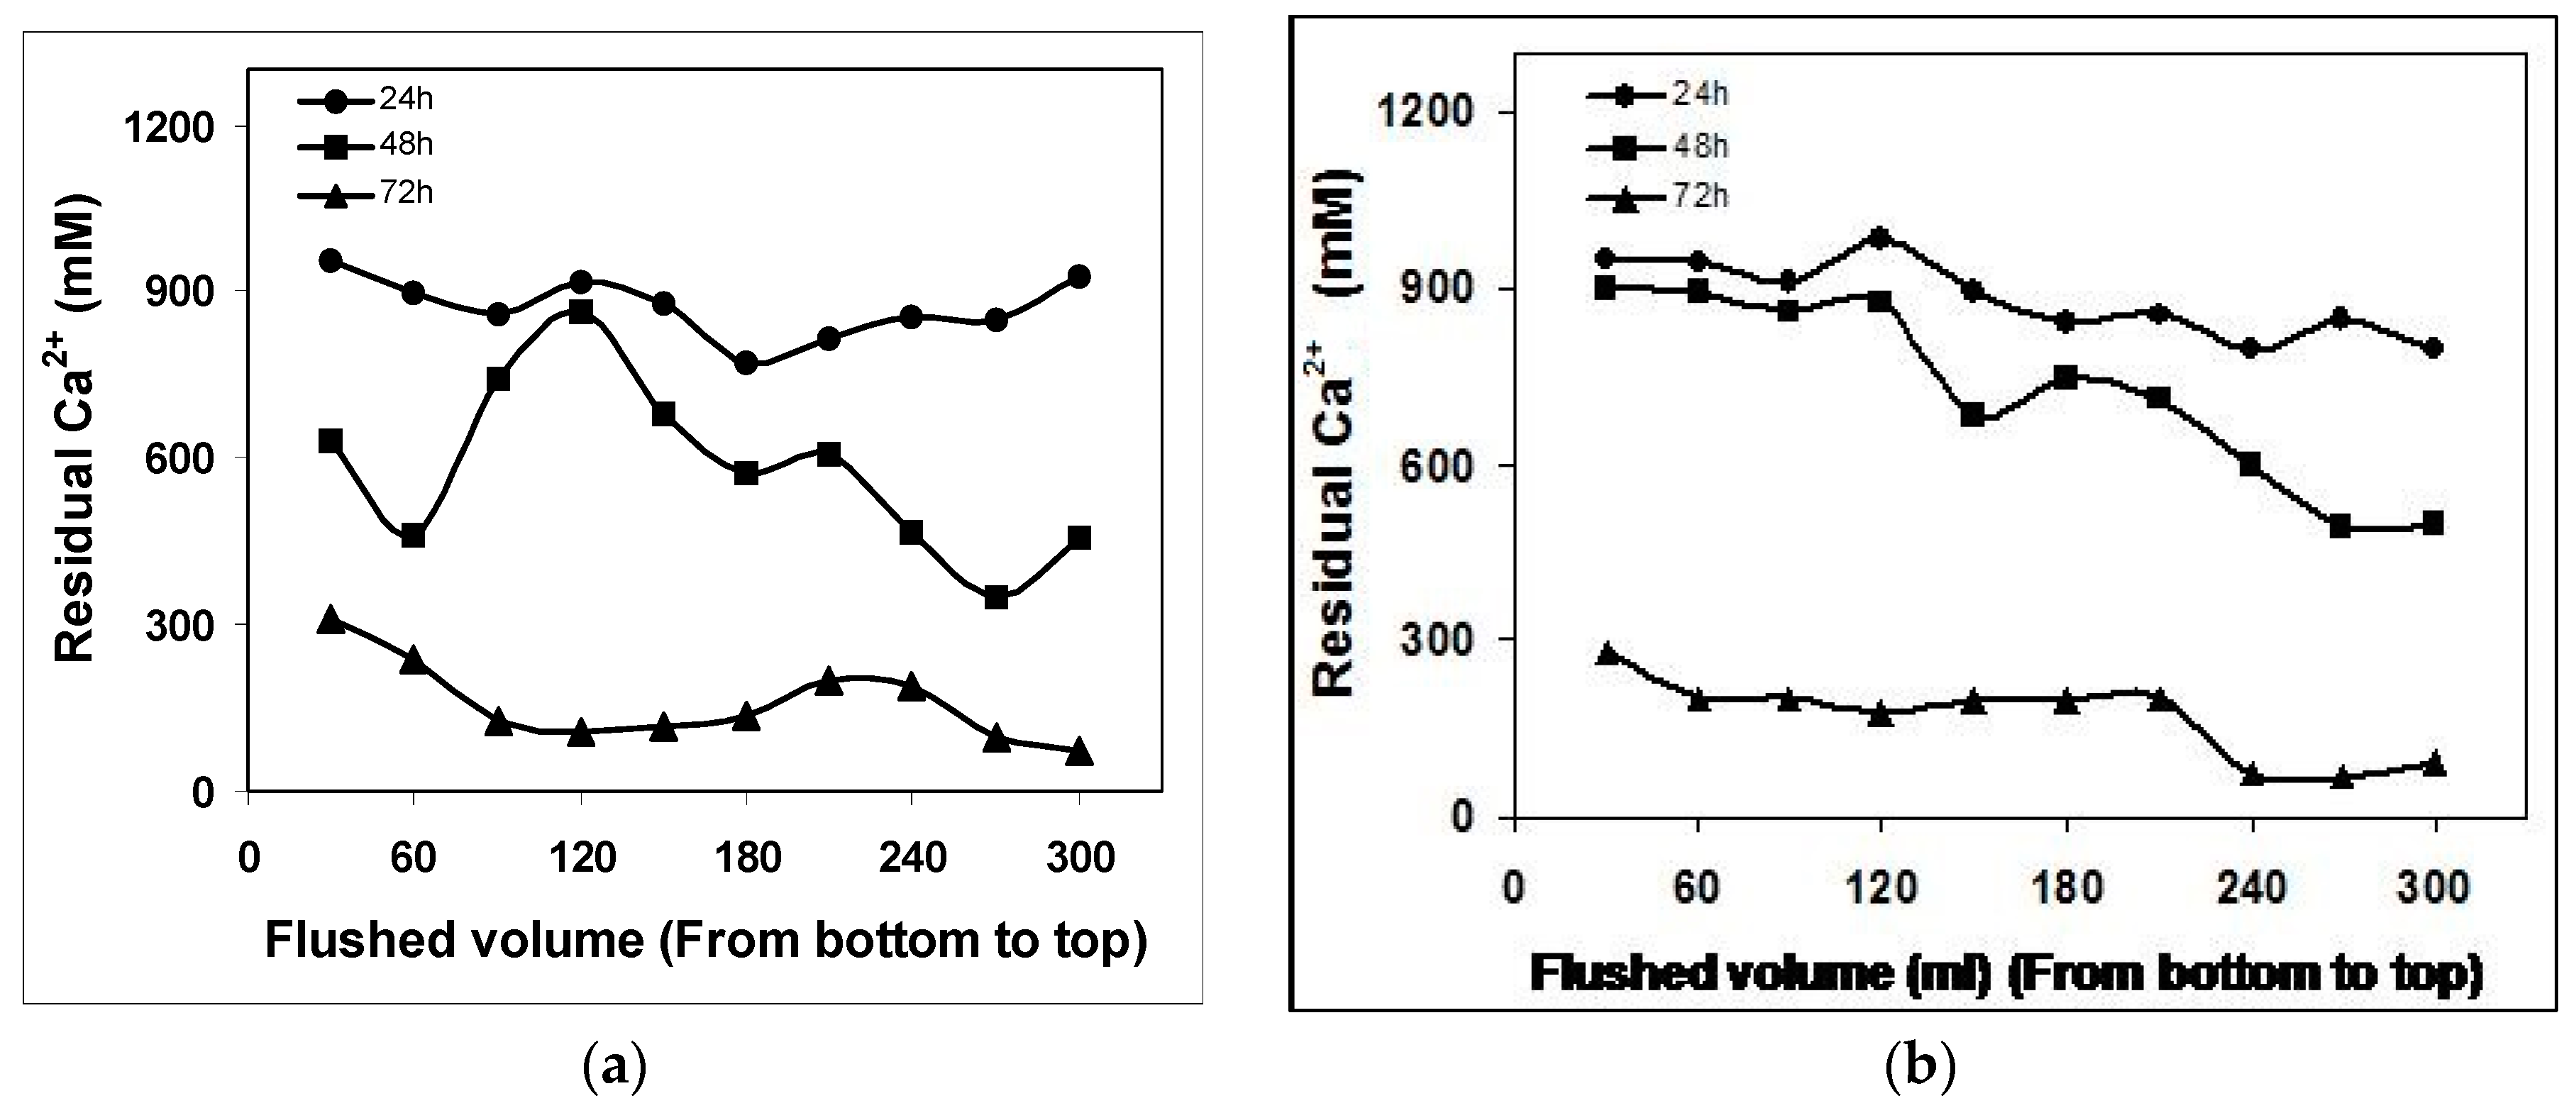
The trend seen in the calcium precipitation rates mimicked those of NH4+ production, i.e., the monoculture of S. pasteurii exhibited a faster precipitation rate than coculture over first and second batch flush. Whereas, after a period of 72 h, soluble calcium was detected in the column 1 and column 2 were almost the same which shows that monoculture S. pasteurii and coculture S. pasteurii-B. subtilis have almost the same ureolytic activity to precipitate CaCO3. The dissolved calcium concentrations over time for monoculture and biculture experiments are shown in Figure 3a,b. Whereas, residual calcium concentrations in the control experiments were higher and remain unreacted corresponding to that of other two systems. This decrease in calcium ion concentration for both the monoculture and biculture experiments could be due to passive precipitation of calcite, with S. pasteurii cells acting as nucleation points, or due to sorption of calcium to the cells. Simultaneously, it can be seen from the data that the rate of calcite precipitation was directly proportional to the rate of urea hydrolysis or NH4+ production. This results contrasts with that of Stocks-Fischer et al. [17] who stated that calcite precipitation was directly linked to cell growth and indirectly linked to ammonia production. We assume that the results obtained in their study relates to pH where Stocks-Fischer et al. started their experiments at a pH of 8 which is related to the supersaturation degree of the solution for calcite; whereas in the present study, experiments were initiated at a pH of 7.

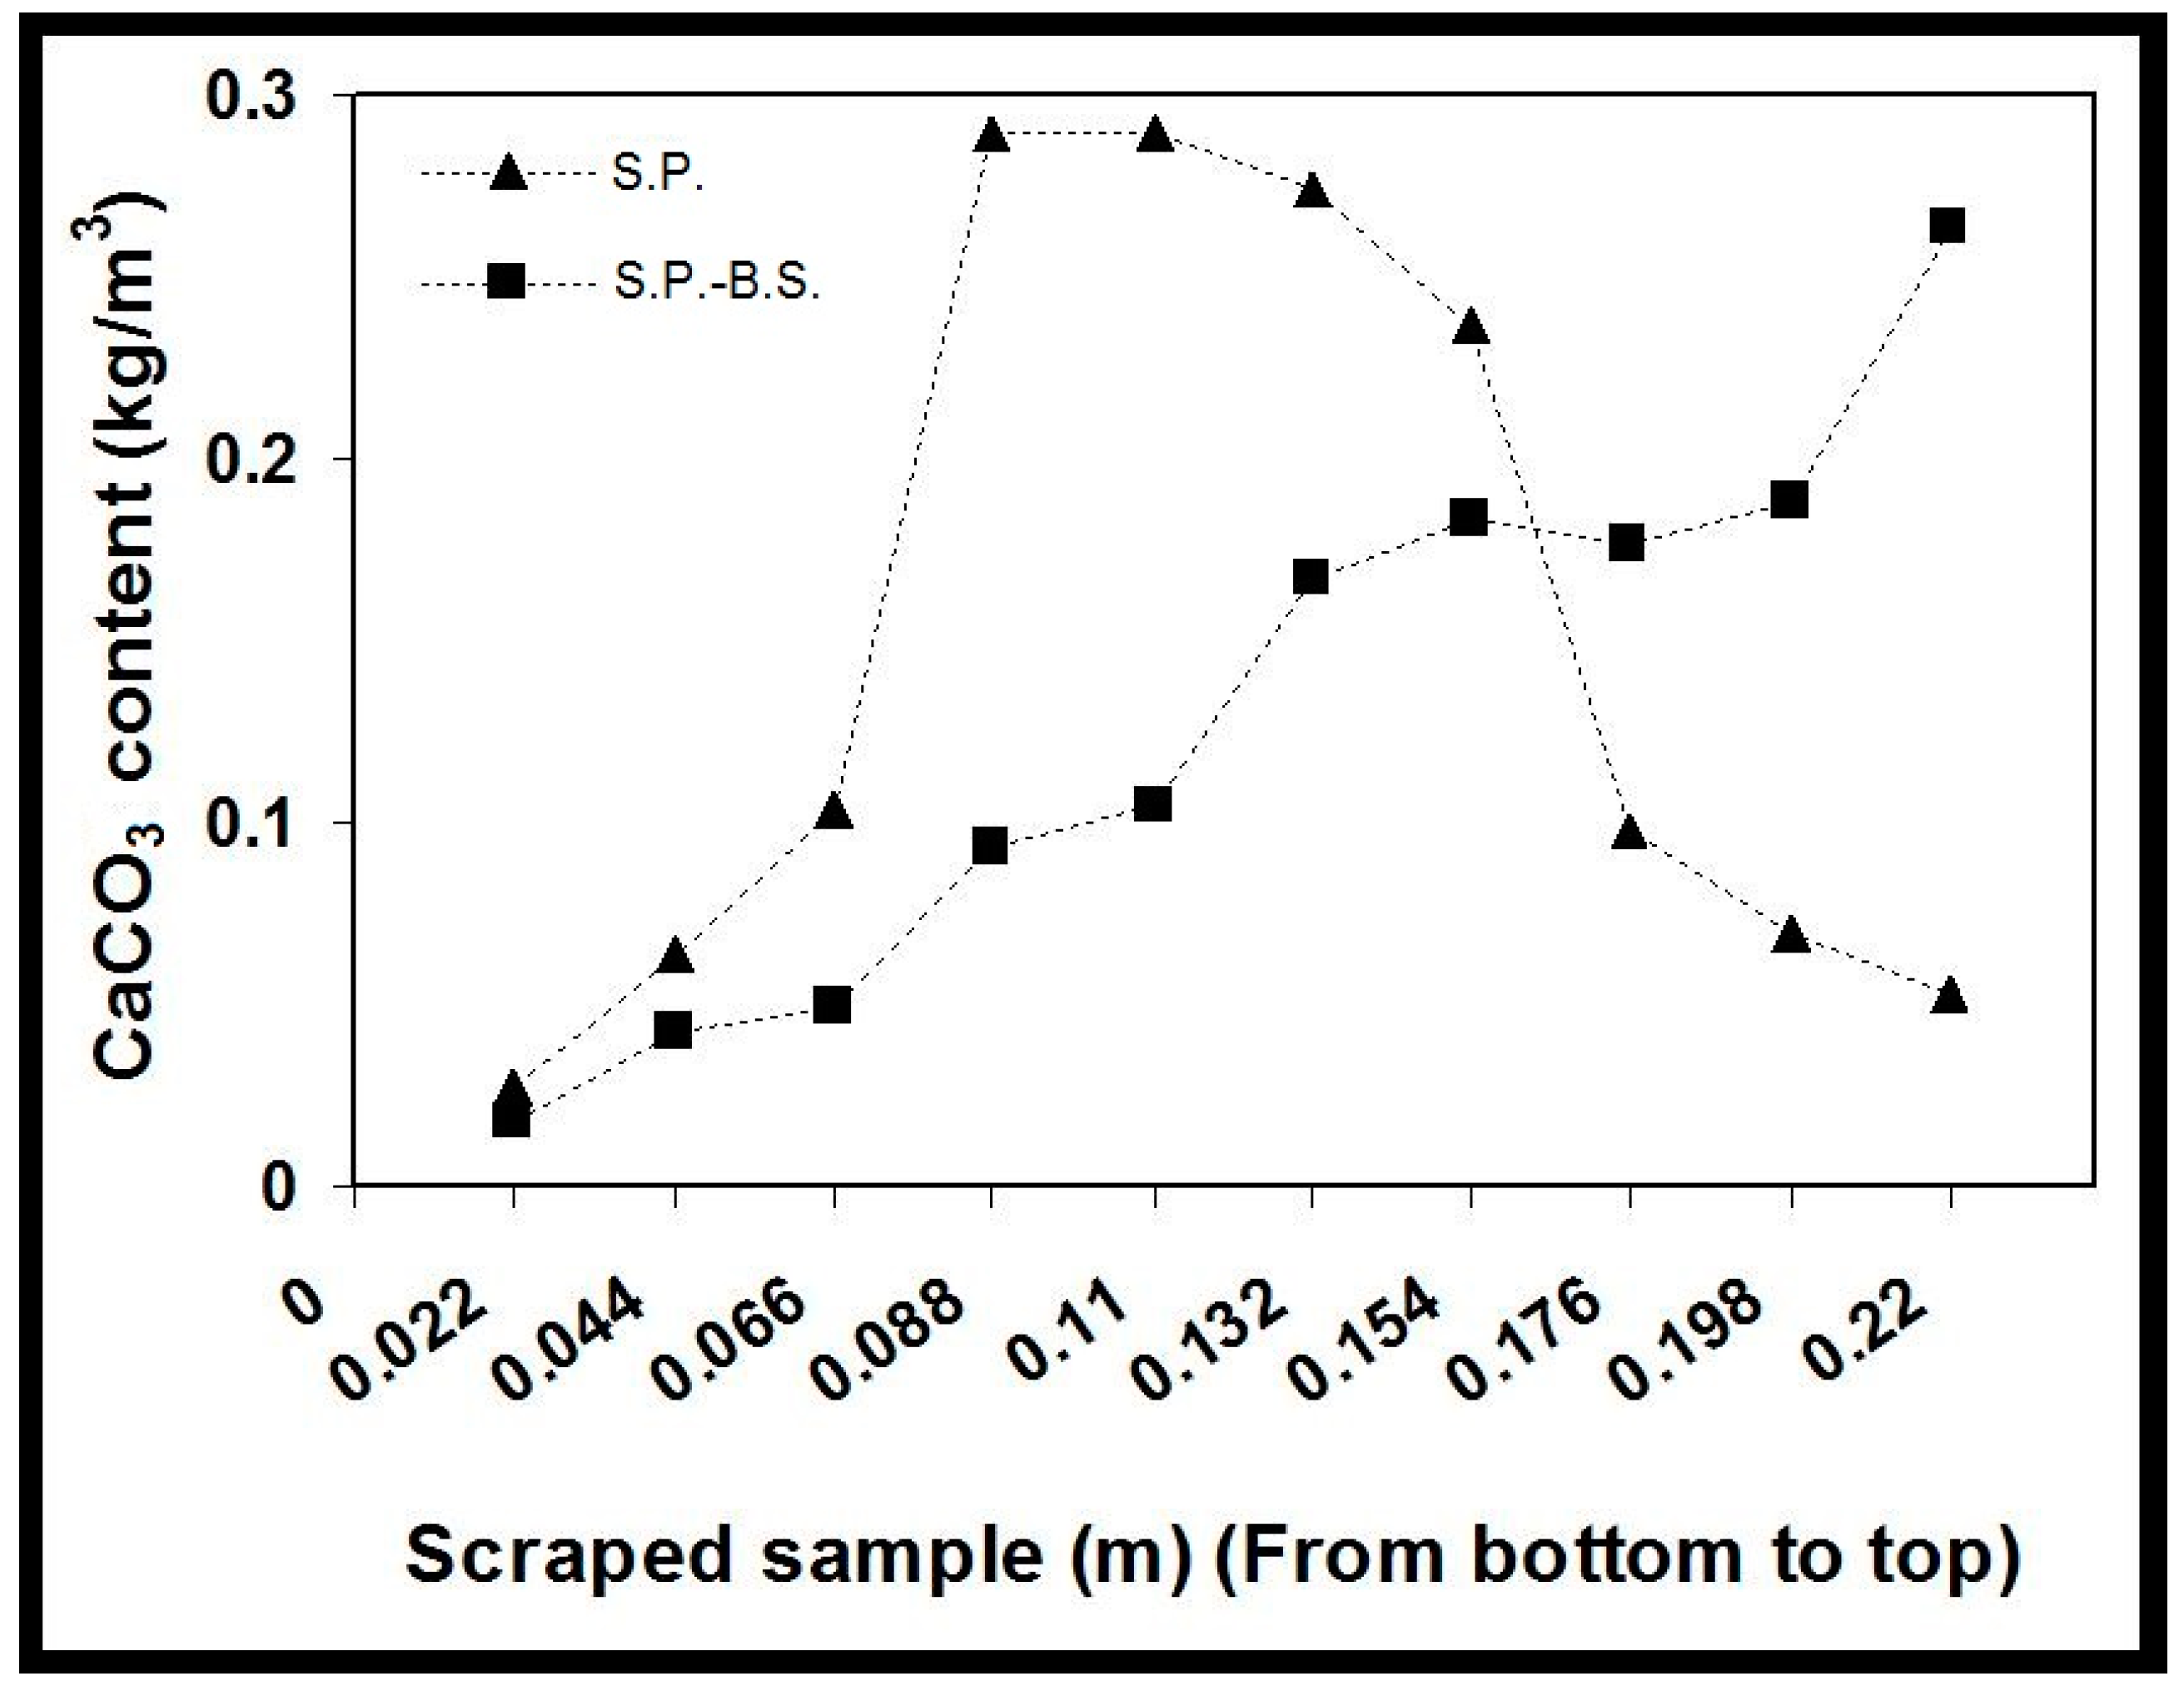
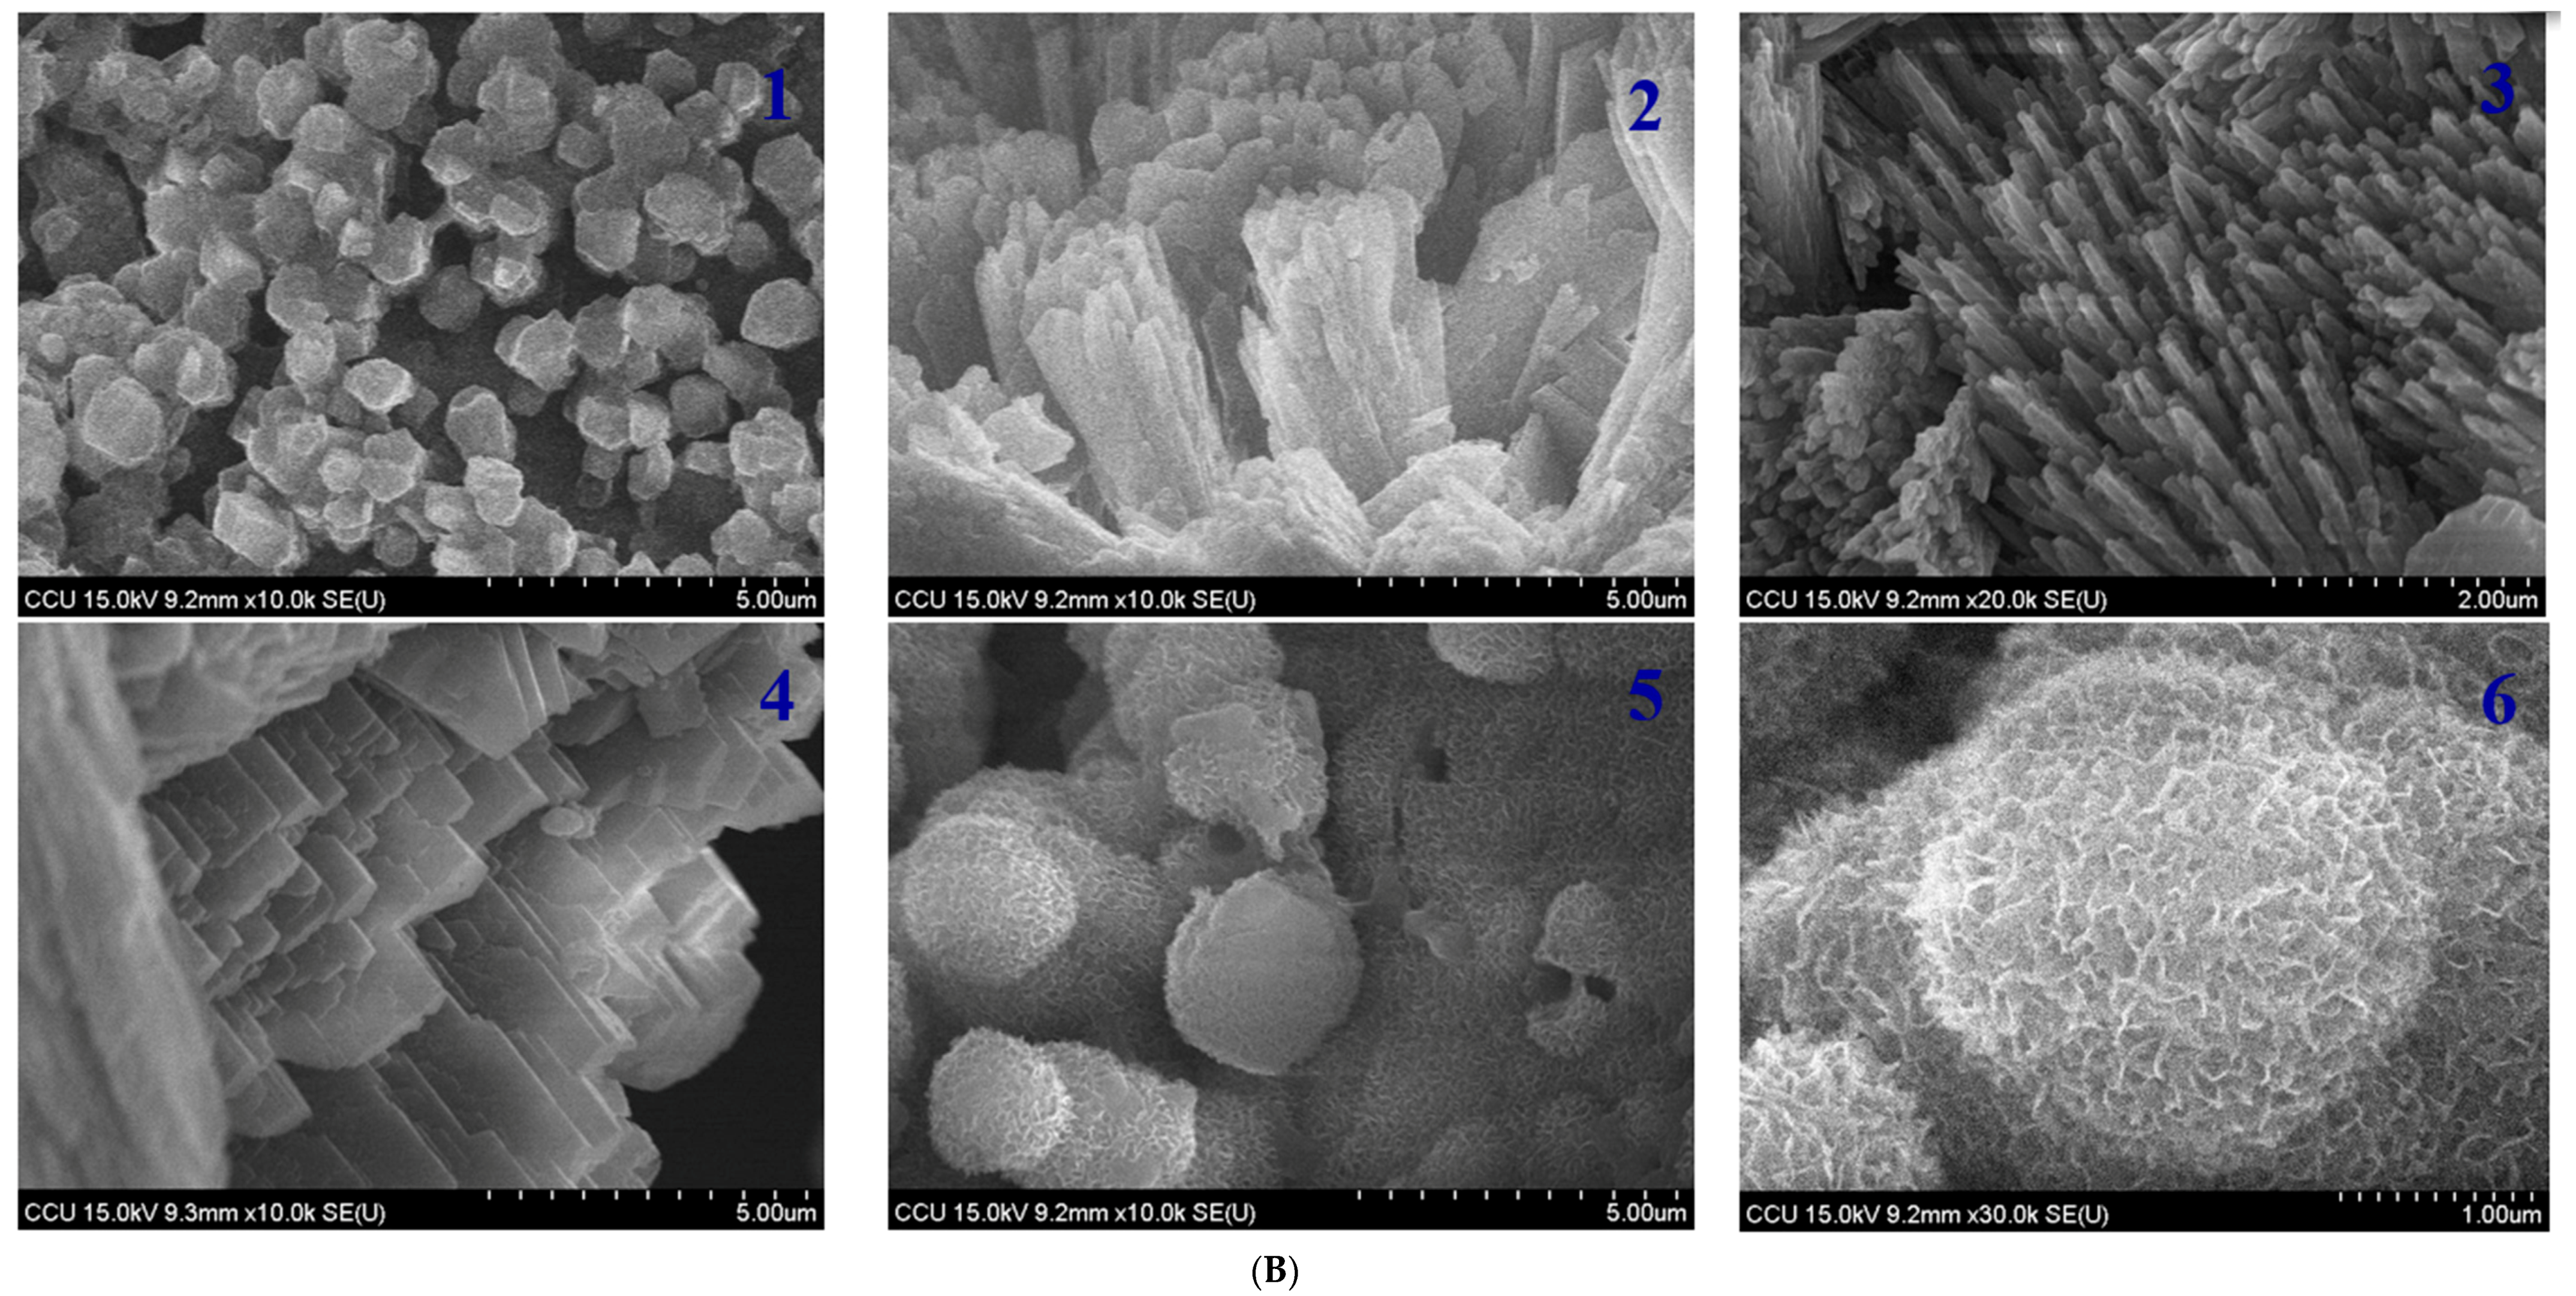
2.3. CaCO3 Profile along the Column

After completion of the experiment, all the three columns were flushed for 24 h with tap water and allowed to dry. Samples along the column length were scraped for evaluation of the CaCO3 content. An average CaCO3 content was determined from at least three samples from each column section and results were correlated with the NH4+ production of each of the tested samples. For both the columns with monoculture of S. pasteurii and coculture S. pasteurii-B. subtilis were almost shown to exhibit the same CaCO3 precipitation at the bottom of the column as shown in Figure 4. Whereas the highest strength of CaCO3 formation measured were significantly highest in the middle of the column for monoculture and for biculture highest strength was obtained at the top of the column where maximum CaCO3 precipitation occurred. Hence, by correlating both of these columns for CaCO3 and NH4+ concentration, it can be seen that the highest CaCO3 precipitation was measured approximately at the same location where maximum NH4+ production was observed with a CaCO3 content of 1.5 kg/m3 and 1.29 kg/m3 for monoculture column 1 and coculture column 2, respectively.

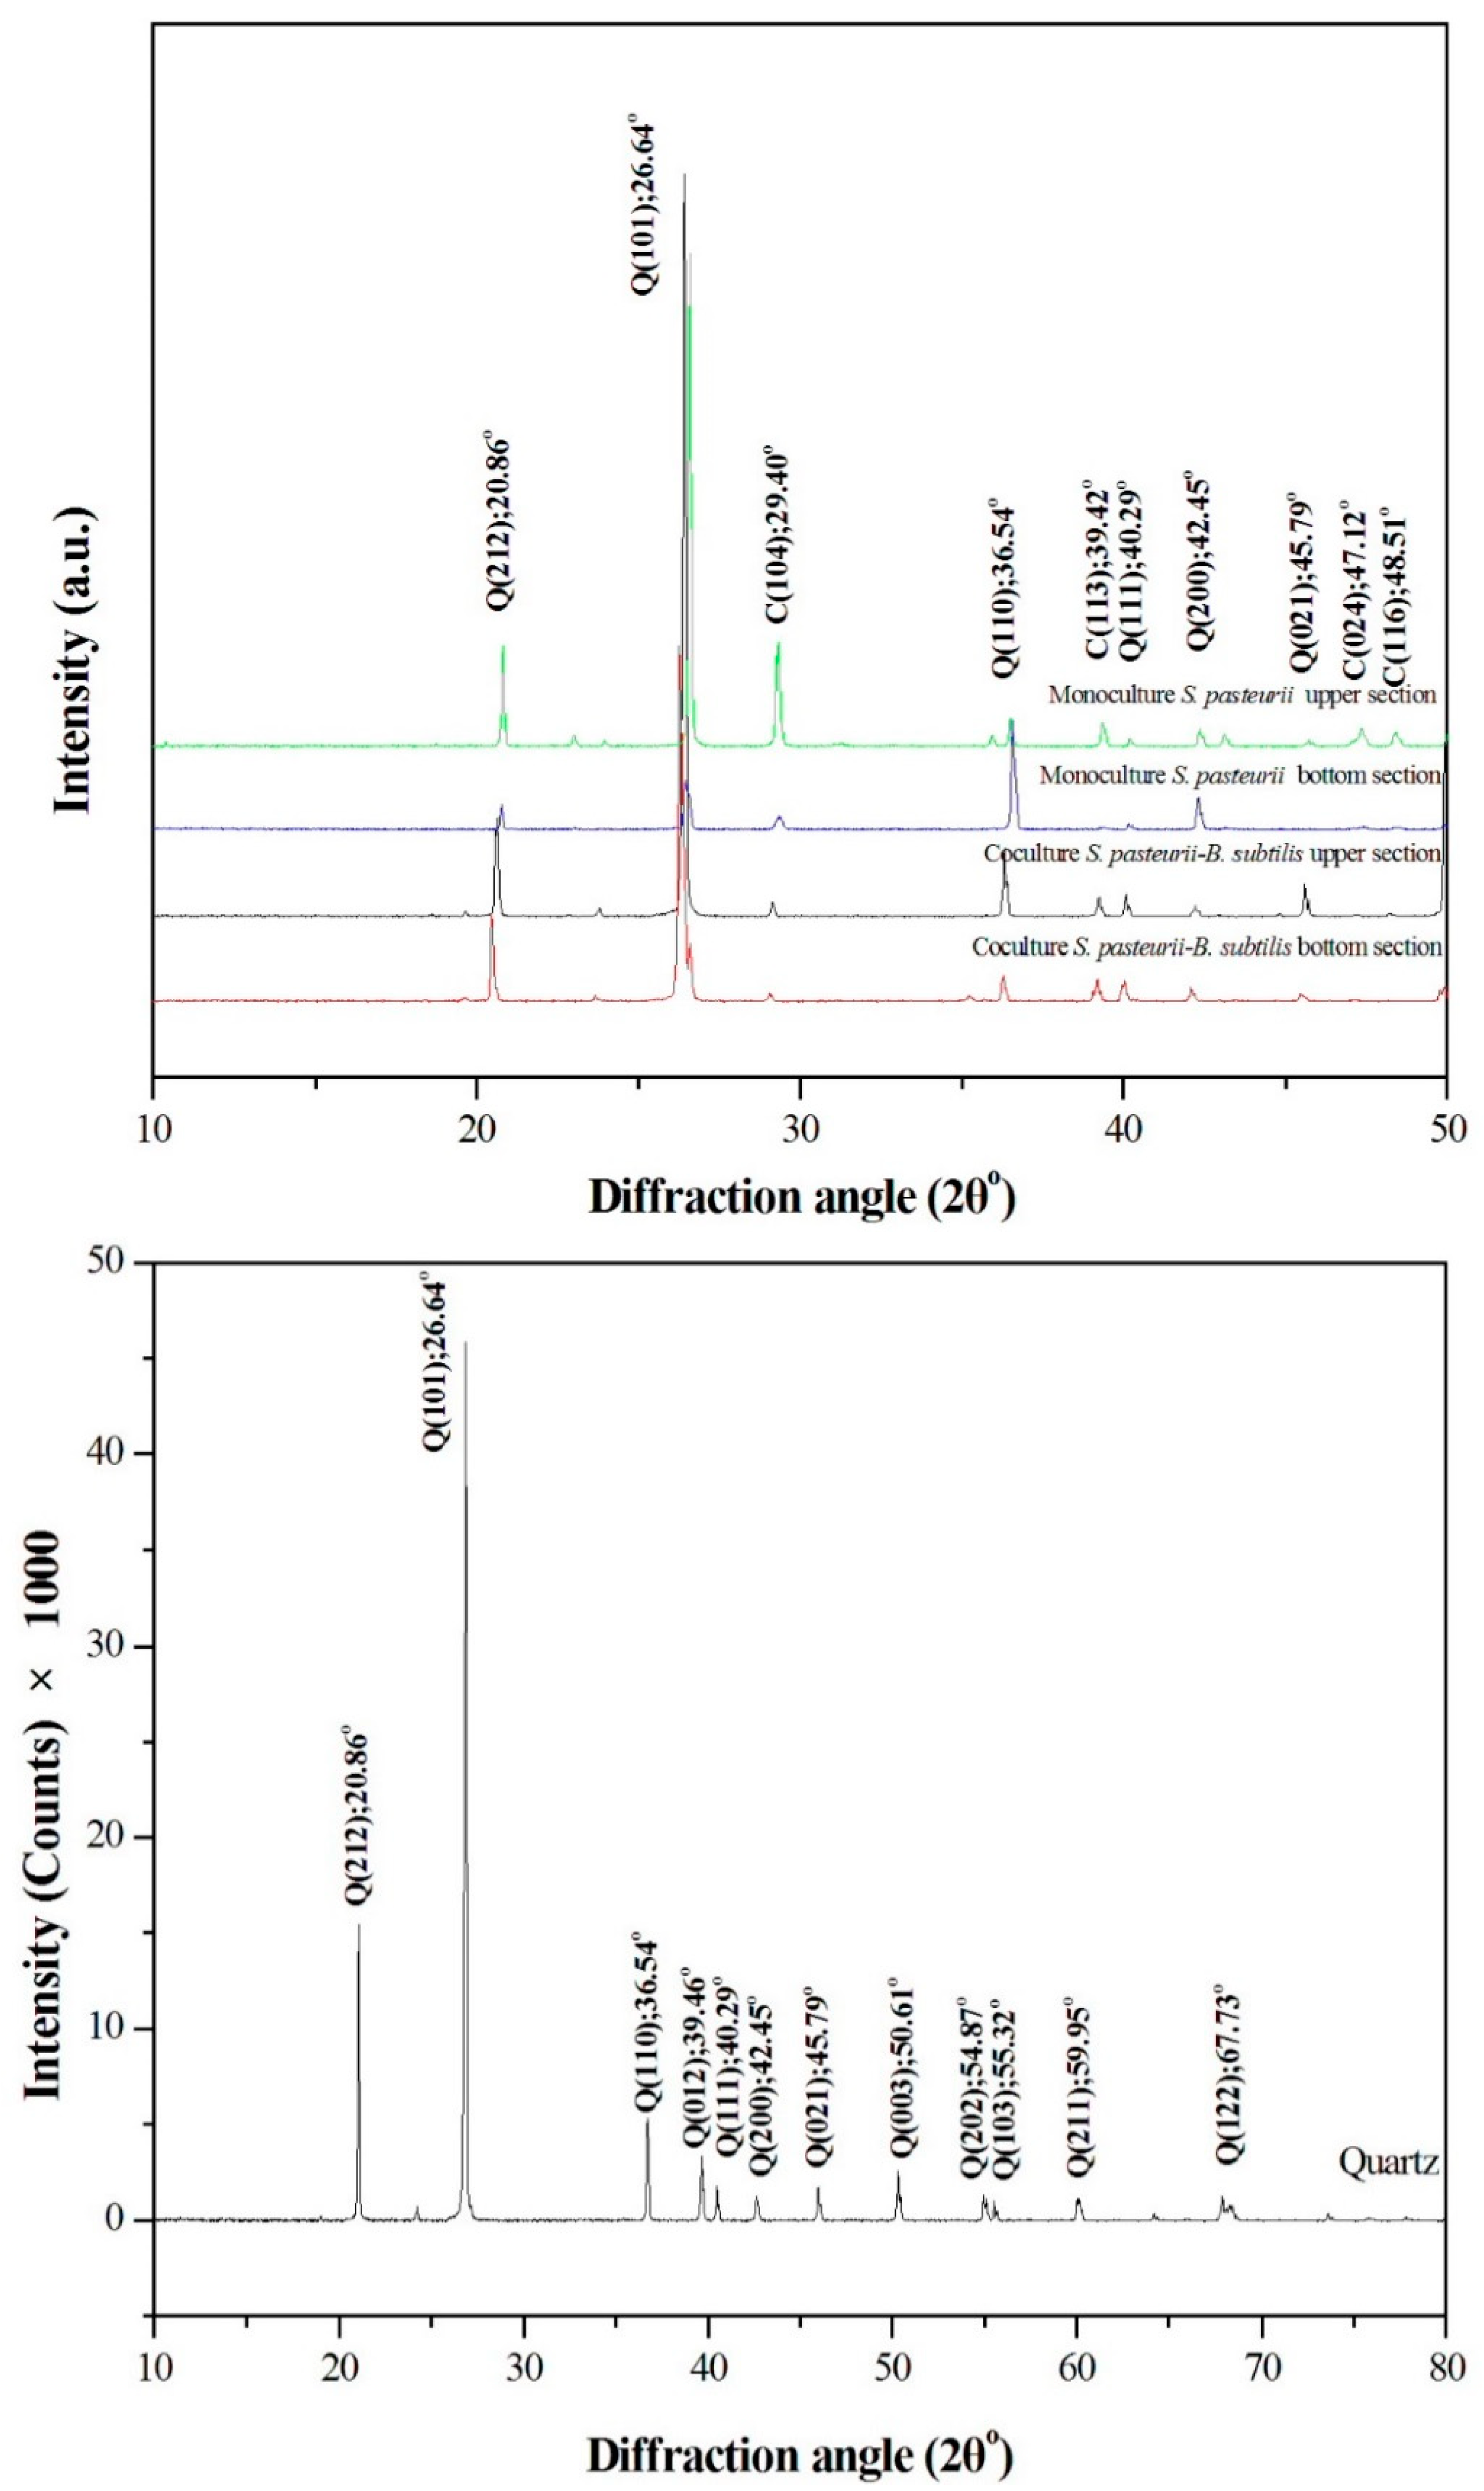
2.4. Comparison of XRD Patterns among Monoculture and Biculture Experiments

Figure 5 indicates the results of XRD analyses of CaCO3 precipitation in the sand columns. Sands were carefully removed from CaCO3 precipitates with tweezers before XRD measurements. However, the peaks with strong intensity of 26.62° at the 2θ value that attributed to the Miller indices of (101) of quartz for all the samples were obtained. This is because the Ottawa sand with the size distribution of from 0.1 mm to 1 mm were used. The 2θ values at 20.85°, 26.62° and 40.28° were attributed to the tiny sand quartz particles that remained in CaCO3 precipitates. The XRD peaks located at 2θ values of 29.39°, 36.0°, 39.41°, and 43.10°, which could be assigned to be due to those of calcite, were precipitated by monoculture and coculture bacteria in glass columns. This is coincides with the main characteristic peaks for quartz, and vaterite 26.63 and 26.99, respectively. Those peaks at 2θ of 24.92°, 26.99° and 32.78° might correspond to the vaterite. Aragonite was not detected with XRD and Raman analyses (Supplementary Figures S1 and S2). The Raman active bands at 714 cm−1 confirmed the main product of calcite from the MICP process (Supplementary Figure S1). Vaterite is a metastable polymorph of calcium carbonate and is rare in natural environments. It is unstable and rapidly transforms into calcite at room temperature in an aqueous solution [18]. Whereas, bacteria and its secretion (mainly organic matrix) may facilitate calcium carbonate precipitation. The results showed that both the monoculture S. pasteurii and coculture S. pasteurii-B. subtilis could induce not only stable calcite crystals but also unstable vaterite crystals. The vaterite crystals have been lasting for more than two years without phase transformation.

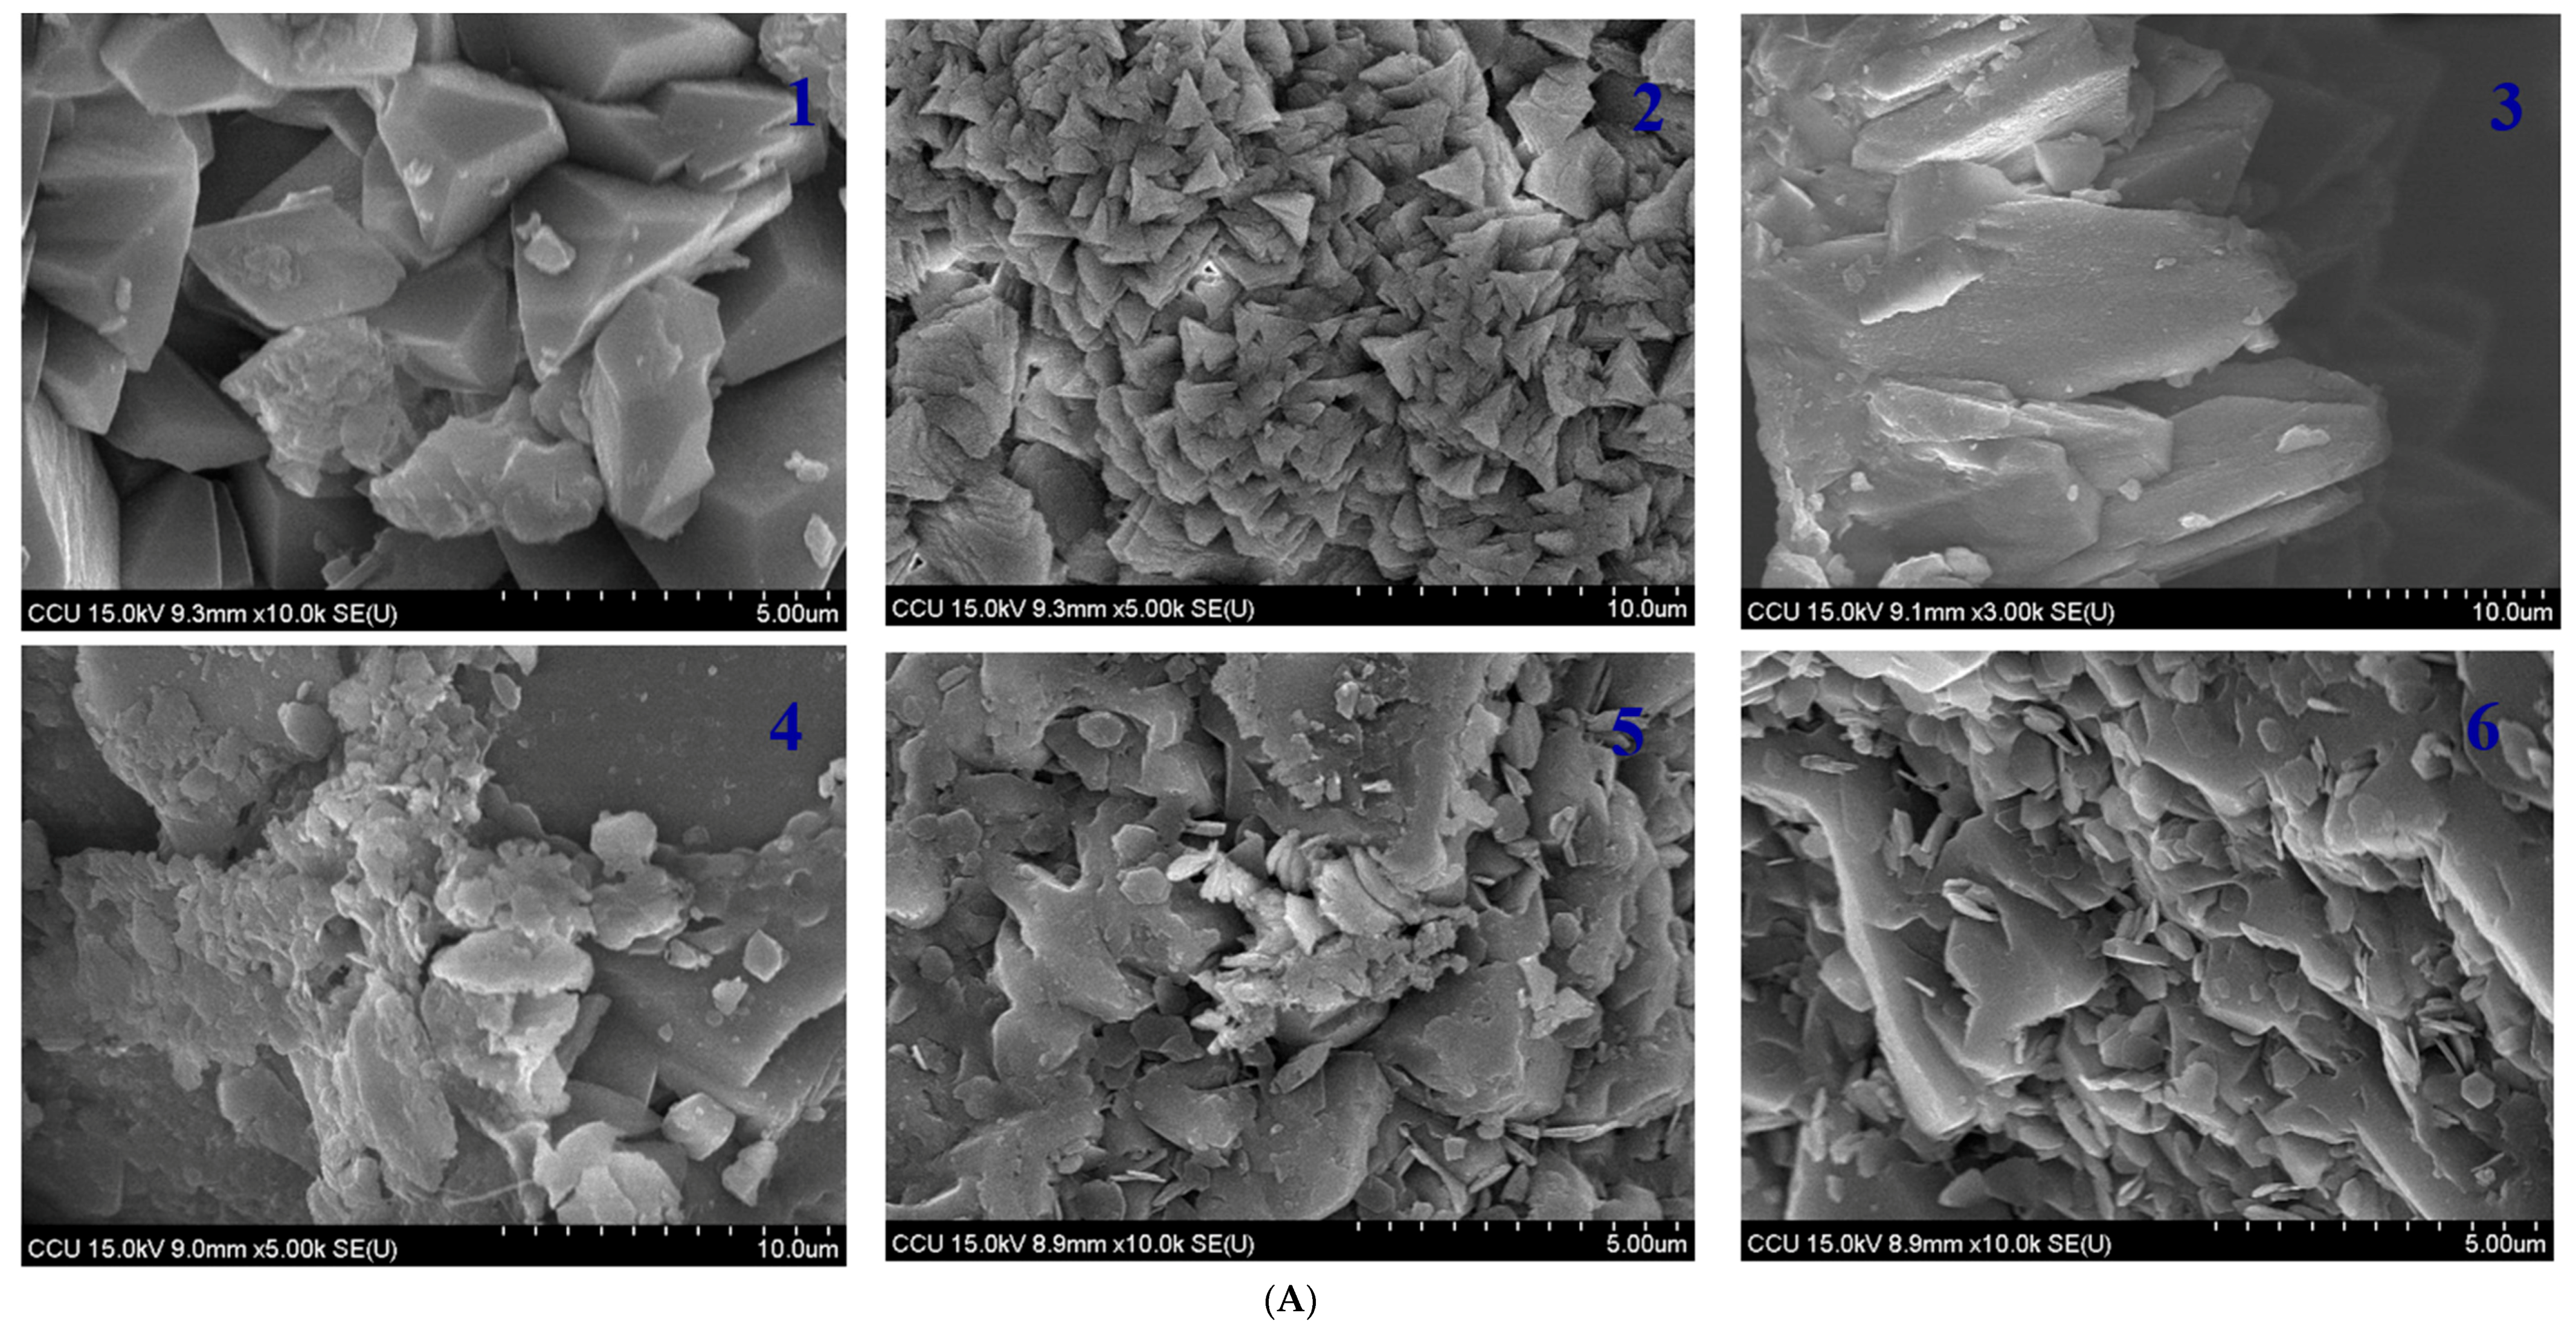
2.5. Comparison of CaCO3 Crystal Morphology Induced by Biological Factors

The CaCO3 crystal morphologies induced by monoculture and biculture experiments are shown in Figure 6. There were obvious differences in the size and morphology of CaCO3 crystals induced in both the experiments as seen in SEM. The column with monoculture S. pasteurii exhibited that large amount of CaCO3 particles formed on the top of the column with trigonal prism CaCO3 (about 3 μm) and rod-shaped calcite (25 μm) in Figure 6A, which were accumulated on the sand surface. Furthermore, it was observed that CaCO3 particles were accumulated by compact calcite with irregular flakes of CaCO3 crystals at the bottom of the column (Figure 6A). Those CaCO3 crystals were confirmed by the XRD spectrum in Figure 5. This SEM result evidenced that the action of S. pasteurii on specific CaCO3 morphology increased with the increasing depth of the column. However, specific morphology of crystals disappeared at the bottom of the column and irregular compact plate like flakes of CaCO3 appeared probably because the control action of S. pasteurii weakened with the gradual bigger and denser crystal size at the top (Figure 6B). Despite the same reaction conditions, coculture bacterial sand columns induced the CaCO3 crystals formation, which were of regular shape; the granular calcite as well as rod-shaped calcite on the top of the column whereas at the bottom of the column compact and lamellar shaped crystals and spherulitic vaterite. crystals were induced (Figure 6B). The length/thickness ratio of the rod-shaped crystals in biculture is completely different from monoculture. The main characteristic peaks of calcite can be found from the XRD peaks located at 2θ values of 29.40 in Figure 5. Vaterite was confirmed from the peaks at 2θ of 24.92°, 26.99° and 32.78° (Figure 5). The appearance of vaterite is probably related to the local higher supersaturation of a metastable phase.
The observed carbonate formation under the influence of two bacteria indicates that both the microbes directly participate in crystallization process. In addition, SEM investigation also shows that CaCO3 crystals precipitate in this experimental condition and are approximately of same size of 2–30 μm diameter. However, compared with monoculture, biculture experiments exhibited the three different crystal morphologies, i.e., lamellar, spherulitic and rod. It has been demonstrated that specific biofilm-forming bacteria which could produce exopolysaccharides (EPS) and amino acids play an essential role in the morphology and mineralogy of bacterially induced carbonate precipitation. In a review article, Marvasi et al. [19] described the production of sorptive EPS, poly-γ-glutamate that is anionic, nontoxic and biodegradable viscous polymer produced mainly by wild type B. subtilis. In addition, the glutamic acid solution was also shown to induce trigonal prism crystal morphology of CaCO3 precipitate studied by Li et al. [1]. We hypothesize that this is why this crystal morphology was selected in the biculture microbial environment, where the EPS might have been produced by B. subtilis which acts as glue to specifically binds Ca2+ ions. However, due to its viscous nature, EPS binds more Ca2+ ions on the top of the column and it flows slowly down towards the bottom of the column where the CaCO3 precipitation was less. Research conducted by Buczynski and Chafetz [20] showed that EPS plays an important role in the formation of carbonate crystals by providing nucleation sites and by attaching small crystals to each other to increase the size of the bioliths. In accordance with Le Me’tayer-Levrel et al. [21], B. subtilis can be applied as biocalcifiers producing carbonates, whereas this activity did not allow the establishment of other bacterial species to function.
Although the present hypothesis that B. subtilis EPS/EPS like chemical might release into the environment and influence the CaCO3 formation is from the laboratory experiment, there are wide implications for natural carbonate precipitation, since bacteria are ubiquitous in nature. Thus, this needs to be examined in detail to study the role of S. pasteurii and B. subtilis monoculture and coculture environment for CaCO3 precipitation and its morphology. Further studies are needed to determine whether the mineralogical biosignatures found in nutrient-rich media can also be found in the subsurface environments.

2.6. Engineering Assessment of the Effect of Consolidation

In addition, to verify the effectiveness in consolidation of sand with the two ureolytic stains, S. pasteurii and B. subtilis, an engineering experiment of mixing standard sand, Portland cement, and bacterial solution into porous cement binder, casting 5 cm cube mortar specimen for testing of compressive strength was carried out.
Figure 7 shows the results of the mortar’s compressive strength with different bacterial solutions. The average compressive strength of control specimen without bacteria is 18.2 MPa at 14 days. The mortars incorporated monoculture S. pasteurii (SP group) and coculture S. pasteurii-B subtilis (SP + BS group) and present the compressive strength of 27.7 MPa and 26.9 MPa, respectively. This indicates that both the monoculture S. pasteurii and coculture S. pasteurii-B subtilis can greatly enhance the strength of the mortars. It is significant for geotechnical engineering to improve the mechanical property of soil by the invented consolidation method.

3. Materials and Methods

3.1. Microorganism

The experiments were designed with two aerobically grown bacteria; S. pasteurii (DSMZ33) and B. subtilis (BBK006). S. pasteurii was cultivated under aerobic batch conditions in a medium containing 20 g L−1 yeast extract and 10 g L−1 NH4Cl, at a pH of 7. The organism was grown to early stationary phase before harvest. B. subtilis was also grown under aerobic batch conditions in M9 medium. The composition of M9 medium was given by Miller as 0.2% glucose in mineral salts (1 g L−1 NH4Cl, 3 g L−1 KH2PO4, 6 g L−1 Na2HPO4, 5 g L−1 NaCl, 1 mmol L−1 MgSO4, and 0.1 mmol L−1 CaCl2). Before sterilization, the medium pH was adjusted to 7.0 with 0.5 mol L−1 NaOH. The medium was sterilized at 121 °C for 20 min (without glucose for M9 medium, which was filter sterilized (Millipore membrane PVDF, 0.22 μm filter unit; Millipore, Watford, UK) and added afterwards) [22]. Control consisted of uninoculated culture medium along with experimental samples.

3.2. Column Parameters and Sampling

Three cylindrical glass columns (height—0.22 m; internal diameter—0.07 m) were used for this study. The schematic illustration of the setup and sampling positions along the columns were indicated at which the samples were analysed by SEM and XRD as shown in Figure 8. The column was positioned vertically with downward flow direction to avoid any settling of the packing material and generation of preferential flow paths that may occur if the column was positioned horizontally. Each end of the column was fitted with filter material consisting of 1 layers of scouring pad (Scotch Brite) at the outside and approximately 2 cm of filter gravel on the inside, next to the sand. Ottawa sand with the size distribution from 0.1 mm to 1 mm were used. Packing of the sand column was conducted under water to the required density to avoid the inclusion of air pockets. After column packing with sand, the column capacity to hold solution approached to 310 ± 10 mL. A pump was installed at the bottom of the column to regulate the outflow rate of 0.2 L/h. All experiments were performed at ambient temperature of 25 ± 2 °C. During the course of the experiment, samples were taken from the outlet of the column. Immediately after collection, the samples were frozen at −18 °C awaiting analysis. To study, optical density (OD600), pH, urease activity and ammonium concentration samples were centrifuged and the supernatant transferred to a clean tube, which was tested for as required.

3.3. Monitoring Methods

Urease activity and NH4+ concentration measurements are based upon the work by Whiffin et al. [2].

3.4. Optical Density (OD600)

OD was determined using a spectrophotometer and recorded at 600 nm.

3.5. Urease Activity

In the absence of calcium ions, urease activity was determined by a conductivity method. This method was not suitable for determining urease activity in the presence of calcium ions (due to precipitation of calcium carbonate particles and the dampening effect of the counter ion on the solution conductivity), thus in these cases urease activity was determined from the ammonium production rate. Both methods for determining urease activity were independently calibrated and correlated with each other.

3.6. Ammonium Concentration

Ammonium concentration was determined by a modified Nessler method of Greenburg et al. [23]. The sample was diluted with deionized water to be in the range of 0–0.5 mM. The 2 mL of sample was added to a cuvette and mixed with 100 µL of Nessler reagent (Merck, Kenilworth, NJ, USA), and allowed to react for exactly 1 min. The sample was then read in a spectrophotometer at 425 nm. Absorbance readings were calibrated with several NH4Cl standards measured under the same conditions.

3.7. Calcium Concentration

Calcium concentration was determined by colorimetric method of Peaslee [24].

3.8. Calcium Carbonate Content

Calcium carbonate content was determined by Loeppert [25]. After drying, the 10 samples were scraped from the top (inlet) to bottom (outlet) of the column. At each sampling point, 3 samples were scraped and averages of them were calculated.

3.9. Flushed Volume

The overall column flow rate was calculated from the total flushed volume (liquid in container plus effluent and port samples) versus time.

3.10. Analysis of Crystal Properties

After drying, the samples were prepared for SEM, XRD and Raman to analyze the crystal properties and minerology. SEM measurements were carried out on a FE-SEM TOPCON field-emission scanning electron microscope (FE-SEM, TOPCON ABT-150S, Singapore). The acceleration voltage of 15 K was used for imaging. Powder X-ray diffraction (XRD) patterns were recorded on a Shimadzu X-ray diffractometer (LabX XRD-6000, Shimadzu, Tokyo, Japan) equipped with Ni-filtered CuKα (λ = 0.1541 nm, 4 kVA, 30 mA) radiation and a graphite crystal monochromator. Raman analysis were performed using inVia reflex Raman Microscopy (Renishaw Plc, Gloucestershire, UK) with the exciting source of He-Cd laser operating at 442 nm with a power of about 80 mW. The measurements were performed for all the three columns and samples for analysis were scraped from the top (inlet) and bottom (outlet) of the column as shown in Figure 8. The scraped samples with sands with CaCO3 precipitates were directly observed using optical microscopy (MEIJI MS-40DR SAM1-P, Saitama, Japan) as shown in Figure 8. The precipitated carbonates were carefully separated from sands with tweezers prior to the XRD and SEM measurements.

3.11. Strength Test of Sand Consolidation

The sample for the strength test of sand consolidation was prepared with mixing standard sand, Portland cement, and bacterial solution into porous mortar. The bacterial solution is SP and SB + BS solution with the OD value of 1.23 and 1.28 respectively. Table 1 gives the mix proportion of the mortars. 3cubes in size of 50 × 50 × 50 mm3 were cast for each specimen group and cured for 24 h at T = 25 °C and 95% ± 3% relative humidity, then demoulded and cured for 6 days at the same condition as initial. After 7 days, MICP treatments were carried out by the procedures as below:
Samples were immersed in urea solution of 1.1 M for 24 h.
(1)
Removing all samples and drying naturally for 24 h.
(2)
SB samples were immersed in SP bacterial solution for 24 h, the same procedure as SP + BS.
(3)
Removed all samples and dried naturally for 24 h.
(4)
All samples were immersed in the mixing solution of 1.1 M urea and 1.1 M calcium acetate for 24 h.
(5)
Removed all samples and dried naturally for 48 h. The control group samples were the same procedure as MICP treatments except the procedure of immersed bacterial solution.
The compressive strength test was performed according to ASTM C 109 on 50 mm × 50 mm × 50 mm motar cube at age of 14 days. For each specimen group the compressive strength was the average of three specimens.

4. Conclusions

Microbiological activities that occur in bioconsolidation and subsurface environments are largely unknown. This study documented the impact of carbonate precipitation, mineral/crystal alteration and environmental implication on bioconsolidation of loose sand and subsurface environments. Comparative studies were conducted on the CaCO3 precipitation induced by microbes and other biological factors. The results showed that the precipitation rate of Ca2+ in the presence of S. pasteurii was faster than that in the presence of S. pasteurii-B. subtilis, respectively, but at the end of the experiment, both studies were shown to induce the same precipitation rate. The mineralogical examination and experiments documented the importance of S. pasteurii and B. subtilis in promoting the formation of calcium carbonate minerals. Our research has extended the understanding of the composition of bacterially precipitated carbonate crystals and evaluated both monoculture and biculture bacteria as a sand bioconsolidant.

Supplementary Materials

The following are available online at https://www.mdpi.com/2073-4352/8/5/189/s1.

Author Contributions

C.-M.H., V.R.N. and C.-C.C. conceived and designed the experiments; C.-M.H., V.R.N. and Y.-H.H. performed the experiments; C.-M.H. and V.R.N., analyzed the data; W.-C.L., Y.-H.K. and C.-H.H. contributed reagents/materials/analysis tools; H.-J.C., C.-Y.C., C.-M.H. and V.R.N. wrote the paper.

Funding

This research was funded by Ministry of Science and Technology Taiwan, grant number [MOST 106-2116-M-194-014].

Acknowledgments

The authors are very grateful to the science council of Taiwan for sponsoring this research.

Conflicts of Interest

The authors declare no conflict of interest.

Abbreviations

CaCl2Calcium chloride
CaCO3Calcium carbonate
NH4+ammonium ion
NH4ClAmmonium chloride
Ca2+calcium ion
XRDX-ray diffraction

References

  1. Li, W.; Liu, L.; Chen, W.; Yua, L.; Li, W.; Yu, H. Calcium carbonate precipitation and crystal morphology induced by microbial carbonic anhydrase and other biological factors. Proc. Biochem. 2010, 45, 1017–1021. [Google Scholar] [CrossRef]
  2. Whiffin, V.S.; van Paassen, L.A.; Harkes, M.P. Microbial Carbonate Precipitation as a Soil Improvement Technique. Geomicrobiol. J. 2007, 24, 1–7. [Google Scholar] [CrossRef]
  3. Arp, G.; Hofmann, J.; Reitner, J. Microbial fabric formation in spring mounds (‘microbialites’) of alkaline salt lakes in the Badain Jaran Sand Sea. Palaios 1998, 13, 581–592. [Google Scholar] [CrossRef]
  4. Phillips, A.J.; Gerlach, R.; Lauchnor, E.; Mitchell, A.C.; Cunningham, A.B.; Spangler, L. Engineered applications of ureolytic biomineralization: A review. Biofouling 2013, 29, 715–733. [Google Scholar] [CrossRef] [PubMed]
  5. Perry, C.T. Biofilm-related calcification, sediment trapping and constructive micrite envelopes: A criterion for the recognition of ancient grass-bed environments. Sedimentology 1999, 46, 33–45. [Google Scholar] [CrossRef]
  6. Benzerara, K.; Miot, J.; Morin, G.; Ona-Nguema, G.; Skouri-Panet, F.; Ferard, C. Significance, mechanisms and environmental implications of microbial biomineralization. CR Geosci. 2011, 343, 160–167. [Google Scholar] [CrossRef]
  7. Wen, Z.F.; Zhong, J.H.; Li, Y.; Guo, Z.Q.; Gao, J.B.; Xu, X.L. Current study on genesis and formation conditions of stromatolites. Geol. J. China Univ. 2004, 10, 418–428. [Google Scholar]
  8. Braissant, O.; Decho, A.W.; Przekop, K.M.; Gallagher, K.L.; Glunk, C.; Dupraz, C.; Visscher, P.T. Characteristics and turnover of exopolymeric substances in a hypersaline microbial mat. FEMS Microbiol. Ecol. 2009, 67, 293–307. [Google Scholar] [CrossRef] [PubMed]
  9. Chen, L.; Shen, Y.H.; Xie, A.J.; Huang, B.; Jia, R.; Guo, R.Y.; Tang, W.Z. Bacteria-mediated synthesis of metal carbonate minerals with unusual morphologies and structures. Cry. Growth Des. 2009, 9, 743–754. [Google Scholar] [CrossRef]
  10. Hammes, F.; Verstraete, W. Key roles of pH and calcium metabolism in microbial carbonate precipitation. Rev. Environ. Sci. Technol. 2002, 1, 3–7. [Google Scholar] [CrossRef]
  11. Mobley, H.L.; Hausinger, R.P. Microbial ureases: Significance, regulation, and molecular characterization. Microbiol. Rev. 1989, 53, 85–108. [Google Scholar] [PubMed]
  12. Fujita, Y.; Ferris, F.G.; Lawson, R.D.; Colwell, F.S.; Smith, R.W. Calcium carbonate precipitation by ureolytic subsurface bacteria. Geomicrobiol. J. 2000, 17, 305–318. [Google Scholar] [CrossRef]
  13. Friedrich, B.; Magasanik, B. Urease of Klebsiella aerogenes: Control of its synthesis by glutamine synthetase. J. Bacteriol. 1977, 131, 446–452. [Google Scholar] [PubMed]
  14. Kaltwasser, H.; Krämer, J.; Conger, W.R. Control of urease formation in certain aerobic bacteria. Arch. Microbiol. 1972, 81, 178–196. [Google Scholar] [CrossRef]
  15. Bachmeier, K.L.; Williams, A.E.; Warmington, J.R.; Bang, S.S. Urease activity in microbiologically-induced calcite precipitation. J. Biotechnol. 2002, 93, 171–181. [Google Scholar] [CrossRef]
  16. Tiano, P.; Biagiotti, L.; Mastromei, G. Bacterial bio-mediated calcite precipitation for monumental stones conservation: Methods of evaluation. J. Microbiol. Methods 1999, 36, 139–145. [Google Scholar] [CrossRef]
  17. Stocks-Fischer, S.; Galinat, J.K.; Bang, S.S. Microbiological precipitation of CaCO3. Soil Biol. Biochem. 1999, 31, 1563–1571. [Google Scholar] [CrossRef]
  18. Spanos, N.; Koutsoukos, P.G. The transformation of vaterite to calcite: Effect of the conditions of the solutions in contact with the mineral phase. J. Crys. Growth 1998, 191, 783–790. [Google Scholar] [CrossRef]
  19. Marvasi, M.; Visscher, P.T.; Martinez, L.C. Exopolymeric substances (EPS) from Bacillus subtilis: Polymers and genes encoding their synthesis. FEMS Microbiol. Lett. 2010, 313, 1–9. [Google Scholar] [CrossRef] [PubMed]
  20. Buczynski, C.; Chafetz, H.S. Habit of bacterially induced precipitates of calcium carbonate and the influence of medium viscosity on mineralogy. J. Sed. Res. 1991, 61, 226–233. [Google Scholar] [CrossRef]
  21. Le Metayer-Levrel, G.; Castanier, S.; Orial, G.; Loubiere, J.F.; Perthuisot, J.P. Applications of bacterial carbonatogenesis to the protection and regeneration of limestones in buildings and historic patrimony. Sediment. Geol. 1999, 126, 25–34. [Google Scholar] [CrossRef]
  22. Miller, H. Experiments in Molecular Genetics; CSHL Press: Plainview, NY, USA, 1972. [Google Scholar]
  23. Greenburg, A.E.; Clesceri, L.S.; Eaton, A.D. Standard Methods for the Examination of Water and Wastewater, 18th ed.; American Public Health Association: Washington, DC, USA, 1992. [Google Scholar]
  24. Peaslee, D.E. Colorimetric determination of calcium in soil extracts. Soil Sci. 1964, 97, 248–251. [Google Scholar] [CrossRef]
  25. Loeppert, R.H. Methods of Soil Analysis—Part 3. Chemical Methods—SSSA Book Series No. 5; SSSA: Madison, WI, USA, 1996. [Google Scholar]
Figure 1. (a): Effluent measurements for two columns, i.e., monoculture S. pasteurii and coculture S. pasteurii and B. subtilis after flushing 0.05 M CaCl2; (b): Effluent measurements for two columns, i.e., monoculture S. pasteurii and coculture S. pasteurii and B. subtilis after flushing cementation solution of 1.1 M Urea and CaCl2.
Crystals 08 00189 g001
Figure 2. (a) Ammonium concentration measurements in the effluent for monoculture S. pasteurii, which was flushed out after 24 h, 48 h and 72 h respectively; (b) Ammonium concentration measurements in the effluent for coculture of S. pasteurii and B. subtilis, which was flushed out after 24 h, 48 h and 72 h, respectively.
Crystals 08 00189 g002
Figure 3. (a) Calcium concentration in the effluent for monoculture S. pasteurii, which was flushed out after 24 h, 48 h and 72 h respectively; (b) Calcium concentration in the effluent for coculture of S. pasteurii and B. subtilis, which was flushed out after 24 h, 48 h and 72 h, respectively.
Crystals 08 00189 g003
Figure 4. Calcium carbonate profiles along the column length from bottom to top.
Crystals 08 00189 g004
Figure 5. X-ray diffraction of upper and bottom sections for monoculture, coculture. The XRD of quartz only was measured for comparison.
Crystals 08 00189 g005
Figure 6. (A): SEM imagines of calcium carbonate precipitated by monoculture bacterial experiments. Top row (for upper part of column) showed the trigonal prism CaCO3 (1 and 2) and rod-shaped calcite (3). Down row (for down part of column) showed the large and compact calcite with the irregular flakes of CaCO3 (4, 5 and 6). (B): SEM imagines of calcium carbonate precipitated by coculture bacterial experiments. Top raw (for down part of column) showed the granular calcite (1) and rod-shaped calcite (2 and 3). Down raw (for upper part of column) showed compact and lamellar calcite (4), and spherulitic vaterite. (5 and 6).
Crystals 08 00189 g006aCrystals 08 00189 g006b
Figure 7. Test results of the compressive strength for the control, SP and SP + BS group specimen at 14 days.
Crystals 08 00189 g007
Figure 8. The schematic illustration of the setup and Sampling positions along the columns were indicated at which the samples were analysed by SEM and XRD. The imagines of optical microscopy showed the cemented sands with CaCO3 precipitates for the scraped samples (Magnification = 0.28 × 20 = 5.6).
Crystals 08 00189 g008
Table 1. Overview of the column injections for determining microbial carbonate precipitation under monoculture experiment and coculture experiment.
PhaseDescriptionDuration (h)Effluent Flow Rate (L/h)Details
RinseWater flush240.2Tap water
Immobilization of bacteria by two-phase injectionBacterial injection1. S. pasteurii240.2OD600: 4.1; Act: 2.13 mS/cm/min
2. S. pasteurii + B. subtilis240.2OD600: 3.2; Act: 1.67 mS/cm/min
CaCl2 injection1. S. pasteurii240.20.05 M CaCl2
2. S. pasteurii + B. subtilis240.20.05 M CaCl2
CementationReaction fluid injection24No flow for 24 h- after 24 h, with 0.2 L/h flow rate, samples were collected1.1 M Urea and CaCl2
RinseWater flush240.2Tap water
1 and 2 are the column number with specific bacteria. Optical density (OD) and the enzyme activity of the bacterial suspension were measured immediately before injection. For column 2, S. pasteurii and B. subtilis cultures were taken as 50 v/v %. Column 3 is not mentioned in the table. Column 3 is the control experiment consisted of uninoculated culture medium along with experimental samples.

