P-T Phase Diagram of LuFe2O4
by
 and
and
Maria Poienar
1, 
Julie Bourgeois
2,
Christine Martin
2,
Maryvonne Hervieu
2,
Françoise Damay
3,
Gaston Garbarino
4,
Michael Hanfland
4,
Thomas Hansen
5,
François Baudelet
6,
Jean Louis Bantignies
7,
Patrick Hermet
1,
Julien Haines
1 and
and
Jérôme Rouquette
1,* 1
Institut Charles Gerhardt UMR CNRS 5253, Université de Montpellier, Place E Bataillon, cc1504, 34095 Montpellier CEDEX, France
2
Laboratoire CRISMAT, UMR 6508 CNRS, ENSICAEN, 6 Boulevard du Maréchal Juin, 14050 Caen CEDEX, France
3
Laboratoire Léon Brillouin, CEA-CNRS UMR 12, 91191 Gif-sur-Yvette CEDEX, France
4
European Synchrotron Radiation Facility, BP 220, 38043 Grenoble CEDEX, France
5
Institut Laue-Langevin, 6 rue Jules Horowitz, Boîte Postale 156, 38042 Grenoble CEDEX 9, France
6
Synchrotron Soleil, L’Orme des Merisiers, Saint-Aubin BP 48 91192 Gif-sur-Yvette CEDEX, France
7
Laboratoire Charles Coulomb, UMR 5221 CNRS-Université de Montpellier, 34095 Montpellier, France
*
Author to whom correspondence should be addressed.
Crystals 2018, 8(5), 184; https://doi.org/10.3390/cryst8050184
Submission received: 7 March 2018
/
Revised: 17 April 2018
/
Accepted: 20 April 2018
/
Published: 24 April 2018
(This article belongs to the Special Issue Non-Ambient Crystallography)
Abstract
:The high-pressure behavior of LuFe2O4 is characterized based on synchrotron X-ray diffraction and neutron diffraction, resistivity measurements, X-ray absorption spectroscopy and infrared spectroscopy studies. The results obtained enabled us to propose a P-T phase diagram. In this study, the low pressure charge-ordering melting could be detected by synchrotron XRD in the P-T space. In addition to the ambient pressure monoclinic C2/m and rhombohedral Rm phases, the possible P triclinic phase, the monoclinic high pressure form Pm and metastable modulated monoclinic phases were observed; the latter modulated monoclinic phases were not observed in the present neutron diffraction data. Furthermore, the transition to the Pm phase which was already characterized by strong kinetics is found to be favored at high temperature (373 K). Based on X-ray absorption spectroscopy data the Pm phase, which could be recovered at atmospheric pressure, can be explained by a change in the Fe-local environment from a five-fold coordination to a distorted 5 + 1 one.
1. Introduction
Magnetoelectric multiferroics combine ferroelectric and ferromagnetic properties in a single material, providing a possible route for controlling electric polarization with a magnetic field and magnetic order with an electric field [1]. Among the multiferroics, LuFe2O4 is considered as a prototype material in which ferroelectricity is driven by the electronic process of frustrated (Fe2+/Fe3+) charge ordering (CO) which is also coupled to magnetic order and magnetic fields [2]. The existence and/or origin of ferroelectricity in LuFe2O4 are still the subject of many debates and will not be considered in this paper [3,4,5]. Note however the strong importance of the CO in the physical behavior of LuFe2O4.
The mixed valence compound LuFe2O4 has been reported in the literature to crystallize at room temperature in the (R) Rm space group [6]. The layered crystal structure (2D) is described as an alternative stacking along the c axis of triangular lattice of Lu, the Fe and O ions forming double triangular Fe2O2.5 layers separated by single LuO1.5 layers. A monoclinic distortion (M1) was evidenced for the CO state, which disappears above TCO, and the crystal structure was refined in the monoclinic C2/m space group [7]. Along with the previously reported q2 and q3 modulations vectors distinctive of the charge-ordering (CO) of the iron species, an incommensurate order was observed characterized by a third vector q1 associated with a tiny oxygen deviation from the O4 stoichiometry [7]. The oxygen storage ability of LuFe2O4+x has been demonstrated over a large x-range [0–0.5] associated with a complex oxygen intercalation/de-intercalation process with several intermediate metastable states which was found to be perfectly reversible [8]. In addition to the structural complexity of LuFe2O4, the coexistence of different magnetic ground states have been evidenced [9,10,11,12] using X-ray and neutron scattering techniques.
Pressure was shown to induce a monoclinic crystal structure (M2) [13], i.e., space group Pm, with a stacking of rectangular [Fe]∞ and buckled triangular [Lu]∞ layers in a misfits structure. This high-pressure form exhibits antiferromagnetic ordering similar to that of wustite FeO up to 380 K [14].
Dependence of LuFe2O4 on P and T is investigated based on synchrotron X-ray diffraction (XRD) and neutron diffraction (ND) studies, resistivity measurements, infrared spectroscopy and X-ray absorption spectroscopy studies.
2. Materials and Methods
2.1. Sample Preparation
LuFe2O4 was prepared by solid state reaction, starting from a 10 g mixture of 0.485 Lu2O3:0.815 Fe2O3:0.37 Fe, pressed in the shape of a rod (6 mm diameter and several centimetre length) and heated at 1180 °C for 12 h in an evacuated silica ampoule [7]. Laboratory XRD indicates that the sample presents the nominal composition and it is a single phase and well crystallized. The refined cell parameters are a = 3.44051(2) Å and c = 25.2389(2) Å in the Rm space group (hexagonal setting) [6].
The magnetic phase transition temperature (TN = 240 K) and charge-ordering transition temperature TCO = 330 K have been determined previously [7,9] and are in agreement with the literature [10].
The samples were carefully crushed, and sieved (at 60 μm and then at 20 μm) in order to have a homogeneous powder.
2.2. Synchrotron XRD
High-pressure synchrotron XRD experiments were performed at the European Synchrotron Radiation Facility (ESRF) on the ID09A beam line, with the X-ray beam collimated to about 10 μm × 10 μm. Angle-dispersive powder XRD of the sample was measured using monochromatic synchrotron radiation with a wavelength λ = 0.415811 Å and the patterns were collected with an online MAR345 image plate detector. The pressure was measured using the ruby fluorescence method [15].
In order to analyze the evolution of structure in function of T and P, three set-ups were used: first, at room temperature where the powder sample was loaded in a gas-membrane diamond anvil cell (DAC) and with helium as a pressure-transmitting medium to assure good hydrostatic conditions up to the highest investigated pressure of ~19 GPa.
A gas-membrane DAC was used also for the high temperature cell with neon as transmitting medium. The highest temperature of 473 K was reached in a resistive furnace and the pressure was up to ~13.5 GPa. For the low temperature measurements a screw-type DAC with helium as transmitting medium was placed inside a He flow cryostat (T = 50 K, P up to ~22 GPa).
The two-dimensional diffraction images were analyzed using the Fit2D software (ESRF, Grenoble, France) [16], yielding intensity vs. 2θ diffraction patterns (the peaks coming from the diamond cell were removed) and full profile matching was performed using the FullProf software (ILL, Grenoble, France) [17]. Unfortunately, statistics could not enable us to perform Rietveld refinements.
The pressure was increased/decreased in steps of approximately 1–2 GPa and the system was allowed to equilibrate for 5 to 10 min at each pressure point and the acquisition time was several seconds. For low temperature measurements, the pressure was always increased at room temperature in order to avoid stress in the sample.
2.3. Resistivity Measurements
The electrical resistivity measurements on a pressed sample with a size of 50 μm were performed in a sintered diamond Bridgman anvil apparatus using a pyrophyllite gasket and two steatite disks as the pressure medium and by using a Keithley (Solon, OH, USA) 2400 source meter and a Keithley 2182 nanovoltmeter [18,19]. The isobar data up to ~20 GPa were recorded between 150 K and 290 K.
2.4. Neutron Powder Diffraction
For the high-pressure ND experiment on the D20 diffractometer [20], at ILL Grenoble with λ = 1.36 Å, the sample was loaded in a Paris-Edinbourg press equipped with anvils of cubic boron nitride (c-BN) and a Ti-Zr gasket. The data were recorded at RT up to 12 GPa using 4:1 deutereted methanol: ethanol as pressure transmitting medium. Pressure is determined based on the equation of state obtained using Synchrotron XRD data.
2.5. Infrared Spectroscopy
Far infrared experiments under hydrostatic pressure conditions were performed in the 35−650 cm−1 range, at room temperature with a resolution of 2 cm−1. The powder sample of LuFe2O4 was placed in a 250 μm diameter hole drilled in a strainless steel gasket preindented to 50 μm, along with a small ruby as a pressure gauge. We used a diamond-anvil cell (equipped with a gas membrane for pressurization) and a Bruker (Karlsruhe, Germany) IFS66S/V infrared spectrometer. The latter is equipped for these measurements with a liquid He bolometer detector, a Ge-coated Mylar (6 μm beam splitter, a Bruker beam condenser system with two ×15 NA 0.4 cassegrain objectives, and a Mercury arc discharge source. Pressure was determined with the ruby luminescence method with a BETSA photoluminescence system (laser wavelength, λ = 532 nm) coupled to an Ocean Optics BV/HR2000+ spectrometer (bandwidth: 675−575 nm).
2.6. Ab-Initio Calculations
Zone-center phonon frequencies are calculated within the DFT+U formalism as implemented inside VASP [21,22,23] at the GGA/PBE level [24]. We used the direct method in the harmonic approximation associated to an atomic displacement of 0.03 A. Positive and negative displacements are considered to minimize the anharmonic effects. The computational details (DFT parameters, supercell, magnetism, ...) are given in [25].
2.7. X-Ray Absorption Spectroscopy
High-pressure XANES measurements at the Fe K-edge (7112 eV) at 300 K, were performed at the ODE beamline at synchrotron SOLEIL, Saint-Aubin, France. The LuFe2O4 sample, together with the pressure transmitting medium, silicone oil, were subject to high pressure up to 25 GPa using a diamond-anvil cell (DAC). Ab-initio simulations were performed using the FDMNES code [26] using the finite difference method with the full multiple scattering theory. We chose in this study this theory which works within the muffin-tin approximation on the potential shape, but is more tractable with large systems.
3. Results
3.1. Synchrotron XRD
3.1.1. 373 K
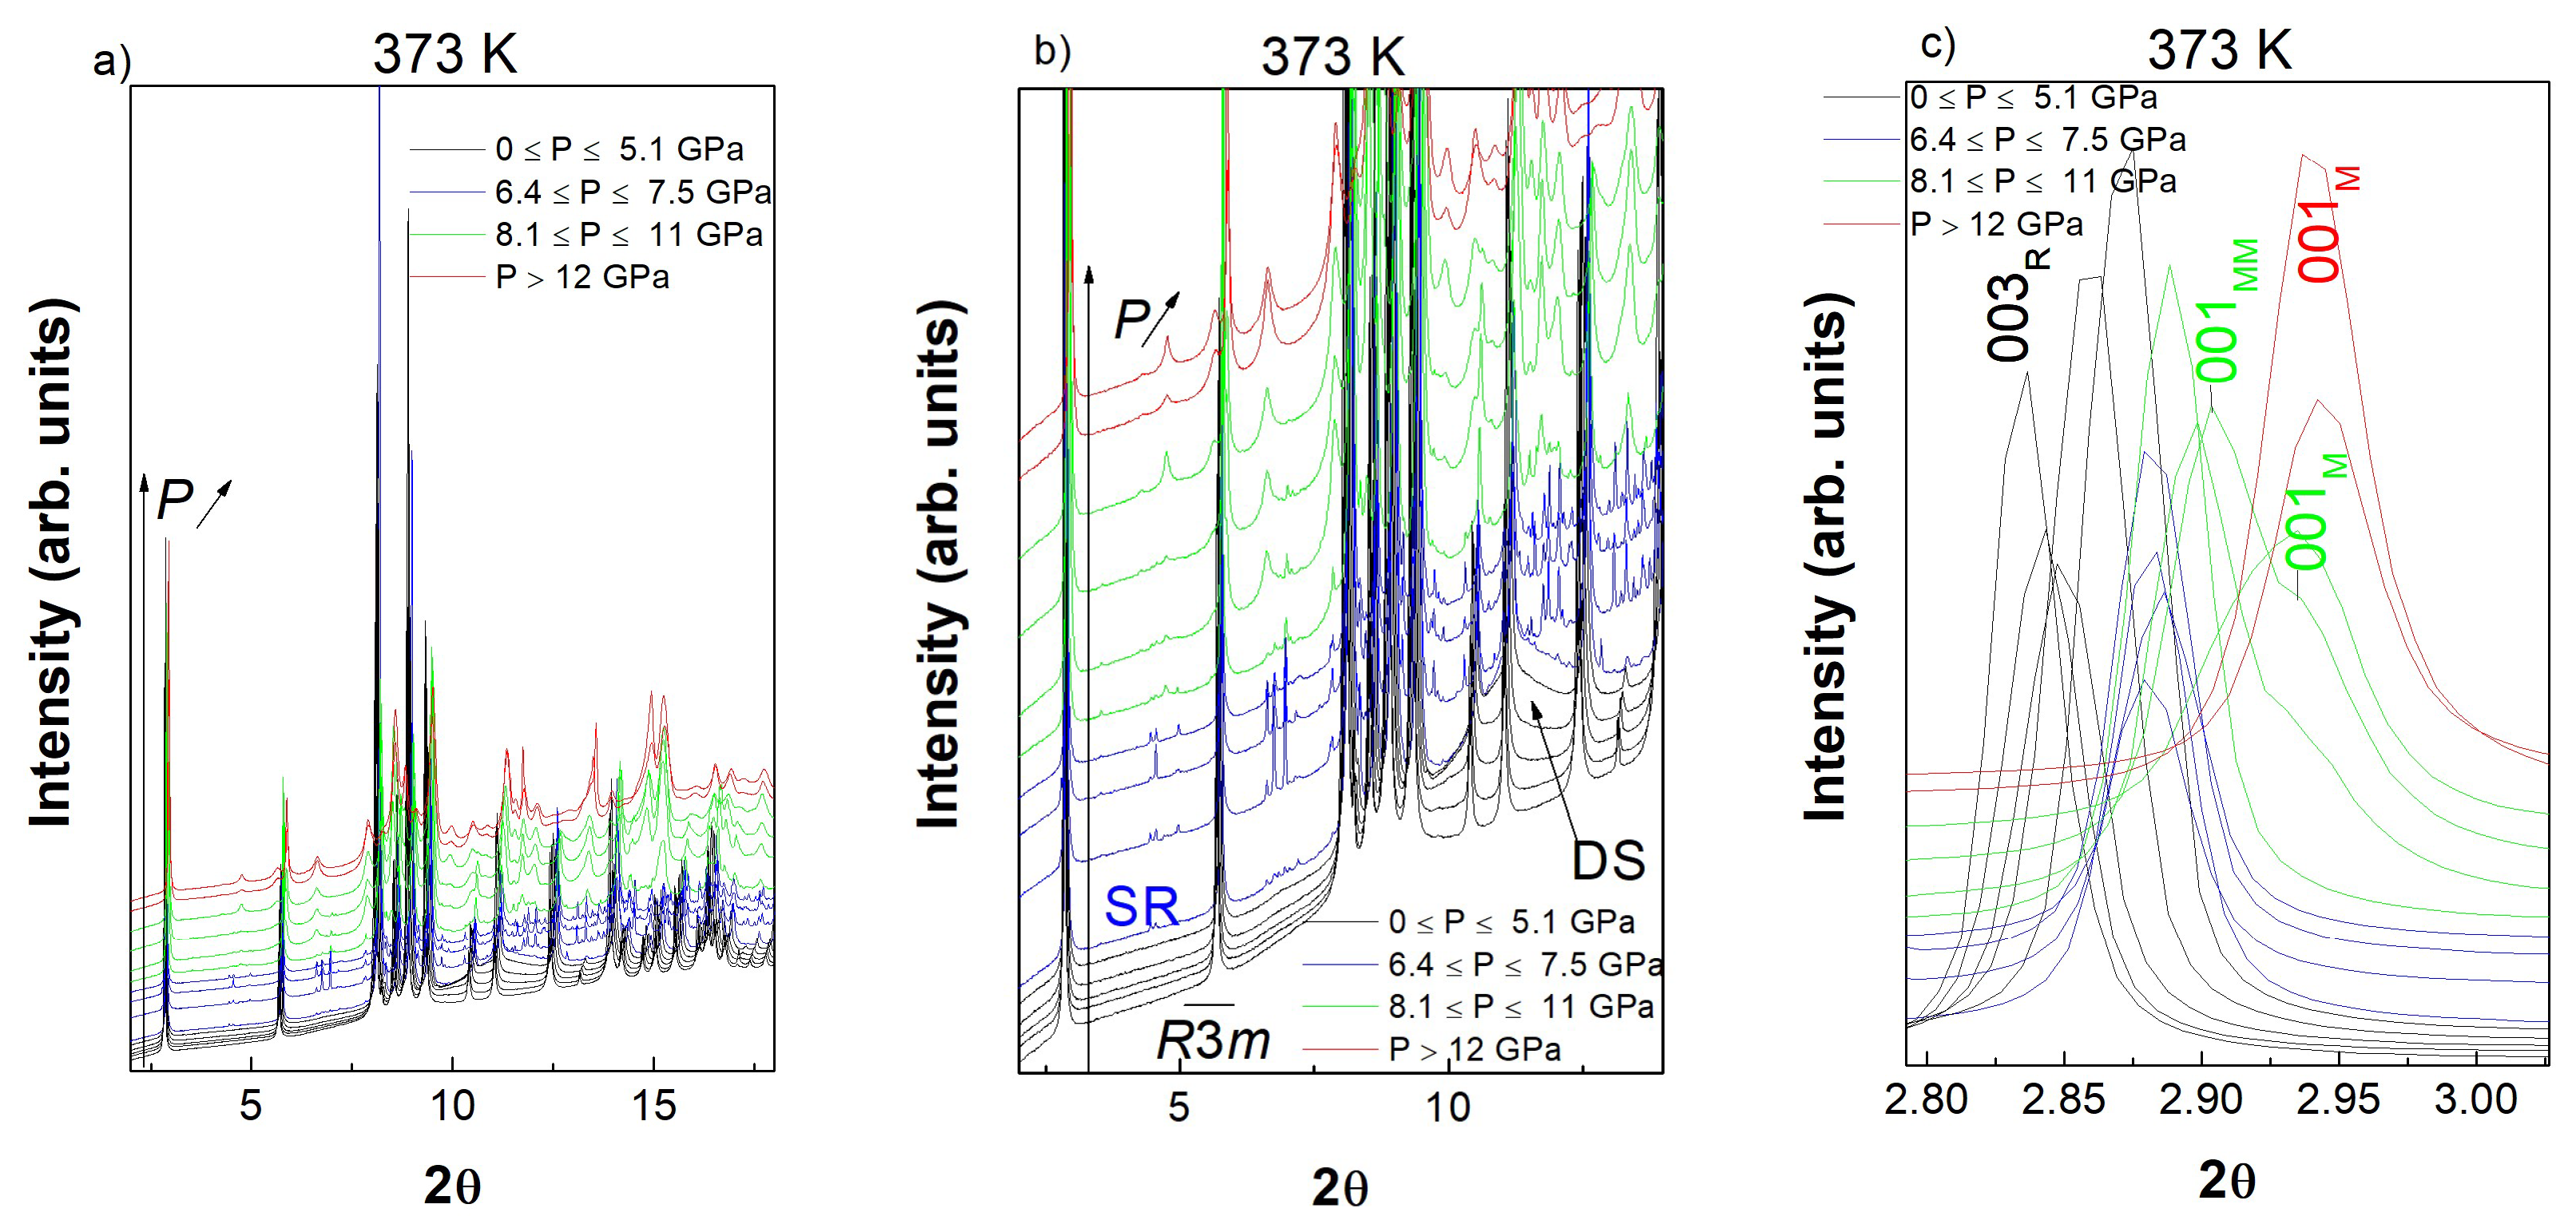
Figure 1 shows the synchrotron XRD data obtained at 373 K upon increasing pressure up to 12 GPa. The high pressure behavior of LuFe2O4 appears to be quite complex with four distinct pressure ranges. No superlattice reflection can be observed in the low angle part of the low pressure diffraction patterns, i.e., 0 GPa ≤ P ≤ 5.1 GPa in Figure 1b, in agreement with the melting of the CO above 330 K under atmospheric pressure. Additionally, no monoclinic splitting could be detected in this pressure range. As loss of the CO state was found to be accompanied by a loss of the monoclinic distortion, these low pressure data were analyzed using the Rm space group. Figure 2a shows the pressure dependence of the LuFe2O4 volume. The B0 value calculated using the Birch-Murnaghan state equation (B’0 = 4) is 140 (2) GPa which is in agreement with the value previously reported at 298 K (138 (2) GPa). Interestingly some strong diffuse scattering (DS) appears between 10° and 12° (2θ) and between 6° and 8° (2θ) for 3 GPa ≤ P ≤ 6.4 GPa, Figure 1a,b. This diffuse scattering is generally associated with some strong dynamic disorder within the structure, which disappears with additional increases in pressure, above 6.4 GPa, to be replaced by many superlattice reflections (SR), Figure 1a,b, and the onset of a monoclinic distortion, Figure 2b.
For these reasons, we describe this new phase as a modulated monoclinic structure (MM). Note that the superlattice reflections positions and intensities are incoherently changing with increasing pressure probably due to the bad powder statistics and/or due to the fact that MM corresponds to metastable states; this is why, we could not describe with more accuracy this modulated phase. This “physical pressure” behavior is similar to that described in the oxygen storage ability of LuFe2O4 for which the intercalation process, i.e., “chemical pressure”, occurred through several intermediate metastable phases. Additional increases in pressure, 8.1 GPa ≤ P ≤ 11 GPa, will lead to a mixing of this MM phase with the previously reported high pressure monoclinic form M2 (space group Pm), the MM phase completely transformed above 11 GPa. Phase mixing between MM and M2 can unambiguously be observed based on the coexistence of the 001MM and 001M2 reflections, Figure 1c; at 298 K c parameter of the M2 Pm high pressure phase is known to be 2.7% more compressible than that of the C2/m M1 phase [25,27]. For P ≥ 12 GPa, the pure M2 phase can be obtained, Figure 1. As already mentioned, M2 can be recovered at atmospheric pressure. M2 phase exhibits a B0 value (B’0 = 4) of 153 (4) GPa at 473 K (V0 = 0.914(1)) similar to the values reported at 300 K. In this experiment the temperature was increased from 373 K to 473 K in order to (unsuccessfully) attempt to back-transform the HP M2 phase to the initial LP phase.
3.1.2. 298 K
Patm ≤ P ≤ 6.6 GPa
Figure 3 shows the synchrotron XRD data obtained at 298 K upon increasing pressure.
In the literature as already mentioned the CO state was evidenced by electron diffraction and Mössbauer spectroscopy. Additionally, the monoclinic distortion linked to the CO form was observed below TCO = 330 K based on XRD and electron diffraction investigations [7]. Further, Blasco et al. proposed a monoclinic supercell (C2/m) which permitted to take into account the CO satellites below TCO and showed that a transition to a triclinic phase (P) occurred below 170 K [28].
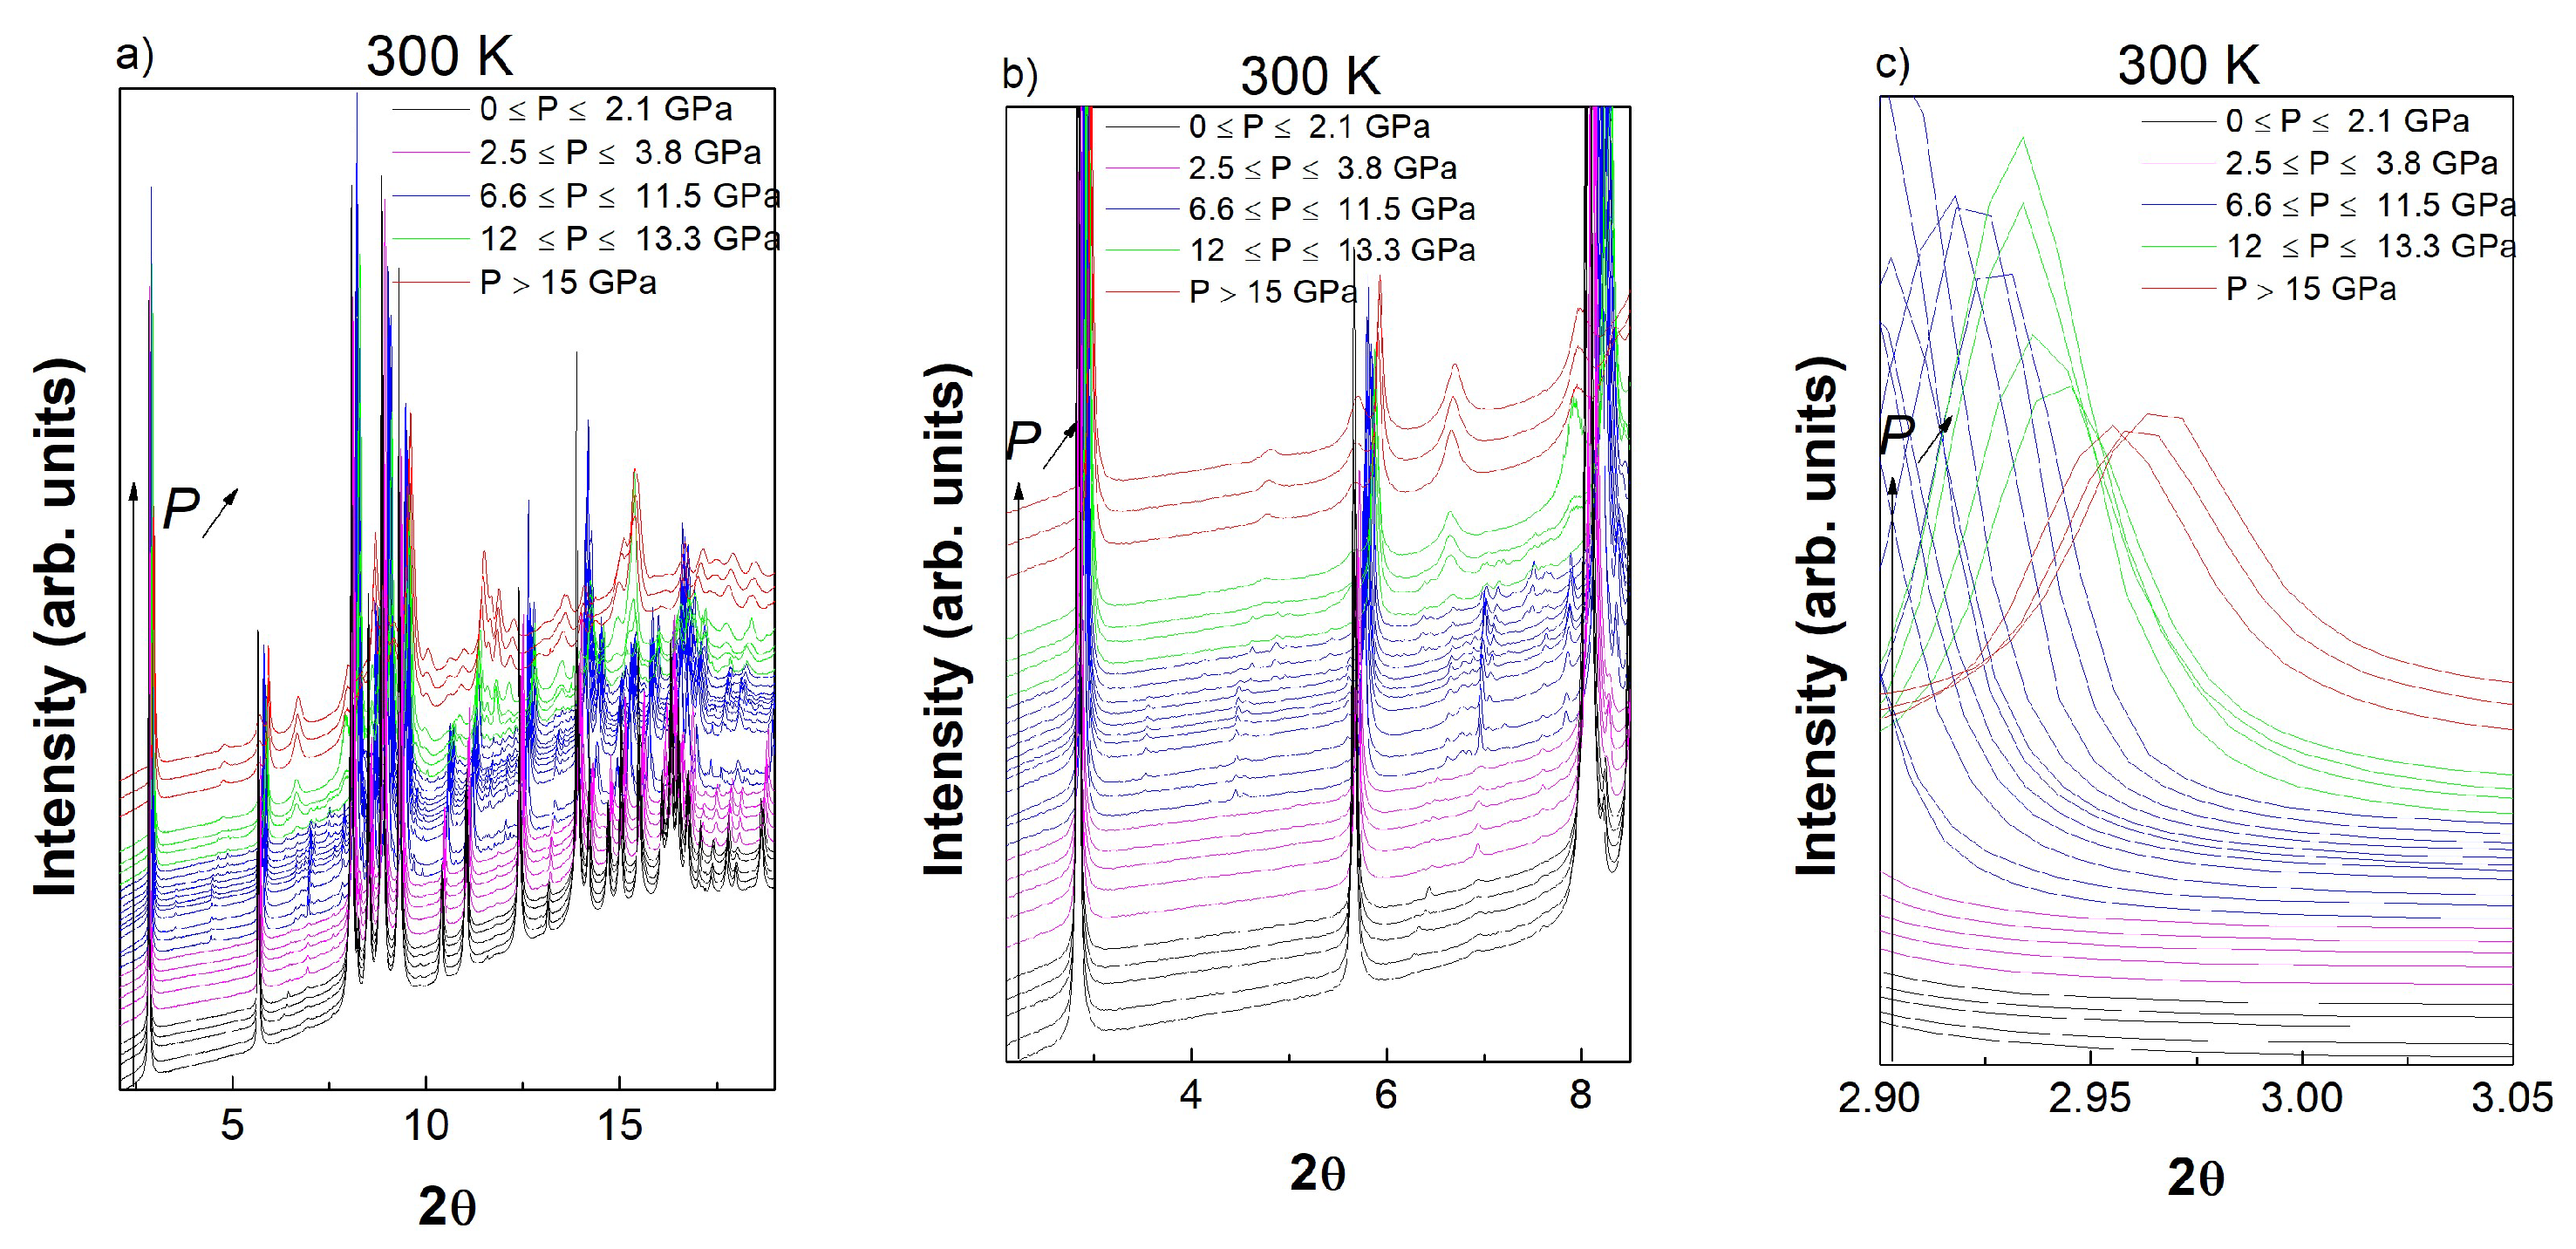
The data obtained at 300 K, Figure 3b, exhibit also some additional low intensity reflections in the low 2θ region for 0 GPa ≤ P ≤ 2.1 GPa. A further inspection of the 0.5 (3) GPa isobar X-ray data confirmed that these reflections were intrinsic from the material as they exhibited a corresponding temperature dependence, Figure 4a: they are present at 50 K and 298 K, while they disappear above TCO at 373 K. As additional satellites reflections can be observed at 50 K on Figure 4a, the P low-temperature transition previously proposed is also confirmed in this study [28]; note that the proposed C2/m and P large supercell respectively fit the data obtained at 298 K and 50 K, Figure 4a.
Upon pressure increase, 2.5 GPa ≤ P ≤ 3.8 GPa, some additional superlattice reflections appear at 298 K, Figure 3b and Figure 4b, which can be interpreted as a transition to the triclinic form; at 50 K, compression resulted as an intensity increase of the triclinic superlattices as a result of an increase in the distortion. Again, it is possible to check that these reflections are intrinsic to the material as they will disappear at 373 K, Figure 4b. The appearance of these additional superlattice reflections coincide with some changes observed in the LuFe2O4 structure (ND data).
At 298 K, the B0 value calculated, 0.2 GPa ≤ P ≤ 3.8 GPa using the Birch-Murnaghan state equation (B’0 = 4) is 132 (3) GPa, Figure 5a; although a transition to the P is suggested in this study, fitting this pressure dataset using two equations of state would be doutful. The lower B0 value than that obtained at 373 K can be explained by the existence of the lower symmetry (C2/m) at 298 K which leaves more flexibility for the compression behavior; note however that the B0 value has still the same order of magnitude as that obtained using an in-house high pressure X-ray diffractometer. The pressure dependence of the unit cell parameters using the C2/m space group, Figure 5b–e, tends to confirm an anomaly in the compression behavior of LuFe2O4 at about 2.5 GPa; above 2.5 GPa the β-angle is found to saturate to a value of 103.47°. Note that Figure 5b–e exhibit also unit cell parameters obtained based on ND (see below).
6.6 GPa ≤ P ≤ 19.1 GPa
As already shown in the 373 K isotherm X-ray data, the appearance of many superlattice reflections can be observed for 6.6 GPa ≤ P ≤ 11.5 GPa, Figure 3a,b. As the monoclinic distortion is conserved, a transition to the modulated MM form is proposed. Compared with the 373 K data and the direct R-MM transformation, the absence of diffuse scattering at 298 K could be explained by the existence of the intermediate M1 monoclinic phase (and possibly T1) which would preclude the dynamic disorder. Note that the MM form could be associated with different metastable states as the superlattice reflections do not necessarily occur in the same 2θ-range as already observed at 373 K. Upon increasing pressure, 12 GPa ≤ P ≤ 13.3 GPa, phase coexistence between MM and the high-pressure M2 phase is observed, Figure 3a-b. However, mechanisms implying the transition to the M2 phase probably exhibit particular pressure induced strain along the c direction as coexistence of 001C2/m and 001Pm reflections already existing at 373 K, Figure 3c, cannot be observed at 298 K, Figure 3c. For P ≥ 15 GPa, the pure M2 phase can be obtained, Figure 3, which can be recovered at atmospheric pressure as already mentioned. The B0 value calculated of the M2 phase at 298 K is 170 (2) GPa with V0 = 0.905 (1), Figure 5a.
3.1.3. 50 K
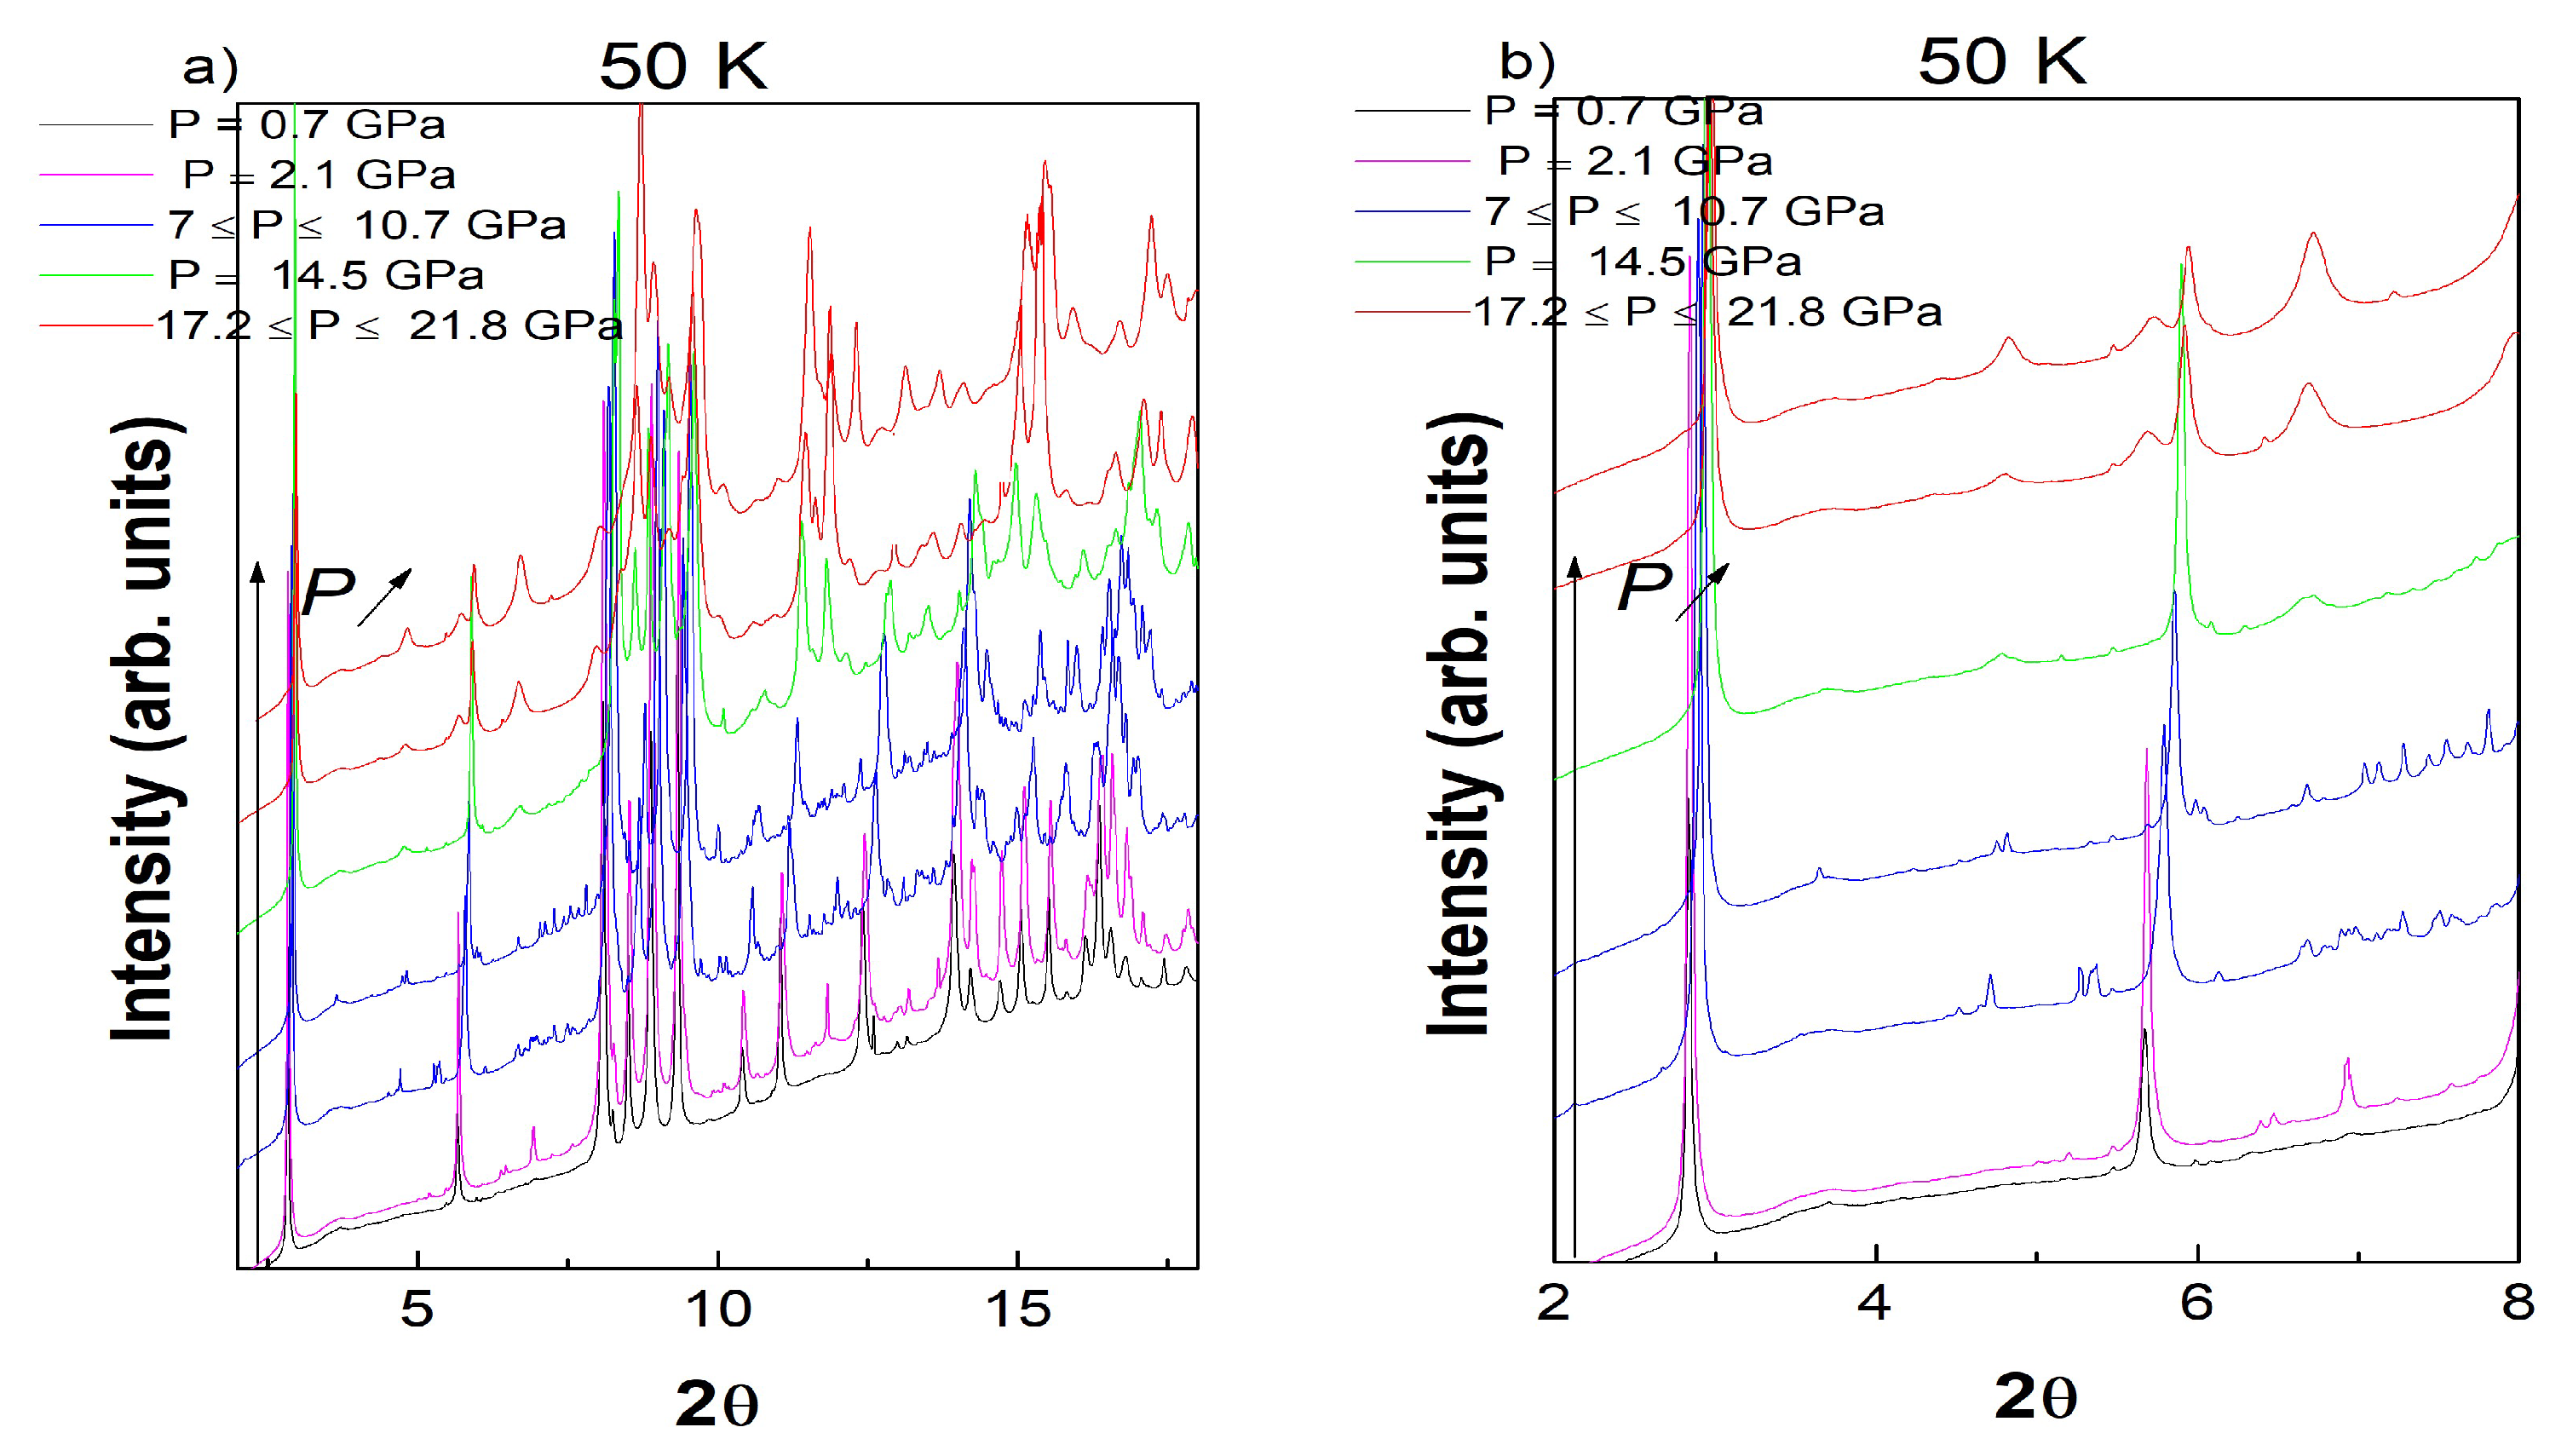
Figure 6a shows the synchrotron XRD data obtained at 50 K upon increasing pressure. As already mentioned on Figure 4, at 50 K, compression resulted as an intensity increase of the triclinic superlattices as a result of an increase in the distorsion. For this isotherm, bulk modulus of the low pressure T1 phase is 187 GPa (38). At 7 GPa, the modulated MM phase(s) is characterized by the appearance of many additional superlattice reflections, which are not the same at 7 GPa and 10.7 GPa respectively as an additional evidence of the metastability of the MM states.
As already observed at 298 K, transformation to MM is not accompanied by the existence of diffuse scattering. Increasing the pressure to 14.5 GPa lead to a phase coexistence between the MM and the M2 phase. The later M2 phase is found to be pure above 17.2 GPa. Mechanisms implying the transition to the M2 phase, which exhibit pressure induced strain along the c direction as coexistence of 001C2/m and 001Pm reflections already shown at 373 K, Figure 1c, cannot be observed at 50 K, Figure 6b. The M2 phase can be recovered at atmospheric pressure and exhibits the following properties: B0 = 157 (1) GPa and V0 = 0.911 (1), Figure 7.
3.2. Neutron Powder Diffraction
As powder statistics did not permit us to follow the quantitative structure dependence of LuFe2O4, high pressure ND was performed. Figure 8 shows the ND data obtained at 2.7 GPa and the results of a refinement using the Rietveld method with the C2/m space group, Table 1. This structural model was used for 0 GPa ≤ P ≤ 6.1 GPa although a smooth structural change is suggested above 2.5 GPa. Compared to the above high resolution X-ray data, the resolution neutron data at λ = 1.36 Å did not reasonably justify the use of lower symmetry.
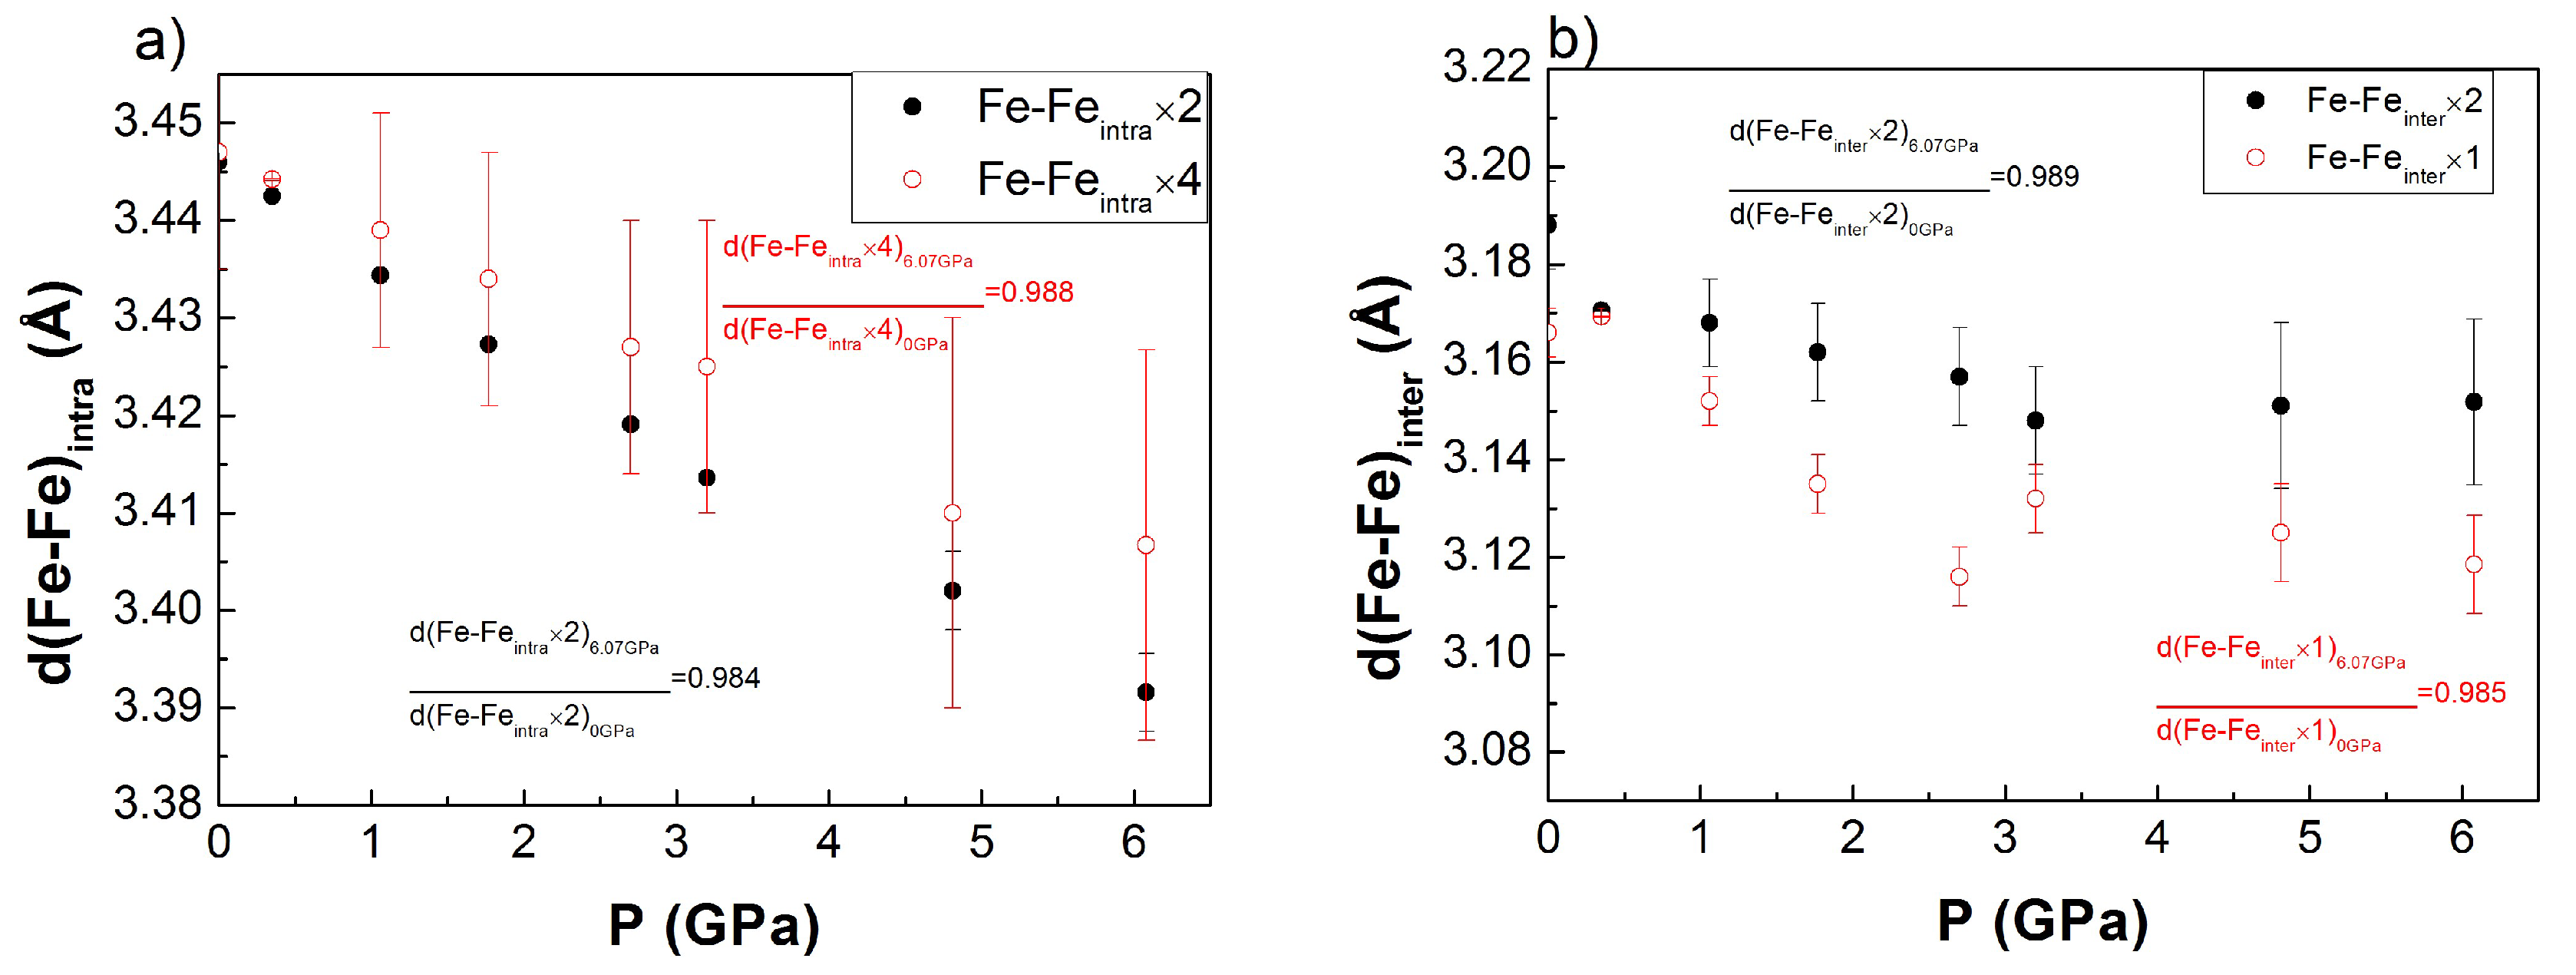
Pressure in the ND experiment was calibrated based on the equation of state obtained in the synchrotron XRD experiment, Figure 5a. Bond lengths calculation obtained using the Rietveld refined structure from NPD data tends to confirm the smooth structural change above 2.5 GPa to the triclinic T1 phase for the Fe-Fe, Lu-Lu, Lu-Fe, Lu-O and Fe-O distances, Figure 9.
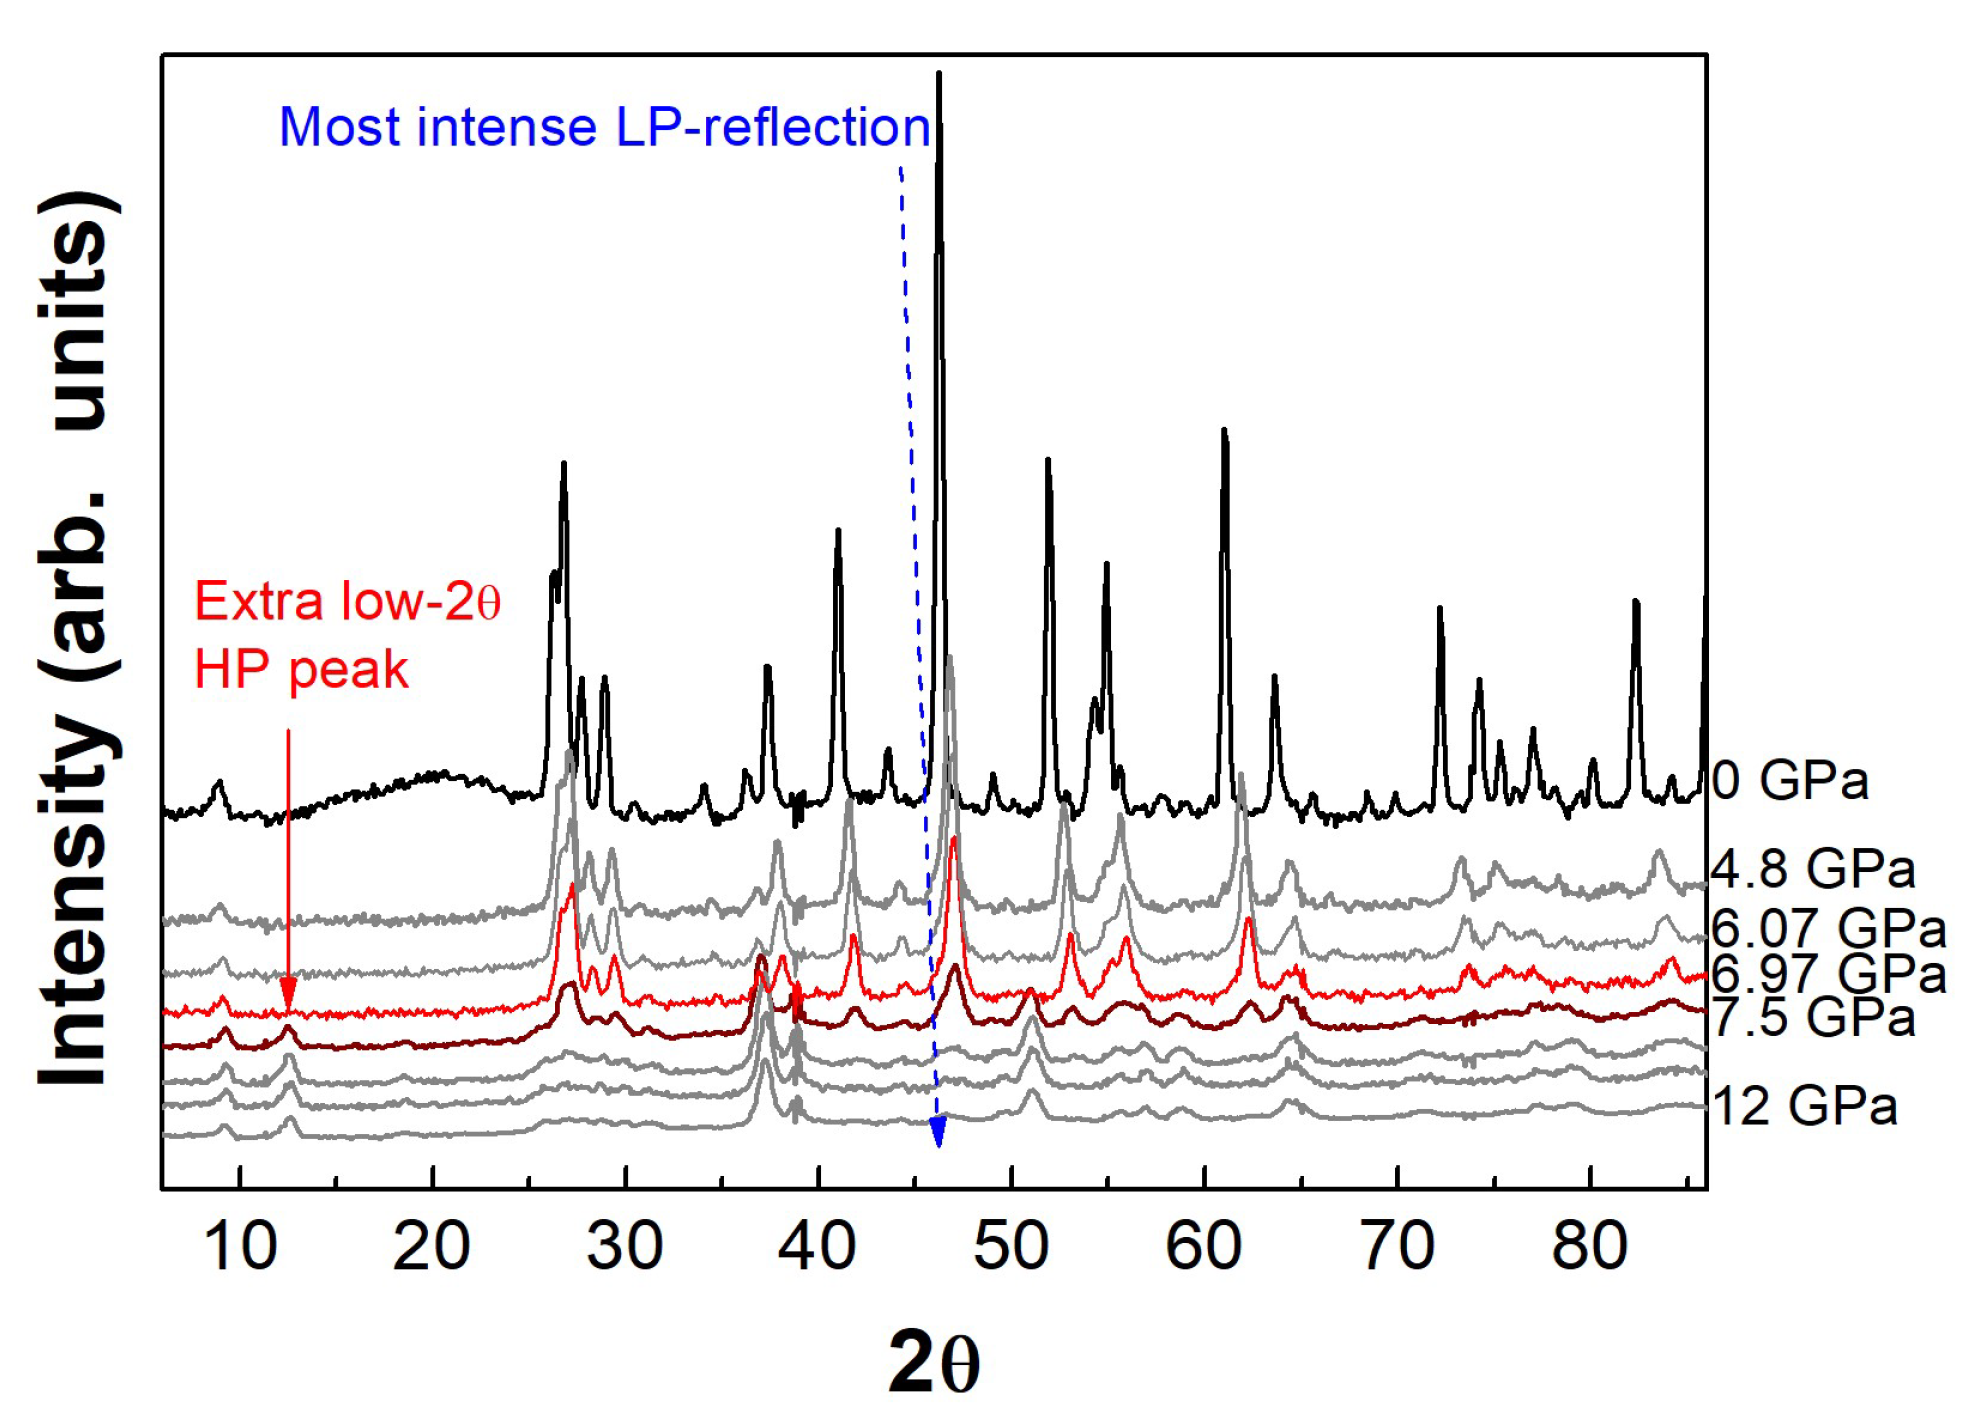
Looking at the high pressure ND data, the transition to the M2 high pressure form can be evidenced in the 6–8 GPa range by (i) the decrease of the most intense reflection of the LP phase (M1) at about 46–48° (2θ) and by (ii) the appearance of a new extra low-2θ HP peak (M2), Figure 10, as a result of antiferromagnetic ordering as already previously reported [25].
Note that no structural information can be obtained above 6 GPa due to the phase coexistence between the M1 and the M2 phase. Additionally, it is of great importance to note that no supplementary MM phase is present in the ND data which clearly evidence that this latter form is metastable and is only observed in the synchrotron XRD, due to the different acquisition time used in these studies; 1 s and 2–3 h for the synchrotron and the ND studies respectively. At the highest pressure reached, i.e., 12 GPa, the transformation to the M2 phase is not totally complete. However, as the HP phase can be recovered at ambient pressure, one could estimate the exact completeness of the transition to the HP M2 phase (90%) based on an XRD investigation and the 2.7% compression difference between the c parameter of the M1 phase and the M2 one.
3.3. Resistivity Measurements
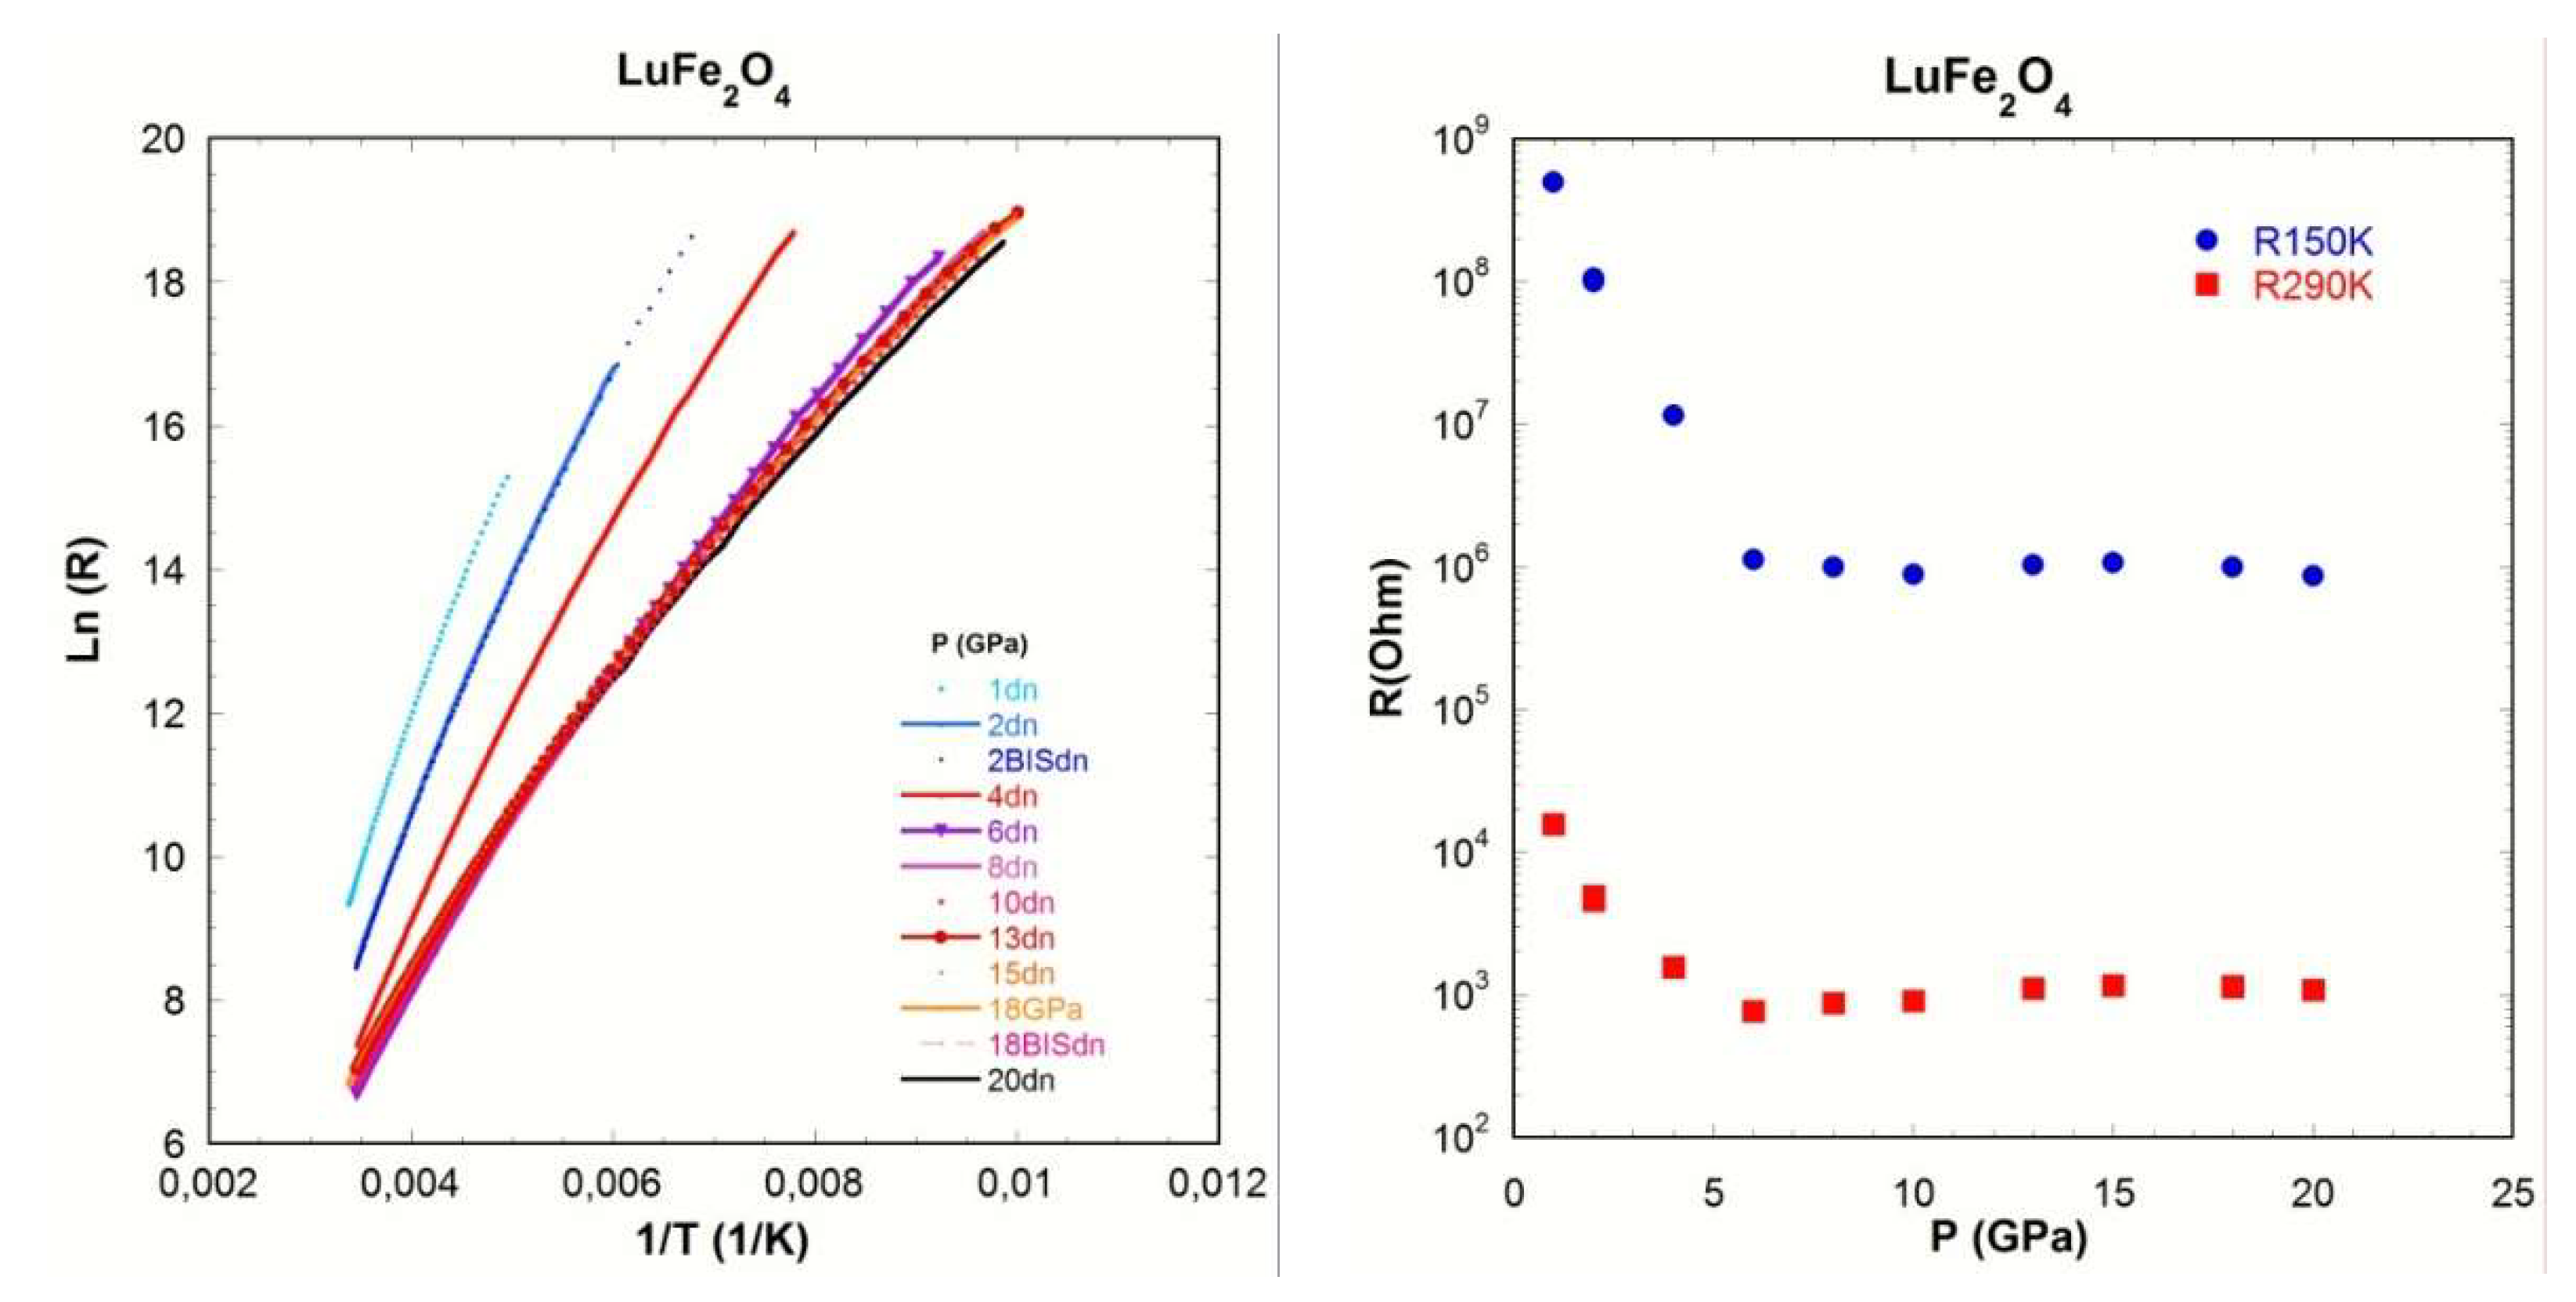
Figure 11 shows results obtained based on resistivity measurements. Figure 9a describes the temperature dependence of the resistivity, i.e., isobar measurements, as a function of pressure; it is consistent with semiconductor behavior over the entire pressure range. However, it is obvious that above 6 GPa the resistivity data tend to exhibit a similar temperature behavior. This is confirmed with Figure 11b which shows the pressure dependence of the resistance at 298 K and 150 K respectively, with a clear change in slope at 6 GPa, which could be linked with the transition to the M2 phase as described above. It is interesting to compare the present resistivity measurements with those previously reported which were obtained at ambient temperature with increasing pressure, i.e., isotherm measurements; in these measurements, the change in behavior occurred at about 11 GPa [27]. This apparent distinct behavior can be understood based on the acquisition time of the respective experiments similarly to what we observed in the synchrotron XRD and ND studies; the present isobar measurements required one day per pressure point, i.e., the entire dataset was performed over a month, whereas the isotherm measurements from atmospheric pressure to 15 GPa were performed within several hours. As we previously observed that the transition to the M2 phase could imply (several) intermediate metastable state(s) (MM), the kinetics are of the greatest importance in this transformation; these two sets of resistivity measurements represent furter evidence of the slow kinetics of this phase transition.
3.4. Infrared Spectroscopy
Figure 12a shows the far infrared spectra of LuFe2O4 in the low-pressure M1 stability range, i.e., below 7 GPa. Infrared spectrum obtained at about 1 GPa is similar to that previously reported in the literature [29,30,31,32]. However, when pressure is increased above 2.4 GPa, some subtle changes noted A,B,C can be observed (mode assignment was indicated in [33]), Figure 12a, which could be interpreted as an indication of a phase transition. It is interesting to note that these changes occur in the same pressure range as modifications previously reported based on ND data, Figure 9, and the appearance of satellites reflections on XRD patterns, Figure 3. Such a signature could reinforce the probable existence of the T1 phase. When pressure increases above 6.3 GPa, Figure 12b, a clear change occurs and the infrared spectra saturate in intensity between 370 cm−1 and 600 cm−1. This saturation of the absorption spectra has to be correlated with the change in resistivity observed at the transition to the M2 phase at close to 6 GPa, Figure 11. The saturation of the LuFe2O4 absorption spectrum therefore probably indicates that the bandgap of the M2 phase is in the infrared energy range. However, when pressure is further increased up to the highest pressure, the saturated absorption intensity between 370 cm−1 and 600 cm−1 progressively decreases and can even be measured during decompression, Figure 12b. Figure 12c shows the absorption spectrum of the HP M2 phase recovered at atmospheric pressure. The frequency positions and mode assignment of the Pm M2 phase were determined based on DFT calculations. Group theory shows us that the phonons of the M2 phase can be classified into Γ = 28 A’⊕14A” where 2A’⊕A” are accoustic modes. The A’ and A” irreducible representations are both Raman and infrared active.
3.5. X-Ray Absorption Spectroscopy
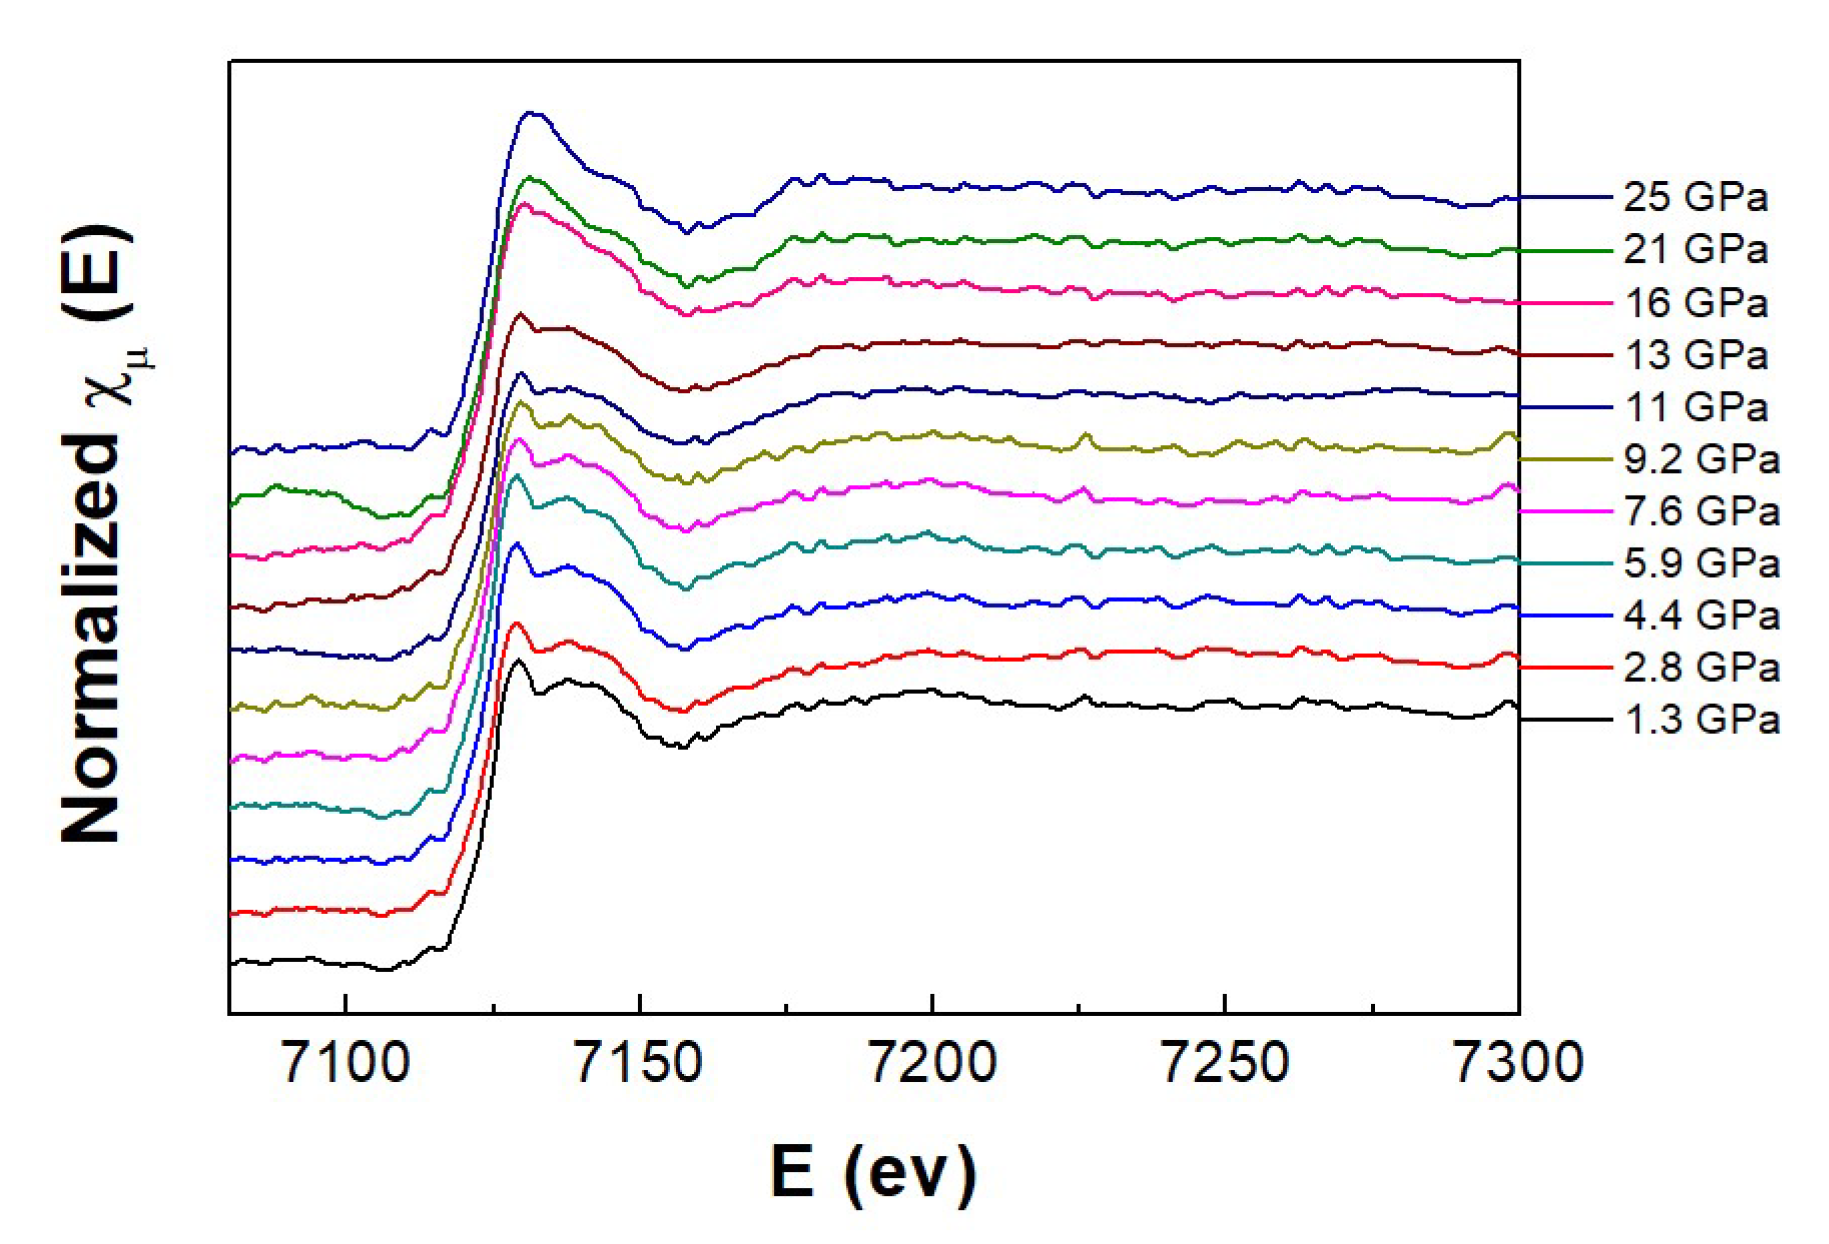
Low pressure spectrum is consistent with those previously reported in the literature [13], Figure 13. High quality, high-pressure X-Ray absorption spectra data of LuFe2O4 at the Fe K edge were normalized to the jump at the absorption edge and a clear change is observed at about 16 GPa, Figure 13. In agreement with above results, such a high-pressure spectrum can be recovered to atmospheric pressure implying that the change in the Fe-local environment obtained under pressure is preserved during decompression. In order to verify the structural change to the M2 phase previously proposed, ab-initio simulations were performed using the FDMNES code [26], Figure 14, resulting in a good agreement between experiments and simulated X-Ray absorption spectra. 10 Å and 6 Å cluster radii were respectively used for the M1 [7] and M2 [25] phases. The 5-fold to distorted 5 + 1-fold change in the Fe-local environment obtained under pressure is therefore proposed to be at the origin of both the slow kinetics of the M1–M2 phase transition and the recovering of the high-pressure form at ambient pressure.
4. Conclusions
A clear phase boundary to the high pressure M2 phase was established. An additional transition to the rhombohedral high temperature phase are proposed along with a potential M1–T1 phase transition based on [28]. As the transition to the M2 high pressure phase is reconstructive with a change of five-fold to 5 + 1-fold Fe-local environment, the MM metastable phases characterized by synchrotron XRD are also included. It is interesting to note the parallel between physical pressure behavior in the present study and chemical pressure one in the oxygen (dis)-insertion previously reported [8] which was also characterized by several intermediate metastable states and a change in the Fe-local environment.
Author Contributions
The samples were prepared by J.B., synchrotron XRD data by M.P., J.B., C.M., F.D., M.H., J.H., J.R, resistivity measurements by G.G., NPD by M.P., J.B., C.M., F.D., T.H., J.H., J.R, infrared spectroscopy by M.P., J.L.B., J.R., ab-initio calculations by P.H., XAS by M.P., C.M., F.B., J.R. The manuscript was written by J.R. and revised by J.H., F.D., C.M. The projects direction were developed by J.R. and C.M.
Acknowledgments
This work was supported by financial support from the French Agence Nationale de la Recherche (JC08-331297 and ANR-08-BLAN-0005-01).
Conflicts of Interest
The authors declare no conflict of interest.
References
- Cheong, S.W.; Mostovoy, M. Multiferroics: A magnetic twist for ferroelectricity. Nat. Mat. 2007, 6, 13–20. [Google Scholar] [CrossRef] [PubMed]
- Ikeda, N.; Ohsumi, H.; Ohwada, K.; Ishii, K.; Inami, T.; Kakurai, K.; Murakami, Y.; Yoshii, K.; Mori, S.; Horibe, Y.; et al. Ferroelectricity from iron valence ordering in the charge-frustrated system Lufe2o4. Nature 2005, 436, 1136–1138. [Google Scholar] [CrossRef] [PubMed]
- Mundy, J.A.; Brooks, C.M.; Holtz, M.E.; Moyer, J.A.; Das, H.; Rebola, A.F.; Heron, J.T.; Clarkson, J.D.; Disseler, S.M.; Liu, Z.Q.; et al. Atomically engineered ferroic layers yield a room—Temperature magnetoelectric multiferroic. Nature 2016, 537, 523. [Google Scholar] [CrossRef] [PubMed]
- Niermann, D.; Waschkowski, F.; de Groot, J.; Angst, M.; Hemberger, J. Dielectric properties of charge-ordered lufe2o4 revisited: The Apparent influence of contacts. Phys. Rev. Lett. 2012, 109, 016405. [Google Scholar] [CrossRef] [PubMed]
- Lafuerza, S.; García, J.; Subías, G.; Blasco, J.; Conder, K.; Pomjakushina, E. Intrinsic electrical properties of Lufe2o4. Phys.Rev. B 2013, 88, 085130. [Google Scholar] [CrossRef]
- Isobe, M.; Kimizuka, N.; Iida, J.; Takekawa, S. Structures of Lufecoo4 and Lufe2o4. Acta Crystallogr. Sect. C Cryst. Struct. Commun. 1990, 46, 1917–1918. [Google Scholar] [CrossRef]
- Bourgeois, J.; Hervieu, M.; Poienar, M.; Abakumov, A.M.; Elkaim, E.; Sougrati, M.T.; Porcher, F.; Damay, F.; Rouquette, J.; Van Tendeloo, G.; et al. Evidence of oxygen-dependent modulation in Lufe2o4. Phys. Rev. B 2012, 85, 064102. [Google Scholar] [CrossRef]
- Hervieu, M.; Guesdon, A.; Bourgeois, J.; Elkaim, E.; Poienar, M.; Damay, F.; Rouquette, J.; Maignan, A.; Martin, C. Oxygen storage capacity and structural flexibility of LuFe2O4+x (0 ≤ x ≤ 0.5). Nat. Mater. 2014, 13, 74–80. [Google Scholar] [PubMed]
- Bourgeois, J.; André, G.; Petit, S.; Robert, J.; Poienar, M.; Rouquette, J.; Elkaïm, E.; Hervieu, M.; Maignan, A.; Martin, C.; Damay, F. Evidence of magnetic phase separation in Lufe2o4. Phys. Rev. B 2012, 86, 024413. [Google Scholar] [CrossRef]
- Iida, J.; Tanaka, M.; Nakagawa, Y.; Funahashi, S.; Kimizuka, N.; Takekawa, S. Magnetization and spin correlation of 2-dimensional triangular antiferromagnet Lufe2o4. J. Phys. Soc. Jpn. 1993, 62, 1723–1735. [Google Scholar] [CrossRef]
- Christianson, A.D.; Lumsden, M.D.; Angst, M.; Yamani, Z.; Tian, W.; Jin, R.; Payzant, E.A.; Nagler, S.E.; Sales, B.C.; Mandrus, D. Three-dimensional Magnetic correlations in multiferroic Lufe(2)O(4). Phys. Rev. Lett. 2008, 100, 107601. [Google Scholar] [CrossRef] [PubMed]
- Angst, M.; Hermann, R.P.; Christianson, A.D.; Lumsden, M.D.; Lee, C.; Whangbo, M.H.; Kim, J.W.; Ryan, P.J.; Nagler, S.E.; Tian, W.; Jin, R.; Sales, B.C.; Mandrus, D. Charge order in Lufe2o4: Antiferroelectric ground state and coupling to magnetism. Phys. Rev. Lett. 2008, 101, 227601. [Google Scholar] [CrossRef] [PubMed]
- Lafuerza, S.; Garcia, J.; Subias, G.; Blasco, J.; Cuartero, V. Strong local lattice instability in hexagonal ferrites Rfe2o4 (R = Lu, Y, Yb) Revealed by X-ray absorption spectroscopy. Phys. Rev. B 2014, 89, 045129. [Google Scholar] [CrossRef]
- Roth, W.L. Magnetic structures of Mno, Feo, Coo, and Nio. Phys. Rev. 1958, 110, 1333–1341. [Google Scholar] [CrossRef]
- Piermarini, G.J.; Block, S.; Barnett, J.D.; Forman, R.A. Calibration of pressure-dependence of R1 ruby fluorescence line to 195 Kbar. J. Appl. Phys. 1975, 46, 2774–2780. [Google Scholar] [CrossRef]
- Hammersley, A.P.; Svensson, S.O.; Hanfland, M.; Fitch, A.N.; Hausermann, D. Two-dimensional detector software: From Real detector to idealised image or two-theta scan. High Press. Res. 1996, 14, 235–248. [Google Scholar] [CrossRef]
- Rodriguezcarvajal, J. Recent advances in magnetic-structure determination by neutron powder diffraction. Physica B 1993, 192, 55–69. [Google Scholar] [CrossRef]
- Garbarino, G.; Weht, R.; Sow, A.; Sulpice, A.; Toulemonde, P.; Alvarez-Murga, M.; Strobel, P.; Bouvier, P.; Mezouar, M.; Nunez-Regueiro, M. Direct observation of the influence of the as-Fe-as angle on the T-C of superconducting Smfeaso1-Xfx. Phys. Rev. B 2011, 84, 024510. [Google Scholar] [CrossRef]
- Sanfilippo, S.; Elsinger, H.; Nunez-Regueiro, M.; Laborde, O.; Le Floch, S.; Affronte, M.; Olcese, G.L.; Palenzona, A. Superconducting high pressure Casi2 phase with T-C up to 14 K. Phys. Rev. B 2000, 61, R3800–R3803. [Google Scholar] [CrossRef]
- Hansen, T.C.; Henry, P.F.; Fischer, H.E.; Torregrossa, J.; Convert, P. The D20 instrument at the ILL: A versatile high-intensity two-axis neutron diffractometer. Meas. Sci. Technol. 2008, 19, 034001. [Google Scholar] [CrossRef]
- Kresse, G.; Furthmuller, J. Efficient iterative schemes for ab-initio total-energy calculations using a plane-wave basis set. Phys. Rev. B 1996, 54, 11169–11186. [Google Scholar] [CrossRef]
- Kresse, G.; Furthmüller, J. Efficiency of ab-initio total energy calculations for metals and semiconductors using a plane-wave basis set. Comput. Mater. Sci. 1996, 6, 15–50. [Google Scholar] [CrossRef]
- Kresse, G.; Hafner, J. Abinitio molecular-dynamics for liquid-metals. Phys. Rev. B 1993, 47, 558–561. [Google Scholar] [CrossRef]
- Perdew, J.P.; Burke, K.; Ernzerhof, M. Generalized gradient approximation made simple. Phys. Rev. Lett. 1996, 77, 3865–3868. [Google Scholar] [CrossRef] [PubMed]
- Damay, F.; Poienar, M.; Hervieu, M.; Guesdon, A.; Bourgeois, J.; Hansen, T.; Elkaim, E.; Haines, J.; Hermet, P.; Konczewicz, L.; et al. High-pressure polymorph of Lufe2o4 with room-temperature antiferromagnetic order. Phys. Rev. B 2015, 91, 214111. [Google Scholar] [CrossRef]
- Joly, Y. X-ray absorption near-edge structure calculations beyond the muffin-tin approximation. Phys. Rev. B 2001, 63, 125120. [Google Scholar] [CrossRef]
- Rouquette, J.; Haines, J.; Al-Zein, A.; Papet, P.; Damay, F.; Bourgeois, J.; Hammouda, T.; Doré, F.; Maignan, A.; Hervieu, M.; Martin, C. Pressure-induced structural transition in Lufe2o4: Towards a new charge ordered state. Phys. Rev. Lett. 2010, 105, 237203. [Google Scholar] [CrossRef] [PubMed]
- Blasco, J.; Lafuerza, S.; Garcia, J.; Subias, G. Structural properties in Rfe2o4 compounds (R = Tm, Yb, and Lu). Phys. Rev. B 2014, 90, 094119. [Google Scholar] [CrossRef]
- Lee, C.; Kim, J.; Cheong, S.W.; Choi, E.J. Infrared optical response of Lufe2o4 under dc electric field. Phys. Rev. B 2012, 85, 014303. [Google Scholar] [CrossRef]
- Vitucci, F.M.; Nucara, A.; Mirri, C.; Nicoletti, D.; Ortolani, M.; Schade, U.; Calvani, P. Infrared and transport properties of Lufe2o4 under electric fields. Phys. Rev. B 2011, 84, 153105. [Google Scholar] [CrossRef]
- Vitucci, F.M.; Nucara, A.; Nicoletti, D.; Sun, Y.; Li, C.H.; Soret, J.C.; Schade, U.; Calvani, P. Infrared study of the charge-ordered multiferroic Lufe2o4. Phys. Rev. B 2010, 81, 195121. [Google Scholar] [CrossRef]
- Xu, X.S.; de Groot, J.; Sun, Q.C.; Sales, B.C.; Mandrus, D.; Angst, M.; Litvinchuk, A.P.; Musfeldt, J.L. Lattice dynamical probe of charge order and antipolar bilayer stacking in Lufe2o4. Phys.Rev. B 2010, 82, 014304. [Google Scholar] [CrossRef]
- Harris, A.B.; Yildirim, T. Charge and spin ordering in the mixed-valence compound Lufe2o4. Phys. Rev. B 2010, 81, 134417. [Google Scholar] [CrossRef]
Figure 1.
Pressure dependence of the LuFe2O4 X-ray data at 373 K, (a) full-2ϴ-range, (b) 2°–14°-2ϴ-range, (c) 2.8°–3.02°-2ϴ-range. Appearance of superlattice reflections (SR) and diffuse scattering (DS) are indicated.
Figure 1.
Pressure dependence of the LuFe2O4 X-ray data at 373 K, (a) full-2ϴ-range, (b) 2°–14°-2ϴ-range, (c) 2.8°–3.02°-2ϴ-range. Appearance of superlattice reflections (SR) and diffuse scattering (DS) are indicated.

Figure 2.
(a) Pressure dependence of the LuFe2O4 rhombohedral low pressure (at 373 K) and monoclinic M2 high pressure forms (at 473 K); (b) evidence of the apparition of a monoclinic distortion with increasing pressure. The obtained monoclinic reflections are indexed in the ambient temperature monoclinic C2/m space group.
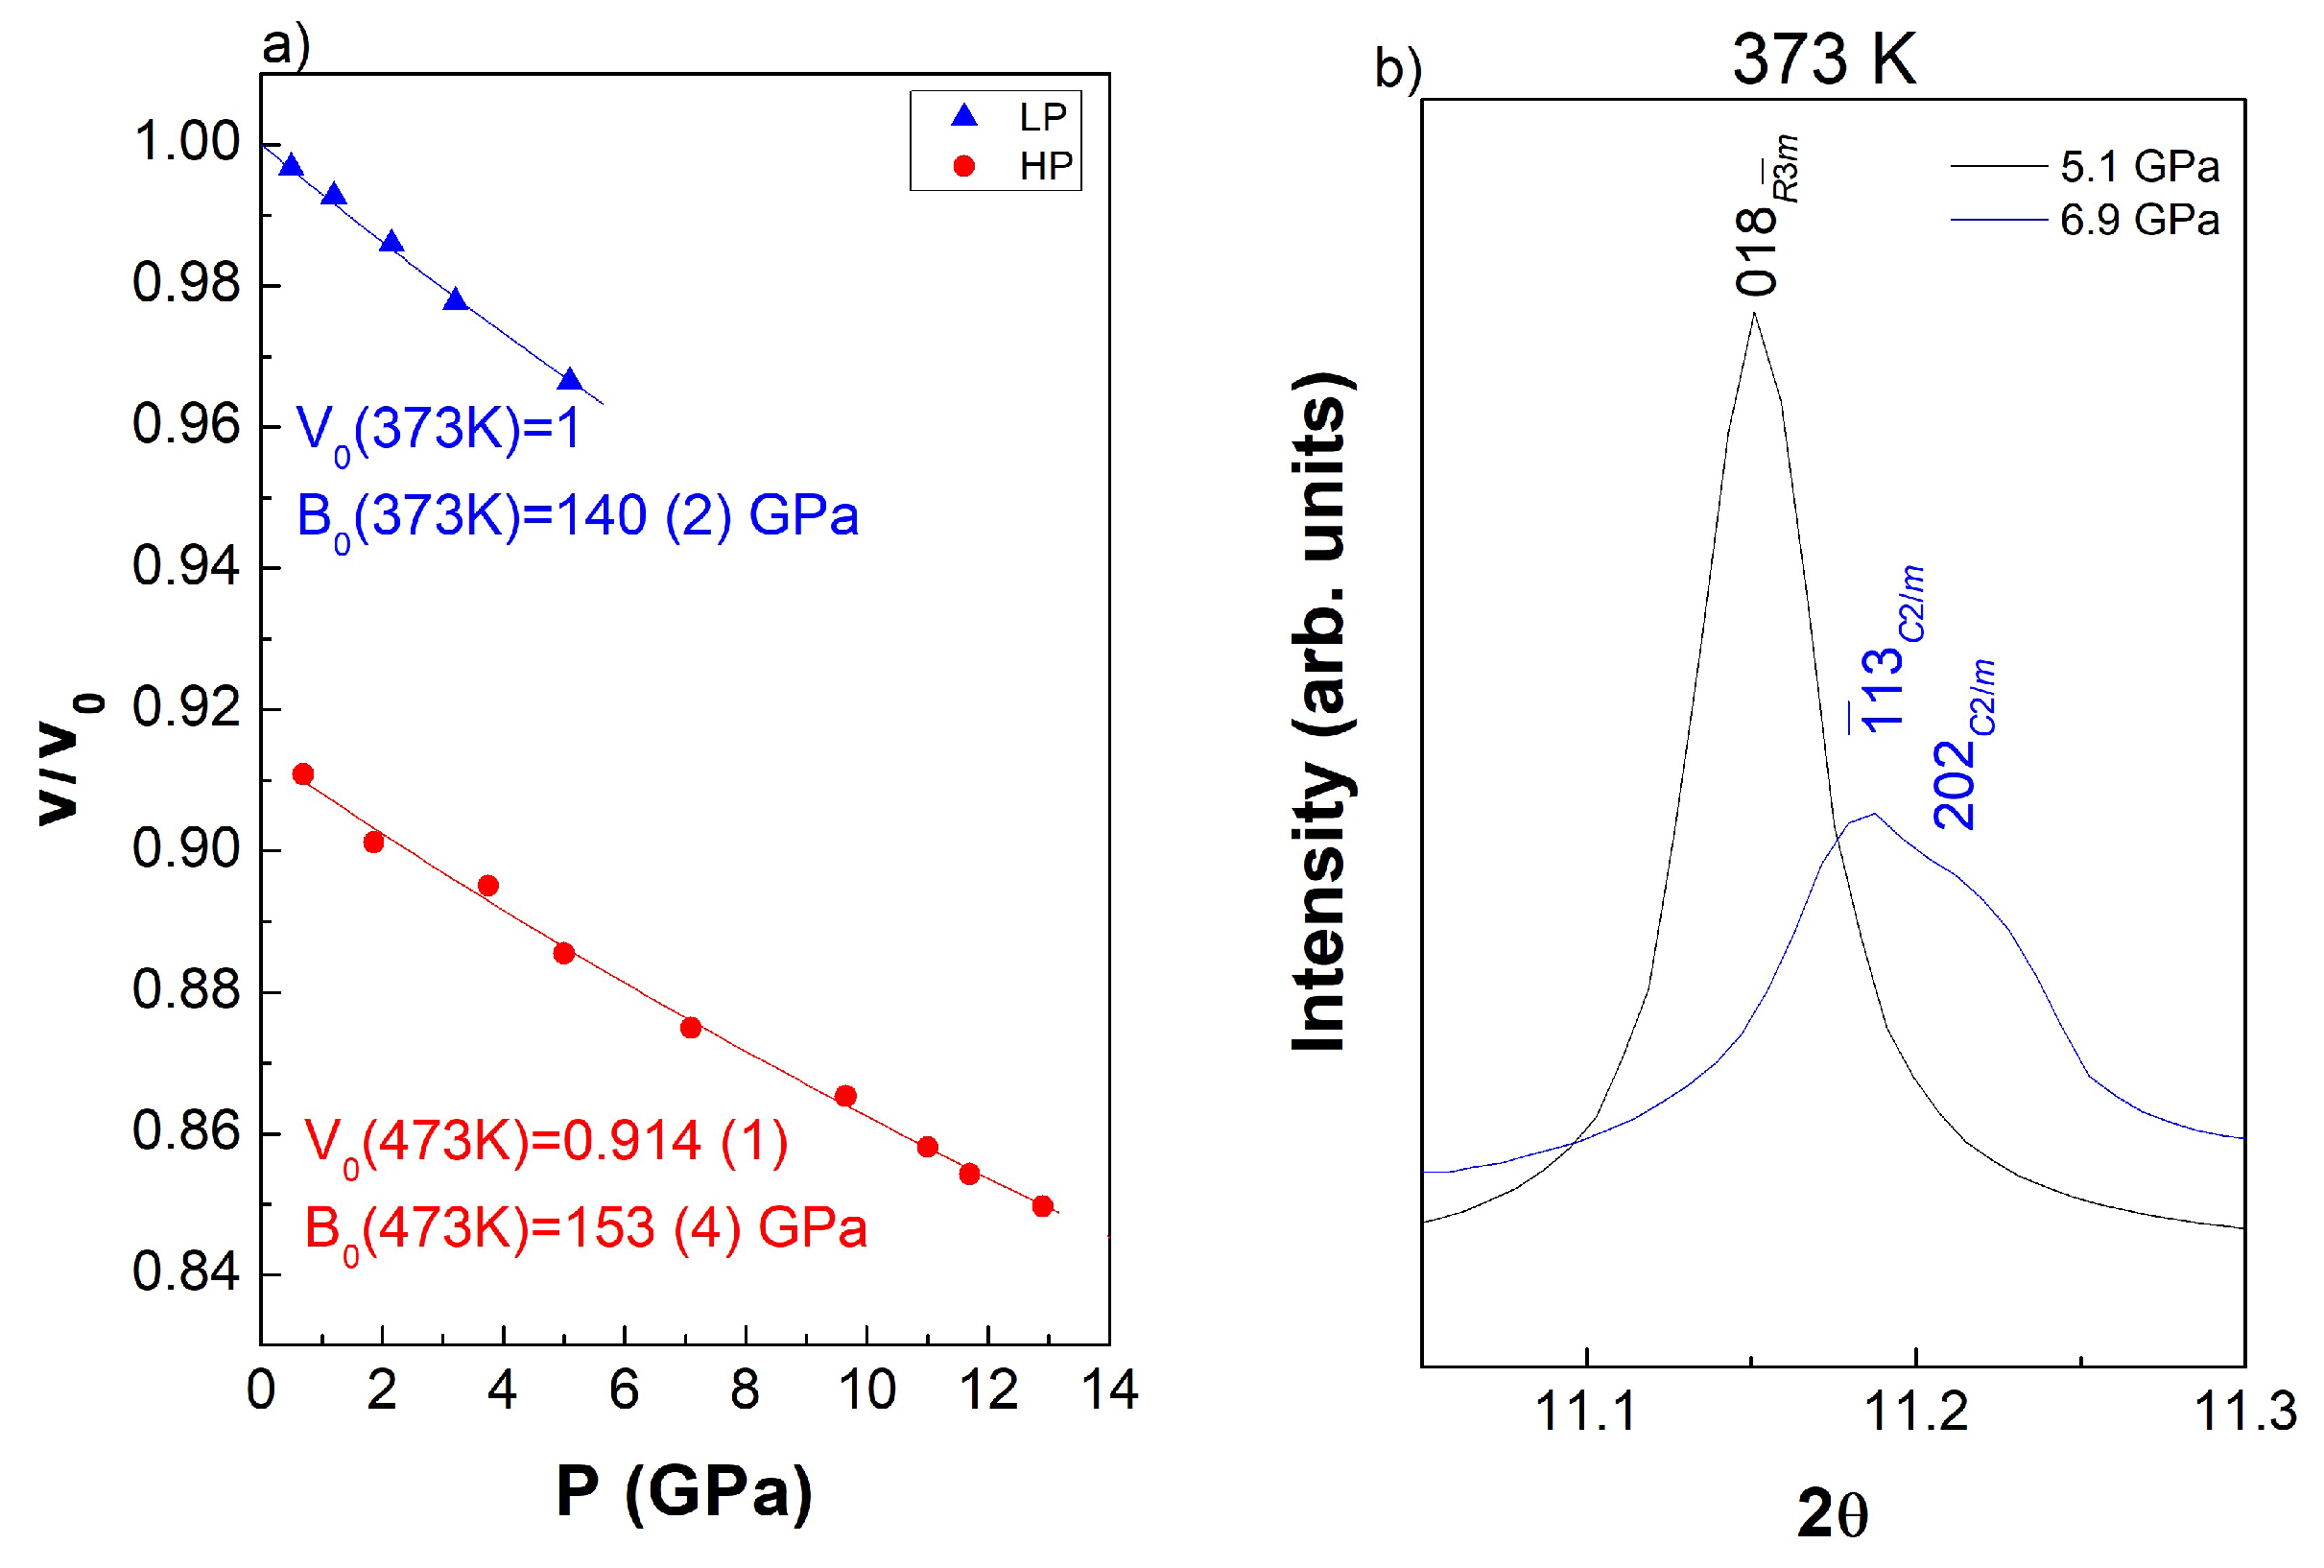
Figure 3.
Pressure dependence of the LuFe2O4 X-ray data at 298 K, (a) full-2ϴ-range, (b) 2°–8.5°-2ϴ-range, (c) 2.9°–3.05°-2ϴ-range.
Figure 3.
Pressure dependence of the LuFe2O4 X-ray data at 298 K, (a) full-2ϴ-range, (b) 2°–8.5°-2ϴ-range, (c) 2.9°–3.05°-2ϴ-range.

Figure 4.
Temperature dependence of the superlattice reflections at (a) 0.5 (3) GPa and (b) 2.9 (4) GPa.
Figure 4.
Temperature dependence of the superlattice reflections at (a) 0.5 (3) GPa and (b) 2.9 (4) GPa.

Figure 5.
Pressure dependence at 298 K of (a) the LuFe2O4 low pressure monoclinic M1 and M2 high pressure forms, the relative monoclinic cell parameters (b) a/a0; (c) b/b0; (d) c/c0 and (e) the monoclinic β angle.
Figure 5.
Pressure dependence at 298 K of (a) the LuFe2O4 low pressure monoclinic M1 and M2 high pressure forms, the relative monoclinic cell parameters (b) a/a0; (c) b/b0; (d) c/c0 and (e) the monoclinic β angle.
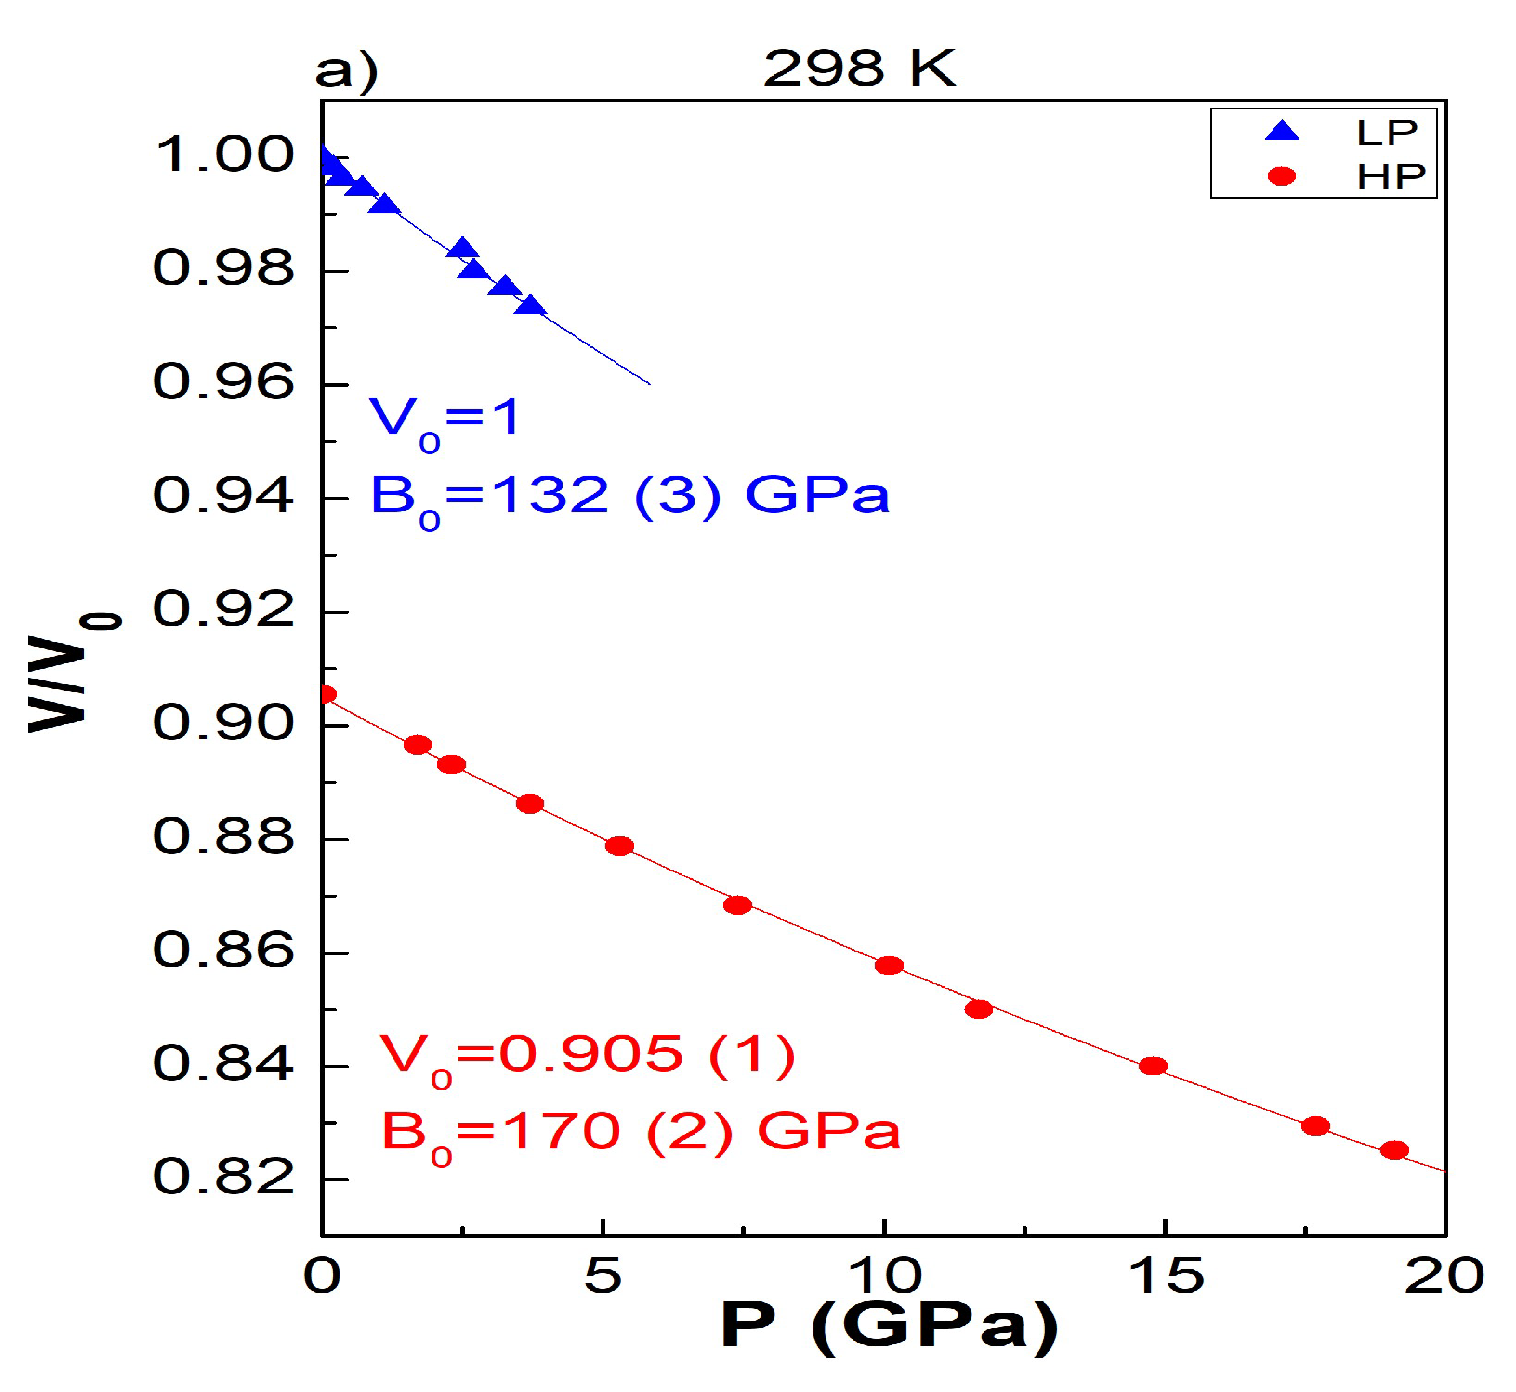
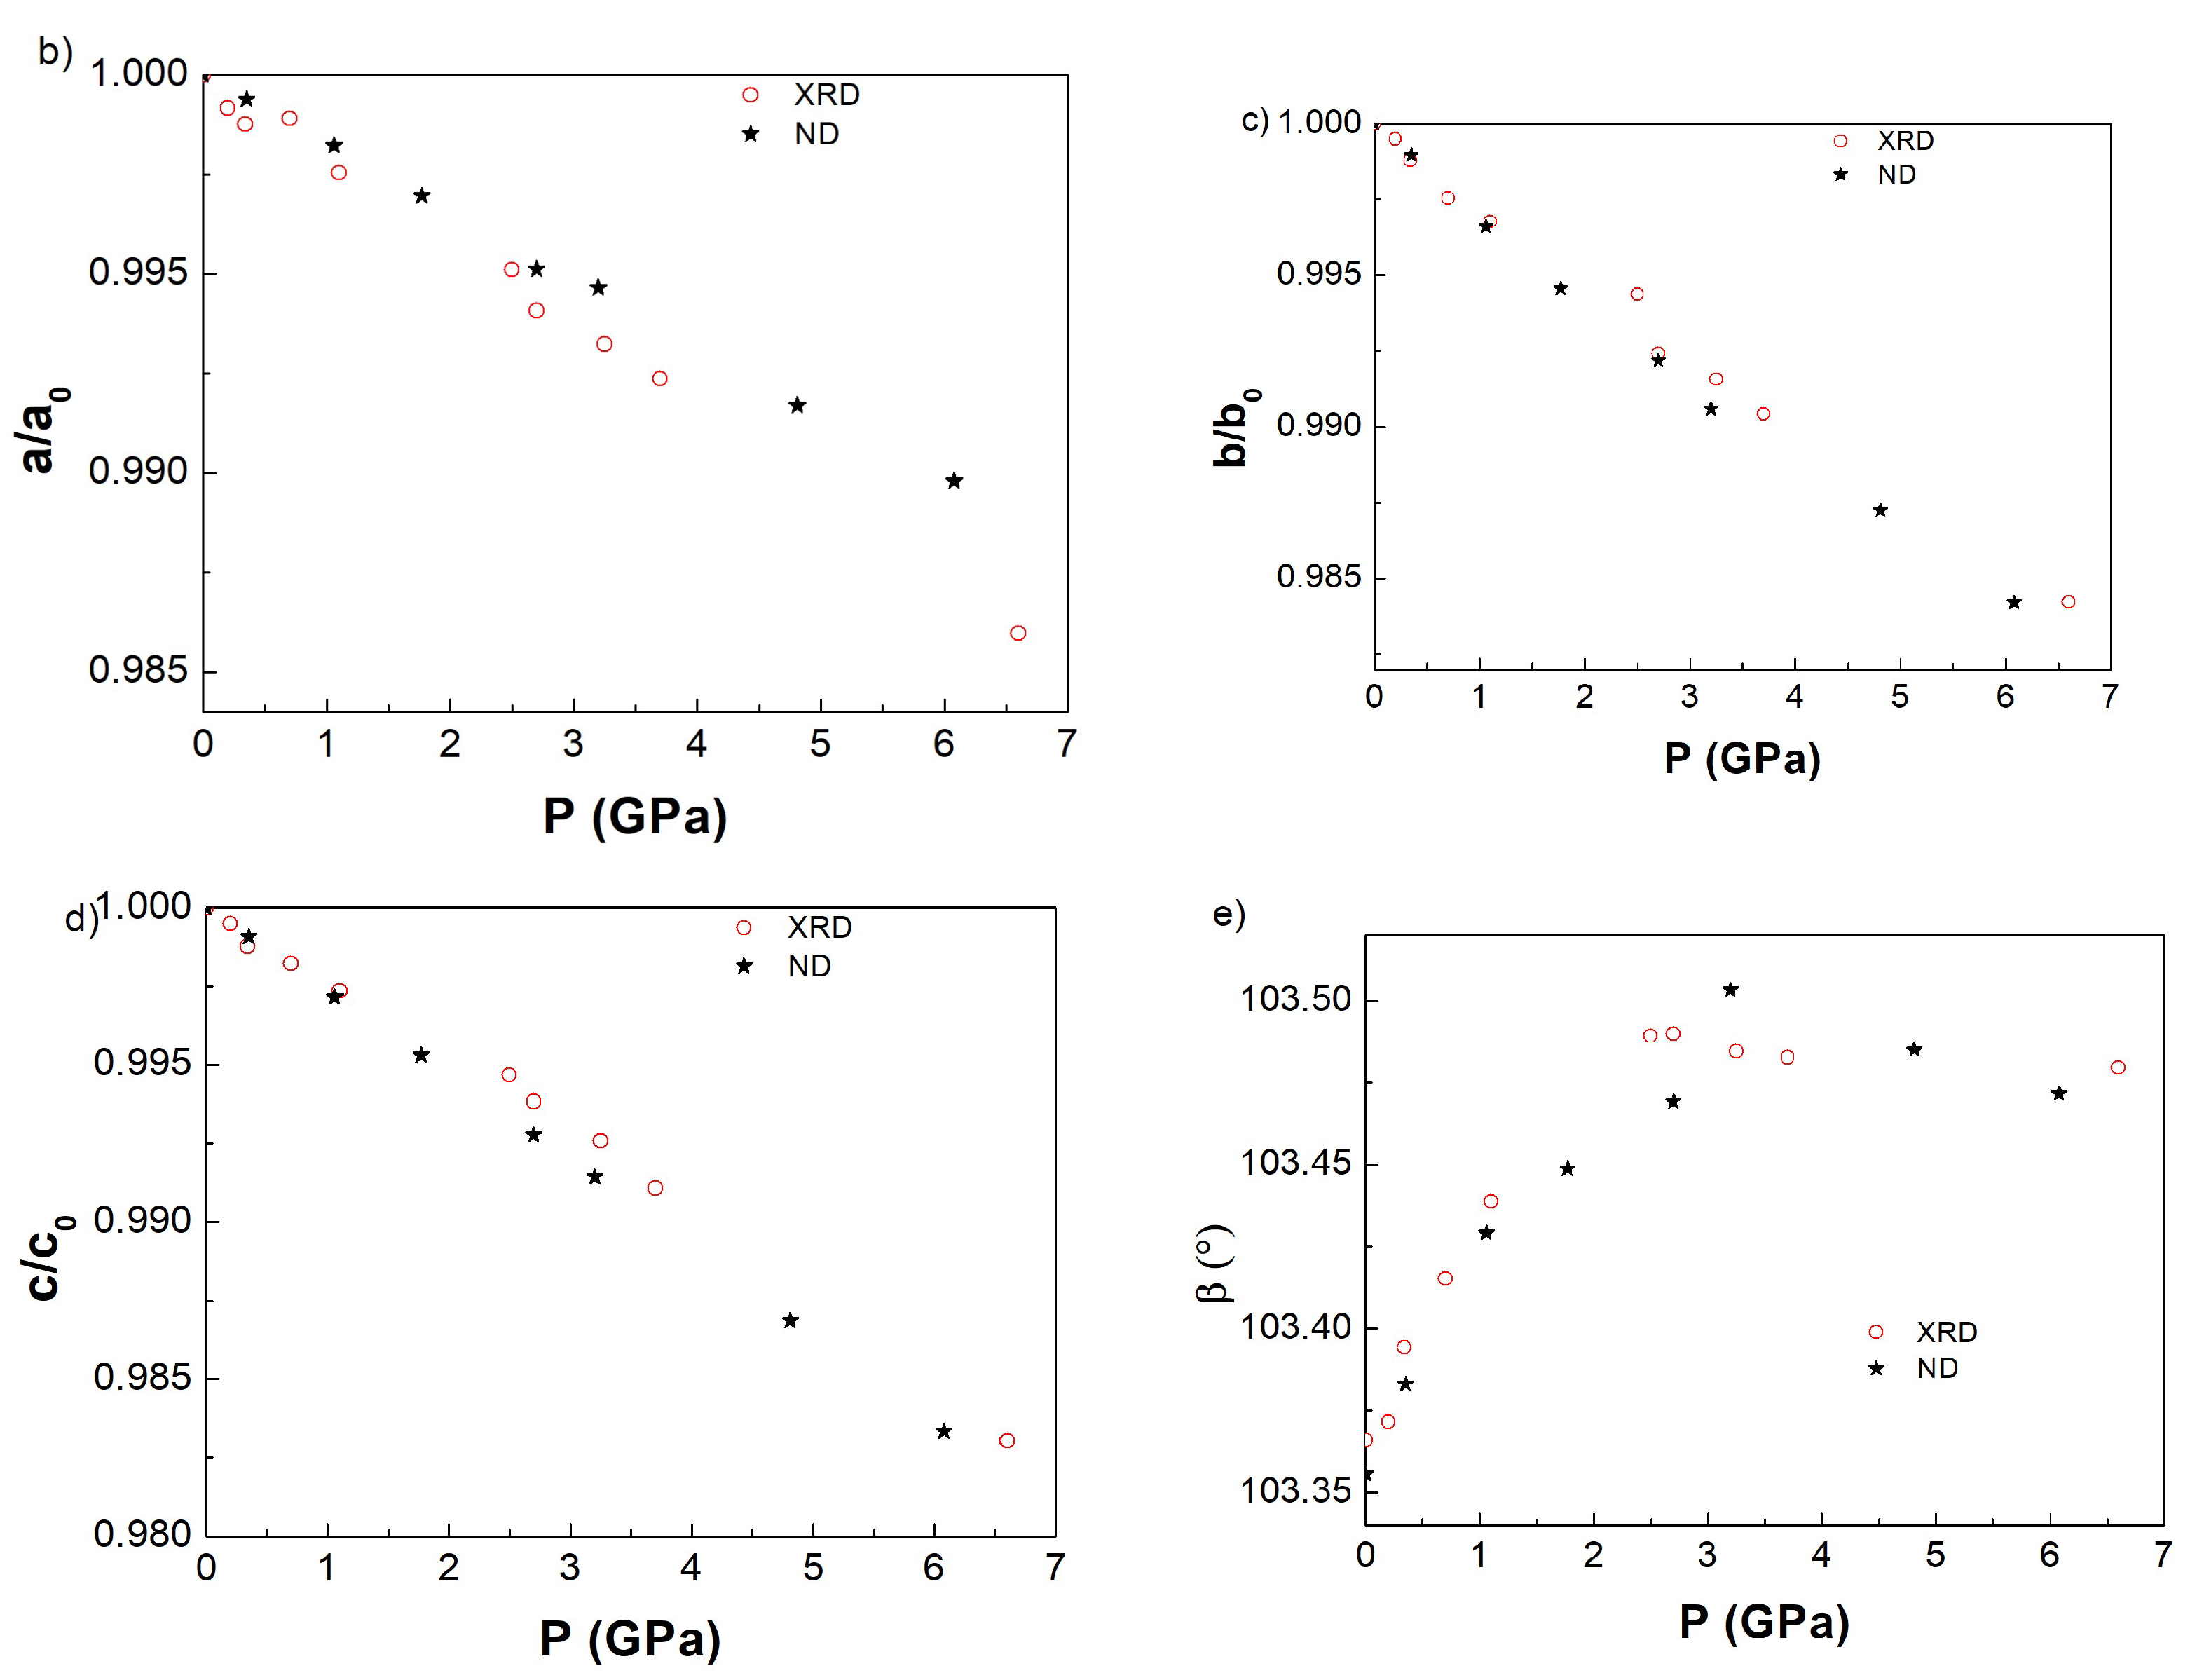
Figure 6.
Pressure dependence of the LuFe2O4 X-ray data at 50 K, (a) full-2ϴ-range, (b) 2°–8°-2ϴ-range.
Figure 6.
Pressure dependence of the LuFe2O4 X-ray data at 50 K, (a) full-2ϴ-range, (b) 2°–8°-2ϴ-range.

Figure 7.
Pressure dependence of the LuFe2O4 low pressure T1 and monoclinic M2 high pressure forms at 50 K.
Figure 7.
Pressure dependence of the LuFe2O4 low pressure T1 and monoclinic M2 high pressure forms at 50 K.
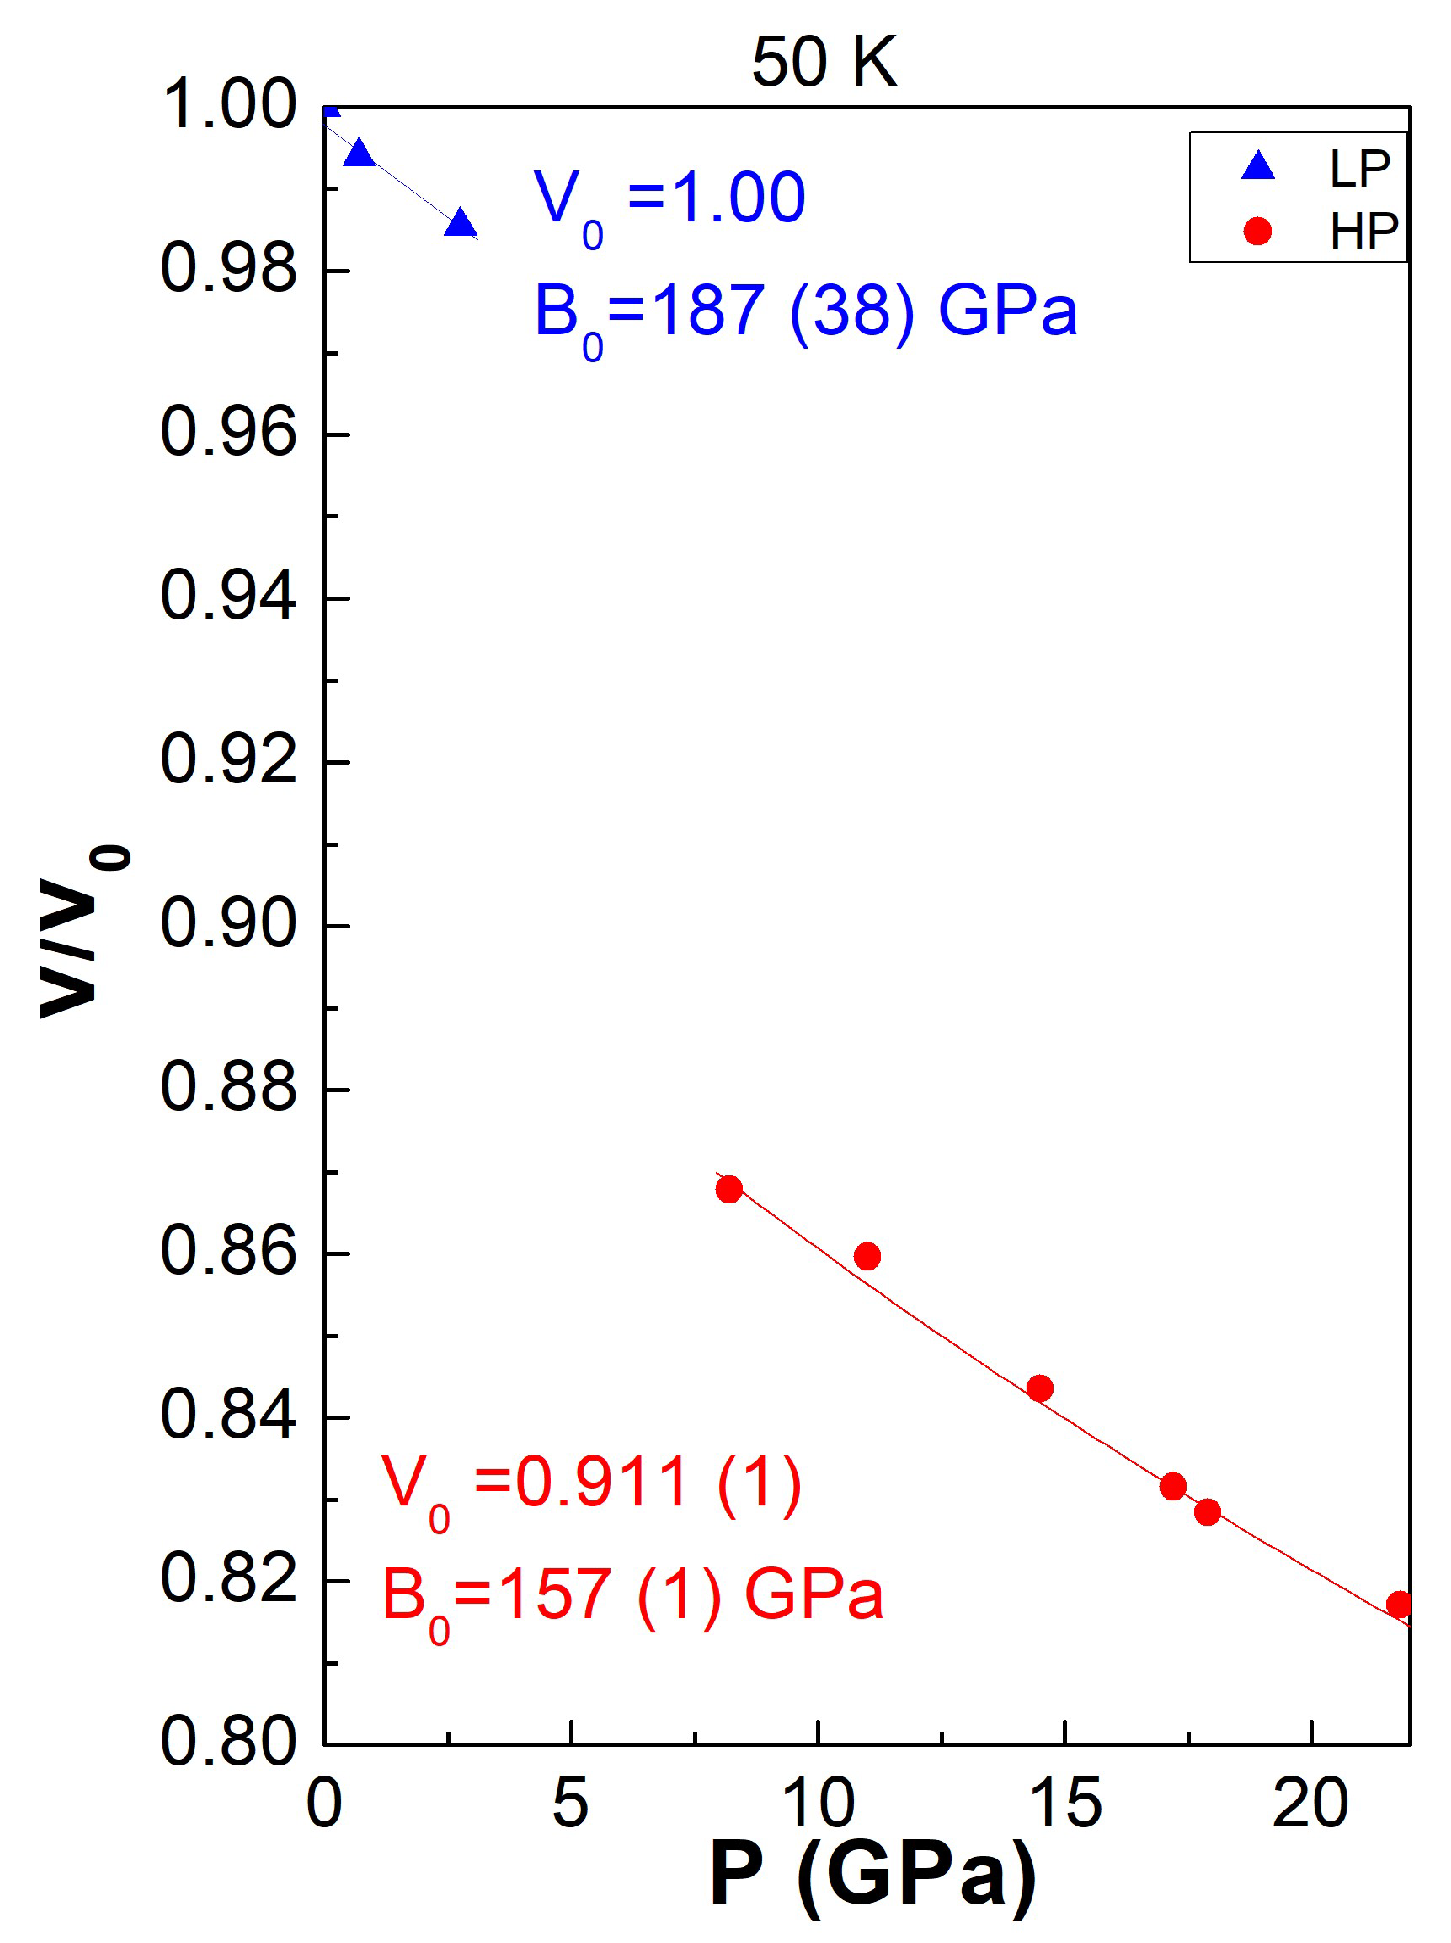
Figure 8.
Rietveld refinement of LuFe2O4 neutron powder diffraction data at P = 2.7 GPa. Experimental data are represented by open circles using the calculated profile by a continuous line, and the allowed structural Bragg reflections by vertical marks. The difference between the experimental and calculated profiles is displayed at the bottom of the graph.
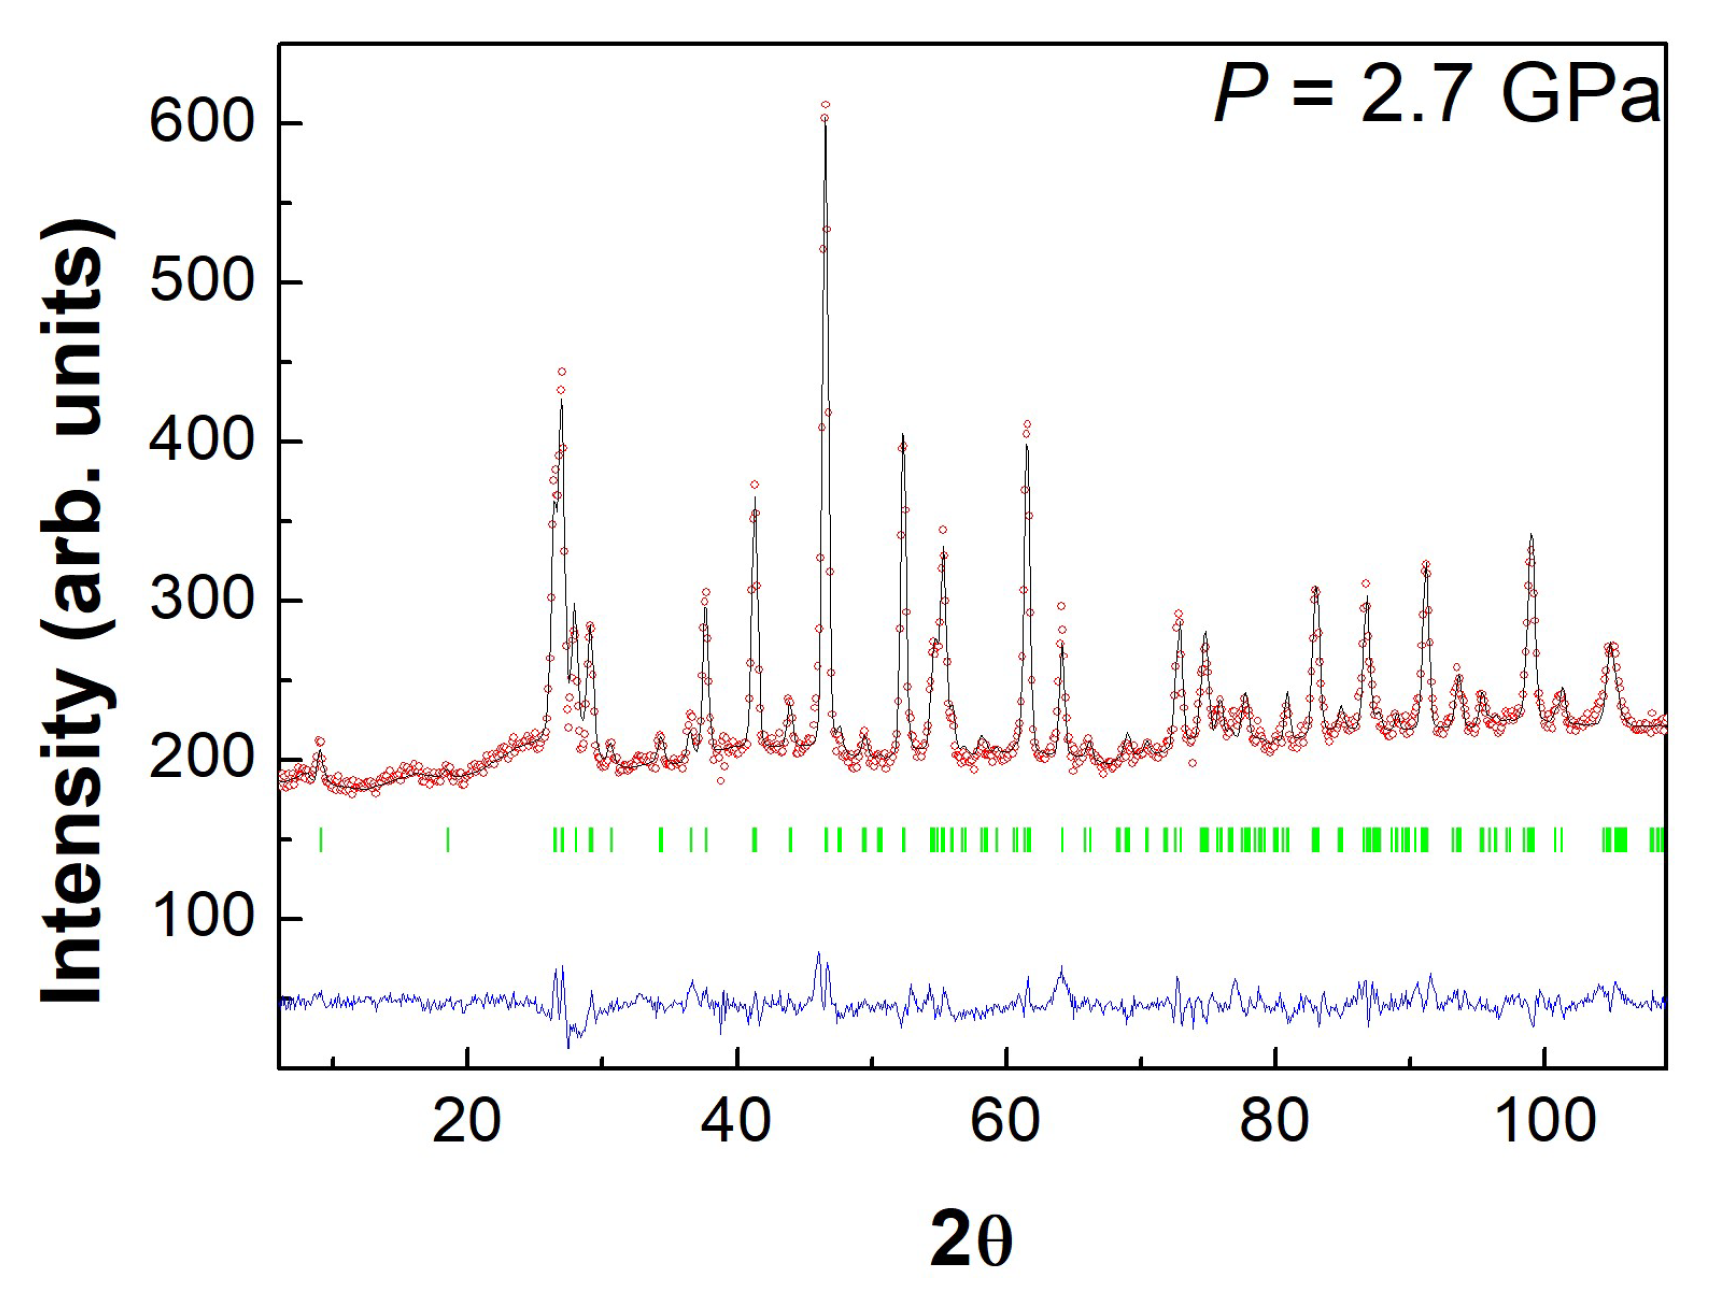
Figure 9.
Pressure dependence of the (a) Fe-Feintra; (b) Fe-Feinter; (c) Lu-Lu; (d) Lu-Fe; (e) Lu-O1; (f) Fe-O1; (g) Fe-O2 distances based on Rietveld refinements using ND data of the M1 phase. For each distance, the different relative compressibilities are calculated.
Figure 9.
Pressure dependence of the (a) Fe-Feintra; (b) Fe-Feinter; (c) Lu-Lu; (d) Lu-Fe; (e) Lu-O1; (f) Fe-O1; (g) Fe-O2 distances based on Rietveld refinements using ND data of the M1 phase. For each distance, the different relative compressibilities are calculated.

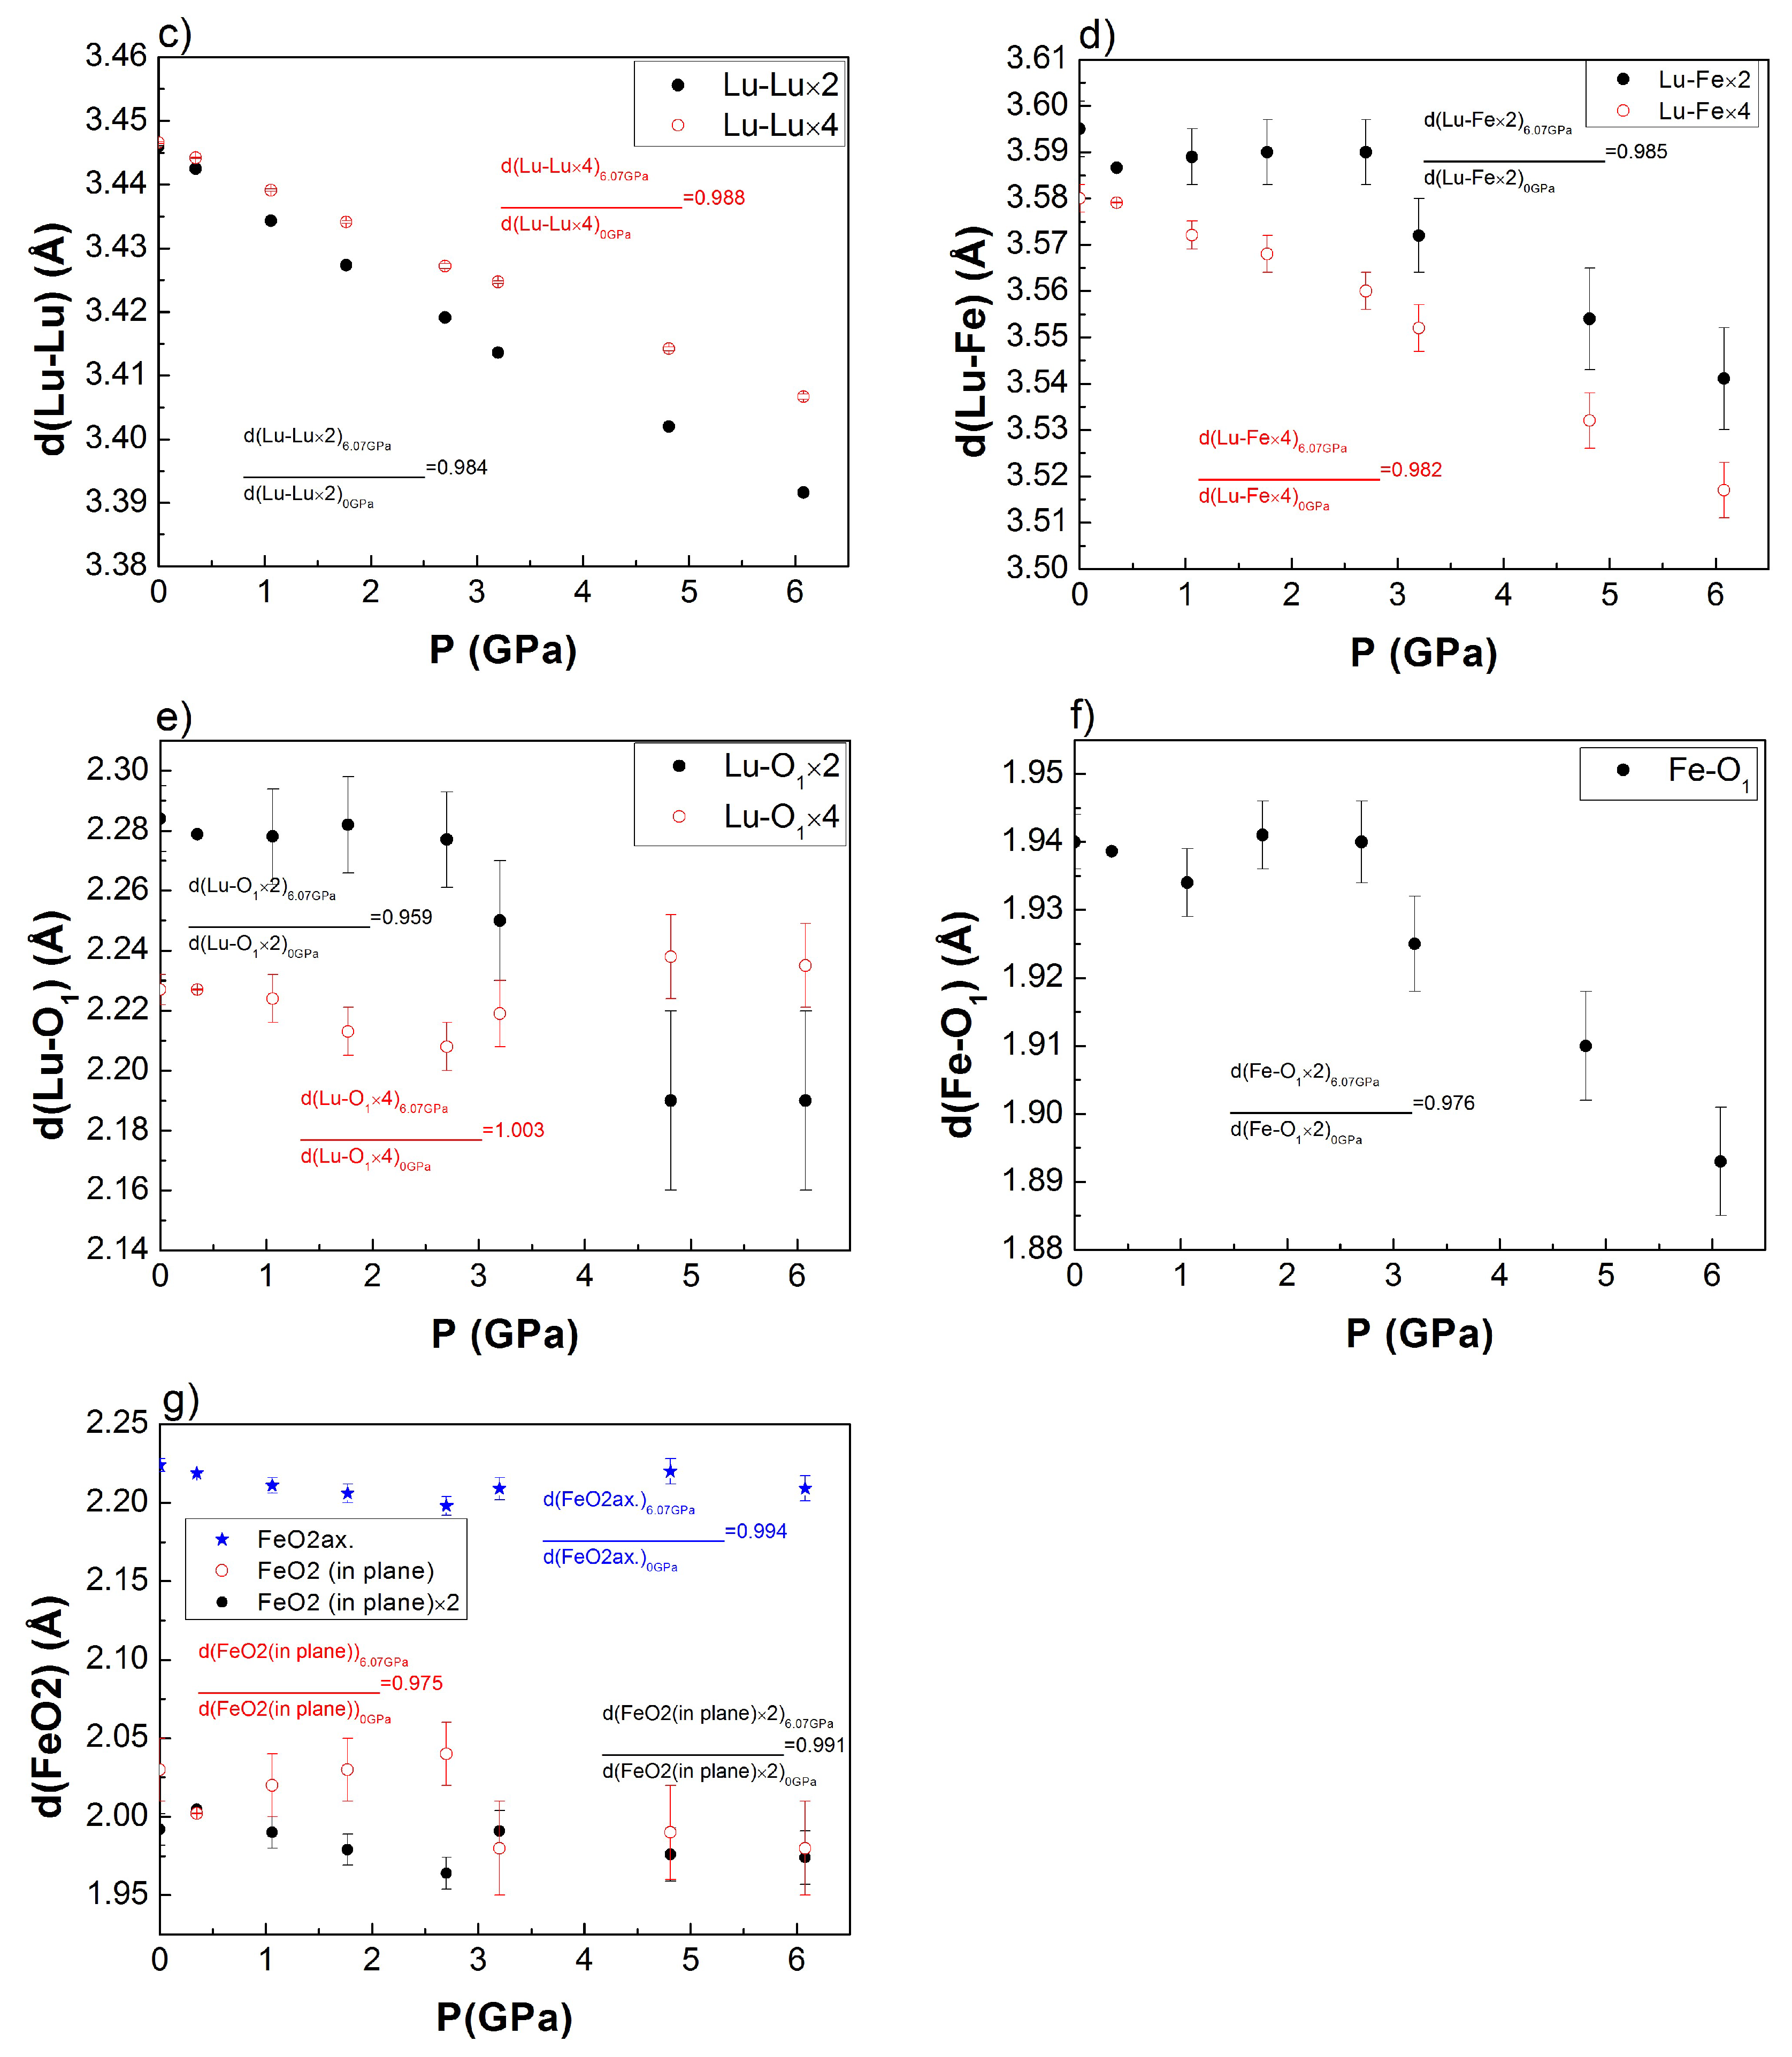
Figure 10.
Pressure dependence of the ND data. Note the appropriate hydrostatic conditions which are confirmed by the presence of the diffuse scattering from the ethanol-methanol pressure transmitting medium close to 20° at 0 GPa. The M2 high-pressure phase is also characterized by the extra low 2θ peak arising from antiferromagnetic ordering.

Figure 11.
(a) Pressure dependence of resistivity measurements as a function temperature; (b) resistivity measurements as a function of pressure at 290 K and 150 K respectively.
Figure 11.
(a) Pressure dependence of resistivity measurements as a function temperature; (b) resistivity measurements as a function of pressure at 290 K and 150 K respectively.

Figure 12.
(a) Pressure dependence of the infrared spectra of LuFe2O4 (vertically shifted) in the low pressure regime, i.e., within the M1 phase stability range; A,B,C correspond to the labelled infrared modes which could be associated to a phase transition as previously observed based on diffraction techniques (b) vertically shifted infrared spectra during compression-decompression; the dotted line marks the transition to the M2 phase; (c) high-pressure M2 phase recovered at ambient pressure; vertical ticks represent calculated optical infrared modes. Note on Figure 10c that the frequency positions of the calculated infrared modes are upshifted as they were determined at 0 K whereas the experimental spectra are obtained at room temperature.
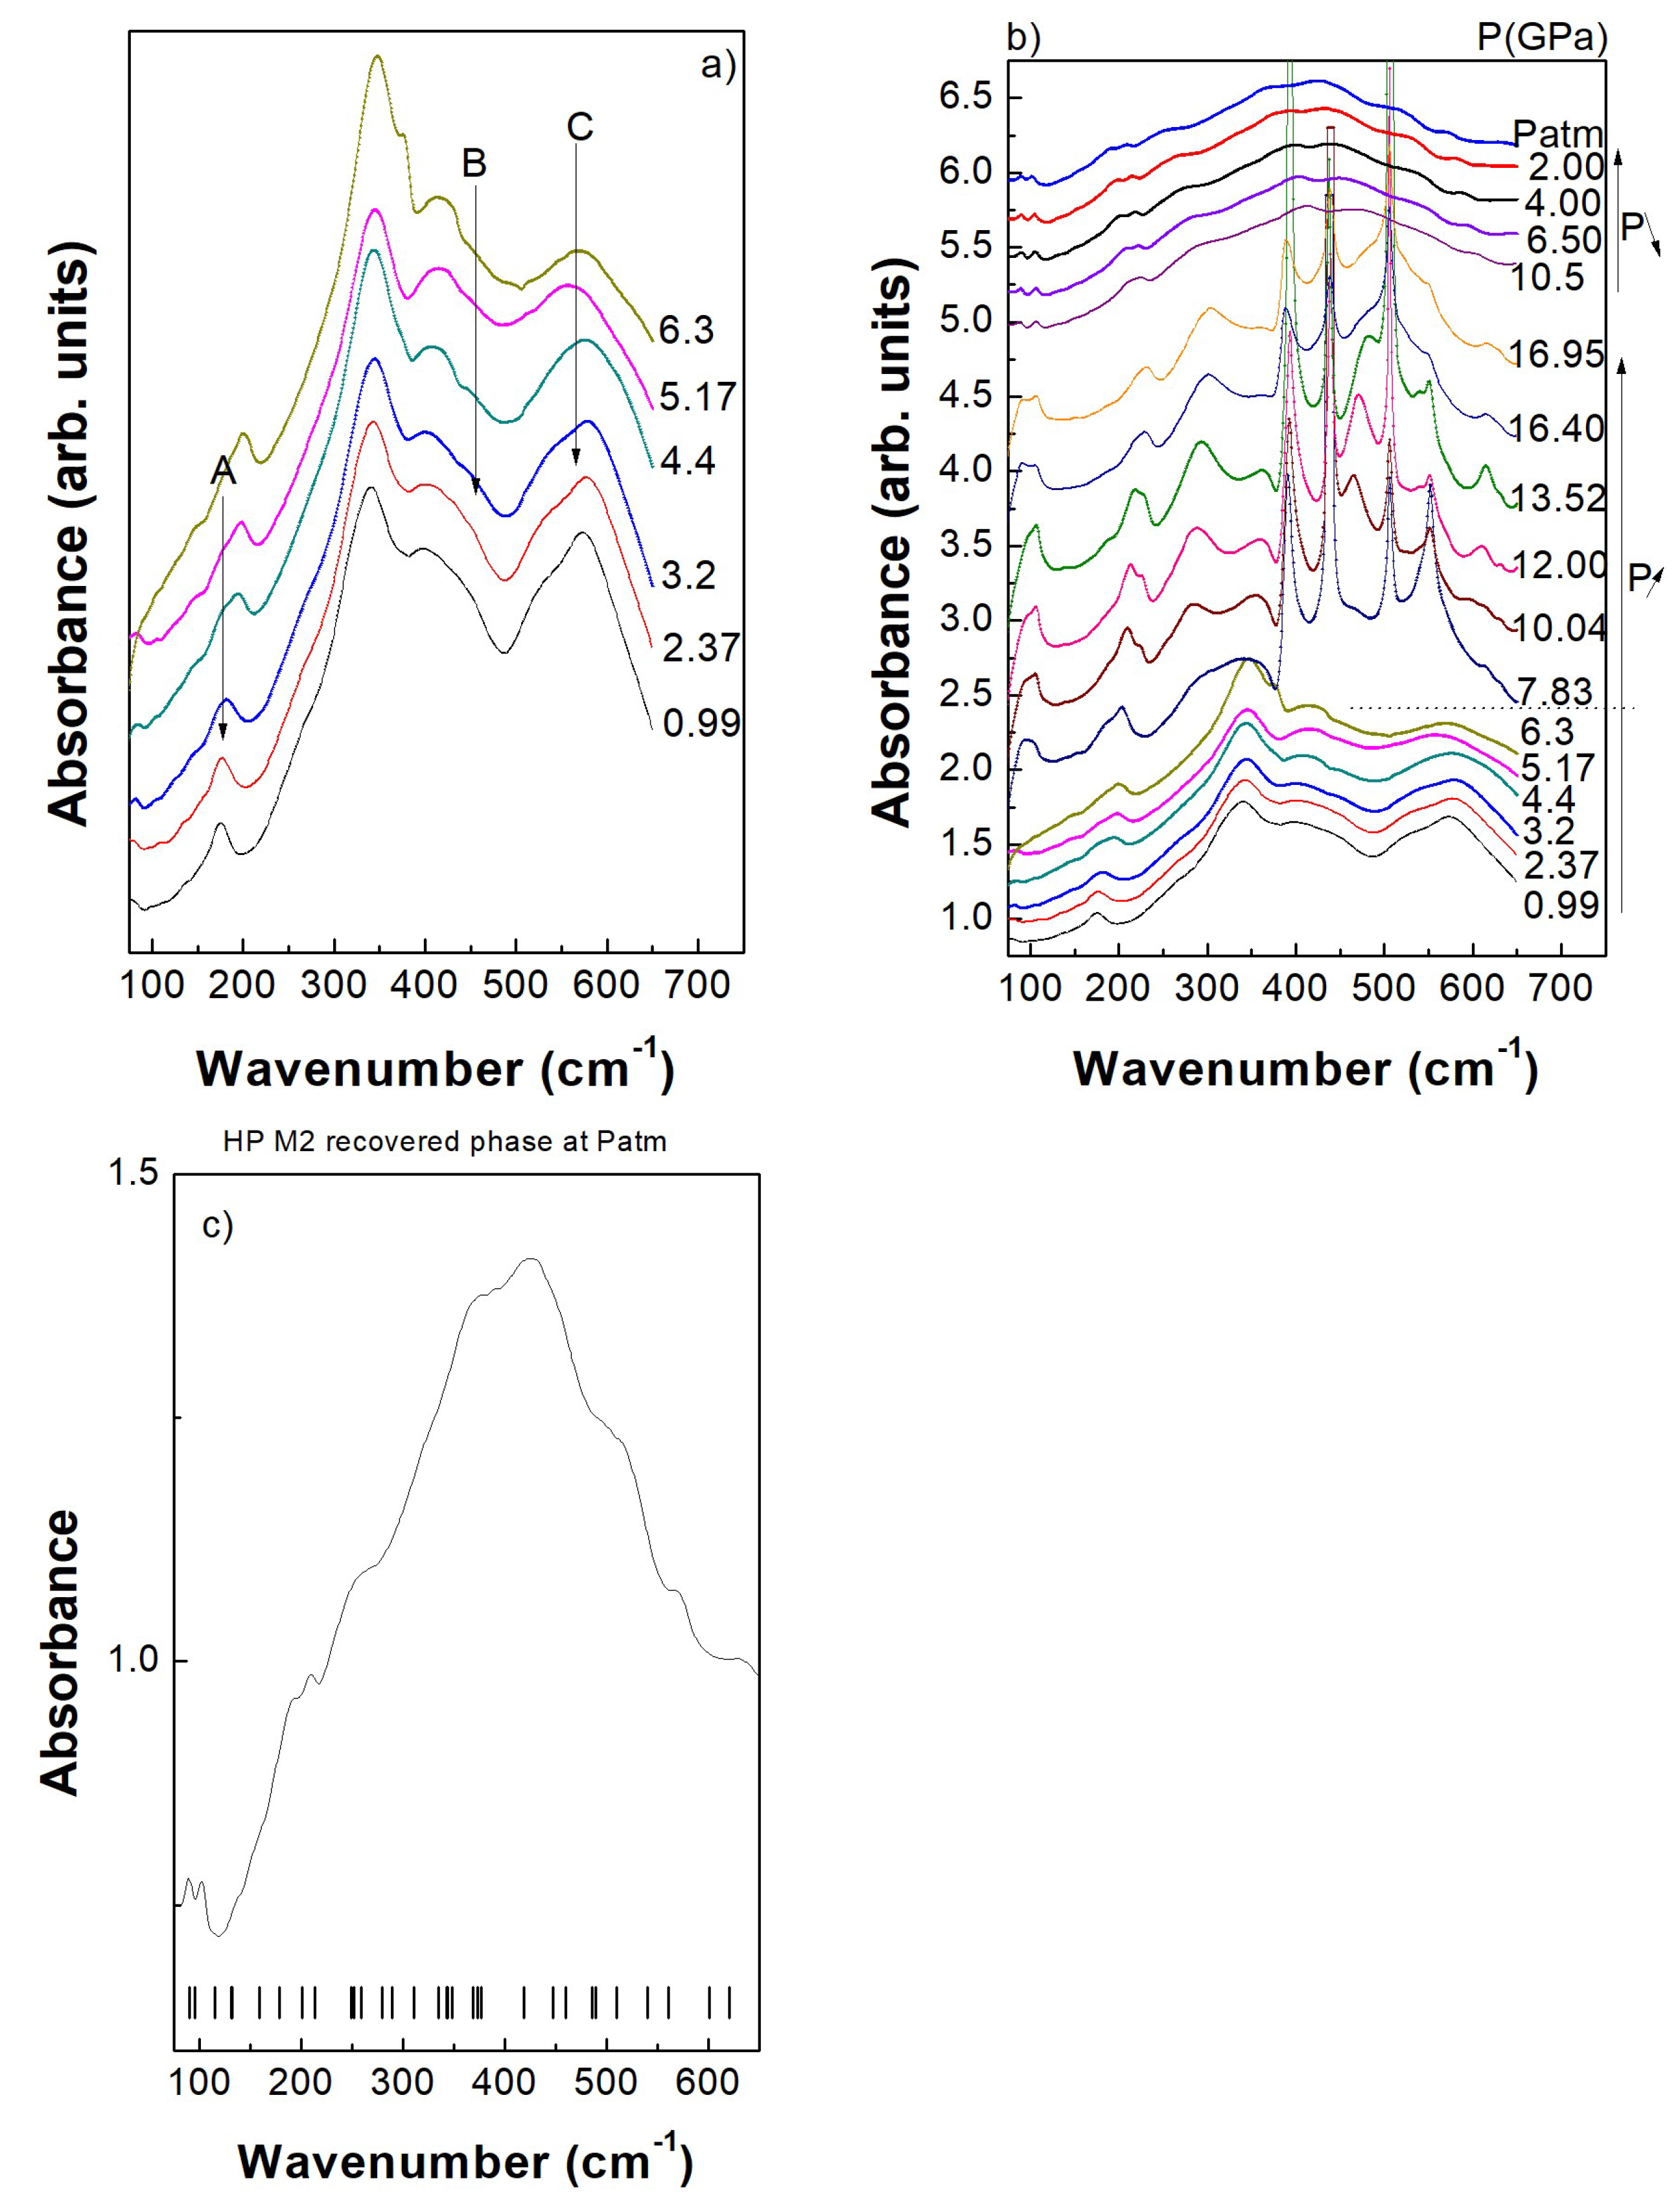
Figure 13.
Pressure dependence of the x-ray absorption spectra of LuFe2O4 obtained at the K-edge.

Figure 14.
Comparison between low-pressure (1.3 GPa) and high-pressure (25 GPa) (a) experimental and (b) simulated X-ray absorption spectra of LuFe2O4 at the K-edge.
Figure 14.
Comparison between low-pressure (1.3 GPa) and high-pressure (25 GPa) (a) experimental and (b) simulated X-ray absorption spectra of LuFe2O4 at the K-edge.

Figure 15.
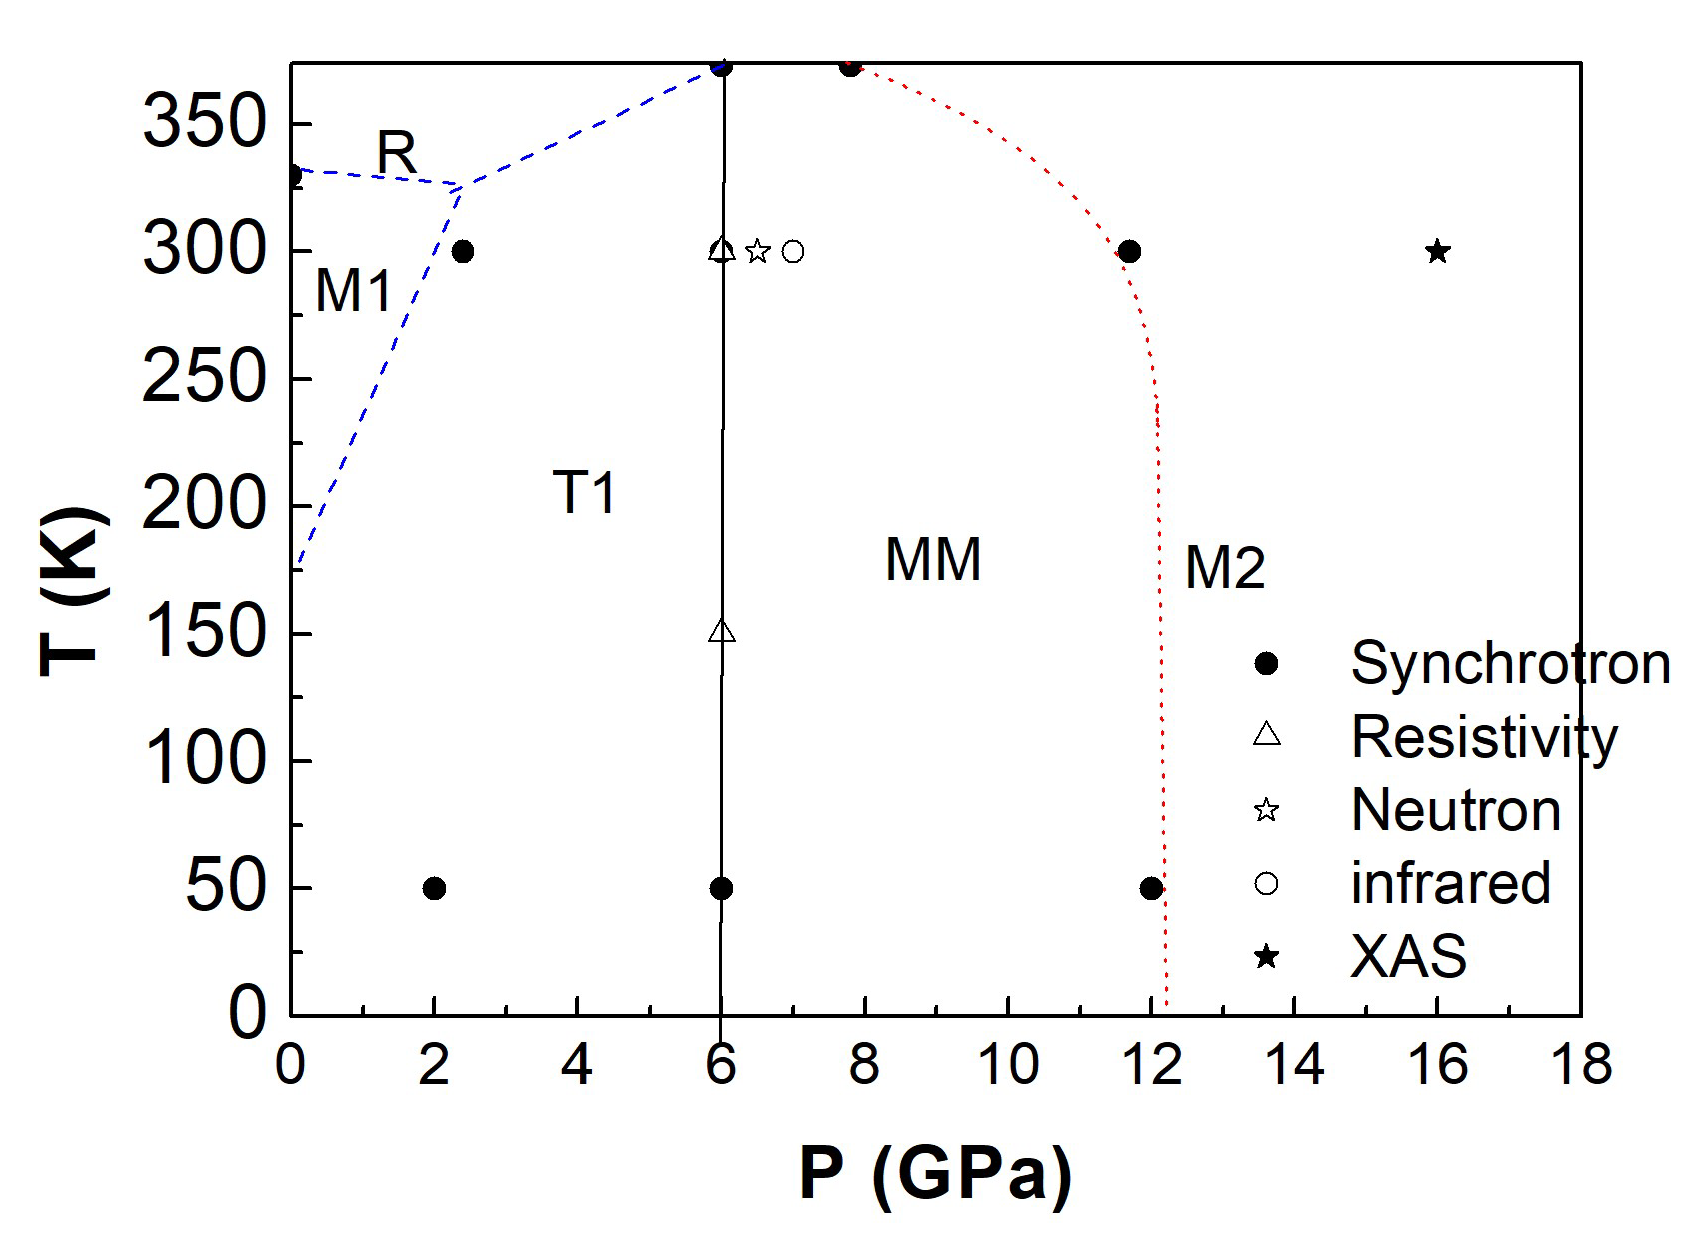
Pressure dependence of the LuFe2O4. The R (Rm, M1 (C2/m) and T1 (proposed smooth charge/structural change of M1), MM (metastable modulated monoclinic phases) and M2 (Pm high-pressure phase) phase stability regions are shown. Solid line corresponds to the determined phase boundary to the high pressure M2 phase. Additional potential M1–R M1–T1 [28] and T1-R frontiers are proposed using dashed lines. Finally, the metastable MM phase(s) obtained from synchrotron X-ray study are also shown.
Figure 15.
Pressure dependence of the LuFe2O4. The R (Rm, M1 (C2/m) and T1 (proposed smooth charge/structural change of M1), MM (metastable modulated monoclinic phases) and M2 (Pm high-pressure phase) phase stability regions are shown. Solid line corresponds to the determined phase boundary to the high pressure M2 phase. Additional potential M1–R M1–T1 [28] and T1-R frontiers are proposed using dashed lines. Finally, the metastable MM phase(s) obtained from synchrotron X-ray study are also shown.


Table 1.
Structural data of LuFe2O4 at P = 2.7 GPa obtained by neutron powder diffraction data.
| C2/m (n° 12) am = 5.9415 (4) Å bm = 3.4181 (2) Å cm = 8.6087 (5) Å βm = 103.505 (5)° V = 170.002 (2) Å3 | RBragg = 13.9 % χ2= 4.75 | ||||
| Atom | Wyckoff Site | x | y | z | Isotropic B Factors |
| Lu | (2a) | 0 | 0 | 0 | 2.266 |
| Fe | (4i) | 0.218 (2) | 0 | 0.6443(5) | 1.100 |
| O1 | (4i) | 0.300 (2) | 0 | 0.8760(7) | 1.658 |
| O2 | (4i) | 0.129 (3) | 0 | 0.3815 (6) | 2.750 |
© 2018 by the authors. Licensee MDPI, Basel, Switzerland. This article is an open access article distributed under the terms and conditions of the Creative Commons Attribution (CC BY) license (http://creativecommons.org/licenses/by/4.0/).
Share and Cite
MDPI and ACS Style
Poienar, M.; Bourgeois, J.; Martin, C.; Hervieu, M.; Damay, F.; Garbarino, G.; Hanfland, M.; Hansen, T.; Baudelet, F.; Bantignies, J.L.; et al. P-T Phase Diagram of LuFe2O4. Crystals 2018, 8, 184. https://doi.org/10.3390/cryst8050184
AMA Style
Poienar M, Bourgeois J, Martin C, Hervieu M, Damay F, Garbarino G, Hanfland M, Hansen T, Baudelet F, Bantignies JL, et al. P-T Phase Diagram of LuFe2O4. Crystals. 2018; 8(5):184. https://doi.org/10.3390/cryst8050184
Chicago/Turabian StylePoienar, Maria, Julie Bourgeois, Christine Martin, Maryvonne Hervieu, Françoise Damay, Gaston Garbarino, Michael Hanfland, Thomas Hansen, François Baudelet, Jean Louis Bantignies, and et al. 2018. "P-T Phase Diagram of LuFe2O4" Crystals 8, no. 5: 184. https://doi.org/10.3390/cryst8050184
Note that from the first issue of 2016, this journal uses article numbers instead of page numbers. See further details here.