Ageing and Langmuir Behavior of the Cage Occupancy in the Nitrogen Gas Hydrate
by

Claire Petuya
1, 
Françoise Damay
2,
Sarah Desplanche
1,
Christian Aupetit
1 and
Arnaud Desmedt
1,* 1
Institut des Sciences Moléculaire-UMR CNRS 5255-Univ. Bordeaux, 351 cours de la Libération, 33404 Talence CEDEX, France
2
Laboratoire Léon Brillouin, UMR 12 CEA-CNRS, Bât. 563 CEA Saclays, 91191 Gif-sur-Yvette CEDEX, France
*
Author to whom correspondence should be addressed.
Crystals 2018, 8(4), 145; https://doi.org/10.3390/cryst8040145
Submission received: 22 February 2018
/
Revised: 15 March 2018
/
Accepted: 16 March 2018
/
Published: 23 March 2018
(This article belongs to the Special Issue Functional Multi-Scale Crystals)
Abstract
:Clathrate hydrates are ice-like systems in which nanometric water cages encapsulate guest molecules. Functionalizing clathrate hydrates is an important issue, accomplished by playing with their chemical composition and their cage structure. In this issue, the cage occupancy and its kinetics constitute key information for future developments. In many aspects, nitrogen gas hydrate represents an interesting system not only for its applied relevance (e.g., gas separation and methane/carbon dioxide exchange), but also for its fundamental interest (e.g., structural metastability and kinetics). Thanks to the complementarity of neutron diffraction and Raman scattering, the vibrational signatures of the so-called SI and SII clathrate structures of the nitrogen hydrates are reviewed. Moreover, the investigation of the ageing of the SII structure is reported together with its interpretation in the frame of the Langmuir behavior of the cage filling at low temperature. The cage filling is monitored with the help of a time-dependent analysis of the Raman scattering signals (over several months). The SII large cage filling decreases with a kinetic rate of h−1 at 77 K and atmospheric pressure, so that equilibrium is reached after ca. eight weeks. Isotherm measurements of the guest Raman signatures lead to revealing a Langmuir constant higher in the small cage than in the large cage at 150 K. Such a behavior might thus be correlated with the nitrogen depletion with time, observed in the large cage of the SII nitrogen hydrate.

1. Introduction
Clathrate hydrates are crystalline compounds consisting of water molecules forming cages inside of which guest molecules are trapped [1,2]. The water cages are stabilized by polygonal rings of water molecules connected at their edges through hydrogen bonds. The 3D arrangements of the cages lead to various nanoporous ice-like structures depending on the chemical nature of the encapsulated molecules and on the pressure and temperature conditions. They may form with a large variety of guest molecules and adopt various types of structures, the most common ones being the so-called SI and SII structures [3]. More specifically, the SI structure corresponds to an ~12 Å cubic unit cell composed of two 512 small cages (denoted SC; the 512 nomenclature refers to a cage formed with 12 pentagonal water rings) and of six 51262 large cages (denoted LC). The SII structure (~17 Å cubic unit cell) is constituted of sixteen 512 SCs and of eight 51264 LCs. Their first synthesis goes back to the early 20th Century, and their discovery was made in pipeline plugs and then on the ocean floor in the natural state [2]. Since these discoveries, research interests for gas hydrates have continuously expanded not only for their fundamental interests ranging from physical-chemistry to astrophysics and geosciences [4,5], but also for their applications in broad areas of flow assurance, chemical engineering, technology, energy or the environment [2,6].
Functionalization of clathrate hydrates is an important issue for future developments. This can be reached either through the water cage or the encapsulated molecules via their chemistry or their structure. The cage-like structure of clathrate hydrate is by itself an intrinsic functionality through the selective encapsulation (or not) of guest molecules; the ability of a chemical species to be enclathrated plays a key role in many applications such as desalinization or gas separation, storage and transport (see e.g., [2,7]). The formed clathrate structure depends on the size of the guest molecule, as well as on its chemical ability to accommodate the water cavities [1,2]. Small guests are usually SII formers because of the large number of SCs (2:1 SC to LC ratio), while the 1:3 SC to LC ratio of the SI structure favors larger guest molecules to be encapsulated [1]. Controlling the guest chemical composition of mixed gas hydrates (i.e., clathrate hydrates encapsulating two species at least) allows promoting structural transition between SI and SII by playing with the steric hindrance of the guest molecules for instance [8] or tuning their equilibrium curve as illustrated by theoretical calculations of the thermodynamics stability of the mixed CO2/N2 hydrate [9]. Co-including guest molecules constitute a functionalization opening new technological opportunities for storage and transportation under mild conditions (close to atmospheric conditions) of natural gases [10] or hydrogen [11]. Hydrogen storage in clathrate hydrates represents probably a flagship or prototype example. Storage within pure H2 clathrate hydrates can be achieved by using a high pressure of the order of thousands of bar [12,13,14]. The co-inclusion of organic promoter molecule such as THF allows the reduction of the operation pressure by several orders of magnitude [15,16,17]. Another functionality of clathrate hydrate concerns their anomalous heat conduction (“glass-like” behavior of clathrate hydrate crystals) [18], resulting from the localized excitations of the guest molecules trapped in the cage structure and their complex interaction with lattice phonons [19,20]. The addition of ionic species in the host substructure leads to switching of the thermal conductivity from a “glass-like” behavior to a “standard crystalline” behavior [21]. Besides, due to the ionic interaction between host and guest molecules, co-including additives like strong acids, bases or quaternary ammonium salts in the cages promotes many specific properties, such as discrete magnetic behavior, metal ion encagement, gas cohosting, improved thermal stability, improved cage flexibility and superprotonic conduction [22,23,24,25,26,27,28,29,30,31,32,33]. These unique features make them particularly promising for potential applications in various fields such as solid electrolytes, gas sensor and energy storage [27,28].
Considering the problematic capture and sequestration of carbon dioxide, the idea of extracting methane from the natural gas hydrates and simultaneously replacing it by its greenhouse gas product, carbon dioxide, could be a two in one approach, which has been extensively studied over the last few decades [34]. Nitrogen molecules are particularly relevant in this technology of methane replacement by carbon dioxide in natural gas hydrates since they play a promoting role [35]. In addition to its role played in many applications aspects, nitrogen gas hydrate represents an interesting system due to its fundamental properties. Many studies have been done on this gas hydrate at equilibrium, especially on structural properties [35,36,37,38,39] and cage occupancy using neutron and X-ray diffraction [39,40,41], Raman scattering [35,38,42,43,44,45,46,47,48] or simulations [49,50,51]. Especially, it has been recently shown that the SI structure is kinetically favored, while the SII structure is thermodynamically stable (the transformation is completed with a time rate of 1.37 ± 0.17 × 10⁵ s−1 at 100 K and at 1 bar), and the thermodynamic conditions (pressure-temperature denoted P-T) drive the filling of the water cage by nitrogen molecules [48]. In the case of the isosteric carbon monoxide hydrate [52,53], it has been shown that the filling of the large cages, evolving with time and P-T conditions, is a key parameter triggering the formed hydrate structure. The cage occupancy and its kinetics and time-evolution are thus key properties for which information is requested in the case of the nitrogen hydrate. Neutron diffraction (see, e.g., [54]) and Raman scattering (see, e.g., [55]) are complementary techniques for identifying gas hydrates’ structure, for analyzing their chemical composition and for investigating their time dependency. In the following, recent results obtained in the case of the nitrogen gas hydrate will be presented through the investigation of the ageing of the SII structure through the analysis of the cage occupancy as a function of time for the nitrogen hydrate stored at liquid nitrogen temperature and ambient pressure. Moreover, thanks to the isotherm measurements of the cage filling as a function of pressure, the cage occupancy is discussed in the frame of the Langmuir model and correlated with the observed ageing of the SII structure.
2. Materials and Methods
2.1. Sample Preparation
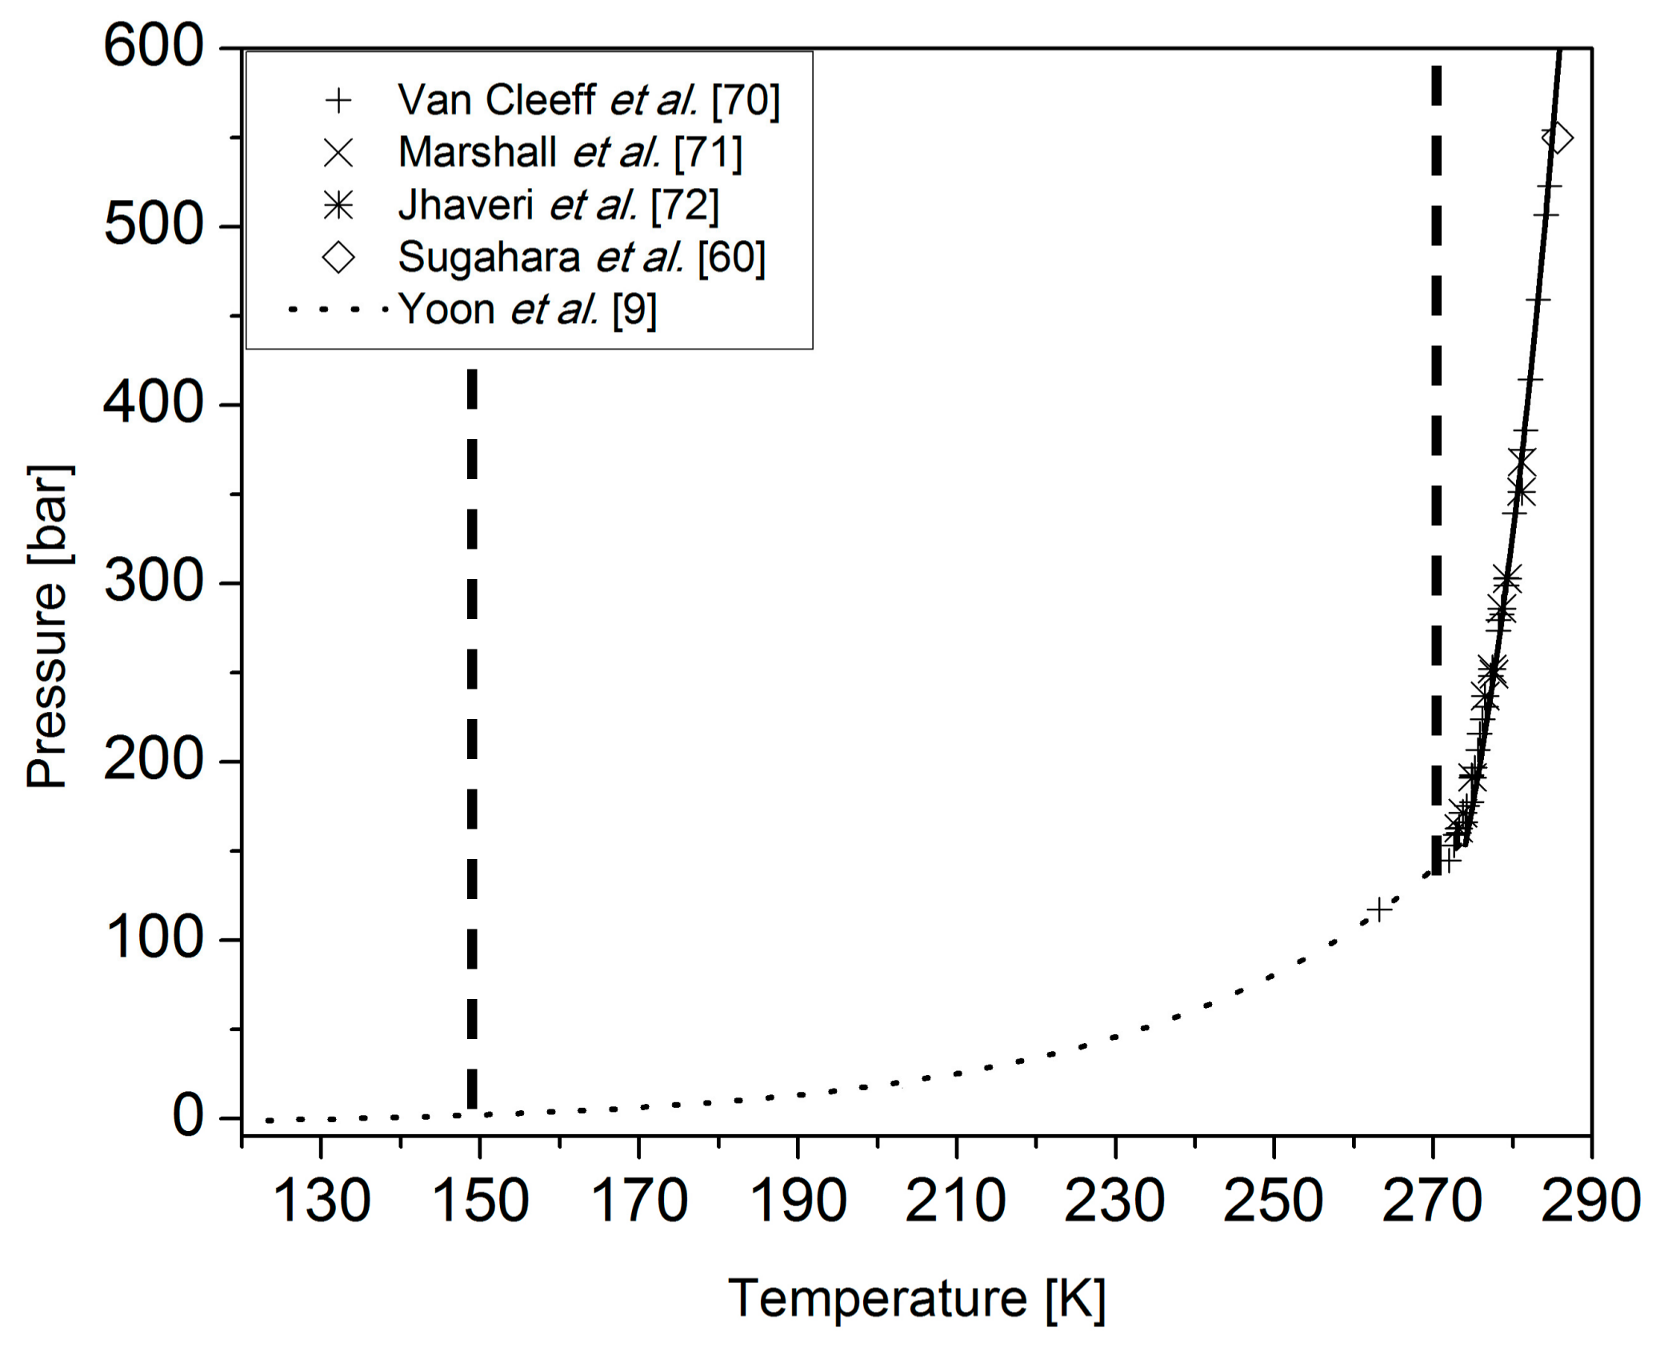
For neutron diffraction experiments, the sample was formed using a powder (grain size typically of the order of 100–200 µm) of deuterium oxide ice (99.9% D) and applying a gas pressure (purity > 99.997%) of 200 bar of nitrogen during 4 h and 3.5 days. The sample pressures were controlled by a PM High Pressure pump (Top Industrie, Vaux-le-Penil, France), which can contain 100 cm3 of gas up to 500 bar. The cell temperature was maintained at 260 K (±5 K) with a thermal bath, to ensure the formation within the thermodynamic stability region (Figure 6). For Raman measurements, the nitrogen hydrate was prepared according to the same procedure by using Milli-Q water instead of deuterated water. In both cases, samples have been recovered under nitrogen atmosphere at 77 K. The samples have then been stored into a nitrogen container (made of a porous material filled with liquid nitrogen) at 77 K and at atmospheric pressure for several weeks.
2.2. Neutron Diffraction
The experiments were performed at Laboratoire Léon Brillouin (CEA, Saclay, France) using the cold neutron two-axis powder diffractometer G 4-1. Measurements were done with a wavelength of 2.428 Å. Due to a better instrumental resolution at low scattering angle 2θ, the angular range 2θ < 60° has been considered. The samples (sealed in a cylindrical vanadium holder) were cold transferred into the cryostat at 100 K, the temperature at which the diffractograms have been recorded for typically 1 h. Diffractograms have been recorded with nitrogen hydrates for various storing times between 6 h and 4 weeks. To analyze the various phases of the samples (hydrate phase and ice phase), pattern-matching of the powder diffractogram has been performed with the Le Bail algorithm [56] and the FullProf program [57].
2.3. Raman Spectra
The spectra were recorded with a Labram HR confocal microspectrometer (Horiba Jobin Yvon, Villeneuve d’Ascq, France) using a 514-nm wavelength laser as excitation source. A 50× objective mounted on the confocal microscope permitted us to focus the incident laser beam and to collect the Raman scattering. The high resolution Raman scattering was dispersed by a holographic grating of 2400 lines/mm and analyzed by a Peltier-cooled CCD detector (Andor, Belfast, UK). Thus, the spectral resolution was 0.8 cm−1 (full width at half-maximum). The wavenumber calibration of the spectrometer was done by using the 520.7 cm−1 mode of a silicon sample and the neon source excitation at 2348.4 cm−1. The Raman spectra have been recorded on nitrogen hydrates with various storing times (between 6 h and 24.5 weeks) by cold transferring at 77 K the samples into a borosilicate capillary under inert atmosphere. The sample temperatures were maintained at 77 K (±0.1 K) during the acquisition thanks to a capillary temperature-controlled stage (Linkam Scientific Instruments Ltd., Tadworth, UK). Because of the occurrence of ice in the hydrate samples (the ice is not totally converted into hydrate), particular attention has been paid to collecting Raman spectra in sample region where the hydrate signal is maximized (thanks to the micrometer spatial resolution of the microscope) by minimizing the Raman band at ca. 315 cm−1 (Figure 2), characteristic of ice [58].
3. Results and Discussion
3.1. Coupling Neutron Diffraction and Raman Scattering to Access Nitrogen Gas Hydrate Signatures
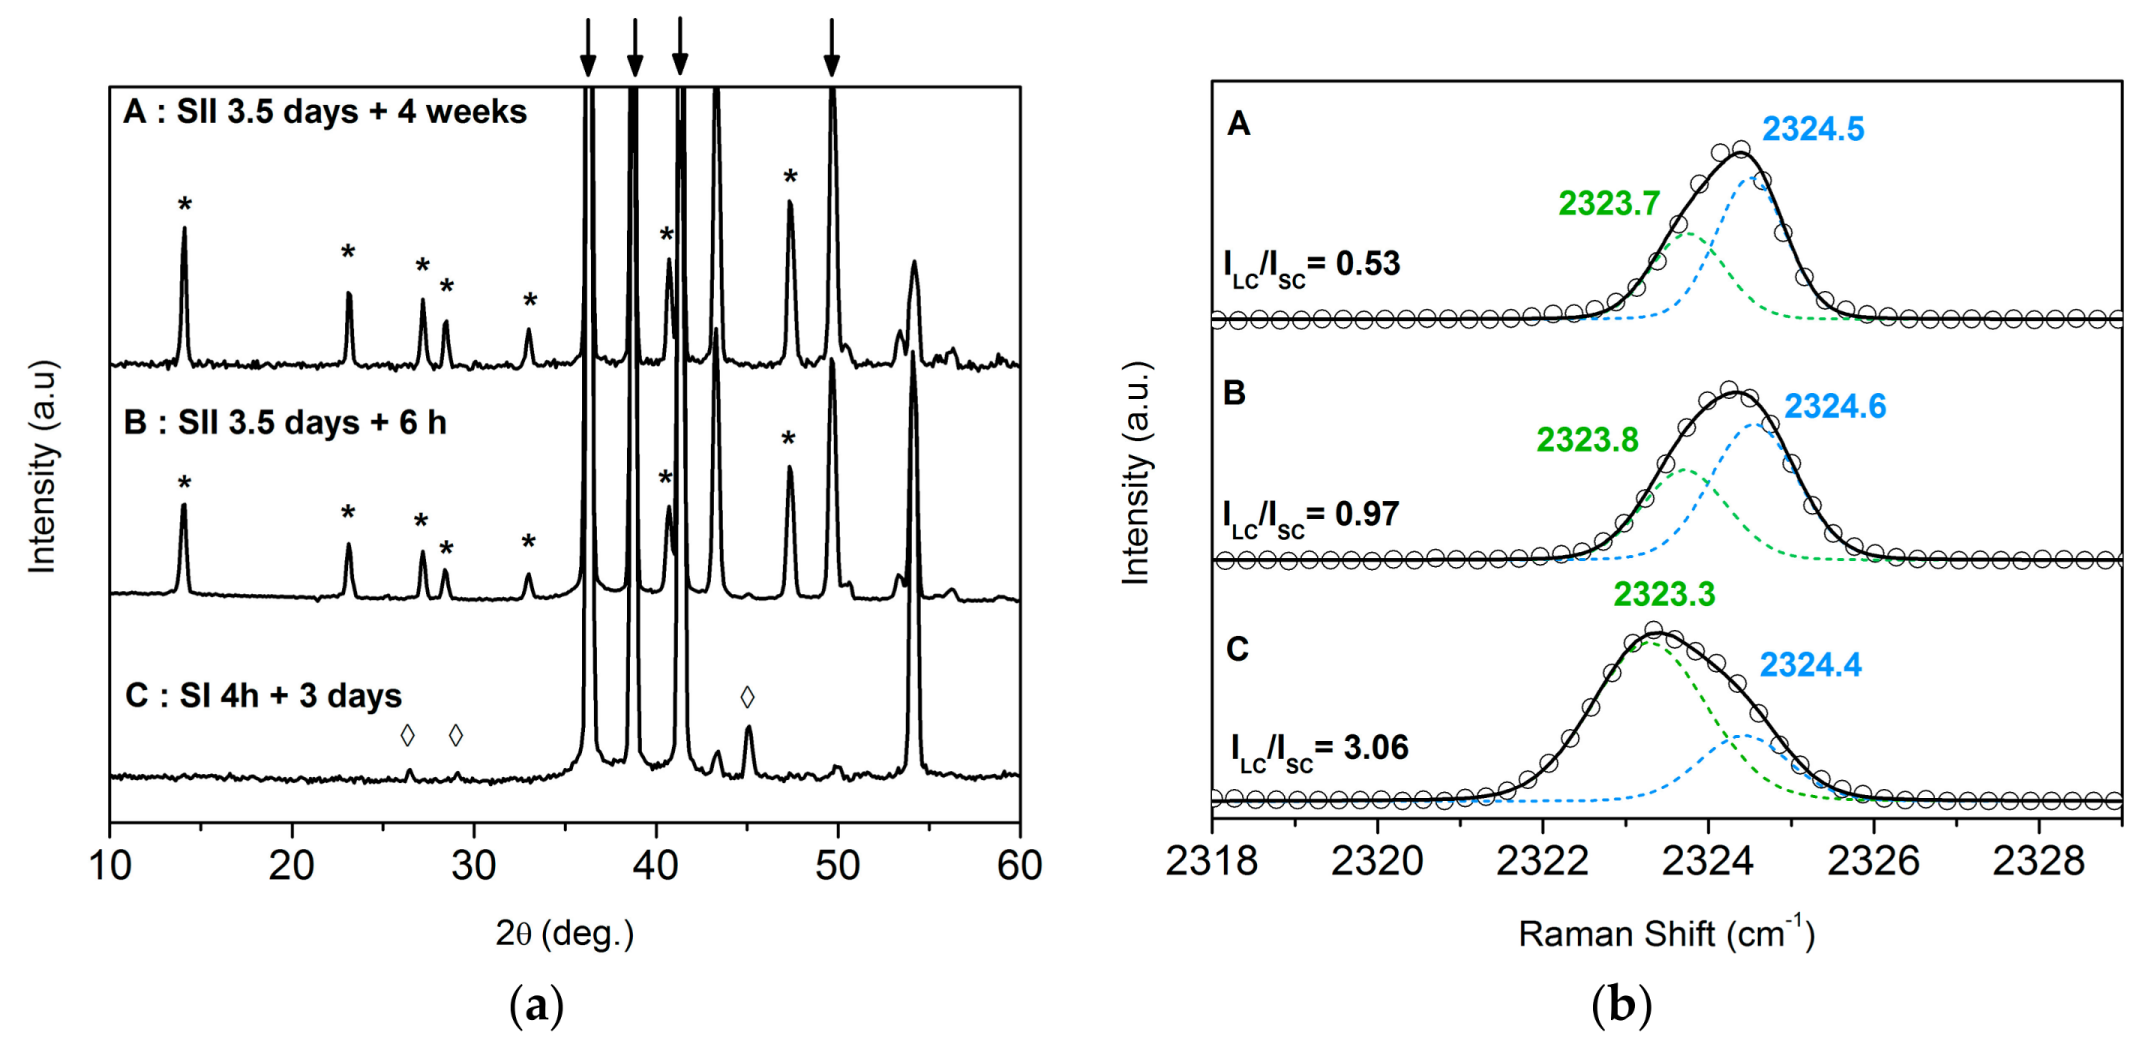
For this study, nitrogen hydrate has been prepared by pressurizing powdered ice at 200 bar and 260 K. The formed hydrate is then stored at liquid nitrogen temperature and atmospheric pressure (see the Materials and Methods Section for details). The Figure 1 shows the transition from SI to SII of the nitrogen hydrate as revealed by neutron diffraction and Raman spectroscopy. According to diffraction data, the SI structure (Sample C in Figure 1) is formed at the early stage of the hydrate formation, while the thermodynamically-stable SII structure (Samples B and A in Figure 1) is formed after 3.5 days of hydrate formation [48].
It is possible to identify the formed hydrate by analyzing the Raman signatures of the water cages’ substructure, notably via the analysis of the intermolecular modes at low wavenumbers (cage phonon or lattice mode) and of the O–H stretching modes at high wavenumbers. Figure 2 compares the lattice modes and the O–H stretching modes in the cases of the hexagonal ice denoted Ih (in blue), of the SI nitrogen hydrate (in black) and of the SII nitrogen hydrate (in red). The ice lattice mode centered at 228.8 cm−1 is observed at higher frequency than the hydrate ones, observed at 224.8 cm−1 and 226.7 cm−1 for SI and SII structures, respectively. The reverse is observed for the O–H stretching modes, i.e., the ice signature at 3091.9 cm−1 is at lower wavenumbers than the hydrate signatures at 3100.0 cm−1 and 3094.9 cm−1 for the SI and SII structures, respectively. These variations are associated with the H–bonds directionality involved in the water sub-structure of the hydrates that is modified compared to the ice. Indeed, the ice Ih possesses a hexagonal lattice consisting of water molecules forming a perfect tetrahedral distribution of the water H–bonds. To form the water cage, the hydrate H–bonding network is slightly distorted compared to that of ice, leading to a weakening of the lattice mode and to a reinforcement of the O–H stretching in the hydrates; in agreement with previous Raman experiments performed on various gas hydrates [58,59,60,61,62]. In addition, the lattice mode of the SI structure is observed at lower frequency than the one of the SII structure; the reverse is observed for the O–H stretching mode (Figure 2). The cages 512, which are slightly smaller in the SII structure than in the SI structure [62], would be at the origin of these differences.
In addition, Raman spectroscopy provides structural information through the analysis of the guest partitioning in the LCs and SCs. Figure 1 shows the Raman stretching modes of nitrogen confined in LCs and SCs, together with the neutron diffraction data. The Raman bands of nitrogen molecules located in the LCs and in the SCs have been obtained by fitting the spectra of two pseudo-Voigt peaks to the experimental spectra, as described in [48]. The Raman band at the lowest wavenumber is attributed to the nitrogen in LCs, while the one at the highest wavenumber is attributed to the nitrogen in SCs [48]. The determination of the gas hydrate structure by Raman spectroscopy may be achieved by analyzing the ratio, , of the LCs to SCs Raman band intensities (denoted and , respectively). Indeed, this ratio depends on the LC and SC guest fillings (denoted and , respectively) of the hydrate struture:
where and are the numbers of LCs and SCs in the considered structure, respectively. and are the Raman scattering cross-sections of the nitrogen molecules in the LCs and in the SCs, respectively. For small molecules like nitrogen or carbon monoxide [48,53], the Raman scattering cross-sections are assumed to be similar for confinement in the LCs and in the SCs, so that . Under the assumption of a single occupancy of the cages, then corresponds to the SI hydrate structure ( and ) and to the SII hydrate structure ( and ), as illustrated for various gas hydrates [48,53,55,63]. In Figure 1, Sample C (SI) and Sample A (SII) are indeed characterized by measured ratio = 3.06 ± 0.15 and = 0.53 ± 0.11, respectively. Sample B (SII) exhibits a ratio = 0.97 ± 0.33, which is intriguing in the frame of this structural description. The pressurization times of Samples A and B (both being SII structures) are identical (3.5 days at 200 bar and 260 K), and only the storing times of the samples differ: they are four weeks and 6 h for Samples A and B, respectively. The measured evolution of the ratio is thus related to a time-evolution of the SII nitrogen hydrate (ageing) at 77 K and 1 bar, and more specifically to the evolution of the cage filling with time according to Equation (1).
3.2. Monitoring the Ageing of the Nitrogen SII Hydrate
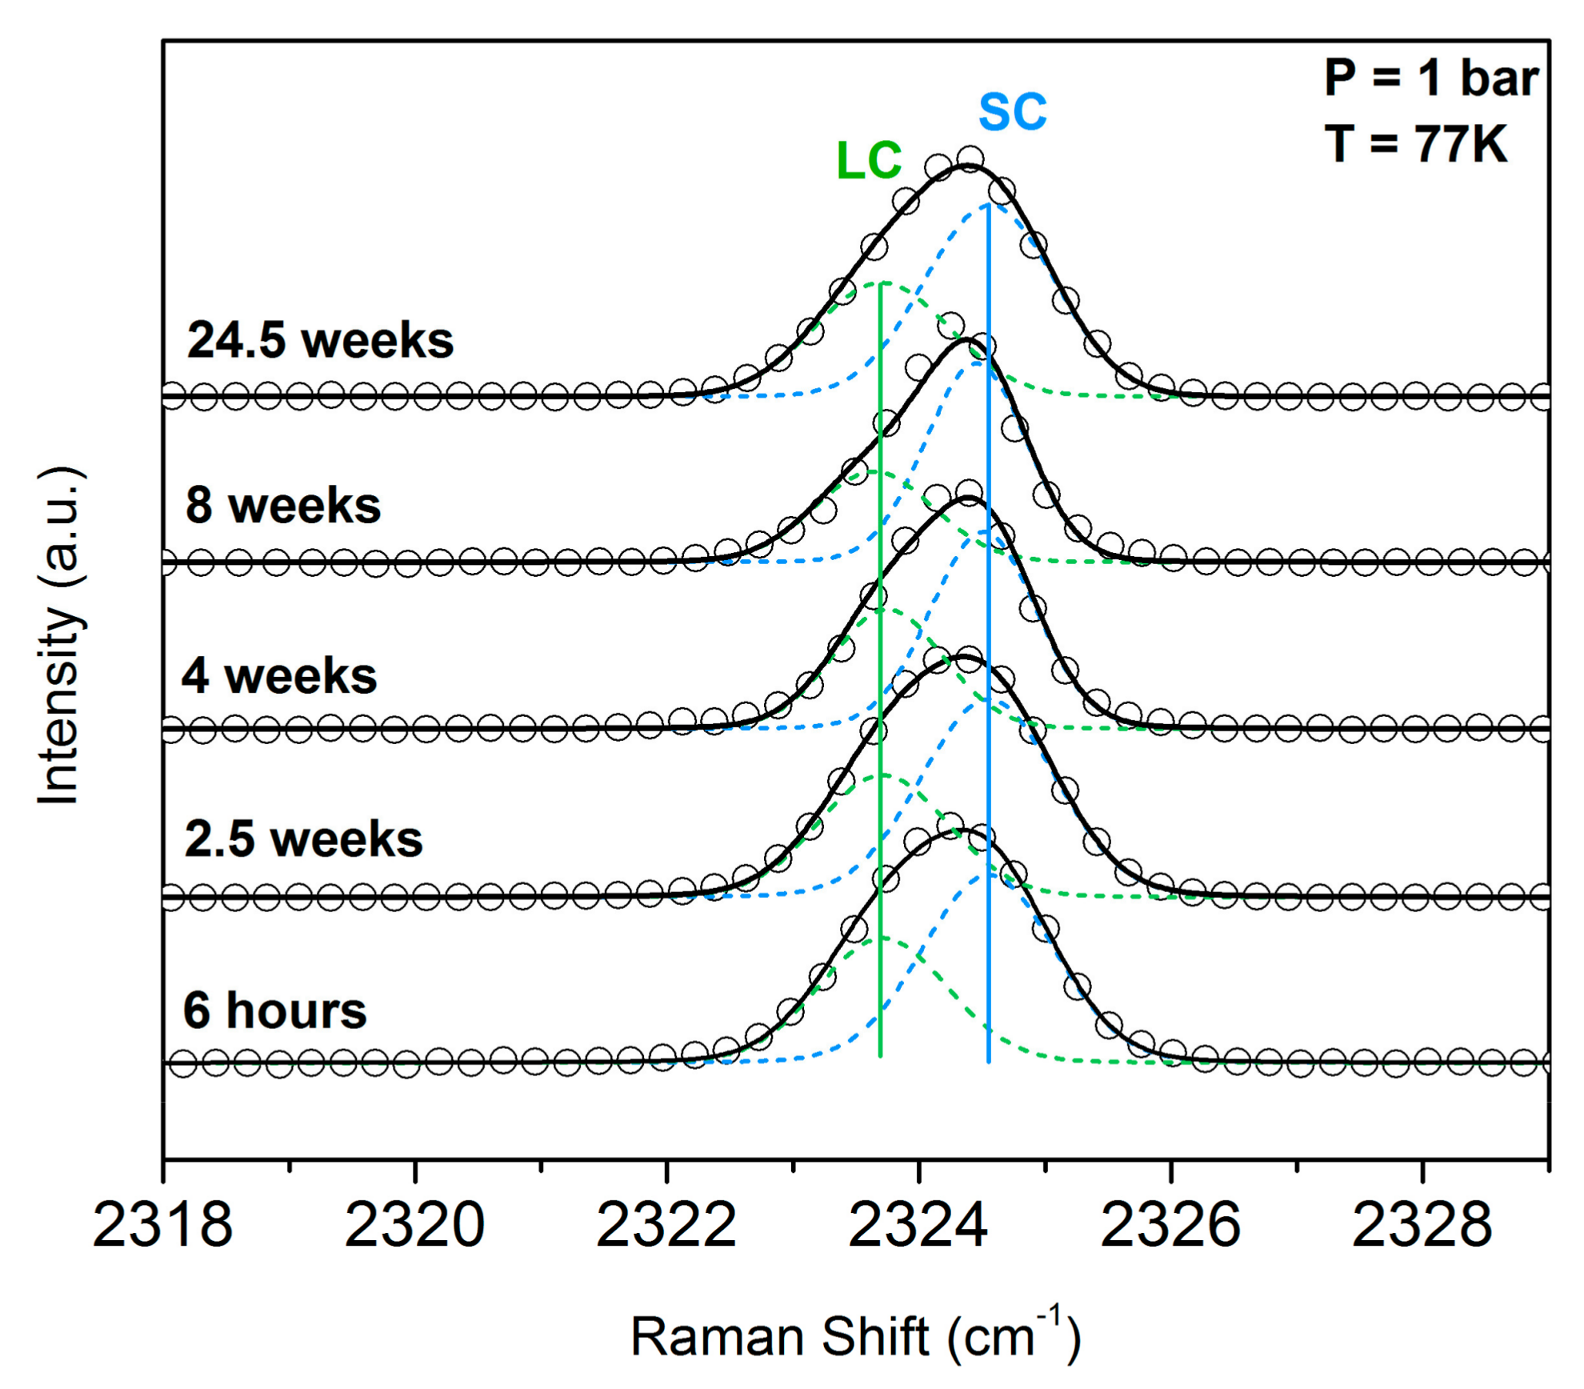
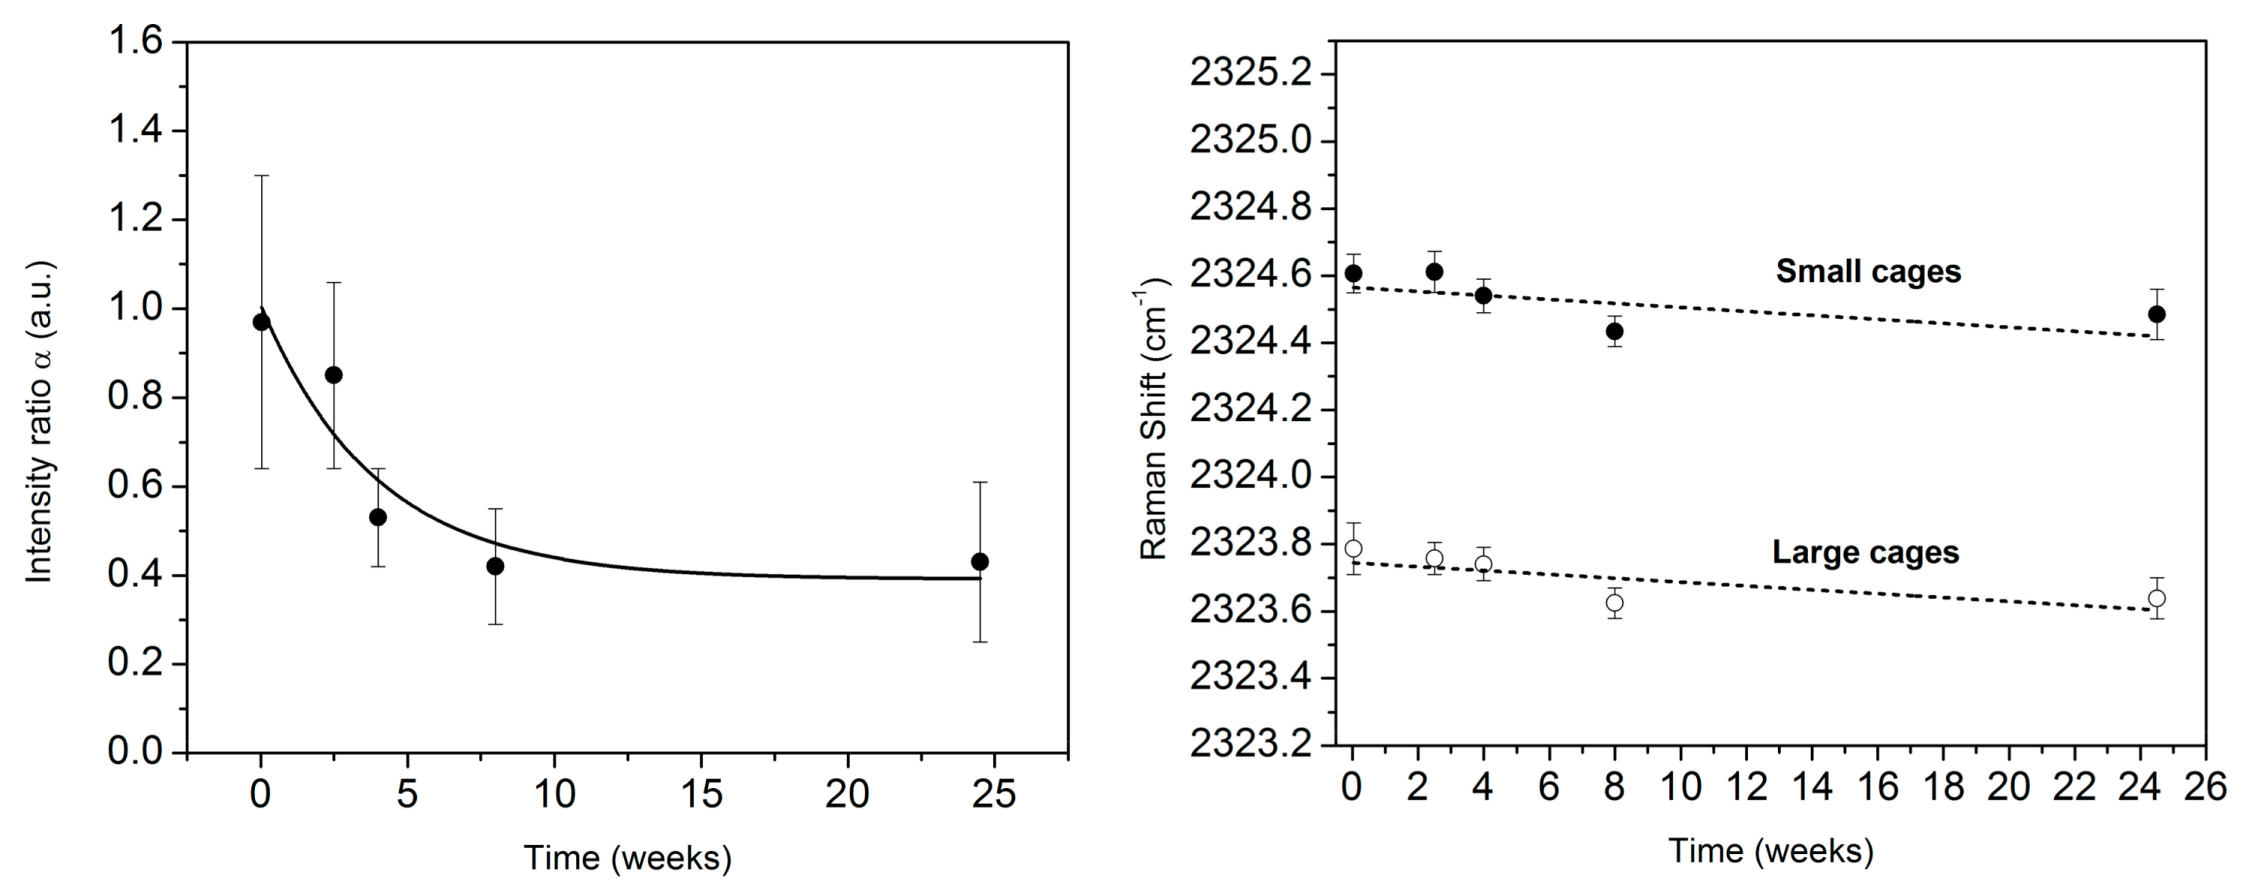
The time evolution of the guest partitioning into LCs and SCs has been monitored in the SII structure. For this analysis, nitrogen hydrate has been prepared by pressurizing powdered ice during 3.5 days at 200 bar and 260 K to ensure the formation of the SII structure. Raman measurements have then been performed after various storing times at liquid nitrogen temperature and atmospheric pressure, from 6 h–24.5 weeks. The measured Raman spectra of the nitrogen stretching mode is shown in Figure 3 at 77 K and atmospheric pressure. These spectra exhibit the SII profile in agreement with the structural analysis, and a clear time evolution of the profile is observed. The Raman profiles have been fitted by considering the LCs and SCs Raman contributions and the intensity ratio , as well as the LC and SC frequencies are shown in Figure 4.
The nitrogen stretching frequencies for LCs and SCs (Figure 4) exhibit a frequency difference close to the one of the SII structure, i.e., 0.89 ± 0.12 cm−1 averaged value over all time measurements (recall that the frequency difference between the LC band and the SC band is 1.1 cm−1 in the SI structure [48], as seen in Figure 1). Moreover, both LC and SC frequencies slightly decrease with time. This modification may be correlated with the cage occupancy: the Raman intensity ratio is also decreasing with time (Figure 4). Such a decrease is related to the evolution of the cage occupancy (see Equation (1)): either the LC occupancy is decreasing or the SC occupancy is increasing (or both). According to X-ray and neutron diffraction analysis, the SCs are singly occupied at the most [40,41]. It follows that the time evolution of the ratio is most probably related to the decrease of the LC filling. Such a release of the nitrogen molecule from the LCs would lead to more free volume in the cages’ structure. In the frame of the loose-cage tight-cage model [53,64,65], this modification would induce a looser-cage case with the time for both SCs and LCs and thus a softening of the guest-cage interaction. This evolution would be at the origin of the decrease of the stretching frequency for the nitrogen confined in the SII hydrate structure as observed in Figure 4.
As shown in Figure 4, the ratio decreases from ca. 1 for a short storing time to ca. 0.4 for a long storing time. As previously mentioned, these measured ratios are in the range of those expected in the SII structure by considering Equation (1): one obtains for a double occupancy of the LCs and a single occupancy of the SCs and for a single occupancy of the LCs and of the SCs. According to neutron diffraction Rietveld refinement of the SII nitrogen hydrate [40], = 0.822 and = 0.996 at 273 K and at 200 bar in the SII structure, so that one obtains at these P-T conditions. Moreover, multiple occupancy of the LCs is indeed observed, depending on the formation conditions: from synchrotron X-ray diffraction Rietveld refinement of the SII nitrogen hydrate [41], = 0.867 and = 1.22 at 258.15 K and at 150 bar, i.e., . In the present measurements (77 K and 1 bar), the nitrogen SII hydrate exhibits a ratio greater than these diffraction-derived values for a storing time below four weeks, while the ratio is slightly smaller after four weeks of storing time. It should be noted that the Raman profile fitting with two contributions (LC and SC) does not take into account the slight difference of the Raman stretching frequencies for a single occupancy of the LCs and for a double occupancy of the LCs. Indeed, these two contributions are respectively observed at 2322 cm−1 and 2323.4 cm−1 at 2900 bar and 293 K, i.e., with a frequency difference of 1.4 cm−1 at this high pressure condition [47]. Such Raman bands are difficult to disentangle in the present conditions of measurements: their frequency difference at 1 bar and 77 K might indeed be significantly smaller than the one measured at 2900 bar and 293 K (successful fitting of the present Raman profiles with these contributions could not be achieved). Nevertheless, the quantitative analysis of the time dependence of the ratio could be achieved by fitting a simple decaying exponential function:
where k represents the kinetic rate of the cage filling, represents the filling ratio at equilibrium and is a scaling factor. In the fitting procedure, the free parameters were k, and . A good agreement is observed between the experimental ratio and the fitted function (see Figure 4): it is obtained h−1, and . Thus, the evolution of would be due to a nitrogen depletion in the LCs with the time, and the SII nitrogen structure takes ca. eight weeks to reach equilibrated cage filling at 77 K and at atmospheric pressure.
3.3. Langmuir Behavior of the Cage Occupancy in the SII Structure from Raman Scattering
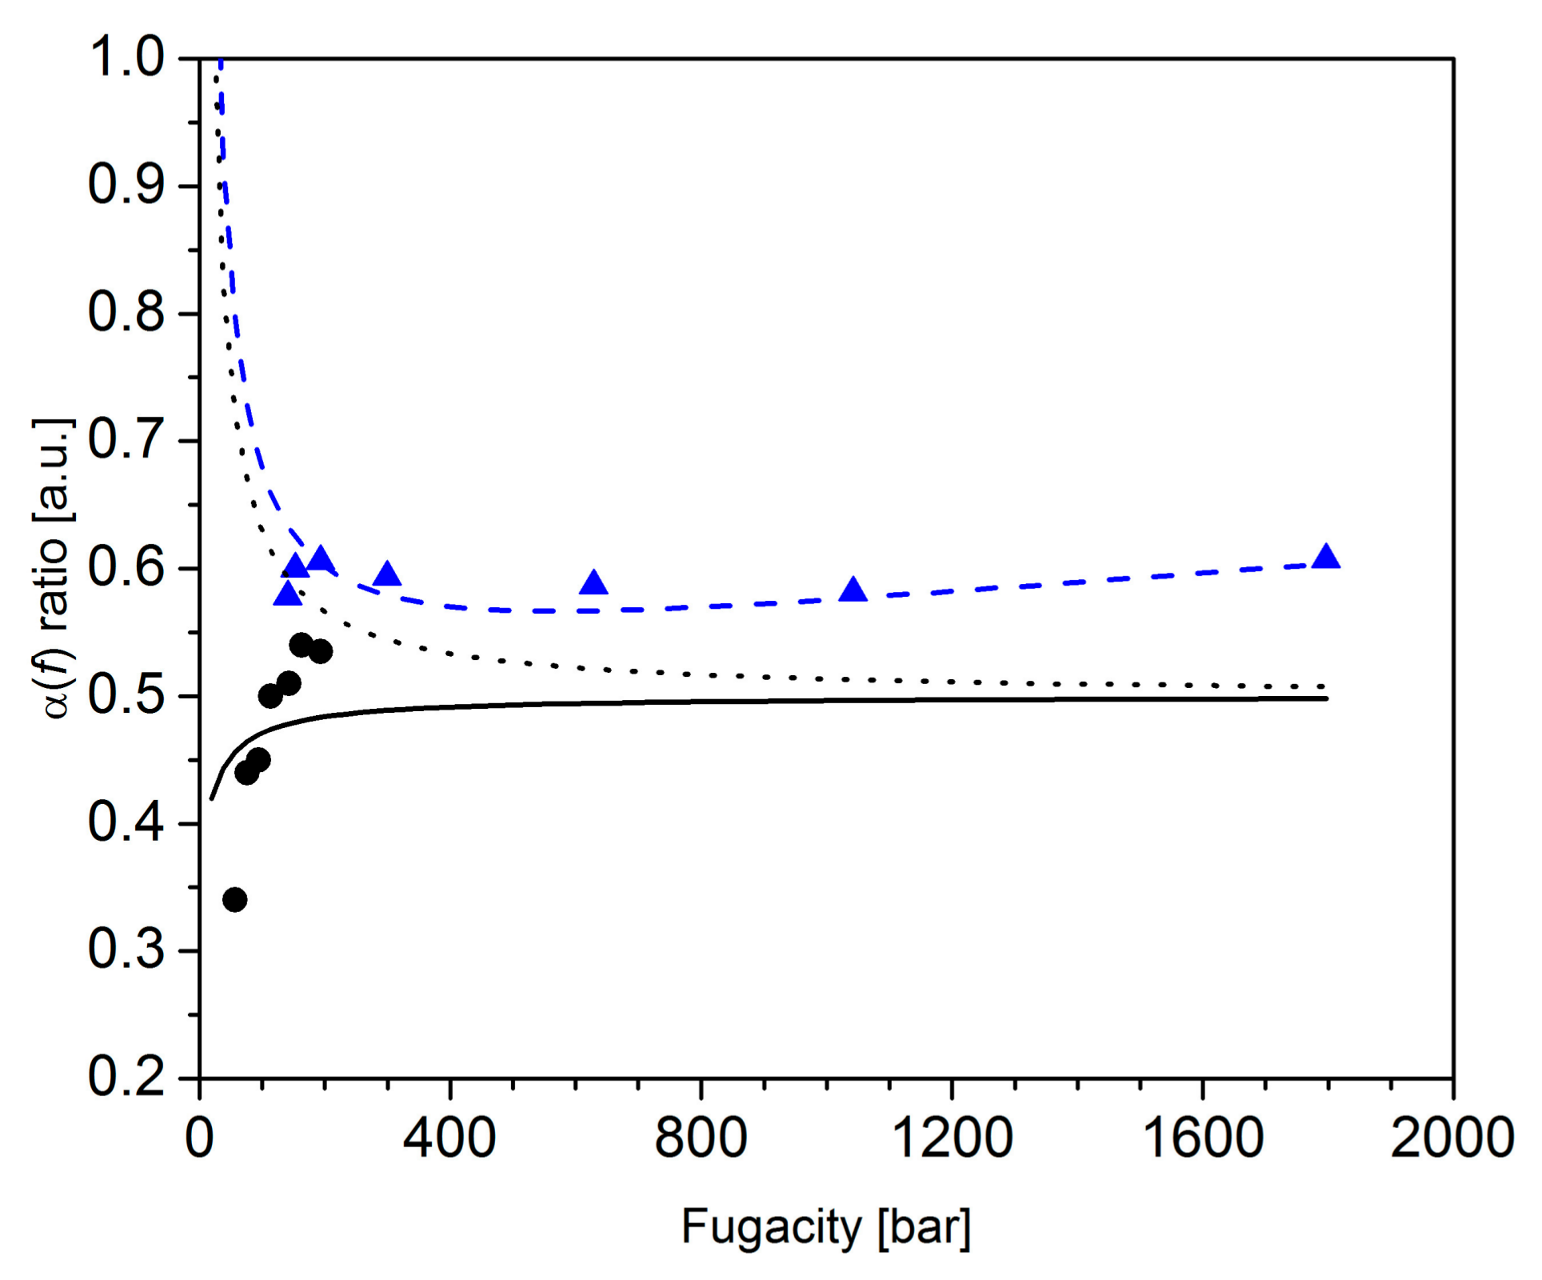
Modeling the cage occupancy is of particular importance for predicting the thermodynamics stability and composition of gas hydrates, as reflected by the wide use of the so-called van der Waals and Platteeuw models [2,4,66]. A prerequisite for such a modelling approach is the knowledge of the LC and SC Langmuir constants, i.e., the knowledge of the “capacity” of the hydrate to store a gaseous species in a given type of cage. Figure 5 shows the measured ratio in the SII nitrogen hydrate as a function of the gas fugacity f (obtained with the table available in the literature [67]) as measured by Raman scattering at 150 K [48] and by Rietveld refinement of neutron diffractograms at 273 K [40]. The pressure ranges accessible along these two isotherms are complementary as shown by the equilibrium region of the nitrogen hydrate in Figure 6.
The measured ratio can be rationalized with the help of the Langmuir model [39] through the fugacity dependence of the cage fillings and (by considering and for the SII structure):
In these expressions, , and are the Langmuir constants for the single occupancy of the SC, the single occupancy of the LC and the double occupancy of the LC, respectively. The ratio obtained with the help of Equation (3) are reported in Figure 5 for various sets of nitrogen Langmuir constants reported in the literature: = 24.7 kbar−1, = 205 kbar−1 and = 0.125 kbar−1 from [40], = 51.7 kbar−1, = 37.5 kbar−1 and = 0 kbar−1 from [68] and = 32.4 kbar−1, = 254.3 kbar−1 and = 0 kbar−1 from [69]. It should be noted that the reported Langmuir constants in [68,69] do not take into account a double occupancy of the LC, as reported in [40]. Moreover, from Equation (3), Figure 5 and previous works dedicated to thermodynamic models taking into account the double occupancy of the LCs [73,74,75], it clearly appears that:
- (i)
- the double occupancy of the LCs () impacts the high fugacity region of the ratio (above ca. 400 bar),
- (ii)
- the ratio decreases with the fugacity when (below ca. 400 bar),
- (iii)
- the ratio increases with the fugacity when (below ca. 400 bar).
With the help of neutron diffraction [40], it is possible to probe due to measurements at high fugacity values (Case (i)). In addition, the fitting of the diffraction-derived cage fillings and leads to at 273 K, i.e., Case (ii) [40]. Thanks to Raman measurements along the isotherm at 150 K (Figure 6), the fugacity region smaller than ca. 200 bars (the domain in which a clear disentangling of Case (ii) and Case (iii) is accessible (Figure 5)) could be probed: Case (iii) is clearly observed, i.e., . Nevertheless, the extraction of the Langmuir constants by fitting the Equations (3) on the Raman-derived ratio is not doable, in view of the three parameters to be considered in such a procedure. Thus, according to neutron [40] and Raman [48] experimental measurements in the SII structure, the nitrogen hydrate would exhibit a thermal evolution from at 273 K to at 150 K. Such an inversion of the Langmuir constants has been reported in the thermodynamical modeling of the SI nitrogen hydrate [9]: in the temperature range 125–250 K with different thermal dependence for and for , so that would become greater than for temperatures smaller than 125 K. Finally, the measurements of the SII ageing at 77 K (Figure 4) is characterized by a decrease of the ratio with time, due to a nitrogen depletion in the LCs: such an evolution corroborates at low temperatures, i.e., a better nitrogen “affinity” in the SCs than in the LCs.
4. Conclusions
The present paper reported the investigation of the cage occupancy in nitrogen gas hydrate on the basis of Raman scattering coupled to neutron diffraction. The analysis of the SI and SII vibrational properties has been first discussed with regards to the host lattice and the water stretching modes and to the guest signatures in LCs and in SCs. Beyond the structural SI-SII metastability, the ageing effect of the SII structure has been unraveled through the cage occupancy monitoring. With the help of a time-dependent analysis of the Raman scattering signals (over several months), the kinetics of the cage filling is interpreted as the LC occupancy decreasing with time to reach equilibrium after ca. eight weeks at 77 K and 1 bar. Thanks to the analysis of the pressure dependence of the guest Raman signatures, the observed evolution of the LC filling is discussed in the frame of the Langmuir model: at 150 K, the SC Langmuir constant has been determined to be higher than the LC one. Such a behavior might thus be correlated with the nitrogen depletion with time, observed for the LCs of the SII nitrogen hydrate.
Acknowledgments
This paper falls in the frame of the MI2C project funded by the French ANR “Agence Nationale de la Recherche” (ANR-15CE29-0016). All Raman experiments have been performed at the platform SIV (“Spectroscopie et Imagerie Vibrationelle”) at University of Bordeaux, funded by the FEDER and the Region Aquitaine.
Author Contributions
Claire Petuyaand, Arnaud Desmedt conceived of and designed the experiments and wrote the paper. Claire Petuya performed the Raman scattering experiments. Claire Petuya, Françoise Damay, Sarah Desplanche and Arnaud Desmedt performed the neutron diffraction experiments. Claire Petuya analyzed the data. Christian Aupetit contributed to handling the high-pressure experiments.
Conflicts of Interest
The authors declare no conflict of interest. The founding sponsors had no role in the design of the study; in the collection, analyses or interpretation of data; in the writing of the manuscript; nor in the decision to publish the results.
References
- Jeffrey, G.A. Hydrate inclusion compounds. In Comprehensive Supramolecular Chemistry; Atwood, J.L., Davies, J.E.D., Mac-Nicol, D.D., Vögtle, F., Eds.; Pergamon: Oxford, UK, 1996; Volume 6, pp. 757–788. [Google Scholar]
- Sloan, E.D.; Koh, C.A. Clathrate Hydrates of Natural Gases, 3rd ed.; Taylor & Francis-CRC Press: Boca Raton, FL, USA, 2008; ISBN 978-0-8493-9078-4. [Google Scholar]
- Von Stackelberg, M.; Muller, H.R. Feste Gashydrate II. Struktur und Raumchemie. Z. Electrochem. 1954, 58, 25–39. [Google Scholar]
- Broseta, D.; Ruffine, L.; Desmedt, A. (Eds.) Gas Hydrates 1: Fundamentals, Characterization and Modeling; Wiley-ISTE: London, UK, 2017. [Google Scholar]
- Ruffine, L.; Broseta, D.; Desmedt, A. (Eds.) Gas Hydrates 2: Geosciences and Applications; Wiley-ISTE: London, UK, 2018; under press. [Google Scholar]
- Koh, C.A.; Sloan, E.D.; Sum, A.K. Natural Gas Hydrates: Recent Advances and Challenges in Energy and Environmental Applications. AIChE J. 2007, 53, 1636–1643. [Google Scholar] [CrossRef]
- Yang, X.; Liu, H.; Li, Y. Research progress of separation technology based on hydrate formation. Huagong Xuebao/CIESC J. 2017, 68, 831–840. [Google Scholar]
- Handa, Y.P.; Ratcliffe, C.I.; Ripmeester, J.A.; Tse, J.S. Structural transition in mixed hydrates of xenon and krypton as a function of gas composition. J. Phys. Chem. 1990, 94, 4363–4365. [Google Scholar] [CrossRef]
- Yoon, J.-H.; Kawamura, T.; Ohtake, M.; Takeya, S.; Komai, T.; Yamamoto, Y.; Emi, H.; Kohara, M.; Tanaka, S.; Takano, O.; et al. Highly Selective Encaging of Carbon Dioxide Meolecules in the Mixed Carbon Dioxide and Nitrogen Hydrate at Low Temperatures. J. Phys. Chem. B 2006, 110, 17595–17599. [Google Scholar] [CrossRef] [PubMed]
- English, N.J.; Tse, J.S.; Carey, D. Mechanism for thermal conduction in various polymorphs of methane hydrate. Phys. Rev. B 2009, 80, 134306. [Google Scholar] [CrossRef]
- Veluswamy, G.P.; Kumar, R.; Linga, P. Hydrogen storage in clathrate hydrates: Current state of the art and future directions. Appl. Energy 2014, 122, 112–132. [Google Scholar] [CrossRef]
- Dyadin, Y.A.; Larionov, E.G.; Aladko, E.Y.; Manakov, A.Y.; Zhurko, F.V.; Mikina, T.V.; Komarov, V.Y.; Grachev, E.V. Clathrate formation in water-noble gas (hydrogen) systems at high pressures. J. Struct. Chem. 1999, 40, 790–795. [Google Scholar] [CrossRef]
- Mao, W.L.; Mao, H.K.; Goncharov, A.F.; Struzhkin, V.V.; Guo, Q.Z.; Hu, J.Z.; Shu, J.F.; Hemley, R.J.; Somayazulu, M.; Zhao, Y.S. Hydrogen clusters in clathrate hydrate. Science 2002, 297, 2247–2249. [Google Scholar] [CrossRef] [PubMed]
- Patchkovskii, S.; Tse, J.S. Thermodynamic stability of hydrogen clathrates. Proc. Natl. Acad. Sci. USA 2003, 100, 14645–14650. [Google Scholar] [CrossRef] [PubMed]
- Florusse, L.J.; Peters, C.J.; Schoonman, J.; Hester, H.C.; Koh, C.A.; Dec, S.F.; Marsh, K.N.; Sloan, E.D. Stable Low-PressureHydrogen Cluster Stored in binary Clathrate Hydrate. Science 2004, 306, 469–471. [Google Scholar] [CrossRef] [PubMed]
- Lee, H.; Lee, J.-W.; Kim, Y.D.; Park, J.; Seo, Y.T.; Zeng, H.; Moudrakovski, I.L.; Ratcliffe, C.I.; Ripmeester, J.A. Tuning clathrate hydrates for hydrogen storage. Nature 2005, 434, 743–746. [Google Scholar] [CrossRef] [PubMed]
- Pefoute, E.; Kemner, E.; Soetens, J.C.; Russina, M.; Desmedt, A. Diffusive motion of molecular hydrogen confined in THF clathrate hydrate. J. Phys. Chem. C 2012, 116, 16823–16829. [Google Scholar] [CrossRef]
- Ross, R.G.; Andersson, P.; Backstrom, G. Unusual PT dependence of thermal conductivity for a clathrate hydrate. Nature 1981, 290, 322–323. [Google Scholar] [CrossRef]
- Tse, J.S.; Klug, D.D.; Zhao, J.Y.; Sturhahn, W.; Alp, E.E.; Baumert, J.; Gutt, C.; Johnson, M.R.; Press, W. Anharmonic motions of Kr in the clathrate hydrate. Nat. Mater. 2005, 4, 917–921. [Google Scholar] [CrossRef] [PubMed]
- Englezos, P.; Lee, J.D. Gas Hydrates: A Cleaner Source of Energy and Opportunity for Innovative Technologies. Korean J. Chem. Eng. 2005, 22, 671–681. [Google Scholar] [CrossRef]
- Krivchikov, A.I.; Romantsova, O.O.; Korolyuk, O.A. The effect of proton ordering on the thermal conductivity of clathrate tetrahydrofuran hydrate. Low Temp. Phys. 2008, 34, 648–654. [Google Scholar] [CrossRef]
- Mootz, D.; Stabel, D. First examples of type I clathrate hydrates of strong acids: Polyhydrates of hexafluorophosphoric, tetrafluoroboric, and perchloric acid. J. Am. Chem. Soc. 1994, 116, 4141–4142. [Google Scholar] [CrossRef]
- Chapoy, A.; Anderson, R.; Tohidi, B. Low-pressure molecular hydrogen storage in semi-clathrate hydrates of quaternary ammonium compounds. J. Am. Chem. Soc. 2007, 129, 746–747. [Google Scholar] [CrossRef] [PubMed]
- Cha, J.H.; Shin, K.; Choi, S.; Lee, S.; Lee, H. Maximized proton conductivity of the HPF6 clathrate hydrate by structural transformation. J. Phys. Chem. C 2008, 112, 13332–13335. [Google Scholar] [CrossRef]
- Cha, J.H.; Shin, K.; Choi, S.; Lee, H. Ionic conductivity enhancement due to coguest inclusion in the pure ionic clathrate hydrates. J. Phys. Chem. C 2008, 112, 10573–10578. [Google Scholar] [CrossRef]
- Shin, K.; Cha, M.; Choi, S.; Dho, J.; Lee, H. Discrete Magnetic Patterns of Nonionic and Ionic Clathrate Hydrates. J. Am. Chem. Soc. 2008, 130, 17234–17235. [Google Scholar] [CrossRef] [PubMed]
- Shin, K.; Cha, J.O.; Seo, Y.; Lee, H. Physico-chemical properties of ionic clathrate hydrates. Chem. Asian J. 2010, 5, 22–34. [Google Scholar] [PubMed]
- Cha, J.H.; Lee, W.; Lee, H. Hydrogen gas sensor based on proton-conducting clathrate hydrate. Angew. Chem. Int. Ed. 2009, 48, 8687–8690. [Google Scholar] [CrossRef] [PubMed]
- Cha, M.; Shin, K.; Kwon, M.; Koh, D.Y.; Sung, B.; Lee, H. Superoxide ions entrapped in water cages of ionic clathrate hydrates. J. Am. Chem. Soc. 2010, 132, 3694–3696. [Google Scholar] [CrossRef] [PubMed]
- Desmedt, A.; Bedouret, L.; Pefoute, E.; Pouvreau, M.; Say-Liang-Fat, S.; Alvarez, M. Energy landscape of clathrate hydrates. Eur. Phys. J. Spec. Top. 2012, 213, 103–127. [Google Scholar] [CrossRef]
- Desmedt, A.; Lechner, R.E.; Lassegues, J.C.; Guillaume, F.; Cavagnat, D.; Grondin, J. Hydronium dynamics in the perchloric acid clathrate hydrate. Solid State Ion. 2013, 252, 19–25. [Google Scholar] [CrossRef]
- Bedouret, L.; Judeinstein, P.; Ollivier, J.; Combet, J.; Desmedt, A. Proton diffusion in the hexafluorophosphoric acid clathrate hydrate. J. Phys. Chem. B 2014, 118, 13357–13364. [Google Scholar] [CrossRef] [PubMed]
- Desmedt, A.; Martin-Gondre, L.; Nguyen, T.T.; Petuya, C.; Barandiaran, L.; Babot, O.; Toupance, T.; Grim, R.G.; Sum, A.K. Modifying the flexibility of water cages by co-including acidic species within clathrate hydrate. J. Phys. Chem. C 2015, 119, 8904–8911. [Google Scholar] [CrossRef]
- Broseta, D.; Torré, J.P.; Dicharry, C. Hydrate-based removal of CO2 from CH4 + CO2 gas streams. In Gas Hydrates 2: Geosiences and Applications; Ruffine, L., Broseta, D., Desmedt, A., Eds.; Wiley-ISTE: London, UK, 2018; Volume 2, under press. [Google Scholar]
- Qin, J.; Kuhs, W.F. Calibration of Raman Quantification Factors of Guest Molecules in Gas Hydrates and their Application to Gas Exchange Processes Involving N2. J. Chem. Eng. Data 2015, 60, 369–375. [Google Scholar] [CrossRef]
- Davidson, D.W.; Handa, Y.P.; Ratcliffe, C.I.; Tse, J.S. The Ability of Small Molecules to Form Clathrate Hydrates of Structure II. Nature 1984, 311, 142–143. [Google Scholar] [CrossRef]
- Lundgaard, L.; Mollerup, J. Calculation of Phase Diagrams of Gas Hydrates. Fluid Phase Equilib. 1992, 76, 141–149. [Google Scholar] [CrossRef]
- Van Hinsberg, M.G.E.; Scheerboom, M.I.M.; Schouten, J.A. The Vibrational Spectra of N2 in Clathrate Hydrates: A New High Pressure Phase Transition. J. Chem. Phys. 1993, 99, 752–754. [Google Scholar] [CrossRef]
- Kuhs, W.F.; Chazallon, B.; Radaelli, P.G.; Pauer, F. Cage Occupancy and Compressibility of Deuterated N2-Clathrate Hydrate by Neutron Diffraction. J. Incl. Phenom. Mol. Recognit. Chem. 1997, 29, 65–77. [Google Scholar] [CrossRef]
- Chazallon, B.; Kuhs, W.F. In situ Structural Properties of N2-, O2-, and Air-Clathrates by Neutron Diffraction. J. Chem. Phys. 2002, 117, 308–320. [Google Scholar] [CrossRef]
- Hansen, T.C.; Falenty, A.; Kuhs, W.F. Lattice Constants and Expansivity of Gas Hydrates from 10 K up to the Stability Limit. J. Chem. Phys. 2016, 144, 054301. [Google Scholar] [CrossRef] [PubMed]
- Van Hinsberg, M.G.E.; Schouten, J.A. The Phase Diagram of Nitrogen Clathrate Hydrate. AIP Proc. 1993, 309, 271–274. [Google Scholar]
- Pauer, F.; Kipfstuhl, J.; Kuhs, W.F. Raman Spectroscopic Study on the Nitrogen Ratio in Natural Ice Clathrates in the GRIP Ice Core. Geophys. Res. Lett. 1995, 22, 969–971. [Google Scholar] [CrossRef]
- Pauer, F.; Kipfstuhl, J.; Kuhs, W.F. Raman Spectroscopic Study on the Spatial Distribution of Nitrogen and Oxygen in Natural Ice Clathrates and their Decomposition to Air Bubbles. Geophys. Res. Lett. 1996, 23, 177–180. [Google Scholar] [CrossRef]
- Champagnon, B.; Panczer, G.; Chazallon, B.; Arnaud, L.; Duval, P.; Lipenkov, V. Nitrogen and Oxygen Guest Molecules in Clathrate Hydrates: Different Sites Revealed by Raman Spectroscopy. J. Raman Spectrosc. 1997, 28, 711–715. [Google Scholar] [CrossRef]
- Chazallon, B.; Champagnon, B.; Panczer, G.; Pauer, F.; Klapproth, A.; Kuhs, W.F. Micro-Raman Analysis of Synthetic Air Clathrates. Eur. J. Mineral. 1998, 10, 1125–1134. [Google Scholar] [CrossRef]
- Sasaki, S.; Hori, S.; Kume, T.; Shimizu, H. Microscopic Observation and In Situ Raman Scattering Studies on High-Pressure Phase Transformations of a Synthetic Nitrogen Hydrate. J. Chem. Phys. 2003, 118, 7892–7897. [Google Scholar] [CrossRef]
- Petuya, C.; Damay, F.; Chazallon, B.; Bruneel, J.-L.; Desmedt, A. Guest Partitioning and Metastability of the Nitrogen Gas Hydrate. J. Phys. Chem. C 2018, 122, 566–573. [Google Scholar] [CrossRef]
- Van Klaveren, E.P.; Michels, P.J.; Schouten, J.A.; Klug, D.D.; Tse, J.S. Stability of Doubly Occupied N2 Clathrate Hydrates Investigates by Molecular Dynamics Simulations. J. Chem. Phys. 2001, 114, 5745–5754. [Google Scholar] [CrossRef]
- Van Klaveren, E.P.; Michels, P.J.; Schouten, J.A.; Klug, D.D.; Tse, J.S. Molecular Dynamics Simulation Study of the Properties of Doubly Occupied N2 Clathrate Hydrates. J. Chem. Phys. 2001, 115, 10500–10508. [Google Scholar] [CrossRef]
- Klauda, J.B.; Sandler, S.I. Phase Behavior of Clathrate Hydrates: A Model for Single and Multiple Gas Component Hydrates. Chem. Eng. Sci. 2003, 58, 27–41. [Google Scholar] [CrossRef]
- Zhu, J.; Du, S.; Yu, X.; Zhang, J.; Xu, H.; Vogel, S.C.; Germann, T.C.; Francisco, J.S.; Izumi, F.; Momma, K.; et al. Encapsulation Kinetics and Dynamics of Carbon Monoxide in Clathrate Hydrate. Nat. Commun. 2014, 5, 4128. [Google Scholar] [CrossRef] [PubMed]
- Petuya, C.; Damay, F.; Talaga, D.; Desmedt, A. Guest Partitioning in Carbon Monoxide Hydrates by Raman Spectroscopy. J. Phys. Chem. C 2017, 121, 13798–13802. [Google Scholar] [CrossRef]
- Desmedt, A.; Bedouret, L.; Ollivier, J.; Petuya, C. Neutron Scattering of Clathrate and Semiclathrate Hydrates. In Gas Hydrates: Fundamentals, Characterization and Modeling; Broseta, D., Ruffine, L., Desmedt, A., Eds.; Wiley-ISTE: London, UK, 2017; Volume 1, pp. 1–62. [Google Scholar]
- Chazallon, B.; Noble, J.A.; Desmedt, A. Spectroscopy of Gas Hydrates: From Fundamental Aspects to Chemical Engineering, Geophysical and Astrophysical Applications. In Gas Hydrates: Fundamentals, Characterization and Modeling; Broseta, D., Ruffine, L., Desmedt, A., Eds.; Wiley-ISTE: London, UK, 2017; Volume 1, pp. 63–112. [Google Scholar]
- Le Bail, A. Accuracy in Powder Diffraction II: Proceedings of the International Conference May 26–29; Prince, E., Stalick, J.K., Eds.; NIST Special Publication, US Government Printing Office: Washington, DC, USA, 1992; Volume 846, pp. 142–153.
- Rodriguez-Carvajal, J. FULLPROF: A program for Rietveld refinement and pattern matching analysis. In Proceedings of the Satellite Meeting on Powder Diffraction of the XV Congress of the IUCr, Toulouse France, 16–19 July 1990; p. 127. [Google Scholar]
- Giannasi, A.; Celli, M.; Ulivi, L.; Zoppi, M. Low Temperature Raman Spectra of Hydrogen in Simple and Binary Clathrate Hydrates. J. Chem. Phys. 2008, 129, 084705. [Google Scholar] [CrossRef] [PubMed]
- Nakahara, J.; Shigesato, Y.; Higashi, A.; Hondoh, T.; Langway, C.C., Jr. Raman Spectra of Natural Clathrates in Deep Ice Cores. Philos. Mag. B 1988, 57, 421–430. [Google Scholar] [CrossRef]
- Sugahara, K.; Tanaka, Y.; Sugahara, T.; Ohgaki, K. Thermodynamic Stability and Structure of Nitrogen Hydrate Crystal. J. Supramol. Chem. 2002, 2, 365–368. [Google Scholar] [CrossRef]
- Klobes, B.; Desmedt, A.; Sergueev, I.; Schmalzl, K.; Hermann, R.P. 129Xe nuclear resonance scattering on solid Xe and 129Xe clathrate hydrate. EPL Europhys. Lett. 2013, 103, 36001. [Google Scholar] [CrossRef]
- Sugahara, K.; Sugahara, T.; Ohgaki, K. Thermodynamic and Raman Spectroscopic Studies of Xe and Kr Hydrates. J. Chem. Eng. Data 2005, 50, 274–277. [Google Scholar] [CrossRef]
- Sum, A.K.; Buruss, R.C.; Sloan, E.D. Measurement of Clathrate Hydrates via Raman Spectroscopy. J. Phys. Chem. B 1997, 101, 7371–7377. [Google Scholar] [CrossRef]
- Subramanian, S.; Sloan, E.D. Trends in Vibrational Frequencies of Guest Trapped in Clathrate Hydrate Cages. J. Phys. Chem. B 2002, 106, 4348–4355. [Google Scholar] [CrossRef]
- Schober, H.; Itoh, H.; Klapproth, A.; Chihaia, V.; Kuhs, W.F. Guest-host Coupling and Anharmonocity in Clathrate Hydrates. Eur. Phys. J. E 2003, 12, 41–49. [Google Scholar] [CrossRef] [PubMed]
- Van der Waals, J.H.; Platteeuw, J.C. Advances in Chemical Physics; Interscience: New York, NY, USA, 1959; Volume 2, pp. 1–57. [Google Scholar]
- Angus, S.; de Reuck, K.M.; Armstrong, B. International Thermodynamic Tables of the Fluid State 6-Nitrogen; Pergamon: Oxford, UK, 1977. [Google Scholar]
- Munck, J.; Skjold-Jorgensen, S.; Rasmussen, P. Phase Behaviour and Structural Aspects of ternary clathrate hydrate systems. The role of additives Computations of the formation of gas hydrates. Chem. Eng. Sci. 1988, 43, 2661–2672. [Google Scholar] [CrossRef]
- Parrish, W.R.; Prausnitz, J.M. Dissociation Pressures of Gas Hydrates Formed by Gas Mixture. Ind. Eng. Chem. Process Des. Dev. 1972, 11, 26–35. [Google Scholar] [CrossRef]
- Van Cleeff, A.; Diepen, G.A.M. Gas Hydrates of Nitrogen and Oxygen. Recueil des Travaux Chimiques des Pays-Bas 1960, 79, 582–586. [Google Scholar] [CrossRef]
- Marshall, D.R.; Saito, S.; Kobayashi, R. Hydrates at high pressures: Part I. Methane-Water, Argon-Water, and Nitrogen-Water Systems. AIChE J. 1964, 10, 202–205. [Google Scholar] [CrossRef]
- Jhaveri, J.; Robinson, D.B. Hydrates in the Methane-Nitrogen System. Can. J. Chem. Eng. 1965, 43, 75–78. [Google Scholar] [CrossRef]
- Asiaee, A.; Raeissi, S.; Shariati, A. Considering multiple occupancy of cavities in clathrate hydrate phase equilibrium calculations. J. Chem. Thermodyn. 2011, 43, 822–827. [Google Scholar] [CrossRef]
- Rasoolzadeh, A.; Shariati, A. Considering double occupancy of large cages in nitrogen and oxygen hydrates at high pressures. Fluid Phase Equilib. 2017, 434, 107–116. [Google Scholar] [CrossRef]
- Tsimpanogiannis, I.N.; Papadimitriou, N.I.; Stubos, A.K. On the limitation of the van der Waals-Platteeuw-based thermodynamic models for hydrates with multiple occupancy of cavities. Mol. Phys. 2012, 110, 1213–1221. [Google Scholar] [CrossRef]
Figure 1.
Observation of SI-SII structural transition with neutron diffraction at 100 K (a) and Raman spectroscopy at 77 K (b). Both measurements have been performed at atmospheric pressure after cold recovery (under nitrogen atmosphere) of the hydrates formed at T = 260 K and P = 200 bar. Samples C, B and A have been pressurized 4 h, 3.5 days and 3.5 days (T = 260 K, P = 200 bar) and then stored at liquid nitrogen temperature (T = 77 K, P = 1 bar) 3 days, 6 h and 4 weeks, respectively. On the neutron diffractograms, diamonds and asterisks represent the SI and SII structure Bragg peaks, respectively. The ice Bragg peaks are indicated with arrows. On the Raman spectra, the nitrogen molecules confined in the cages give rise to Raman bands at 2323.7 cm−1, 2323.8 cm−1 and 2323.3 cm−1 for the large cages (LCs) and at 2324.5 cm−1, 2324.6 cm−1 and 2324.4 cm−1 for the small cages (SCs) (for Samples A, B and C, respectively).
Figure 2.
Raman spectra of the lattice modes (a) and the O–H stretching modes (b) of hexagonal ice Ih (blue), nitrogen hydrate in the SI structure (black; Sample C in Figure 1) and nitrogen hydrate in the SII structure (red; Sample A in Figure 1) at T = 77 K and P = 1 bar.
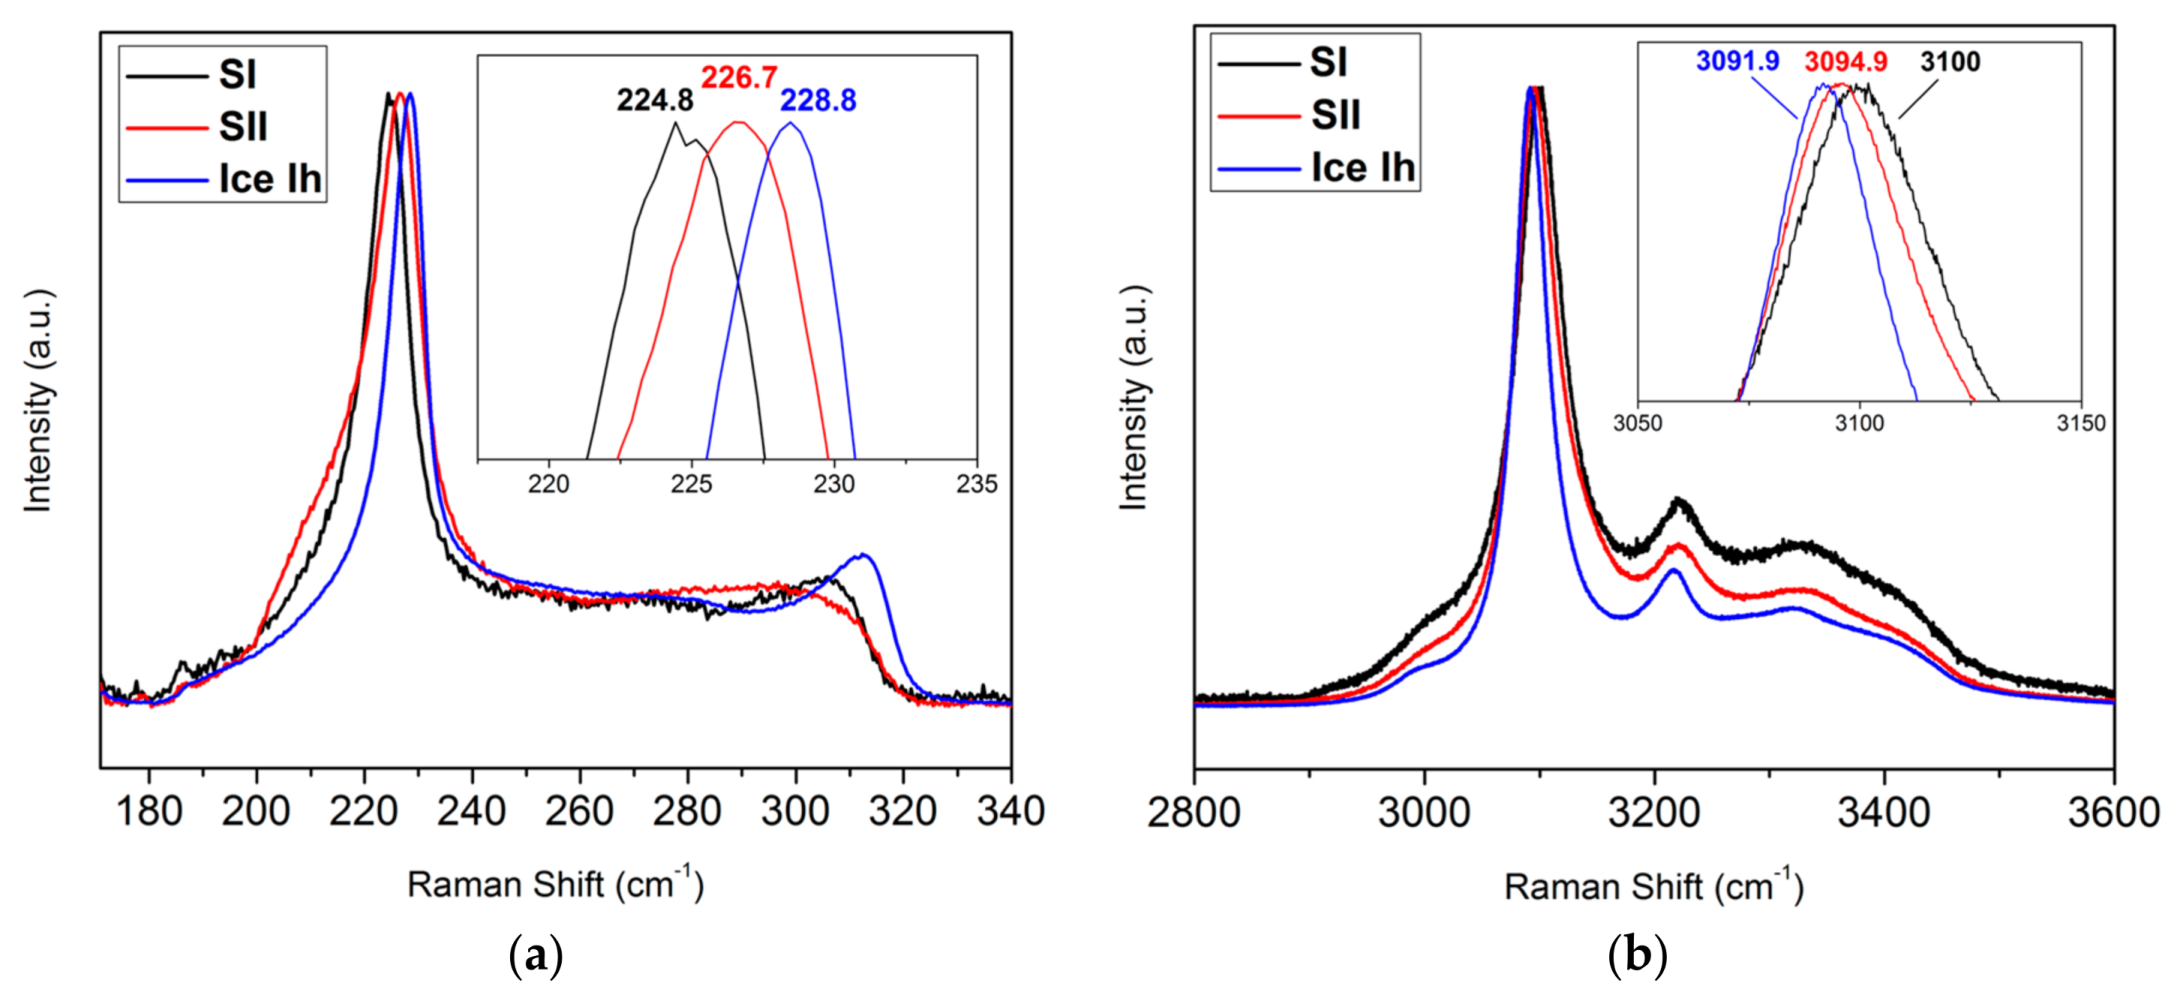
Figure 3.
Time evolution of the Raman spectrum of the nitrogen SII hydrate at 1 bar and 77 K. The gas hydrate has been formed by pressurizing powdered ice Ih at 200 bar and 260 K for 3.5 days. Fitting details of the LC and SC contributions are provided in the text.
Figure 3.
Time evolution of the Raman spectrum of the nitrogen SII hydrate at 1 bar and 77 K. The gas hydrate has been formed by pressurizing powdered ice Ih at 200 bar and 260 K for 3.5 days. Fitting details of the LC and SC contributions are provided in the text.

Figure 4.
Time evolution of the Raman intensity ratios (left hand) and frequencies (right hand) for nitrogen molecules encapsulated in the SC and LC of the SII structure at 77 K and 1 bar. The SII nitrogen gas hydrate has been formed at 200 bar and 255 K during 3.5 days. The continuous line on the left-hand graph represents the fit of Equation (2) to the measured ratio , and the ones on the right-hand graph are guides to the eyes. The error bars correspond to systematic errors.

Figure 5.
Fugacity dependence of the LC to SC cage filling ratio as measured by means of Raman scattering at 150 K (filled black circles; data from [48]) and by means of neutron diffraction at 273 K (filled blue triangles; data from [40]). The lines are the calculated ratios according to Equation (3) by using sets of Langmuir constants reported at 273 K (see the text for details): dashed blue line from [40], continuous black line from [68] and dotted black line from [69]).
© 2018 by the authors. Licensee MDPI, Basel, Switzerland. This article is an open access article distributed under the terms and conditions of the Creative Commons Attribution (CC BY) license (http://creativecommons.org/licenses/by/4.0/).
Share and Cite
MDPI and ACS Style
Petuya, C.; Damay, F.; Desplanche, S.; Aupetit, C.; Desmedt, A. Ageing and Langmuir Behavior of the Cage Occupancy in the Nitrogen Gas Hydrate. Crystals 2018, 8, 145. https://doi.org/10.3390/cryst8040145
AMA Style
Petuya C, Damay F, Desplanche S, Aupetit C, Desmedt A. Ageing and Langmuir Behavior of the Cage Occupancy in the Nitrogen Gas Hydrate. Crystals. 2018; 8(4):145. https://doi.org/10.3390/cryst8040145
Chicago/Turabian StylePetuya, Claire, Françoise Damay, Sarah Desplanche, Christian Aupetit, and Arnaud Desmedt. 2018. "Ageing and Langmuir Behavior of the Cage Occupancy in the Nitrogen Gas Hydrate" Crystals 8, no. 4: 145. https://doi.org/10.3390/cryst8040145
Note that from the first issue of 2016, this journal uses article numbers instead of page numbers. See further details here.