Effects of Carrier Doping on the Transport in the Dirac Electron System α-(BEDT-TTF)2I3 under High Pressure

Department of Physics, Toho University, Miyama 2-2-1, Funabashi-shi, Chiba 274-8510, Japan
Crystals 2018, 8(3), 126; https://doi.org/10.3390/cryst8030126
Submission received: 31 January 2018
/
Revised: 6 March 2018
/
Accepted: 6 March 2018
/
Published: 8 March 2018
(This article belongs to the Special Issue Advances in Organic Conductors and Superconductors)
Abstract
:A zero-gap state with a Dirac cone type energy dispersion was discovered in an organic conductor α-(BEDT-TTF)2I3 under high hydrostatic pressures. This is the first two-dimensional (2D) zero-gap state discovered in bulk crystals with a layered structure. Moreover, the Dirac cones are highly tilted in a k-space. This system, thus, provides a testing ground for the investigation of physical phenomena in the multilayered, massless Dirac electron system with anisotropic Fermi velocity. Recently, the carrier injection into this system has been succeeded. Thus, the investigations in this system have expanded. The recent developments are remarkable. This effect exhibits peculiar (quantum) transport phenomena characteristic of electrons on the Dirac cone type energy structure.
1. Introduction
The realization of the graphene opened the physics of the Dirac electron in a solid [1,2]. A rich variety of material with Dirac electrons has been discovered, and the recent progress of the physics for Dirac electrons has been brilliant [3,4,5,6,7,8,9,10,11,12,13,14,15,16]. However, the zero-gap material with the Fermi level at the Dirac point is limited. The physics at the vicinity of the Dirac point is the most significant. Among them, we have discovered the zero-gap material with Dirac-type energy dispersion in α-(BEDT-TTF)2I3 (BEDT-TTF = bis(ethylenedithio) tetrathiafulvalene) [17] (Figure 1) at high pressure. This is the first bulk (multilayered) 2D zero-gap system with Dirac electrons. Thus, this material has led the studies of the specific heat [18] and the nuclear magnetic resonance (NMR) [19] for the Dirac electron system. Another significant feature is that the Dirac cones are highly tilted as shown in Figure 1d,e [13,14,15,16]. Thus, this system has led to the peculiar transport characteristic of the electrons on the Dirac cone type energy structure [8,9,10,11,12,16,20,21,22,23]. This Dirac electron system, on the other hand, is next to the charge-ordered insulator phase in the temperature-pressure phase diagram. Therefore, strongly correlated Dirac electrons constitute one of the interesting recent studies [19,24,25].
The recent success of carrier injection helped the development of physics with regard to this system. In this review, the effects of carrier doping on the peculiar (quantum) transport phenomena are described. In the following, the electronic structure of α-(BEDT-TTF)2I3 and the experimental evidence of massless Dirac electron systems are briefly mentioned in this section. The methods of the carrier doping in Section 2 and those effects on the transport phenomena in Section 3, Section 4 and Section 5 are revealed. In Section 6, the Dirac type energy structure of this system is corrected.
1.1. Electronic Structure of α-(BEDT-TTF)2I3
α-(BEDT-TTF)2I3 is a member of the (BEDT-TTF)2I3 family [17]. The crystals consist of conductive layers of BEDT-TTF molecules and insulating layers of I3− anions as shown in Figure 1a–c [26,27,28]. The difference of the arrangement of BEDT-TTF molecules gives rise to variations in the transport phenomena. Most are 2D metals with large Fermi surfaces, and some of them show a superconducting transition [26,27,28]. α-(BEDT-TTF)2I3, however, is different from other members. The band calculation indicated a semimetal with small Fermi pockets of the electron character and the hole character [8].
This material behaves as a metal down to 135 K, where it undergoes a phase transition to an insulator [17]. At temperatures below 135 K, an abrupt drop of the magnetic susceptibility suggests that a nonmagnetic state with a spin gap is realized [29]. The theory by Kino and Fukuyama [30] and Seo [31], the NMR study by Takano et al. [32], the Raman study by Wojciechowski et al. [33], and the spectroscopy study by Moldenhauer et al. [34] indicated that the origin of this transition was due to the charge disproportionation. Each BEDT-TTF molecule with approximately 0.5 has formed the horizontal charge stripe patterns for and 0 at temperatures below 135 K [33,35]. This phase transition is suppressed by the pressure above 1.5 GPa at room temperature [8,9,16].
The resistivity at high pressure is very peculiar. It is almost constant over the whole temperature range like dirty metals. The carrier mobility in dirty metals should be low, because the impurity scattering dominates the conduction. Thus, the resistance in dirty metals is temperature independent. However, the present situation is different. The large magnetoresistance at low temperatures indicated that the carrier mobility was extremely high. It was estimated to be approximately cm/V·s at low temperatures [9,16,35,36,37]. The high carrier mobility led to the observation that the magnetic field warped the path of the electric currents [8]. So, this system is clean.
This is the motive with which this study has started. To clarify this mechanism, the Hall effect was investigated. Surprisingly, in the region from 300 to 2 K, the carrier (hole) density and the mobility change by approximately six orders of magnitude as shown in Figure 2. At low temperatures, the state of extremely low density of approximately cm−3 and extremely high mobility of approximately cm2/V·s is realized [10,16]. The independent resistance is due to the effects of changes in the density, and the mobility just cancels out [8,9,10,16].
According to the band calculations by Kobayashi et al. and first-principles band calculations by Kino and Miyazaki, this material under high pressures is in the zero-gap state of which the bottom of the conduction band and the top of the valence band touch each other at two points (we call these “Dirac points”) in the first Brillouin zone [13,14,15]. The Fermi energy is located exactly on the Dirac point.
In the picture of 2D zero-gap energy structure with a linear dispersion, the peculiar transport phenomena were naturally understood. The carrier density proportional to the temperature squared is explained. When the Fermi energy located at the Dirac point is temperature-independent, it is written as , in which is the density of state and is the Fermi distribution function. According to Mott’s argument [38], on the other hand, the mean free path of a carrier can never be shorter than the wavelength of the carrier, so . For the cases of high density of scattering centers, (). As the temperature is decreased, becomes long, because becomes long ( becomes small) with the decreasing energy of the carriers. The Boltzmann transport equation gives the temperature-independent quantum conductivity as , in which is the velocity of Dirac electrons when the electric field along -axis is applied and is the lifetime. The constant sheet resistance (resistivity per layer) close to the value of the quantum resistance, kΩ, is derived. Many realistic theories for the sheet resistance in the zero-gap system give , in which is a parameter of order unity [39,40,41]. Combining the temperature dependences of the carrier density and the resistivity with , on the other hand, the temperature dependence of the carrier mobility was led as shown in Figure 2.
1.2. Experimental Evidence of Massless Dirac Electron System
We can see the remarkable characteristic transport of 2D Dirac electron systems in the magnetic field normal to the 2D plane. In the 2D massless Dirac electron system, the particles obeyed to the Weyl equation , in which is the Pauli matrix and is the momentum. In the magnetic field, the gauge transformation from into derives the energy of Landau levels as
in which is the vector potential, is the Fermi velocity, is the Landau index, and is the magnetic field strength. This energy depends on the square root of and , which is different from that of the conventional conductors. At the Dirac point (), and the Landau level, called the zero-mode, always appears [42].
For , the system is in the state of the quantum limit so that the zero-mode carriers dominate the conduction. In this situation, the carrier density per spin and per valley is given by , in which is the quantum flux and the Fermi distribution function at is 1/2. Strong magnetic fields induced the zero-mode carrier with high density.
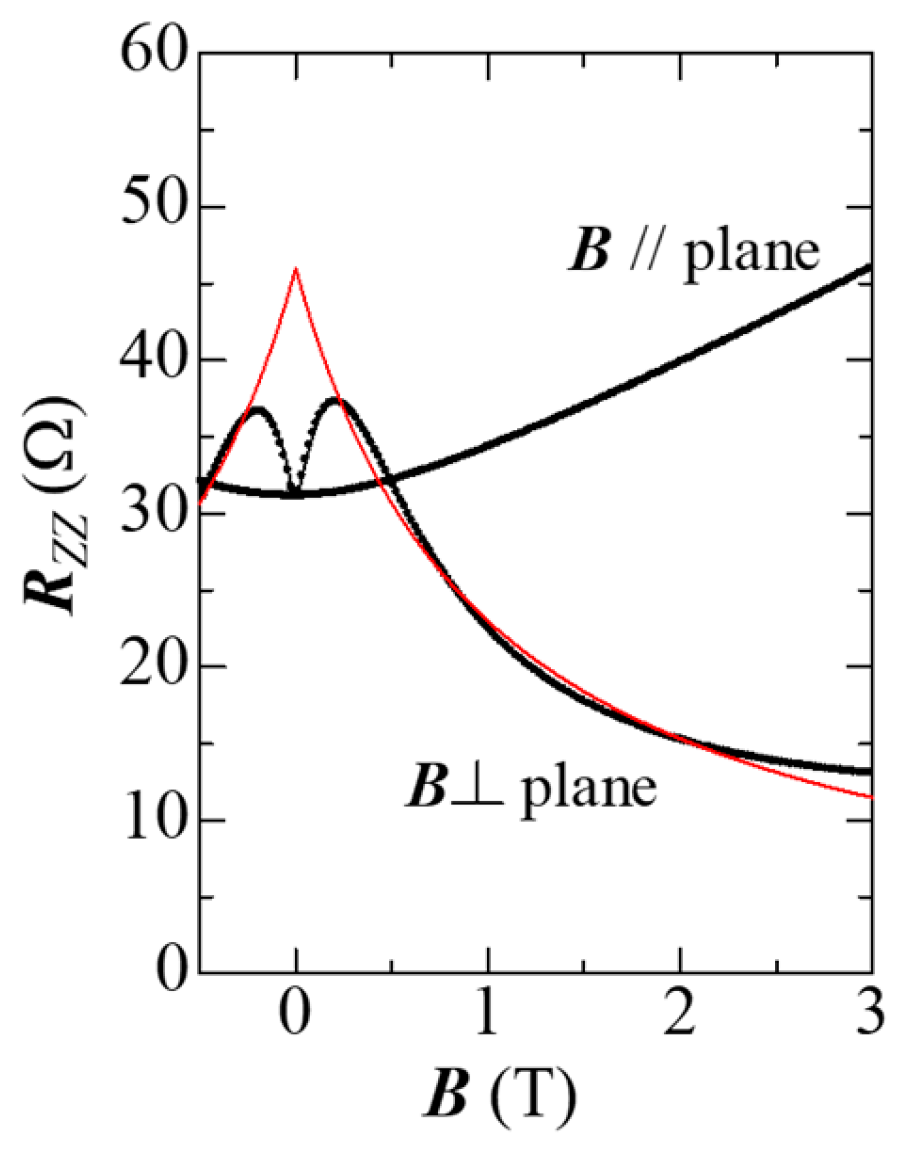
Tajima et al. succeeded in detecting this effect in the longitudinal inter-layer magnetoresistance [11]. In this experiment, the Lorentz force is weak, because the electrical current and the magnetic field are parallel to each other. Thus, the effect of the magnetic field only gives rise to the change in the zero-mode carrier density. It leads to the remarkable negative interlayer magnetoresistance in the magnetic field above 0.2 T, as shown in Figure 3 [11]. An analytical formula for by Osada reproduced well the field and the angle dependences of [43].
Since each Landau level is broadened by the scattering of carriers and/or thermal energy, the zero-mode is sure to overlap with the other Landau levels at a low magnetic field. In such a region, the relationship of loses its validity. We can recognize this region in Figure 3, in which a positive magnetoresistance is observed. At K, for example, this critical field is approximately 0.2 T. At the magnetic field above , the overlap between the zero-mode and the Landau levels will be sufficiently small so that the negative magnetoresistance is observed there. Thus, at . The Fermi velocity was estimated to be approximately m/s [44,45].
Thus, the detection of zero-mode has demonstrated that this material under high pressure was composed of truly massless Dirac electron systems. The recent progress of this system has been remarkable. One example of this is the success of the carrier doping to this system. In the next section, the effects of the carrier doping on the transport phenomena are described.
2. Methods of Carrier Doping
In the Dirac electron systems, the Berry phase, which is fundamental concept for the geometry of the Bloch particles, plays an important role in quantum transport. In 2D massless Dirac electron system, the particles obey the Weyl equation has Berry phase. Berry phase has yielded the new type of quantum Hall effect (half integer quantum Hall effect), which was first discovered in graphene. The success of the carrier doping (control of ) by the field effect transistor (FET) method led to this discovery.
Here, the detection of the Berry phase is briefly mentioned. The semiclassical quantization condition for a cyclotron orbit is written as , in which is the cross-section area of the th Landau level, is the magnetic length, and is the Onsager phase factor that is related to the Berry phase as . In a conventional electron system, and are expected to be 0 and 1/2. Dirac particles, on the contrary, prefer and . Dirac particles in a solid thus had been identified from the phase analysis of quantum oscillation (Shubnikov-de Haas oscillations: SdH) in a magnetic field.
In order to detect the quantum Hall effect (QHE) characterized by the electrons on the Dirac cones in α-(BEDT-TTF)2I3 under high pressure, the Fermi level should be moved from the Dirac point. However, control of the Fermi level by the field effect transistor (FET) method is much more difficult, because this crystal has a multilayered structure with high conductivity. Moreover, the conductivity in each layer is high.
Cannot we inject carriers to α-(BEDT-TTF)2I3 under high pressure? Cannot we detect the QHE experimentally in this system? The answer is “NO”. One of the breakthroughs for the carrier injection to α-(BEDT-TTF)2I3 was suggested. Important results are that the SdH oscillations and the QHE associated with the special Landau level structure of Equation (1) were detected at low temperature [16,46]. In this section, we mention some unique methods of carrier doping in this system.
2.1. Effects of Dopant
Because of the characteristic energy spectrum, slight dopant brought a strong effect on the transport phenomena. The instability of I3− anions is the main origin of the dopant. Depending on the dopant, there are two types of samples according to which the electrons or holes were doped. Moreover, sample (dopant) dependence of the resistivity and the Hall coefficient is strong at low temperatures. This characteristic feature provided experimentally an anomalous Hall conductivity caused by the inter-band effects of the magnetic field [12]. In the magnetic field, the vector potential plays an important role in the inter-band excitation of electrons [47]. In this situation, large diamagnetism and the anomalous Hall conductivity is derived by the orbital motion of virtual electron-hole pairs. This is the inter-band effect of the magnetic field. This effect is strongest when the chemical potential is located at the Dirac point. In Section 3, inter-band effects of magnetic field on the transport properties are described.
2.2. Electron Doping by the Annealing
Annealing of the crystals in a vacuum at high temperature gives rise to the lack of I3− anions [48,49]. It yields mobile electrons. Annealing time and temperature are the control parameters of the density [50]. Recently, Tisserond et al. succeeded in injecting electrons and observed SdH oscillation at low temperature [51]. Effects of electron doping by the annealing on the transport properties are roughly mentioned in Section 4.
2.3. Hole Doping by Contact Electrification
The carrier density per layer of α-(BEDT-TTF)2I3 under a high pressure at low temperatures is estimated to be approximately cm−2 [10]. Thus, the effects of hole doping can be detected on the transport phenomena by fixing a crystal onto a substrate weakly that is negatively charged. This is called the contact electrification method. The effects of hole doping on the quantum transport phenomena were detected by fixing a thin crystal onto a poly (ethylene naphthalate) (PEN) substrate (Figure 4) [46]. Positively charged substrate, on the other hand, dopes electrons. Effects of hole doping by the contact electrification on the transport phenomena are described in Section 5.
2.4. Experiments of the Transport Phenomena in α-(BEDT-TTF)2I3 Under High Pressure
A sample on which six to eight gold wire with a diameter of 15 μm is attached by the carbon paste and is put in a Teflon capsule filled with the pressure medium (DN-oil 7373, Idemitsu, Tokyo, Japan), and then the capsule is set in a clamp-type pressure cell made of hard alloy MP35N cell or BeCu/NiCrAl dual-structure cell. The pressure was examined by change in the resistance of Manganin wire at room temperature. Resistance of a crystal was measured by a conventional dc method with six to eight probes. An electrical current between 0.1 μA and 10 μA was applied in the 2D plane. The magneto transport phenomena were investigated at temperatures from 0.1 K to 300 K in the magnetic field up to 12 T.
3. Effects of Dopant: Inter-Band Effects of Magnetic Field
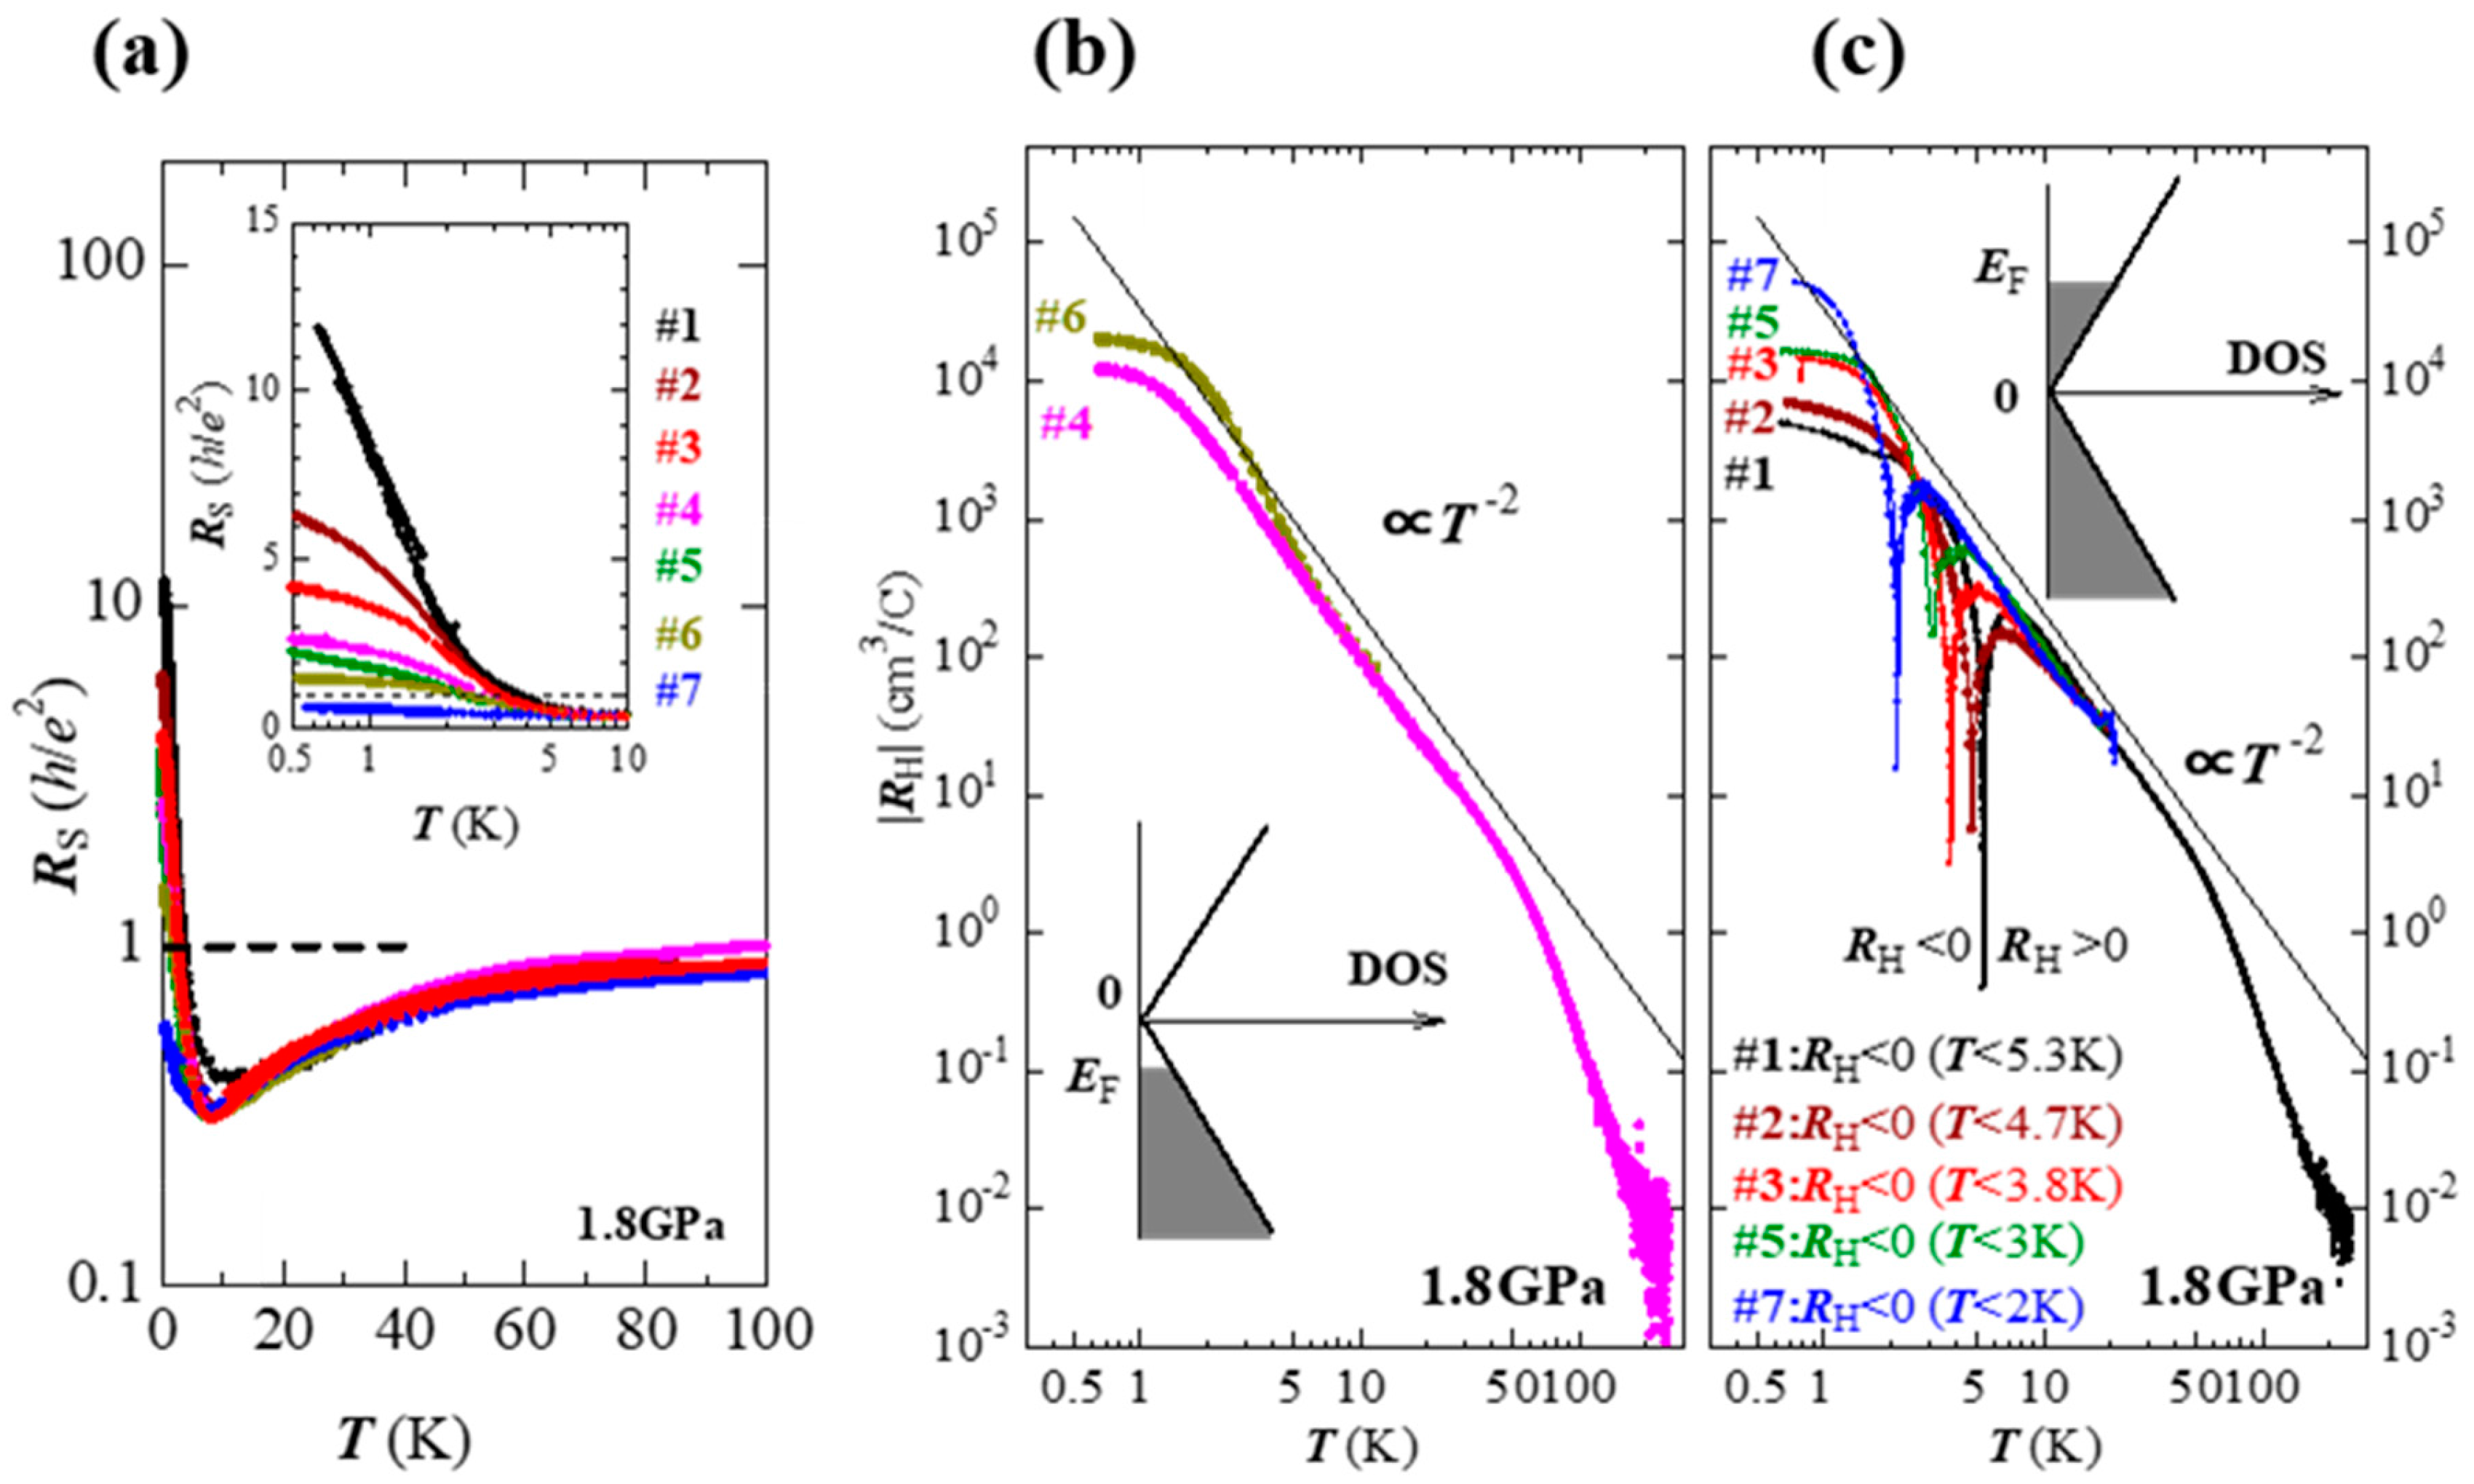
The sample (dopant) dependence of the resistivity and the Hall coefficient is strong at low temperatures, as shown in Figure 5, because this system has the characteristic energy spectrum. This fact is very important, because the dopant will throw light on the structure and the characteristic properties in the vicinity of Dirac point. In this section, anomalous Hall conductivity that originated from the inter-band effects of the magnetic field at the vicinity of Dirac point is examined [12]. Moreover, electron-hole symmetry of this system is revealed.
As mentioned in Section 1, is proportional to at temperatures below 50 K. It was explained based on a single Dirac cone type energy structure. In the present system, however, two cones that touched at a Dirac point exclude such a simple situation. In the case that the two Dirac cones are strictly symmetric, the Hall coefficient will be zero, because the signals of the Hall effect due to carriers on the top and bottom of the Dirac cones cancel out. To detect the signal, the energy structure should be asymmetrical. The measurements of should detect the signal that depends on the strength of asymmetry.
Tajima et al. examined the temperature dependence of for seven samples (n1–n7) and found that the samples were classified into two groups. First group (n4 and n6) is that is positive over the whole temperature range, as shown in Figure 5b. In another group (n1, n2, n3, n5, and n7), on the other hand, the polarity of changes at a certain temperatures below 10 K, as shown in Figure 5c. The dopant with a low level of density in the sample leads to this difference. It plays an essential role in the polarity of at low temperatures. The density and the kind of dopants were determined by at the lowest temperature, in which the thermal excitation of carriers between the cones is negligible. The kind of dopant of the first group (n4 and n6) is hole. On the other hand, electron is the character of dopant in another group (n1, n2, n3, n5, and n7). Here, we have a deep interest in the change in the polarity of in the second group (electron doped samples: n1, n2, n3, n5, and n7), as shown in Figure 5c. We find strong sample dependence of the temperature in which the polarity changes. Note that above 10 K, the curve of for all samples is a single. It indicates that doping does not affect the electron energy structure. Thus, the effect of the dopant results in changes in . The change in the polarity of is understood as follows.
Strong temperature dependence of indicates that the symmetry of the present Dirac cones is low. In this situation, the chemical potential should vary with the temperature. At the temperature at which , the polarity of changes [12,20]. This fact is very important, because the temperature dependence of the transport phenomena provides its chemical potential dependence in the vicinity of the Dirac point. Here, let us detect the inter-band effects of the magnetic field in the Hall conductivity. The inter-band effect is strongest at [47]. In the following, we examine the inter-band effect in the vicinity of ().
First, let us express as a function of . The dopant density was determined from at low temperature. Thus, was calculated from the relationship with m/s. Note that the value of for all samples is almost the same, because sample dependence of is very weak at temperatures of above 7 K. For example, for samples n1 and n7 are estimated to be 1.35 and 0.35 K, respectively. Kobayashi et al. theoretically demonstrated that is varied with the temperature as approximately at low temperatures, in which a parameter depends on the symmetry of the Dirac cone (: and are the Fermi velocities for lower and upper Dirac cones) and is independent of . At , . Thus, is estimated to be approximately 0.24 at . This experimental formula is consistent with the theoretical curve well [20]. Hence, is estimated to be approximately 1.2 [12]. This is the electron-hole symmetry of this system. The detail for asymmetric Dirac cones in this system is described in Section 6.
The calculation of the Hall conductivity is the second step. The temperature dependence of for samples n1 and n7 is shown in Figure 6a. In this calculation, it was assumed as . The last step is that is drawn in Figure 6b as a function for by replacing by . We should compare this with the theoretical curve . Experimental data roughly reproduce the relation , in which is a parameter that depends on the temperature. It is significant that there is a peak and a dip structure in each curve at the vicinity of the point at which . In the magnetic field, the orbital motion of virtual electron-hole pairs by the vector potential plays an important role in . The peak structure of shown in Figure 6 is the characteristic feature due to the inter-band effects of the magnetic field [20]. The energy between two peaks is the damping, which depends on the density of scattering centers in the crystal. The intensity of the peak, on the other hand, depends on the damping and the tilt of the Dirac cones [20]. Note that without the inter-band effects, on the other hand, has no peak structure.
Another important finding is a smooth change in the polarity of . This is evidence that this material has an intrinsic zero-gap energy structure.
4. Electron Doping by the Annealing
As mentioned in the previous section, the dopant with the density of ppm order gave rise to the intense effects on the transport phenomena. The origin of the dopant is the instability of I3− anions in a crystal. In a sense, this is the natural doping. Annealing in a vacuum at high temperature, on the other hand, enhances the lack of I3− anions so that the mobile electrons are yielded. In this section, the effects of annealing on the transport phenomena in α-(BEDT-TTF)2I3 under the pressure are mentioned.
The density of the doped electron by the annealing depends on the parameters of its time and temperature. The annealing at temperature above 80 °C, however, changes the crystal structure from α- to β-types [48]. Thus, Miura et al. investigated the resistivity of a crystal with a parameter of the time with 10 min steps of annealing in a vacuum of 10−3 Pa at 70 °C [50]. The effects of anneal (doping) were clearly seen in the value of resistivity and its temperature dependence as shown in Figure 7a. The effects of annealing lead this crystal to a metal. At 4.2 K, for example, the resistivity is decreased by about two orders of magnitude in duration of 40 min annealing. It is expected that electrons were doped to this system.
Here we note that this experiment was performed by a single crystal. First step was to investigate the resistivity of α-(BEDT-TTF)2I3 under the pressure of 1.3 GPa. As the second step, the crystal was annealed in the duration of 10 min in a vacuum about 10−3 Pa at 70 °C after pressure was removed. Then, the resistivity of this crystal under the pressure of 1.3 GPa was investigated again. For the after steps, the doping of electrons by the annealing was repeated in the same way.
The polarity of the Hall coefficient indicated the electron doping successes. At low temperature, the variation in the electron density estimated from the Hall coefficient is almost same as that in the resistivity. It is increased by about two orders of magnitude in a 40 min of anneal at 4.2 K as shown in Figure 7b.
Here, let us return to Figure 7a. The resistivity per layer in the case without annealing expressed as in a wide temperature region is the characteristic transport in the massless Dirac electron system in which is located close to Dirac point as mentioned in Section 1. However, the system with far from the Dirac point lacks validity of this law. The resistivity of the case with annealed duration of 40 min shows the metallic behavior.
Figure 8 is the recent highlight. Tisserond et al. succeeded in detecting SdH oscillation in a thick crystal under pressure of 2.2 GPa at 200 mK. [51]. Note that it is doped as a side effect of the elaboration of the gold electrical contacts deposited by Joule evaporation, with an unintentional annealing. Careful analysis of SdH oscillations, however, conduced the correction of the Dirac cones in this system. In Section 6, this will be disclosed.
5. Hole Doping by Contact Electrification
By fixing a thin crystal onto a substrate weakly negatively charged as shown in Figure 4, the effects of carrier doping by contact electrification can be detected in the transport. The polarity of Hall resistance indicates that the hole doping is successful. Note that holes should be injected into a few layers (pairs of BEDT-TTF molecular layers and I3− anion layers). Main is the first from the interface.
5.1. Resistivity of α-(BEDT-TTF)2I3 on PEN Substrate under High Pressure
Figure 9 shows the temperature dependence of the resistivity of α-(BEDT-TTF)2I3 on PEN substrate under pressure of 1.7 GPa. We see clear effects of the hole-doping in the resistivity. First, the value of resistivity of the thin crystal on the PEN substrate is lower than those of the usual thick crystal. Most noticeable difference is seen at temperatures below 2 K. The resistivity for the thin crystal on the PEN substrate behaves as . This is the characteristic transport in the Fermi liquid state.
Thus, carrier injection into α-(BEDT-TTF)2I3 with a layered structure was successful. Note that the resistivity depends on the crystal thickness, because the number of carrier-doped layers is small, as mentioned before.
5.2. Observations of SdH Oscillations and Quantized Hall Resistance
The signature of the Dirac electrons is seen in the quantum transport. The magnetic field dependence of resistance and the Hall resistance in the thin crystal on the PEN substrate under pressure of approximately 1.7 GPa were investigated at 0.5 K. We find clear oscillation of as shown in Figure 10a. The oscillation as a function of indicates the SdH signal with a frequency of 9.18 T. The second-order differential of clearly depicts the oscillation in Figure 10b.
Here, we regard the origin of the SdH oscillation is 2D massless Dirac electrons. In the Dirac electron systems, the circular orbit around the Dirac point in the magnetic field would yield Berry phase as mentioned before. The effect of the phase of the SdH oscillation is further probed in the semi-classical magneto-oscillation description. In general, the component of the SdH oscillation written by
acquires the phase factor 1/2 or 0 for normal electrons with and Dirac particles with . Here, is the amplitude of the oscillation. We obtain phase factor by plotting the values of at the oscillation minima of as a function of their number, as shown in Figure 10c. The linear extrapolated values of approximately 1/2 at determine the phase factors , which are approximately 0. Thus, we identify the Dirac particles.
Here, we notice the split of the SdH oscillation at in Figure 10b. The SdH oscillation represents the density of states of the Landau levels. Thus, it indicates the Zeeman splitting of Landau level. The Landau level structure including its Zeeman splitting is written as
in which is the factor and is the Bohr magneton. Combined this relation of and with , the Fermi velocity is estimated to be m/s, in which and is the quantum flux.
The most significant finding is the quantum Hall state in this system. Two obvious plateaus are observed at magnetic fields of approximately 3.5 and 5.5 T, which show minima (Figure 10a). Based on the conventional 2D Dirac electron systems, the plateau is interpreted as follows.
quantization is in accordance with , in which is the quantized filling factor, and is the fourfold spin/valley degeneracy. An outstanding effect on the Dirac electron system is that the factor of half-integer exists. Thus, probes of the quantum Hall plateaux for are expected. In the data in Figure 10a, based on this step rule, for the first layer at plateau, or anomalies are required from SdH oscillations against the Landau index shown in Figure 11.
The estimation of from the values of plateau in this system, however, is a serious problem. The multilayered structure with a few hole-doped layers (mostly single layer) gives rise to the lack of the validity of the estimation of from the values of plateau because it depends on the thickness. On the other hand, the conductivities for the many undoped layers are finite. Hence, is not zero but shows minima at plateaux. At magnetic field, for example, we can see this effect on . In this magnetic field region, the polarity of is negative and yet holes are injected, as shown in Figure 10a. This is a frequently observed behavior of the present material induced by electron-type dopant (Section 3). However, detailed examination of the thickness (number of layer) dependence of the Hall conductivity revealed . For example, at plateau of 5.5 T in Figure 10a [46]. This is expected shown in Figure 11.
6. Correction of Dirac Cones
In Section 5, the detection of SdH oscillations, whose phase was modified by Berry phase, is evidence that this system is a 2D Dirac electron system. This measurement was done in the magnetic field below 7 T at 0.5 K. However, recent examination of the SdH oscillations at the magnetic field up to 12 T by Tisserond et al. suggested the correction of the Dirac cones [51]. In this section, the SdH signals in the high magnetic field are interpreted within the model of distorted Dirac cones.
The detections of the SdH oscillations were done by two carrier doping methods: anneal (Sample A: Figure 8) and contact electrification (Sample B). Both the oscillations with the periodicities and the phase factors of the Berry phase indicate that the Dirac carriers are involved at low magnetic field. At high magnetic field, however, both the SdH signals are very peculiar. Both oscillations lost oscillations periodicity as shown in Figure 12 [51]. The detail structure of Dirac cones shows up the non-periodic SdH oscillations of the high magnetic field [52].
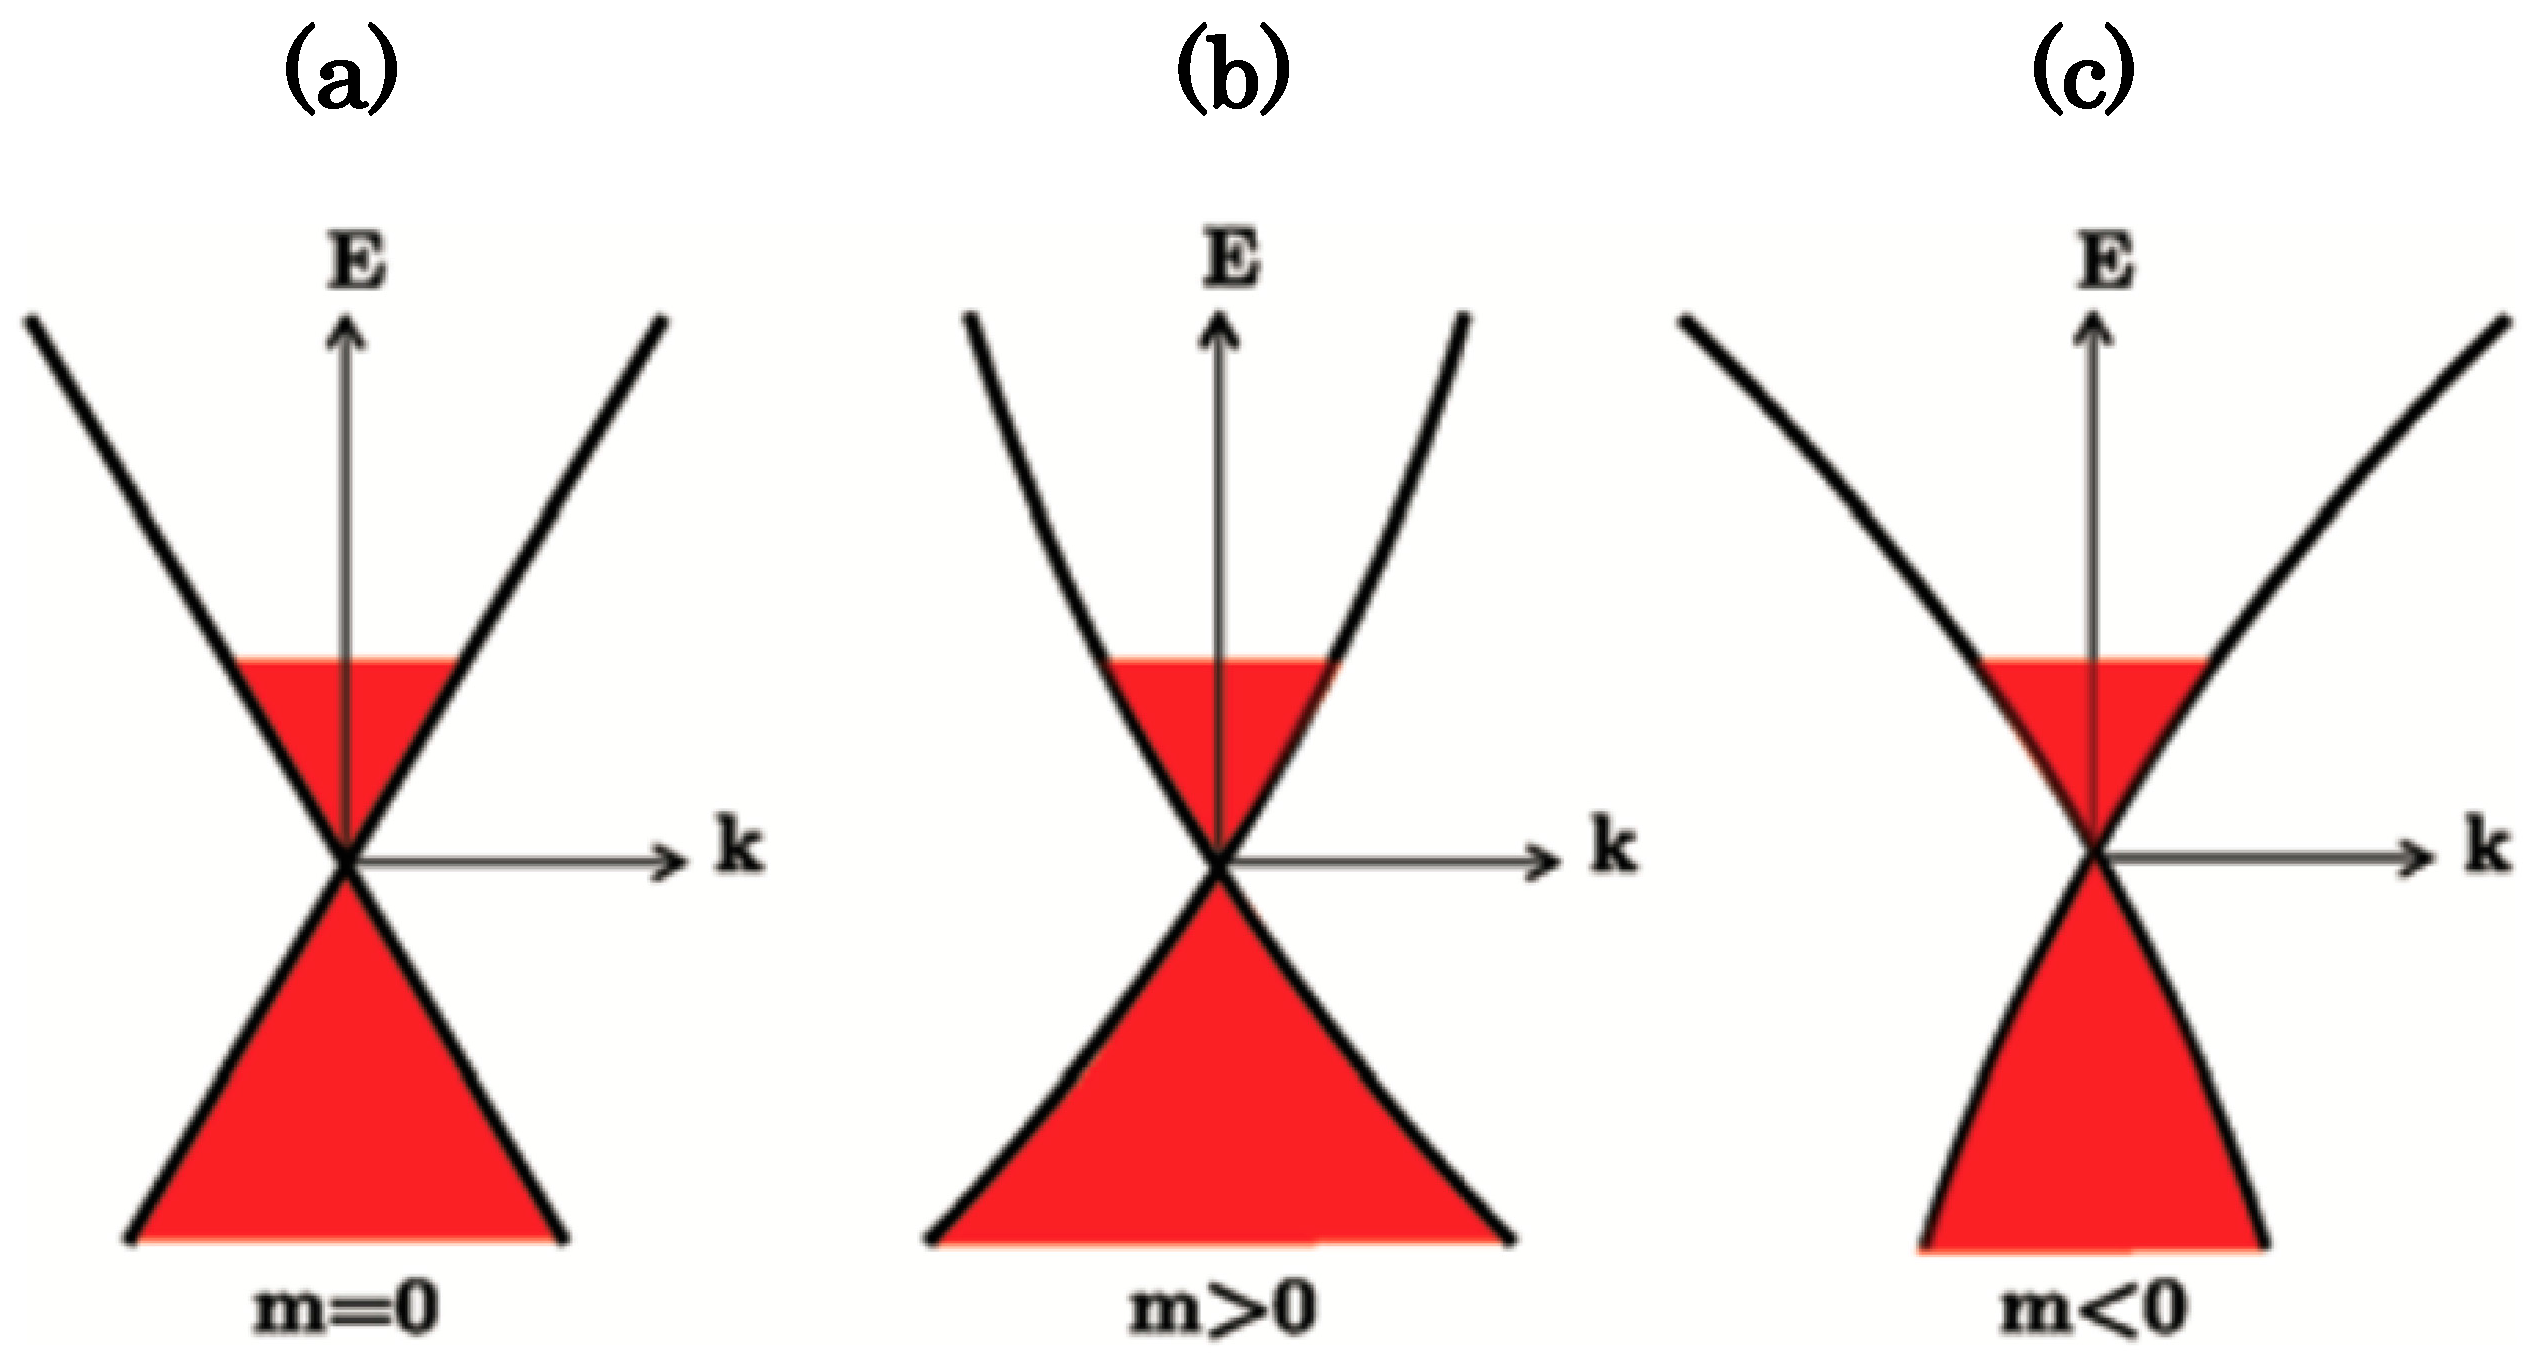
Tisserond et al. interpreted the SdH signals shown in Figure 12 based on the picture of distorted Dirac cones, of which the Hamiltonian is written as , in which mass is the curvature term. Figure 13 is the sketch of distorted Dirac cones. In the magnetic field, by the gauge transformation from into , the Landau level structure without Zeeman effect term is calculated as
in which and . The positive part of this equation corresponds to the conduction band contribution and the negative part to that of the valence band. The curves (solid lines) of Landau index against reproduced well the experimental curve as shown in Figure 13. The best fit mass parameter for Sample A is . For Sample B, on the other hand, it is to be . Note that others possible causes, such as a cone tilting or a Zeeman effect, are carefully ruled out in the Reference [46] and its Supplementary Materials.
The proposed interpretation corrects the band structure from (a) massless Dirac cone to distorted Dirac cone with (b) or (c) shown in Figure 13. This electron-hole asymmetry explains the temperature dependence of the chemical potential mentioned in Section 3 [12,20]. It suggests distorted Dirac cone shown in Figure 13b. Moreover, recent realistic calculations of the energy band and Landau level structures in this system by Kishigi and Hasegawa support our experimental results and those interpreted qualitatively [53].
7. Summary
We summarize this review as follows.
The effects of carrier doping on the peculiar (quantum) transport phenomena in α-(BEDT-TTF)2I3 under high pressure were described. We presented three unique methods for the carrier doping of this system. First, unstable I3− anions yield the dopant in the crystal. This effect led to the detection of anomalous Hall conductivity that originated from the inter-band effects of the magnetic field; second, subjects that were annealed in a vacuum at high temperature enhanced the lack of I3− anions so that the mobile electrons were yielded. The effects of annealing on the transport phenomena in α-(BEDT-TTF)2I3 under pressure were mentioned. Tisserond et al. succeeded in detecting SdH oscillation in a thick crystal under pressure of 2.2 GPa at 200 mK [51]. Lastly, we presented the effects of the carrier doping by the contact electrification on the transport phenomena. Only by fixing a thin crystal onto a substrate weakly negatively charged by contact electrification, the effects of carrier doping can be detected in the transport. A significant finding is the SdH oscillation and the quantum Hall effect characterized by the Dirac type energy structure. Moreover, the distortion of the band structure Dirac cones was revealed.
The effects of carrier doping became more important for the organic Dirac electron system. However, control of the Fermi energy has not been achieved yet. Control of the Fermi energy and further investigations will lead us to interesting phenomena.
Acknowledgments
We thank M. Monteverde, Miura, T. Yamauchi, T. Yamaguchi, Y. Kawasugi, M. Suda, H. M. Yamamoto, R. Kato, Y. Nishio, K. Kajita, T. Morinari, A. Kobayashi, Y. Suzumura, and H. Fukuyama for valuable discussions. This work was supported by a Grant-in-Aid for Scientific Research (A) (No. 15H02108), (S) (No. 16H06346), (B) (No. 25287089), from the Ministry of Education, Culture, Sports, Science, and Technology, Japan.
Conflicts of Interest
The author declares no conflict of interest.
References
- Novoselov, K.S.; Geim, A.K.; Morozov, S.V.; Jiang, D.; Katsnelson, M.I.; Grigorieva, I.V.; Dubonos, S.V.; Firsov, A.A. Two-dimensional gas of massless Dirac fermions in grapheme. Nature 2005, 438, 197–200. [Google Scholar] [CrossRef] [PubMed] [Green Version]
- Zhang, Y.; Tan, Y.W.; Stormer, H.; Kim, P. Experimental observation of the quantum Hall effect and Berry’s phase in grapheme. Nature 2005, 438, 201–204. [Google Scholar] [CrossRef] [PubMed]
- Kempa, H.; Esquinazi, P.; Kopelevich, Y. Field-induced metal-insulator transition in the c-axis resistivity of graphite. Phys. Rev. B 2002, 65, 241101. [Google Scholar] [CrossRef]
- Luk’yanchuk, I.A.; Kopelevich, Y. Phase Analysis of Quantum Oscillations in Graphite. Phys. Rev. Lett. 2004, 93, 166402. [Google Scholar] [CrossRef] [PubMed]
- Fuseya, Y.; Ogata, M.; Fukuyama, H. Interband Contributions from the Magnetic Field on Hall Effects for Dirac Electrons in Bismuth. Phys. Rev. Lett. 2009, 102, 066601. [Google Scholar] [CrossRef] [PubMed]
- Richard, P.; Nakayama, K.; Sato, T.; Neupane, M.; Xu, Y.-M.; Bowen, J.H.; Chen, G.F.; Luo, J.L.; Wang, N.L.; Dai, X.; et al. Observation of Dirac Cone Electronic Dispersion in BaFe2As2. Phys. Rev. Lett. 2010, 104, 137001. [Google Scholar] [CrossRef] [PubMed]
- Zhang, H.; Liu, C.-X.; Qi, X.-L.; Dai, X.; Fang, Z.; Zhang, S.-C. Topological insulators in Bi2Se3, Bi2Te3 and Sb2Te3 with a single Dirac cone on the surface. Nat. Phys. 2009, 5, 438–442. [Google Scholar] [CrossRef]
- Tajima, N.; Tamura, M.; Nishio, Y.; Kajita, K.; Iye, Y. Transport property of an organic conductor α-(BEDT-TTF)2I3 under high pressure: Discovery of a novel type of conductor. J. Phys. Soc. Jpn. 2000, 69, 543–551. [Google Scholar] [CrossRef]
- Tajima, N.; Sugawara, S.; Tamura, M.; Kato, R.; Nishio, Y.; Kajita, K. Electronic phases in an organic conductor α-(BEDT-TTF)2I3: Ultra narrow gap semiconductor, superconductor, metal, and charge-ordered insulator. J. Phys. Soc. Jpn. 2006, 75, 051010. [Google Scholar] [CrossRef]
- Tajima, N.; Sugawara, S.; Tamura, M.; Kato, R.; Nishio, Y.; Kajita, K. Transport properties of massless Dirac fermions in an organic conductor α-(BEDT-TTF)2I3 under pressure. Europhys. Lett. 2007, 80, 47002. [Google Scholar] [CrossRef]
- Tajima, N.; Sugawara, S.; Kato, R.; Nishio, Y.; Kajita, K. Effect of the zero-mode Landau level on interlayer magnetoresistance in multilayer massless dirac fermion systems. Phys. Rev. Lett. 2009, 102, 176403. [Google Scholar] [CrossRef] [PubMed]
- Tajima, N.; Kato, R.; Sugawara, S.; Nishio, Y.; Kajita, K. Inter-band effects of magnetic field on Hall conductivity in the multilayered massless Dirac fermion system α-(BEDT-TTF)2I3. Phys. Rev. B 2012, 85, 033401. [Google Scholar] [CrossRef]
- Kobayashi, A.; Katayama, S.; Noguchi, K.; Suzumura, Y. Superconductivity in Charge Ordered Organic Conductor –α-(ET)2I3 Salt–. J. Phys. Soc. Jpn. 2004, 73, 3135–3148. [Google Scholar] [CrossRef]
- Katayama, S.; Kobayashi, A.; Suzumura, Y. Pressure-induced zero-gap semiconducting state in organic conductor α-(BEDT-TTF)2I3 Salt. J. Phys. Soc. Jpn. 2006, 75, 054705. [Google Scholar] [CrossRef]
- Kino, H.; Miyazaki, T. First-principles study of electronic structure in α-(BEDT-TTF)2I3 at ambient pressure and with uniaxial strain. J. Phys. Soc. Jpn. 2006, 75, 034704. [Google Scholar] [CrossRef]
- Kajita, K.; Nishio, Y.; Tajima, N.; Suzumura, Y.; Kobayashi, A. Molecular Dirac Fermion Systems—Theoretical and Experimental Approaches—. J. Phys. Soc. Jpn. 2014, 83, 072002. [Google Scholar] [CrossRef]
- Bender, K.; Hennig, I.; Schweitzer, D.; Dietz, K.; Endres, H.; Keller, H.J. Synthesis, structure and physical properties of a two-dimensional organic metal, di[bis(ethylenedithiolo)tetrathiofulva lene] triiodide, (BEDT-TTF)+2I−3. Mol. Cryst. Liq. Cryst. 1984, 108, 359–371. [Google Scholar] [CrossRef]
- Konoike, T.; Uchida, T.; Osada, T. Specific heat of the multilayered massless Dirac fermion system. J. Phys. Soc. Jpn. 2012, 81, 043601. [Google Scholar] [CrossRef]
- Hirata, M.; Ishikawa, K.; Miyagawa, K.; Tamura, M.; Berthier, C.; Basko, D.; Kobayashi, A.; Matsuno, G.; Kanoda, K. Observation of an anisotropic Dirac cone reshaping and ferrimagnetic spin polarization in an organic conductor. Nat. Commun. 2016, 7, 12666. [Google Scholar] [CrossRef] [PubMed]
- Kobayashi, A.; Suzumura, Y.; Fukuyama, H. Hall Effect and Orbital Diamagnetism in Zerogap State of Molecular Conductor α-(BEDT-TTF)2I3. J. Phys. Soc. Jpn. 2008, 77, 064718. [Google Scholar] [CrossRef]
- Kobayashi, A.; Suzumura, Y.; Fukuyama, H.; Goerbig, O. Tilted-cone-induced easy-plane pseudo-spin ferromagnet and Kosterlitz–Thouless transition in massless Dirac fermions. J. Phys. Soc. Jpn. 2009, 78, 114711. [Google Scholar] [CrossRef]
- Proskrin, I.; Ogata, M.; Suzumura, Y. Longitudinal conductivity of massless fermions with tilted Dirac cone in magnetic field. Phys. Rev. B 2015, 91, 195413. [Google Scholar] [CrossRef]
- Suzumura, Y.; Proskrin, I.; Ogata, M. Effect of tilting on the in-plane conductivity of Dirac electrons in organic conductor. J. Phys. Soc. Jpn. 2014, 83, 023701. [Google Scholar] [CrossRef]
- Liu, D.; Ishikawa, K.; Takehara, R.; Miyagawa, K.; Tamura, M.; Kanoda, K. Insulating Nature of Strongly Correlated Massless Dirac Fermions in an Organic Crystal. Phys. Rev. Lett. 2016, 116, 226401. [Google Scholar] [CrossRef] [PubMed]
- Hirara, M.; Ishikawa, K.; Matsuno, G.; Kobayashi, A.; Miyagawa, K.; Tamura, M.; Berthier, C.; Kanoda, K. Anomalous spin correlations and excitonic instability of interacting 2D Weyl fermions. Science 2017, 358, 1403–1406. [Google Scholar] [CrossRef] [PubMed]
- Shibaeva, R.P.; Kaminskii, V.F.; Yagubskii, E.B. Crystal structures of organic metals and superconductors of (BEDT-TTP)-I system. Mol. Cryst. Liq. Cryst. 1985, 119, 361–373. [Google Scholar] [CrossRef]
- Kobayashi, H.; Kato, R.; Kobayashi, A.; Nishio, Y.; Kajita, K.; Sasaki, W. Crystal and electronic structures of layered molecular superconductor, θ-(BEDT-TTF)2(I3)1−x(AuI2)x. Chem. Lett. 1986, 15, 833–836. [Google Scholar] [CrossRef]
- Kobayashi, H.; Kato, R.; Kobayashi, A.; Nishio, Y.; Kajita, K.; Sasaki, W. A new molecular superconductor, (BEDT-TTF)2(I3)1−x(AuI2)x (x < 0.02). Chem. Lett. 1986, 15, 789–792. [Google Scholar]
- Rothaemel, B.; Forro, L.; Cooper, J.R.; Schilling, J.S.; Weger, M.; Bele, P.; Brunner, H.; Schweitzer, D.; Keller, H.J. Magnetic susceptibility of α and β phases of di[bis(ethylenediothiolo) tetrathiafulvalene] tri-iodide [(BEDT-TTF)2I3] under pressure. Phys. Rev. B 1986, 34, 704–712. [Google Scholar] [CrossRef]
- Kino, H.; Fukuyama, H. On the phase transition of α-(ET)2I3. J. Phys. Soc. Jpn. 1995, 64, 1877–1880. [Google Scholar] [CrossRef]
- Seo, H. Charge ordering in organic ET compounds. J. Phys. Soc. Jpn. 2000, 69, 805–820. [Google Scholar] [CrossRef]
- Takano, Y.; Hiraki, K.; Yamamoto, H.M.; Nakamura, T.; Takahashi, T. Charge disproportionation in the organic conductor, α-(BEDT-TTF)2I3. J. Phys. Chem. Solids 2001, 62, 393–395. [Google Scholar] [CrossRef]
- Wojciechowski, R.; Yamamoto, K.; Yakushi, K.; Inokuchi, M.; Kawamoto, A. High-pressure Raman study of the charge ordering in α-(BEDT-TTF)2I3. Phys. Rev. B 2003, 67, 224105. [Google Scholar] [CrossRef]
- Moldenhauer, J.; Horn, C.H.; Pokhodnia, K.I.; Schweitzer, D.; Heinen, I.; Keller, H.J. FT-IR absorption spectroscopy of BEDT-TTF radical salts: Charge transfer and donor-anion interaction. Synth. Met. 1993, 60, 31–38. [Google Scholar] [CrossRef]
- Kakiuchi1, T.; Wakabayashi, Y.; Sawa, H.; Takahashi, T.; Nakamura, T. Charge ordering in α-(BEDT-TTF)2I3 by synchrotron X-ray diffraction. J. Phys. Soc. Jpn. 2007, 76, 113702. [Google Scholar] [CrossRef]
- Ojiro, T.; Kajita, K.; Nishio, Y.; Kobayashi, H.; Kobayashi, A.; Kato, R.; Iye, Y. A new magneto-pressure phase in α-(BEDT-TTF)2I3. Synth. Met. 1993, 56, 2268–2273. [Google Scholar] [CrossRef]
- Kajita, K.; Ojiro, T.; Fujii, H.; Nishio, Y.; Kobayashi, H.; Kobayashi, A.; Kato, R. Magnetotransport Phenomena of α-Type (BEDT-TTF)2I3 under High Pressures. J. Phys. Soc. Jpn. 1993, 61, 23–26. [Google Scholar] [CrossRef]
- Mott, N.F.; Davis, E.A. Elecron Processes in Non-Crystalline Materials; Clarendon: Oxford, UK, 1979. [Google Scholar]
- Shon, N.H.; Ando, T. Quantum transport in Two-dimensional graphite system. J. Phys. Soc. Jpn. 1998, 67, 2421–2429. [Google Scholar] [CrossRef]
- Ziegler, K. Delocalization of 2D dirac fermions: The role of a broken supersymmetry. Phys. Rev. Lett. 1998, 80, 3113–3116. [Google Scholar] [CrossRef]
- Nomura, K.; MacDonald, A.H. Quantum transport of massless dirac fermions. Phys. Rev. Lett. 2007, 98, 076602. [Google Scholar] [CrossRef] [PubMed]
- Ando, T. Theory of electronic states and transport in carbon nanotubes. J. Phys. Soc. Jpn. 2005, 74, 777–817. [Google Scholar] [CrossRef]
- Osada, T. Negative interlayer magnetoresistance and Zero-Mode landau level in multilayer Dirac electron systems. J. Phys. Soc. Jpn. 2008, 77, 084711. [Google Scholar] [CrossRef]
- Sugawara, S.; Tamura, M.; Tajima, N.; Sato, M.; Nishio, Y.; Kajita, K.; Kato, R. Temperature dependence of inter-layer longitudinal magnetoresistance in α-(BEDT-TTF)2I3: Positive versus negative contributions in a tilted Dirac cone system. J. Phys. Soc. Jpn. 2010, 79, 113704. [Google Scholar] [CrossRef]
- Tajima, N.; Sato, M.; Sugawara, S.; Kato, R.; Nishio, Y.; Kajita, K. Spin and valley splittings in multilayered massless Dirac fermion system. Phys. Rev. B 2010, 82, 121420. [Google Scholar] [CrossRef]
- Tajima, N.; Yamauchi, T.; Yamaguchi, T.; Suda, M.; Kawasugi, Y.; Yamamoto, H.M.; Kato, R.; Nishio, Y.; Kajita, K. Quantum Hall effect in multilayered massless Dirac fermion systems with tilted cones. Phys. Rev. B 2013, 88, 075315. [Google Scholar] [CrossRef]
- Fukuyama, H. Anomalous orbital magnetism and hall effect of massless fermions in two dimension. J. Phys. Soc. Jpn. 2007, 76, 043711. [Google Scholar] [CrossRef]
- Pokhodnia, K.I.; Graja, A.; Weger, M.; Schweitzer, D. Resonant Raman scattering from superconducting single crystals of (BEDT-TTF)2I3. Z. Phys. B 1993, 90, 127–133. [Google Scholar] [CrossRef]
- Yoshimura, M.; Shigekawa, H.; Kawabata, K.; Saito, Y.; Kawazu, A. STM study of thin films of BEDT-TTF iodide. Appl. Surf. Sci. 1992, 61, 317–320. [Google Scholar] [CrossRef]
- Miura, K. Effects of Annealing on the Transport in an Organic Zero-Gap Conductor α-(BEDT-TTF)2I3. Master’s Thesis, Toho University, Chiba, Japan, 2011. (Supplementary material, 2017). [Google Scholar]
- Tisserond, E.; Fuchs, J.N.; Goerbig, M.O.; Auban-Senzier, P.; Meziere, C.; Batail, P.; Kawasugi, Y.; Suda, M.; Yamamoto, H.M.; Kato, R.; et al. Aperiodic quantum oscillations of particle-hole asymmetric Dirac cones. Europhys. Lett. 2017, 119, 67001. [Google Scholar] [CrossRef]
- Fortin, J.-Y.; Audouard, A. Effect of electronic band dispersion curvature on de Haas-van Alphen oscillations. Eur. Phys. J. B 2015, 88, 225. [Google Scholar] [CrossRef]
- Kishigi, K.; Hasegawa, Y. Three-quarter Dirac points, Landau levels, and magnetization in α-(BEDT-TTF)2I3. Phys. Rev. B 2017, 96, 085430. [Google Scholar] [CrossRef]
Figure 1.
(a) BEDT-TTF molecule and I3− anion, crystal structure of α-(BEDT-TTF)2I3 viewed from (b) a-axis and (c) c-axis, (d) band structure, and (e) energy contours near a Dirac point. Note that we take the origin to the position of the Dirac point.
Figure 1.
(a) BEDT-TTF molecule and I3− anion, crystal structure of α-(BEDT-TTF)2I3 viewed from (b) a-axis and (c) c-axis, (d) band structure, and (e) energy contours near a Dirac point. Note that we take the origin to the position of the Dirac point.

Figure 2.
The carrier density and the mobility under the pressure of GPa against the temperature. Close circles show the effective carrier density and the mobility estimated from the Hall coefficient () and the conductivity (). The magnetoresistance mobility and the density , on the other hand, is shown by open square. The carrier density obeys from 10 K to 50 K (indicated by broken lines). Reproduced with permission from [9].
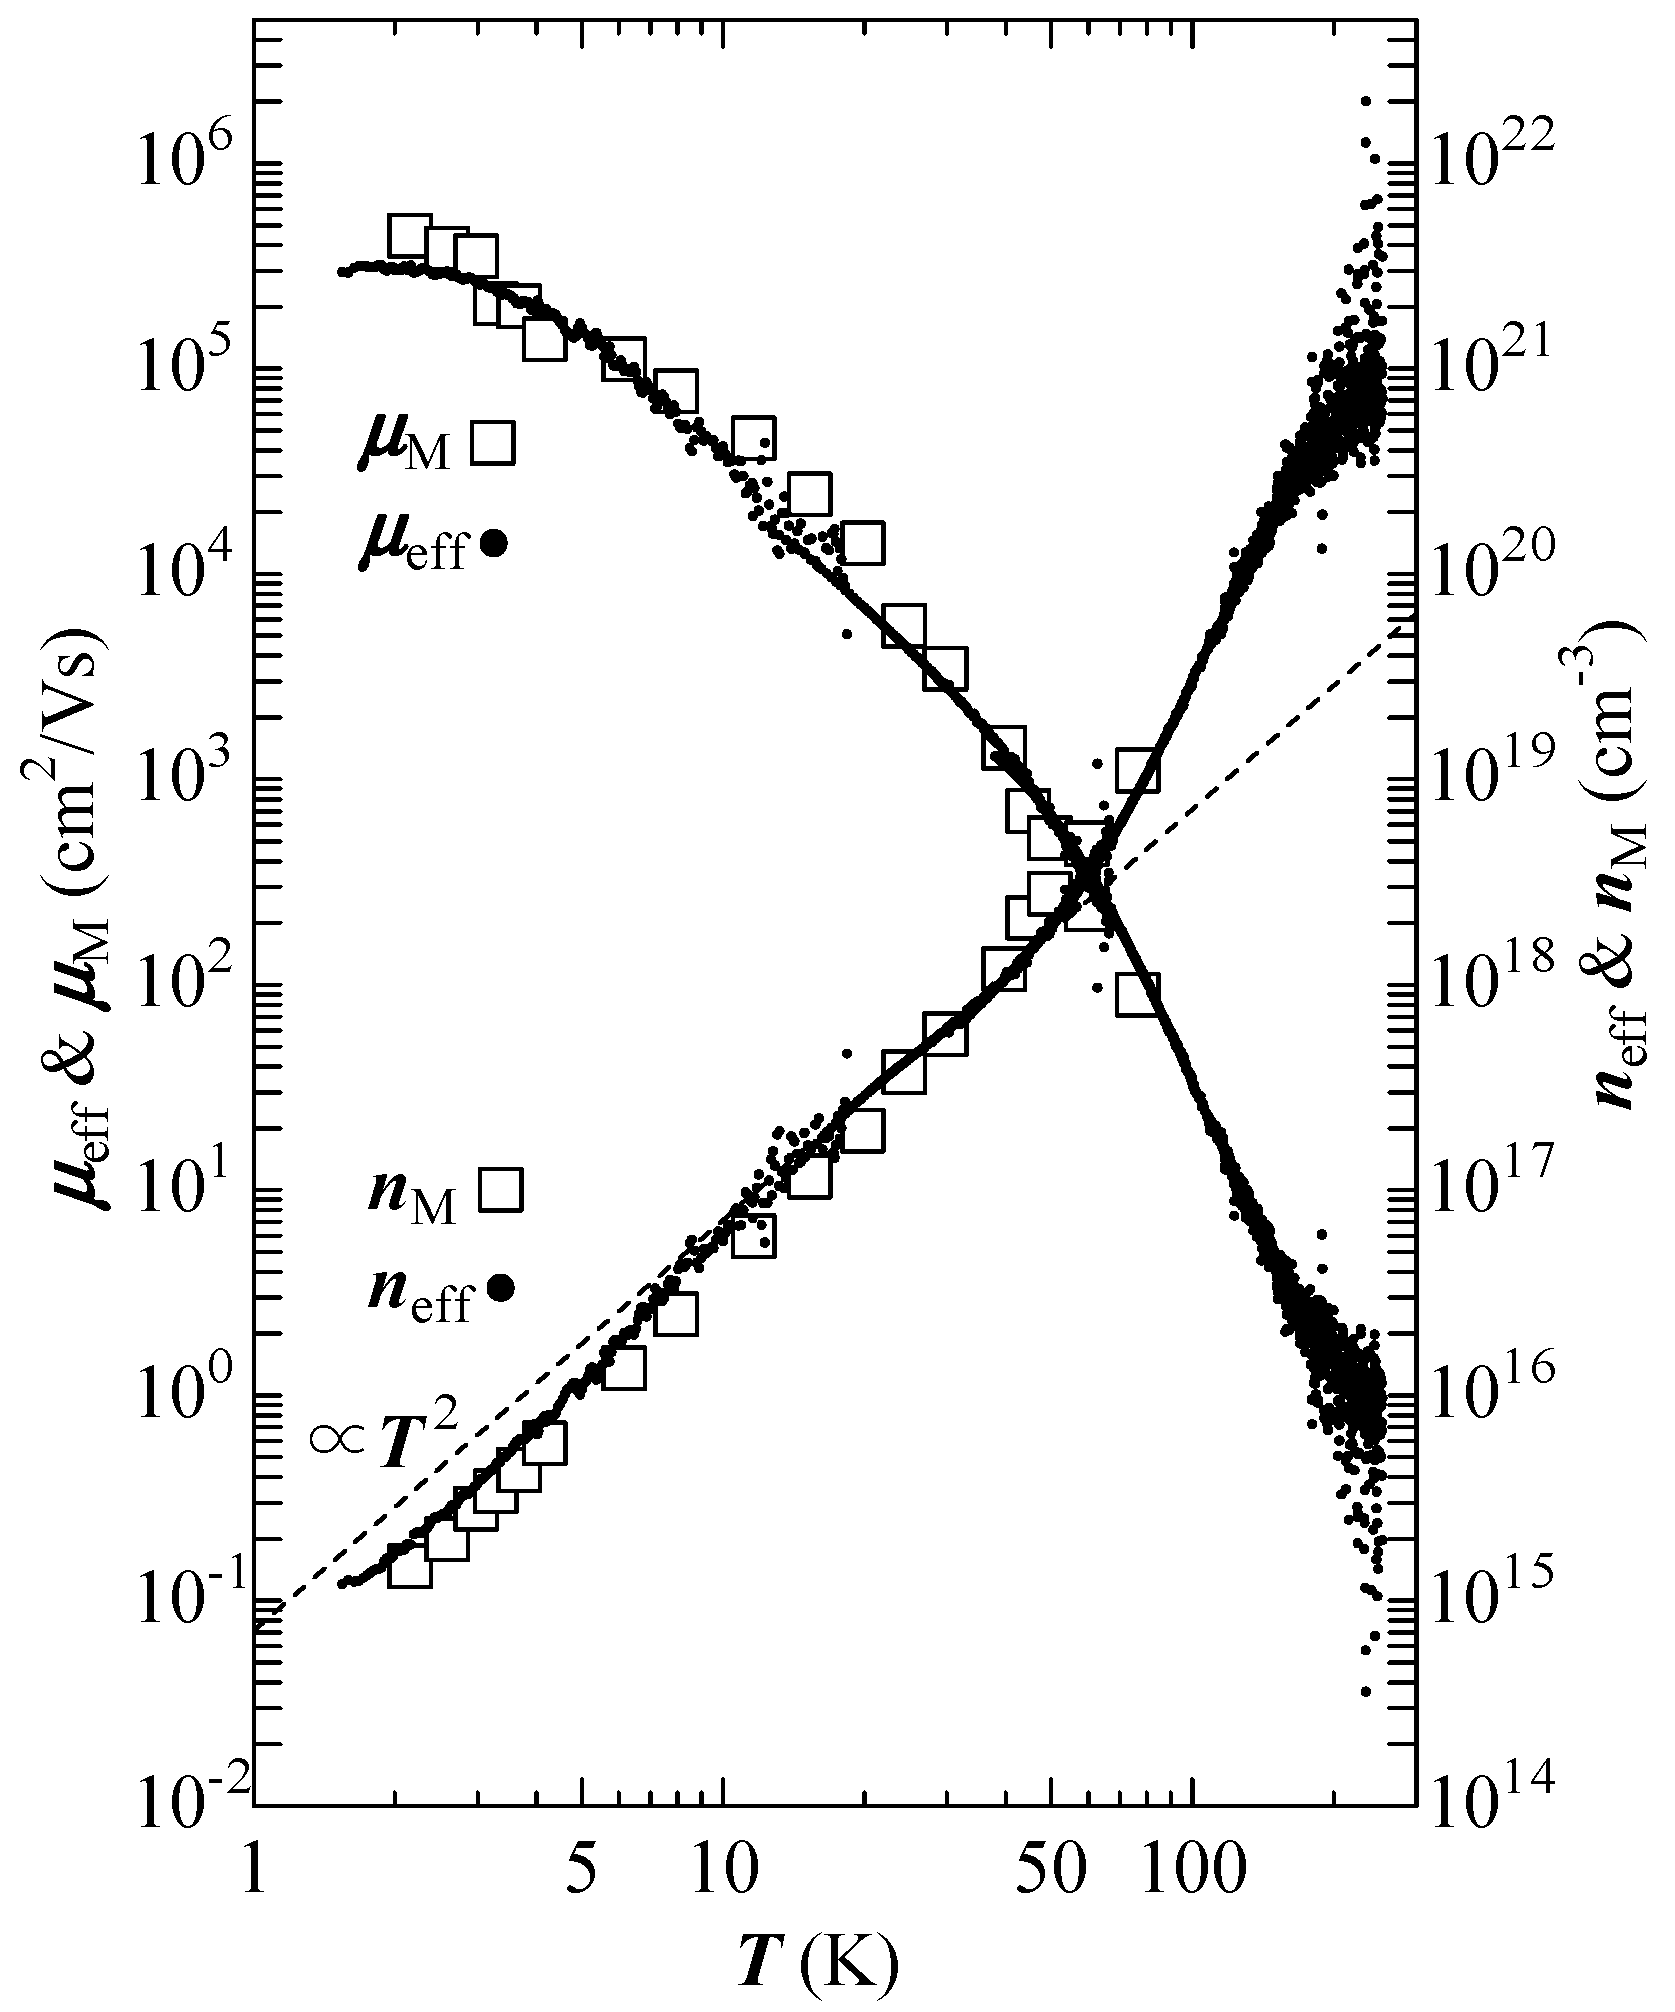
Figure 3.
Field dependence of the interlayer magnetoresistance for 1.7 GPa at 4 K [11]. Remarkable negative magnetoresistance is observed at T. Fitting curve (red line) is an Equation in the negative magnetoresistance region, in which is a fitting parameter that depends on the purity of a crystal [36].

Figure 4.
(a) Crystal structure of α-(BEDT-TTF)2I3 viewed from the a-axis; (b) schematic diagram of this system. The thickness of the crystal measured with a step profiler was approximately 100 nm; (c) optical image of a single crystal on a PEN substrate in the processed form. The crystal was cut using a pulsed laser beam with a wavelength of 532 nm. The scale bar is approximately 0.2 mm.
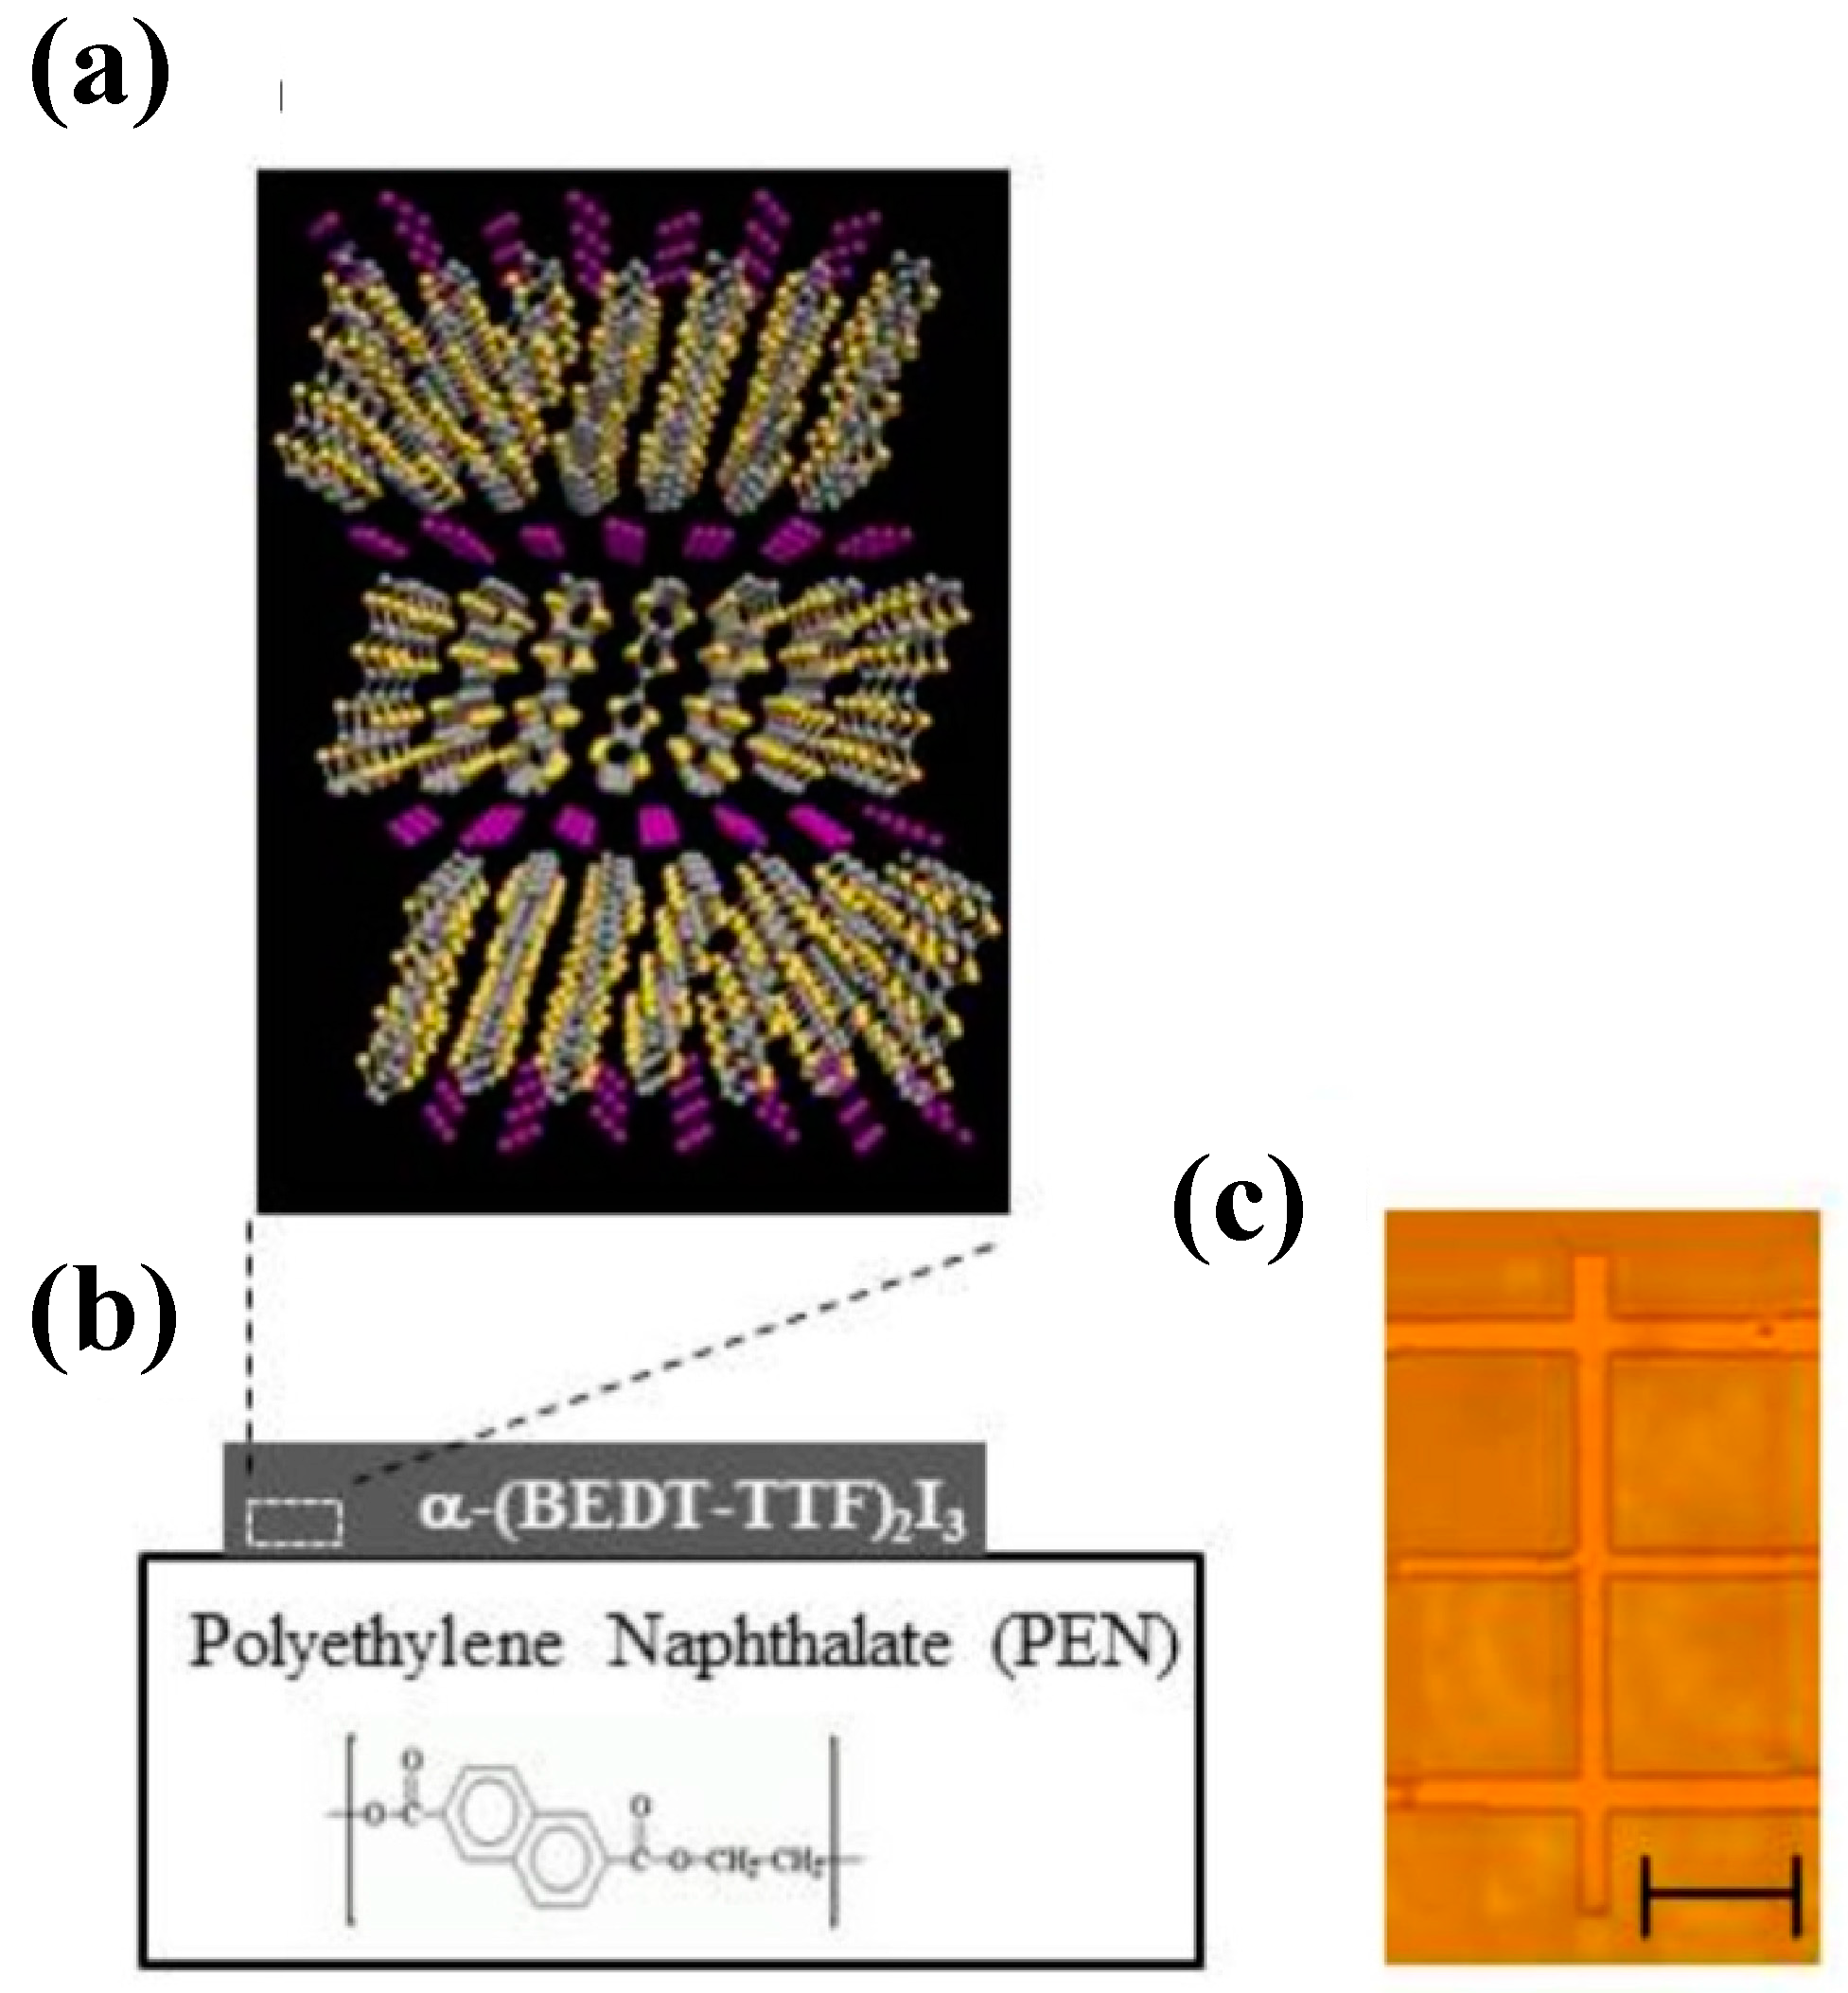
Figure 5.
(a) Temperature dependence of for seven samples under pressure of 1.8 GPa. at temperature below 10 K is shown in the inset; (b,c) is the temperature dependence of for hole-doped-type and electron-doped-type samples. Note that the absolute value of is plotted. Thus, the dips in (c) indicate a change in the polarity. The inset of (b,c) shows the schematic illustration of the Fermi levels.

Figure 6.
(a) Temperature dependence of the Hall conductivity for n1 and n7 in Figure 5; (b) chemical-potential dependence of the Hall conductivity for n1 and n7. Solid lines and dashed lines are the theoretical curves with and without the inter-band effects of the magnetic field by Kobayashi et al., respectively [20]. Reproduced with permission from [11].
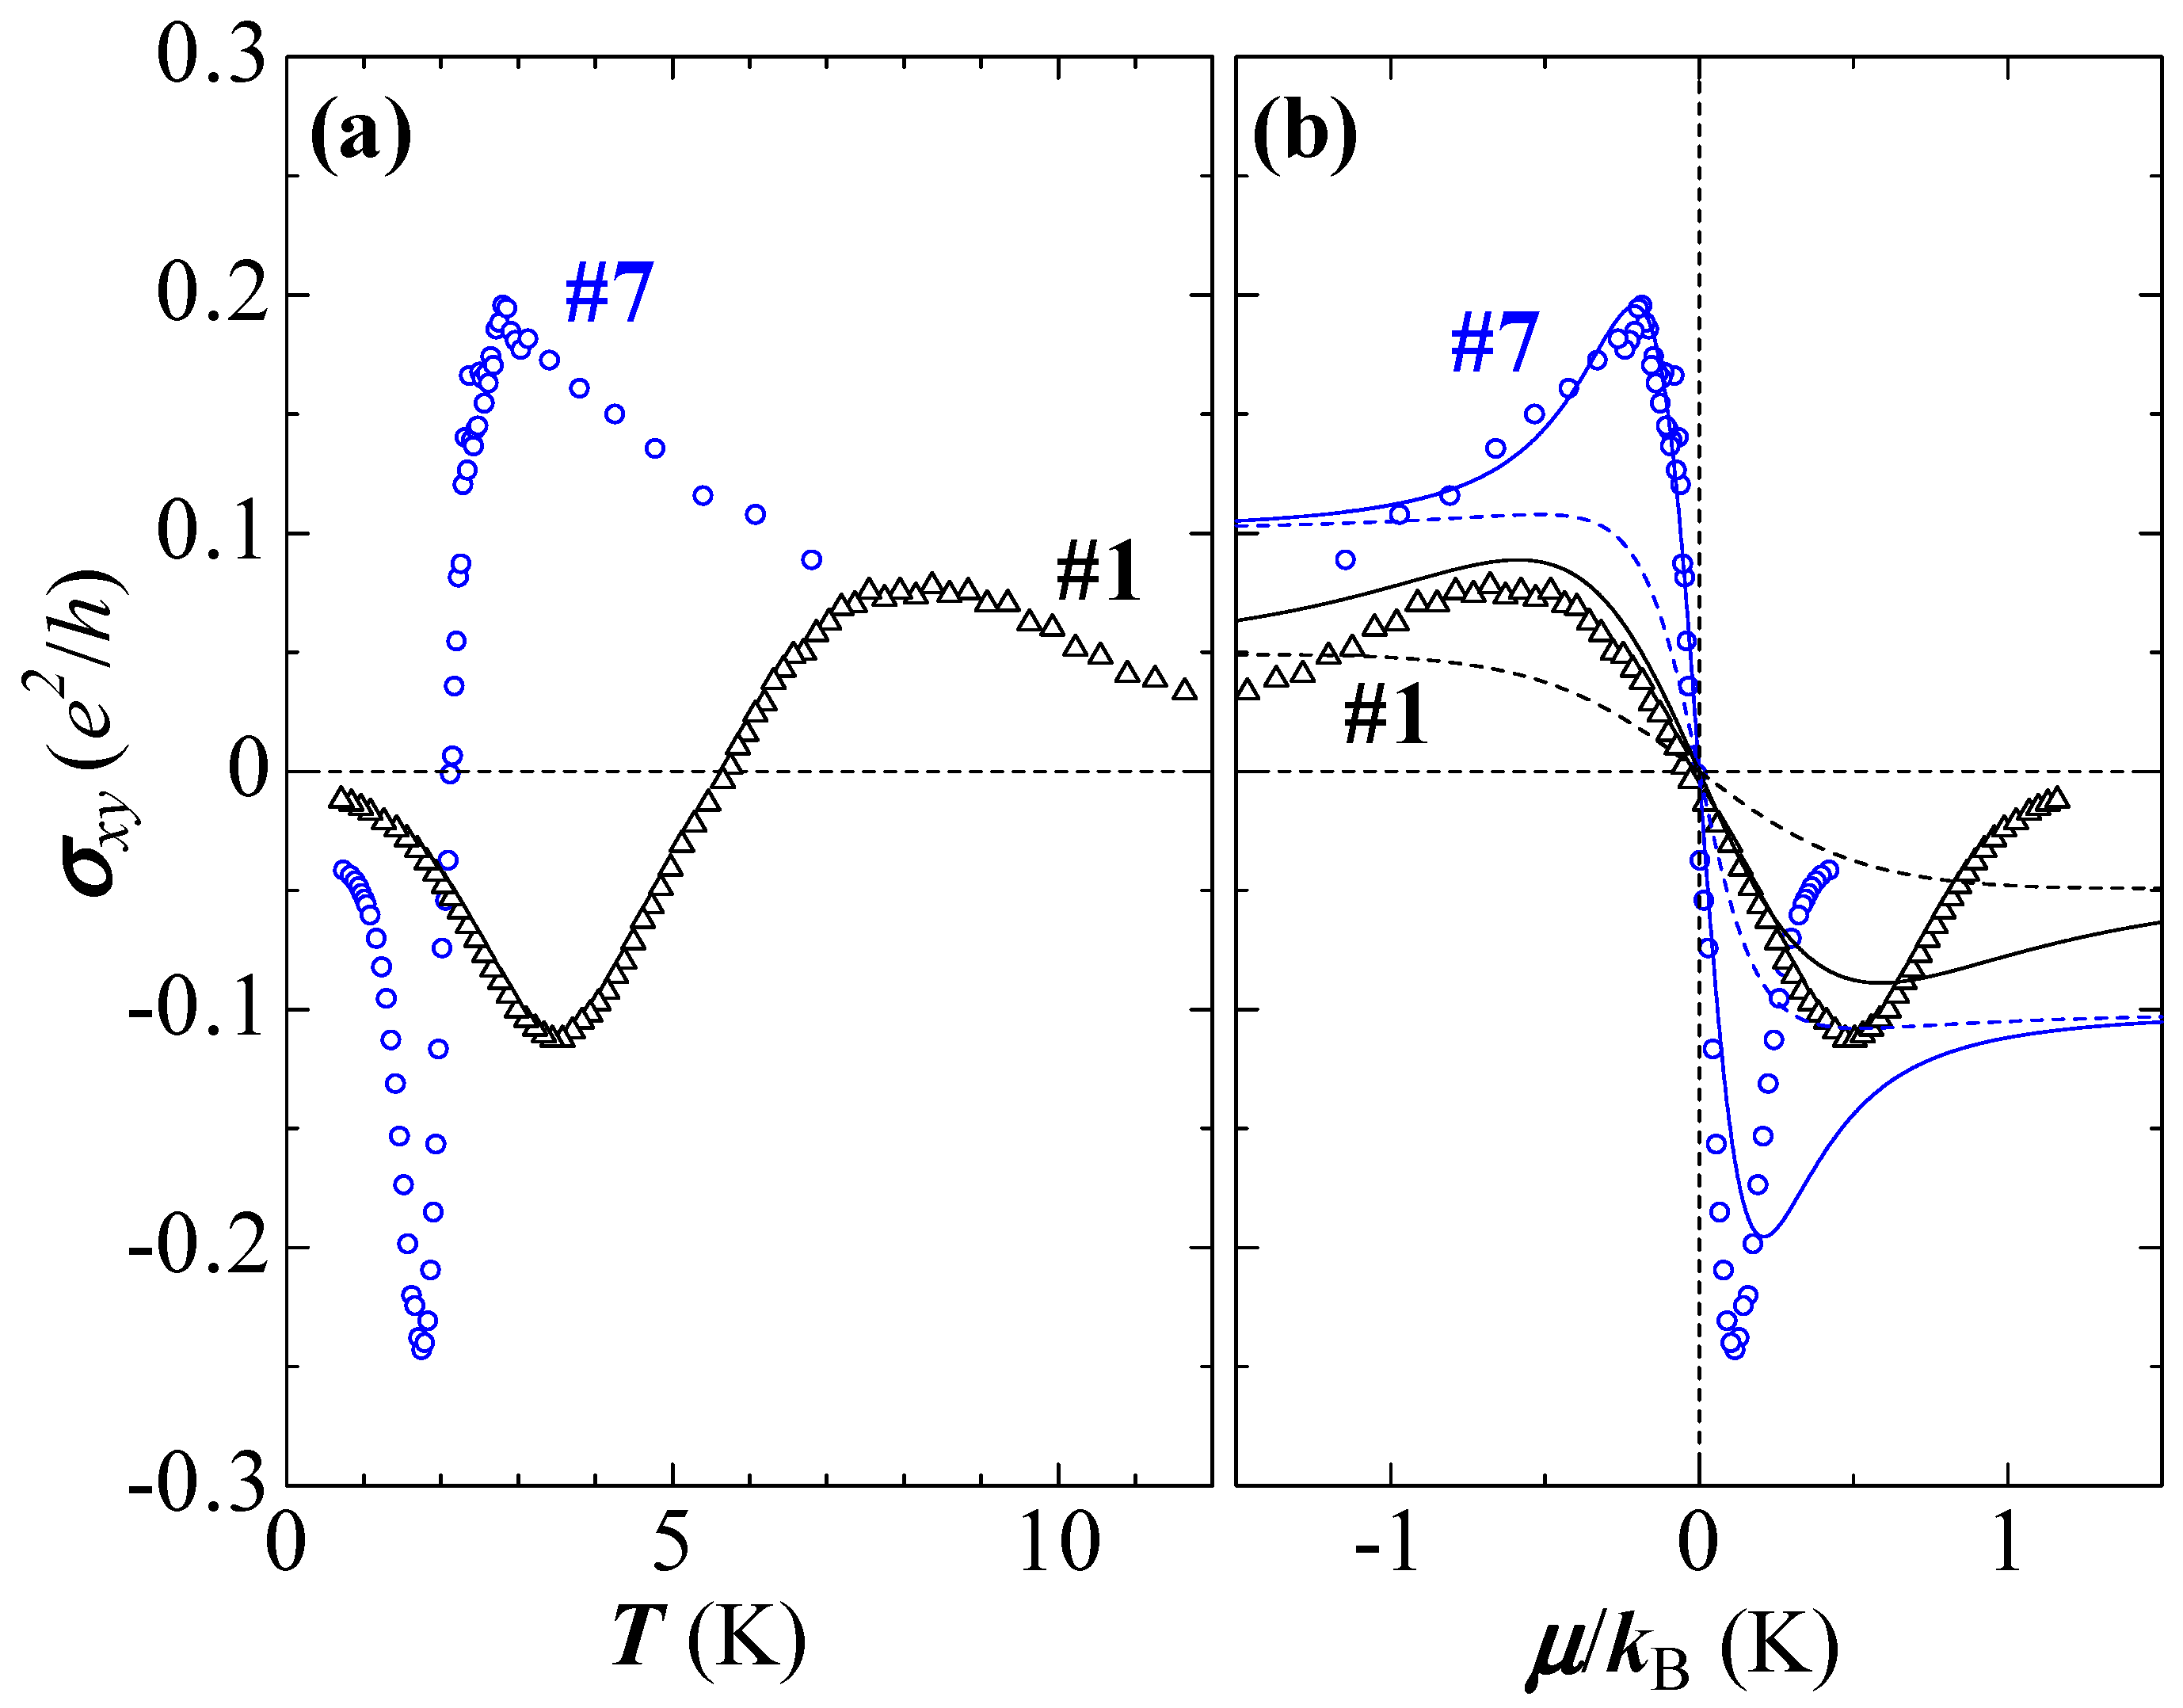
Figure 7.
(a) Effects of the annealing on the resistivity in α-(BEDT-TTF)2I3 under pressure of 1.3 GPa; (b) annealing time dependence of electron density at 4.2 K and 1.6 K. Reproduced with permission from [50,51].
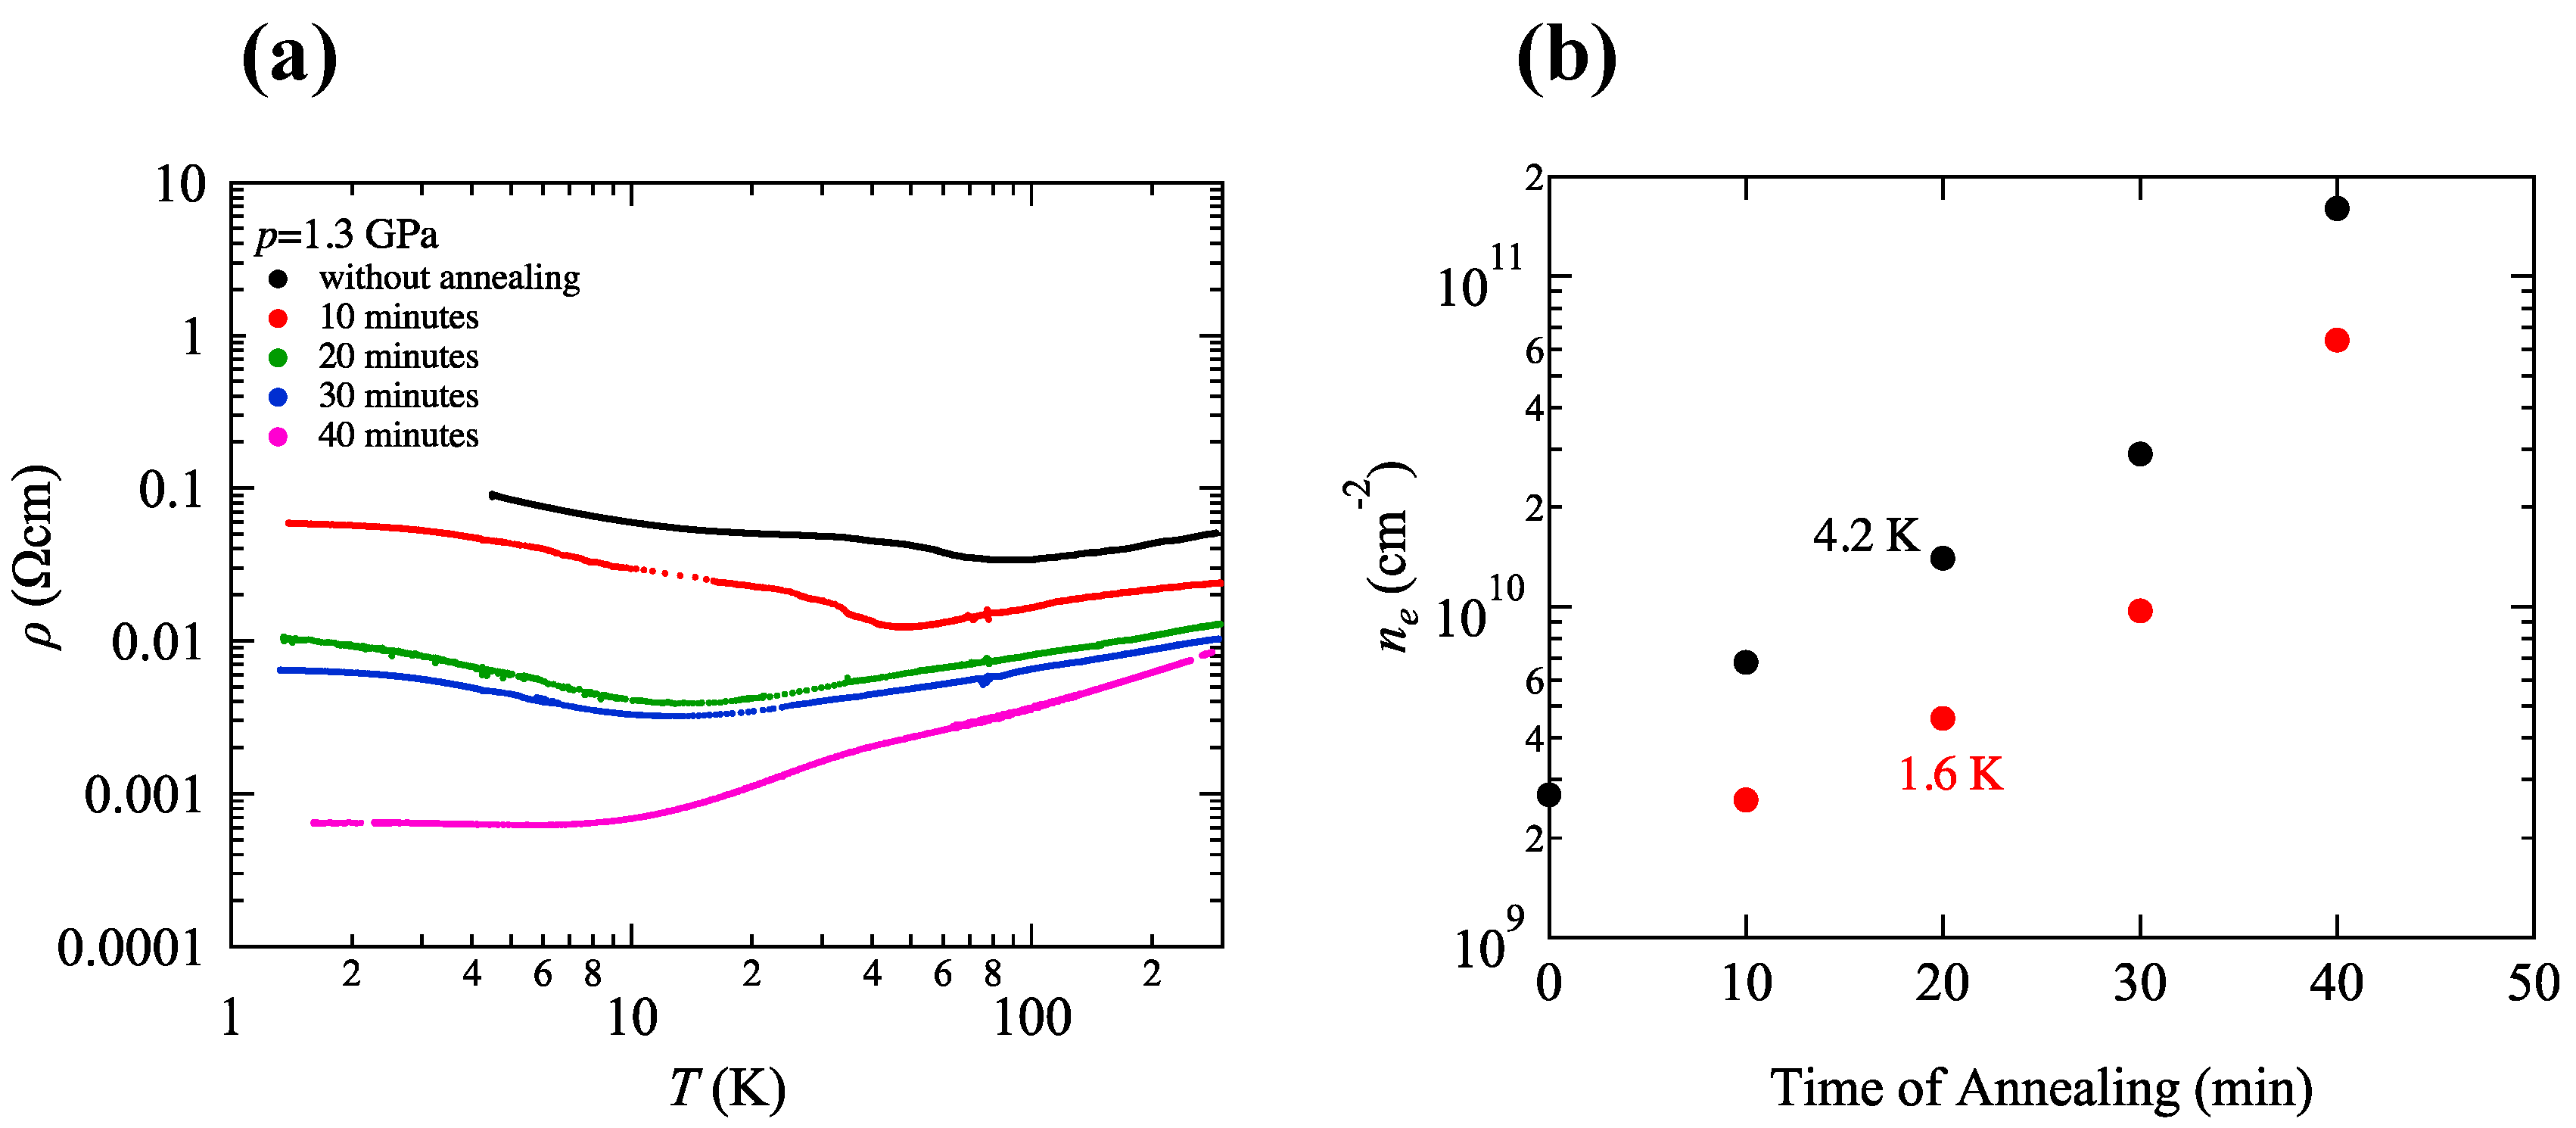
Figure 8.
Field dependence of the magnetoresistance in α-(BEDT-TTF)2I3 under pressure of 2.2 GPa at 200 mK. Inset shows the photograph of sample. Reproduced with permission from [51].
Figure 8.
Field dependence of the magnetoresistance in α-(BEDT-TTF)2I3 under pressure of 2.2 GPa at 200 mK. Inset shows the photograph of sample. Reproduced with permission from [51].

Figure 9.
Temperature dependence of resistivity of α-(BEDT-TTF)2I3 on PEN substrate under pressure of 1.7 GPa. Inset shows against , in which is the resistivity at a limit of .
Figure 9.
Temperature dependence of resistivity of α-(BEDT-TTF)2I3 on PEN substrate under pressure of 1.7 GPa. Inset shows against , in which is the resistivity at a limit of .

Figure 10.
(a) Magnetic field dependence of , , and (b) SdH oscillation () under the pressure of 1.7 GPa at 0.5 K; (c) value of for the SdH oscillation minima. In the Dirac electron systems, the linear extrapolation of the data to should be 1/2. For normal electrons, on the other hand, it is shifted to 0.

Figure 11.
Landau index or filling factor for first layer dependence of and . Reproduced with permission from [45].
Figure 11.
Landau index or filling factor for first layer dependence of and . Reproduced with permission from [45].
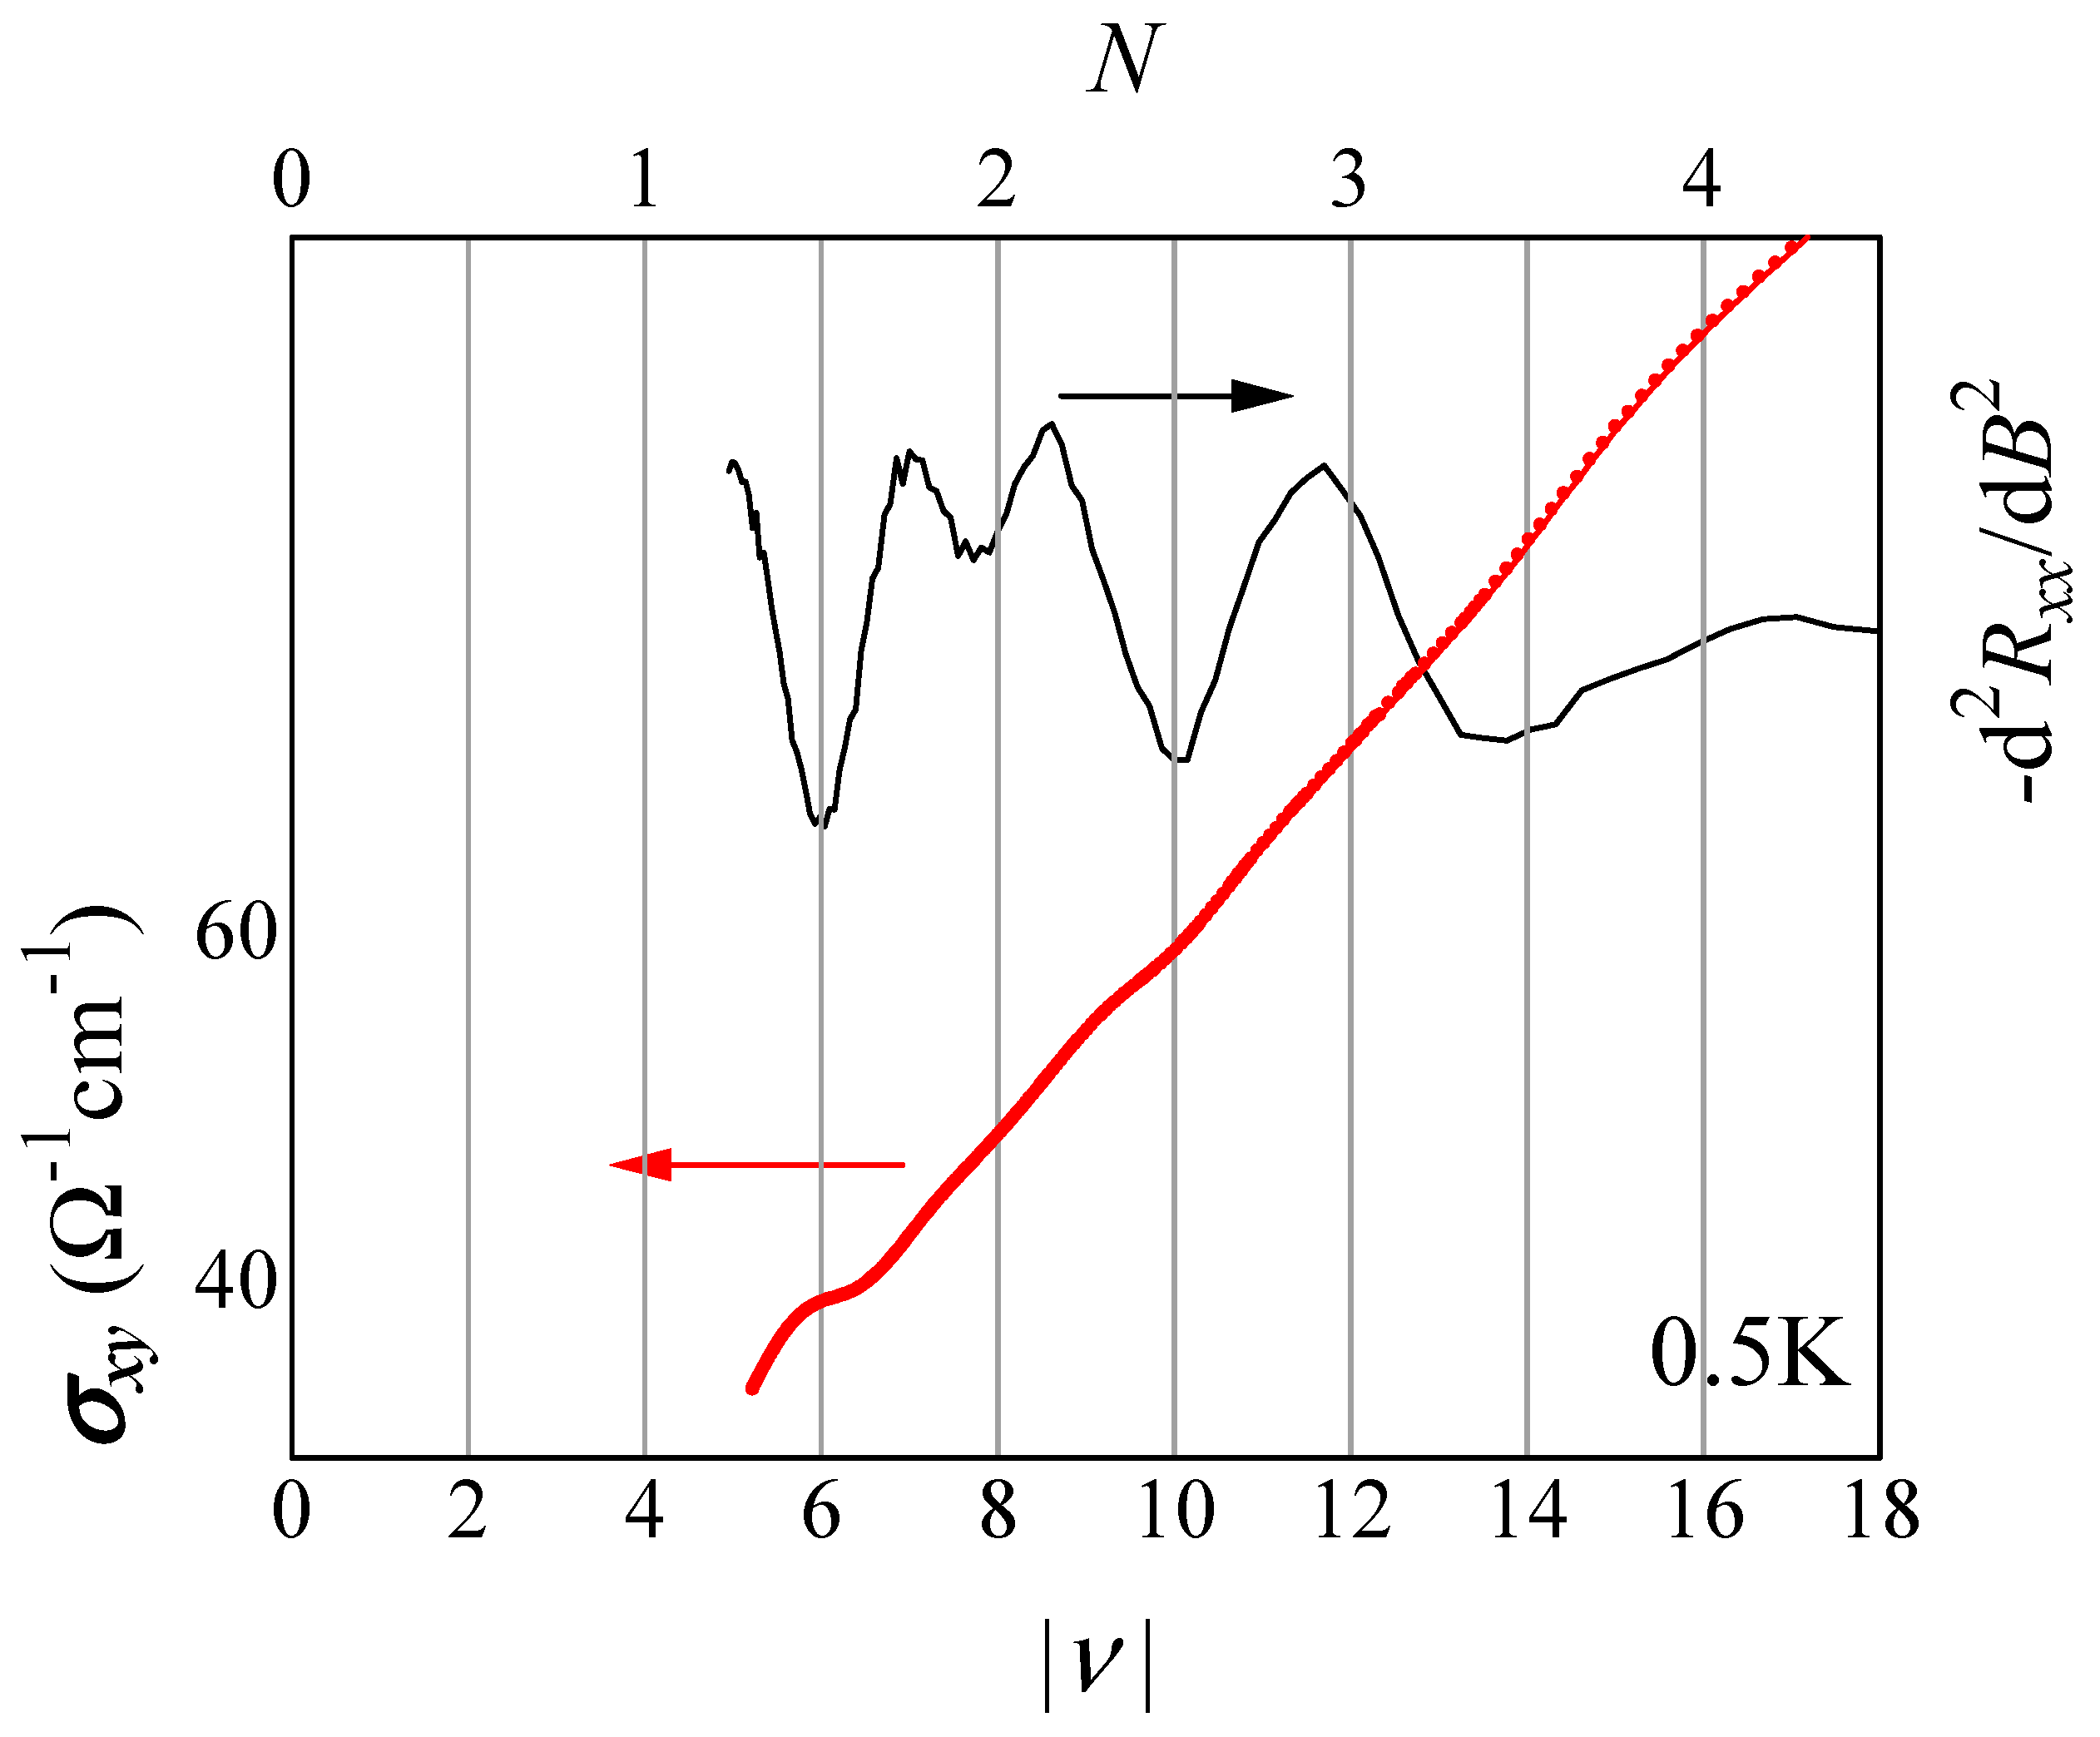
Figure 12.
Construction of Landau plots from the analysis of the SdH oscillations. At low magnetic fields, the oscillations are periodic; they are SdH oscillations. The determination of their phase offset, connected to the Berry phase, indicates that the Dirac charge carriers are involved in the measured oscillations. At higher magnetic fields, the oscillations periodicity loss. Reproduced with permission from [51].

Figure 13.
Distortion of the Dirac cone by a curvature term with a mass . (a) massless Dirac cone; (b) distorted Dirac cone (); (c) distorted Dirac cone (). Reproduced with permission from [51].
Figure 13.
Distortion of the Dirac cone by a curvature term with a mass . (a) massless Dirac cone; (b) distorted Dirac cone (); (c) distorted Dirac cone (). Reproduced with permission from [51].
© 2018 by the author. Licensee MDPI, Basel, Switzerland. This article is an open access article distributed under the terms and conditions of the Creative Commons Attribution (CC BY) license (http://creativecommons.org/licenses/by/4.0/).
Share and Cite
MDPI and ACS Style
Tajima, N. Effects of Carrier Doping on the Transport in the Dirac Electron System α-(BEDT-TTF)2I3 under High Pressure. Crystals 2018, 8, 126. https://doi.org/10.3390/cryst8030126
AMA Style
Tajima N. Effects of Carrier Doping on the Transport in the Dirac Electron System α-(BEDT-TTF)2I3 under High Pressure. Crystals. 2018; 8(3):126. https://doi.org/10.3390/cryst8030126
Chicago/Turabian StyleTajima, Naoya. 2018. "Effects of Carrier Doping on the Transport in the Dirac Electron System α-(BEDT-TTF)2I3 under High Pressure" Crystals 8, no. 3: 126. https://doi.org/10.3390/cryst8030126
Note that from the first issue of 2016, this journal uses article numbers instead of page numbers. See further details here.