Effects of Alloying Atoms on Antiphase Boundary Energy and Yield Stress Anomaly of L12 Intermetallics: First-Principles Study †

1
Institute for Structure and Function, Chongqing University, Chongqing 401331, China
2
Microsystem Technology Laboratory, Microsystem and Terahertz Research Center, CAEP, Chengdu 610200, China
3
College of Materials Science and Engineering, Chongqing University, Chongqing 400044, China
*
Author to whom correspondence should be addressed.
†
Project Supported by the Natural Science Foundation of China (11104361, 11647307) and Project No.CDJQJ308822 Supported by the Fundamental Research Funds for the Central Universities.
Crystals 2018, 8(2), 96; https://doi.org/10.3390/cryst8020096
Submission received: 4 January 2018
/
Revised: 2 February 2018
/
Accepted: 2 February 2018
/
Published: 12 February 2018
Abstract
:The antiphase boundary energies of {111} and {010} planes in L1 intermetallics (NiGe, NiSi, AlSc, NiAl, NiGa and AlTi) under different pressure are presented using first-principle methods. The yield stress anomaly is predicted by the energy criterion p-factor based on the anisotropy of antiphase boundary energies and elasticity. These L1 intermetallics exhibit anomalous yield stress behavior except AlSc. It is found that pressure cannot introduce the transition between anomalous and normal behavior. In order to investigate the transition, AlSc, NiSi and NiGe with substituting atoms are investigated in detail due to p-factors of them are close to the critical value . AlSc can change to anomalous when Sc atoms in {010} planes are substituted by Ti with plane concentration 25%. When Li substitutes Al in {111} planes, anomalous AlSc will change to normal. NiSi and NiGe can exhibit normal yield stress behavior when Ge and Si in {111} planes are substituted by alloying atoms with plane concentrations 12.5% and 25%. When Ga and Al substitute in {010} planes, normal NiSi and NiGe will revert to anomalous behavior. Therefore, transparent transition between normal and anomalous yield stress behavior in L1 intermetallics can be introduced by alloying atoms.
1. Introduction
In materials science, the yield stress anomaly (YSA) means the yield stress of the unusual materials has a positive dependence with the increasing temperature, in contrast to the usual materials which the yield stress decreases with temperature [1,2,3,4]. L1 structure intermetallics are one kind of those materials. This property has attracted much attention for high temperature applications. For example, due to this property, L1 Ni-base superalloys are widely used for blades and vanes in gas turbine engines for aircrafts and power generations [5,6,7].
Most models explain that the YSA in L1 intermetallics is caused by the exhaustion of the mobile dislocations on {010} planes by the Kear-Wilsdorf (K-W) locking mechanism [8,9,10,11,12,13,14]. The K-W locks are mainly caused by the cross-slip of the screw superdislocations [11,15,16]. With the temperature increasing, the mobile superdislocations are thermally activated to cross-slip from the {111} hexagonal planes onto the {010} cubic planes. This process is more frequent at higher temperature. Then, it leads to the formation of K-W locks that decrease the velocity and density of the mobile dislocations. Finally the K-W locks exhaust the mobile dislocations and make the yield strength increase. Therefore, whether the materials satisfy the requirements to occur the cross-slip can be the criterion of whether they have the property of YSA. The differences of the antiphase boundary (APB) energies between {111} and {010} planes provides the driving force to form the cross-slip [17,18]. The dissociation of 〈110〉 superdislocation is shown as follow:
where 〈110〉 is the Burgers vector of superdislocations in {111} and {010} planes which will be dissociated into two 〈110〉/2 partials with an APB between them [19,20,21,22,23]. There may be other dissociation types like CSF (complex stacking fault) and SISF (superlattice intrinsic stacking fault). However, according to Schoeck et al. [24], the cross-slip can be achieved only by the recombination of two Shockley partials. Therefore here we only consider the APB energy. When the p-factor is larger than the critical value, the slip on the {111} planes will cross-slip onto the {010} planes and be divided into two 1/2[10] superpartials as shown in Figure 1. Then with the temperature increasing, the intermetallics will display anomalous behavior of yield stress. This transition from superdislocations to fully dissociated partials is examined to be related to the APB anisotropy. Therefore, the APB anisotropy ratio = / is used to predict the existence of the cross-slip of L1 materials. However, Yoo considers the effect of elastic anisotropy of anisotropy materials is also important [25]. Therefore the improved energy based criterion is shown below:
where , and are elastic constants of L1 materials, A = 2c/(c− c) is the elastic anisotropy, is the APB energy on {111} planes and is the APB energy on {010} planes. This means when the p exceeds , the material will have enough energy to occur cross-slip with the increasing of temperature. The material displays the behavior of YSA.
L1 structure NiAl is the first material reported to have this property [11,26,27,28,29]. L1 structure NiGe [30,31,32], NiSi [33,34,35] NiGa [36,37,38] and AlTi [39] are also found to have this property. Geng et al. [40] provided a quantitative method to confirm the increase of yield strength of Ni-base superalloys at elevated temperature which is in agreement with the results of experiments. Liu et al. [41] studied the origin of the loss of the YSA of NiGe with Fe substitution. Besides L1 structure materials, many other materials are found to have this behavior. Hagihara et al. [42,43] studied Ni(Ti,Nb) which is identified as long-period-stacking ordered (LPSO) compound in the Ni-Ti-Nb ternary system. They found the behavior of YSA is caused by basal slip in Ni-based LPSO phase and the mobility of dislocations on the non-basal plane have negligible effects. The work of Nishino et al. [44] shows that the occurrence of the YSA of D0 FeAl is related to the D0-B2 phase transition. Also they studied the effects of substitutions on the phase stability and high-temperature strength. George et al. [45] explained the YSA of B2 FeAl with the vacancy-hardening model and dislocation creep at high temperatures. They also found up-quenching and down-quenching may corroborate this vacancy-hardening model through experiments. Mitchell et al. [46] studied that the YSA of C11 MoSi is related to various slip systems and calculated the stacking fault energies with modified embedded atom method (MEAM). The work of Takayoshi et al. [47] shows the behavior of C40 NbSi is controlled by the phase stability and the YSA is caused by the formation of a dragging atmosphere around dislocations.
In the previous work of Liu et al. [48], p-factors increasing with temperature are investigated by using first principles calculations and quasiharmonic approach. This can give a more accurate description of the anomalous yield stress than predictions at 0 K. Pressure also has important effects on elastic constants and stacking fault energy. Therefore, it is interesting to study the pressure dependent p-factor for typical L1 intermetallics, such as NiAl [27,28,29], NiGe [30,31,32], NiSi [33,34,35], NiGa [36] and AlTi [39] which have the YSA properties. To make comparisons, we also choose AlSc which has the normal behavior.
Beside pressure, alloying elements in materials also have effects on the APB energy and yield stress [44,49]. In this paper, NiGe, NiSi and AlSc are investigated since the p-factors of these materials are close to the critical value p. Based on the work of Golovin et al. [50] and Balk et al. [51], the NiGe losses the property of YSA with Fe substitution. Therefore, NiGe is alloyed with Fe. Since p-factors of NiGe, NiSi and AlSc are close to , while the p-factors of NiAl, NiGa and AlTi are much larger than , NiGe is alloyed with Al and Ga, NiSi is alloyed with Al, Ga and Ti, AlSc is alloyed with Ti. On the other hand, since AlSc is the only material that displays the normal behavior, NiGe and NiSi are alloyed with Sc to investigate whether their property can be changed. Since Sc and Y, Ti and Zr are in same groups, AlSc is alloyed with Y and Zr. The addition of Li in Al-Sc alloys can result in greater peak hardness from the L1 Al-Li-Sc [52]. After determining the alloying atoms, in order to confirm the alloying sites, formation energies are calculated in detail. Then, APB energies with and without alloying are calculated to obtain the p-factors.
This paper is organized as follows. The next section contains the technical details of the calculations we performed. In Section 3, we discuss our results for p-factors under different pressure. Our main results for p-factors effected by different substitutional atoms and concentrations are described in Section 4. Finally, in Section 5 we summarize the main conclusions and results.
2. Computational Methodology and Models
Calculations are performed by using the Vienna Ab-initio Simulation Package (VASP), which is based on the density functional theory (DFT). Generalized gradient approximation (GGA) with The Perdew–Burke–Ernzerhof (PBE) functional is employed as the exchange-correlation functional. All the materials calculated are L1 structures.
In cubic crystals, there are three independent elastic constants c, c and c. A 1 × 1 × 1 supercell is constructed to calculate the lattice constants and the elastic constants. The cut-off energy of plane wave is set to 450 eV due to convergence test, and the Brillouin zones are performed by using Monkhorst and Pack special k points generated with a 15 × 15 × 15 mesh parameters grid.
A supercell model of 12 layers perpendicular to the APB and four atoms per layer with vacuum layers is constructed to calculate APB energies in both {111} and {010} planes under the pressures of 0, 20 and 40 GPa [53]. We add vacuum layers since the vacuum layers can reduce the effects from the neighbor supercell [54]. The k points are set as 15 × 15 × 1. The structures of the {111} and {010} planes are shown in Figure 2.
The {111} and {010} planes with and without APB are shown in Figure 3. They are created by applying 1/2〈110〉 shift vectors on the {111} and {010} planes or not. The APB energy is given by:
where is the APB energy, and are the total energies of the supercell with and without APB, respectively. A is the cross-section area of the APB. They can be calculated accurately by using first-principle methods.
When calculating the APB energies with substituting atoms, different supercells are used for different concentrations in the slip planes: 2 × 2 × 12 for a plane concentration 6.25%, 2 × 1 × 12 for a plane concentration of 12.5% and 1 × 1 × 12 for a plane concentration of 25%. All the supercells have vacuum layers. As for the Brillouin zone k-point grids, 7 × 7 × 1, 7 × 15 × 1 and 15 × 15 × 1 k-point meshes are used for different bulks.
Before calculating the APB energies, formation energies to confirm the preference of the substitutions are calculated first. Since there are different concentrations, only the supercell with the plane concentration 25% is chosen. The formation energies is given by:
where E is the formation energy, A and B are the two kinds atoms of AB materials, X is the substituted atom, E is the total energy of AB material with substitution, E, E and E are the energies of single atom of atoms A, B and substitutional atom X. By comparing the results, the most preference substitutional site can be confirmed, thus to optimize the calculations of the APB energies.
3. Effects of Pressure on Stacking Fault Energy and p-Factor
Lattice constants and elastic constants under different pressures are presented in Table 1. In general, results are in good agreement with experiments and previous theoretical calculations [55,56]. The elastic constants and anisotropy A increase with pressure. Results of A of NiAl and NiGa are the larger ones, which indicate that these two materials much easily form cross-slip to have the property of YSA according to Equation (2). Specifically, it is found that the structures of AlTi and AlSc are not stable when P = 40 GPa. Therefore, the lattice constants and elastic constants of AlTi and AlSc at 40 GPa are not presented.
The APB energies in both {111} and {010} planes of NiAl, NiGe, NiSi, NiGa, AlTi and AlSc under 0, 20 and 40 GPa are shown in Table 2. Obviously, the APB energies in {010} planes are much smaller than those in {111} planes. Larger APB energy in {111} planes results in smaller dissociation distance between partial dislocations. The possibility of construction is high for dissociated dislocation in {111} planes. Therefore, the cross-slip from {111} to {010} may be generated.
Based on the calculated APB energies and elastic constants, the anomalous yield stress phenomenon is predicted by the energy-based criterion Equation (2). The p-factors of NiAl, NiGe, NiSi, NiGa, AlTi and AlSc under the different pressures are shown in Figure 4. Noticeably, the calculated p-factor of NiSi at 0 GPa is lower than , which is in agreement with Yoo [61]. However, based on the observed behavior of YSA for NiSi, Yoo still considers NiSi to have a positive temperature dependence of yield stress, and by calculating with other supercells, the p-factor of NiSi satisfies the criterion. Therefore, here, NiSi is regarded to have the property of YSA at 0 GPa, as well. According to Equation (2), although the A of AlTi, NiAl and NiGa increases with pressure (see Table 1), due to the APB energy in {010} planes having a faster growth than the one in {111} planes, p-factors of AlTi, NiAl and NiGa keep decreasing with pressure, and they are still much larger than among all pressures. The values of p-factors of AlSc, NiGe and NiSi increase with pressure, and the A of them has the same trend of increase. This indicates that APB energy in {010} planes does not have many effects on the changes of the p-factor with pressure. The changes of the p-factors of NiGe and NiSi are not obvious, and the values are still slightly larger than . These results mean they all exhibit the YSA under all pressures investigated here. On the other hand, only the p-factor of AlSc is smaller than under all pressures, which means this material does not have YSA; although it increases slightly with pressure. All these results are in good agreement with the properties achieved from experiments. This means pressure has negligible influence on the property of yield stress.
4. Effects of Substituting Atoms on Stacking Fault Energy and p-Factor
4.1. Substituted by a Single Atom
Based on the above results, the pressure will not introduce the transition between anomalous and normal behavior. In this section, the effects of substitutional atoms on p-factor will be investigated. p-factors of NiGe, NiSi and AlSc are studied since they are close to . In Figure 1, there are substitutions (black circle and white circle) on either {111} and {010} planes, which affect the and . Therefore, as discussed above, NiGe is substituted with Fe, Sc, Al or Ga, NiSi is substituted with Al, Ga, Ti or Sc and AlSc is substituted with Ti, Y, Zr or Li.
To determine the substitutional sites, the formation energies of NiGe, NiSi and AlSc with alloying atoms are presented. All possible substitutional sites are taken into consideration. Results of the formation energies of different substitution sites are shown in Table 3. It is easy to see that: (1) the formation energies of Sc, Al Ga and Fe are lower to make the structure more stable; (2) the formation energies of Sc, Ti Ga and Al are lower to make the structure more stable; (3) the formation energies of Ti, Y and Zr and Li are lower to make the structure more stable. Fe means that the Ni site is substituted by Fe, and so forth. Therefore, Sc, Al and Ga tend to occupy the site of Ge, while Fe tends to occupy the site of Ni in NiGe. Al, Ga, Ti and Sc all tend to occupy the site of Si in NiSi. Ti, Y and Zr tend to occupy the site of Sc, while Li tends to occupy the site of Al in AlSc.
Three different plane concentrations of 6.25%, 12.5%, and 25% are used to calculate the APB energies. APB energies in {111} and {010} planes are shown in Table 4. It is interesting to find that substitutional atoms decrease APB energies in {111} planes except Zr in AlSc. The APB energies in {010} planes are also decreased by substitutional atoms except Fe, Sc, Y and Li.
Based on APB energies, p-factors of NiGe, NiSi and AlSc at different concentrations are obtained (see Table 4 and Table 5). Table 4 shows the p-factor of atoms substituted in both {111} and {010} planes, and Table 5 shows the p-factor of atoms substituted only in {111} or {010} planes, respectively.
The p-factors of YSA for NiGe with substitutional atoms are shown in Figure 5. Fe means Ni substituted by Fe only in {111} planes; Fe means Ni substituted by Fe only in {010} planes; and Fe means Ni substituted by Fe both in {111} and {010} planes, and so forth. It is transparent that when only substituting atoms in {111} planes, the p-factors of Fe, Sc, Al and Ga decrease with the concentrations. These are originated from the decrease of APB energies of NiGe with substitutional atoms in {111} planes (see Table 4). When the concentration is 12.5%, NiGe will display the normal behavior with Sc or Al. With the concentration increasing to 25%, Ga can change the property of YSA for NiGe, as well. When only substituting atoms in {010} planes, the p-factors of Sc, Al and Ga increase, and the properties of YSA for NiGe are enhanced due to the decrease of APB energies in {010} planes with substitutions; except that Fe weakens the properties of YSA with the plane concentration increasing from 12.5%–25% due to the APB energy increasing from 0.412 J/m–0.478 J/m. When substituting atoms in both {111} and {010} planes, p-factors lie between those that only substitute in {111} or {010} planes. Due to the lower decrease of the APB energies of Sc compared to the APB energies in {111} planes than those of Al and Ga, the p-factor of Sc at a concentration of 25% is the only one less than the critical value to make NiGe show the normal behavior.
The p-factors of YSA for NiSi with substitutional atoms are shown in Figure 6. It is transparent that p-factors of substituting atoms only in {111} planes decrease with concentrations of Al, Ga, Ti and Sc. These are originated from the decrease of APB energies of NiSi with the substitutional atoms in {111} planes (see Table 4). NiSi starts to display the normal behavior when the plane concentrations are 12.5%. However, when substituting atoms only in {010} planes, the properties of YSA for NiSi are enhanced by Al, Ga or Ti due to the decreasing of APB energies in {010} planes with substitutions. Only when Sc is substituted in {010} planes, since the APB energy increases from 0.521 J/m–0.545 J/m, while plane concentration increases from 12.5%–25%, the p-factor decreases. Due to the decrease of APB energies of Al, Ga, Ti in both planes, p-factors of atoms substituted in both planes lie between those of substituting in a single plane. Only the p-factor of Sc stays lower than Sc in {010} planes to display the normal behavior when the concentration is larger than 12.5%. This is caused by the increase of APB energies in {010} planes and the decrease of APB energies in {111} planes.
The p-factors of YSA for AlSc with substitutional atoms are shown in Figure 7. It is transparent that the p-factors of substituting atoms only in {111} planes decrease with increasing concentrations of Ti or Li. These are due to the decrease of APB energies of AlSc with substituting Li or Ti in {111} planes (see Table 4). The p-factor of Zr has few changes. Besides, the p-factor of Y increases since the APB energy of Y increases from 0.698 J/m–0.775 J/m while the plane concentration increases from 0–12.5%. Then, it decreases with the APB energy decreasing to 0.697 J/m when the plane concentration reaches 25%. When atoms are substituted only in {010} planes, the p-factors of Ti and Zr increase with concentrations, while Li and Y have different trends. AlSc displays the anomalous behavior only when substituting Ti in {010} planes with the plane concentration of 25%. Due to the APB energies of Ti in both planes increasing with concentrations, p-factors of Ti lie between those of substituting in single plane. p-factors of Y are similar to those of Ti at the plane concentration of 12.5%. Due to the APB energies of Li increasing in {010} planes and decreasing in {111} planes, the p-factors of Li keep decreasing with concentrations. From Figure 7c, the p-factor of Li lies below the other two and is the lowest at all concentrations. On the other hand, the increase of APB energies of Zr and the decrease of APB energies of Zr lead to the p-factor of Zr to become the highest. However, none of these p-factors with atoms substituted in both planes can reach the critical value at all concentrations.
Comparing the different concentrations, the effects of substitutional atoms are enhanced with increasing concentrations. When the concentration is 12.5%, it makes the effects of atom substituted in {111} planes great enough to change the behavior from anomalous to normal obvious, such as Sc, Al, Ga, Ti and Sc. When the concentration is 25%, Ti can be effective enough to make AlSc have the property of YSA.
4.2. Substituted by Two Different Atoms
In this section, different alloying atoms are substituted in the {111} and {010} planes of NiGe, NiSi and AlSc with the same concentrations. The p-factors are plotted in Figure 8, Figure 9 and Figure 10.
The p-factors of NiGe are plotted in Figure 8: (a) Fe with Sc (black dashed-dotted line with circles), Al (blue solid line with triangles) and Ga (purple solid line with squares); (b) Sc with Al (blue solid line with triangles), Ga (purple solid line with squares) and Fe (black dashed-dotted line with circles); (c) Al with Sc (blue solid line with triangles), Ga (purple solid line with squares) and Fe (black dashed-dotted line with circles); (d) Ga with Sc(blue solid line with triangles), Al (purple solid line with squares) and Fe (black dashed-dotted line with circles), respectively.
From Figure 8, it is easy to see that the transition of NiGe does not exist when Fe with Ga, Al or Sc. p-factors of Sc with Ga or Al, Al with Ga and Ga with Al have the same trend of increase, which means their properties of YSA will not be changed. Besides, the p-factor of Ga with Sc decreases with concentrations. Though the p-factor of it is very close to at a plane concentration of 25%, it is still slightly higher than , which means that there is no transition from anomalous to normal. Sc with Fe, Al with Fe or Sc and Ga with Fe will result in transition with a plane concentration of 25%. It can be found that Fe will decrease the p-factors with the concentration varying from 6.25%–25% no matter whether there are atoms substituted in {111} planes; only Fe can lead to a small increase of p-factor with the concentration varying from 6.25%–12.5% (see Figure 5a). Additionally, it will be small enough to change the property of yield stress from anomalous to normal at the concentration of 25%. Comparing with Figure 5 and Figure 8, it can be seen that substituting Al or Ga in {010} planes with a concentration of 25% can be effective to revert the normalized NiGe with Sc, Al or Ga to anomalous.
The p-factors of NiSi are plotted in Figure 9: (a) Al with Ga (black dashed-dotted line with circles), Ti(blue solid line with triangles) and Sc (purple solid line with squares); (b) Ga with Al (black dashed-dotted line with circles), Ti (blue solid line with triangles) and Sc (purple solid line with squares); (c) Ti with Al (black dashed-dotted line with circles), Ga (blue solid line with triangles) and Sc (purple solid line with squares); (d) Sc with Al (black dashed-dotted line with circles), Ga (blue solid line with triangles) and Ti (purple solid line with squares), respectively.
From Figure 9, it is easy to see that Al with Ga, Ga with Al, Ti with Ga or Al and Sc with Ga or Al will not have the transition from anomalous to normal since the p-factors increase with plane concentrations. Although there are temporary increases of Ga with Ti or Sc and Sc with Ti at a concentration of 6.25%, overall, the p-factors of Al with Ti or Sc, Ga with Ti or Sc, Ti with Sc and Sc with Ti decrease with concentrations and decline low enough to be smaller than at the concentration of 25%, which means the transition will occur. In other words, when substituting atoms in both planes, Ti and Sc will change the anomalous behavior of yield stress to normal at the concentration of 25% no matter what atom is substituted in {111} planes, except Ti, which makes the p -factor of Ti be larger than . (see Figure 6). In contrast, to make the normalized NiSi (see Figure 6) revert to anomalous, it is effective to substitute Al and Ga in {010} planes.
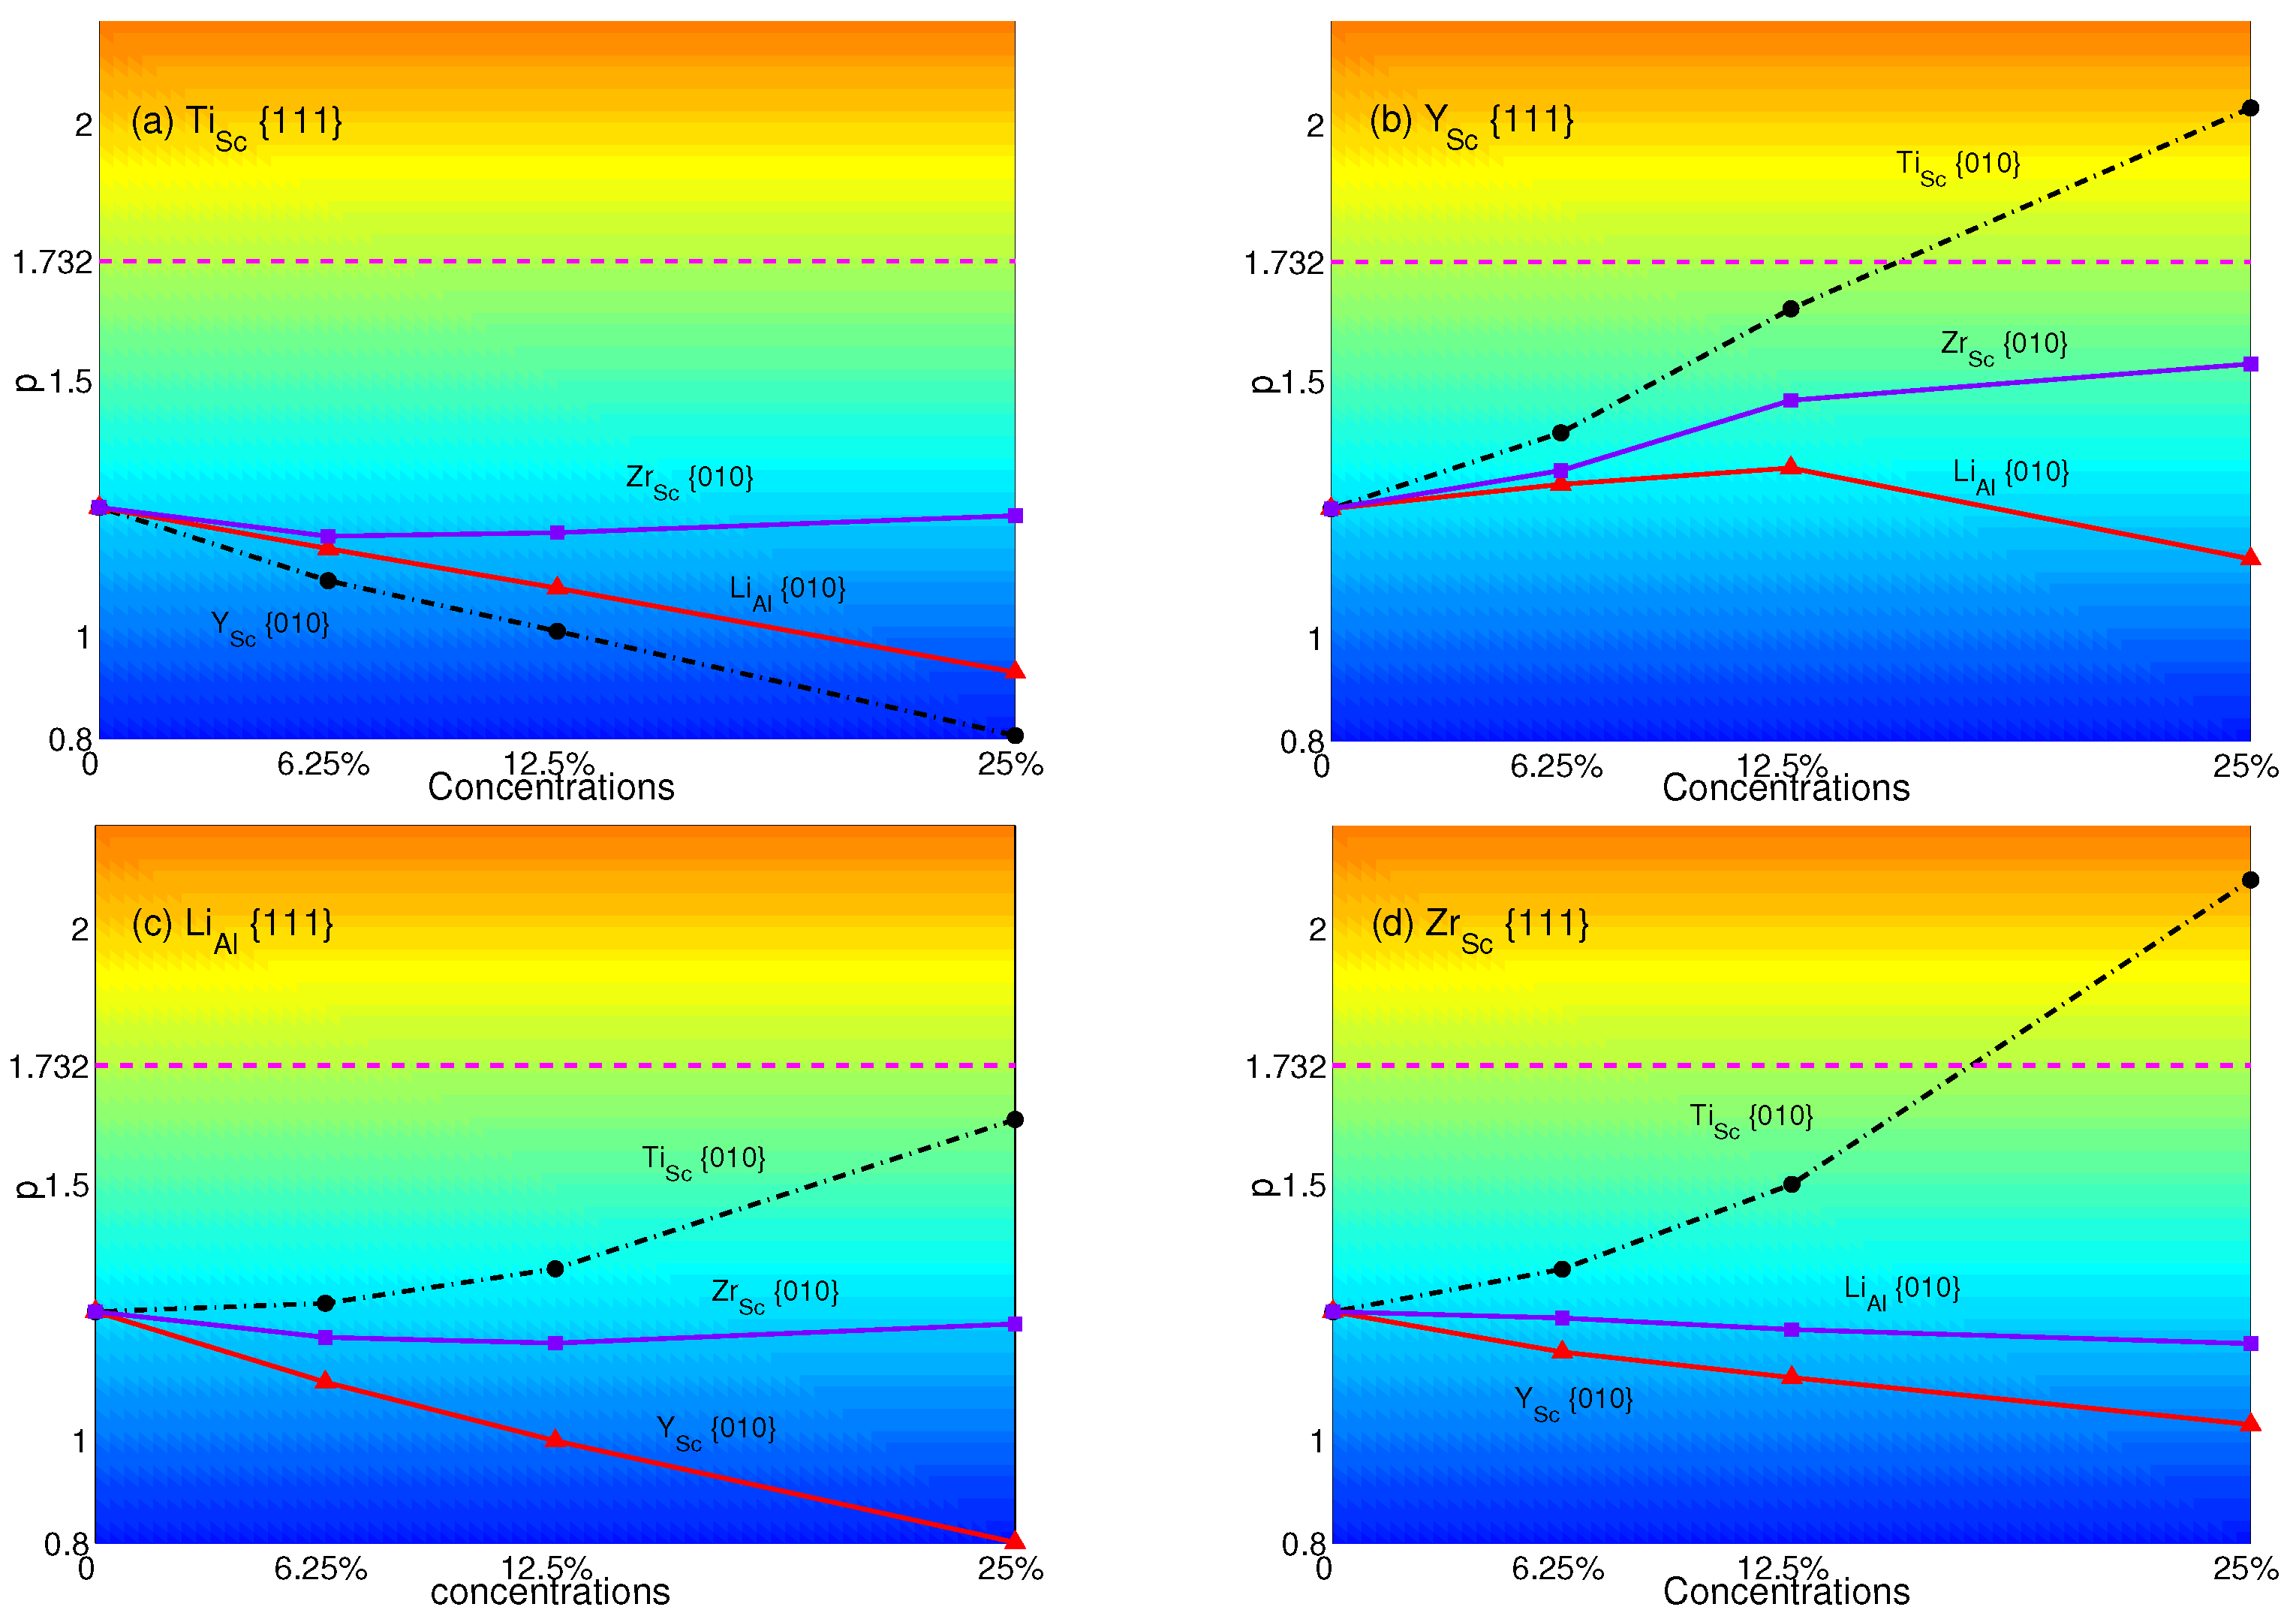
The p-factors of AlSc are plotted in Figure 10: (a) Ti with Y(black dashed-dotted line with circles), Zr (purple solid line with triangles) and Li (red solid line with squares); (b) Y with Ti (black dashed-dotted line with circles), Zr (purple solid line with squares) and Li (red solid line with triangles); (c) Li with Ti (black dashed-dotted line with circles), Y (red solid line with triangles) and Zr (purple solid line with squares); (d) Zr with Ti (black dashed-dotted line with circles), Y (red solid line with triangles) and Li (purple solid line with squares), respectively.
From Figure 10, it is easy to see that only Y with Ti and Zr with Ti will have the transition from normal to anomalous at a concentration of 25%. p-factors of Ti with Zr, Li or Y, Y with Zr or Li, Li with Ti, Zr or Y and Zr with Li or Y stay lower than , though some of them increase with concentrations. Among them, the p-factor of Li with Ti is close to at the concentration of 25%. However, it still failed to overcome the critical value. Comparing to Figure 7, only Ti at the concentration of 25% with Zr, Y or no atoms substituted in {111} planes may have the opportunity to change the property of yield stress from normal to anomalous. This shows that Ti has a great influence and makes the APB energies in {010} planes small enough to obtain a larger p-factor than . The only way to maintain the normal behavior is substituting Li or Ti (see Figure 7) in {111} planes.
Comparing to different concentrations, although it has influences on the p- factors, there are no obvious changes of the property of YSA varying from 6.25–12.5%. Only when the concentration is 25%, substitutional atoms can obviously change the property of yield stress between normal and anomalous such as Sc with Fe, Ga with Sc and Y with Ti.
5. Conclusions
The pressure-dependent elastic constants and APB energies of L1 intermetallics (NiGe, NiSi, AlSc, NiAl, NiGa and AlTi) are calculated using first-principles methods. Based on the energy criterion p-factor considering anisotropy, the properties of YSA under different pressures are predicted. Pressure will not introduce transition between anomalous and normal yield stress behavior. All these intermetallics are anomalous, except AlSc. In order to obtain the transition in these intermetallics, the alloying elements are only substituted in NiGe, NiSi, AlSc due to their p-factors being close to . When Sc, Al or Ga is substituted in {111} planes in NiGe and NiSi with the concentration of 25%, the anomalous NiGe and NiSi will become normal. Based on the obtained normal NiGe and NiSi, substituting Al or Ga in {010} planes with the concentration of 25%, the normal NiGe and NiSi will revert to anomalous. Ti may have the same effect as Al and Ga. However, normal AlSc will become anomalous when the concentration of Ti is 25%. When Al in {111} planes is substituted by Li, the obtained anomalous AlSc will become normal. Therefore, transition between normal and anomalous yield stress behavior can be introduced by alloying atoms in L1 intermetallics. Furthermore, when the plane concentration is lower than 6.25%, the transition will not occur. Until the concentration is larger or equal to 12.5%, the property may have the opportunity to be changed such as Sc, Al and Ga. When the concentration is 25%, substitutional atoms will have much greater influences on the APB energies to change the property of yield stress between normal and anomalous more obviously, such as Sc, Ti, Ga with Sc and Y with Ti.
Author Contributions
Xiaozhi Wu and Jianwei Wang conceived and designed the ideas; Xiaojun Gao and Xiaozhi Wu performed the calculations; Rui Wang and Zhihong Jia analyzed the data; Jianwei Wang and Xiaojun Gao wrote the paper.
Conflicts of Interest
The authors declare no conflict of interest.
References
- Westbrook, J.H. Defect structure and temperature dependence of hardness of an intermetallic compound. Trans. TMS-AIME 1957, 209, 898. [Google Scholar] [CrossRef]
- Flinn, P. Theory of deformation and superlattices. Trans. TMS-AIME 1960, 218, 145–154. [Google Scholar]
- Davies, R.G.; Stoloff, N.S. Yield stress of aged Ni-Al alloys. Trans. TMS-AIME 1965, 233, 714. [Google Scholar]
- Copley, S.M.; Kear, B.H. Working-hardening in off-stoichiometric. Trans. TMS-AIME 1967, 239, 977. [Google Scholar]
- He, L.Z.; Zheng, Q.; Sun, X.F.; Hou, G.C.; Guan, H.R.; Hu, Z.Q. Low ductility at intermediate temperature of NiCbase superalloy M963. Mater. Sci. Eng. A 2004, 380, 340–348. [Google Scholar] [CrossRef]
- Sheng, L.Y.; Fang, Y.; Guo, J.T.; Xi, T.F. Anomalous yield and intermediate temperature brittleness behaviors of directionally solidified nickel-based superalloy. Trans. Nonferrous Met. Soc. 2014, 24, 673–681. [Google Scholar] [CrossRef]
- Chu, Z.K.; Yu, J.J.; Sun, X.F.; Guan, H.R.; Hu, Z.Q. Tensile property and deformation behavior of a directionally solidified Ni-base superalloy. Mater. Sci. Eng. A 2010, 527, 3010–3014. [Google Scholar] [CrossRef]
- Pope, D.P. Physical Metallurgy, 4th ed.; Elsevier Press: Amsterdam, The Netherlands, 1996; Volume 3, p. 2075. [Google Scholar]
- Vitek, V.; Pope, D.P.; Bassani, J.L. Disloactions in Solids; Elsevier Press: Amsterdam, The Netherlands, 1996; Volume 10, p. 135. [Google Scholar]
- Veyssière, P.; Saada, G.; Duesbery, M.S. Disloactions in Solids; Elsevier Press: Amsterdam, The Netherlands, 1996; Volume 10, p. 253. [Google Scholar]
- Veyssière, P. Yield stress anomalies in ordered alloys: A review of microstructural findings and related hypotheses. Mater. Sci. Eng. A 2001, 309, 44–48. [Google Scholar] [CrossRef]
- Caillard, D.; Molénat, G.; Paidar, V. On the role of incomplete Kear-Wilsdorf locks in the yield stress anomaly of Ni3Al. Mater. Sci. Eng. A 1997, 234, 695–698. [Google Scholar] [CrossRef]
- Bonneville, J.; Coupeau, C. Quantitative atomic force microscopy analysis of slip traces in Ni3Al yield stress anomaly. Mater. Sci. Eng. A 2008, 483, 87–90. [Google Scholar] [CrossRef]
- Michel, J.; Coupeau, C.; Nahas, Y.; Drouet, M.; Beonneville, J. What can be learnt on the yield stress anomaly of Ni3Al using AFM observations. Intermetallics 2014, 50, 86–93. [Google Scholar] [CrossRef]
- Caillard, D.; Couret, A. Disloactions in Solids; Elsevier Press: Amsterdam, The Netherlands, 1996; Volume 10, p. 69. [Google Scholar]
- Rao, S.I.; Dimiduk, D.M.; Parthasarathy, T.A.; Unchic, M.D.; Woodward, C. Atomistic simulations of intersection cross-slip nucleation in L12 Ni3Al. Scr. Mater. 2012, 66, 410–413. [Google Scholar] [CrossRef]
- Paidar, V.; Pope, D.P.; Vitek, V. A theory of the anomalous yield behavior in L12 ordered alloys. Acta Metall. 1984, 32, 435–448. [Google Scholar] [CrossRef]
- Umakoshi, Y.; Pope, D.P.; Vitek, V. The asymmetry of the flow stress in Ni3(Al,Ta) single crystals. Acta Metall. 1984, 32, 449–456. [Google Scholar] [CrossRef]
- Kear, B.H.; Wilsdolf, H.G. Dislocation configurations in plastically deformed polycrystalline Cu3Au alloys. Trans. Metall. Soc. AIME 1962, 224, 382. [Google Scholar]
- Gorbatov, O.I.; Lomaev, I.L.; Gornostyrev, Y.N. Effect of composition on antiphase boundary energy in Ni3Al based alloys: Ab initio calculations. Phys. Rev. B 2016, 93, 224106. [Google Scholar] [CrossRef]
- Sun, R.; Van de Walle, A. Automating impurity-enhanced antiphase boundary energy calculations from ab initio Monte Carlo. CALPHAD 2016, 53, 20–24. [Google Scholar] [CrossRef]
- Koizumi, Y.; Mizuno, M.; Sugihara, A. Effects of substitutional impurity Au and Si atoms on antiphase boundary energies in Ti3Al: A first principles study. Philos. Mag. 2010, 90, 3919–3934. [Google Scholar] [CrossRef]
- Vamsi, K.V.; Karthikeyan, S. MATEC Web of Conferences. 2014; 14, 11005. [Google Scholar]
- Shoeck, G.; Kohlhammer, S.; Fähnle, M. Planar dissociations and recombination energy of [110] superdislocations in Ni3Al: Generalized Peierls model in combination with ab initioelectron theory. Philos. Mag. Lett. 1999, 79, 849–857. [Google Scholar] [CrossRef]
- Yoo, M.H. On the theory of anomalous yield behavior of Ni3Al-effect of elastic anisotropy. Scr. Metall. 1986, 20, 915. [Google Scholar] [CrossRef]
- Paxton, A.T.; Sun, Y.Q. The role of planar fault energy in the yield anomaly in L12 intermetallics. Philos. Mag. A 1998, 78, 85–104. [Google Scholar]
- Kumar, K.; Sankarasubramanian, R.; Waghmare, U.V. The effect of γ-γ’ interface on the tensile and shear strengths of nickel-based superalloys: A first-principles study. Comput. Mater. Sci. 2015, 97, 26–31. [Google Scholar] [CrossRef]
- Manga, V.R.; Shang, S.L.; Wang, W.Y.; Wang, Y.; Liang, J.; Crespi, V.H.; Liu, Z.K. Anomalous phonon stiffening associated with the (111) antiphase boundary in L12 Ni3Al Original research article. Acta Mater. 2015, 82, 287–294. [Google Scholar] [CrossRef]
- Demura, M.; Golberg, D.; Hirano, T. An athermal deformation model of the yield stress anomaly in Ni3Al. Intermetallics 2007, 15, 1322–1331. [Google Scholar] [CrossRef]
- Abzaev, Y.A.; Starenchenko, V.A.; Solo’eva, Y.V.; Kozlov, E.V. Effect of orientation on the peak temperature of the yield-stress anomaly in single crystals of the Ni3Ge alloy. Phys. Met. Metall. 2006, 101, 591–595. [Google Scholar] [CrossRef]
- Suzuki, T.; Oya, Y.; Wee, D.M. Transition from positive to negative temperature dependence of the strength in Ni3Ge-Fe3Ge solid solution. Acta Metall. 1980, 28, 301–310. [Google Scholar] [CrossRef]
- Pak, H.R.; Saubri, T.; Nenno, S. Temperature and Orientation Dependence of the Yield Stress in Ni3Ge Single Crystals. Trans. Jpn. Inst. Met. 1977, 18, 617–626. [Google Scholar] [CrossRef]
- Thornton, P.H.; Davies, R.G. The temperature dependence of the flow stress of gamma prime phases having the Ll2 structure. Metall. Trans. 1970, 1, 549–550. [Google Scholar] [CrossRef]
- Dyck, S.V.; Delaey, L.; Froyen, L.; Buekenhout, L. Microstructural evolution and its influence on the mechanical properties of a nickel silicide based intermetallic alloy. Intermetallics 1997, 5, 137–145. [Google Scholar] [CrossRef]
- Takasugi, T.; Yoshida, M. Strength anomaly and dislocation structure at 4.2 k in ni3(si, ti) single crystals. Philos. Mag. A 1992, 65, 613–624. [Google Scholar] [CrossRef]
- Lunt, M.J.; Sun, Y.Q. Creep and the anomalous yield stress of Ni3Ga. Mater. Sci. Eng. A 1997, 239, 445–449. [Google Scholar] [CrossRef]
- Takeuchi, S.; Kuramoto, E. Anomalous Temperature Dependence of the Yield Stress in Ni3Ga. J. Phys. Soc. Jpn. 1971, 31, 1282. [Google Scholar] [CrossRef]
- Takeuchi, S.; Kuramoto, E. Temperature and orientation dependence of the yield stress in Niin3Ga single crystals. Acta Metall. 1973, 21, 415–425. [Google Scholar] [CrossRef]
- Wu, Z.L.; Pope, D.P.; Vitek, V. Deformation and fracture of L12 (Al,Fe)3Ti. Scr. Metall. 1990, 24, 2187. [Google Scholar] [CrossRef]
- Geng, P.J.; Li, W.G.; Zhang, X.H.; Deng, Y.; Kou, H.B.; Ma, J.Z.; Shao, J.X.; Chen, L.M.; Wu, X.Z. A theoretical model for yield strength anomaly of Ni-base superalloys at elevated temperature. J. Alloy. Compd. 2017, 706, 340–343. [Google Scholar] [CrossRef]
- Liu, J.B.; Johnson, D.D.; Smirnov, A.V. Predicting yield-stress anomalies in L12 alloys: Ni3Ge-Fe3Ge pseudo-binaries. Acta Mater. 2005, 53, 3601–3612. [Google Scholar] [CrossRef]
- Hagihara, K.; Tanaka, T.; Nakano, T.; Veyssière, P.; Umakoshi, Y. Effects of the anisotropy of the anti-phase boundary energy on the yield-stress anomaly in Ni3X compounds with close-packed crystal structures. Philos. Mag. Lett. 2007, 87, 705–712. [Google Scholar] [CrossRef]
- Hagihara, K.; Tanaka, T.; Izumo, H.; Umakoshi, Y.; Nakano, T. Non-basal slip in Ni3(Ti, Nb) and Ni3(Ti, Al) single crystals with various long-period stacking ordered structures. Acta Mater. 2013, 61, 4365. [Google Scholar] [CrossRef]
- Nishino, Y.; Tanahashi, T. Effect of molybdenum substitution on the yield stress anomaly in Fe3Al-based alloys. Mater. Sci. Eng. A 2004, 387, 973–976. [Google Scholar] [CrossRef]
- George, E.P.; Baker, I. Thermal vacancies and the yield anomaly of FeAl. Intermetallics 1998, 6, 759–763. [Google Scholar] [CrossRef]
- Mitchell, T.E.; Baskes, M.I.; Hoagland, R.G.; Misra, A. Dislocation core structures and yield stress anomalies in molybdenum disilicide. Intermetallics 2001, 9, 849–856. [Google Scholar] [CrossRef]
- Nakano, T.; Hagihara, K. Yield stress anomaly controlled by the phase stability in NbSi2 single crystals. Scr. Mater. 2013, 68, 313–316. [Google Scholar] [CrossRef]
- Liu, L.L.; Wu, X.Z.; Wang, R.; Li, W.G.; Liu, Q. Stacking fault energy, yield stress anomaly, and twinnability of Ni3Al: A first principle study. Chin. Phys. B 2015, 24, 077102. [Google Scholar] [CrossRef]
- Lü, B.L.; Chen, G.Q.; Qu, S.; Su, H.; Zhou, W.L. First-principle calculation of yield stress anomaly of Ni3Al-based alloys. Mater. Sci. Eng. A 2013, 565, 317–320. [Google Scholar] [CrossRef]
- Golovin, I.S.; Jäger, S.; Mennerich, C.; Siemers, C.; Neuhäuser, H. Structure and anelasticity of Fe3Ge alloy. Intermetallics 2007, 15, 1548–1557. [Google Scholar] [CrossRef]
- Balk, T.J.; Kumar, M.; Hemker, J. Influence of Fe substitutions on the deformation behavior and fault energies of Ni3Ge-Fe3Ge L12 intermetallic alloys. Acta Mater. 2001, 49, 1725–1736. [Google Scholar] [CrossRef]
- Hu, W.C.; Liu, Y.; Li, D.J.; Zeng, X.Q.; Xu, C.S. Mechanical and thermodynamic properties of Al3Sc and Al3Li precipitates in Al-Li-Sc alloys from first-principles calculations. Phys. B 2013, 427, 85–90. [Google Scholar] [CrossRef]
- Saal, J.E.; Wolverton, C. Energetics of antiphase boundaries in γ’ Co3(Al,W)-based superalloys. Acta Mater. 2016, 103, 57–62. [Google Scholar] [CrossRef]
- Wu, X.Z.; Wang, R.; Wang, S.F.; Wei, Q.Y. Ab initio calculations of generalized-stacking-fault energy surfaces and surface energies for FCC metals. Appl. Surf. Sci. 2010, 256, 6345–6349. [Google Scholar] [CrossRef]
- Frankel, J.; Vassiliou, J.; Jamieson, J.C.; Dandekar, D.P.; Scholz, W. The elastic constants of Ni3Al to 1.4 GPa. Physica B+C 1986, 139, 198–201. [Google Scholar] [CrossRef]
- Duan, Y.H.; Sun, Y.; Peng, M.J.; Zhou, S.G. Ab-initio investigations on elastic properties in L12 structure Al3Sc and Al3Y under high pressure. J. Alloy. Compd. 2014, 585, 587–593. [Google Scholar] [CrossRef]
- Boucetta, S.; Zegrar, F. First-Principles Study of the Structural, Elastic, and Mechanical Properties of Ni3Ga Compound under Pressure. Acta Phys. Pol. A 2014, 125, 54. [Google Scholar] [CrossRef]
- Pearson, W.B. A Handbook of Lattice Spacings and Structures of Metals and Alloys; Pergamon Press: Pergamon, Turkey; New York, NY, USA, 1958. [Google Scholar]
- Li, J.; Zhang, M.; Luo, X. Theoretical investigations on phase stability, elastic constants and electronic structures of D022- and L12-Al3Ti under high pressure. J. Alloy. Compd. 2013, 556, 214–220. [Google Scholar] [CrossRef]
- Tian, T.; Wang, X.F.; Li, W. Ab initio calculations on elastic properties in L12 structure Al3X and X3Al-type (X = transition or main group metal) intermetallic compounds. Solid State Commun. 2013, 156, 69–75. [Google Scholar] [CrossRef]
- Fu, C.L.; Ye, Y.Y.; Yoo, M.H. Theoretical investigation of the elastic constants and shear fault energies of Ni3Si. Philos. Mag. Lett. 1993, 67, 179–185. [Google Scholar] [CrossRef]
Figure 1.
Structure of cross-slip from {111} onto the {010} plane. The white and black circles are substitutions on the {010} and {111} planes.
Figure 1.
Structure of cross-slip from {111} onto the {010} plane. The white and black circles are substitutions on the {010} and {111} planes.
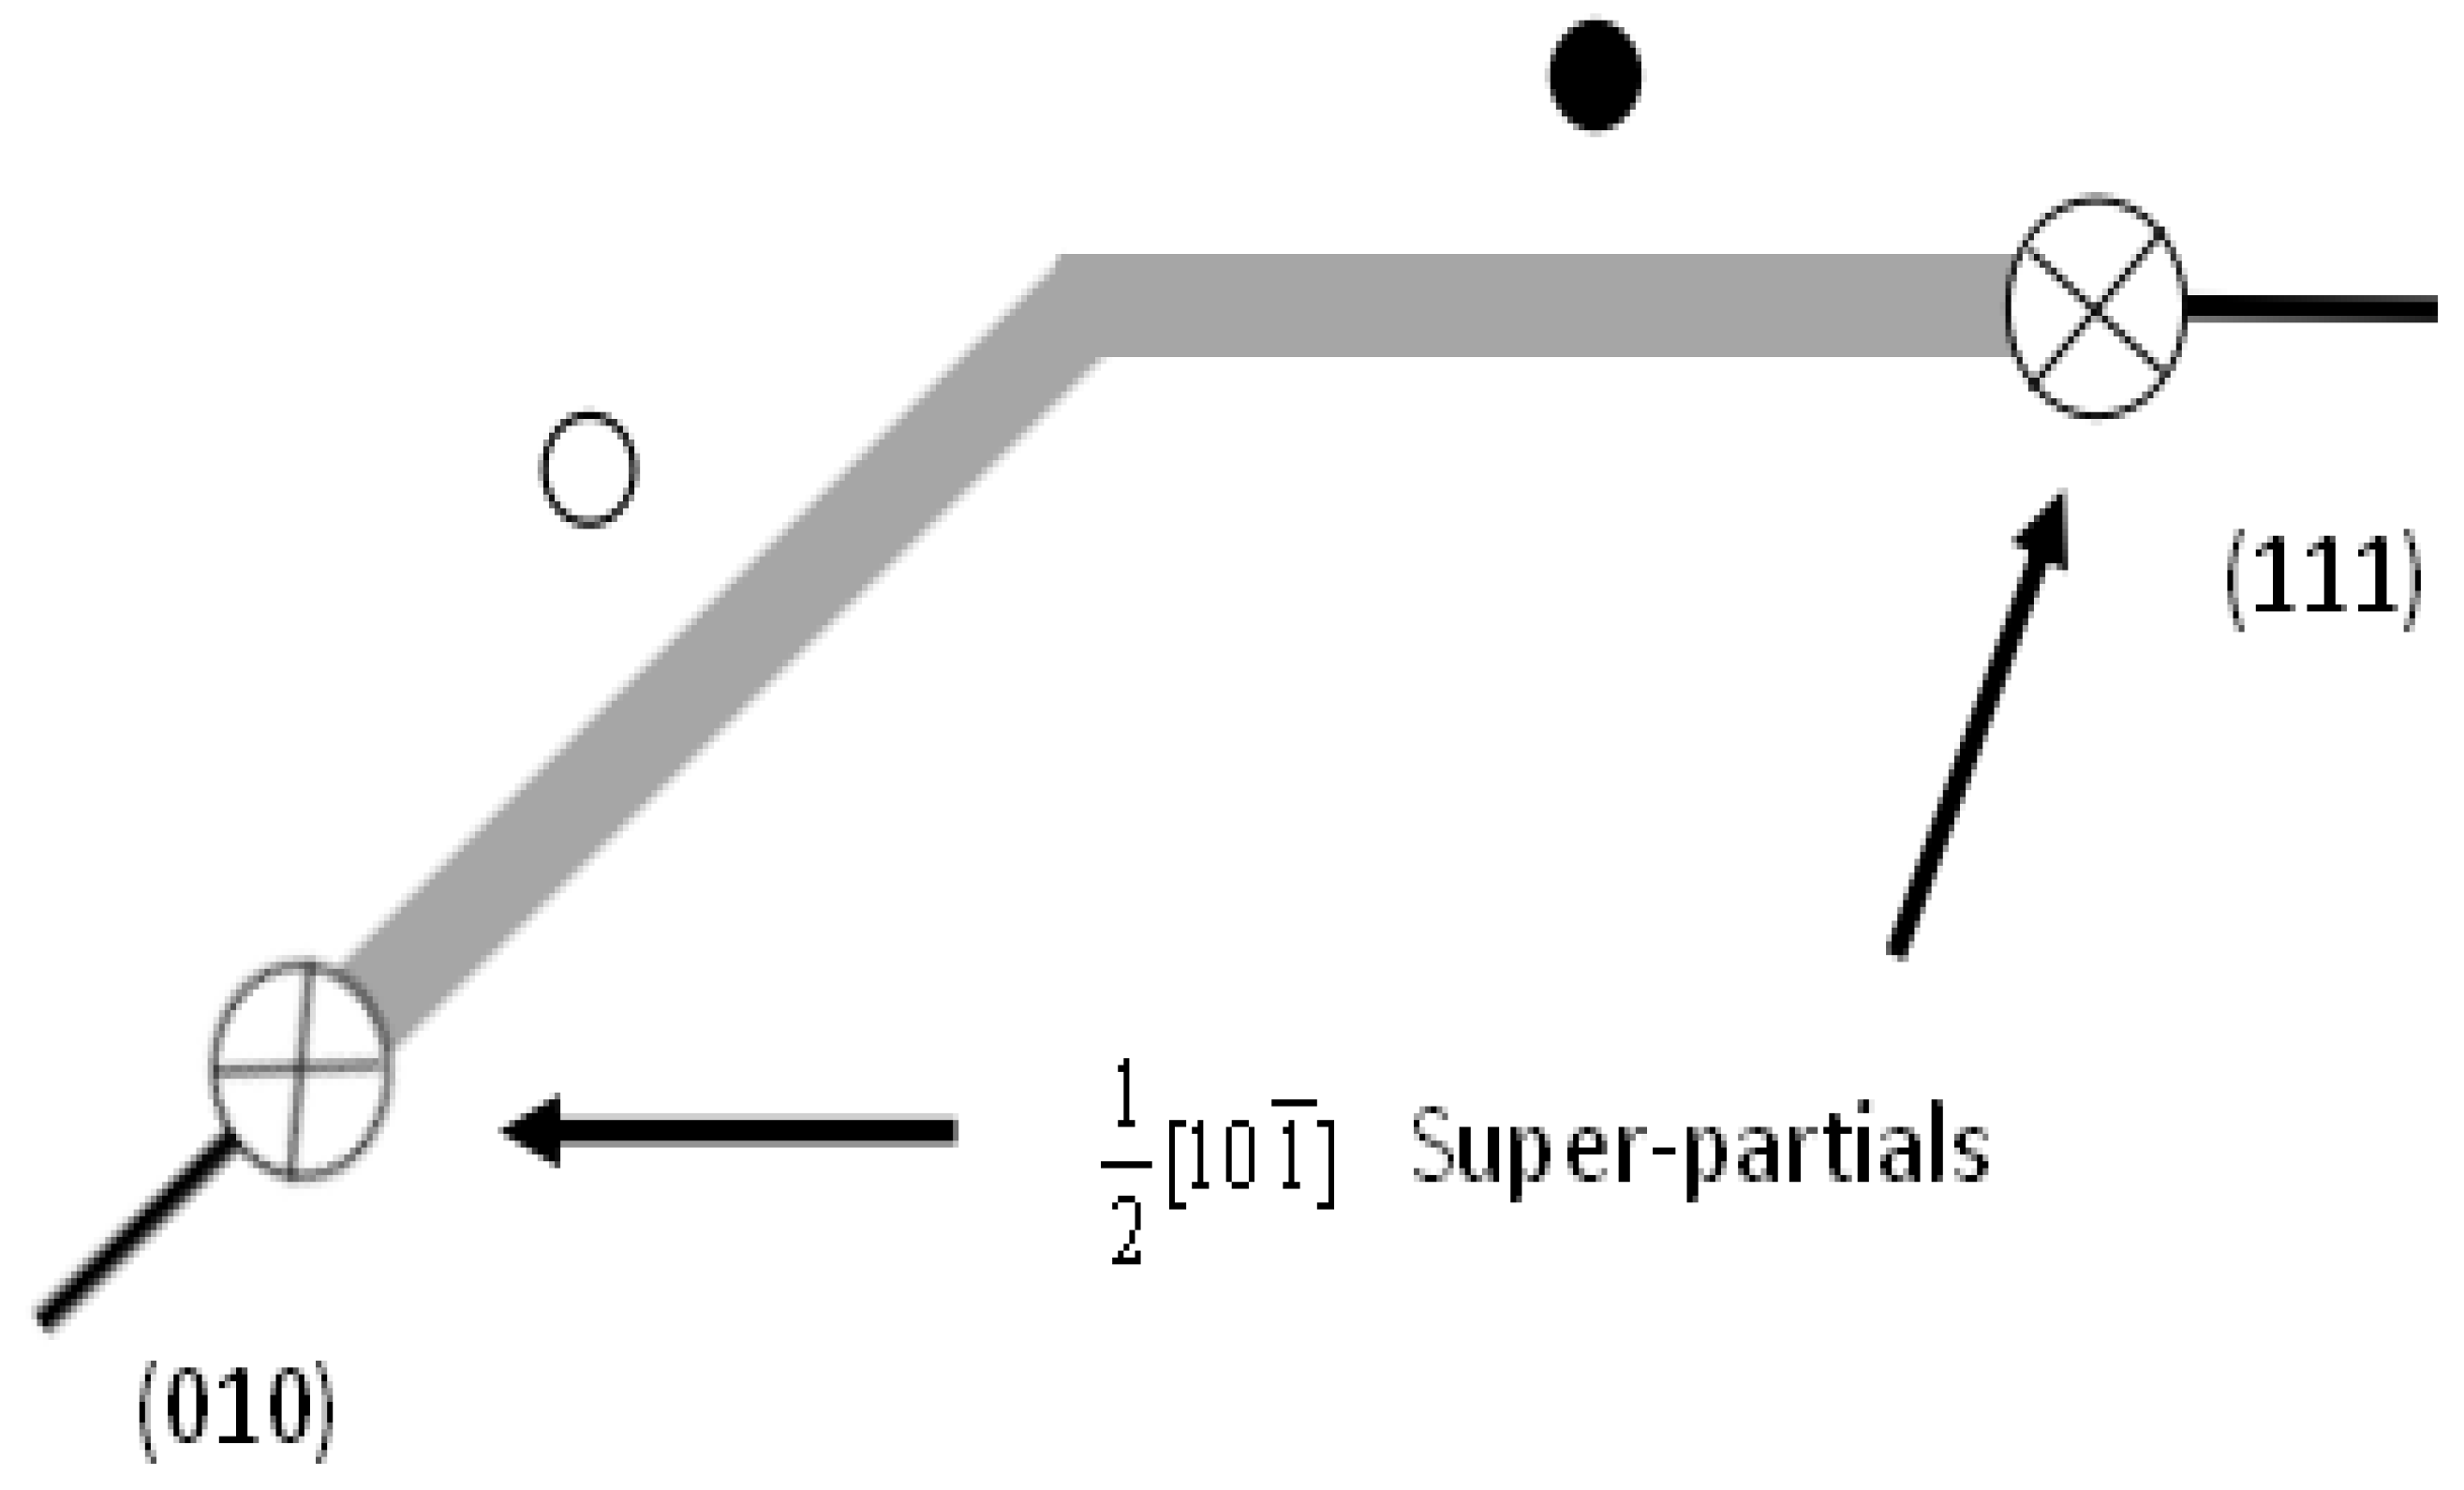
Figure 2.
Supercells for antiphase boundary (APB) energy calculations in (a) {111} planes and (b) {010} planes with a concentration of 25%. Red spheres represent A atoms and black spheres represent B atoms in AB L1 materials.
Figure 2.
Supercells for antiphase boundary (APB) energy calculations in (a) {111} planes and (b) {010} planes with a concentration of 25%. Red spheres represent A atoms and black spheres represent B atoms in AB L1 materials.
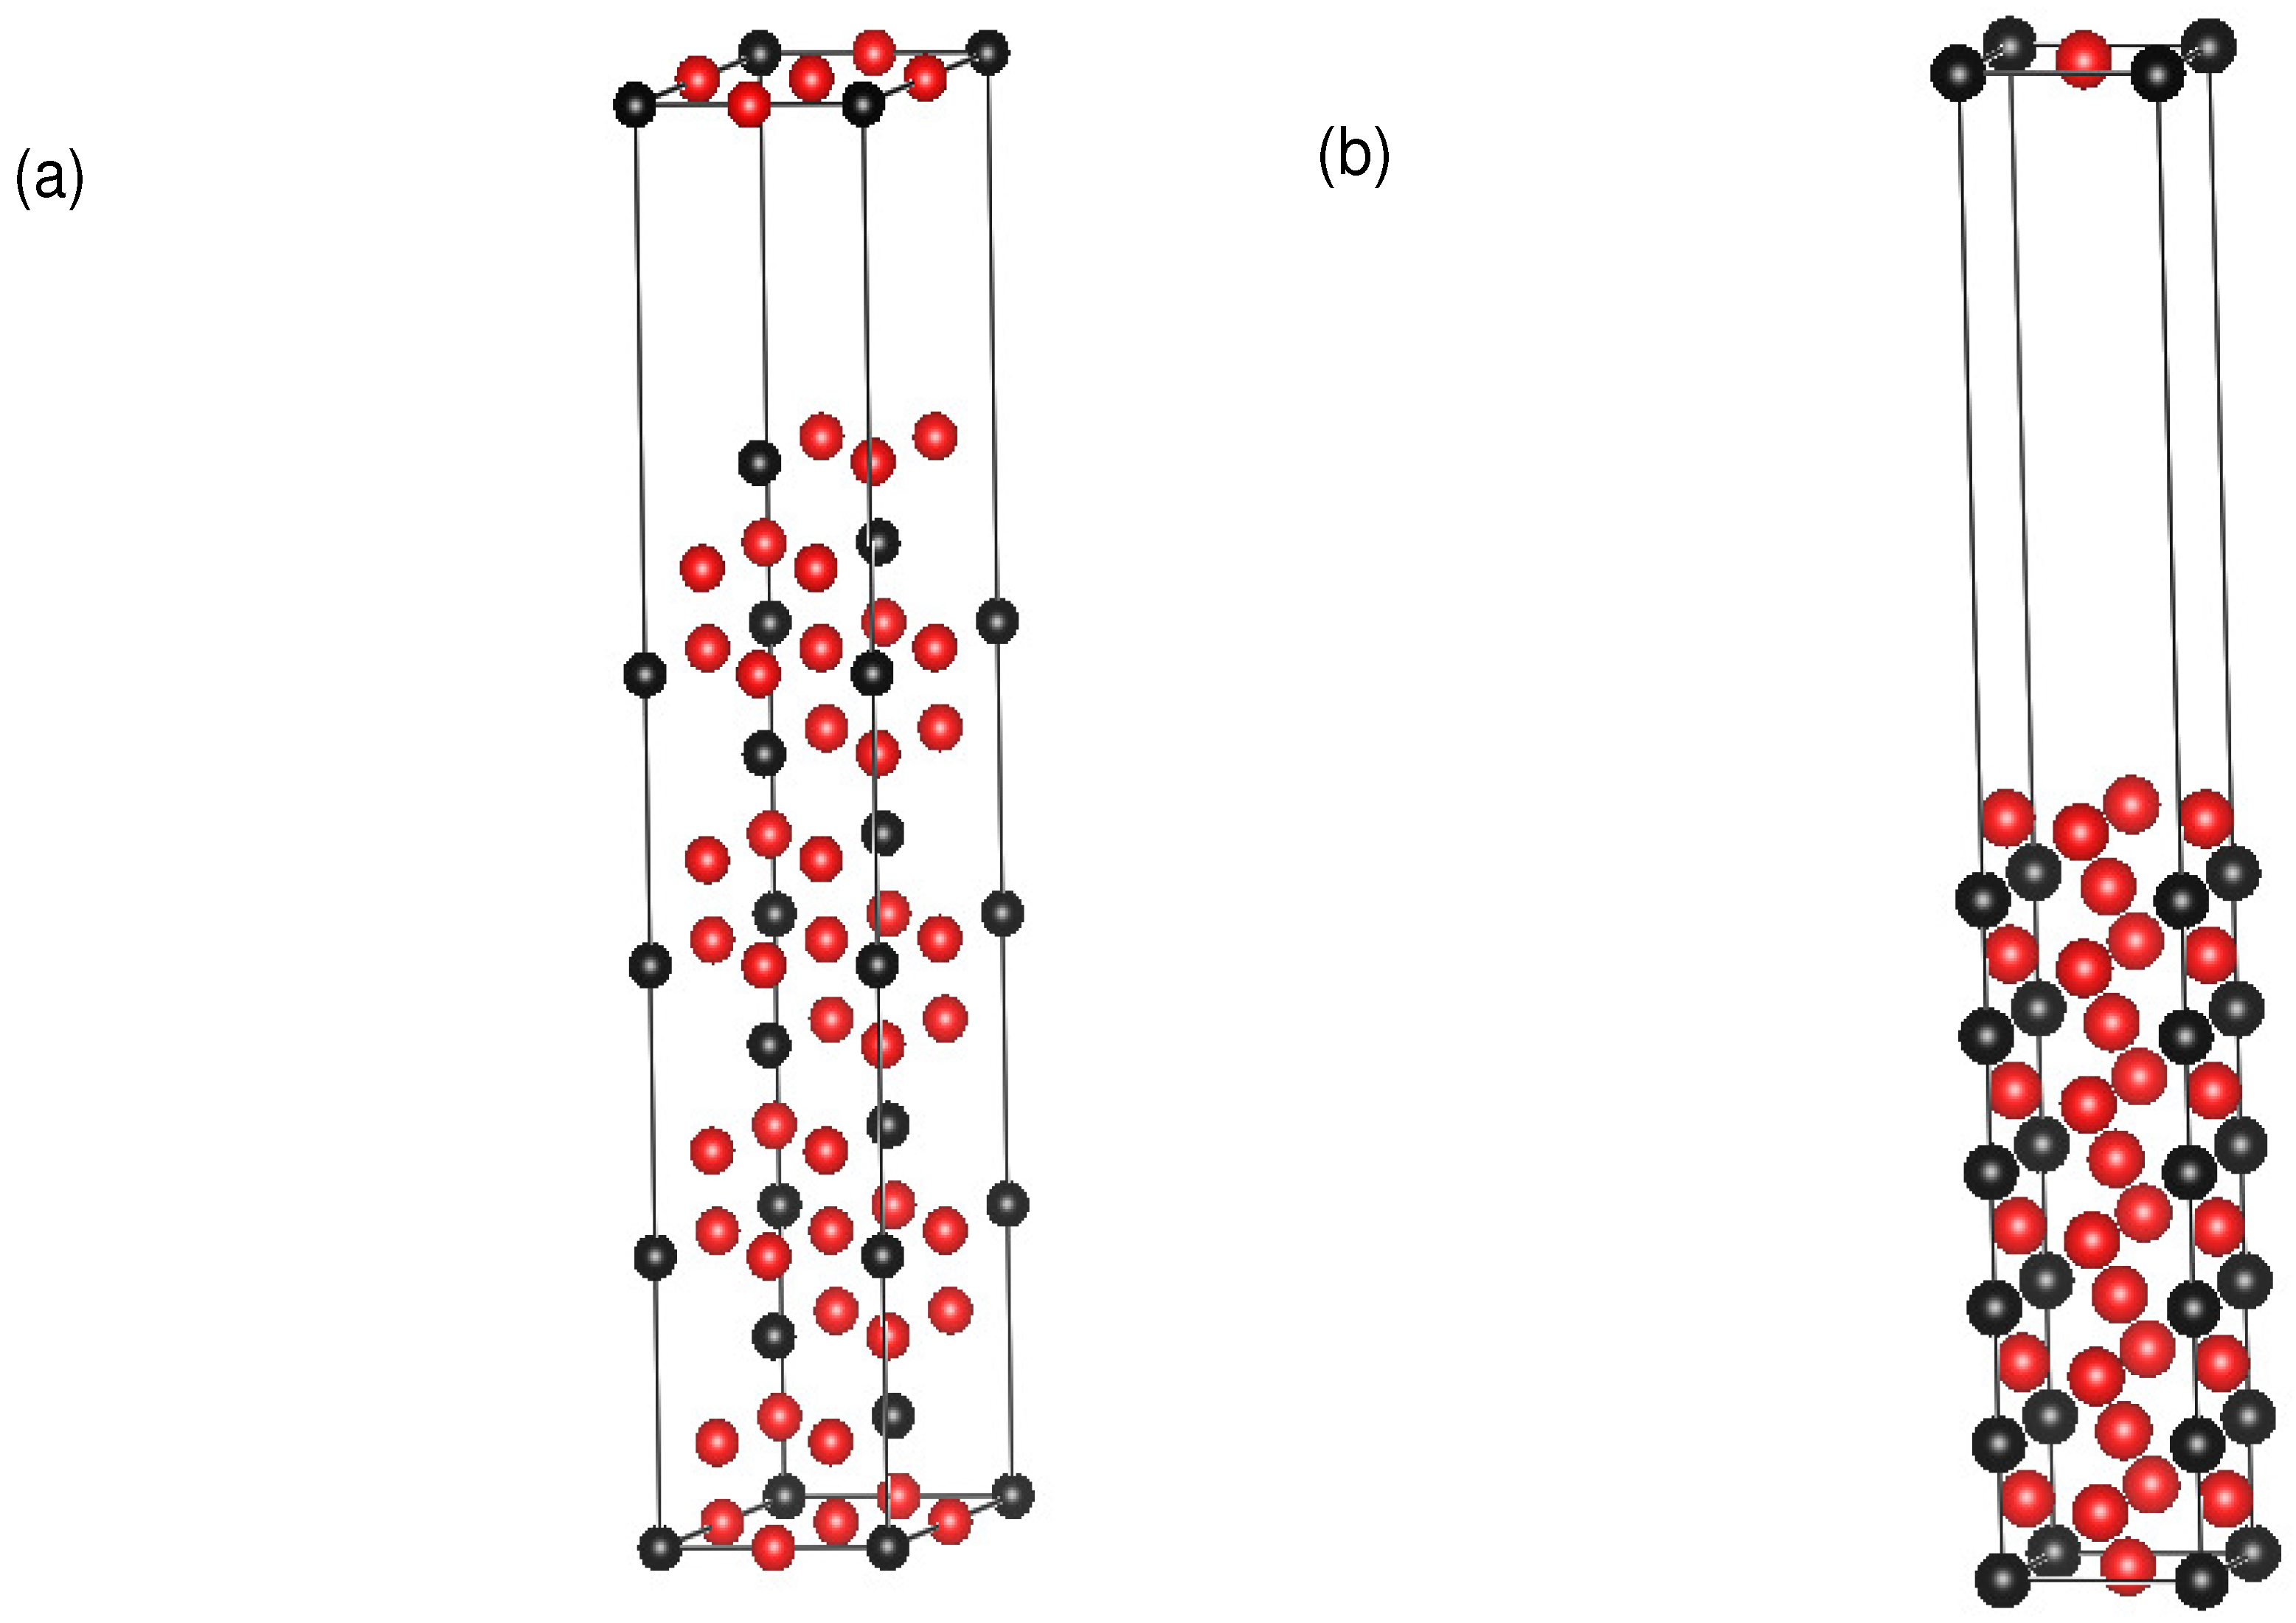
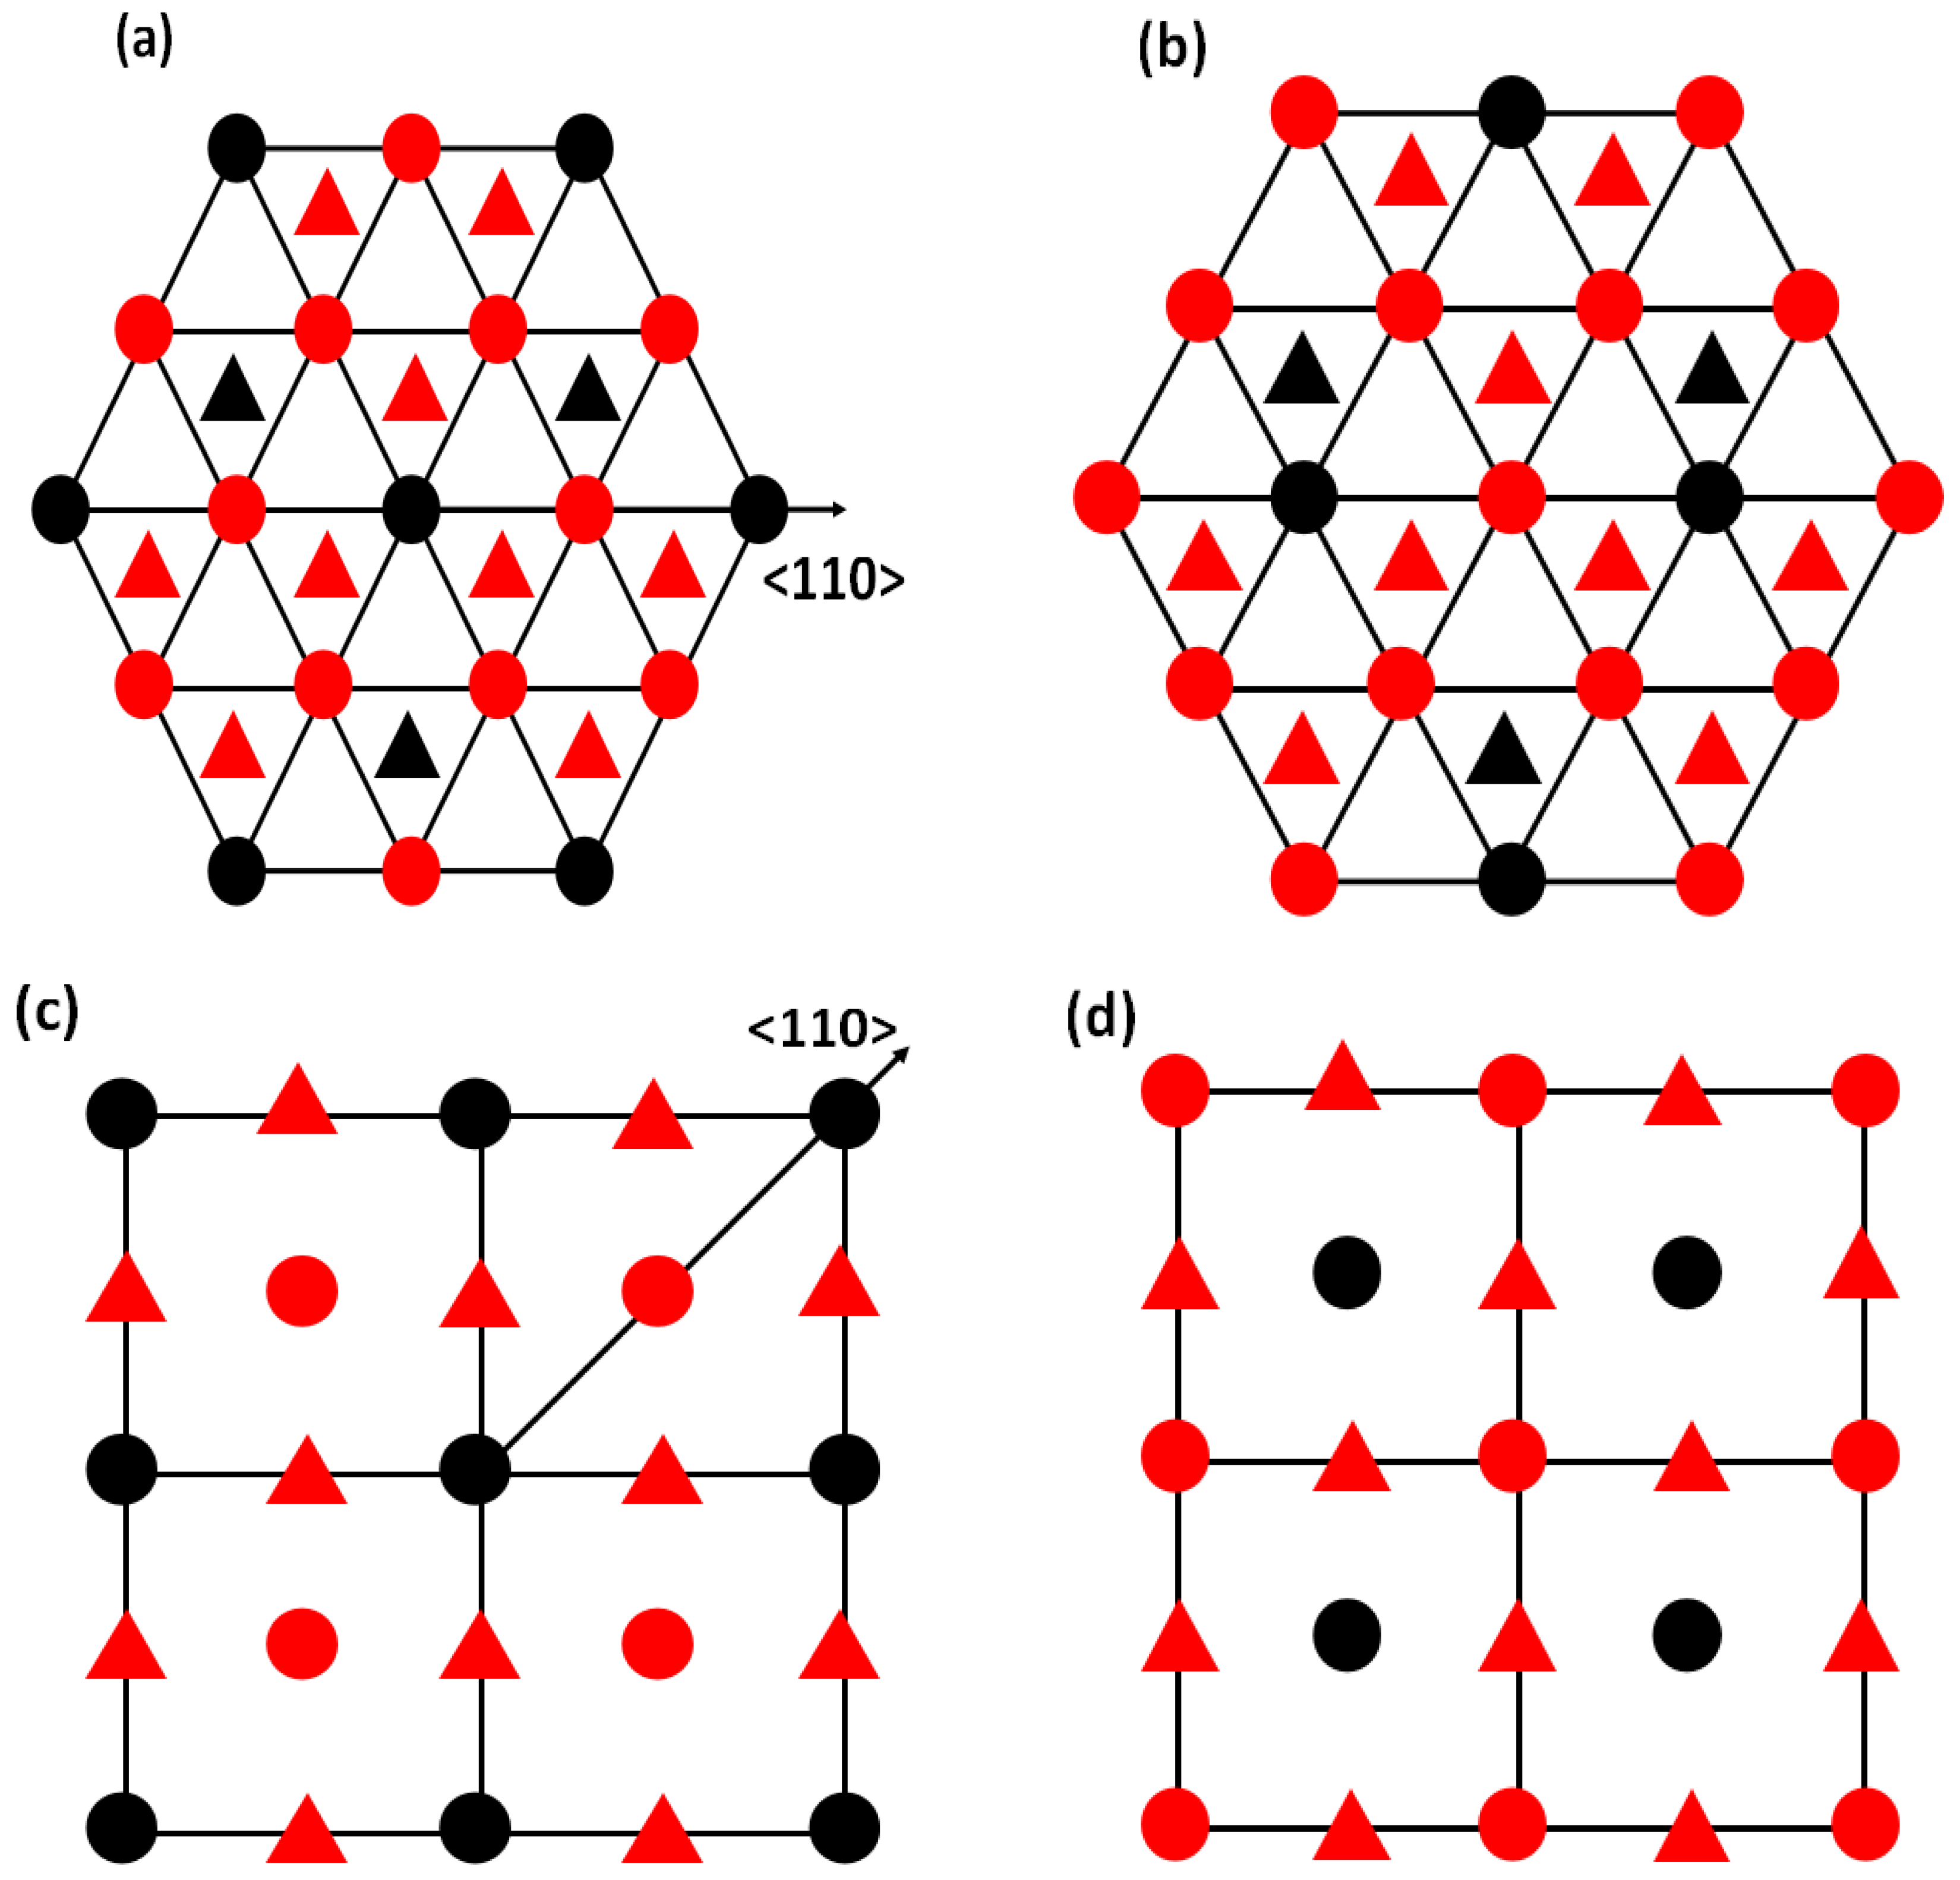
Figure 3.
The atomic projection of L1 AB (a) without and (b) with APB on the {111} planes; (c) without and (d) with APB on the {010} planes. Red spheres represent A atoms and black spheres represent B atoms in AB L1 materials.
Figure 3.
The atomic projection of L1 AB (a) without and (b) with APB on the {111} planes; (c) without and (d) with APB on the {010} planes. Red spheres represent A atoms and black spheres represent B atoms in AB L1 materials.

Figure 4.
p of NiX (X = Al, Ge, Si and Ga) and AlX’ (X’ = Ti and Sc) under different pressures p = 0, 20 and 40 GPa. The blue solid line with up-triangles shows the results of NiAl. The red solid line with squares shows the results of NiGe. The black solid line with circles shows the results of NiSi. The green solid line with crosses shows the results of NiGa, which is shown by the right axis. The brown solid line with down-triangles shows the results of AlTi. The yellow dashed-dotted line with diamonds shows the results of AlSc. The magenta dash line represents the critical value of p = .

Figure 5.
p-factors of Ni substituted with (a) Fe; (b) Sc; (c) Al; and (d) Ga. Black dashed-dotted lines with circles represent the results of atoms substituted in both {111} and {010} planes; blue solid lines with triangles represent the results of atoms substituted only in {111} planes; purple solid lines with squares represent the results of atoms substituted only in {010} planes. Magenta dashed lines represent the critical value of p = .
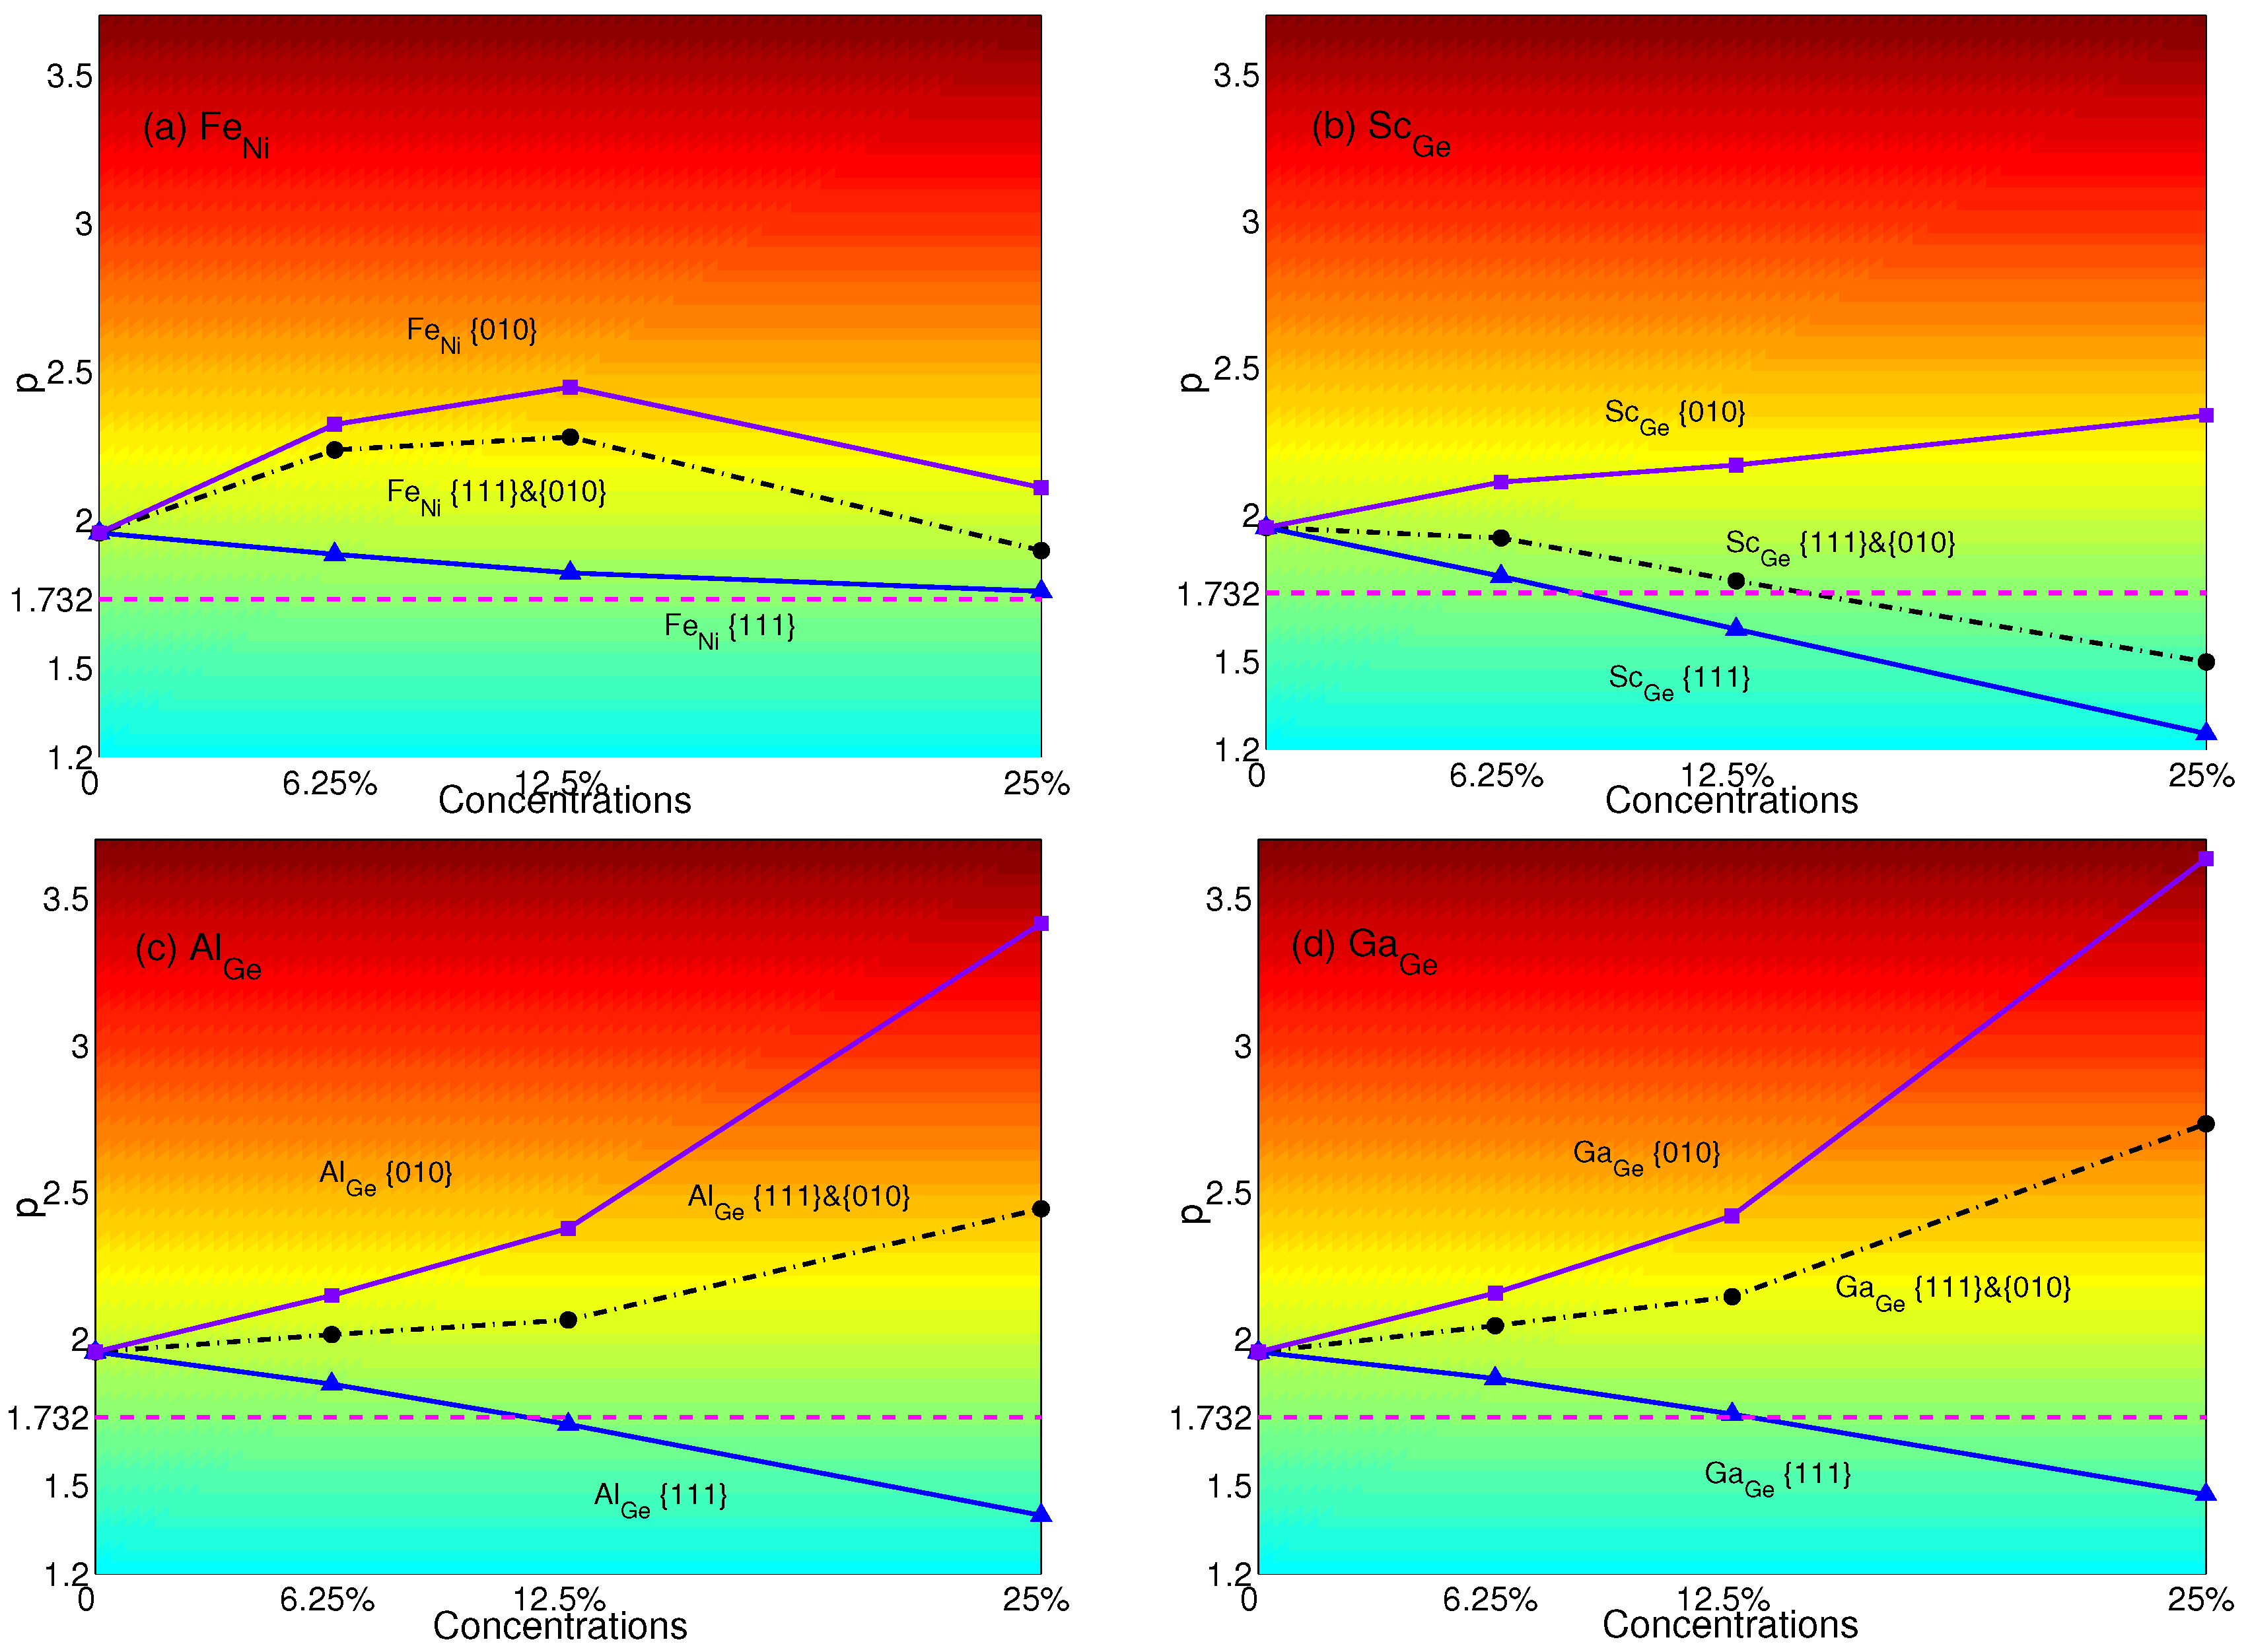
Figure 6.
p-factors of Ni substituted by (a) Al; (b) Ga; (c) Ti; and (d) Sc. Black dashed-dotted lines with circles represent the results of atoms substituted in both {111} and {010} planes; blue solid lines with triangles represent the results of atoms substituted only in {111} planes; purple solid lines with squares represent the results of atoms substituted only in {010} planes. Magenta dash lines represent the critical value of p = .
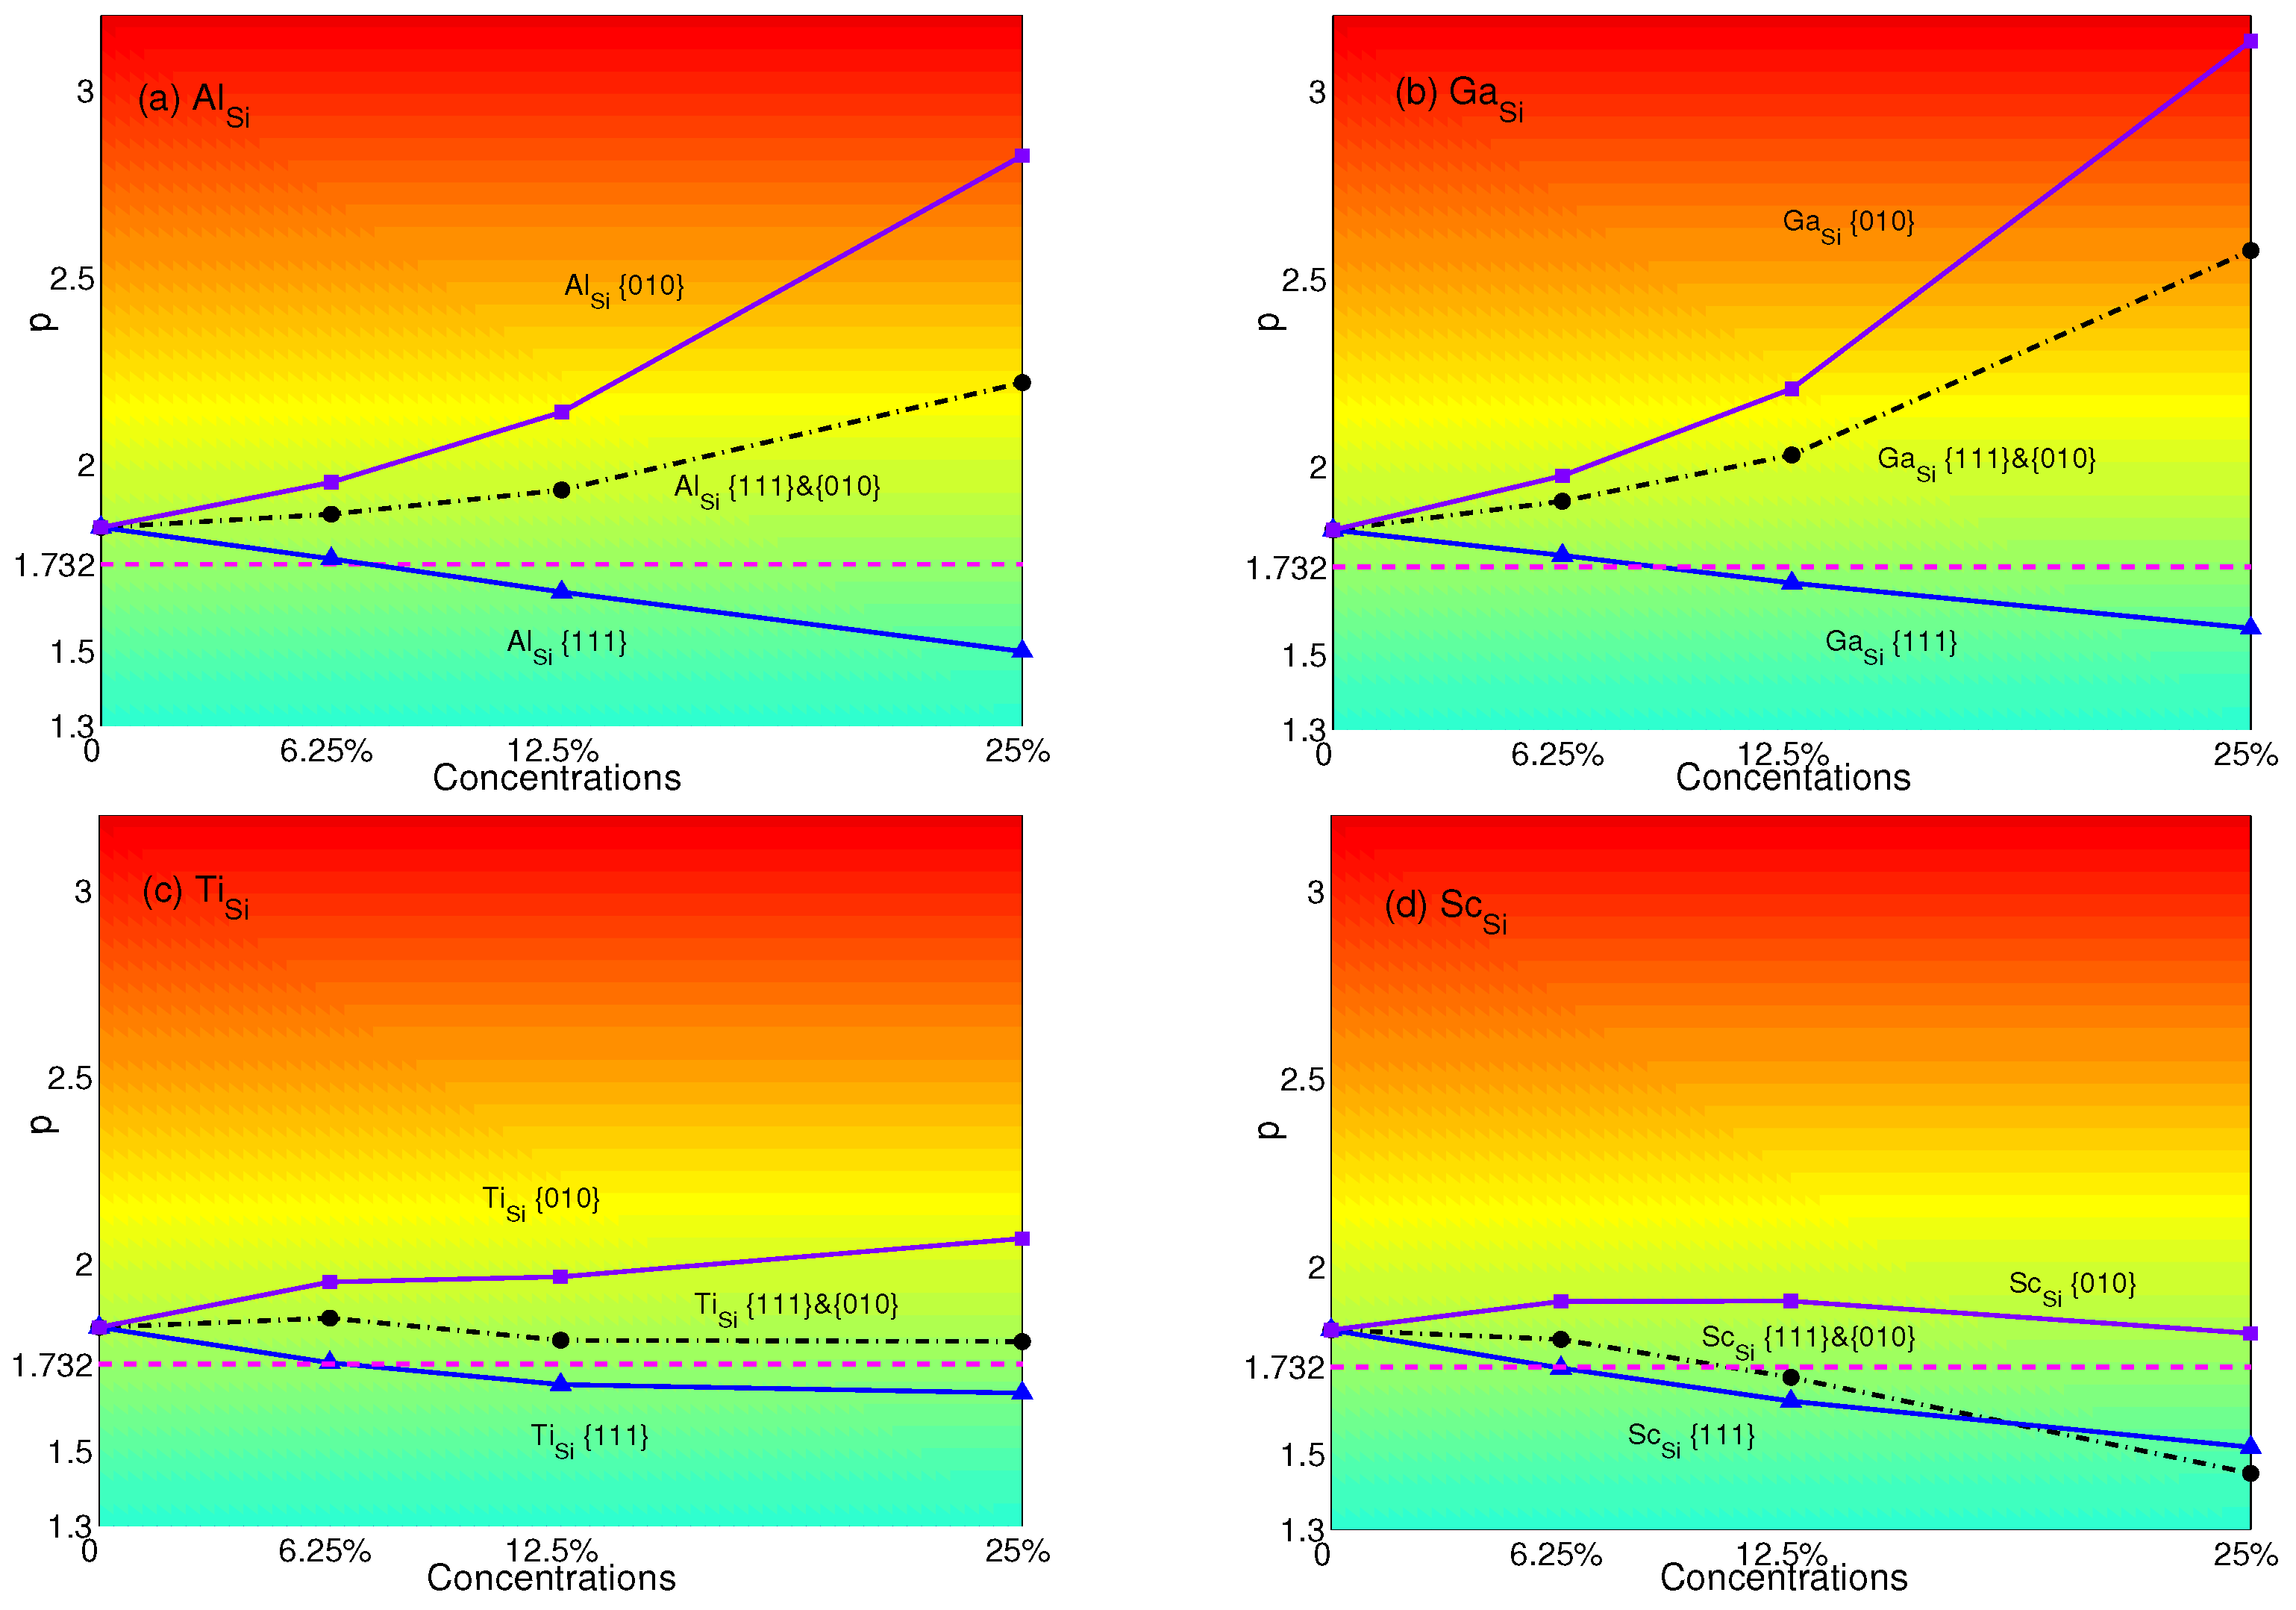
Figure 7.
p-factors of Al: substituted with (a) Ti; (b) Y; (c) Li; and (d) Zr. Black dashed-dotted lines with circles represent the results of atoms substituted in both {111} and {010} planes; red solid lines with triangles represent the results of atoms substituted only in {111} planes; purple solid lines with squares represent the results of atoms substituted only in {010} planes. Magenta dashed lines represent the critical value of p = .
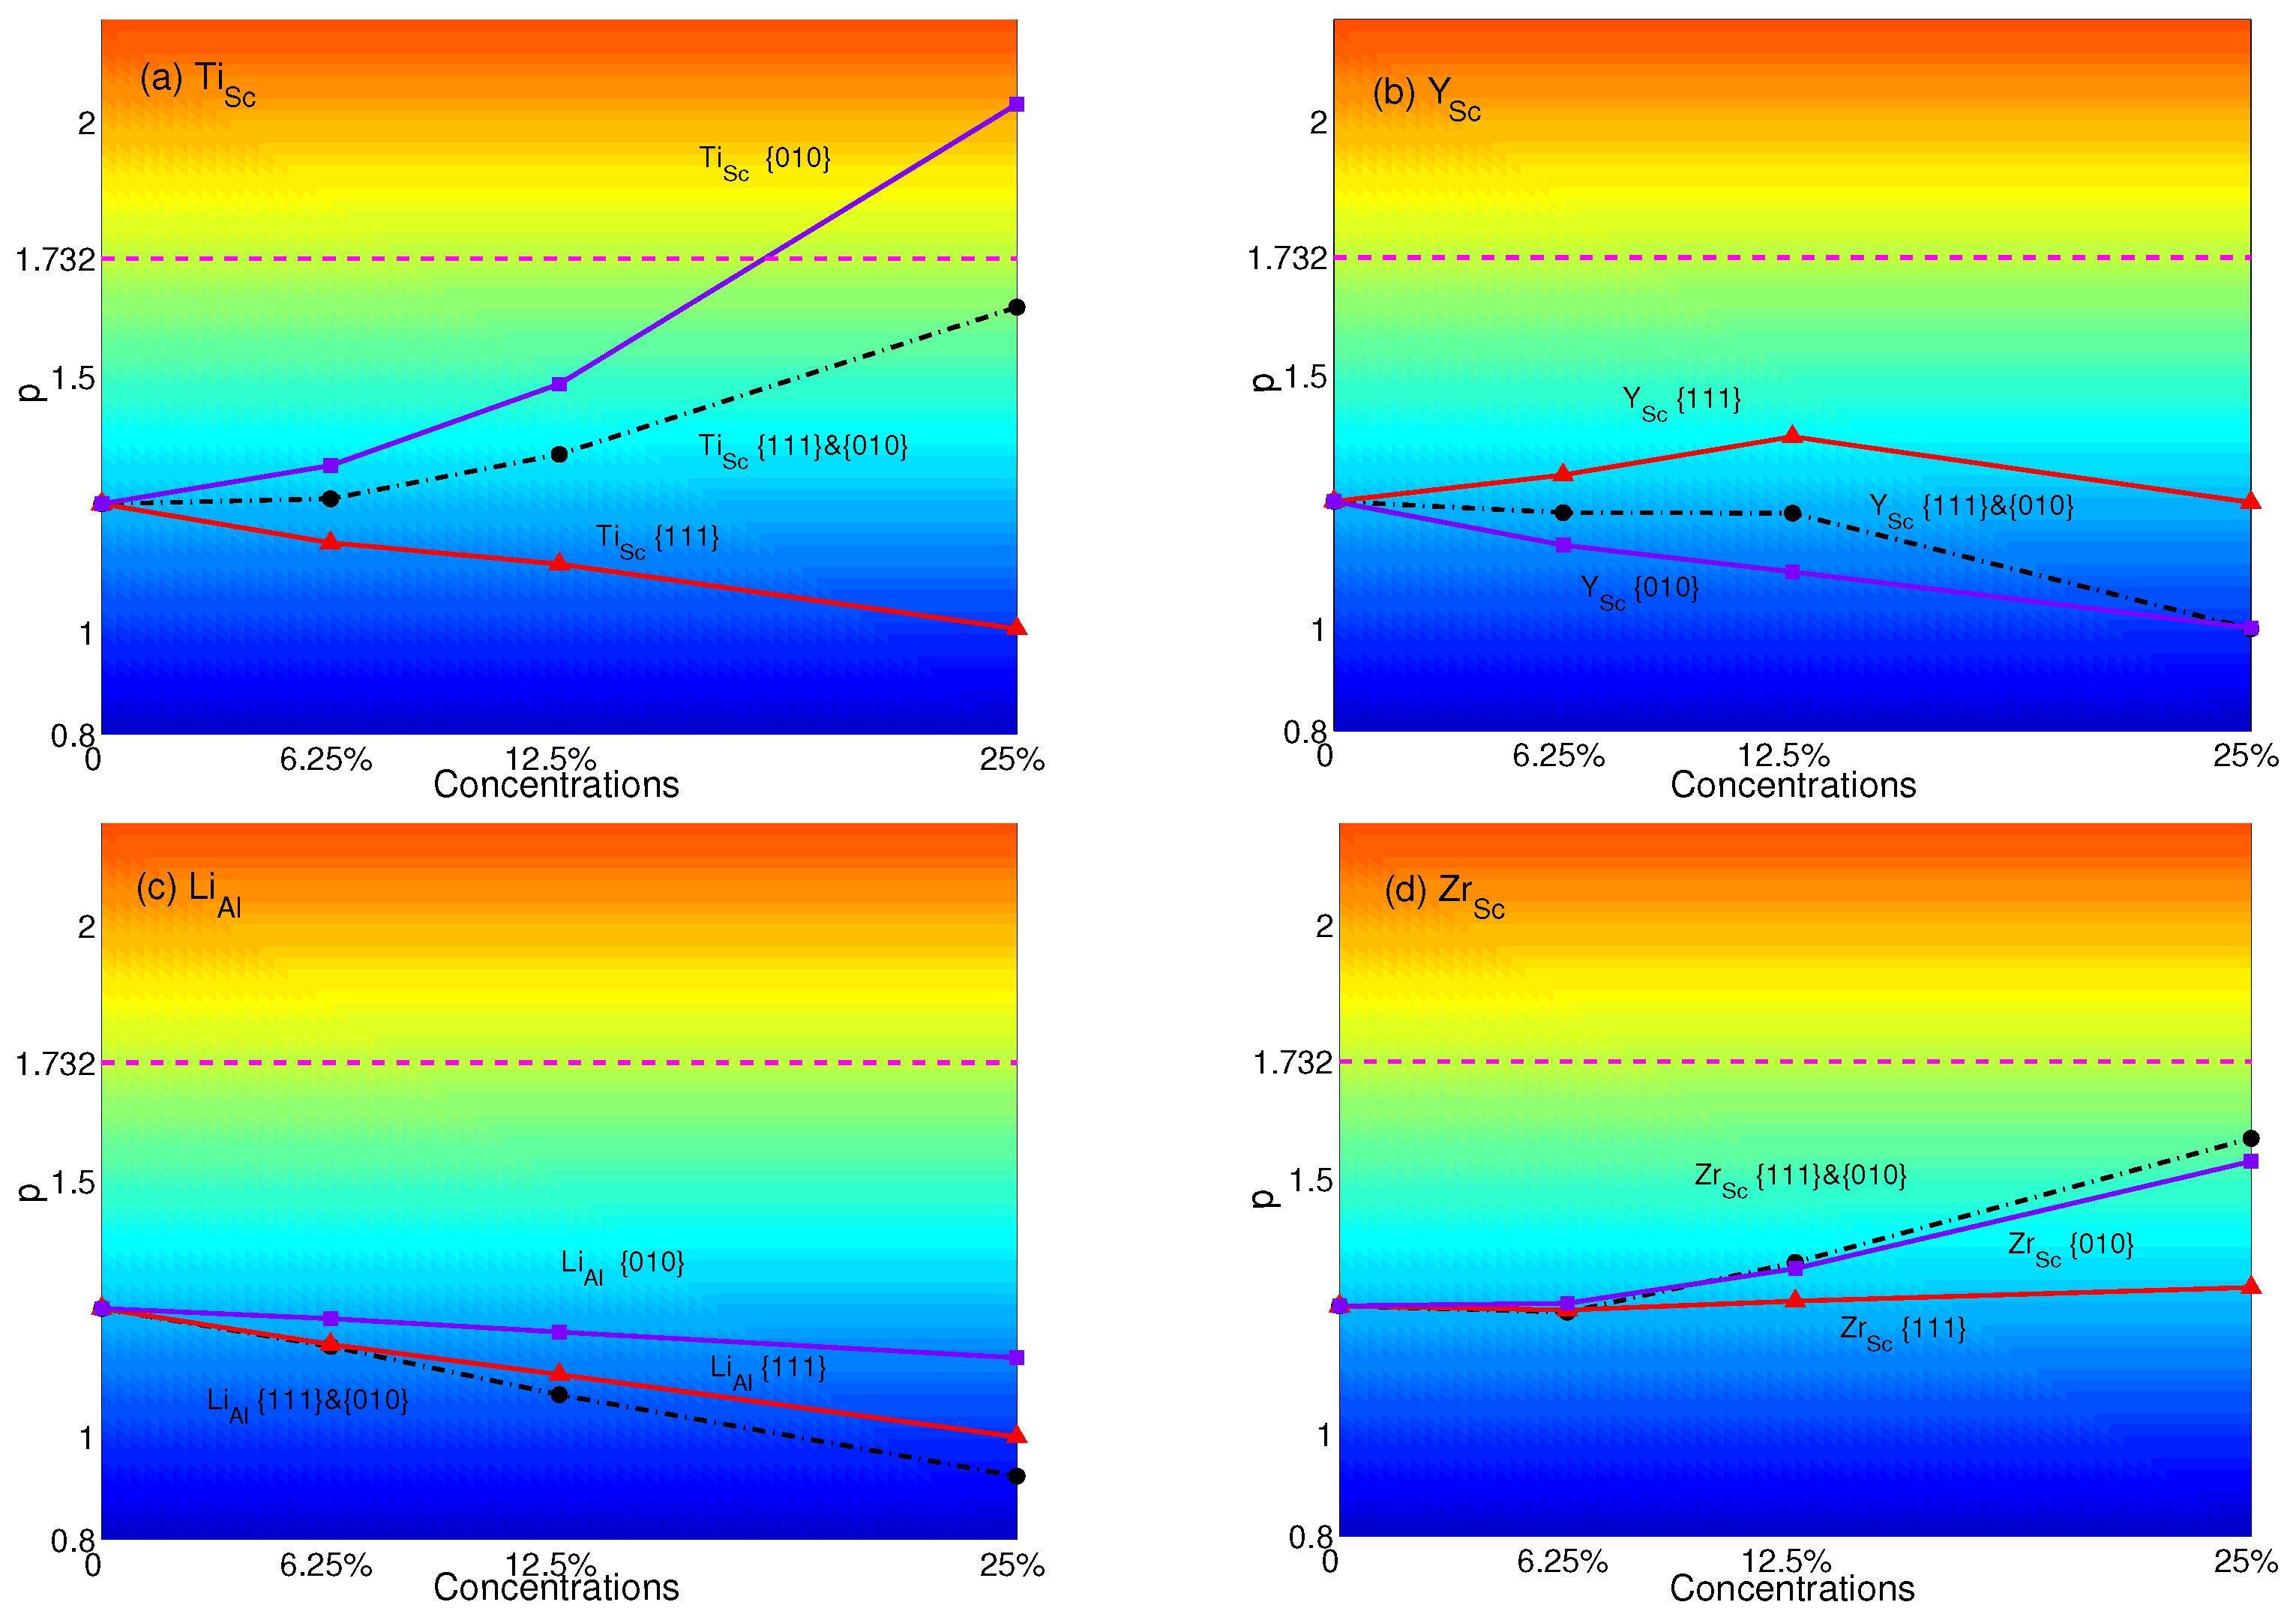
Figure 8.
p-factors of Ni: (a) Fe in {111} planes with Sc, Al and Ga in {010} planes; (b) Sc in {111} planes with Fe, Al and Ga in {010} planes; (c)Al in {111} planes with Fe, Sc and Ga in {010} planes; (d) Ga in {111} planes with Fe, Sc and Al in {010} planes. Magenta dash lines represent the critical value of p = .
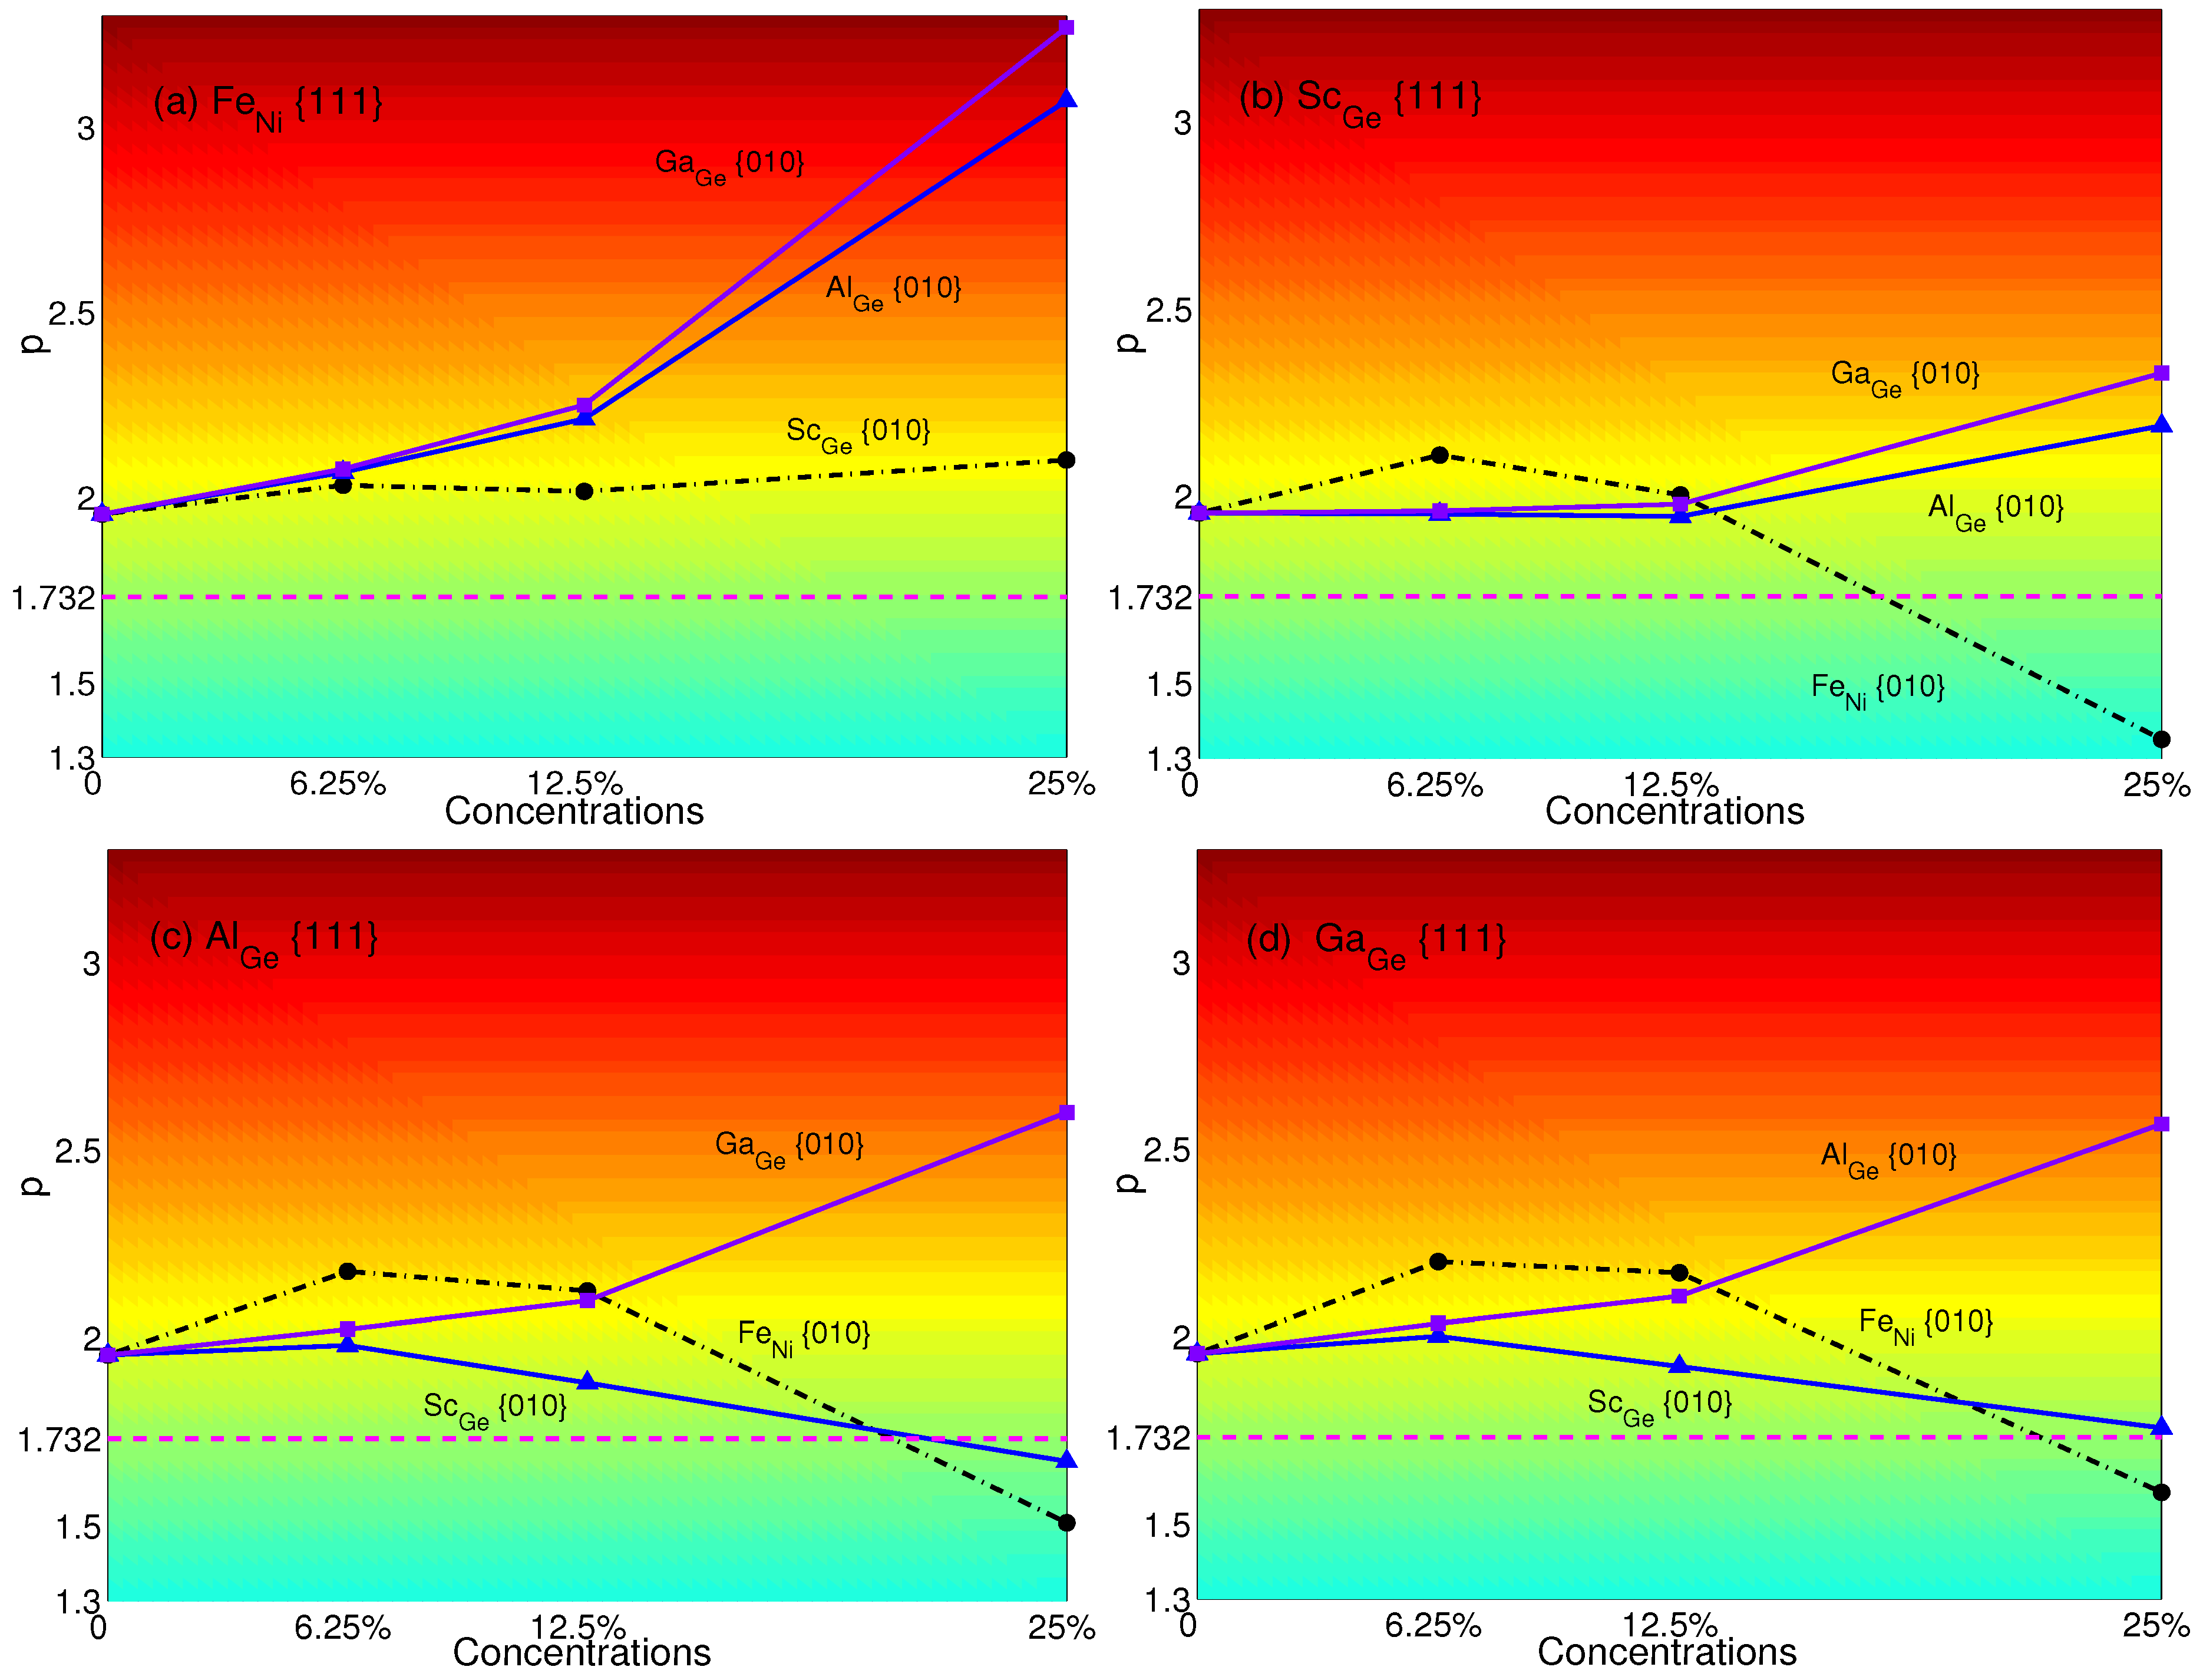
Figure 9.
p-factors of Ni: (a) Al in {111} planes with Ga, Ti and Sc in {010} planes; (b) Ga in {111} planes with Al, Ti and Sc in {010} planes; (c) Ti in {111} planes with Al, Sc and Sc in {010} planes; (d) Sc in {111} planes with Al, Ga and Ti in {010} planes. Magenta dash lines represent the critical value of p = .
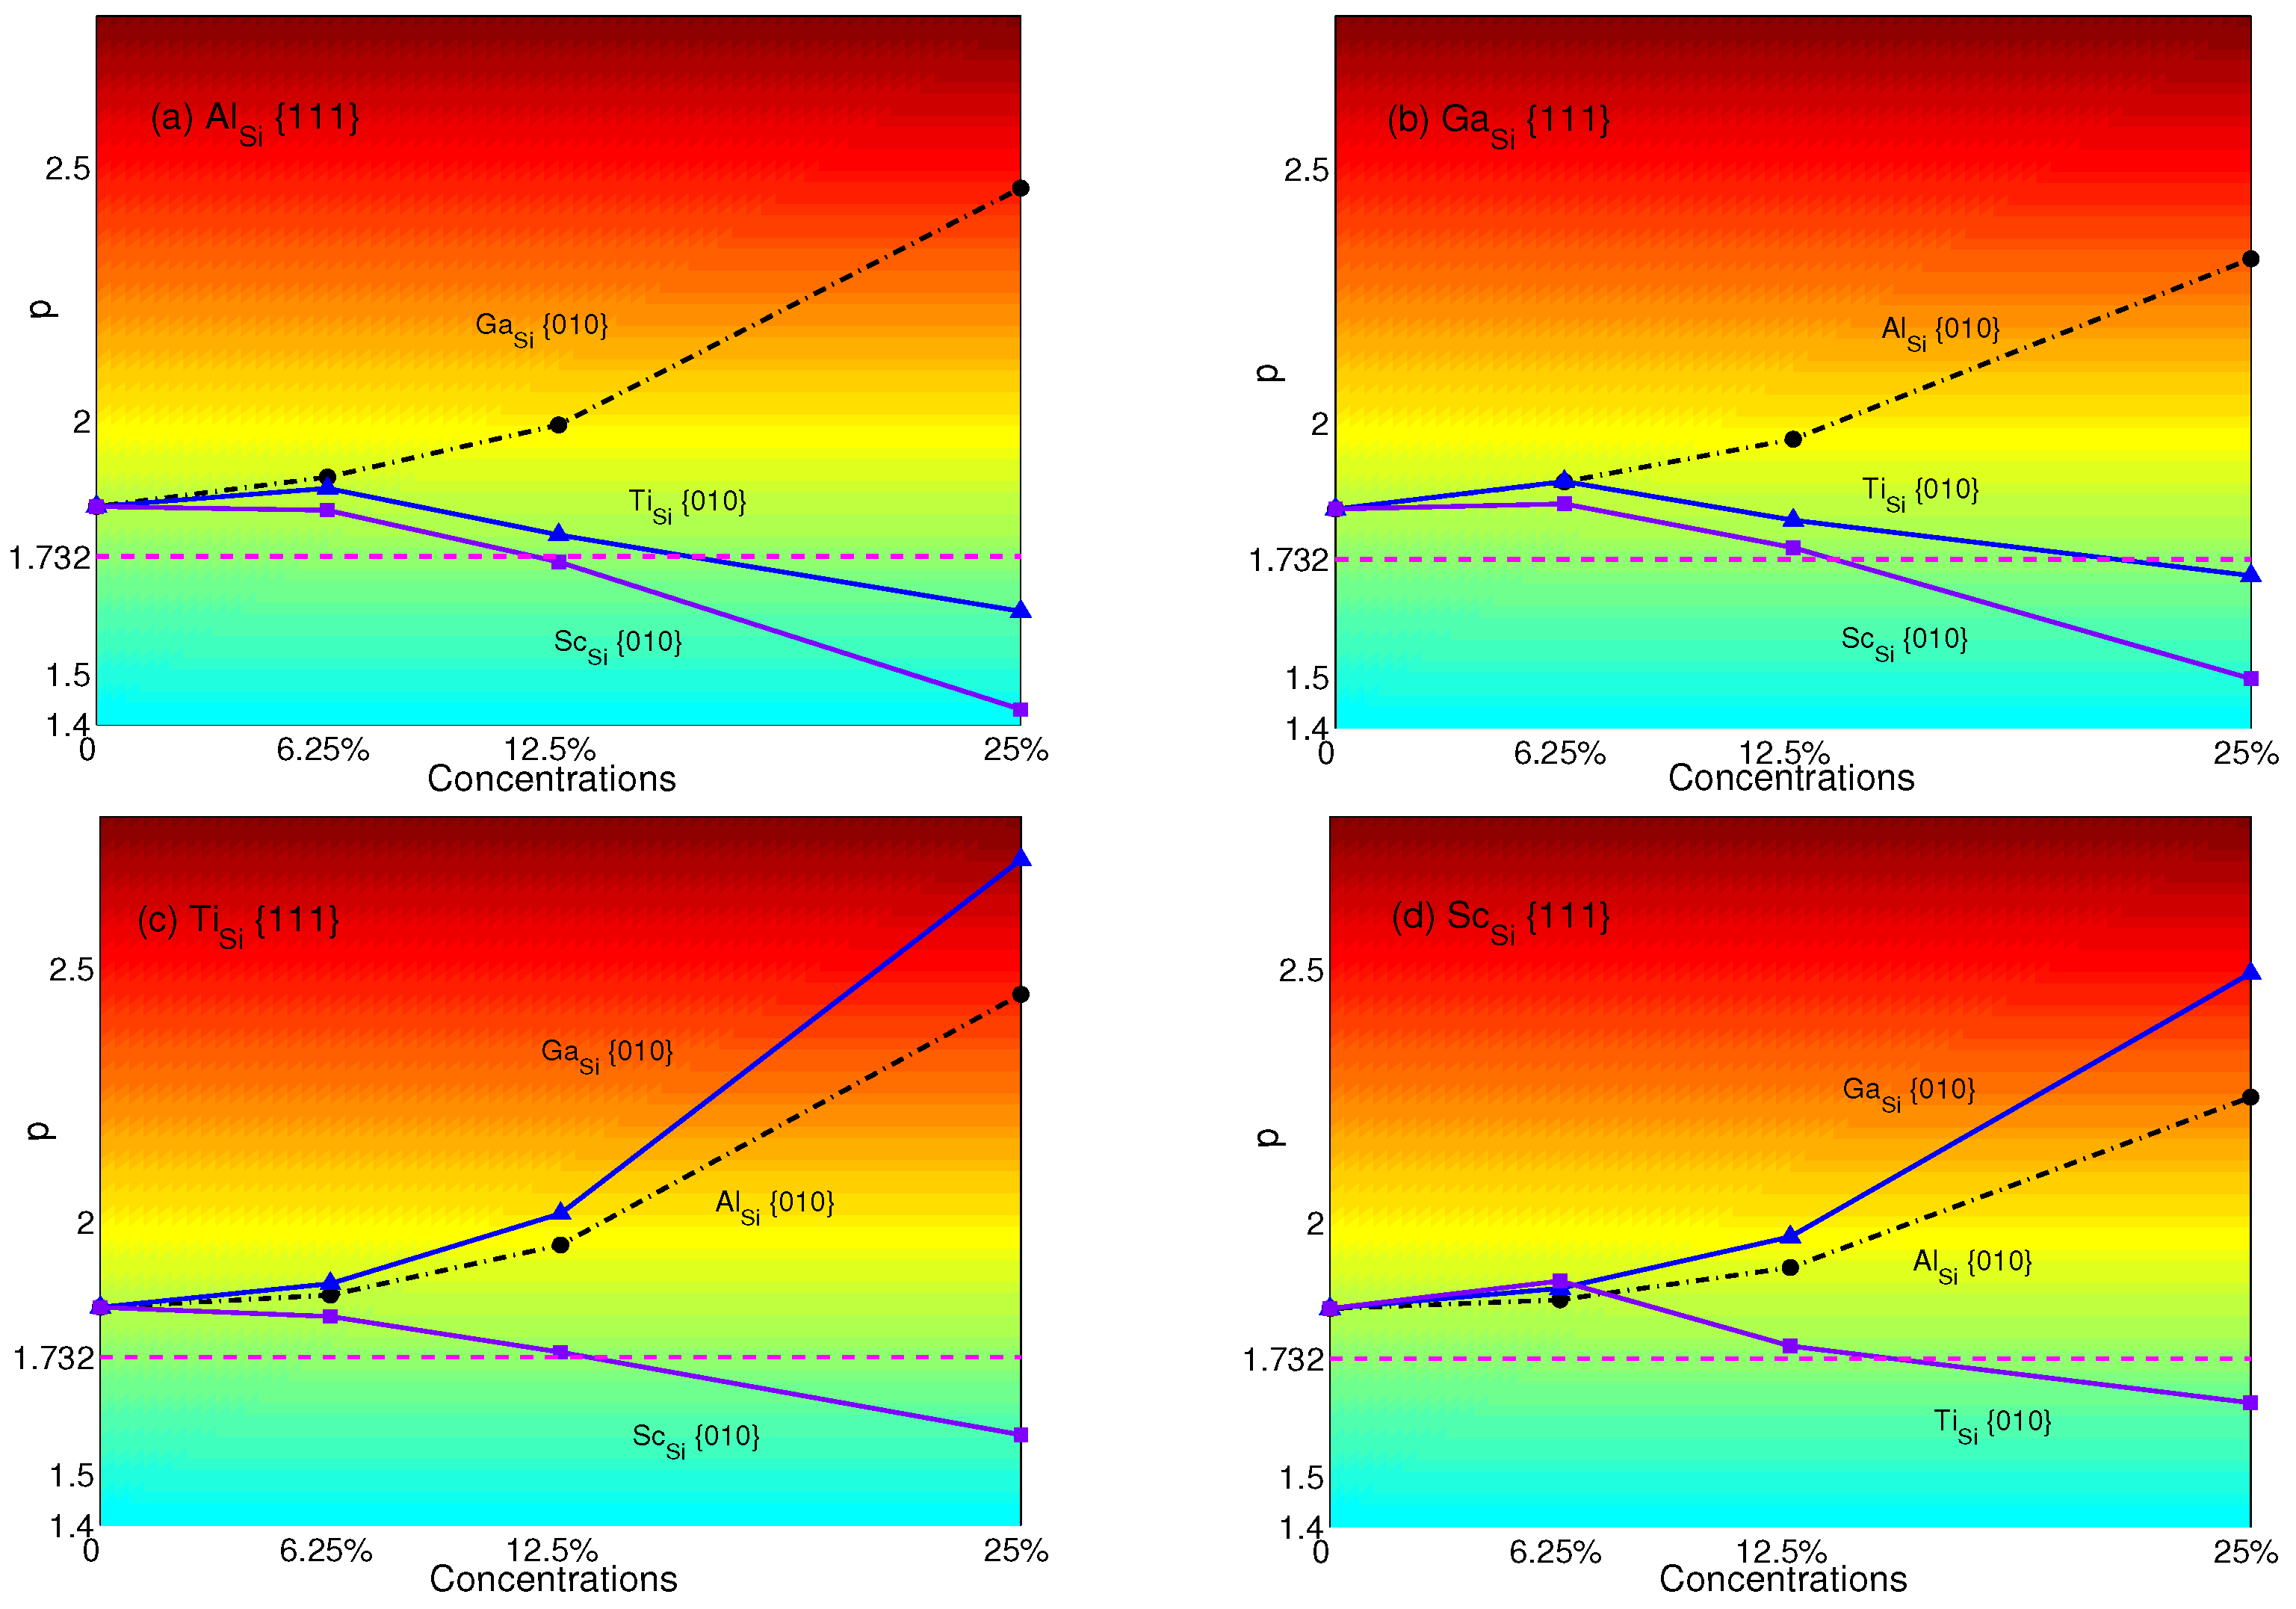
Figure 10.
p-factors of Al: (a) Ti in {111} planes with Y, Li and Zr in {010} planes; (b) Y in {111} planes with Ti, Li and Zr in {010} planes; (c) Li in {111} planes with Ti, Y and Zr in {010} planes; (d) Zr in {111} planes with Ti, Y and Li in {010} planes. Magenta dash lines represent the critical value of p = .

Table 1.
Lattice constants a (in units of Å), elastic constants , and (in units of GPa) and the elastic anisotropy ratio A of NiX (X = Al, Ge, Si and Ga), AlX’ (X’ = Ti and Sc) under different pressures P (in units of GPa).
Table 1.
Lattice constants a (in units of Å), elastic constants , and (in units of GPa) and the elastic anisotropy ratio A of NiX (X = Al, Ge, Si and Ga), AlX’ (X’ = Ti and Sc) under different pressures P (in units of GPa).
| P | a | A | ||||
|---|---|---|---|---|---|---|
| NiAl | 0 | 3.569 | 228.42 | 151.76 | 116.89 | 3.05 |
| 1.4 [55] | - | 223.50 | 149.00 | 122.90 | 3.30 | |
| 20 | 3.463 | 330.25 | 231.54 | 161.43 | 3.27 | |
| 40 | 3.389 | 415.88 | 302.55 | 197.93 | 3.49 | |
| NiGe | 0 | 3.585 | 253.81 | 149.28 | 98.83 | 1.89 |
| 0 [41] | 3.500 | 263.00 | 143.00 | 103.00 | 1.72 | |
| 20 | 3.484 | 367.87 | 231.14 | 141.99 | 2.08 | |
| 40 | 3.413 | 474.76 | 310.69 | 183.49 | 2.24 | |
| NiSi | 0 | 3.511 | 298.15 | 166.93 | 129.24 | 1.97 |
| 20 | 3.420 | 410.44 | 247.02 | 174.86 | 2.14 | |
| 40 | 3.354 | 514.69 | 322.28 | 216.06 | 2.25 | |
| NiGa | 0 | 3.588 | 226.66 | 154.68 | 105.40 | 2.93 |
| 0 [57] | 3.521 | 288.86 | 192.53 | 127.74 | 2.65 | |
| 0 [57] | 3.570 | 264.14 | 169.99 | 116.39 | 2.47 | |
| 0 [58] | 3.580 | 191.00 | 123.00 | 108.00 | 3.17 | |
| 20 | 3.482 | 329.99 | 240.69 | 147.18 | 3.30 | |
| 40 | 3.408 | 424.04 | 320.88 | 184.82 | 3.58 | |
| AlTi | 0 | 3.980 | 190.74 | 64.27 | 75.41 | 1.19 |
| 0 [59] | 3.985 | 184.40 | 64.21 | 74.61 | 1.24 | |
| 0 [59] | 3.984 | 184.32 | 62.41 | 72.89 | 1.20 | |
| 0 [59] | 3.900 | 207.54 | 69.05 | 87.29 | 1.26 | |
| 20 | 3.797 | 299.66 | 122.13 | 127.42 | 1.44 | |
| 20 [59] | 3.799 | 292.10 | 120.50 | 126.80 | 1.48 | |
| AlSc | 0 | 4.106 | 182.21 | 39.39 | 71.37 | 1.00 |
| 0 [60] | - | 180.67 | 40.62 | 72.00 | 1.03 | |
| 0 [56] | 4.101 | 187.84 | 35.14 | 73.32 | 0.96 | |
| 20 | 3.887 | 293.69 | 94.29 | 124.15 | 1.25 | |
| 20 [56] | - | 312.83 | 88.19 | 128.13 | 1.14 |
Table 2.
APB energies (in units of J/m) on {111} and {010} planes of NiX (X = Al, Ge, Si and Ga), AlX’ (X’ = Ti and Sc) under different pressures P (in units of GPa). (ratio of APB/APB) and p-factors are also presented.
Table 2.
APB energies (in units of J/m) on {111} and {010} planes of NiX (X = Al, Ge, Si and Ga), AlX’ (X’ = Ti and Sc) under different pressures P (in units of GPa). (ratio of APB/APB) and p-factors are also presented.
| P | 0 | 20 | 40 | |
|---|---|---|---|---|
| NiAl | {111} | 0.344 | 0.406 | 0.459 |
| {010} | 0.117 | 0.173 | 0.205 | |
| 2.940 | 2.346 | 2.239 | ||
| p | 5.352 | 4.626 | 4.282 | |
| NiGe | {111} | 0.509 | 0.587 | 0.651 |
| {010} | 0.381 | 0.415 | 0.442 | |
| 1.336 | 1.414 | 1.473 | ||
| p | 1.950 | 2.163 | 2.331 | |
| NiSi | {111} | 0.455 | 0.515 | 0.565 |
| {010} | 0.395 | 0.453 | 0.506 | |
| 1.152 | 1.137 | 1.117 | ||
| p | 1.718 | 1.766 | 1.777 | |
| NiGa | {111} | 0.272 | 0.308 | 0.337 |
| {010} | 0.016 | 0.024 | 0.029 | |
| 17.000 | 12.833 | 11.621 | ||
| p | 31.396 | 24.485 | 22.320 | |
| AlTi | {111} | 0.258 | 0.643 | - |
| {010} | 0.094 | 0.173 | - | |
| 2.745 | 3.717 | - | ||
| p | 5.615 | 4.748 | - | |
| AlSc | {111} | 0.741 | 1.025 | - |
| {010} | 0.575 | 0.851 | - | |
| 1.289 | 1.204 | - | ||
| p | 1.280 | 1.394 | - |
Table 3.
Formation energies (in units of eV) of NiGe substituted with Fe on Ni sublattice and Sc, Al, Ga on the Ge sublattice. Energies of substituted NiSi and AlSc are presented, as well.
Table 3.
Formation energies (in units of eV) of NiGe substituted with Fe on Ni sublattice and Sc, Al, Ga on the Ge sublattice. Energies of substituted NiSi and AlSc are presented, as well.
| NiGe | Fe | Sc | Al | Ga |
| Ni | −36.21 | −32.22 | −32.89 | −32.25 |
| Ge | −34.69 | −33.02 | −33.52 | −33.01 |
| NiSi | Al | Ga | Ti | Sc |
| Ni | −53.90 | −53.23 | −53.58 | −52.64 |
| Si | −54.02 | −53.43 | −53.87 | −52.98 |
| AlSc | Ti | Y | Li | Zr |
| Al | −50.86 | −49.45 | −50.86 | −50.41 |
| Sc | −51.15 | −51.15 | −49.46 | −51.63 |
Table 4.
The APB energies (in units of J/m) of {111} and {010} planes in NiGe, NiSi and AlSc with different substitutional concentrations (0%, 6.25%, 12.5% and 25%). p-factors of atoms substituted in or both planes are also presented. Fe means that the Ni site is substituted by Fe, and so forth.
Table 4.
The APB energies (in units of J/m) of {111} and {010} planes in NiGe, NiSi and AlSc with different substitutional concentrations (0%, 6.25%, 12.5% and 25%). p-factors of atoms substituted in or both planes are also presented. Fe means that the Ni site is substituted by Fe, and so forth.
| APB | APB | ||||||||||||
|---|---|---|---|---|---|---|---|---|---|---|---|---|---|
| 0% | 6.25% | 12.5% | 25% | 0% | 6.25% | 12.5% | 25% | 0% | 6.25% | 12.5% | 25% | ||
| Fe | 0.691 | 0.665 | 0.643 | 0.621 | 0.515 | 0.434 | 0.412 | 0.478 | 1.955 | 2.235 | 2.278 | 1.895 | |
| Sc | 0.691 | 0.628 | 0.566 | 0.442 | 0.515 | 0.477 | 0.465 | 0.431 | 1.955 | 1.919 | 1.774 | 1.497 | |
| Al | 0.691 | 0.648 | 0.600 | 0.494 | 0.515 | 0.469 | 0.424 | 0.295 | 1.955 | 2.014 | 2.064 | 2.443 | |
| Ga | 0.691 | 0.655 | 0.613 | 0.519 | 0.515 | 0.467 | 0.417 | 0.277 | 1.955 | 2.044 | 2.143 | 2.732 | |
| NiSi | Al | 0.666 | 0.635 | 0.602 | 0.523 | 0.520 | 0.507 | 0.464 | 0.351 | 1.831 | 1.866 | 1.931 | 2.219 |
| Ga | 0.666 | 0.641 | 0.614 | 0.548 | 0.520 | 0.500 | 0.450 | 0.317 | 1.831 | 1.907 | 2.031 | 2.575 | |
| Ti | 0.666 | 0.631 | 0.609 | 0.577 | 0.520 | 0.506 | 0.505 | 0.480 | 1.831 | 1.855 | 1.796 | 1.792 | |
| Sc | 0.666 | 0.629 | 0.596 | 0.530 | 0.520 | 0.518 | 0.521 | 0.545 | 1.831 | 1.806 | 1.704 | 1.449 | |
| AlSc | Ti | 0.698 | 0.666 | 0.637 | 0.562 | 0.558 | 0.527 | 0.472 | 0.343 | 1.251 | 1.262 | 1.349 | 1.637 |
| Y | 0.698 | 0.738 | 0.775 | 0.697 | 0.558 | 0.600 | 0.630 | 0.696 | 1.251 | 1.229 | 1.228 | 1.001 | |
| Li | 0.698 | 0.669 | 0.630 | 0.558 | 0.558 | 0.568 | 0.582 | 0.604 | 1.251 | 1.177 | 1.083 | 0.924 | |
| Zr | 0.698 | 0.704 | 0.708 | 0.718 | 0.558 | 0.557 | 0.529 | 0.454 | 1.251 | 1.239 | 1.337 | 1.581 | |
Table 5.
p-factors for NiGe, NiSi and AlSc with atoms only substituted in the {111} or {010} planes.
Table 5.
p-factors for NiGe, NiSi and AlSc with atoms only substituted in the {111} or {010} planes.
| Materials | Substitutions | |||||||
|---|---|---|---|---|---|---|---|---|
| 0 | 6.25% | 12.5% | 25% | 6.25% | 12.5% | 25% | ||
| NiGe | 1.955 | 1.883 | 1.820 | 1.758 | 2.320 | 2.447 | 2.108 | |
| Sc | 1.955 | 1.789 | 1.609 | 1.253 | 2.110 | 2.168 | 2.337 | |
| Al | 1.955 | 1.845 | 1.708 | 1.399 | 2.147 | 2.376 | 3.415 | |
| Ga | 1.955 | 1.865 | 1.743 | 1.470 | 2.155 | 2.419 | 3.635 | |
| NiSi | Al | 1.831 | 1.746 | 1.657 | 1.499 | 1.951 | 2.139 | 2.826 |
| Ga | 1.831 | 1.763 | 1.670 | 1.569 | 1.975 | 2.207 | 3.133 | |
| Ti | 1.831 | 1.736 | 1.677 | 1.654 | 1.952 | 1.966 | 2.068 | |
| Sc | 1.831 | 1.729 | 1.641 | 1.518 | 1.907 | 1.907 | 1.822 | |
| AlSc | Ti | 1.251 | 1.175 | 1.134 | 1.007 | 1.327 | 1.487 | 2.035 |
| Y | 1.251 | 1.304 | 1.379 | 1.250 | 1.166 | 1.113 | 1.002 | |
| Li | 1.251 | 1.182 | 1.122 | 1.001 | 1.232 | 1.206 | 1.155 | |
| Zr | 1.251 | 1.244 | 1.261 | 1.288 | 1.257 | 1.325 | 1.536 | |
© 2018 by the authors. Licensee MDPI, Basel, Switzerland. This article is an open access article distributed under the terms and conditions of the Creative Commons Attribution (CC BY) license (http://creativecommons.org/licenses/by/4.0/).
Share and Cite
MDPI and ACS Style
Gao, X.; Wang, J.; Wu, X.; Wang, R.; Jia, Z. Effects of Alloying Atoms on Antiphase Boundary Energy and Yield Stress Anomaly of L12 Intermetallics: First-Principles Study. Crystals 2018, 8, 96. https://doi.org/10.3390/cryst8020096
AMA Style
Gao X, Wang J, Wu X, Wang R, Jia Z. Effects of Alloying Atoms on Antiphase Boundary Energy and Yield Stress Anomaly of L12 Intermetallics: First-Principles Study. Crystals. 2018; 8(2):96. https://doi.org/10.3390/cryst8020096
Chicago/Turabian StyleGao, Xiaojun, Jianwei Wang, Xiaozhi Wu, Rui Wang, and Zhihong Jia. 2018. "Effects of Alloying Atoms on Antiphase Boundary Energy and Yield Stress Anomaly of L12 Intermetallics: First-Principles Study" Crystals 8, no. 2: 96. https://doi.org/10.3390/cryst8020096
Note that from the first issue of 2016, this journal uses article numbers instead of page numbers. See further details here.