Article

Theoretical and Experimental Investigations into Novel Oxynitride Discovery in the GaN-TiO2 System at High Pressure

1
Department of Chemistry, State University of New York, Stony Brook, NY 11794, USA
2
Department of Geosciences, State University of New York, Stony Brook, NY 11794, USA
3
Center for Materials by Design, Institute for Advanced Computational Science, State University of New York, Stony Brook, NY 11794, USA
4
Mineral Physics Institute, Stony Brook University, Stony Brook, New York 11794, USA
5
Skolkovo Institute of Science and Technology, Skolkovo Innovation Center, 3 Nobel Street, Moscow 143026, Russia
6
Department of Problems of Physics and Energetics, Moscow Institute of Physics and Technology, 9 Institutskiy Lane, Dolgoprudny City, Moscow 141700, Russia
7
International Center for Materials Design, Northwestern Polytechnical University, Xi’an 710072, China
*
Authors to whom correspondence should be addressed.
Crystals 2018, 8(2), 15; https://doi.org/10.3390/cryst8020015
Submission received: 31 December 2017 / Revised: 19 January 2018 / Accepted: 19 January 2018 / Published: 23 January 2018
(This article belongs to the Special Issue Non-Ambient Crystallography)

Abstract

:
We employed ab initio evolutionary algorithm USPEX to speed up the discovery of a novel oxynitride in the binary system of GaN-TiO2 using high-pressure synthesis. A 1:2 mixture of GaN and nanocrystalline TiO2 (anatase) was reacted under 1 GPa of pressure and at 1200 °C in a piston cylinder apparatus to produce a mixture of TiO2 (rutile) and an unknown phase. From the initial analysis of high resolution neutron and X-ray diffraction data, it is isomorphic with monoclinic V2GaO5 with a unit cell composition of Ga10Ti8O28N2 with the following parameters: monoclinic, space group C2/m, a = 17.823(1) Å, b = 2.9970(1) Å, c = 9.4205(5) Å, β = 98.446(3)°; Volume = 497.74(3) Å3. Further, a joint rietveld refinement revealed two distinct regimes—A Ti-rich block and a Ga-rich block. The Ti-rich block consists of four edge-shared octahedra and contains a site which is about 60% occupied by N; this site is bonded to four Ti. The remainder of the block consists of edge linked Ti-octahedral chains linked to the TiN/TiO fragments at octahedral corners partially occupied by nitrogen. The Ga-block contains two symmetry independent octahedral sites, occupied mostly by Ga, and a pure Ga-centered tetrahedral site bonded mostly to oxygen.

1. Introduction

The search for alternatives to fossil fuels is driven by increasing energy demands, and the desirability of limiting growth in CO2 in the atmosphere, while retaining the advantages of fuel transportability. In this regard, visible light [1] driven photocatalysis for overall water splitting (OWS) might produce chemical fuels, such as hydrogen, which would address these criteria [2,3].
Traditional OWS photocatalysts, such as titanium dioxide (rutile) are inorganic oxides with large bandgaps and activity only under ultraviolet light. Rutile is a photosensitizer capable of oxidized organic dyes [4], and it was identified as a photocatalyst in 1956 by Mashio et al. [4]. Water splitting was observed with TiO2 a photo-anode and platinum cathode and an external bias in the pioneering work of Honda and Fujishima et al. [5,6]. Other oxides identified as capable of OWS include SrTiO3 perovskite and K2La2Ti3O10, a Ruddlesden–Popper phase [7].
Oxynitrides and solid solutions containing nitrogen absorb the majority of solar spectrum [8,9,10,11] compared to the traditional inorganic oxide photocatalysts due to their higher N2p valence states and smaller bandgaps. For example, LaTiO2N, produced by the ammonolysis of La2Ti2O7, absorbs visible light [12,13]. Attempts to introduce nitrogen into Ti based photocatalysts had varied success. Bimetallic oxynitride perovskites, which contain titanium, are common [10,14] while pure titanium oxynitride compounds exist rarely; sometimes as thin films [15,16].
An important recent discovery was a GaN rich solid solution (GaN)x(ZnO)1−x, reported by Domen et al. [8,17]. Members of the solid solution have bandgaps smaller than the GaN and ZnO endmembers. In addition, they achieved overall water splitting at relatively high efficiency of up to 6%. Inspired by these results, we synthesized the complete solid solution (GaN)x(ZnO)1−x under pressure and demonstrated hydrogen evolution from water without the use of cocatalysts and sacrificial reagents [18]. Further, we investigated the possibility of other oxynitride solid solutions that might go beyond currently available efficiencies. We selected GaN-TiO2, cognizant of arguments that d0 and d10 oxynitrides are likely to lead to OWS catalysts [8]. While it is desirable to produce an OWS catalyst at near ambient pressure, our previous high pressure work suggested high pressure synthesis allows for better control over stoichiometry, which is not always available from ammonolysis. Further, recent computational search based on published databases [19] suggests that many novel oxynitrides have high instability indices at ambient pressure, and that high pressure followed by quench recovery may be required for their synthesis. High pressure experiments are difficult, requiring multiple runs for their optimization, and our previous work on Nb2O5–GaN system [20] used crystal structure prediction methods and in situ high resolution X-ray scattering to mitigate this disadvantage. Here, using state of the art evolutionary algorithm USPEX along with density functional theory calculations, we studied the pressure-driven stability of GaN-TiO2 system to better understand and evaluate the structures and stability fields of possible Ga-Ti-oxynitride compounds with chemical composition chosen from a mix of GaN and TiO2 endmembers.

2. Results

2.1. Theoretical Predictions Using USPEX

We constructed the convex hull, which connects the phases that are stable against decomposition into elements or binaries at a given pressure. The convex hulls were obtained from the enthalpies of the most stable structures of compounds at a given pressure. The enthalpy of formation of the lowest enthalpy Ga-Ti-oxynitrides at 0, 5, 10 and 20 GPa are given in Table 1, which simply shows a tendency for structures with 1:1 and 1:2 ratios of GaN:TiO2 to move to lower formation enthalpy with increasing pressure. This trend suggests their potential stability with increasing pressure.
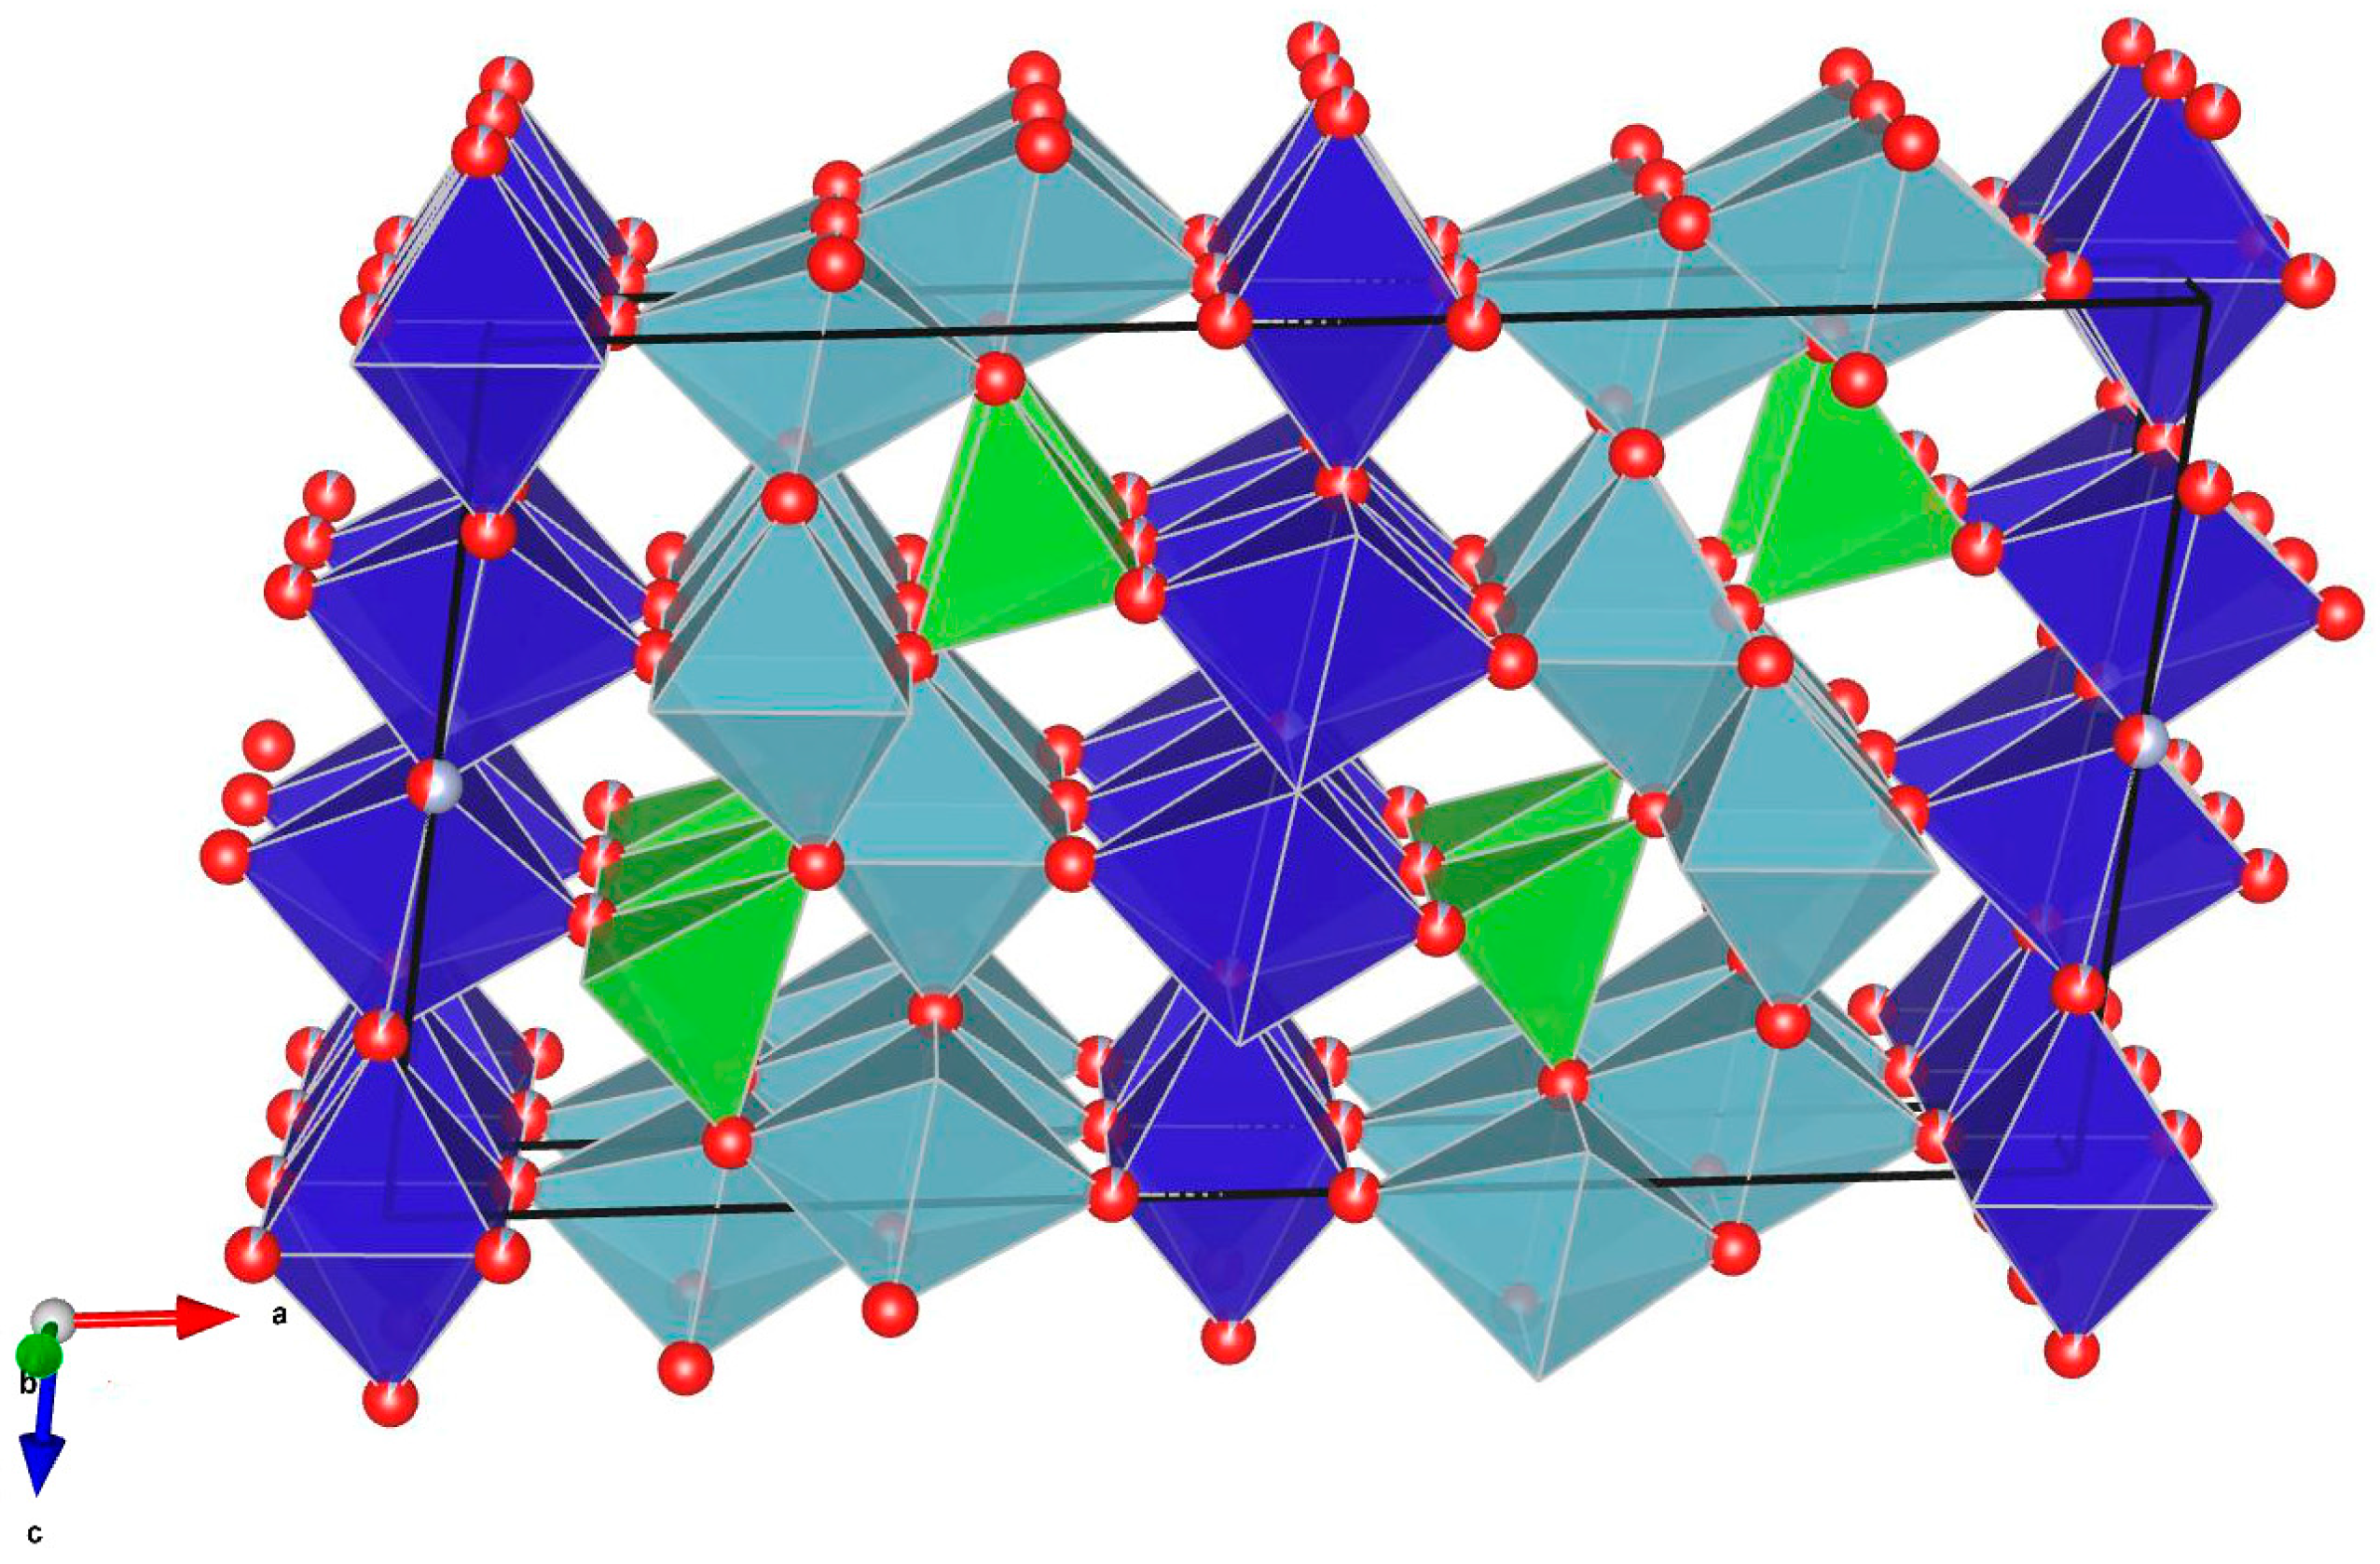
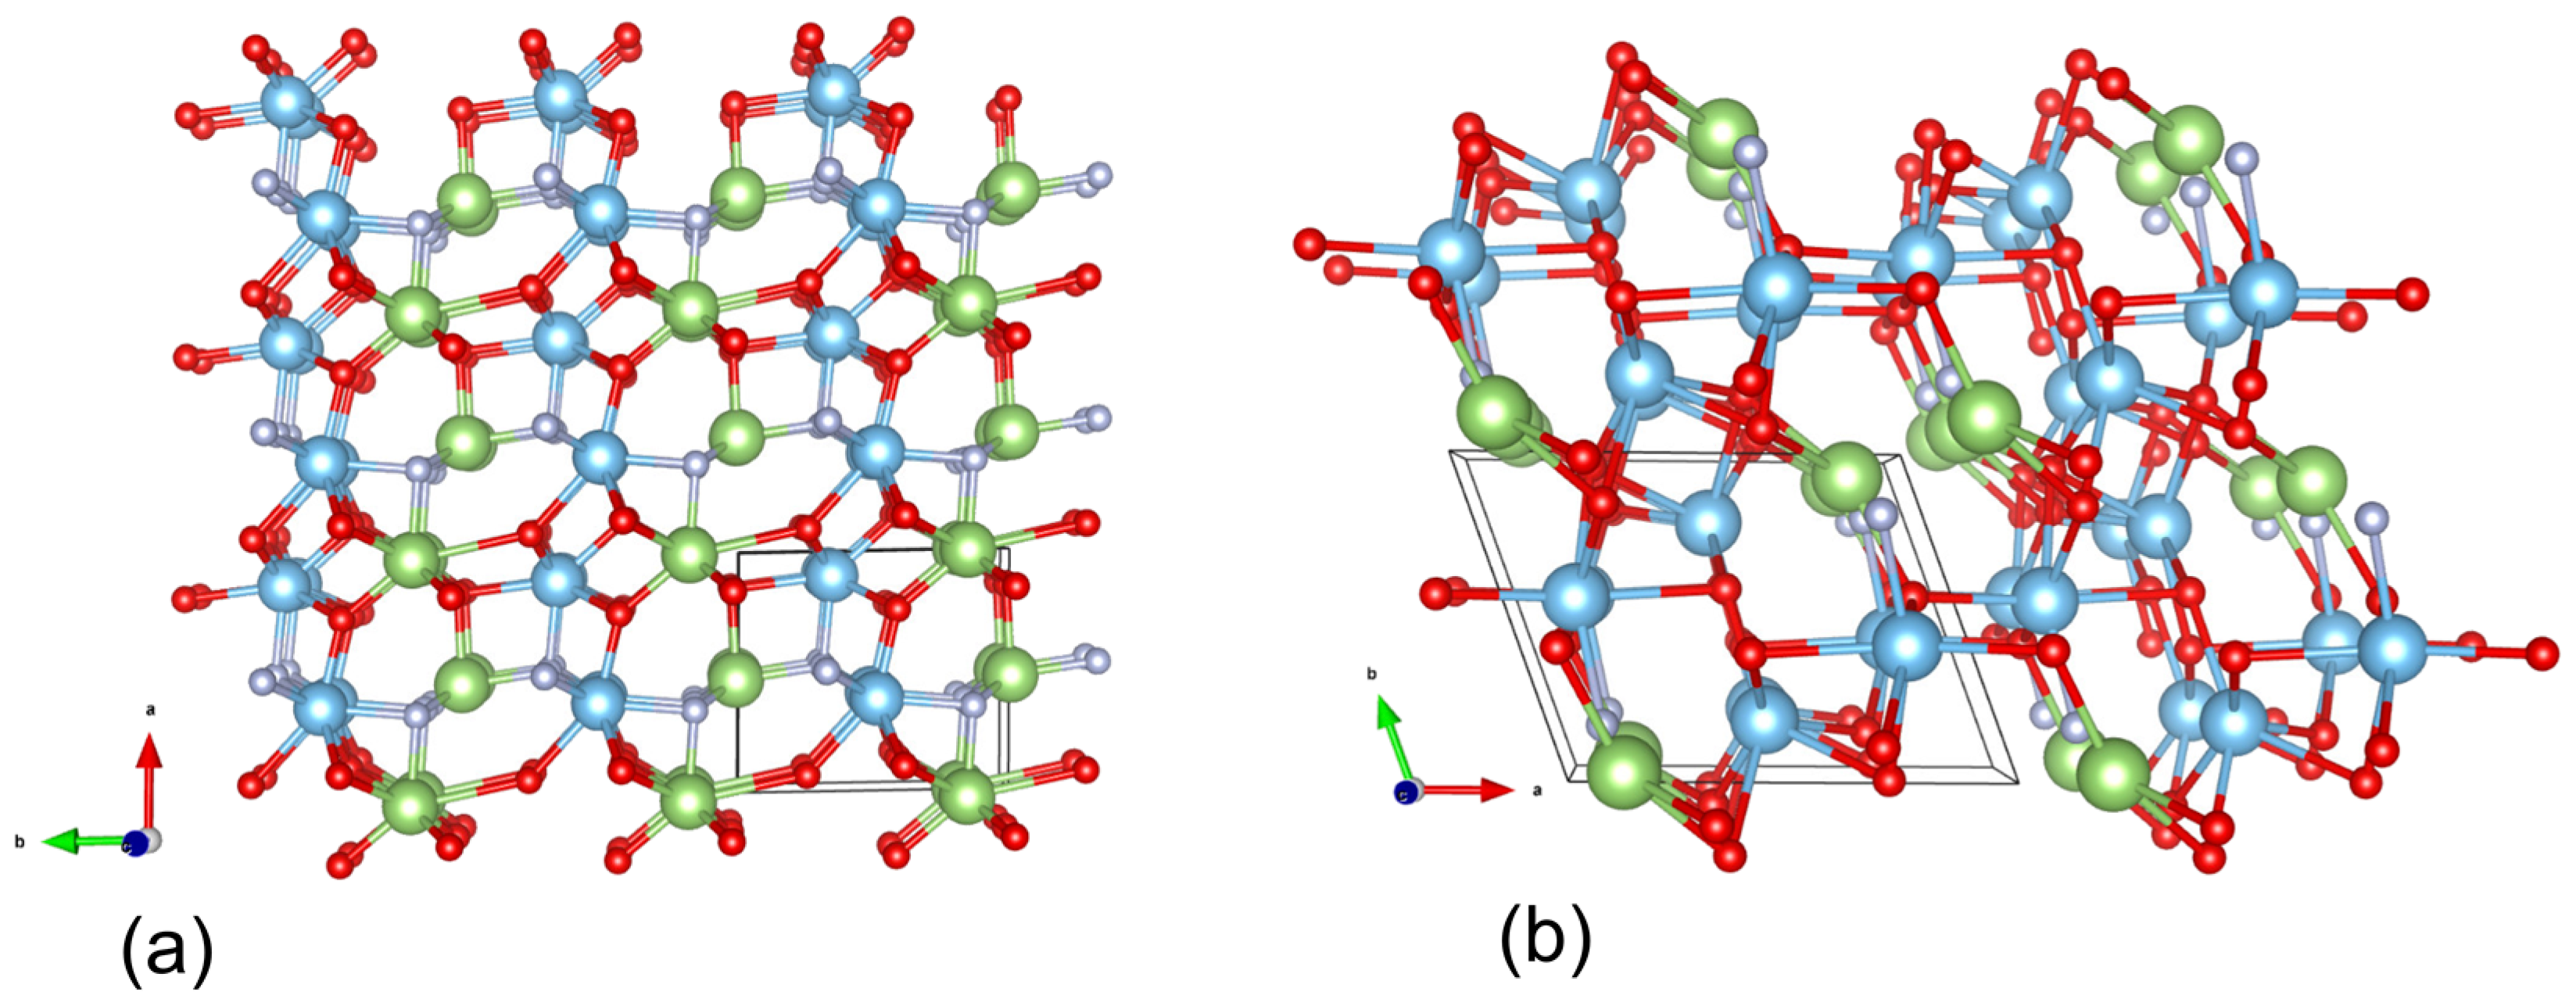
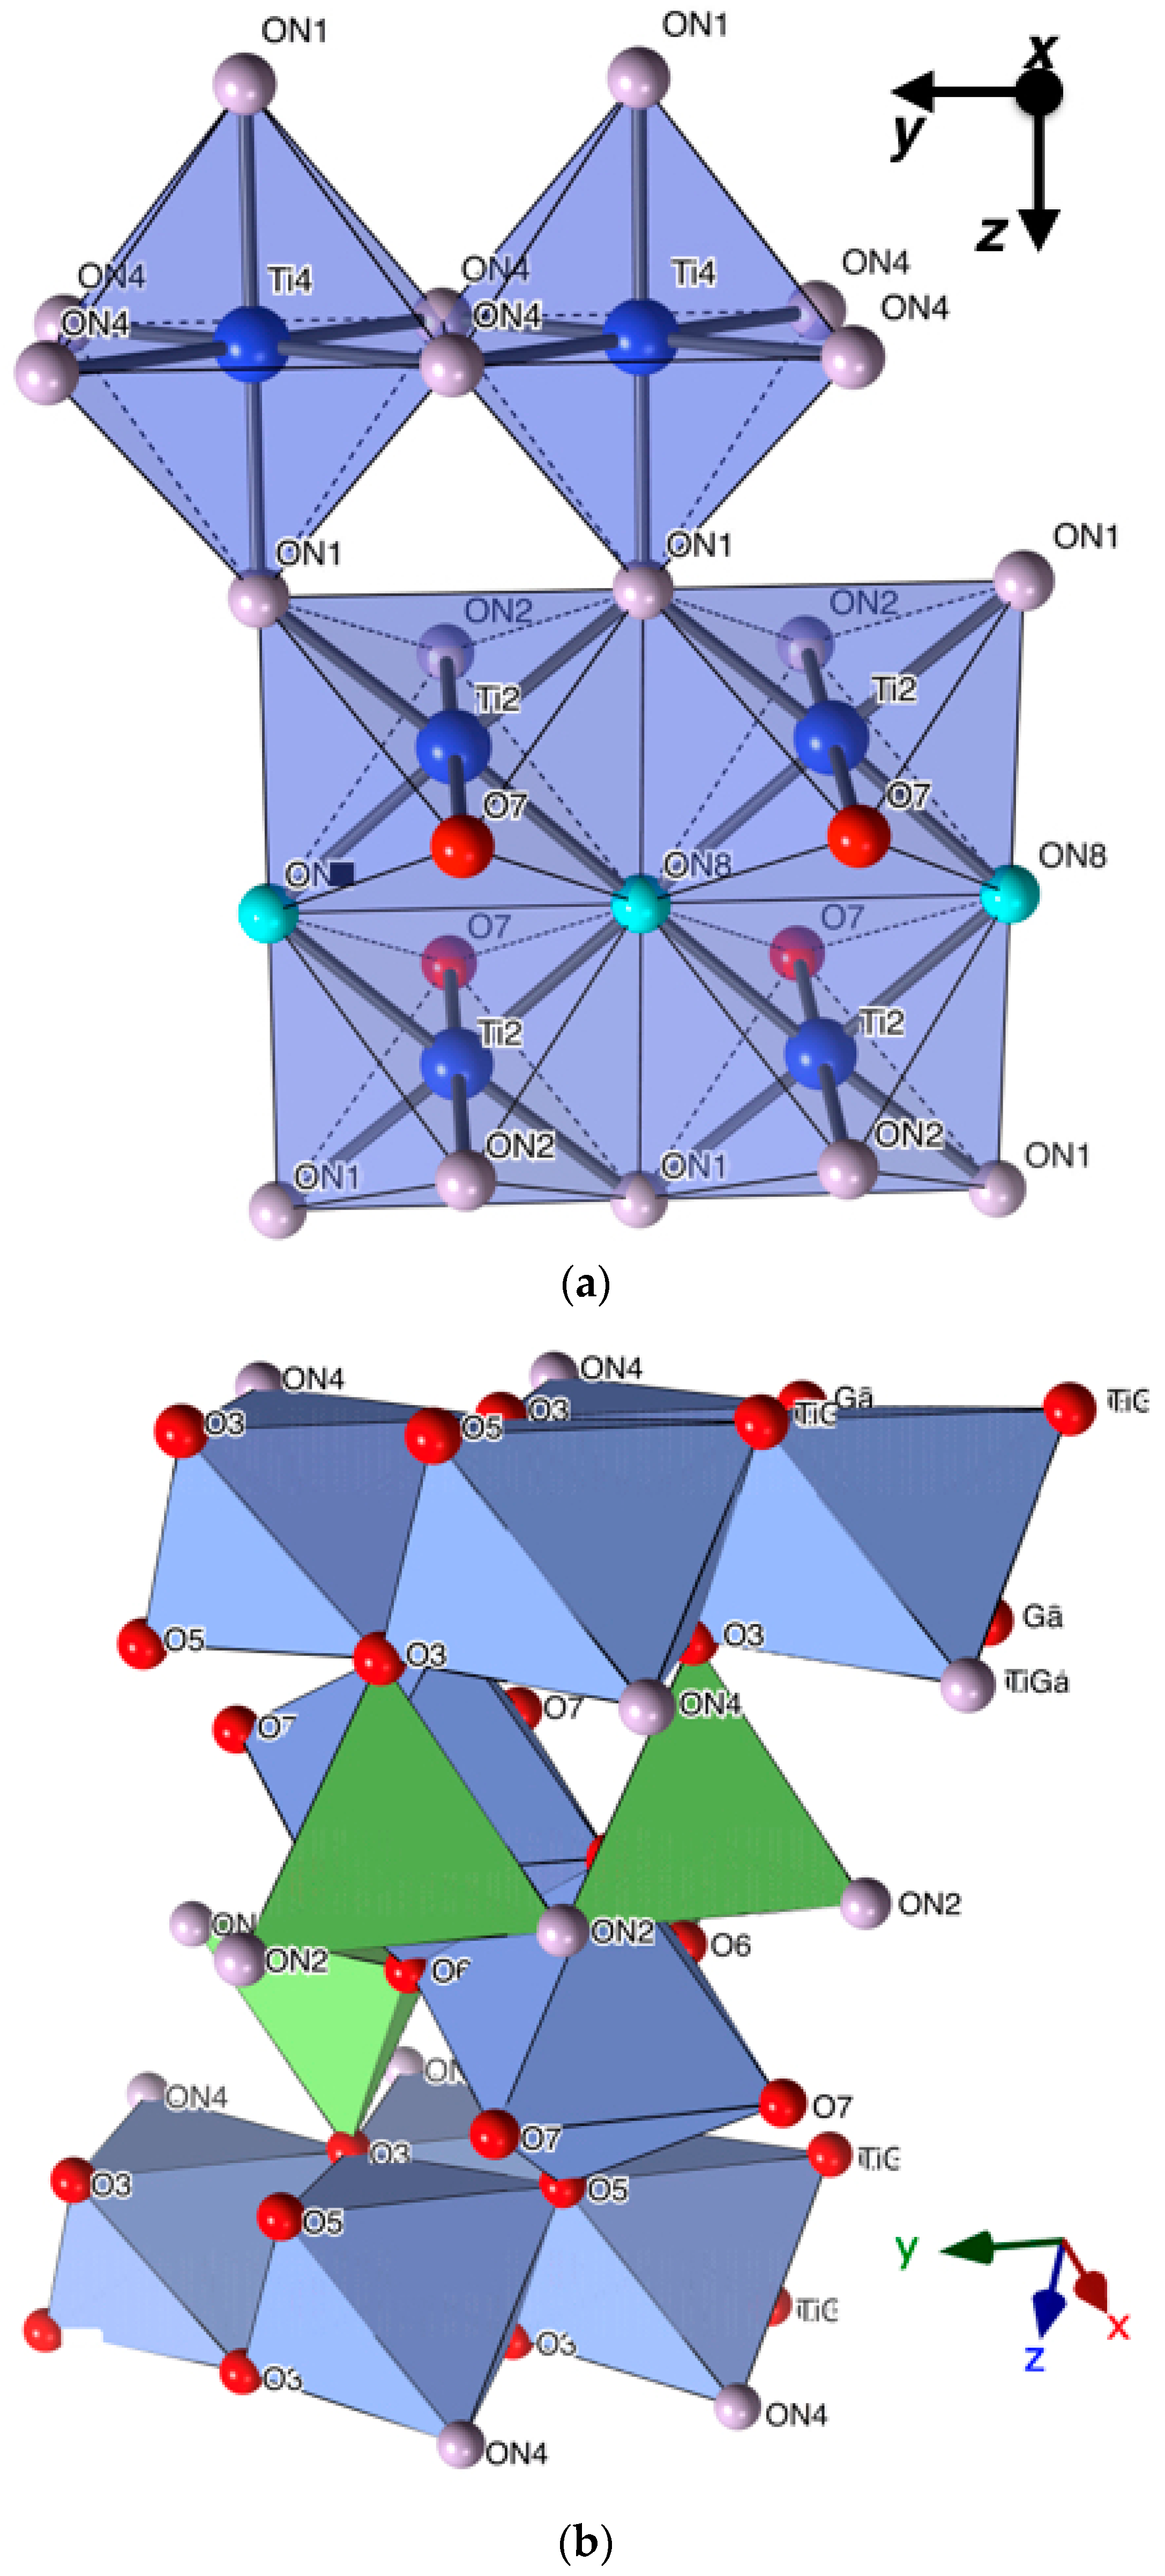
The structures of the predicted ordered GaTiO2N and GaTi2O4N phases are illustrated in Figure 1 and the Crystallographic Information Files (CIF) are described in the appendix (Table A2). Although not all structural aspects of these ordered phases did match with the disordered experimental phase described in Section 2.2, ab initio calculations at 0 K provided a useful guide to target compositions that are within thermodynamically synthesizable range.
Analysis of X-ray and neutron scattering data suggests that the experimentally synthesized new phase has the composition of Ga10Ti8O28N2. After obtaining this result, we performed phase stability calculations for Ga10Ti8O28N2 against the decomposition to oxynitrides and oxide endmembers i.e., Ti3O3N2 and Ga2TiO5, however, the decomposition reaction energies indicate that Ga10Ti8O28N2 is an entropy-stabilized oxynitride. The decomposition reaction energies are obtained as follow: 15 meV/atom at 10 GPa and 4 meV/atom at 20 GPa, which indicates its stability with increasing pressure.
Entropy can have a significant impact on free energy calculations of disordered structures; however, incorporating entropy is computationally expensive. Entropy is a sum of the electronic entropy (Sel), configurational entropy (Sconf) and vibrational entropy [21]. The electronic entropy Sel is easy to calculate, but does not have a significant effect on the free energy. On the other hand, vibrational Svib and configurational Sconf entropies are very expensive and can have significant effect on free energy. The configurational entropies are calculated based on Boltzmann’s formula which relates entropy values to the number of the accessible arrangement of atoms in the lattice [22].
S c o n f = k ln g ( σ ) ,
where k is the Boltzmann constant and g ( σ ) is the number of all possible configurations. The general formula for the configurational entropy can be obtained from:
S c o n f = k   ( P j l n P j   + ( 1 P j ) l n ( 1 P j ) ) ,
where Pj is the probability of a certain configuration j. Configurational entropies are calculated based on the above formula and the stabilizing temperatures are calculated from:
T   = H o r d e r e d d i s o r d e r e d S
where H o r d e r e d d i s o r d e r e d is the difference between enthalpies of ordered and disordered structures and S = S c o n f . Configurational entropies and required temperatures for stabilizing GaTiO2N, GaTi2O4N and Ga10Ti8O28N2 are listed in Table 2. The experimentally-observed mixed tetrahedral and octahedral coordination of Ga is accurately predicted with USPEX; however, Ti is predicted to exist in a mixture of octahedral and heptahedral coordination while experiments only observe octahedral Ti. In addition, bond valences are calculated according to S i = Σ j   exp [ ( R 0 R ij ) / B ] , where B is 0.37 and R 0 is obtained from published tables [23]. Bond valences for Ga and Ti of the predicted structures are consistent with the experimental phase.
Theoretical and experimental structural studies revealed that the synthesized phase has positional disorder among both the cations and the anions sites. Since oxygen and nitrogen have similar ionic size, electronegativities and coordination number, these anions are usually disordered across anion sites [9], and hence makes it a real challenge for crystal structure prediction methods. Partial ordering have been observed in some oxynitrides [24,25,26], however, ideally ordered oxynitrides are scarce between known oxynitrides e.g., TaON and Si2N2O [27,28]. While incorporating disorder is not practical with crystal structure prediction methods at the current stage of development, the predicted structures give insights into the chemistry of the system, may guide experimental efforts, and contain structural features, such as the separation of Ti and Ga into different structural blocks, which is confirmed in the experimental analysis. In addition, the average bond lengths of the predicted phases, (Figure 1 & Table A3) are in a good agreement with the experimental data.

2.2. Crystallographic Characterization

In anticipation of the inability of X-rays to distinguish between O and N in the anion sites, and because of the favorable scattering contrast between Ga and Ti, bN = 7.29 fm and −3.44 fm, respectively, initially only neutron diffraction data, collected on the POWGEN instrument at the Spallation Neutron Source at Oak Ridge National Laboratory, TN, were utilized. Unit cell indexing and structure solution identified the new phase designated presumptively as “Ga-Ti-O-N”, is isomorphic with monoclinic V2GaO5, C2/m, Z = 6, a = 17.758(5) Å, b = 2.990(1) Å, c = 9.323(3) Å and β = 98.44(2)° [30]. From the crystal structure of V2GaO5 we can construct a solid solution that accounts for the coupled substitution of Ti/N into the full unit cell contents (Z = 6) of V12Ga6O30. The oxide and oxynitride endmembers of this solid solution would then be Ga12Ti6O30 and Ti18O18N12, respectively. More generally, the solid solution is formulated as Ti6+xGa12−xO30−xNx; empirical formula Ti1+xGa2−xO5−xNx. This formulation provided chemical constraints utilized in the latter stages of structure refinement.
An X-ray diffraction pattern was collected on the high resolution powder [31,32] instrument at beamline 11-BM at the Advanced Photon Source, IL, by taking advantage of the mail-in service at this facility [33]. The X-ray data provides an independent means of determining the Ga/Ti content; this is particularly important since the presumed unknown phase designated isomorphous to V2GaO5 phase is nonstoichiometric [30]. Any sample related variables, such as residual strain, can also be best determined from the high angular resolution X-ray data. Further, the small size of the sample, its multiphase nature, and the relative complexity of the Ga-Ti-O-N phase, is well matched to the high angular resolution at the 11-BM instrument. The initial X-ray refinements were constrained by assuming a pure oxide composition, Ga and Ti distributed randomly over all cation sites consistent with the presumed chemistry derived from V2GaO5, that is Ga2TiO5, and with displacement parameters for all atoms fixed to a common value (Uiso = 0.01Å2). The peak width parameters were fixed to values determined from a LaB
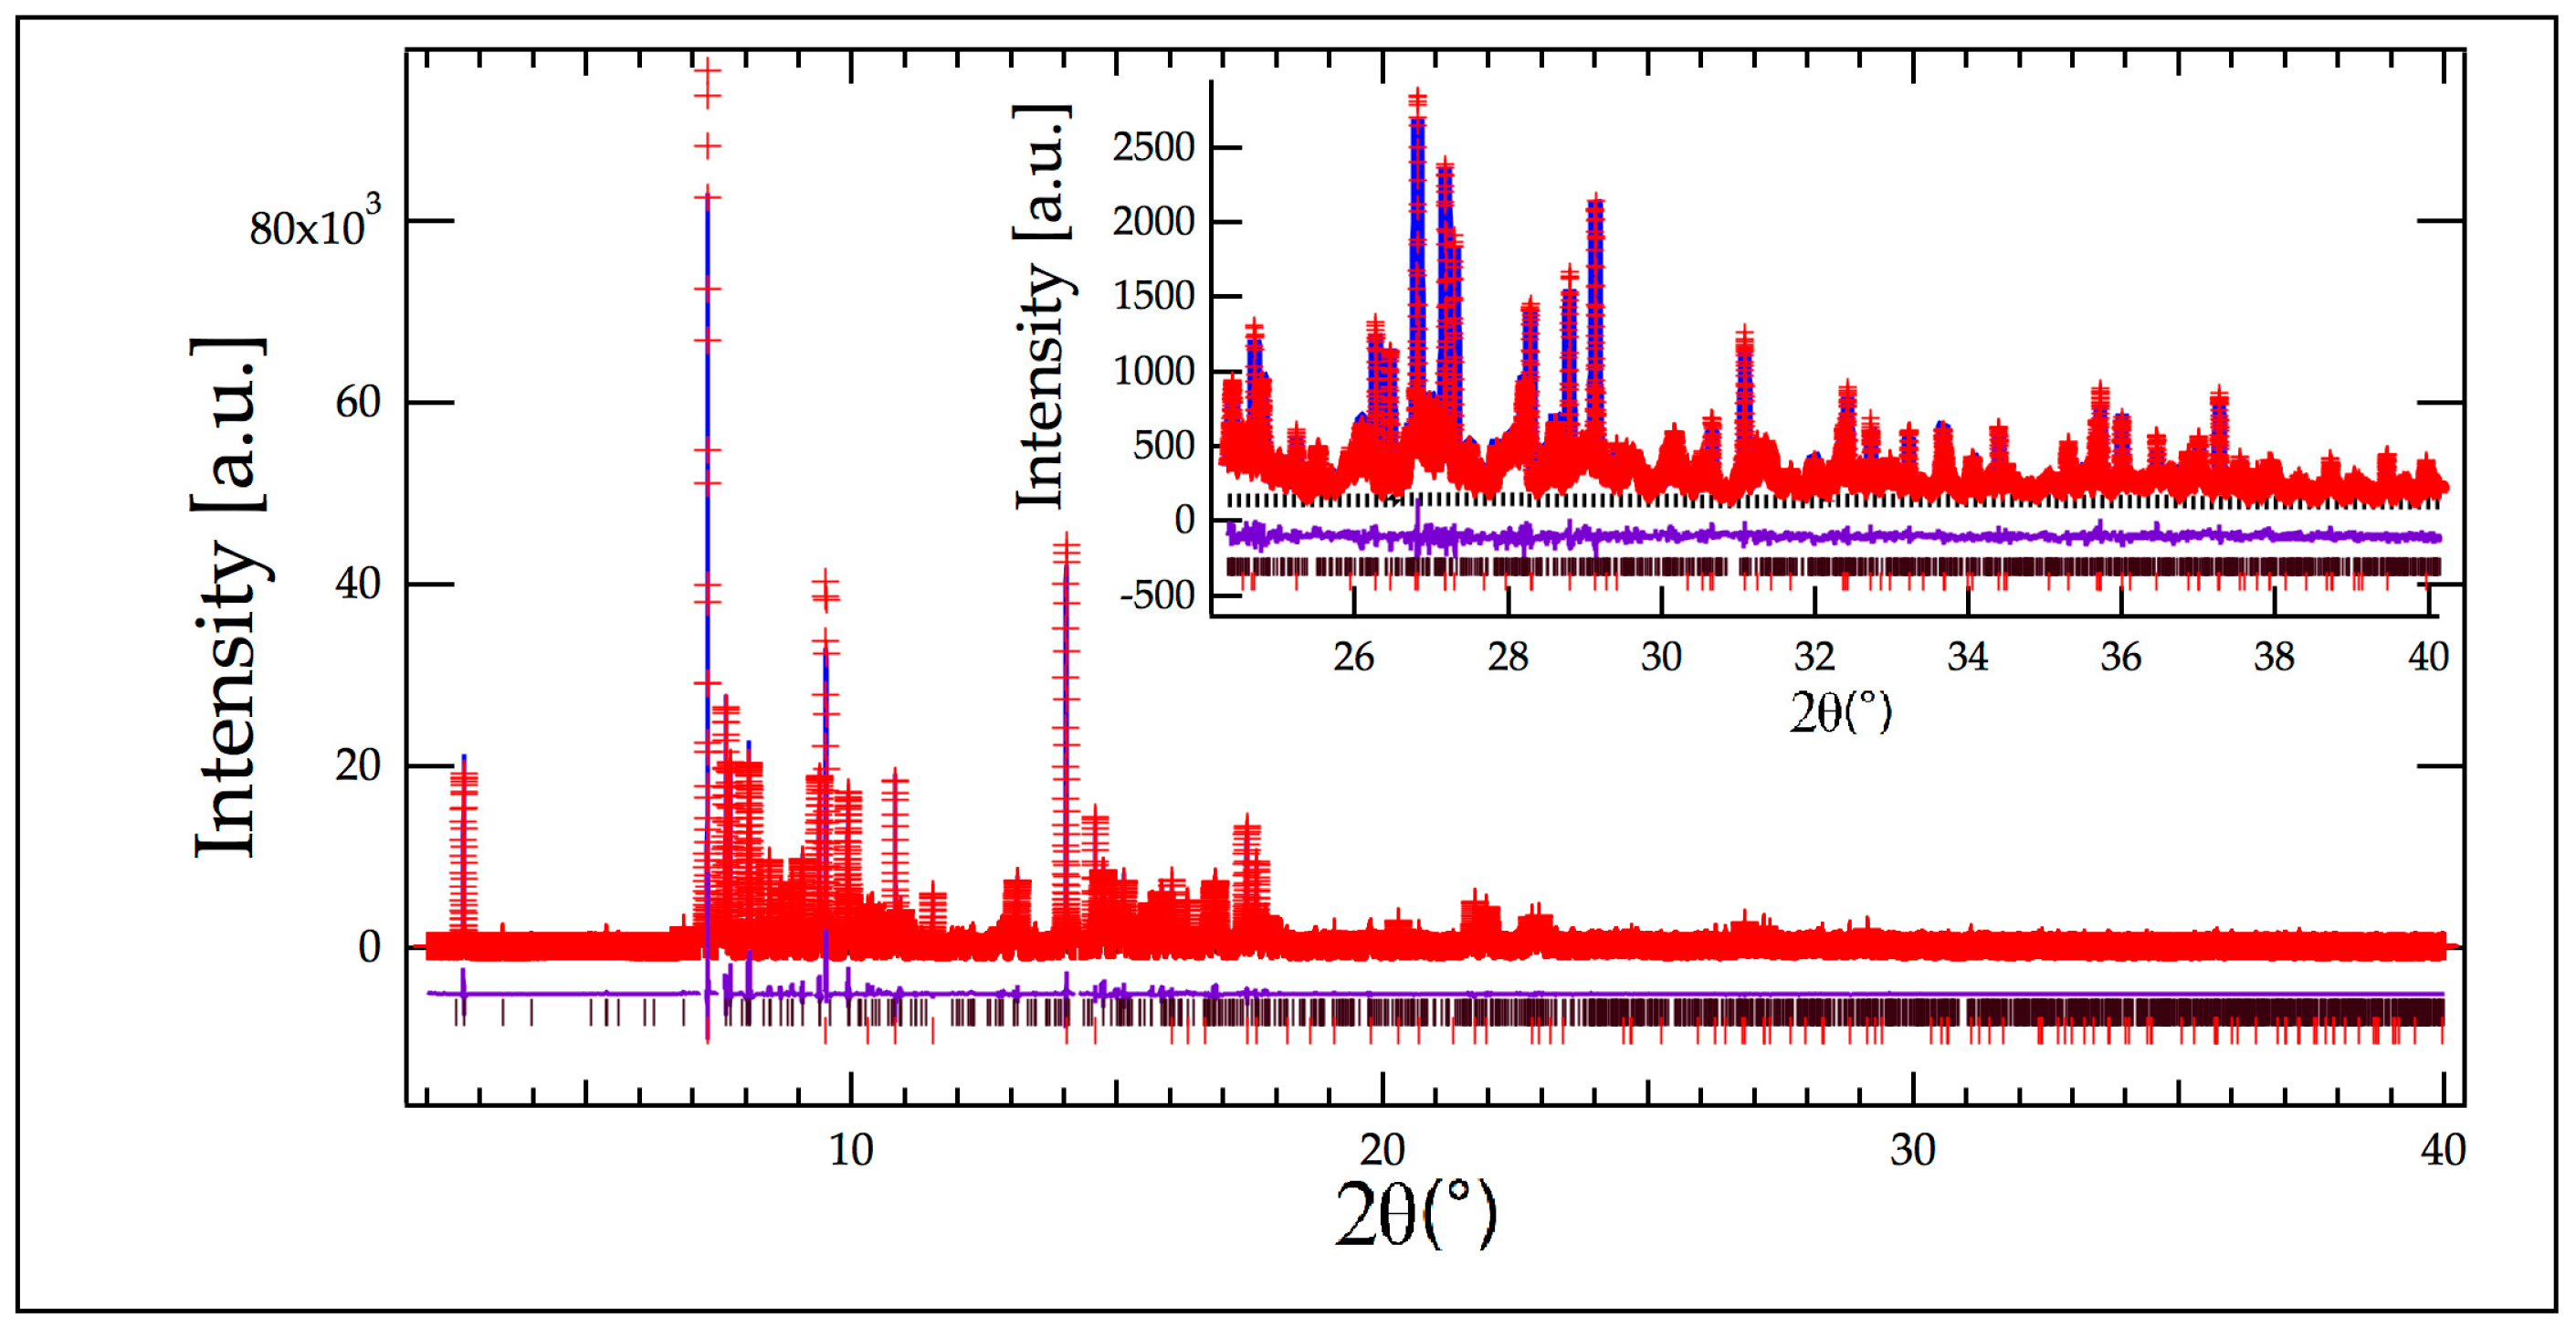
6 standard, which also provided the X-ray wavelength, 0.412447(5) Å. The sample on which X-ray data were collected was identical to the one used for neutron-data collection. Because of the superior counting statistics (Figure 2 and 
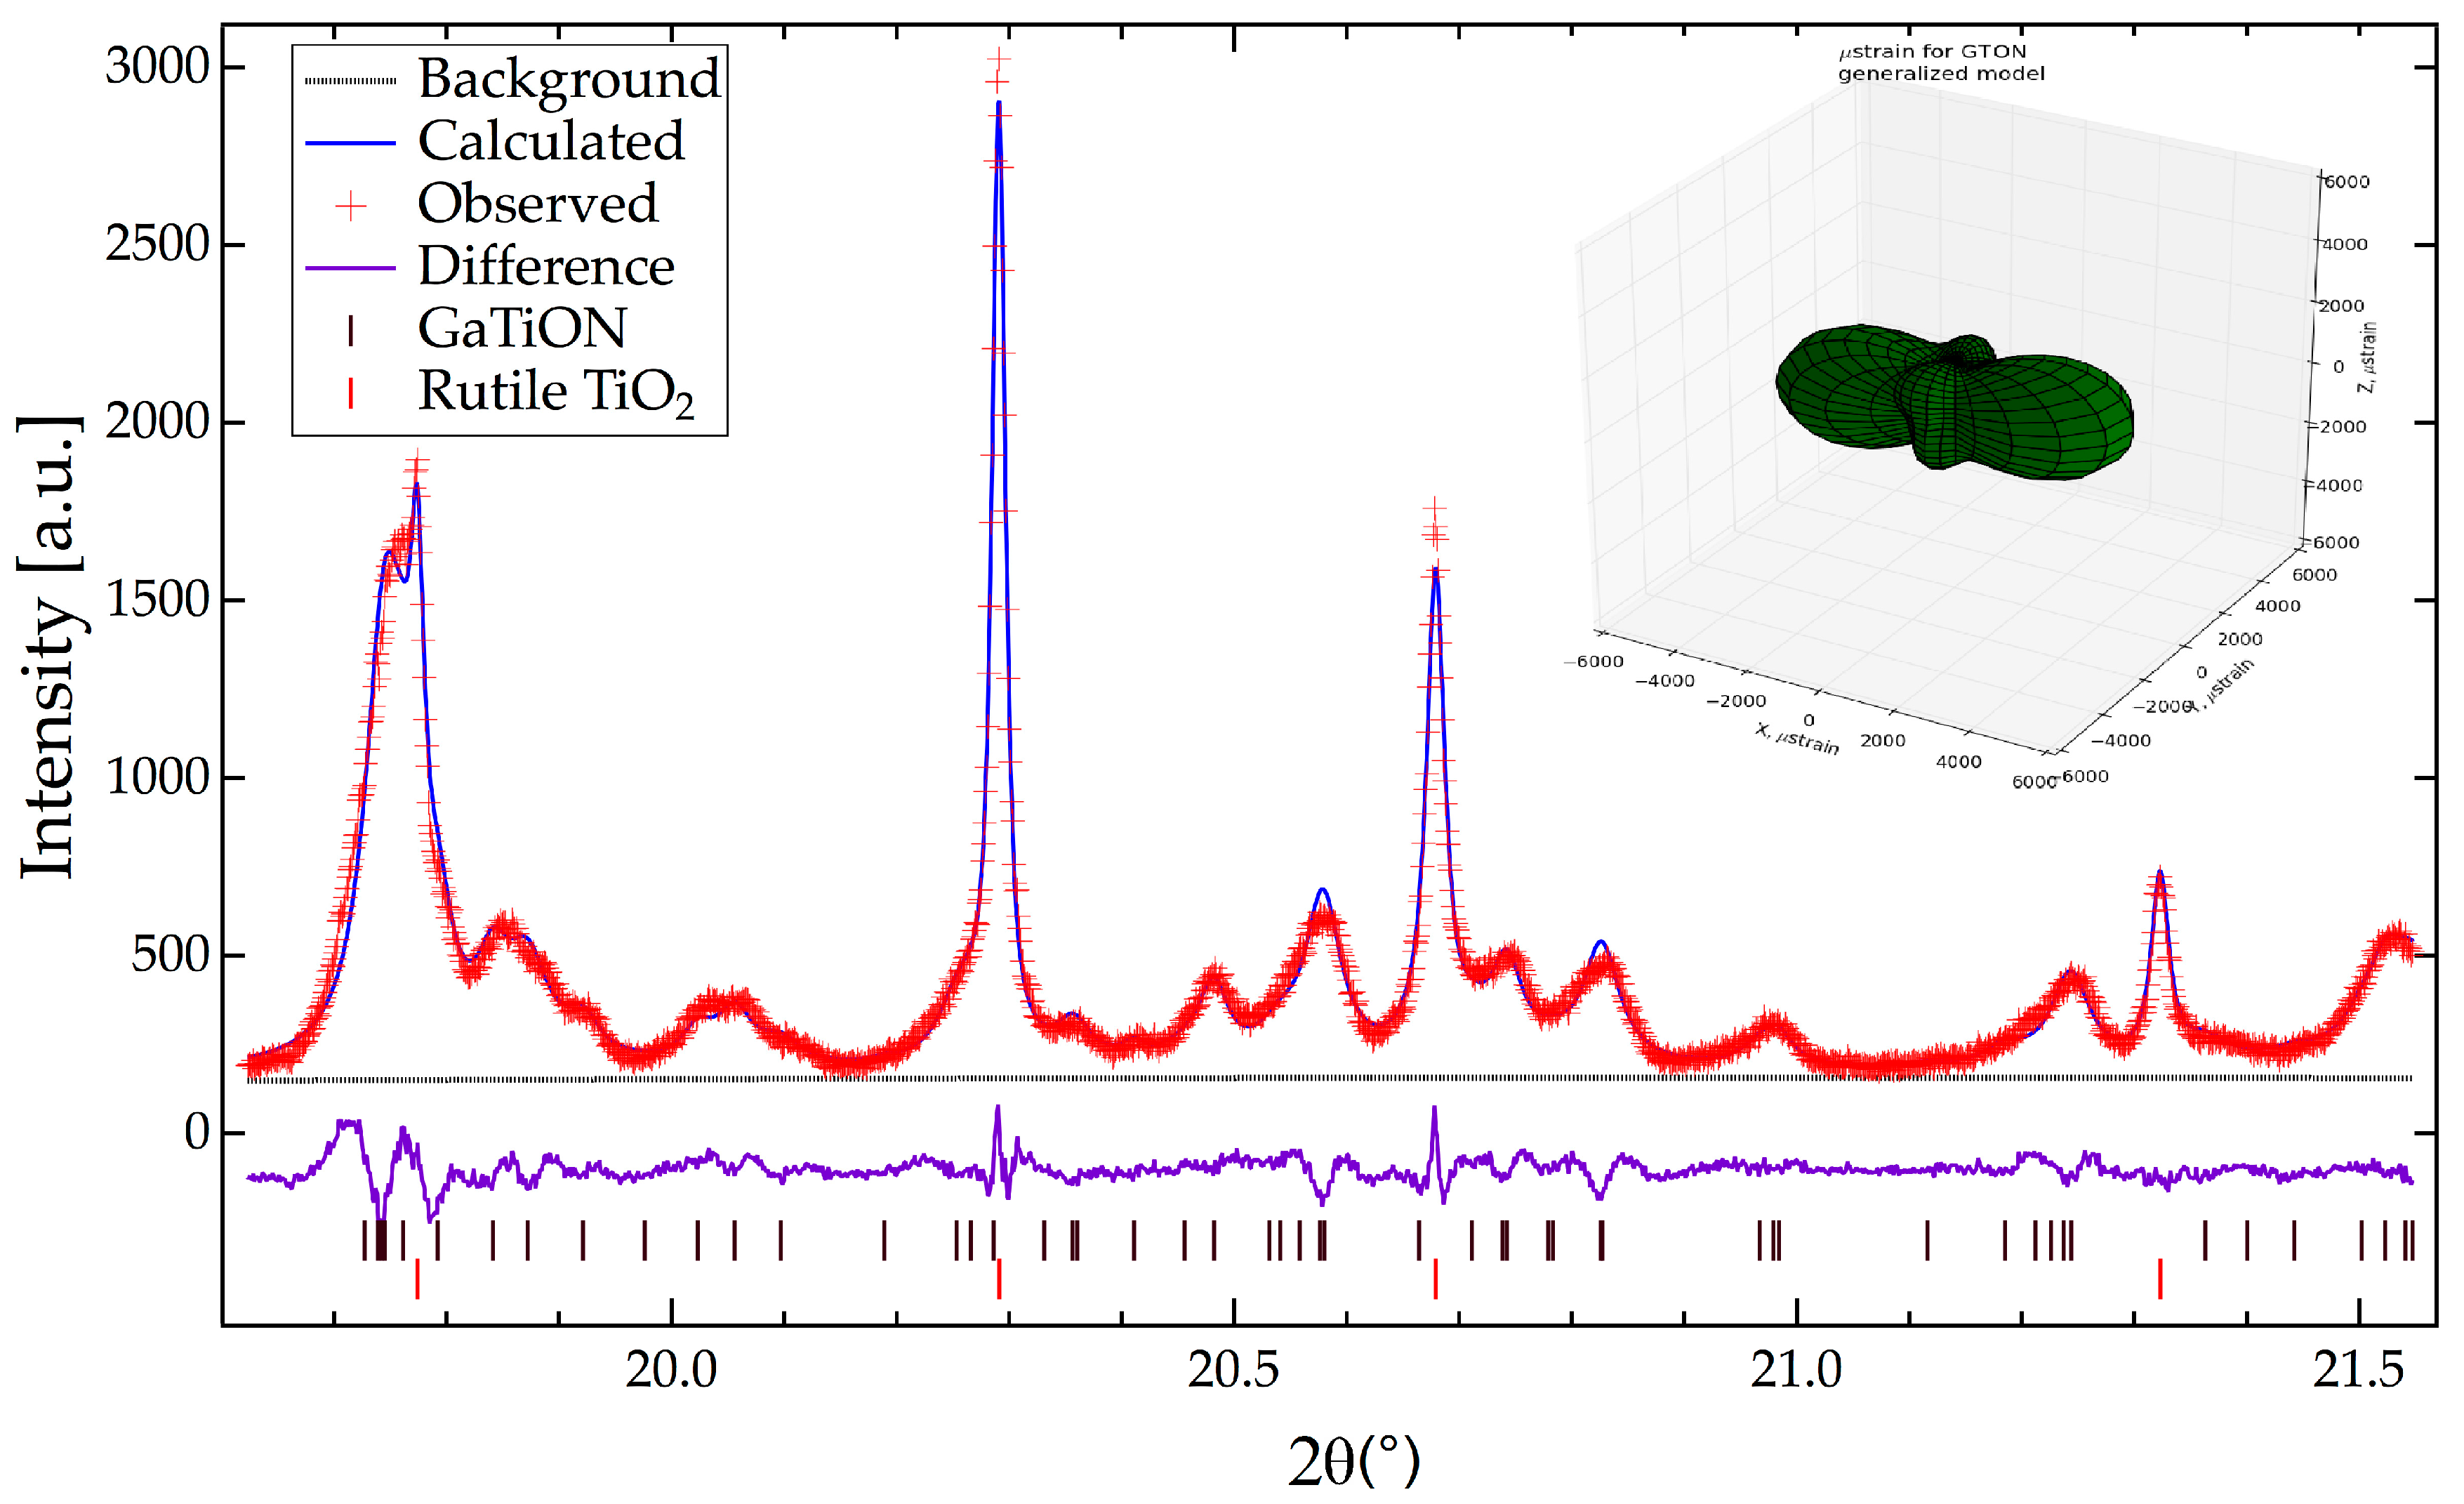
Figure 3) a small amount of an unidentified phase was obvious in the XRD pattern. The largest peaks from this phase were around 7.2, 7.5, 9.3, and 14.2° in 2θ and the most intense peak of the unindexed phase match that of rutile and Ga-Ti-O-N phases; the amounts were estimated to be 1% and 2% of those phases, respectively. Those regions containing peaks from the unidentified phase were excluded from refinements utilizing the X-ray data. These peaks were not observed in the neutron data, probably because of insufficient peak-to-background discrimination.
Refinement began with background parameters (cosine series, 12 parameters) and scale factor. Following convergence, cell parameters for both rutile and Ga-Ti-O-N phases were added to the refinement. The differences between observed and calculated patterns was dominated by anisotropic broadening of the Ga-Ti-O-N phase. Refinement of a generalized anisotropic broadening model [34,35] for Ga-Ti-O-N, improved the fit considerably as shown in Figure 2, which is a smaller region of the fit.
The question of stoichiometry was addressed by refining positional parameters, followed by refinement of all metal site occupancies with fixed displacement parameters for all atoms (Uiso = 0.005 Å2), the total occupancy of anion sites fixed to one oxygen, and metal sites constrained to be fully occupied. These assumptions were tested further in joint X-ray-neutron refinements discussed below. At this stage, refinement using just the X-ray data suggested some cation sites were partially disordered but that all were preferred by either Ga or Ti, or indeed were fully occupied by one or other of these metals. For example, the tetrahedral site (Figure 3) is occupied exclusively by Ga, while the block of sites at x = 0 and x = ½ are essentially pure Ti, with about 20% Ga-substitution in the remaining TiGa sites (Figure 3). The refined Ga/Ti ratio was approximately 1.25, which would correspond to a unit cell composition of Ga10Ti8O28N2.
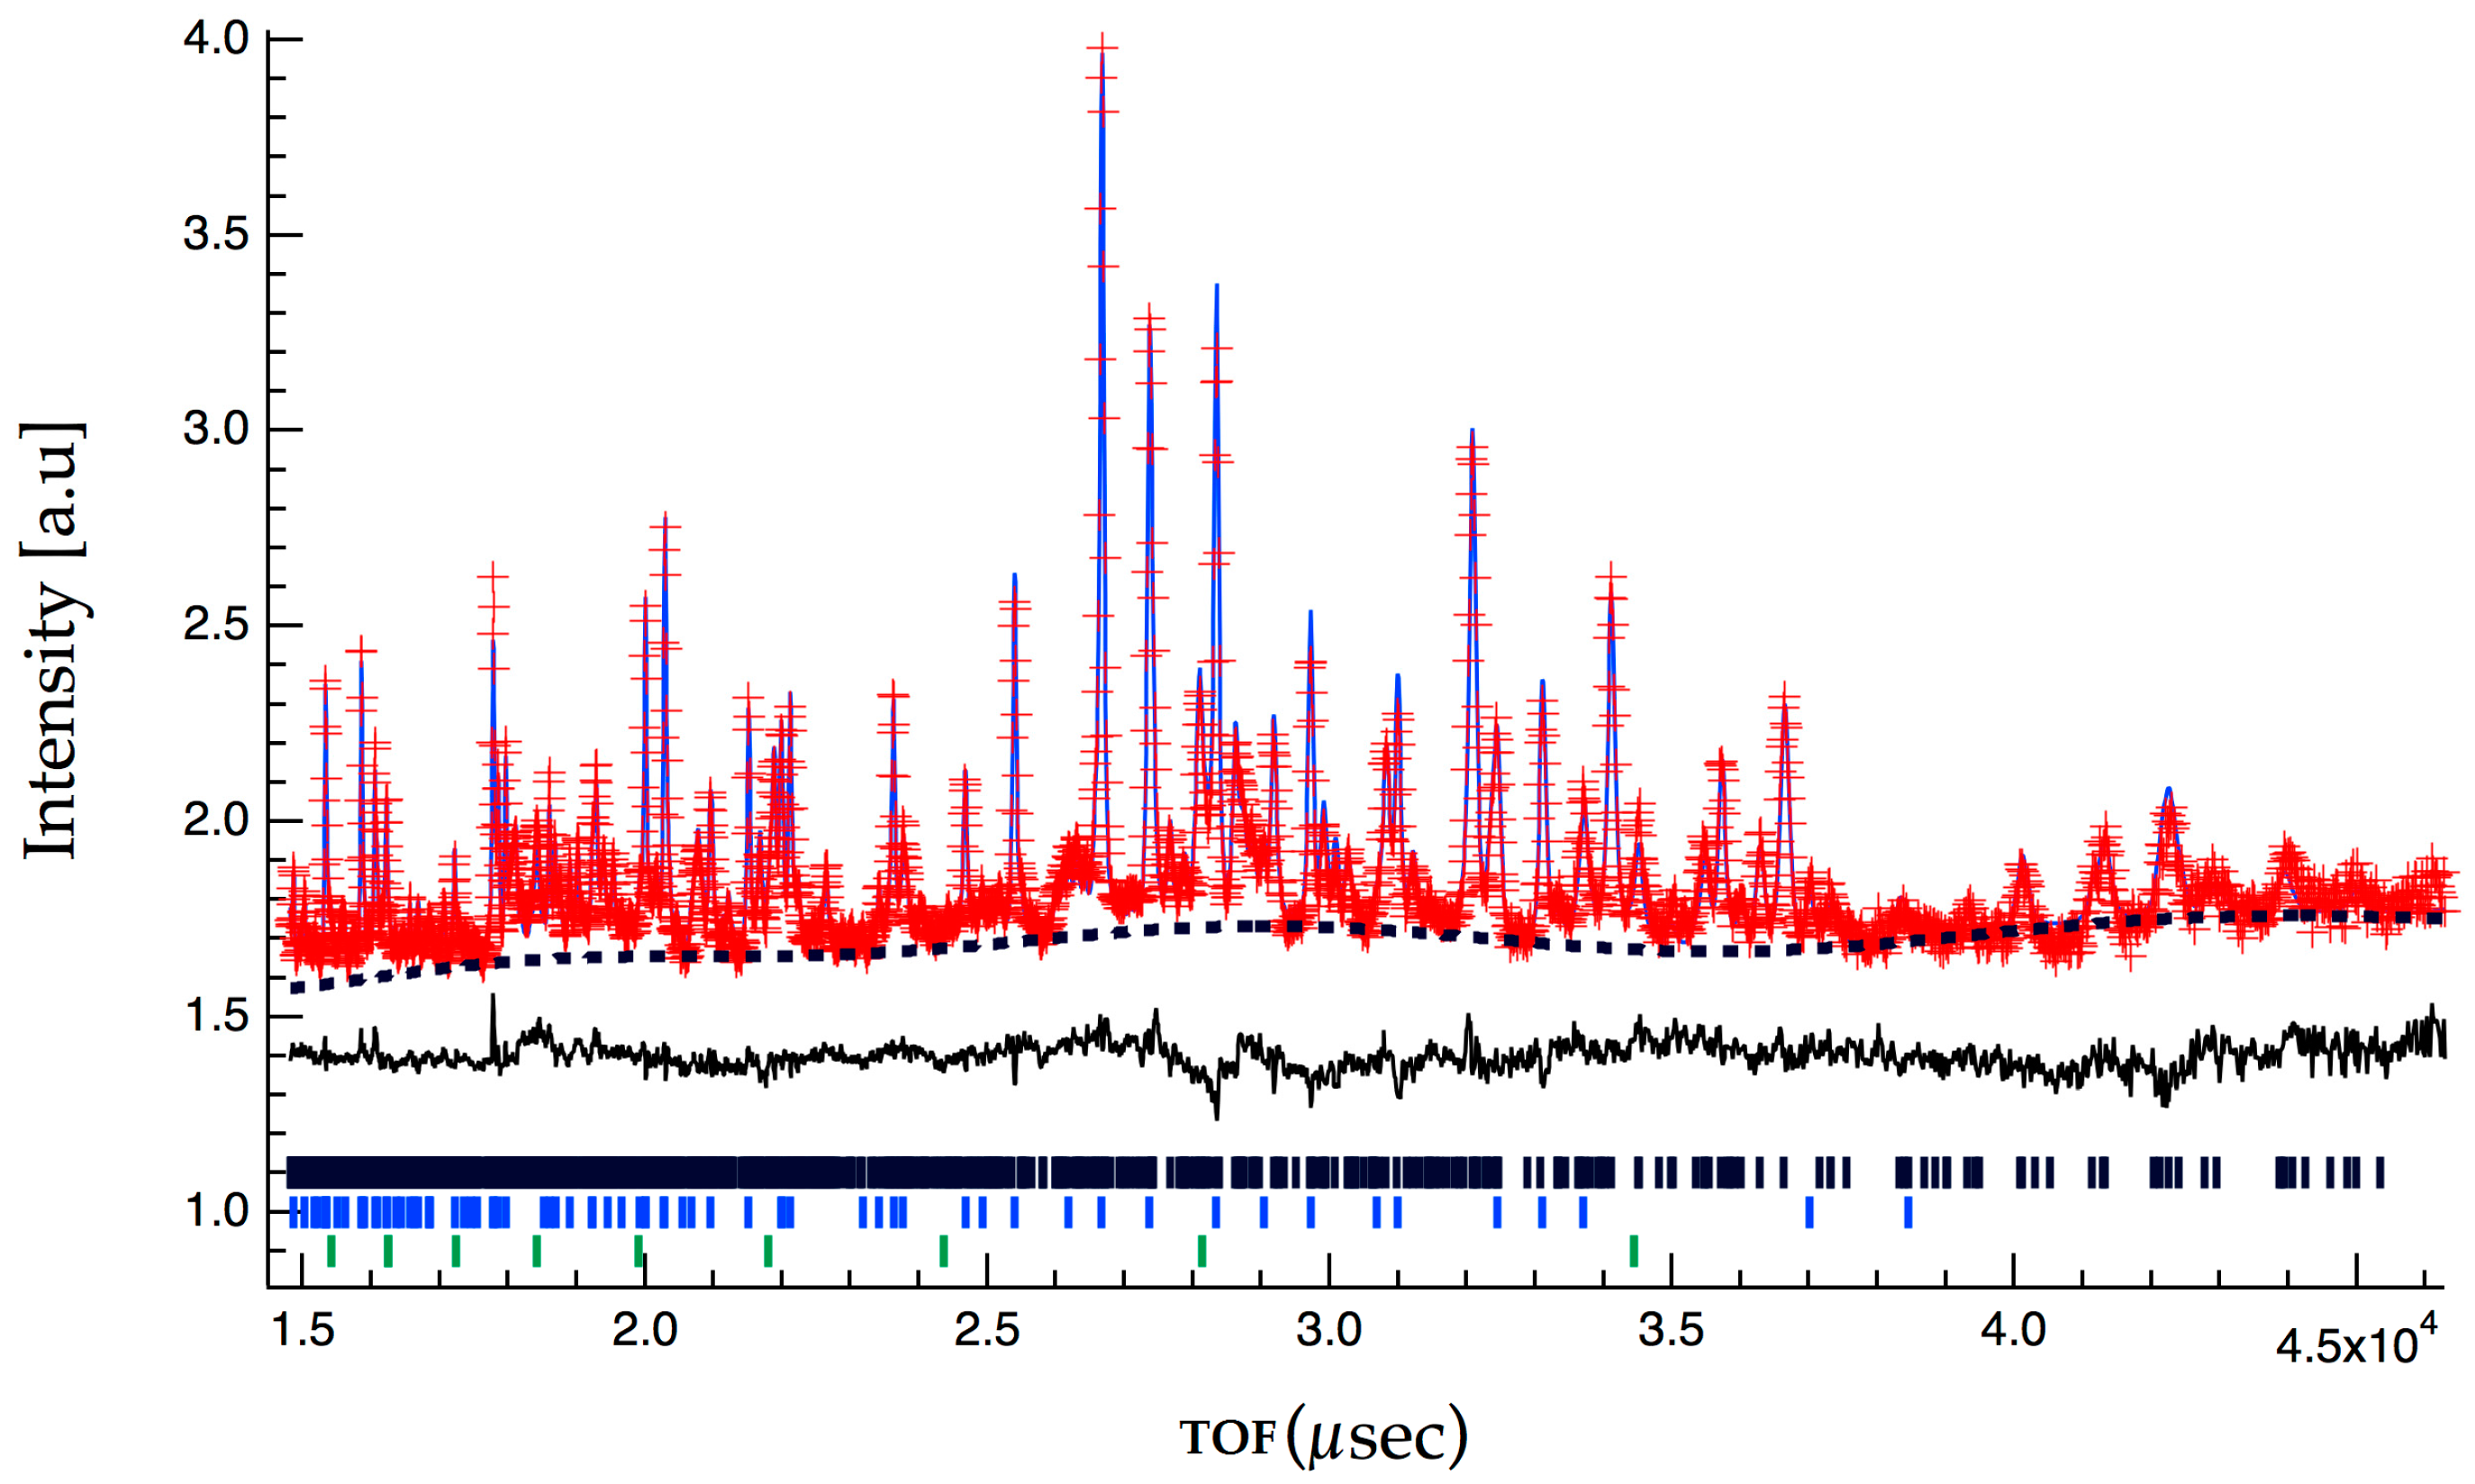
A joint refinement utilizing both X-ray and neutron data was then initiated. The strain parameters for rutile and Ga-Ti-O-N were refined independently (Figure 4) but constrained to be equal for each phase between X-ray and neutron datasets. The neutron data was weighted at 1.5, compared to the X-ray data weighted at 1.0, to emphasize the favorable scattering differences between O/N and Ga/Ti pairs occupying anion and cation sites, respectively. Starting with the unit cell composition consistent with refinement of cation site occupancies from the X-ray data, Ga10Ti8O28N2, atoms were distributed randomly over the cation and anion sites. The neutron refinement was initiated by sequentially refining overall parameters, background and scale, for individual data sets, and then sample parameters common to both datasets, strain and unit cell dimensions. To account for slight differences arising due to the temperatures at which neutron data were collected, elastic strain components were refined for both phases for the X-ray data set. The neutron dataset was contaminated by peaks arising from the vanadium sample holder, and this phase was added to account for this. Following convergence of a refinement of the above parameters and the site positional parameters for the Ga-Ti-O-N phase, the anion and cation site occupancies were determined.
To set a baseline for comparison of the overall fit, all anion sites were filled with oxygen while the Ga-Ti occupancies of cation sites were refined along with overall displacement parameters (U); the value of U for all cation sites were constrained to be equal, as were those of the anion sites. The results of this refinement suggested the following approximate compositions for the five cation sites (see Table A1, which summarizes the final results for Ga-Ti-O-N): site 1, Ga¾Ti¼; site2, Ti; site3, Ga0.8Ti0.2; site 4, Ti; site5, Ga. The fit to the neutron data, summarized by the weighted profile R-value (Rwp) and goodness of fit (GOF) were 5.81% and 3.70, respectively. The fits to the Ga-Ti-O-N phase Bragg intensities, RB(F2), comparable to the usual single crystal discrepancy factor, were 5.27% and 12.86%, for the X-ray and neutron data, respectively. The site occupancies of all metal and anion sites were then varied, with Uiso constrained as above. The results of this refinement were: neutron overall Rwp = 5.34%, GOF = 3.64, and RB(F2) = 5.25% and 10.14%, for the X-ray and neutron data, respectively. Sites that were within the margin of error of full occupancy by Ga, Ti and O were fixed at those compositions; no anion site was fully occupied by nitrogen. A new set of refinements was performed, maintaining restraints on strain and displacement parameters as described above. Trial refinements with displacement parameters refined without constraint did not significantly improve the overall fit. Finally, the chemical composition was constrained to be consistent with the formula derived for the solid solution Ti6+xGa12−xO30−xNx; the amount of nitrogen per unit cell distributed over sites occupied by both oxygen and nitrogen, designated as “ON” sites ON1, 2, 4 and 8, was set equal to the amount of titanium in sites GaTi1 and 3 (Table A1). After convergence, the results summarized in Table A1 were obtained. The overall fits to the X-ray and neutron data are given in Figure 2 and Figure 3, respectively. The CIF file for the experimental phase is deposited into Crystallography Open Database (COD entry 3000168) as prepublication data.

3. Discussion

3.1. Composition

The unit cell contents for the synthesized Ga-Ti-O-N phase were Ga10Ti8O28N2, consistent with the solid solution between theoretical endmembers Ti18O18N12 and Ti6Ga12O30, Ti6+xGa12−xO30−xNx. The sites occupied by nitrogen tend to be segregated into those anion sites associated with the pure Ti-octahedral sites in blocks of structure centered at x = 0, ½ (Figure 5, Table A1). If all ON sites were fully occupied by nitrogen this would correspond to N14 per unit cell, more nitrogen rich than the endmember composition, and so probably a composition that would not crystallize in this structure type. Interestingly, the presumptive pure Ti endmember composition, Ti18O18N12 or Ti3O3N2, is one predicted to have ideal bandgap properties for overall water splitting [19] albeit with a predicted instability of 31 meV per atom [19] that probably requires high pressure for synthesis. Wu et al.’s prediction is based upon Ti/O coupled substitution into the Ta3N5 structure [19]. The structure of Ta3N5 is orthorhombic Cmcm, a =3.8862 Å, b = 10.2118 Å, c = 10.2624 Å and consists of only distorted TaN6 octahedra [38]. The Ta3N5 structure [38] is very different from that of Ga10Ti8O28N2 reported here (Figure 3 and Figure 4). It would be interesting to attempt the synthesis of the titanium endmember “Ti3O3N2”. Our preliminary attempts to do so using ammonolysis of TiO2 were not successful.

3.2. Implications and Future Work

It is evident that state of the art evolutionary algorithm USPEX can be used reliably to find high pressure phases of oxynitrides with enough structural details and that will be utilized to explore several other oxynitride systems. In fact, the results obtained here will act as a feedback to assist us. We are continuing the synthesis work at even higher pressures in a multianvil press to find out if we can synthesize other members of the solid solution. Further, we are developing methods to predict materials with desired bandgaps more efficiently.

4. Materials and Methods

4.1. Theoretical Prediction Methods

Ab initio variable-composition evolutionary algorithm USPEX [39,40,41,42,43], which simultaneously searches for stable stoichiometries and their corresponding most stable structures, was employed to search for stable oxynitrides at pressures attainable in a large volume press. In this method, all stoichiometric compounds are considered following a constraint on the total number of atoms on the unit cell. We performed calculations at 0, 5, 10 and 20 GPa for systems having up to 48 atoms in the unit cell. Using USPEX, we generate stoichiometric compounds with initial chemical composition randomly chosen from a mix of GaN and TiO2 and their corresponding structures generated using random symmetric generator. USPEX makes subsequent generations with 20% random structures, and 80% using heredity, soft-mutation, lattice mutation and transmutation operators, in which transmutation and heredity operators change the composition, while lattice mutation and soft-mutation only change the structure within a fixed-composition mechanism. After relaxing the structures, only the best 60% of the structures, ranked by a fitness function, are used to generate the subsequent generations.
The underlying structure relaxation was carried out using the all electron projector-augmented wave (PAW) method [44] as implemented in the VASP package [45] in the framework of DFT. We used valence electron configurations of [3p6 3d2 4s2], [4s2 4p1], [2s2 2p4] and [2s2 2p3] for titanium, gallium, oxygen and nitrogen, respectively. We used Perdew-Burke-Ernzerhof generalized gradient approximation (PBE-GGA) [46]. A plane-wave kinetic cutoff energy of 600 eV and dense Monkhorst-Pack k-points grids with reciprocal space resolution 2π × 0.05 Å−1 were employed [47] in order to provide sufficient accuracy during enthalpy calculations.

4.2. High Pressure Synthesis

A 1:1 mixture of GaN, produced from the ammonolysis of powdered Ga2O3 (Alfa Aeser, Thermo Fisher Scientific Chemicals Inc., Ward Hill, MA, USA, 99.99%) and TiO2 (Aldrich, Sigma-Aldrich, Saint Louis, MO, USA, 99.8% trace metals basis, anatase) was mixed thoroughly for half an hour in a mortar and pestle. About 1 g of this mixture was loaded into a piston-cylinder apparatus with a 19 mm diameter cylindrical talc pressure cell and rapidly heated at ~200 °C min−1 to 1200 °C, at 1 GPa. Details of this instrument was described in the literature [20]. The pressure and temperature was selected based on the previous research experience, where we saw that disorder in a system can bring about the stabilization of high pressure phases at even lower pressures than expected [20]. A mixture of TiO2 (rutile) and an unknown phase resulted after the reaction. In an attempt to increase the yield of the unknown phase, the reaction mixture was adjusted to TiO2:GaN = 2:1, and a nano form of the TiO2 polymorph anatase (Nanostructured & Amorphous Materials, Inc., Houston, TX, USA, 99.4%) was used as a reactant along with crystalline GaN. About 50% of the anatase reacted with GaN before converting to the more refractory rutile polymorph. This sample, containing rutile and Ga-Ti-O-N, was used for subsequent determination of crystal structure.

Supplementary Materials

The COD entry 3000168 contains the supplementary crystallographic data for this paper. These data can be obtained free of charge via http://www.crystallography.net/cod/search.html.

Acknowledgments

The authors are thankful to the National Science Foundation (United States) for supporting the synthesis, characterization, and manuscript preparation (Grant DMR-1231586) of this work. A portion of this research used resources at the Spallation Neutron Source, a DOE Office of Science User Facility operated by the Oak Ridge National Laboratory. This research used resources of the Advanced Photon Source, a U.S. Department of Energy (DOE) Office of Science User Facility operated for the DOE Office of Science by Argonne National Laboratory under Contract No. DE-AC02-06CH11357. The authors wish to thank scientists and technicians working at these institutions for their help and scientific advice for this research.

Author Contributions

William R. Woerner, Alexandra Sinclair and M. Mahdi Davari Esfahani conceived and designed the experiments; William R. Woerner and M. Mahdi Davari Esfahani performed the experiments and theoretical predictions; John B. Parise, M. Mahdi Davari Esfahani, Alwin James, Artem R. Oganov, Lars Ehm and William R. Woerner analyzed the data and contributed to the text; Alwin James wrote, edited and submitted the paper.

Conflicts of Interest

The authors declare no conflict of interest.

Appendix A

Structural Description

Selected interatomic distances and angles, and bond valence sums are summarized in Table A2 and the overall structure is depicted as a polyhedral model in Figure 5. For the sake of clarity, the structure is divided into separate Ti- and Ga-rich blocks (Figure A1) with the nitrogen doped sites preferentially occupying the former structural element. The Ti-block (Figure A1) consists of four edge-shared Ti-centered octahedra, a piece of NaCl-related (TiO, TiN) structure containing the ON8 site, which is about 60% occupied by N (Table A1); this site is bonded to four Ti (Figure A1). The remainder of the block consists of edge linked Ti-octahedral chains linked to the TiN/TiO fragments at octahedral corners. With the exception of O7, all anion sites within the block, ON-1, -2, -4 and -8 are partially occupied by nitrogen.
The second block contains two symmetry independent octahedral sites, occupied mostly by Ga (Table A1) and a pure Ga-centered tetrahedral site (Figure A1).
Table A1. Final results from the joint X-ray neutron refinement of the Ga-Ti-O-N phase.
SiteComp *M **xyz
TiGa10.272(7)40.68066(6)00.0554(1)
Ti21.040.48766(9)00.6516(1)
TiGa30.245(7)40.18934(6)00.3871(1)
Ti41.02000
Ga51.040.15770(5)00.7257(1)
ON10.08(2)40.0147(2)00.2125(4)
ON20.08(2)40.4003(2)00.3039(5)
O31.040.1979(2)00.9208(5)
ON40.07(2)40.4277(2)00.9955(4)
O51.040.1876(2)00.1853(4)
O61.040.2288(2)00.5998(4)
O71.040.3792(3)00.6098(4)
ON80.57(1)200½
* Fractional occupancy (f) by Ti and N of the cation TiGa and anion ON sites, respectively; All sites were refined assuming full occupancy, e.g., fTi + fGa = 1.0; The chemistry was constrained so that total nitrogen in the unit cell = ((total Ti in unit cell)-6) consistent with the formulation Ti6+xGa12−xO30−xNx. ** M = site multiplicity.
Figure A1. (a) top—Ti-block and (b) bottom—Ga-Ti block (see Figure 3).
Crystals 08 00015 g0a1
Refined Uiso × 102 Å2 = 0.67(1) and 0.41(2) for cation and anion sites, respectively.
Refined Composition: Ti8Ga10O28N2 or Ti4Ga5O14N.
Unit cell: monoclinic, C2/m, a = 17.823(1) Å, b = 2.9970(1) Å, c = 9.4205(5) Å, β = 98.446(3)°; Volume = 497.74(3) Å3.
Refinement statistics: combined Rwp = 5.57% GOF = 3.69 for joint X-ray neutron data (Rwp = for the individual X-ray and Neutron data sets were RXwp = 13.31% (38,714 observations) and RNwp = 2.15% (4035 observations) respectively; the X-ray:neutron data were weighted 1:1.5; the integrated Bragg discrepancy factors, RB(F2), for the Ga-Ti-O-N phase were 5.32% and 10.22%, for the X-ray and neutron data, respectively.
Table A2. Selected interatomic distances (Å) and angles (°) for the Ga-Ti-O-N phase.
TiGa1Todist.Sij/ΣSij *O3O3O3ON4O5
O32.143(4)0.43
O32.015(3)0.5879.7(1)
O32.015(3)0.5879.7(1)96.1(2)
ON41.920(40.72171.7(2)94.8(1)94.8(1)
O51.927(2)0.7188.0(1)79.6(1)167.5(2)97.3(1)
O51.927(2)0.7188.0(1)167.5(2)79.6(1)97.3(1)102.1(2)
3.73
Ti2Todist. ON1ON1ON2O7ON8
ON11.976(3)0.63
ON11.976(3)0.6398.6(2)
ON21.980(5)0.6388.8(1)88.8(1)
O71.916(5)0.7390.9(1)90.9(1)179.6(2)
ON82.104(1)0.4785.1(1)174.1(1)86.6(1)93.6(1)
ON82.104(1)0.47174.1(1)85.1(1)86.6(1)93.6(1)90.86(5)
3.57
TiGa3Todist. O5O6O6O6O7
O51.897(4)0.76
O62.025(4)0.57160.8(2)
O62.082(3)0.5088.2(1)78.6(1)
O62.082(3)0.5088.2(1)78.6(1)92.1(2)
O71.936(3)0.7095.6(1)96.5(1)83.1(1)173.8(2)
O71.936(3)0.7095.6(1)96.5(1)173.8(2)83.1(1)101.4(2)
3.71
Ti4Todist. ON1ON1ON4ON4ON4
ON11.980(4)0.63
ON11.980(4)0.63180
ON41.973(3)0.6490.6(1)89.4(1)
ON41.973(3)0.6490.6(1)89.4(1)98.8(2)
ON41.973(3)0.6489.4(1)90.6(1)81.2(2)180
ON41.973(3)0.6489.4(1)90.6(1)18081.2(2)98.8(2)
3.81
Ga5Todist. ON2ON2O3
ON21.818(3)0.79
ON21.818(3)0.79111.0(2)
O31.872(4)0.68106.1(1)106.1(1)
O61.859(4)0.71109.1(1)109.1(1)115.3(2)
2.96
* Bond Valence Sij = exp((R0 − Rij)/B) where Rij is the length of a bond between atoms i and j; ΣSij, the bond valence sum around each atom should be equal to the valence (oxidation state) of that atom. For the values quoted the parameters R0 and B were taken from tabulations provided at the International Union of Crystallography: https://www.iucr.org/resources/data/datasets/bond-valence-parameters [48]. The R0 and B parameters used were those compiled for Ti4+ (1.815, 0.37) and Ga3+ (1.73, 0.37) bonded to O2−. TiGa sites used T4+ parameters.
Table A3. Average bond lengths of the predicted Ga-Ti-O-N structures optimized at 20 GPa.
Average Bond LengthsGaTiO2NGaTi2O4N
d(Ga-ON)1.9411.976
d(Ti-O)---2.027
d(Ti-ON)2.0571.969
Table A4. Crystallographic Information Files (CIFs) created for GaTiO2N and GaTiO4N.
CIF File Created for GaTiO2N
_audit_creation_date2017-08-05
_symmetry_space_group_name_H-M‘PM’
_symmetry_Int_Tables_number6
_symmetry_cell_settingmonoclinic
loop_
_symmetry_equiv_pos_as_xyz
x,y,z
x,-y,z
_cell_length_a5.9275
_cell_length_b3.0572
_cell_length_c5.2466
_cell_angle_alpha90.0000
_cell_angle_beta91.4407
_cell_angle_gamma90.0000
loop_
_atom_site_label
_atom_site_type_symbol
_atom_site_fract_x
_atom_site_fract_y
_atom_site_fract_z
_atom_site_U_iso_or_equiv
_atom_site_adp_type
_atom_site_occupancy
Ga1Ga0.18413−0.000000.003670.00000Uiso1.00
N2N0.16384−0.000000.371340.00000Uiso1.00
Ti1Ti0.50889−0.000000.407780.00000Uiso1.00
O2O0.43639−0.000000.768920.00000Uiso1.00
O4O0.75867−0.000000.101120.00000Uiso1.00
Ga2Ga0.012540.500000.482000.00000Uiso1.00
N1N0.696270.500000.531240.00000Uiso1.00
Ti2Ti0.666310.500000.903420.00000Uiso1.00
O1O0.029380.500000.856560.00000Uiso1.00
O3O0.421920.500000.148540.00000Uiso1.00
CIF File Created for GaTiO4N
_audit_creation_date2017-08-05
_symmetry_space_group_name_H-M‘P21’
_symmetry_Int_Tables_number4
_symmetry_cell_settingmonoclinic
loop_
_symmetry_equiv_pos_as_xyz
x,y,z
-x,y+1/2,-z
_cell_length_a4.8847
_cell_length_b5.0528
_cell_length_c6.2742
_cell_angle_alpha90.0000
_cell_angle_beta110.3545
_cell_angle_gamma90.0000
loop_
_atom_site_label
_atom_site_type_symbol
_atom_site_fract_x
_atom_site_fract_y
_atom_site_fract_z
_atom_site_U_iso_or_equiv
_atom_site_adp_type
_atom_site_occupancy
Ga1Ga0.079810.987380.153990.00000Uiso1.00
N1N0.802670.119360.863840.00000Uiso1.00
Ti1Ti0.212260.555400.481750.00000Uiso1.00
Ti3Ti0.562760.492950.174390.00000Uiso1.00
O1O0.950050.272360.305430.00000Uiso1.00
O2O0.410280.915410.499850.00000Uiso1.00
O3O0.429210.128880.112940.00000Uiso1.00
O7O0.165590.283200.693540.00000Uiso1.00

References

  1. Lewis, N.S.; Nocera, D.G. Powering the planet: Chemical challenges in solar energy utilization. Proc. Natl. Acad. Sci. USA 2006, 103, 15729–15735. [Google Scholar] [CrossRef] [PubMed]
  2. Lewis, N.S.; Crabtree, G. Basic Research Needs for Solar Energy Utilization: Report of the Basic Energy Sciences Workshop on Solar Energy Utilization, 18–21 April 2005; US Department of Energy, Office of Basic Energy Science: Washington, DC, USA, 2005.
  3. Tsao, J.; Lewis, N.; Crabtree, G. Solar FAQs; US department of Energy: Washington, DC, USA, 2006; pp. 1–24.
  4. Hashimoto, K.; Irie, H.; Fujishima, A. TiO2 photocatalysis: A historical overview and future prospects. Jpn. J. Appl. Phys. 2005, 44, 8269. [Google Scholar] [CrossRef]
  5. Fujishima, A.; Honda, K. Electrochemical photolysis of water at a semiconductor electrode. Nature 1972, 238, 37–38. [Google Scholar] [CrossRef] [PubMed]
  6. Fujishima, A.; Honda, K.; Kikuchi, S. Photosensitized electrolytic oxidation on semiconducting n-type TiO2 electrod. Kogyo Kagaku Zasshi 1969, 72, 108–113. [Google Scholar] [CrossRef]
  7. Ruddlesden, S.N.; Popper, P. New compounds of the K2NiF4 type. Acta Crystallogr. 1957, 10, 538–539. [Google Scholar] [CrossRef]
  8. Maeda, K.; Domen, K. Oxynitride materials for solar water splitting. MRS Bull. 2011, 36, 25–31. [Google Scholar] [CrossRef]
  9. Fuertes, A. Synthesis and properties of functional oxynitrides—From photocatalysts to CMR materials. Dalton Trans. 2010, 39, 5942–5948. [Google Scholar] [CrossRef] [PubMed]
  10. Fuertes, A. Chemistry and applications of oxynitride perovskites. J. Mater. Chem. 2012, 22, 3293–3299. [Google Scholar] [CrossRef]
  11. Hirai, T.; Maeda, K.; Yoshida, M.; Kubota, J.; Ikeda, S.; Matsumura, M.; Domen, K. Origin of visible light absorption in GaN-rich (Ga1−xZnx)(N1−xOx) photocatalysts. J. Phys. Chem. C 2007, 111, 18853–18855. [Google Scholar] [CrossRef]
  12. Kasahara, A.; Nukumizu, K.; Hitoki, G.; Takata, T.; Kondo, J.N.; Hara, M.; Kobayashi, H.; Domen, K. Photoreactions on LaTiO2N under visible light irradiation. J. Phys. Chem. A 2002, 106, 6750–6753. [Google Scholar] [CrossRef]
  13. Kasahara, A.; Nukumizu, K.; Takata, T.; Kondo, J.N.; Hara, M.; Kobayashi, H.; Domen, K. LaTiO2N as a visible-light (≤600 nm)-driven photocatalyst (2). J. Phys. Chem. B 2003, 107, 791–797. [Google Scholar] [CrossRef]
  14. Porter, S.H.; Huang, Z.; Dou, S.; Brown-Xu, S.; Golam Sarwar, A.T.M.; Myers, R.C.; Woodward, P.M. Electronic structure and photocatalytic water oxidation activity of RTiNO2 (R = Ce, Pr and Nd) perovskite nitride oxides. Chem. Mater. 2015, 27, 2414–2420. [Google Scholar] [CrossRef]
  15. Hyett, G.; Green, M.A.; Parkin, I.P. The use of combinatorial chemical vapor deposition in the synthesis of Ti3-δO4N with 0.06 < δ < 0.25: A titanium oxynitride phase isostructural to anosovite. J. Am. Chem. Soc. 2007, 129, 15541–15548. [Google Scholar] [PubMed]
  16. Hyett, G.; Green, M.A.; Parkin, I.P. Ultra-violet light activated photocatalysis in thin films of the titanium oxynitride, Ti3−δO4N. J. Photochem. Photobiol. A Chem. 2009, 203, 199–203. [Google Scholar] [CrossRef]
  17. Maeda, K.; Takata, T.; Hara, M.; Saito, N.; Inoue, Y.; Kobayashi, H.; Domen, K. GaN: ZnO solid solution as a photocatalyst for visible-light-driven overall water splitting. J. Am. Chem. Soc. 2005, 127, 8286–8287. [Google Scholar] [CrossRef] [PubMed]
  18. Dharmagunawardhane, H.A.N.; James, A.; Wu, Q.; Woerner, W.R.; Sinclair, A.; Palomino, R.; Orlov, A.; Parise, J.B. Unexpected visible light driven photocatalytic activity without cocatalysts and sacrificial reagents from the (GaN)1–x(ZnO)x solid solution synthesized at high pressure in the entire composition range. RSC Adv. 2018. In Review. [Google Scholar]
  19. Wu, Y.B.; Lazic, P.; Hautier, G.; Persson, K.; Ceder, G. First principles high throughput screening of oxynitrides for water-splitting photocatalysts. Energy Environ. Sci. 2013, 6, 157–168. [Google Scholar] [CrossRef] [Green Version]
  20. Woerner, W.R.; Qian, G.-R.; Oganov, A.R.; Stephens, P.W.; Dharmagunawardhane, H.N.; Sinclair, A.; Parise, J.B. Combined theoretical and in situ scattering strategies for optimized discovery and recovery of high-pressure phases: A case study of the GaN–Nb2O5 system. Inorg. Chem. 2016, 55, 3384–3392. [Google Scholar] [CrossRef] [PubMed]
  21. Ozoliņš, V.; Wolverton, C.; Zunger, A. First-principles theory of vibrational effects on the phase stability of Cu-Au compounds and alloys. Phys. Rev. B 1998, 58, R5897. [Google Scholar] [CrossRef]
  22. Vinograd, V.L. Substitution of [4]al in layer silicates: Calculation of the Al-Si configurational entropy according to 29Si NMR spectra. Phys. Chem. Miner. 1995, 22, 87–98. [Google Scholar] [CrossRef]
  23. Brown, I.D.; Altermatt, D. Bond-valence parameters obtained from a systematic analysis of the inorganic crystal structure database. Acta Crystallogr. Sect. B 1985, 41, 244–247. [Google Scholar] [CrossRef]
  24. Lüdtke, T.; Orthmann, S.; Lerch, M. Bixbyite-type phases in the system Ta-Zr-ON. Z. Naturforsch. B 2017, 72, 305–311. [Google Scholar] [CrossRef]
  25. Kuno, Y.; Tassel, C.; Fujita, K.; Batuk, D.; Abakumov, A.M.; Shitara, K.; Kuwabara, A.; Moriwake, H.; Watabe, D.; Ritter, C. ZnTaO2N: Stabilized high-temperature LiNbO3-type structure. J. Am. Chem. Soc. 2016, 138, 15950–15955. [Google Scholar] [CrossRef] [PubMed]
  26. Oró-Solé, J.; Clark, L.; Bonin, W.; Attfield, J.P.; Fuertes, A. Anion-ordered chains in ad 1 perovskite oxynitride: NdVO2N. Chem. Commun. 2013, 49, 2430–2432. [Google Scholar] [CrossRef] [PubMed]
  27. Yashima, M.; Lee, Y.; Domen, K. Crystal structure and electron density of Tantalum oxynitride, a visible light responsive photocatalyst. Chem. Mater. 2007, 19, 588–593. [Google Scholar] [CrossRef]
  28. Srinivasa, S.; Cartz, L.; Jorgensen, J.; Worlton, T.; Beyerlein, R.; Billy, M. High-pressure neutron diffraction study of Si2N2O. J. Appl. Crystallogr. 1977, 10, 167–171. [Google Scholar] [CrossRef]
  29. Momma, K.; Izumi, F. Vesta: A three-dimensional visualization system for electronic and structural analysis. J. Appl. Crystallogr. 2008, 41, 653–658. [Google Scholar] [CrossRef]
  30. Cros, B.; Kernerczeskleba, H.; Philippot, E. The structure of V2GaO5. Acta Crystallogr. Sect. B-Struct. Commun. 1980, 36, 2210–2213. [Google Scholar] [CrossRef]
  31. Suchomel, M.R.; Ribaud, L.; Von Dreele, R.B.; Toby, B.H. Synchrotron powder diffraction simplified: The high-resolution diffractometer 11-BM at the Advanced Photon Source. Geochim. Cosmochim. Acta 2010, 74, 12. [Google Scholar]
  32. Wang, J.; Toby, B.H.; Lee, P.L.; Ribaud, L.; Antao, S.M.; Kurtz, C.; Ramanathan, M.; Von Dreele, R.B.; Beno, M.A. A dedicated powder diffraction beamline at the advanced photon source: Commissioning and early operational results. Rev. Sci. Instrum. 2008, 79, 085105. [Google Scholar] [CrossRef] [PubMed]
  33. Toby, B.H.; Huang, Y.; Dohan, D.; Carroll, D.; Jiao, X.S.; Ribaud, L.; Doebbler, J.A.; Suchomel, M.R.; Wang, J.; Preissner, C.; et al. Management of metadata and automation for mail-in measurements with the aps 11-BM high-throughput, high-resolution synchrotron powder diffractometer. J. Appl. Crystallogr. 2009, 42, 990–993. [Google Scholar] [CrossRef]
  34. Toby, B.H.; Von Dreele, R.B. GSAS-II: The genesis of a modern open-source all purpose crystallography software package. J. Appl. Crystallogr. 2013, 46, 544–549. [Google Scholar] [CrossRef]
  35. Stephens, P.W. Phenomenological model of anisotropic peak broadening in powder diffraction. J. Appl. Crystallogr. 1999, 32, 281–289. [Google Scholar] [CrossRef]
  36. Balzar, D.; Audebrand, N.; Daymond, M.R.; Fitch, A.; Hewat, A.; Langford, J.I.; Le Bail, A.; Louer, D.; Masson, O.; McCowan, C.N.; et al. Size-strain line-broadening analysis of the Ceria round-robin sample. J. Appl. Crystallogr. 2004, 37, 911–924. [Google Scholar] [CrossRef]
  37. Ha, K.; Ciria, M.; O’Handley, R.C.; Stephens, P.W.; Pagola, S. X-ray study of strains and dislocation density in epitaxial Cu/Ni/Cu/Si(001) films. Phys. Rev. B 1999, 60, 13780–13785. [Google Scholar] [CrossRef]
  38. Brese, N.E.; O’Keeffe, M.; Rauch, P.; DiSalvo, F.J. Structure of Ta3N5 at 16 K by time-of-flight neutron diffraction. Acta Crystallogr. C 1991, 47, 2291–2294. [Google Scholar] [CrossRef]
  39. Glass, C.W.; Oganov, A.R.; Hansen, N. USPEX—Evolutionary crystal structure prediction. Comput. Phys. Commun. 2006, 175, 713–720. [Google Scholar] [CrossRef]
  40. Lyakhov, A.O.; Oganov, A.R.; Stokes, H.T.; Zhu, Q. New developments in evolutionary structure prediction algorithm USPEX. Comput. Phys. Commun. 2013, 184, 1172–1182. [Google Scholar] [CrossRef]
  41. Lyakhov, A.O.; Oganov, A.R.; Valle, M. How to predict very large and complex crystal structures. Comput. Phys. Commun. 2010, 181, 1623–1632. [Google Scholar] [CrossRef]
  42. Oganov, A.R.; Glass, C.W. Evolutionary crystal structure prediction as a tool in materials design. J. Phys. Condens. Matter 2008, 20, 064210. [Google Scholar] [CrossRef] [PubMed]
  43. Oganov, A.R.; Lyakhov, A.O.; Valle, M. How evolutionary crystal structure prediction works and why. Acc. Chem. Res. 2011, 44, 227–237. [Google Scholar] [CrossRef] [PubMed]
  44. Blöchl, P.E. Projector augmented-wave method. Phys. Rev. B 1994, 50, 17953. [Google Scholar] [CrossRef]
  45. Kresse, G.; Furthmüller, J. Efficient iterative schemes for ab initio total-energy calculations using a plane-wave basis set. Phys. Rev. B 1996, 54, 11169. [Google Scholar] [CrossRef]
  46. Perdew, J.P.; Burke, K.; Ernzerhof, M. Generalized gradient approximation made simple. Phys. Rev. Lett. 1996, 77, 3865. [Google Scholar] [CrossRef] [PubMed]
  47. Monkhorst, H.J.; Pack, J.D. Special points for brillouin-zone integrations. Phys. Rev. B 1976, 13, 5188. [Google Scholar] [CrossRef]
  48. Brown, I.D. The Chemical Bond in Inorganic Chemistry: The Bond Valence Model; Oxford University Press: Oxford, UK, 2002. [Google Scholar]
Figure 1. The lowest enthalpy structures of (a) GaTiO2N and (b) GaTi2O4N predicted at 20 GPa. Green and blue spheres are gallium and titanium atoms, respectively. Oxygen and nitrogen are represented by red and silver spheres, respectively. The unit cells are outlined with black lines. Visualization is done by VESTA [29].
Crystals 08 00015 g001
Figure 2. Fit to X-ray data; observed and calculated data are red crosses and the continuous blue line, respectively. The dotted and solid black curves represent the background and the difference between observed and calculated data, respectively.
Crystals 08 00015 g002
Figure 3. Fit to neutron data; observed and calculated data are red crosses and the continuous blue line, respectively. The dotted and solid black curves represent the background and the difference between observed and calculated data, respectively. The vertical black, blue and green lines mark the positions of Bragg reflections from the Ga-Ti-O-N, TiO2 (rutile) and vanadium sample can, respectively. The largest differences between observed and calculated data are in the rutile phase.
Crystals 08 00015 g003
Figure 4. Rietveld fit to 11-BM (APS) X-ray profile containing an estimated TiO2 (46 wt %) and the new phase related to V2GaO5 (54 wt %). Note the much larger anisotropic strain, defined in GSAS-II [34] and originally introduced [35] and used by Stephens [36,37]. Note the sharper rutile peaks (vertical red markers) compared to those of the V2GaO5-related phase (vertical black markers).
Crystals 08 00015 g004
Figure 5. Structure of Ga-Ti-O-N, the gallium titanium oxynitride phase. Visualization is done by VESTA [29]. Deep blue polyhedra are occupied exclusively by Ti sites, green pure Ga and light blue are mixed Ti/Ga sites. Red balls represent anion sites occupied by oxygen; ON sites occupied mostly by nitrogen and by ~10% nitrogen, are represented by partially red and grey balls. The origin of the unit cell centered on Ti and is in the back top-left-hand corner, with z vertical, x to the right and y out of the page. The sites occupied by nitrogen are separated mostly into sites within blocks of Ti-centered octahedra, while oxide sites occupy mostly blocks occupied by Ga- and mixed TiGa sites.
Crystals 08 00015 g005
Table 1. Enthalpies of formation of GaTiO2N and GaTi2O4N calculated at 0, 5, 10 and 20 GPa.
PressureFormation Enthalpy (eV/atom)
GaTiO2NGaTi2O4N
0 GPa0.190.21
5 GPa0.140.15
10 GPa0.130.14
20 GPa0.100.11
Table 2. Configurational entropies and calculated temperatures needed to stabilize given compounds.
CompoundSconf (eV K−1/F.U.)T (K)
GaTiO2N3.291408
GaTi2O4N4.411684
Ga10Ti8O28N26.383494

