Article

Anthracene-Based Lanthanide Metal-Organic Frameworks: Synthesis, Structure, Photoluminescence, and Radioluminescence Properties

by
Stephan R. Mathis II
1,
Saki T. Golafale
1,
Kyril M. Solntsev
2 and
Conrad W. Ingram
1,*
1
Center for Functional Nanoscale Materials, Department of Chemistry, Clark Atlanta University, Atlanta, GA 30314, USA
2
School of Chemistry and Biochemistry, Georgia Institute of Technology, Atlanta, GA 30332, USA
*
Author to whom correspondence should be addressed.
Crystals 2018, 8(1), 53; https://doi.org/10.3390/cryst8010053
Submission received: 11 December 2017 / Revised: 10 January 2018 / Accepted: 17 January 2018 / Published: 22 January 2018
(This article belongs to the Special Issue Structural Design and Properties of Coordination Polymers)

Abstract

:
Four anthracene-based lanthanide metal-organic framework structures (MOFs) were synthesized from the combination of the lanthanide ions, Eu3+, Tb3+, Er3+, and Tm3+, with 9,10-anthracenedicarboxylic acid (H2ADC) in dimethylformamide (DMF) under hydrothermal conditions. The 3-D networks crystalize in the triclinic system with P-1 space group with the following compositions: (i) {{[Ln2(ADC)3(DMF)4·DMF]}n, Ln = Eu (1) and Tb (2)} and (ii) {{[Ln2(ADC)3(DMF)2(OH2)2·2DMF·H2O]}n, Ln = Er (3) and Tm (4)}. The metal centers exist in various coordination environments; nine coordinate in (i), while seven and eight coordinate in (ii). The deprotonated ligand, ADC, assumes multiple coordination modes, with its carboxylate functional groups severely twisted away from the plane of the anthracene moiety. The structures show ligand-based photoluminescence, which appears to be significantly quenched when compared with that of the parent H2ADC solid powder. Structure 2 is the least quenched and showed an average photoluminescence lifetime from bi-exponential decay of 0.3 ns. On exposure to ionizing radiation, the structures show radioluminescence spectral features that are consistent with the isolation of the ligand units in its 3-D network. The spectral features vary among the 3-D networks and appear to suggest that the latter undergo significant changes in their molecular and/or electronic structure in the presence of the ionizing radiation.

1. Introduction

Metal-organic framework (MOF) structures that display linker-based luminescence characteristics have been receiving an increasing amount of attention in recent years. Their 2-D and 3-D networks offer the opportunity to fine-tune the luminescence characteristics of the organic linker molecules by isolating them in well-defined environments [1,2,3,4,5,6]. Of interest to us is the potential of MOFs as radioluminescent (scintillating) materials for the detection of ionization radiation, including neutrons, protons, and gamma rays. Advancement in the science of detecting ionizing radiation is of great significance in radiography, biological safety, medical devices, biochemical analysis, particle physics, astrophysics, and nuclear materials identification and monitoring. Anthracene, with its highly luminescent chromophore, has the highest light output (rated at 100%) among organic scintillators and exhibits fast luminescent lifetimes [7]. The radioluminescence is based on energy transitions of excitable electrons in the π-bonds. This organic molecule can discriminate between subatomic particles and gamma rays, since the delayed fluorescence it produces is dependent on the nature of the exciting/ionizing particles. However, the natural arrangement of anthracene as a bulk solid is not conducive to high scintillation efficiency, which is hampered by the tendency of the molecule to dimerize on exposure to ionizing radiation [8]. It is possible that this drawback can be overcome by isolating the anthracene chromophore as a structural component of MOFs, thereby minimizing its tendency to undergo dimerization and reducing the associated non-radiative relaxation pathways.
Research on MOFs as radioluminescent materials has only been recent. Allendorf, Doty, and coworkers showed that MOFs that were assembled from Zn(II) ions and the deprotonated 4,4′-trans-stilbenedicarboxylic acid (SDC) are a new and effective class of scintillation materials [9,10,11]. We recently reported the synthesis and radioluminescence behavior of ultra large pores Ln-SDC MOFs (Ln = Tm and Er) [12]. In all cases, unique features were observed in their ligand-based photoluminescence and radioluminescence spectra and lifetimes, corresponding to differences in the electronic and crystalline structure of each material. The materials demonstrated increased fluorescence lifetimes that were indicative of higher fluorescence quantum efficiency from the rigidified stilbene linker within their structures. Allendorf, Doty, and coworkers further investigated the radioluminescence behavior of previously known MOF structures that contain other scintillating molecules as linkers, including 4,4′-biphenyldicarboxylic acid (Zn-based IRMOF-10), 2,6-naphthalenedicarboxylic acid (Zn-based IRMOF-8), an AlOH-based structure, 135-trimethylbenzene (DUT-6), 5,5-(naphthalene-2,6-diyl)diisophthalic acid (NOTT-103-Zn), and 5,5′-(anthracene-9,10-diyl)diisophthalinic acid (PCN-14) [2].
We are interested in exploring the behavior of anthracene when its molecular units are isolated in dense 3-D MOF structures that contain little or no voids or channels. We sought to investigate whether the inter-linker spacing within the structures would be sufficiently large to reduce inter-chromophore coupling, while close enough to impart rigidity and stability to the structure, thus decreasing non-radiative pathways while maintaining structural integrity upon exposure to ultraviolet or ionizing radiation. The organic moiety, 9,10-anthracenedicarboxylate (ADC), was therefore chosen as a linker, as this ligand is shorter and more rigid than 5,5′-(anthracene-9,10-diyl)diisophthalate of Zn-PCN-14, the only anthracene-based MOF whose scintillation behavior has been reported to date [2].
The choice of metal ion is also of consideration. A significant number of anthracene-based CP and MOF structures containing d-block and s-block metal ions have been reported. Among them are Cd [13,14,15,16], Zn [17,18,19,20,21], Ni [22], Co [23], Mn [24], Ag [25] and Mg [26], many of which demonstrate ligand-based photoluminescence. We chose to use the lanthanide metal ions. In comparison to d-block metal ions, the lanthanide ions demonstrate a propensity for high and variable coordination numbers and their flexible coordination environment are more conducive to forming more condensed multidimensional structures. Reports on anthracene-based lanthanide MOFs are sparse. A 3-D structure based on ADC in coordination with La(III) ions was reported by Wang et al. [13]. Like in the case of the transition metals, ligand-based photoluminescence was observed from this structure. Recently, Calahorro reported the synthesis and magnetic properties of Ln–ADC-based MOFs (Ln = Pr3+, Nd3+, Gd3+, Tb3+, Dy3+, Er3+, and Yb3+) [27].
This manuscript reports the synthesis and photoluminescence and radioluminescence behavior of four Ln–ADC MOFs that were synthesized under hydrothermal conditions from the combination of Eu3+ (1), Tb3+ (2), Er3+ (3), and Tm3+ (4) with H2ADC. Compounds 1, 3, and 4 are new. Compounds 3 and 4 are isostructural, as are Compounds 1 and 2, and these compounds are among those recently reported [27].

2. Experimental Method

2.1. Synthesis

Synthesis of 1 (C63H59N5O17Eu2): A mixture of Eu(NO3)3·6H2O (0.043 g), ADCH2 (0.05 mmol, 0.013 g), and DMF/H2O (10 mL/10 mL) was sealed in a 20 mL scintillation vial and heated to 105 °C for 72 h in a convection oven. The vial was cooled to room temperature and the colorless crystals were filtered and repeatedly washed with fresh DMF and vacuum filtered. (Yield = 88% based on ADCH2). Elemental Anal. (%) C, 51.80; H, 4.17; N, 4.92. Calcd. (%) C, 51.77; H, 4.04; N, 4.79. FTIR (KBr pellet, cm−1): 3341 br, 1562 s, 1450 m, 1327 s, 1284 m, 1176 w, 1105 w, 1029 w, 839 s, 794 m, 736 m, 686 s, 600 w, 468 m.
Synthesis of 2 (C63H59N5O17Tb2): The synthesis procedure was the same as 1, except Tb(NO3)3·6H2O was used as lanthanide metal salt (0.045 g). (Yield = 86% based on ADCH2). Elemental Anal. (%) C, 51.22; H, 4.04; N, 4.80. Calcd. (%) C, 51.27; H, 3.99; N, 4.74. FTIR (KBr pellet, cm−1): 3341 br, 1562 s, 1450 m, 1327 s, 1284 m, 1176 w, 1105 w, 1029 w, 839 s, 794 m, 736 m, 686 s.
Synthesis of 3 (C60H58N4O19Er2): The synthesis procedure was the same as 1, except Er(NO3)3·6H2O (0.044 g) was used as lanthanide metal salt. (Yield = 92% based on ADC). Elemental Anal. (%) C, 49.00; H, 3.98; N, 3.75. Calcd. (%) C, 50.70; H, 3.95; N, 4.69. FTIR (KBr pellet, cm−1): 3341 br, 1562 s, 1450 m, 1327 s, 1284 m, 1176 w, 1105 w, 1029 w, 839 s, 794 m, 736 m, 686 s, 600 w, 468 m.
Synthesis of 4 (C60H58N4O19Tm2): The synthesis procedure was the same as 1 except Tm(NO3)3·6H2O (0.045 g) was used as the lanthanide metal salt. (Yield = 86% based on ADC). Elemental Anal. (%) C, 41.74; H, 3.56; N, 3.19. Calcd. (%) C, 48.70; H, 3.93; N, 3.79. FTIR (KBr pellet, cm−1): 3341 br, 1562 s, 1450 m, 1327 s, 1284 m, 1176 w, 1105 br, 1029 w, 839 s, 794 m, 736 m, 686 s, 600 w, 468 m.

2.2. Characterization

Single crystal X-ray analysis (SCXA) was conducted on a Bruker APEX-II CCD diffractometer. A suitable crystal was isolated from the sample and mounted onto the instrument using Paratone Oil. Measurements were made at ω scans of 1° per frame for 40 s using Mo Kα radiation (fine-focus sealed tube, 45 kV, 30 mA). The structures were solved with the Superflip structure solution program, using the Charge Flipping solution method [28] and using Olex2 as the graphical interface [29]. The models were refined with version 2013-4 of ShelXL using least squares minimization [30]. The total number of runs and images was based on the strategy calculation from the program APEX2 [31]. Cell parameters were retrieved and refined using SAINT software [32]. Data reduction was performed using the SAINT software, which corrects for Lorentz polarization. All non-hydrogen atoms were refined anisotropically. Hydrogen positions were calculated geometrically and refined using the riding model. Powdered X-ray diffraction (PXRD) patterns were recorded on a Panalytical Empyrean Series 2 X-ray diffractometer. The X-ray source was a Cu Kα (λ = 1.5418 Å) with anode at a voltage of 45 kV and current of 40 mA. Diffraction patterns were recorded between the 2θ angles of 4°–40° with a step size of 0.026°. Simulated PXRD patterns were obtained from SCXA data using Mercury 3.1 software from Cambridge Crystal Structure Database (CCDC). Infrared measurements were recorded on a Bruker Alpha-P FTIR spectrophotometer (intensive pattern: m—medium, s—strong, w—weak). The sample was introduced into the spectrophotometer using KBr as a zero-background powder and measurements were acquired between 350 and 4000 cm−1. Thermogravimetric analysis was conducted on a TA Instrument Q50 thermal analyzer. Approximately 4 mg of sample was heated at a rate of 5 °C/min from ambient temperature to 900 °C under airflow. Elemental analysis was performed by Atlantic Microlab, Norcross, GA, USA.

2.3. Photoluminescence and Radioluminescence

Room temperature solid-state photoluminescence measurement was conducted on Photon Technology International fluorometer equipped with a 75 Watts Xenon Arc Lamp, excitation and emission monochromators, and a photomultiplier detector. A powdered sample of each structure was smeared between quartz slides, and excitation and emission spectra were recorded. Fluorescence lifetimes of the same samples were measured using an Edinburgh Instruments time-correlated single photon counting (TCSPC) system. In this measurement, an excitation pulse diode laser (LDH-P-C-375, 372 nm) was used as excitation light sources. The detection system consisted of a high-speed microchannel plate photomultiplier tube (MCP-PMT, Hamamatsu R3809U-50) and TCSPC electronics. The decays curves were fitted by the polyexponential functions after deconvolution with the instrument response function (IRF).
Radioluminescence measurements were conducted using an ion beam induced luminescence (IBIL) method in the Ion Beam Laboratory, Sandia Laboratories, New Mexico, using published procedures [11,12]. The experimental setup and conditions involved a 2.5 MeV proton beam, a current density 12,000 nA/cm2 with the sample under 4.3 × 10⁻⁶ Torr vacuum pressure and ambient temperature. The beam was focused onto the sample with a spot size estimated to be 120 µm × 175 µm. Data was collected using a fiber optics coupled CCD spectrophotometer.

3. Results and Discussion

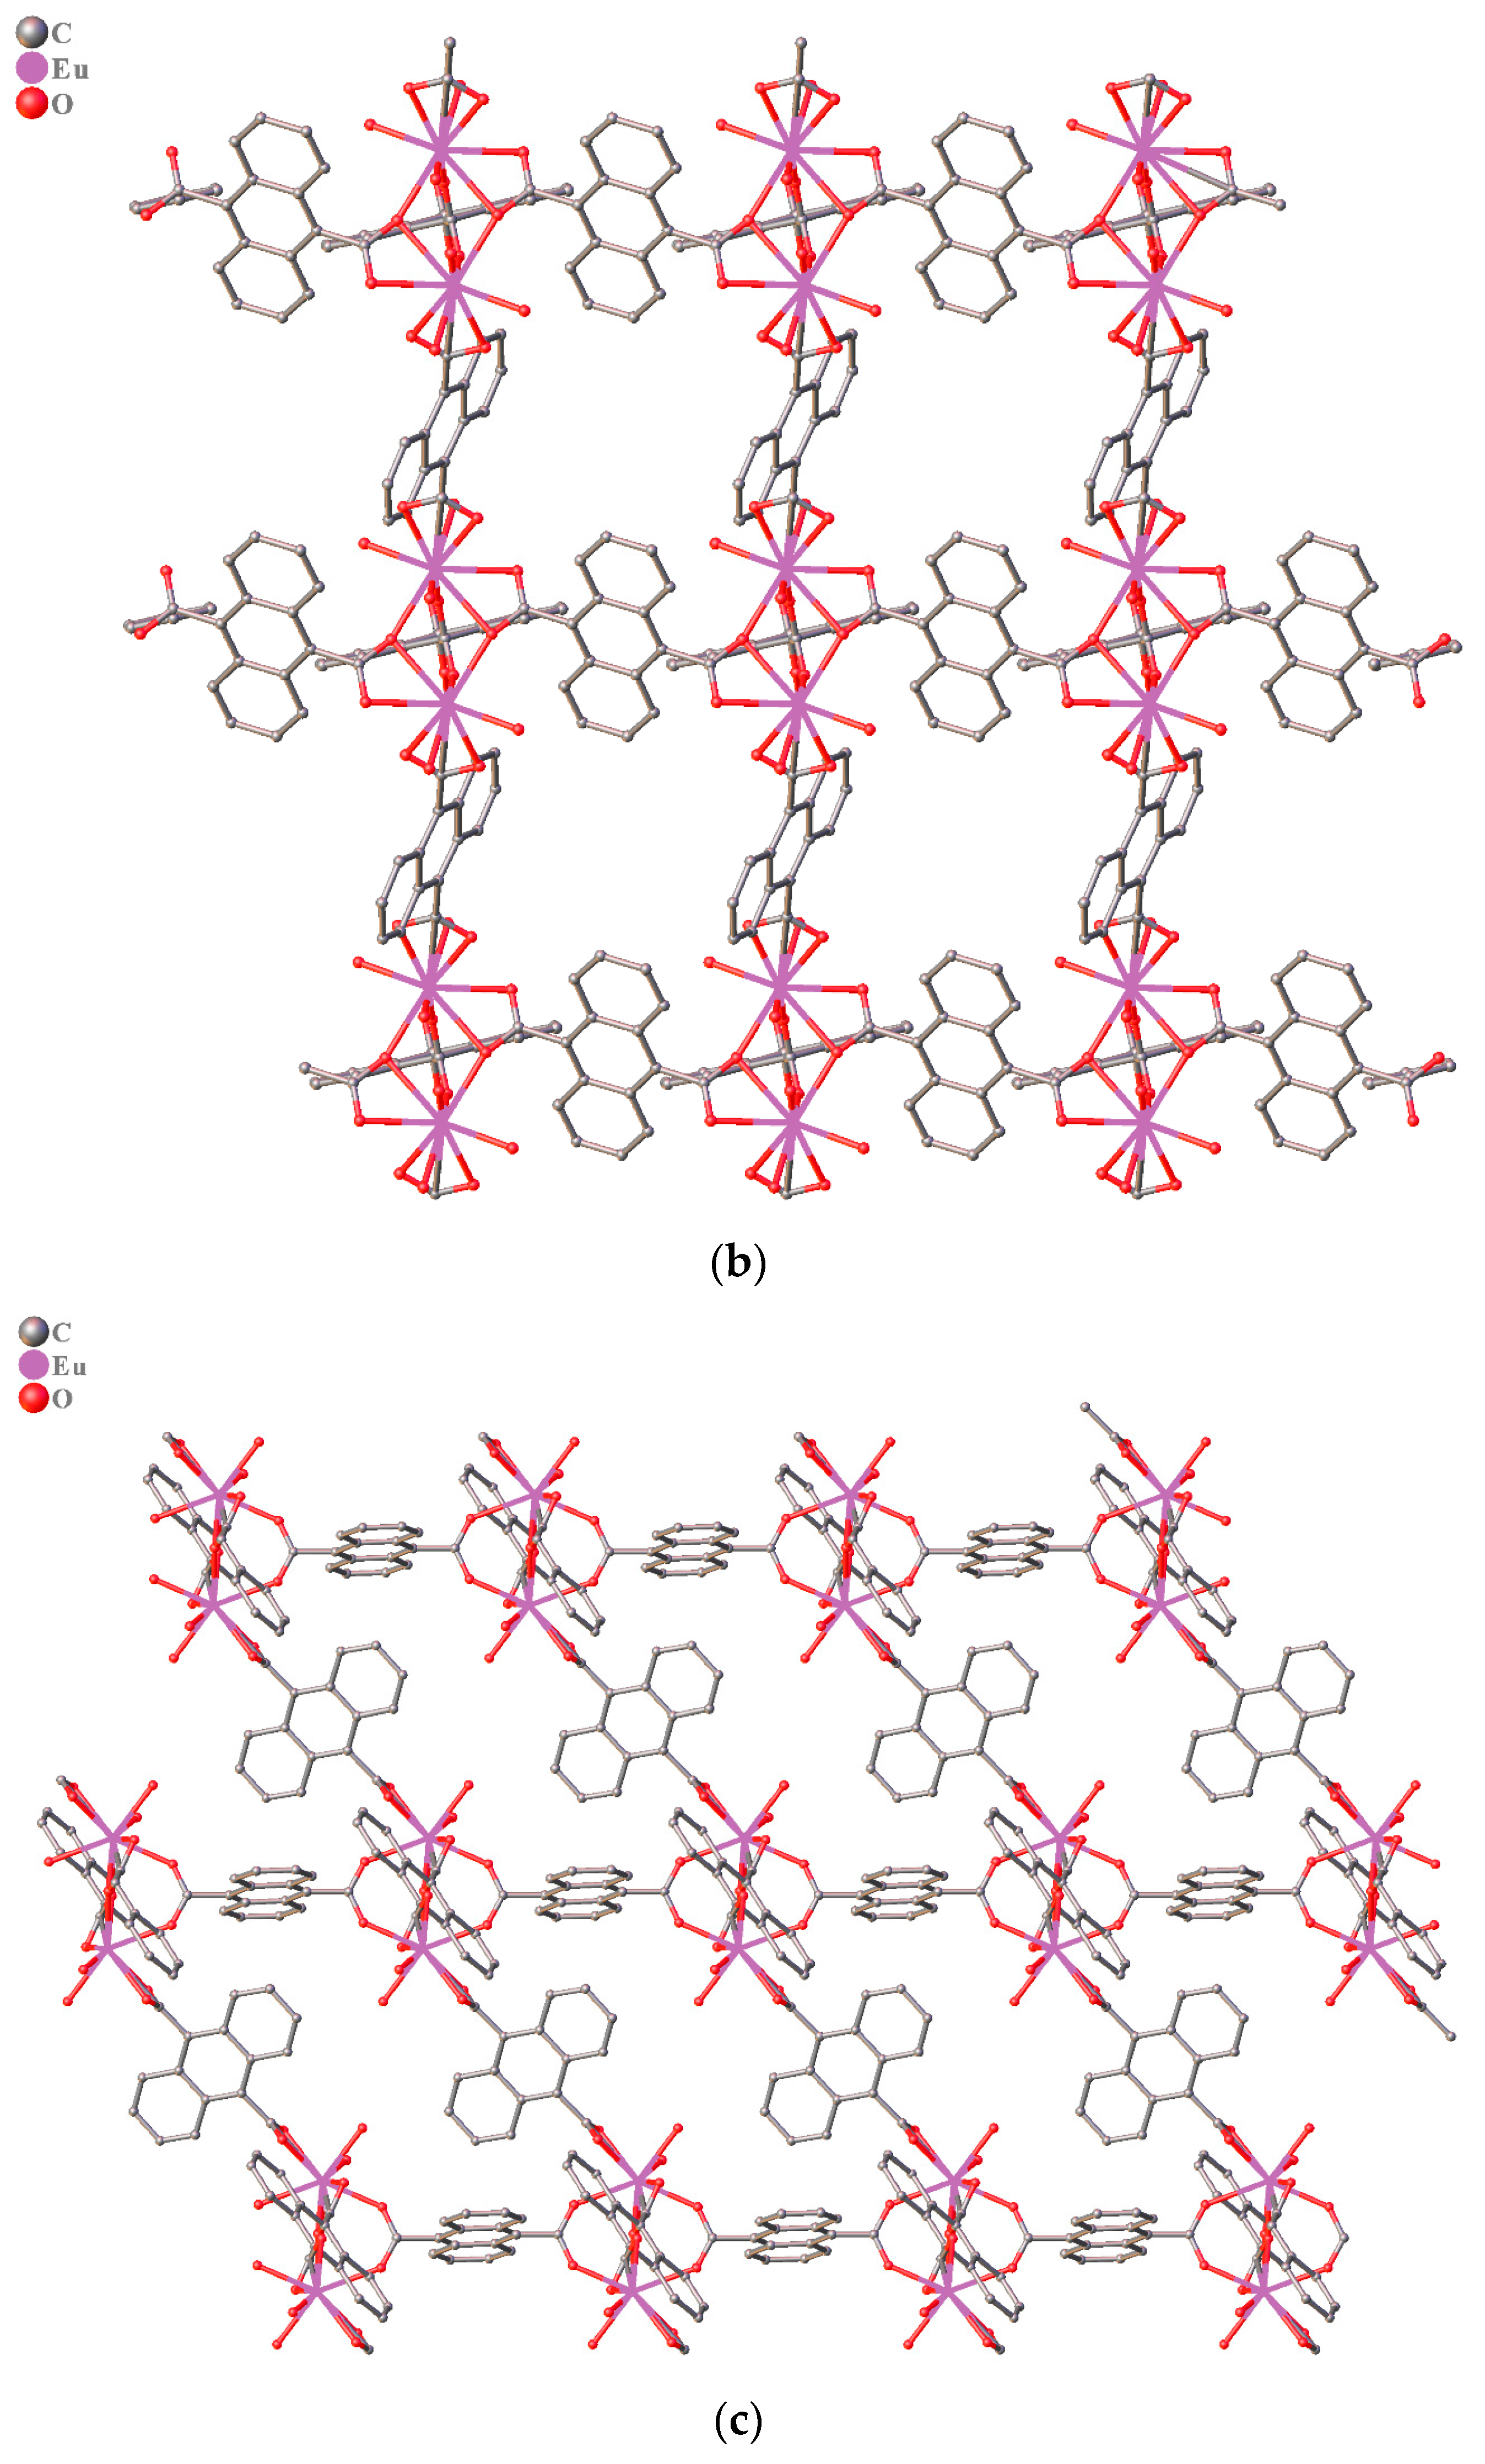
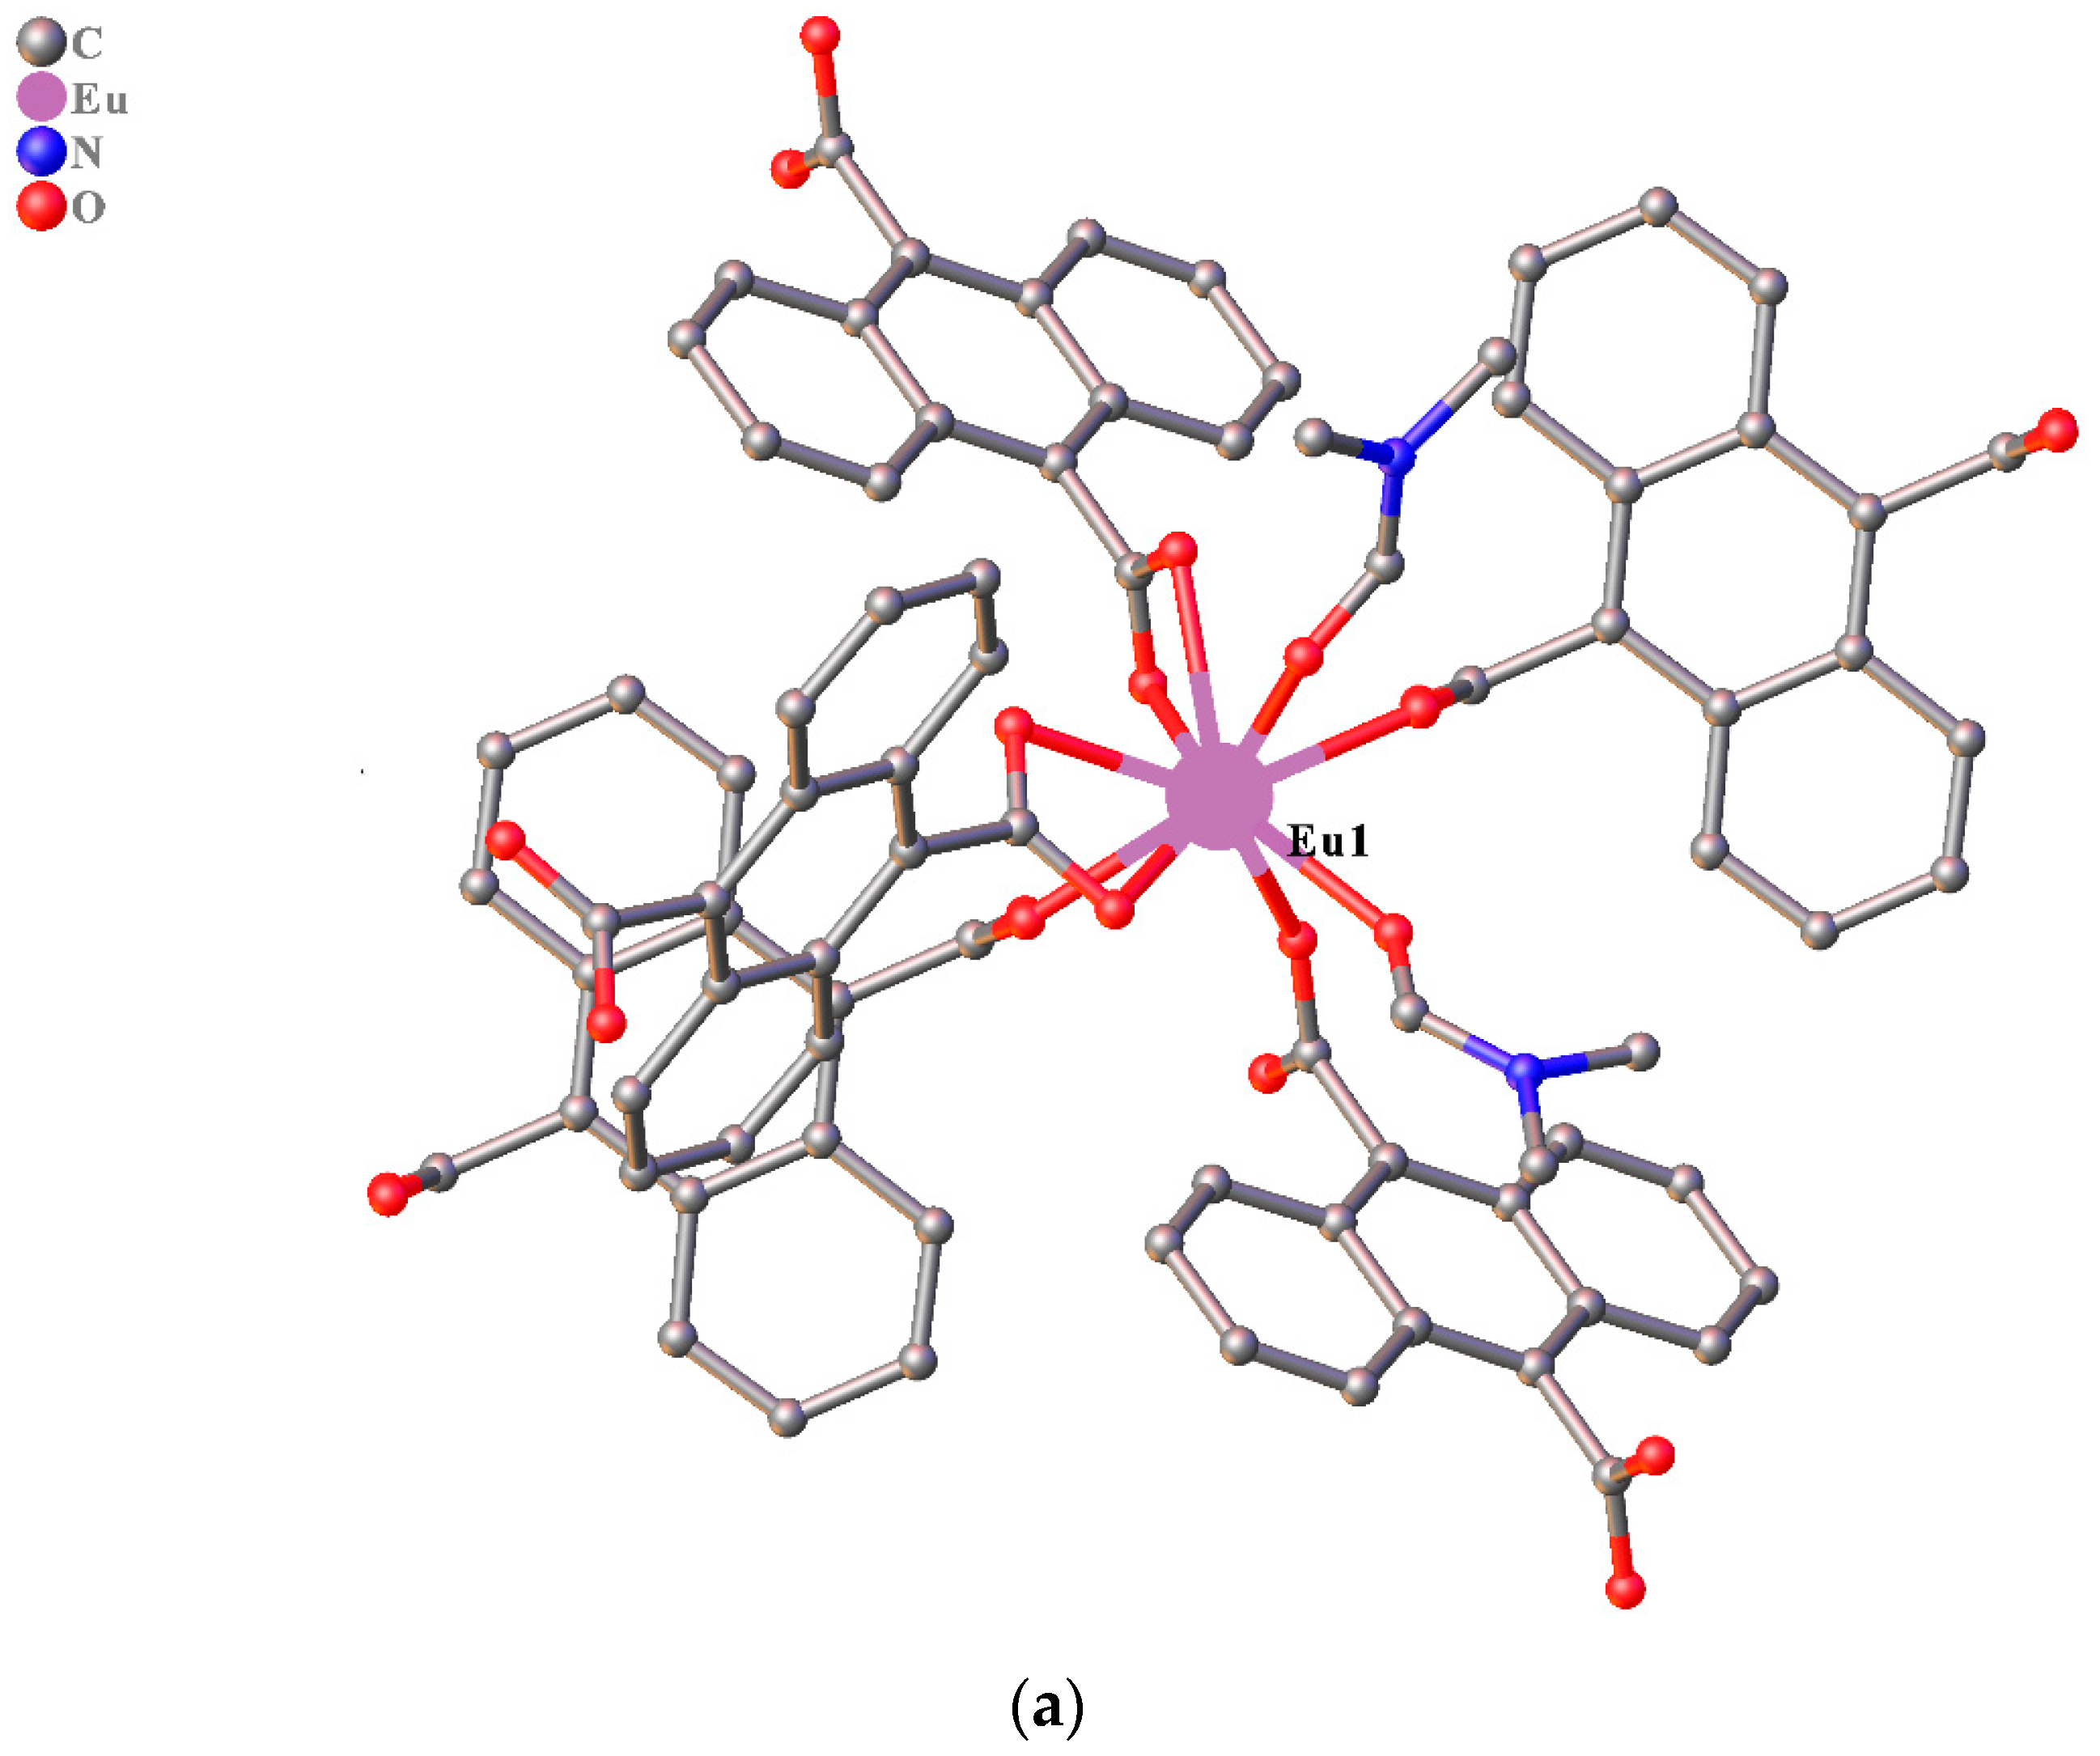
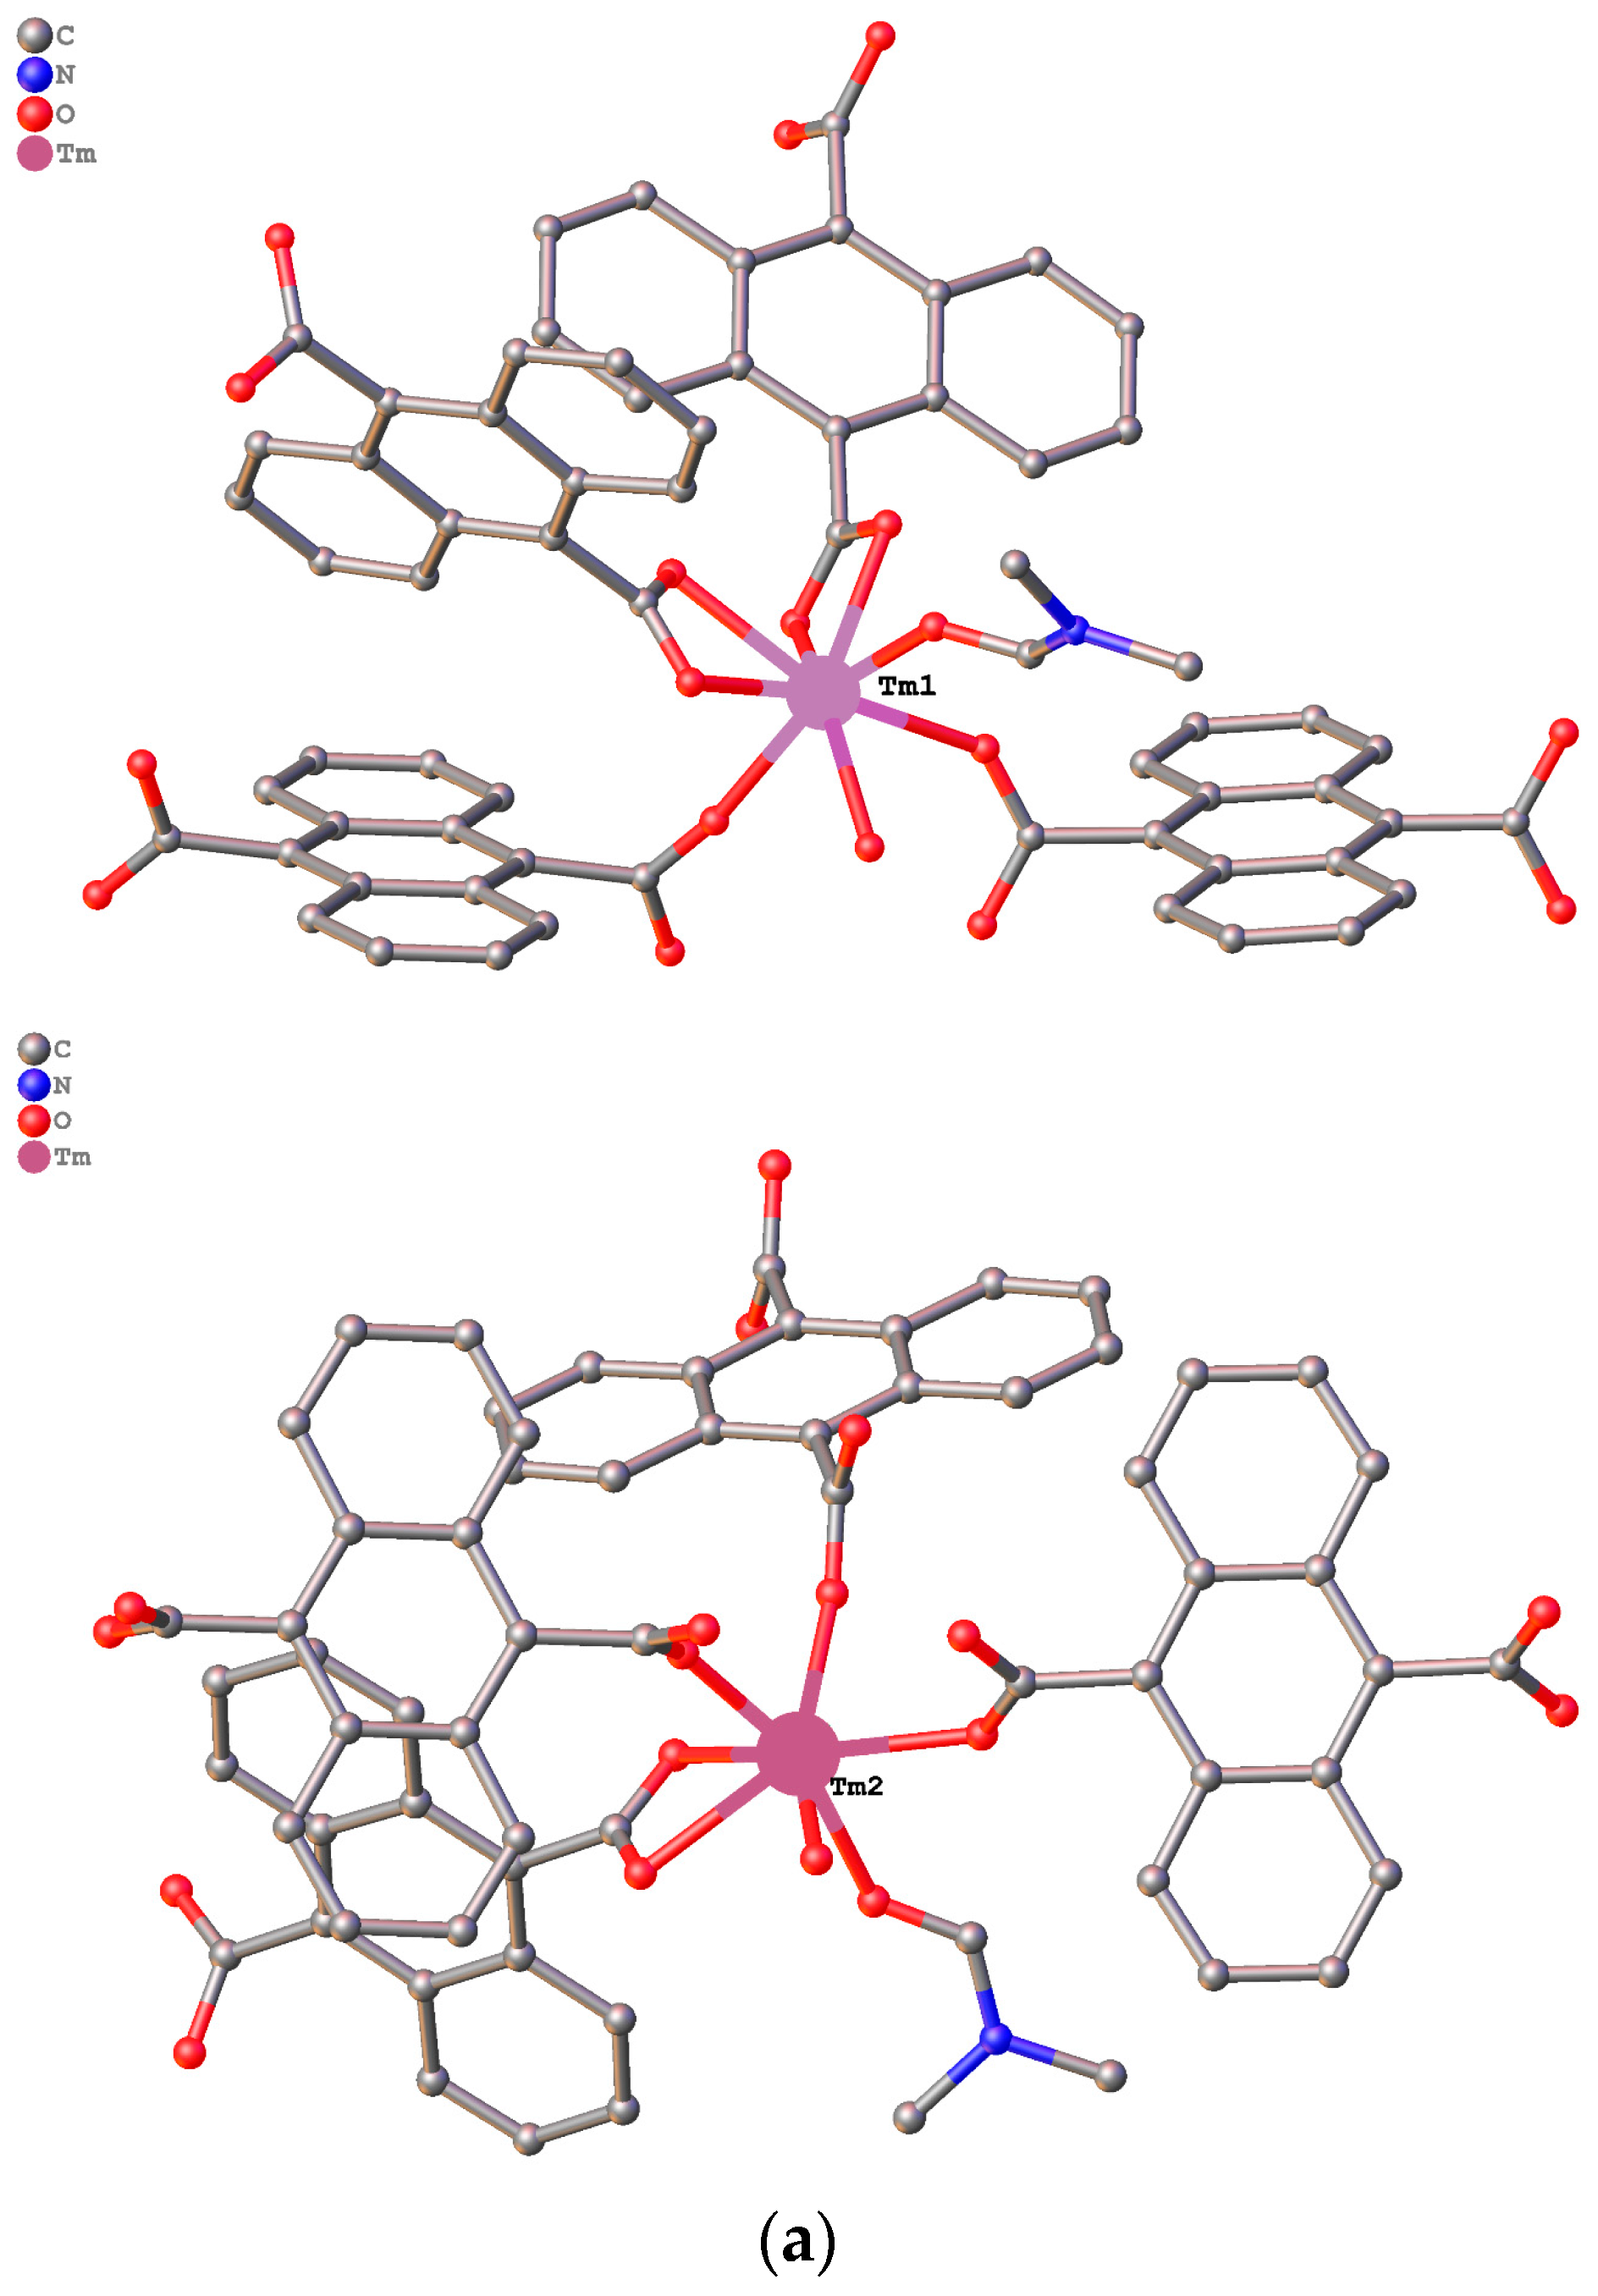
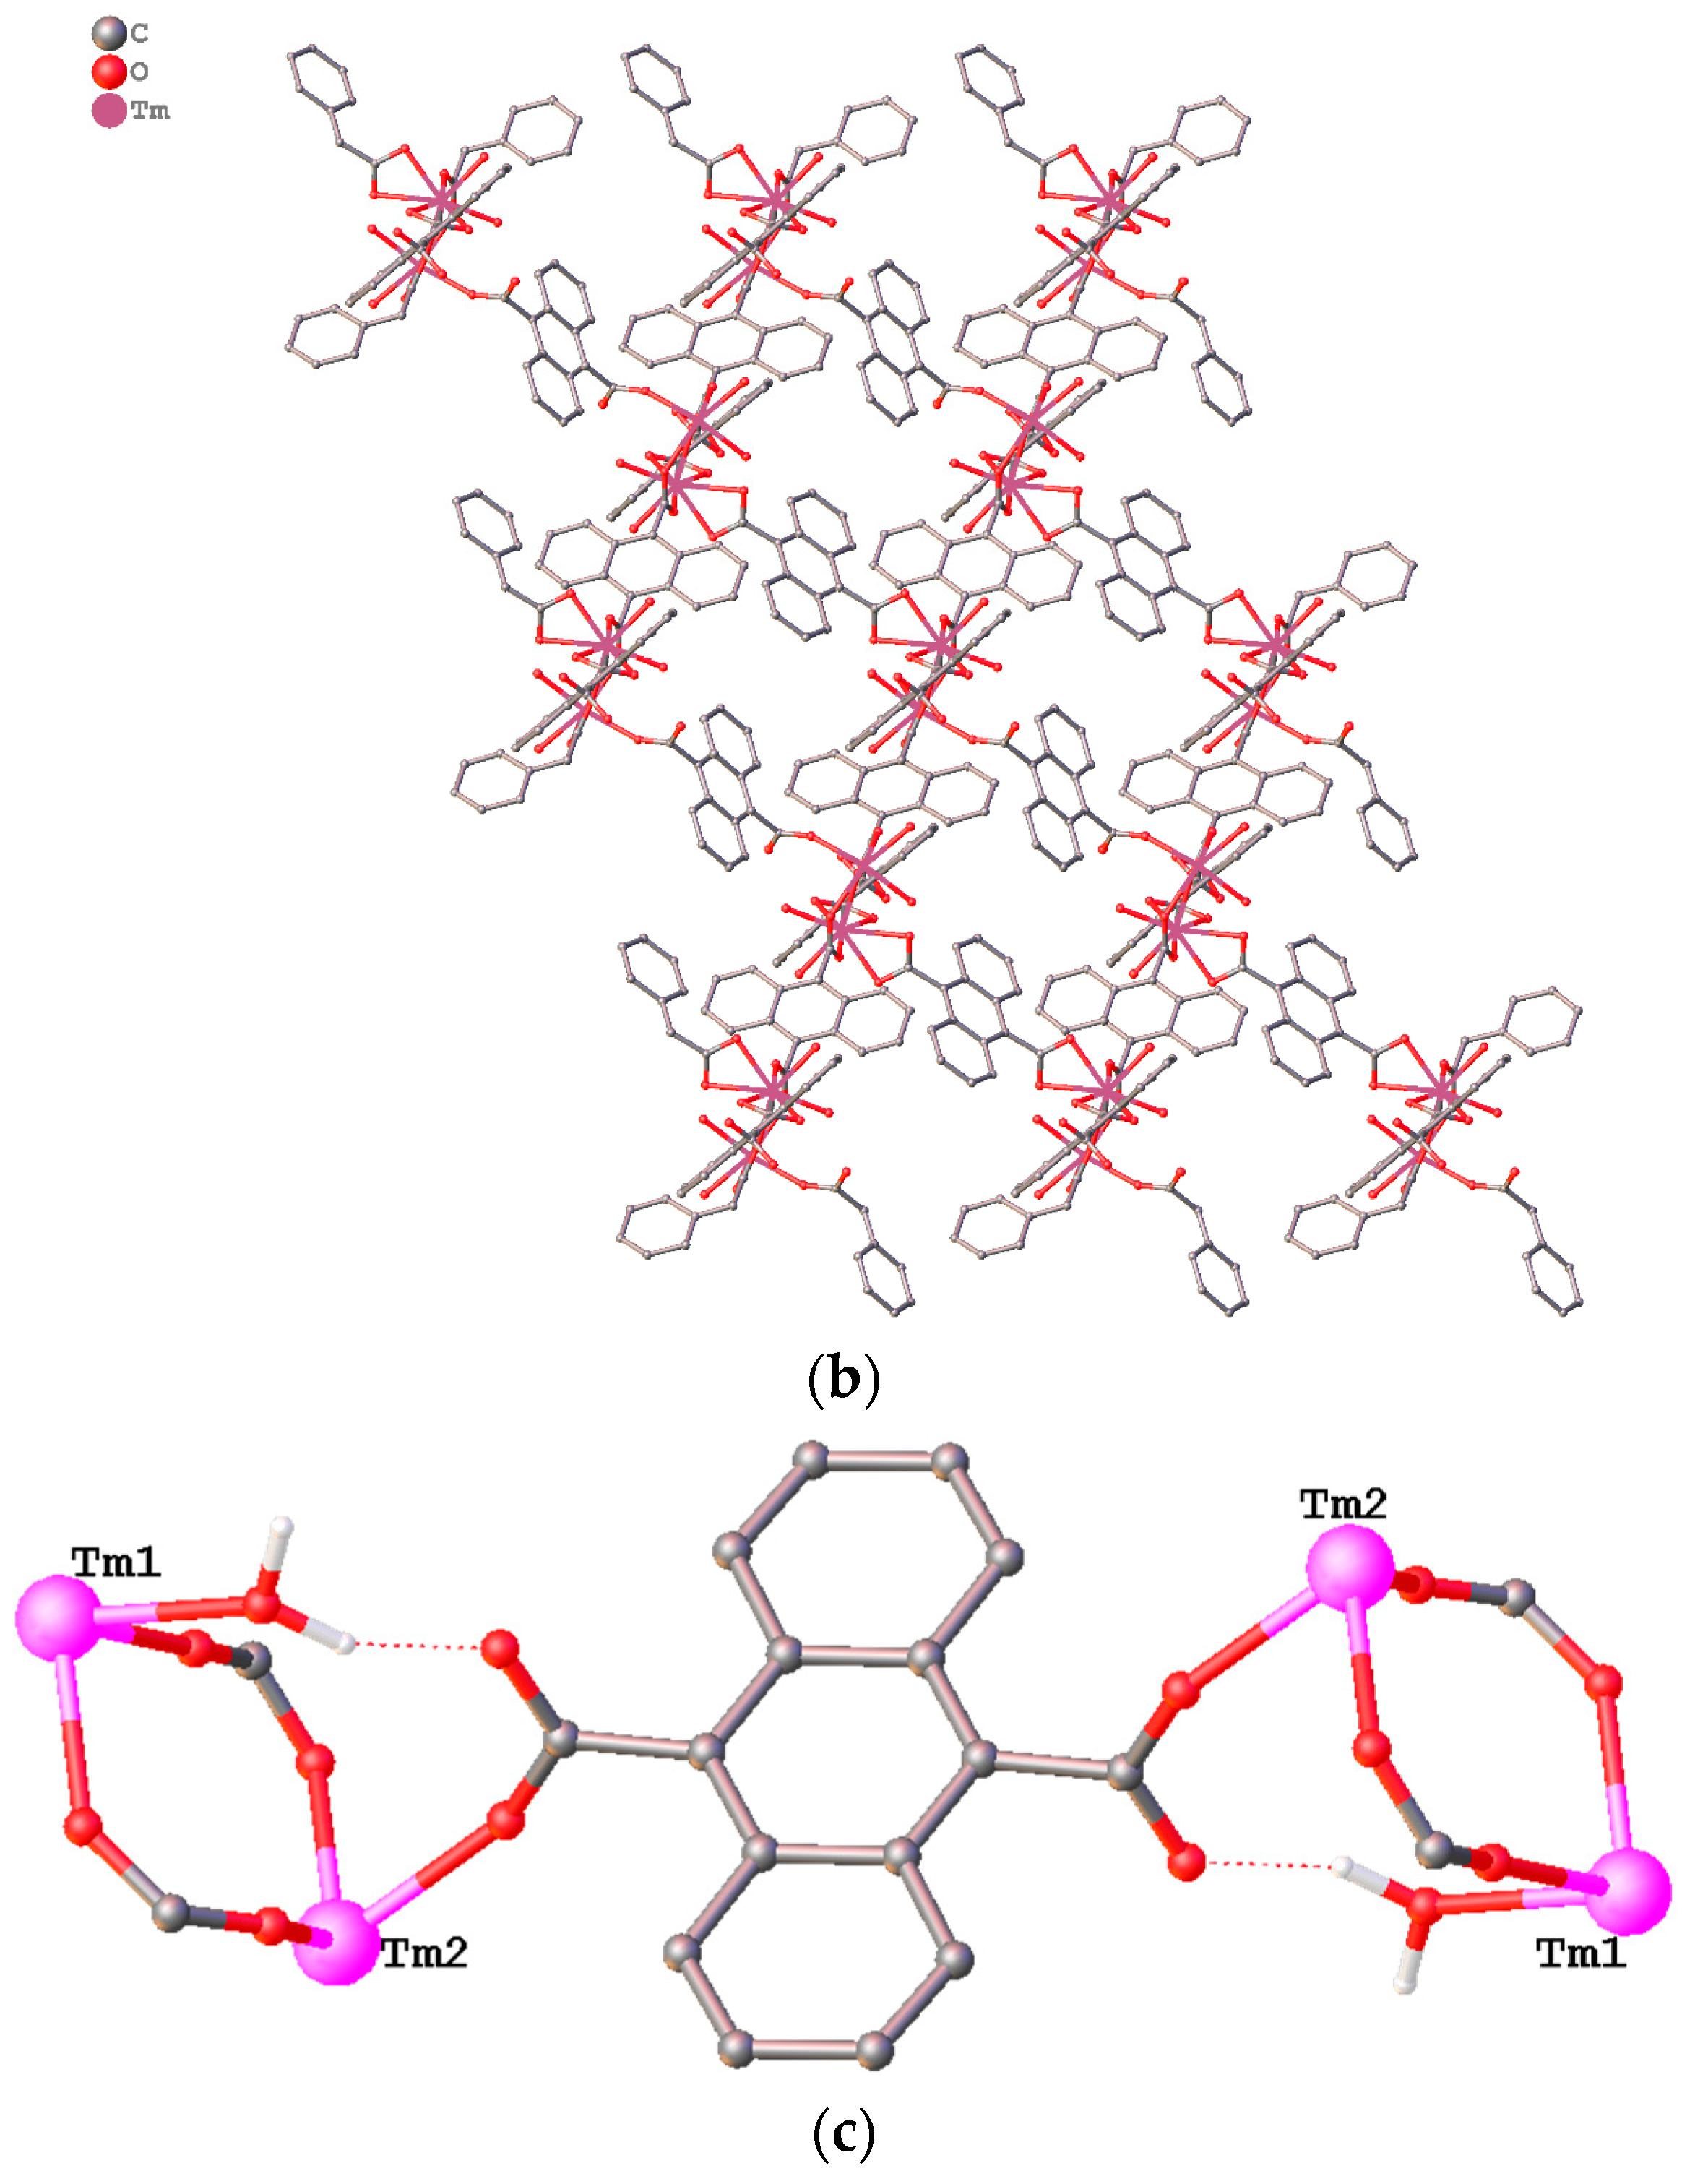
3.1. Structure Description

Structure description of 1 and 2: The PXRD patterns of 1 (Eu) and 2 (Tb), along with the simulated profile of 2, show peaks in identical 2θ positions for both (Electronic Supplementary Information (ESI) Figure S1). The MOFs also show identical PXRD profiles as the simulated pattern of 1, which confirms that each sample crystallizes as a pure phase. Crystal structure data for single SCXA are presented in Table 1. Both PXRD and SCXA analyses show that 1 and 2 are isostructural, so detailed analysis is given for 1 only. The crystal structure of 1 refines in a triclinic P-1 space group as a 3-D coordination polymeric network, with minimum voids and no measurable porosity.
Metal coordination: Structure 1 consists of two crystallographically identical Eu atoms per unit cell. There are five ADC units and two DMF molecules surrounding each Eu1 atom (Figure 1a). The Eu1 atom has nine coordinates, all with Eu1–O bonds. Seven Eu–O bonds are with the oxygen atoms from the five ADC ligands and two Eu1–O bonds are with oxygen atoms of two DMF molecules, generating an irregular EuO9 coordination polyhedron. A list of select bond lengths and angles for 1 and 2 is presented in Table S1. The Eu–O bond lengths range from 2.363(1) Å for Eu–O3 to 2.572(2) Å for Eu–O1 and are similar to those observed in related coordination polymers [33,34]. The two Eu atoms are bridged by the oxygen atoms of two ADC ligands, with O1 atoms coordinating to Eu1 and creating an intradinuclear Eu···Eu distance of 4.036 Å.
Ligand coordination: The ADC unit coordinates in three modes, namely, μ23 (bis-bridging-chelating), μ22 (bis-bridging), and η2 (bis-chelating). The bridging ligands link four metal atoms, whereas the bis-chelating ligands involve the linking of two. Various interconnected polymeric chains can be identified in the structure. Along the (100) direction, -(ADC-Eu2)n- chains are present, with the ADC units coordinating Eu atoms in bis-bidentate chelating mode, and with two adjacent Eu1 atoms bridged by oxygen atoms of the ligands carboxylate functional group (Figure 1b). Along the (010) direction, -(ADC-Eu2)n- chains are also present, with the ADC units coordinating Eu atoms in bis-bidentate bridging/chelating mode through the ligands’ carboxylate groups. Each Eu atom is coordinated by three carboxylate oxygen atoms, and each carboxylate oxygen atom coordinates two Eu atoms. The -(ADC-Eu2)n- chains are also present along the c direction with the ADC units in bis-bidentate bridging mode; each carboxylate group coordinates two Eu atoms (Figure 1c). The nearest Eu···Eu distance along the length of an ADC unit is 11.4 Å. Interestingly, the carboxylate groups are significantly twisted outside the plane of the anthracene moiety and measure 63.6° (C6-C2-C1-O2) for the bis-chelating, 85.8° (C11-C10-C9-O3) for the bis-bridging, and 68.7° for the bis-bridging/chelating ligands. The twisting of the carboxylate groups, as compared to a coplanar configuration, is consistent with reported DFT calculations on the parent H2ADC molecule, which showed its potential energy to be at a minimum with a 60° rotation of the COOH group [35]. The interconnectivity of the chains through the Eu1 atoms creates a 3-D arrangement, with channels along the b axis and the coordinated DMF solvent inside. Though non-continuous solvent accessible voids constitute 11% of the structure, nitrogen adsorption analysis at 77 K on the activated sample of 1 shows no appreciable porosity.
Structure description of 3 and 4: The PXRD patterns of 3 (Er) and 4 (Tm), along with the simulated profile of 4, show peaks in identical 2θ positions (ESI Figure S2). The structures show PXRD profiles that are identical to the simulated pattern of 4, which confirms that they both crystallize as pure phases. Both PXRD and SCXA (Table 1) show that 3 and 4 are isostructural, so detailed analysis is given for 4 only. The structure is a 3-D network consisting of two crystallographically inequivalent Tm atoms, six ADC ligands, two coordinated, and two lattice, DMF molecules, and two coordinated, and one lattice, water molecules.
Metal Coordination: The coordination environment for each of the two crystallographically inequivalent Tm atoms is shown in Figure 2. The Tm1 atom has eight coordinates. Six are Tm1-OCARB bonds with oxygen atoms from four ADC units, while the seventh and eight are Tm1-OH2O and Tm1-ODMF bonds, respectively (Figure 2a). The distorted Tm1O8 coordination polyhedron has Tm1-O bond lengths ranging from 2.228(2) Å for Tm1-O10 to 2.512(3) Å for Tm1-O3, and O-Tm1-O bond angles ranging from 53.8(8)° to 89.1(4)°. The Tm2 atom coordinates seven oxygen atoms to form an irregular Tm2O7 coordination polyhedron (Figure 2a). There are five Tm2-OCARB bonds from four ADC ligands, one Tm2-ODMF bond, and one Tm2-OH2O. A list of selected bond lengths and angles are presented in Table S1. The Tm2-O bond lengths range between 2.219(3) Å for Tm2-O13 and 2.393(3) Å for Tm2-O5. The O-Tm2-O bond angles range from 55.7(3)° to 86.3(2)°. The Tm-O bond lengths are similar to those observed in related MOF structures [12]. The intradinuclear Tm1···Tm2 distance measures 4.687 Å.
Ligand coordination: Three coordination modes can be identified for the ADC linker, namely, bridging (μ22), bis-chelating (η2), and bis-monodentate (η1). The bis-chelating ligands coordinate Tm1 and Tm2 atoms along both the b and c axes to create a 2-D “ladder-like” conformation, with the “ladder rungs” along the b axis (Figure 2b). The “ladder” structure is like that reported by Wang et al. in a related but different structure [13]. Along the b axis, the bis-chelating and bis-monodentate coordinating ADC units are coordinated to Tm1···Tm2 centers in an alternating arrangement. The bis-bridging ADC units, which are aligned along the a axis, intersect the 2-D ladder arrangement at the bimetallic Tm1···Tm2 centers to complete the 3-D network (Figure 2b). As in the case of 1 and 2, the carboxylate groups are significantly twisted outside the plane of the anthracene moiety, with a twist angle of 62.2° (C30-C27-C26-O7) for the bis-bridging ligand and 77.6° (C3-C2-C1-O2) for the bis-chelating ligands. As discussed earlier, the twisting is dictated by the minimum energy conformation from the 60° rotation of the carboxylate, as shown by DFT calculations [34]. The uncoordinated oxygen atoms of the carboxylate groups on the bis-monodentate coordinating ADC units form strong hydrogen bonds with nearby coordinated water molecules, thus further stabilizing the ligand and providing restriction to its rotation (Figure 2c). The closest interchromophore distance is 12.5 Å. Narrow channels are present along the b direction. However, like 1, nitrogen adsorption analysis at 77 K on an activated sample of 4 shows no appreciable porosity.
FTIR Analysis: The nature of the ADC units in the structures was further investigated by analysis of their Fourier transformed infrared spectra (FTIR) and a comparison with that of H2ADC (ESI Figure S3). The band at 3448 cm−1 in all samples indicates the presence of O–H from adsorbed water on the MOFs and on H2ADC. The 2925 cm−1 and 2967 cm−1 bands observed in H2ADC were assigned to weak intramolecular O⋅⋅⋅H bonds between non-planar C=O and H on the aromatic ring at the 1, 4, 5, and 8 carbon positions. These bands were not observed in 14, and their absence is attributed to C=O coordination to the metal atom, thus limiting their interactions with aromatic H. The band observed at 1687 cm−1 in the spectrum of H2ADC is attributed to the HO–C=O, with localized charges on the ligand’s carboxylic acid functional groups. This band was not observed in 14; instead, two individual bands were observed at 1601 cm−1 and 1551 cm−1, which are attributed to variation in stretching vibrations of the C–O bonds in the three different ligand conformations. These observations indicate that the ligand is deprotonated (as ADC) within the MOF structures. The band at 1562 cm−1 in the MOF spectra is attributed to of metal-oxygen bonds [36].
Thermal Analysis: The thermal behavior of the structures was investigated by thermogravimetric analysis. The TGA curves of 1 and 2 show weight loss between 100 and 450 °C representing the loss of coordinated and uncoordinated DMF molecules (~30 wt %). Weight loss commencing around 440 °C (~40 wt %) is attributed to the loss of ADC units, and residue (~30 wt %) is attributed to lanthanide oxides. The TGA curves of 3 and 4 show small weight loss events up to 100 °C, attributed to the loss of H2O molecules (~10 wt %). Weight loss up to 400 °C (~15 wt %) is attributed to loss of DMF. Weight loss event commencing around 400 °C (~45 wt %) is attributed to the loss of ADC units, and residue (~30 %) is attributed to lanthanide oxides.

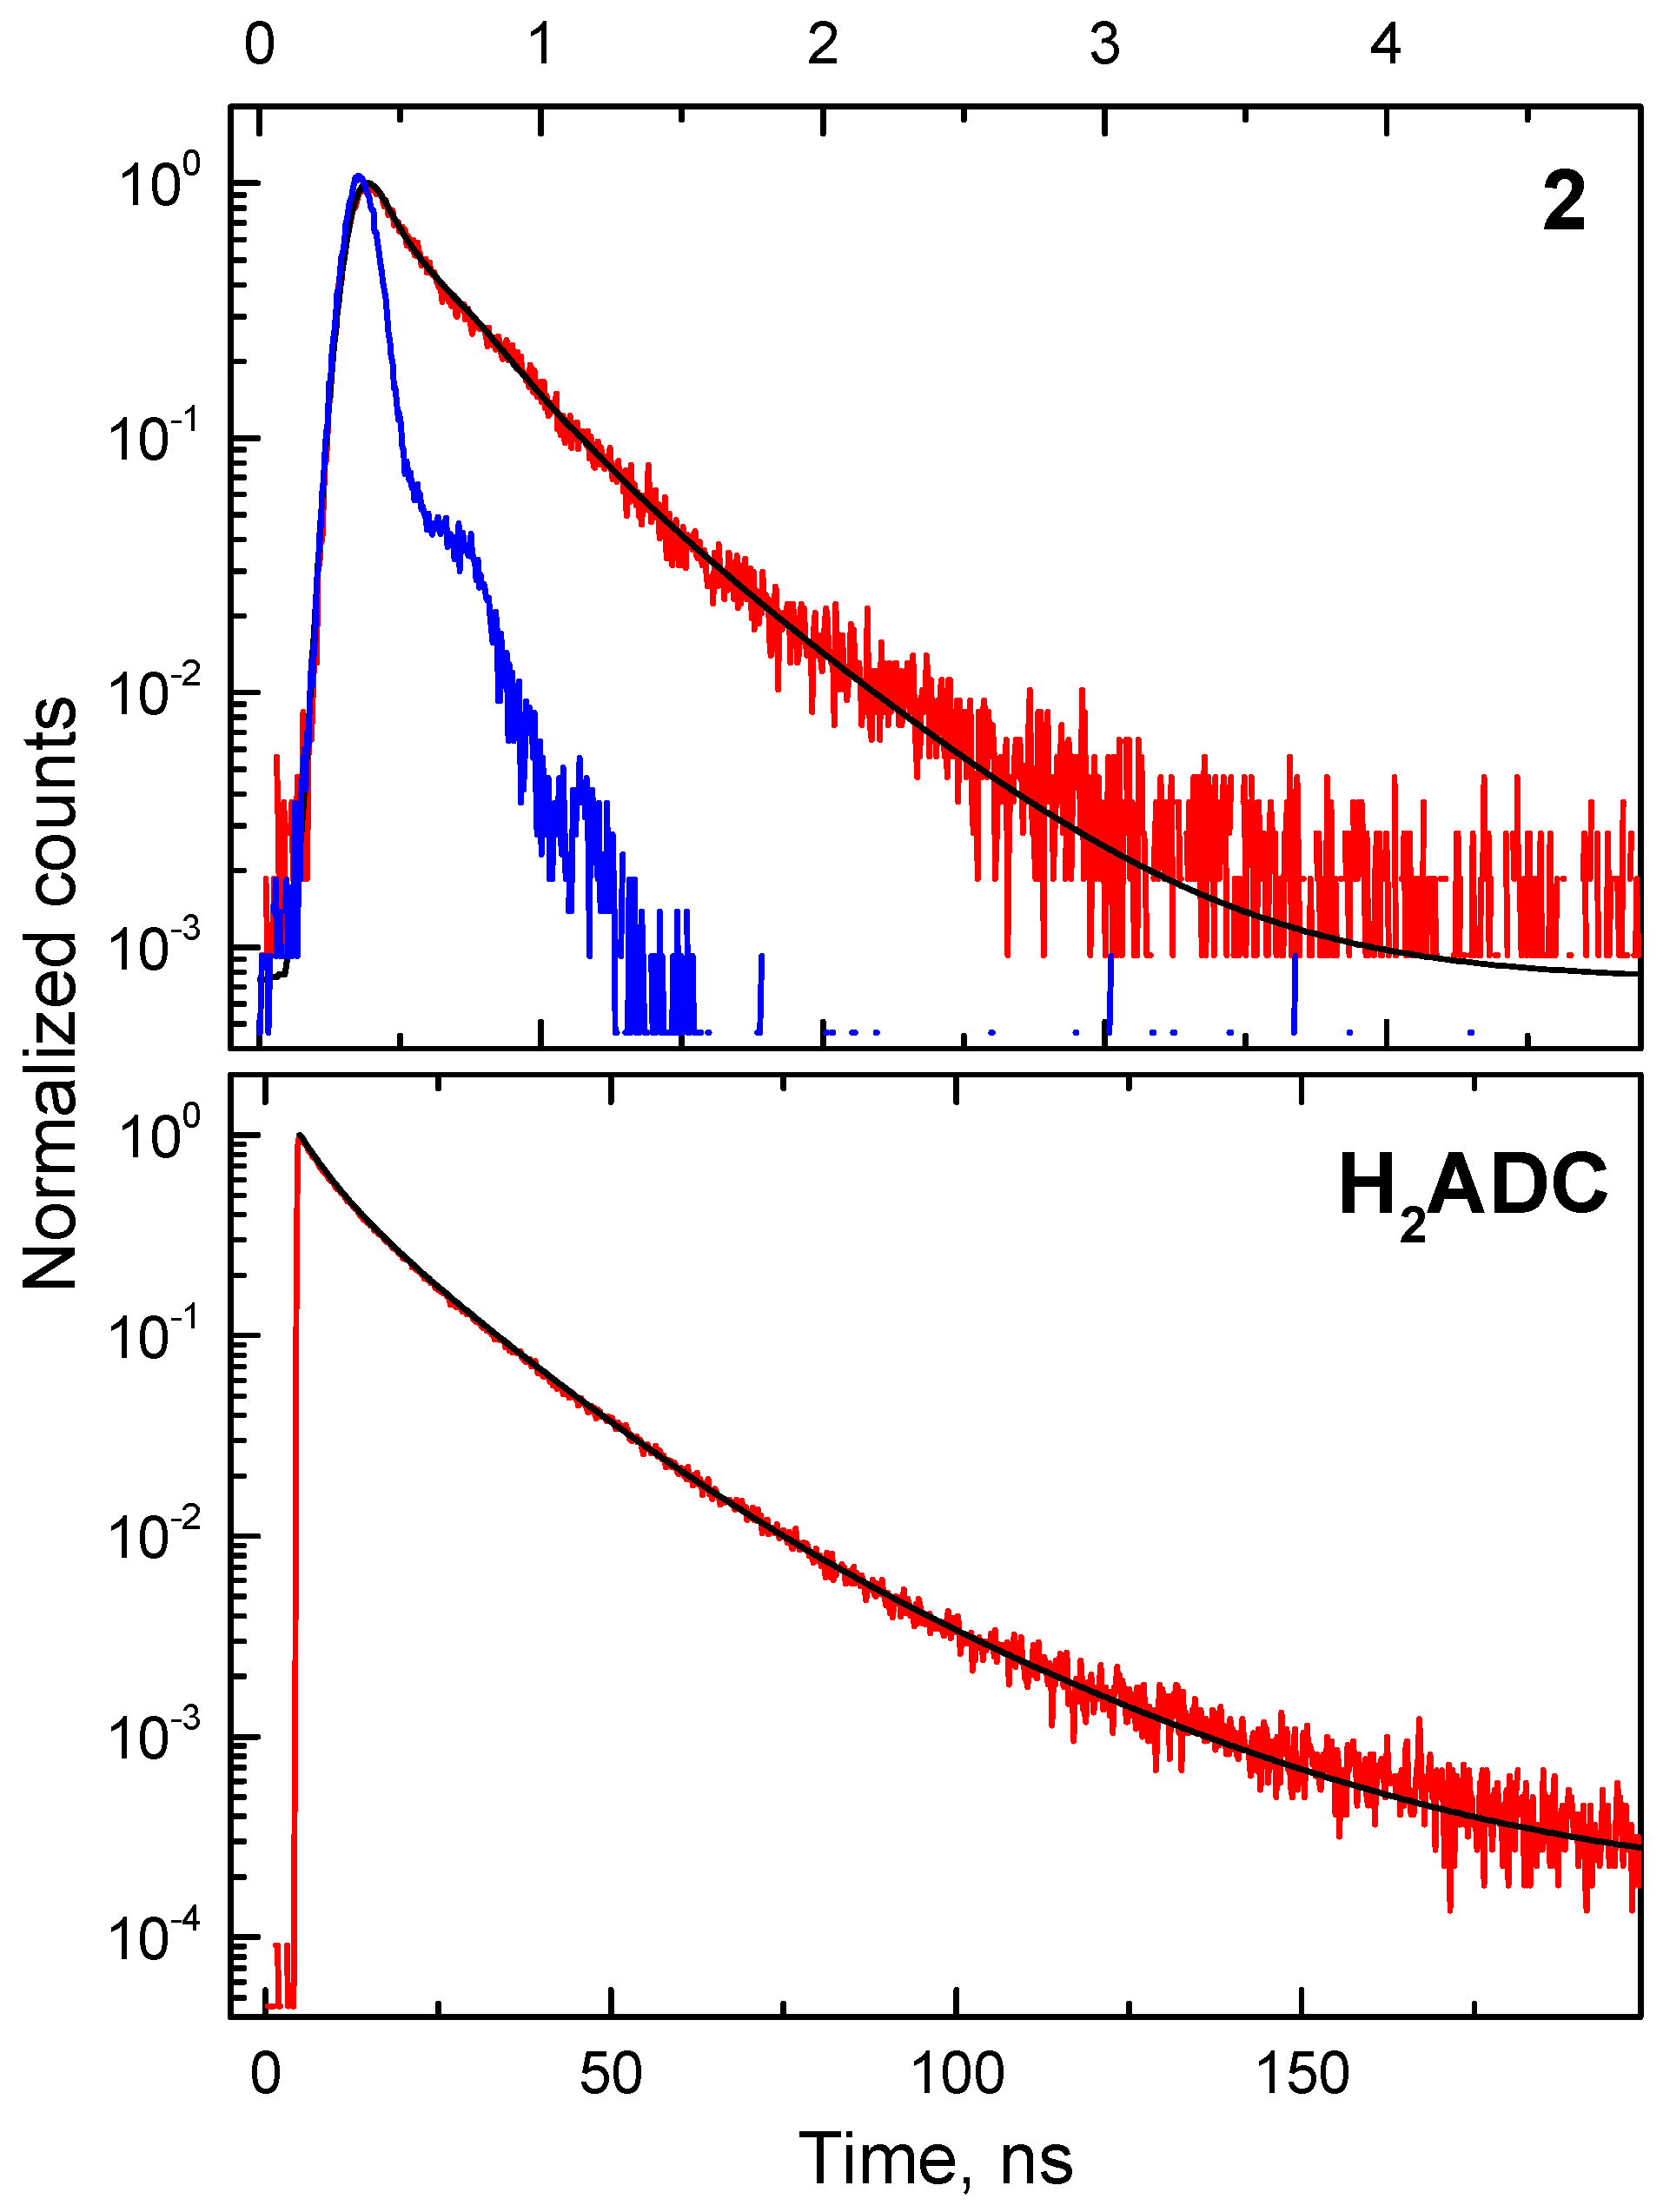
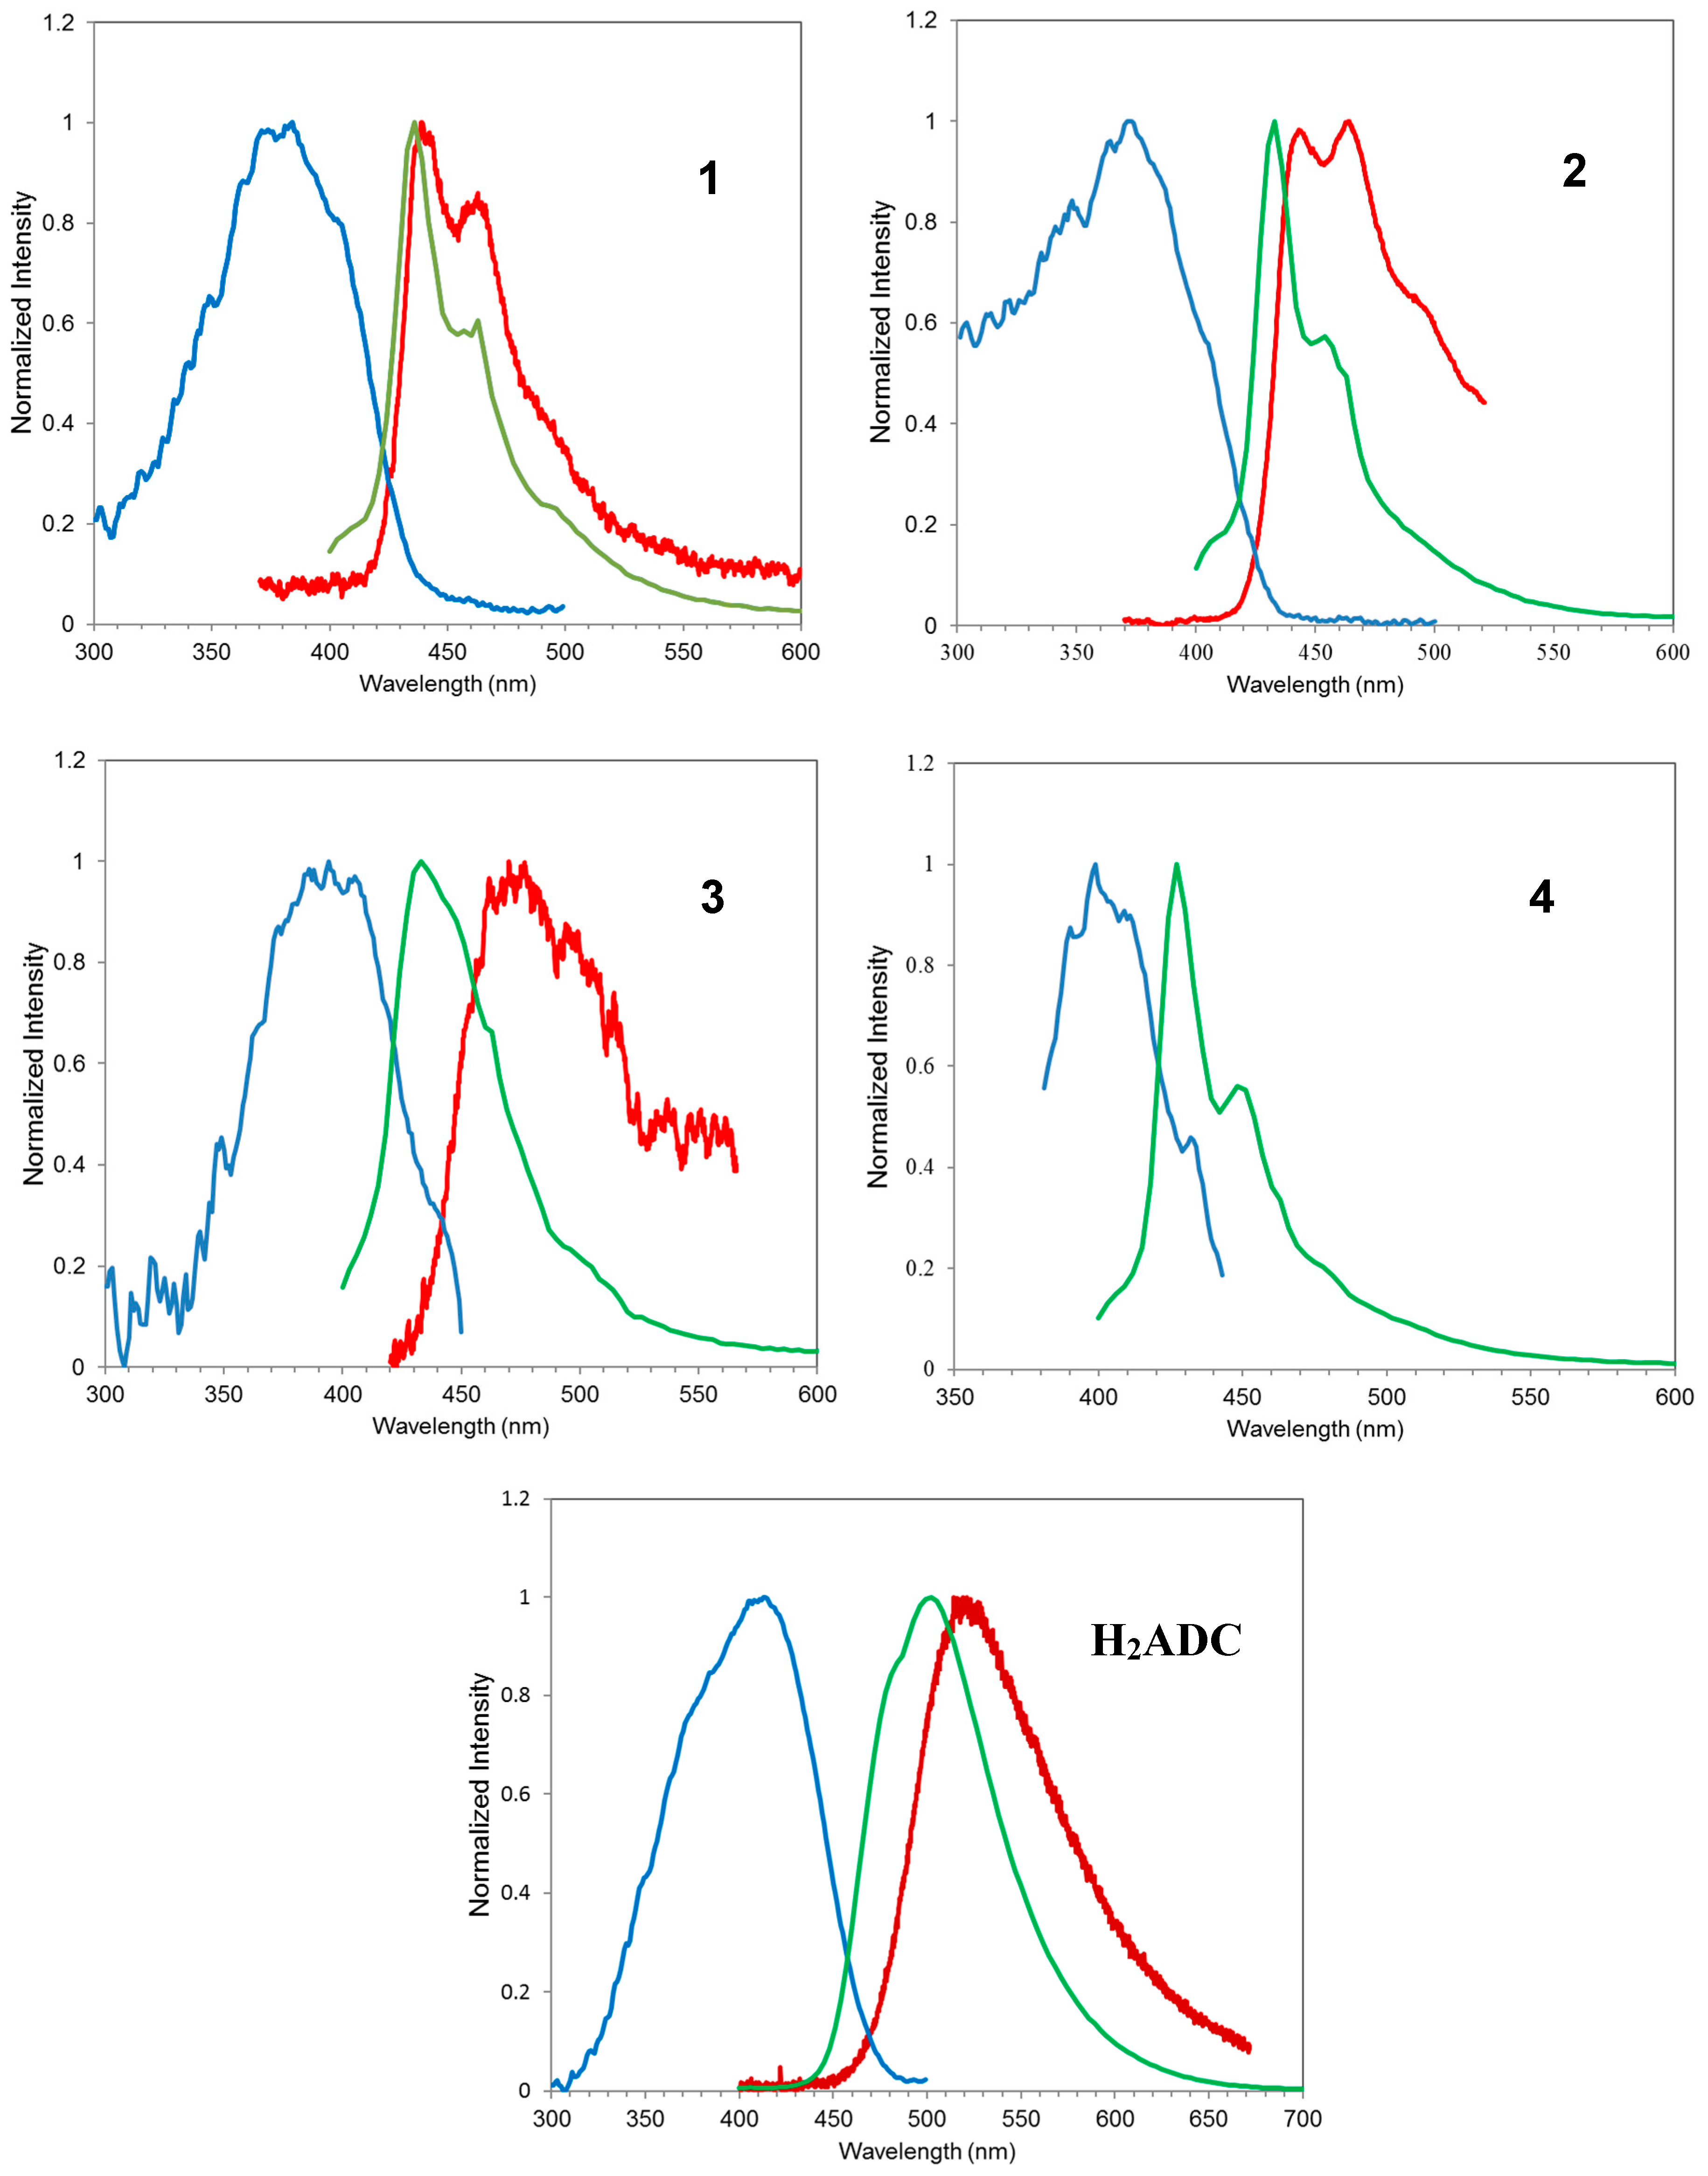
3.2. Photoluminescence

The photoluminescence behavior of each compound was investigated. The room temperature solid-state photoluminescence emission spectra of the structures along with that of solid H2ADC are presented in Figure 3. The spectrum of Na2ADC in dilute aqueous solution was also recorded for comparison (ESI Figure S5). The spectrum of Na2ADC in aqueous solution shows two defined vibronic peaks: one with λmax at 425 nm and a shoulder at 450 nm. This is similar to that reported for pure anthracene [37], except that a smaller left shoulder peak expected at ~400 nm was not defined. The MOF structures (except 3) show emission spectra with distinct vibronic peaks that are similar in profile to those observed for Na2ADC in aqueous solution, thus suggesting that the emission is linker-based.
The emission peaks from the structures are within the 400–600 nm region, with their wavelength maxima (λmax) observed between that of the Na2ADC in dilute aqueous solution at 425 nm and that of the H2ADC powder at 500 nm. The emission maxima of the structures are therefore red-shifted compared to the ADC sodium salt solution and blue-shifted compared to the H2ADC powder. Further, a Stokes shift was observed among the structures as follows: 60 nm for 1 (380 nm ex-max to 440 nm em-max), 65 nm for 2 (380 nm ex-max to 435 nm em-max), 50 nm for 3 (389 nm ex-max to 430 nm em-max) and 30 nm for 4 (400 nm ex-max to 430 nm em-max), all of which are smaller than the 87 nm observed for H2ADC. Except for 4, the Stokes shift values are larger than the 41 nm observed in Zn-PCN-14, which contains the larger and rotatable anthracene liker, 5,5′-(anthracene-9,10-diyl)diisophthalinic acid (DPATC) [2]. With the exception of Structure 3, the peaks are more defined than those observed in Zn-PCN-14. By comparison, the emission spectrum of H2ADC is broad with less defined peaks and a larger Stokes shift (Figure 4). The broad spectral features of H2ADC are likely ascribed to changes in the excited state geometry of the molecule due to the rotation of its –COOH groups to near coplanar conformation with the anthracene moiety. This can result in a lower energy excited state complex due to increased resonance, π overlap, and charge transfer interactions between the functional group and the ring system [34]. However, the ADC units in Structures 14 are deprotonated and are rigidified by coordination to the metal atoms. Rotation of the carboxylate groups is expected to be restricted as a result. This ridification, coupled with the separation of individual ADC units in the structures, will therefore reduce the level of interligand interactions and, by extension, reduce the extent of non-radiative relaxation pathways that would otherwise exist in solid forms of both anthracene and H2ADC.
Within each structure, the cofacial alignment of ADC units in the (100) direction is interrupted by ADC units in the (010) direction. The closest cofacial distances are 14.5 Å in 1 and 12.5 Å in 4, which are beyond the distance within which significant interchromophore coupling interactions among the phenyl rings of ADC units would be present [38]. The nearest distances between the planar face of one anthracene moiety and the hydrogen atoms on the edges of another, range between 3.689 (H12···C3) and 5.242 Å (H12···C7) for 1, and between 3.397 (H4···C24) and 5.542 Å (H4···C21) for 4. These edge-to-face distances are in the range within which C–H···π interactions are possible between the-orbitals of the hydrogens and the π system of the anthracene moieties. Such interactions could contribute to the non-radiative decay pathways and to the observed Stokes shifts. The broad featureless emission spectrum of 3 could be the result of more severe structural changes that brought ADC units closer on exposure to UV excitation. The possibility of the inductive effects of the Er atoms on the linker that can cause perturbation of the electronic transitions occurring in the ligand to result in more diffuse spectrum is also worthy of consideration and warrants further investigation.
Of note is that no luminescence spectral features from the lanthanide ions were detected in the visible region (for Eu3+ and Tb3+) and were not measured in the near-infrared region (for Tm3+ and Er3+) which is beyond the range of our standard fluorimeter. It is speculated, however, that following direct excitation the photoemissions of the latter two metals ions would be weak or non-existent due to their low molar absorption coefficient (typically lower that 10 L mol−1 cm−1) [1,2,3,4].
Time-resolved photoluminescence decay: Time-resolved photoluminescence measurements were also acquired to further investigate the local environment of the anthracene units in the 3-D networks. Structures 1 Eu (not shown), 3 (Er), and 4 (Tm) yielded photoluminescence decay curves of low intensity that almost overlap with the instrument response function (IRF) (ESI Figure S6), while the decay curve for 2 (Tb), like that of H2ADC, was quite distinct from the IRF (Figure 4). The decay curves were fitted with the biexponentional function, I = α 1 exp ( τ τ 1 ) + α 2 exp ( τ τ 2 ) , which corresponds to two different photo emissive rates, where I is the intensity, τ is the time, τ1 and τ2 are their corresponding excited state decay lifetimes, and α is the pre-exponential factor. The faster a radiative lifetime a major component has, the more τ1 is attributed to emission from monomeric-like ADC units, and the more τ2 is attributed to ADC units involved in coupling interactions, as observed for anthracene dimers. For Structure 2 (Tb), lifetimes τ1 = 0.2 ns and τ2 = 0.5 ns and weighted average lifetime τo = 0.3 ns are much shorter than the 4.9 ns, 16 ns, and 9.5 ns, respectively, we determined for H2ADC (ESI Table S2). These lifetimes are also shorter than the average lifetime value of τo = 2.0 ns reported elsewhere for anthracene in monomeric isolated arrangements [39] and shorter than τo = 5 ns reported for Zn-PCN-14 [2].
As discussed earlier, changes in the excited state geometry of bulk ligand molecules due to the rotation of its –COOH groups to near coplanar conformation with the anthracene moiety and reorganization towards end-to-face herringbone arrangement, which can facilitate excimer formation and strong interchromophore interactions, are quite likely. This could have contributed to the much longer lifetime (τ2) compared to the MOF structures [8,34].
The short lifetimes observed for Structures 14 in comparison to those of H2ADC and Zn-PCN-14 suggest that there is significant fluorescence quenching in the structures. Similar quenching of ligand fluorescence in complexes of lanthanides ions, including Tb3+ and Eu3+ have been previously observed [40] and is postulated to occur by the energy transfer between the ligand and the paramagnetic lanthanide ions via a cross-relaxation mechanism.

4. Radioluminescence

Radioluminescence (scintillation) is the emission of radiation after a material absorbs radiation with energy generally ≥10 eV that leads to π-electron ionization (Iπ) [7]. The ionization is followed by ion recombination (the recombining of secondary electrons with their parent electrons) that populates available singlet (S) and triplet (T) states. This is followed by non-radiative thermal deactivation to the lowest vibrational level of the first excited state S1 before relaxation to lower electronic levels with an accompanying emission of radiation [41]. In this work, proton ion beam-induced luminescence (IBIL) spectroscopy was used to assess the radioluminescence spectral profile of the structures and H2ADC, as this is known to simulate the production of recoil protons by elastic scattering of fast neutrons within an organic scintillator [2].
The IBIL emission spectral profiles for Structures 13 are compared with their respective photoluminescence spectra and to that of H2ADC (Figure 3). The IBIL spectrum of 4 was not measured since the crystal faces were not of sufficiently large dimensions to fit the ion beam without penetration during data collection. The similarities in the IBIL spectral profile of 1 and 2 to their respective photoluminescence spectrum and to that of a dilute solution of Na2ADC show that the IBIL is a product of the MOF crystal only and not of any H2ADC impurities from synthesis or a result of any damage caused by the beam. Interestingly, for 1, its IBIL spectrum shows two distinct vibronic peaks at 440 and 460 nm that almost overlap its photoluminescence spectrum (though a small red shift was observed). The overlap is consistent with the local environment of highly isolated ligand units in the structure remaining unaltered upon exposure to the proton beam [42]. For structures 2 (with λmax-IBIL at 445 nm) and 3 (with λmax-IBIL at 475 nm), there are significant red shifts in the IBIL spectrum of each when compared with their respective photoluminescence spectrum. This also translates into Stokes shift values (between the photoluminescence excitation λmax and the λmax-IBIL) of 65 (445–380 nm) for 2 and 85 nm (490–375 mm) for 3, respectively. Interestingly also is that the IBIL emission peaks remained well defined in 2, while they are broadened and featureless in 3. These Stokes shift values are within close proximity of 78 nm reported for Zn-PCN-14 (which contains the DPATC linker) [2], but are much less than the 115 nm (515–400 nm) that we observed for H2ADC (Figure 3). These Stokes shifts and peak broadening (in the case of 3) suggest that the relaxation pathways described above may not be strictly observed due to changes in the molecular and/or electronic structures of materials on exposure to ionizing radiation. Such changes could possibly be a distortion of the chromophore environment, resulting in a shortening of inter-ligand distances and an increase in inter-chromophore interactions. It is notable also that, because of the significant Stokes shift, there was a relatively small spectral overlap between excitation and emission, and this is favorable for the use of the material as a scintillator in that self-absorption can be minimized [2].

5. Conclusions

The combination of lanthanide ions Eu3+, Tb3+, Er3+ and Tm3+ with the H2ADC under hydrothermal conditions yielded four 3-D anthracene-based lanthanide MOFs in two different structure types; the Eu and Tb MOFs are isostructural, as are the Er and Tm MOFs. The deprotonated ligand, ADC, assumes multiple coordination modes in the structures and its carboxylate functional groups are severely twisted away from the plane of the anthracene moiety, which is consistent with its lowest energy conformation. The structures possess very narrow channels and show no appreciable porosity. The structures exhibit ligand-based photoluminescence that is significantly quenched. The Tb-containing MOF was least quenched and showed an average photoluminescence lifetime, τo, of 0.3 ns. On exposure to ionizing radiation, the structures also show ligand-based radioluminescence.

Supplementary Materials

The following are available online at https://www.mdpi.com/2073-4352/8/1/53/s1. Figure S1: Powder X-ray diffraction patterns of 1 and 2, Figure S2: Powdered X-ray diffraction pattern of simulated 3 and 4, Figure S3: FTIR spectra of 14 and H2ADC, Figure S4: TGA curves of 14, Figure S5: Photoluminescence emission spectrum of 0.1 M aqueous solution of Na2ADC, Figure S6: Photoluminescence decay curves of structures 3 and 4, Table S1: Selected bond lengths (Å) and angles (°) for 14, Table S2: Photoluminescence lifetimes of 24 and H2ADC.

Acknowledgments

This work was supported by the United States National Science Foundation, Grants No. HRD-0630456, HRD-1305041, the National Nuclear Security Administration, Grant No. NA0000979, and the Department of Energy, Grant No. DE-FE0022952. We thank John Bacsa and the Crystallography Laboratory at Emory University, Atlanta, GA, for conducting single crystal X-ray analyses of the structures. We also thank Elizabeth Auden and Khalid Hattar of Sandia National Laboratory Albuquerque, NM, for assistance in radioluminescence measurements. The authors are grateful to Rob Dickson and his group at Georgia Tech for the help with fluorescence lifetimes measurements. TGA curves, FTIR spectra, PXRD patterns, and the lists of bond lengths, bond angles, and other structural details are provided as ESI. CCDC No. 1046541, 1046540, 1046539, and 1046542 for 1, 2, 3, and 4, respectively, contains the supplementary crystallographic data for this paper. These data can be obtained free of charge via http://www.ccdc.cam.ac.uk/conts/retrieving.html (or from the CCDC, 12 Union Road, Cambridge CB2 1EZ, UK; Fax: +44-1223-336033; E-mail: [email protected]).

Author Contributions

All authors contributed equally to this work.

Conflicts of Interest

The authors declare no conflicts of interest.

References

  1. Allendorf, M.D.; Bauer, C.A.; Bhakta, R.K.; Houk, R.J.T. Luminescent metal-organic frameworks. Chem. Soc. Rev. 2009, 38, 1330–1352. [Google Scholar] [CrossRef] [PubMed]
  2. Perry, J.J., IV; Feng, P.L.; Meek, S.T.; Leong, K.; Doty, F.P.; Allendorf, M.D. Connecting structure with function in metal-organic frameworks to design novel photo- and radioluminescent materials. J. Mater. Chem. 2012, 22, 10235–10248. [Google Scholar] [CrossRef]
  3. Kreno, L.E.; Leong, K.; Farha, O.K.; Allendorf, M.D.; Van Duyne, R.P.; Hupp, J.T. Metal-organic framework materials as chemical sensors. Chem. Rev. 2012, 112, 1105–1125. [Google Scholar] [CrossRef] [PubMed]
  4. Rocha, J.; Carlos, L.D.; Almeida Paz, F.A.; Ananias, D. Luminescent multifunctional lanthanides-based metal–organic frameworks. Chem. Soc. Rev. 2011, 40, 926–940. [Google Scholar] [CrossRef] [PubMed]
  5. Silva, C.G.; Corma, A.; Garciá, H. Metal-organic frameworks as semiconductors. J. Mater. Chem. 2010, 20, 3141–3156. [Google Scholar] [CrossRef]
  6. Cui, Y.; Yue, Y.; Qian, G.; Chen, B. Luminescent functional metal-organic frameworks. Chem. Rev. 2012, 112, 1126–1162. [Google Scholar] [CrossRef] [PubMed]
  7. Knoll, G.F. Radiation Detection and Measurement, 3rd ed.; John Wiley & Sons: Hoboken, NJ, USA, 2000; pp. 219–263. [Google Scholar]
  8. Liu, J.Q. Crystal engineering of Cd(II) metal-organic frameworks bridged by dicarboxylates and N-donor coligands. J. Coord. Chem. 2011, 64, 1503–1512. [Google Scholar] [CrossRef]
  9. Doty, F.; Bauer, C.; Skulan, A.; Grant, P.; Allendorf, M.D. Scintillating metal-organic frameworks: A new class of radiation detection materials. Adv. Mater. 2009, 21, 95–101. [Google Scholar] [CrossRef]
  10. Bauer, C.A.; Timofeeva, T.V.; Settersten, T.B.; Patterson, B.D.; Liu, V.H.; Simmons, B.A.; Allendorf, M.D. Influence of connectivity and porosity on ligand-based luminescence in zinc metal-organic frameworks. J. Am. Chem. Soc. 2007, 129, 7136–7144. [Google Scholar] [CrossRef] [PubMed]
  11. Feng, P.L.; Branson, J.V.; Hattar, K.; Vizkelethy, G.; Allendorf, M.D.; Doty, F.P. Designing metal-organic framework for radiation dectection. Nucl. Inst. Methods Phys. Res. A 2011, 652, 295–298. [Google Scholar] [CrossRef]
  12. Mathis, S.R., II; Golafale, S.T.; Bacsa, J.; Steiner, A.; Ingram, C.W.; Doty, F.P.; Auden, E.; Hattar, K. Mesoporous stilbene-based lanthanide metal organic frameworks: Synthesis, photoluminescence and radioluminescence characteristics. Dalton Trans. 2017, 46, 491–500. [Google Scholar] [CrossRef] [PubMed]
  13. Wang, J.; Hu, T.; Bu, X. Cadmium(II) and zinc(II) metal-organic frameworks with anthracene-based dicarboxylic ligands: Solvothermal synthesis, crystal structures, and luminescent properties. CrystEngComm 2011, 13, 5152–5161. [Google Scholar] [CrossRef]
  14. Li, X.; Yang, L.; Zhao, L.; Wang, X.-L.; Shao, K.Z.; Su, Z.-M. Luminescent metal-organic frameworks with anthracene chromophores: Small-molecule sensing and highly selective sensing for nitro explosives. Cryst. Growth Des. 2016, 16, 4374–4382. [Google Scholar] [CrossRef]
  15. Wang, J.; Liu, C.; Hu, T.; Chang, Z.; Li, C.; Yan, L.; Chen, P.; Bu, X.; Wu, Q.; Zhao, L.; et al. Zinc(II) coordination architectures with two bulky anthracene-based carboxylic ligands: Crystal structures and luminescent properties. CrystEngComm 2008, 10, 681–692. [Google Scholar] [CrossRef]
  16. Liu, C.; Wang, J.; Chang, Z.; Yan, L.; Bu, X. Cadmium(II) coordination polymers based on a bulky anthracene-based dicarboxylate ligand: Crystal structures and luminescent properties. CrystEngComm 2010, 12, 1833–1841. [Google Scholar] [CrossRef]
  17. Ma, S.; Wang, X.-S.; Collier, C.D.; Manis, E.S.; Zhou, H.-C. Ultramicroporous metal-organic framework based on 9,10-anthracenedicarboxylate for selective gas adsorption. Inorg. Chem. 2007, 46, 8499–8501. [Google Scholar] [CrossRef] [PubMed]
  18. Chang, Z.; Zhang, A.-S.; Hiu, T.-L.; Bu, X.-H. ZnII coordination poylmers based on 2,3,6,7-anthracenetetracarboxylic acid: Synthesis, structures, and luminescence properties. Cryst. Growth Des. 2009, 9, 4840–4846. [Google Scholar] [CrossRef]
  19. Zhuang, J.; Friedel, J.; Terfort, A. The oriented and patterned growth of fluorescent metal-organic frameworks onto functionalized surfaces. Belstein J. Nanotechnol. 2012, 3, 570–578. [Google Scholar] [CrossRef] [PubMed]
  20. Kojtari, A.; Carroll, P.; Ji, H. Metal organic framework (MOF) micro/nanopillars. CrystEngComm 2014, 16, 2885–2888. [Google Scholar] [CrossRef]
  21. Gao, Q.; Xie, Y.-B.; Li, J.-R.; Yuan, D.-Q.; Yakovenko, A.A.; Sun, J.-H.; Zhou, H.-C. Tuning the formations of metal-organic frameworks by modification of ratio of reactant, acidity of reaction system, and use of a secondary ligand. Cryst. Growth Des. 2012, 12, 281–288. [Google Scholar] [CrossRef]
  22. Ma, S.; Simmons, J.M.; Yuan, D.; Li, J.-R.; Weng, W.; Liu, D.-J.; Zhou, H.-C. A. Nanotubular metal-organic framework with permanent porosity: Structure analysis and gas sorption studies. Chem. Commun. 2009, 27, 4049–4051. [Google Scholar] [CrossRef] [PubMed]
  23. Mu, Y.; Zhu, B.; Li, D.; Guo, D.; Zhao, J.; Ma, L. A new highly-connected 3D [Co43-OH)2] cluster-based framework from different dicarboxylates and N-donor co-ligands: Synthesis, structure, and magnetic propert. Inorg. Chem. Commun. 2013, 33, 86–89. [Google Scholar] [CrossRef]
  24. Liu, F.; Zhang, L.; Wang, R.; Sun, J.; Yang, J.; Chen, Z.; Wang, X.; Sun, D. Five MOFs with different topologies based on anthracene functionalized tetracarboxylic acid: Syntheses, structures, and properties. CrysEngComm 2014, 16, 2917–2928. [Google Scholar] [CrossRef]
  25. Liu, C.; Chang, Z.; Wang, J.; Yan, L.; Bu, X.; Batten, S. A photoluminescent 3D silver(I) coordination polymer with mixed ligands anthracene-9,10-dicarboxylate and hexamethylenetetramine, showing binodal 4-connected (43·63)2(42·62·82)3 topology. Inorg. Chem. Commun. 2008, 11, 889–892. [Google Scholar] [CrossRef]
  26. Chen, J.; Fan, Q.; Kitagawa, S. Synthesis, structures, and adsorption properties of two new magnesium coordination polymers. Solid State Sci. 2013, 16, 29–33. [Google Scholar] [CrossRef]
  27. Calahorro, A.J.; Fernández, B.; Oyarzabal, I.; Seco, J.M.; Tian, T.; Fairen-Jimenez, D.; Colacio, E.; Rodríguez-Diéguez, A. Rare earth anthracenedicarboxylate metal-organic frameworks: Slow relaxation of magnetization of Nd3+, Gd3+, Dy3+, Er3+ and Yb3+ based materials. Dalton Trans. 2016, 45, 591–598. [Google Scholar] [CrossRef] [PubMed]
  28. Palatinus, L.; Chapuis, G. SUPERFLIP—A computer program for the solution of crystal structures by charge flipping in arbitrary dimensions. J. Appl. Cryst. 2007, 40, 786–790. [Google Scholar] [CrossRef]
  29. Dolomanov, O.V.; Bourhis, L.J.; Gildea, R.J.; Howard, J.A.K.; Puschmann, H. OLEX2—A complete structure solution, refinement and analysis program. J. Appl. Cryst. 2009, 42, 339–341. [Google Scholar] [CrossRef]
  30. Sheldrick, G.M. A short history of SHELX. Acta Cryst. 2008, A64, 339–341. [Google Scholar]
  31. APEX2; Bruker AXS Inc.: Madison, WI, USA, 2012.
  32. SAINT; Bruker AXS Inc.: Madison, WI, USA, 2013.
  33. Wang, J.; Wang, J.; Li, Y.; Jiang, M.; Zhang, L.; Wu, P. A europium(III)-based metal–organic framework as a naked-eye and fast response luminescence sensor for acetone and ferric iron. New J. Chem. 2016, 40, 8600–8606. [Google Scholar] [CrossRef]
  34. Wen, G.-X.; Wu, Y.-P.; Dong, W.-W.; Zhao, J.; Li, D.-S.; Zhang, J. An Ultrastable europium(III)-organic framework with the capacity of discriminating Fe2+/Fe3+ ions in various solutions. Inorg. Chem. 2016, 55, 10114–10117. [Google Scholar] [CrossRef] [PubMed]
  35. Werner, T.C.; Hercules, D.M. Fluorescence of 9-anthroic acid and its esters. Environmental effects on excited-state behavior. J. Phys. Chem. 1969, 73, 2005–2011. [Google Scholar] [CrossRef]
  36. Dametto, P.; Siqueira, A.; Carvalho, C.; Ionashiro, M. Synthesis, characterization and thermal studies on solid state 3-methoxybenzoate of lighter trivalent lanthanides. Eclética Química 2007, 32, 17–21. [Google Scholar] [CrossRef]
  37. Clarke, H.B.; Northrop, D.C.; Simpson, O. The Scintillation Phenomenon in Anthracene I. Radiation Damage. Prog. Phys. Soc. 1962, 79, 366–372. [Google Scholar] [CrossRef]
  38. Nag, A.; Kutty, T. The light induced valence change of europium in Sr2SiO4: Eu involving transient crystal structure. J. Mater. Chem. 2004, 14, 1598–1604. [Google Scholar] [CrossRef]
  39. Hinoue, T.; Shigenoi, Y.; Sugino, M.; Mizobe, Y.; Hisaki, I.; Miyata, M.; Tohnai, N. Regulation of π-stacked anthracene arrangement for fluorescence modulation of organic solid from monomer to excited oligomer emission. Chem. Eur. J. 2012, 18, 4634–4643. [Google Scholar] [CrossRef] [PubMed]
  40. Birks, J.B. The Theory and Practice of Scintillation Counting, 1st ed.; Pargamon: Oxford, UK, 1964. [Google Scholar]
  41. King, T.A.; Voltz, R. The time dependence of scintillation intensity in aromatic materials. Proc. R. Soc. Lond. Ser. A 1966, 269, 424–439. [Google Scholar] [CrossRef]
  42. Birks, J.B. Energy Transfer in organic phosphorsm. Phys. Rev. 1954, 94, 1567. [Google Scholar] [CrossRef]
Figure 1. (a) Coordination environment of Eu1 atoms in 1. (b) Interconnectivity of bis-chelating chains along the (100) direction. (c) Interconnectivity of bis-bridging and bis-chelating chains along the (010) direction (Coordinated solvent and hydrogen atoms are omitted for clarity).
Crystals 08 00053 g001aCrystals 08 00053 g001b
Figure 2. (a) The coordination environment of Tm1 and Tm2 in 4. (b) Interconnectivity of two chains with the ADC units in bis-chelating and bis-monodentate coordination modes along the (010) direction. (c) Hydrogen bonding between ADC and coordinated water molecules. (Coordinated solvent molecules are omitted for clarity).
Crystals 08 00053 g002aCrystals 08 00053 g002b
Figure 3. Photoluminescence excitation (blue), emission (green), and IBIL (red) spectra of 14 and H2ADC. (Excitation wavelength was 380 nm for all emission spectra. Excitation spectra were monitored at emission wavelength of 435 nm for 14 and at 525 nm for H2ADC. IBIL spectrum was not recorded for 4).
Crystals 08 00053 g003
Figure 4. Photoluminescence decay curves of Structure 2 (top graph) and H2ADC (blue = IRF, red = experimental data, black solid lines = model fit). (Excitation wavelength = 372 nm).
Crystals 08 00053 g004
Table 1. Crystal structure and refinement data for 14.
Structure1234
FormulaC63H59N5O17Eu2C63H59N5O17Tb2C60H58N4O19Er2C60H58N4O19Tm2
Density g cm−31.6451.6811.6971.703
μ/mm−12.1832.4842.9693.141
Formula Weight1462.071475.991473.621476.96
Crystal SystemtriclinictriclinictriclinicTriclinic
Space GroupP-1P-1P-1P-1
a/Å10.4144(5)10.3706(9)12.6026(14)12.5949(3)
b/Å11.4340(5)11.3600(9)14.9605(16)14.9329(4)
c/Å12.9875(6)12.9850(11)17.1024(19)17.1174(5)
α/°72.8203(11)72.5410(10)87.5905(14)87.538(2)
β/°89.9297(11)89.7340(10)69.7644(15)69.7810(10)
γ/°87.1572(12)87.4110(10)72.8494(14)72.8160(10)
V/Å31475.56(12)1457.7(2)2884.5(5)2879.8(8)
Z1142
Z’0.50.521
Θmin1.8672.5511.9381.430
Θmax31.00030.05830.04630.522
Measured Refl.27,68638,80528,99247,108
Independent Refl.9326854415,97517,387
Refl. Used8571803611,48913,514
Rint0.03380.03380.04500.0527
Parameters458392803803
Restraints95249865
Largest Peak1.3461.7002.0802.372
Deepest Hole−0.999−0.978−1.169−1.057
GooF1.1021.0530.9671.048
wR2(all data)0.07530.06730.12020.0906
wR20.06800.6600.10400.0814
R1(all data)0.03220.02850.07500.0554
R10.02800.02640.04700.0374

