Liquid Crystal Ordering of Four-Base-Long DNA Oligomers with Both G–C and A–T Pairing


1
Dipartimento di Biotecnologie Mediche e Medicina Traslazionale, Università di Milano, via Fratelli Cervi 93, I-20090 Segrate, Italy
2
Dipartimento di Scienze Umane e Promozione della Qualità della Vita, Università Telematica San Raffaele di Roma, via di Val Cannuta, 247, I-00166 Roma, Italy
3
Department of Physics and Soft Materials Research Center, University of Colorado, Boulder, CO 80309-0390, USA
*
Author to whom correspondence should be addressed.
Crystals 2018, 8(1), 5; https://doi.org/10.3390/cryst8010005
Submission received: 20 November 2017
/
Revised: 14 December 2017
/
Accepted: 21 December 2017
/
Published: 23 December 2017
(This article belongs to the Section Liquid Crystals)
Abstract
:We report the liquid crystal (LC) ordering in an aqueous solution of four-base-long DNA oligomers 5′-GCTA-3′. In such systems, the formation of the chiral nematic (N*) LC phase is the result of a continuous self-assembly process in which double helix stability is achieved only through linear chaining of multiple DNA strands. The thermal stability of the aggregates and their LC phase diagram have been experimentally investigated, quantitatively interpreted with theoretical models and compared with recent results on four-base sequences with only G–C or only A–T pairing motifs. N* phase is found at GCTA concentration, cDNA, between 240 and 480 mg/mL and at temperature T < 30 °C. The twist of the nematic director is found to be left-handed with pitch (p) in the optical range, increasing with cDNA and decreasing with T.
1. Introduction
In the last decade, advances in the knowledge of DNA interactions and the development of techniques which allow chemical synthesis of DNA oligonucleotides [1] have fostered the growth of the DNA-based material field. Taking advantage of the selective Watson and Crick pairing of DNA nucleobases—adenine-thymine (A–T), guanine-cytosine (G–C)—the fine design of different DNA sequences has been used to obtain 2D and 3D self-assembled structures with nanometer dimensions, such as DNA origami [2] or DNA nanostructures [3], with many potential applications ranging from drug delivery [4] to the production of systems for basic condensed matter studies [5].
In the last ten years, the study of collective behavior of DNA oligomers in water solution, forming short double helix fragments of 6 to 20 base pairs (bp), has revealed a rich range of soft phases, including some peculiar to lyotropic liquid crystals (LC). Indeed, it has been recently shown that short DNA oligomers associated in double helices can order into LC phases despite their nearly globular shape [6]. In these systems, the formation of LC is mediated by the end-to-end aggregation of DNA duplexes into columns of covalently unassociated but physically continuous duplexes. Such self-assembled columns have the aspect ratio required to develop either chiral nematic (N*) or columnar (COL) ordering. This finding has expanded the region of nucleic acids (NA) LC phases to DNA helices which individually do not satisfy the Onsager rule for nematic ordering [7], having 1 < L/D < 3.5. The onset of LC ordering in this class of systems crucially depends on the end-to-end aggregation of the building blocks which can be obtained either by stacking of blunt-end DNA helices or by pairing of complementary single strand overhangs (sticky-ends) [8].
LC ordering of DNA oligomers appears to be a robust phenomenon. LC phases are found even in concentrated solutions of random sequence oligomers [9], and in systems in which double stranded DNA is mixed with DNA single strands or with poly-(ethylene glycol) (PEG) chains [10]. In these systems, the formation of LC domains is dependent on the phase separation and condensation of stacked DNA duplexes.
In the context of origin-of-life scenarios, the spontaneous LC ordering of oligonucleotides might have been a possible route in the formation and elongation of primordial nucleic acids [11]. Indeed, the molecular ordering within LC domains, in which the terminals of distinct oligomers are held in close proximity by packing and stacking forces, could have acted as a template for the formation of extended chains if the chemical conditions of the solution favored the ligation of such terminals. Remarkably, it has been shown that LC ordering catalytically promotes non-enzymatic chemical ligation of DNA oligomers, with more than ten-fold elongation [12,13]. This potential relevance motivated a search for the minimal conditions sufficient for DNA LC, particularly the investigation of minimum necessary oligomer length.
A step in this direction was the recent observation of LC phases and isotropic gelation in two different DNA sequences having lengths of only four bp: 5′-GCCG-3′P (GCCGp) and 5′-ATTA-3′P (ATTAp), which, despite their length, were found to form aggregates by the pairing of their GC and AT terminals, respectively [14]. Here we report an extension of that work with LC ordering found in concentrated aqueous solutions of DNA 4mers 5′-GCTA-3′ sequence (GCTA), which can mutually interact by Watson–Crick pairing of either the 5′-terminal bases, GC/CG, or the 3′-terminal bases, TA/AT. In all these cases, LC phases arise as a consequence of oligomers assembling in running-bond type chains. Indeed, DNA 4mers alone are too short to assemble into a stable double helix, except in a linear chain composed of more than two DNA strands. Aggregation of these molecules occurs in a process analogous to living polymerization [15,16] where formation of base pairs and linear chaining occur simultaneously.
2. Materials and Methods
2.1. Synthesis and Purification
Synthesis of DNA was carried out on an Akta Oligopilot 100 synthesizer using Primer Support 5G solid support preloaded with 350 μmol/g dA obtained from GE Healthcare Biosciences and DNA phosphoramidites obtained from American International Chemical Inc. Chemical reagents were mixed and dried 1 week prior to synthesis using 4 Å molecular sieves under argon. Synthesis was by typical automated methods at the 243 μmol scale.
After synthesis, solid support bearing the DNA was vacuumed to dryness on the reactor column to remove organic solvents, then transferred to a 50 mL conical tube. It was treated overnight by 40 mL of 28% ammonium hydroxide at 45 °C to deprotect the bases and remove the DNA polymer from the solid support. Solid support was then removed by filtering the mixture through a medium grain glass frit and the support was washed to free residual DNA by starting at 50% ethanol for 200 mL and then switched to 100% water for the final 300 mL. The 0.5 L mixture was dried by rotary evaporator and resuspended in 40 mL of 50 mM triethylammonium acetate (TEAA) pH 7, then purified by reverse phase HPLC using a preparative column with an 8-carbon chain packing, where buffer A was 50 mM TEAA pH 7 and buffer B was methanol. DNA collected from the HPLC was consolidated and rotovapped gently to ~5 mL volume. We completed the purification by adding sodium chloride to 400 mM and then induced precipitation of the DNA by adding enough Isopropanol to trigger precipitation, typically near 50% by volume. We then centrifuged the mixture at 14,000 rpm in an SS-34 rotor to collect a pellet, and washed the pellet with a second round of centrifugation in 75% ethanol. DNA contained in the pellet was suspended in ~1 mL of water and lyophilized to dryness.
2.2. Sequence Characterization
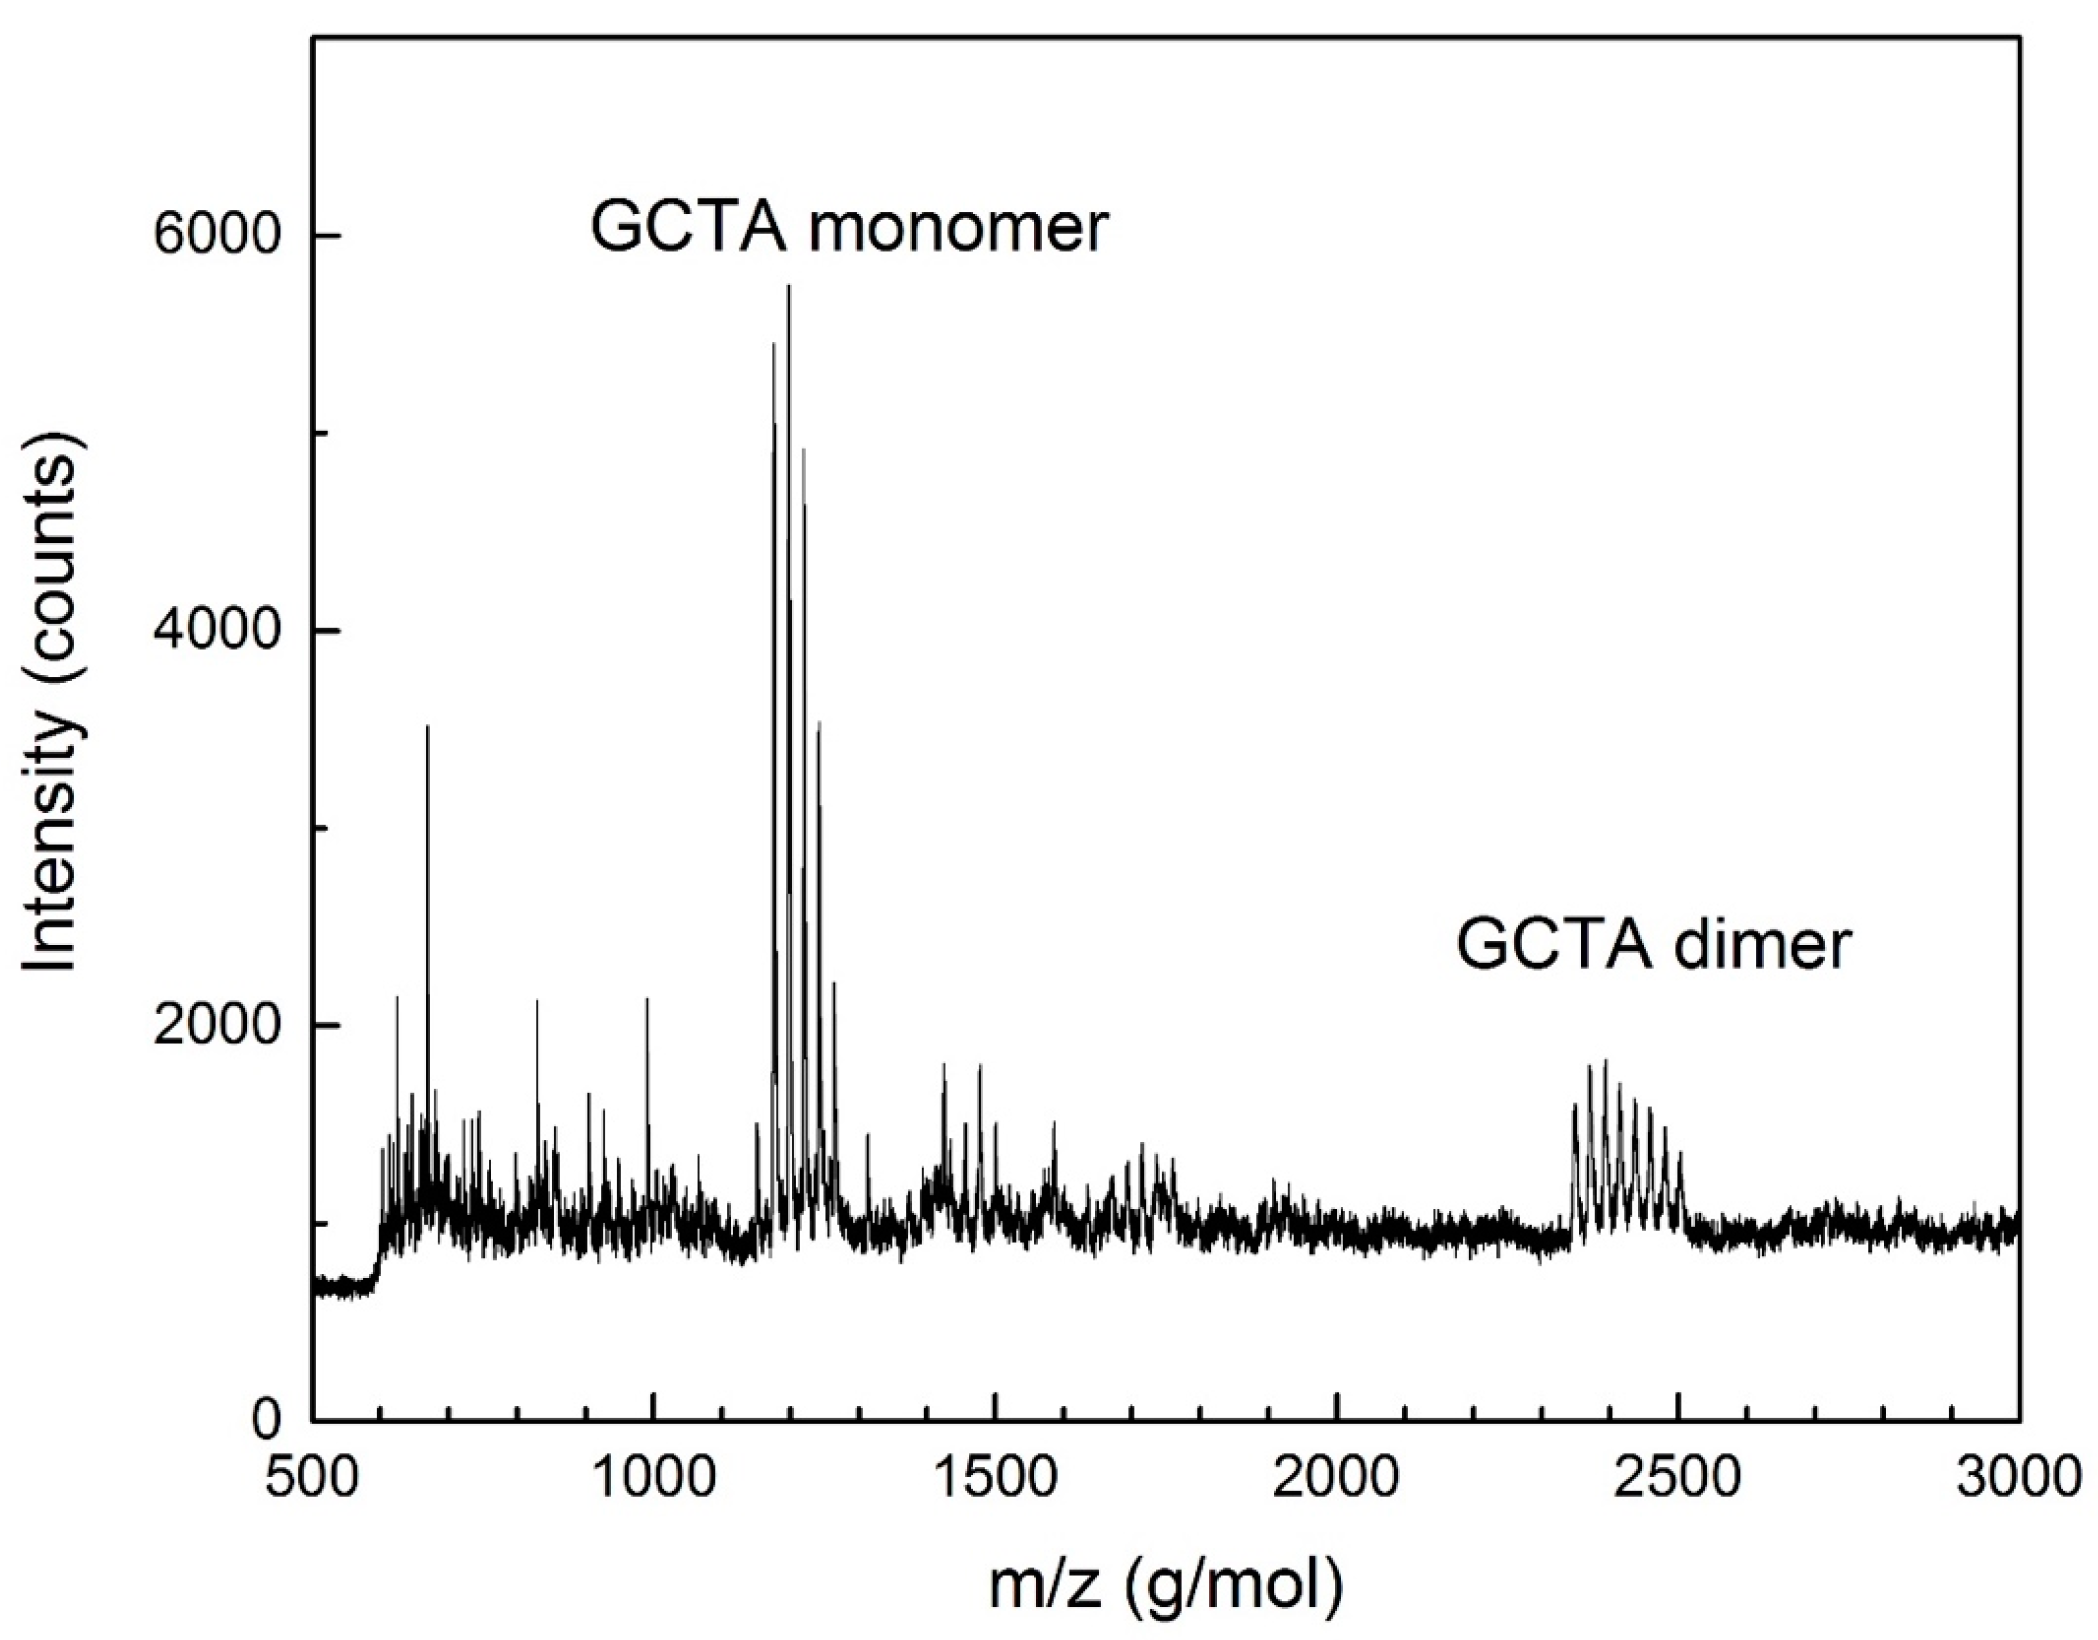
DNA synthesized and purified by these means was finally examined by MALDI-TOF mass spectrometry to confirm the expected mass, using 3-hydroxypicolinic acid as the matrix. A peak was observed within instrument error of the expected mass of the GCTA oligonucleotide (1174 g/mol), along with a mass ladder due to sodium substitution for hydrogen on the phosphodiester backbone (Figure 1).
2.3. Sample Preparation
A stock solution of GCTA was prepared in MilliQ water at cDNA = 100 mg/mL (~85 mM) and stored at 4 °C. In a typical experiment, thin flat cells were prepared by sequentially depositing 0.5–1 μL droplets of the stock solutions on flat glass (3 × 1.25 × 0.09 cm) and letting them dry until they reached the required concentration. The cells were then closed, sealed with a fluorinated oil and glued. Inner cell thickness was controlled by 20 μm silica spacers.
We prepared stock solutions of GCTA—EtBr in MilliQ water at cDNA = 2 mg/mL (~1.7 mM) and cDNA = 20 mg/mL (~17 mM) and stoichiometric ratio DNA/EtBr = 4. Samples for polarized and fluorescence microscopy were prepared following the same procedure as above.
2.4. Optical Microscopy
Phase observations and fluorescence measurements were performed with polarized optical microscopes TE300 and Abbe Optiphot 2 (Nikon, Tokyo, Japan) equipped with Nikon DS-U1 color camera and Jenoptik b/w fluorescence camera. Temperature was regulated during observation by an Instec TSA02i thermoelectric coupled hot and cold stage.
3. Results and Discussion
3.1. Pairing Modes of GCTA and Its Thermal Stability
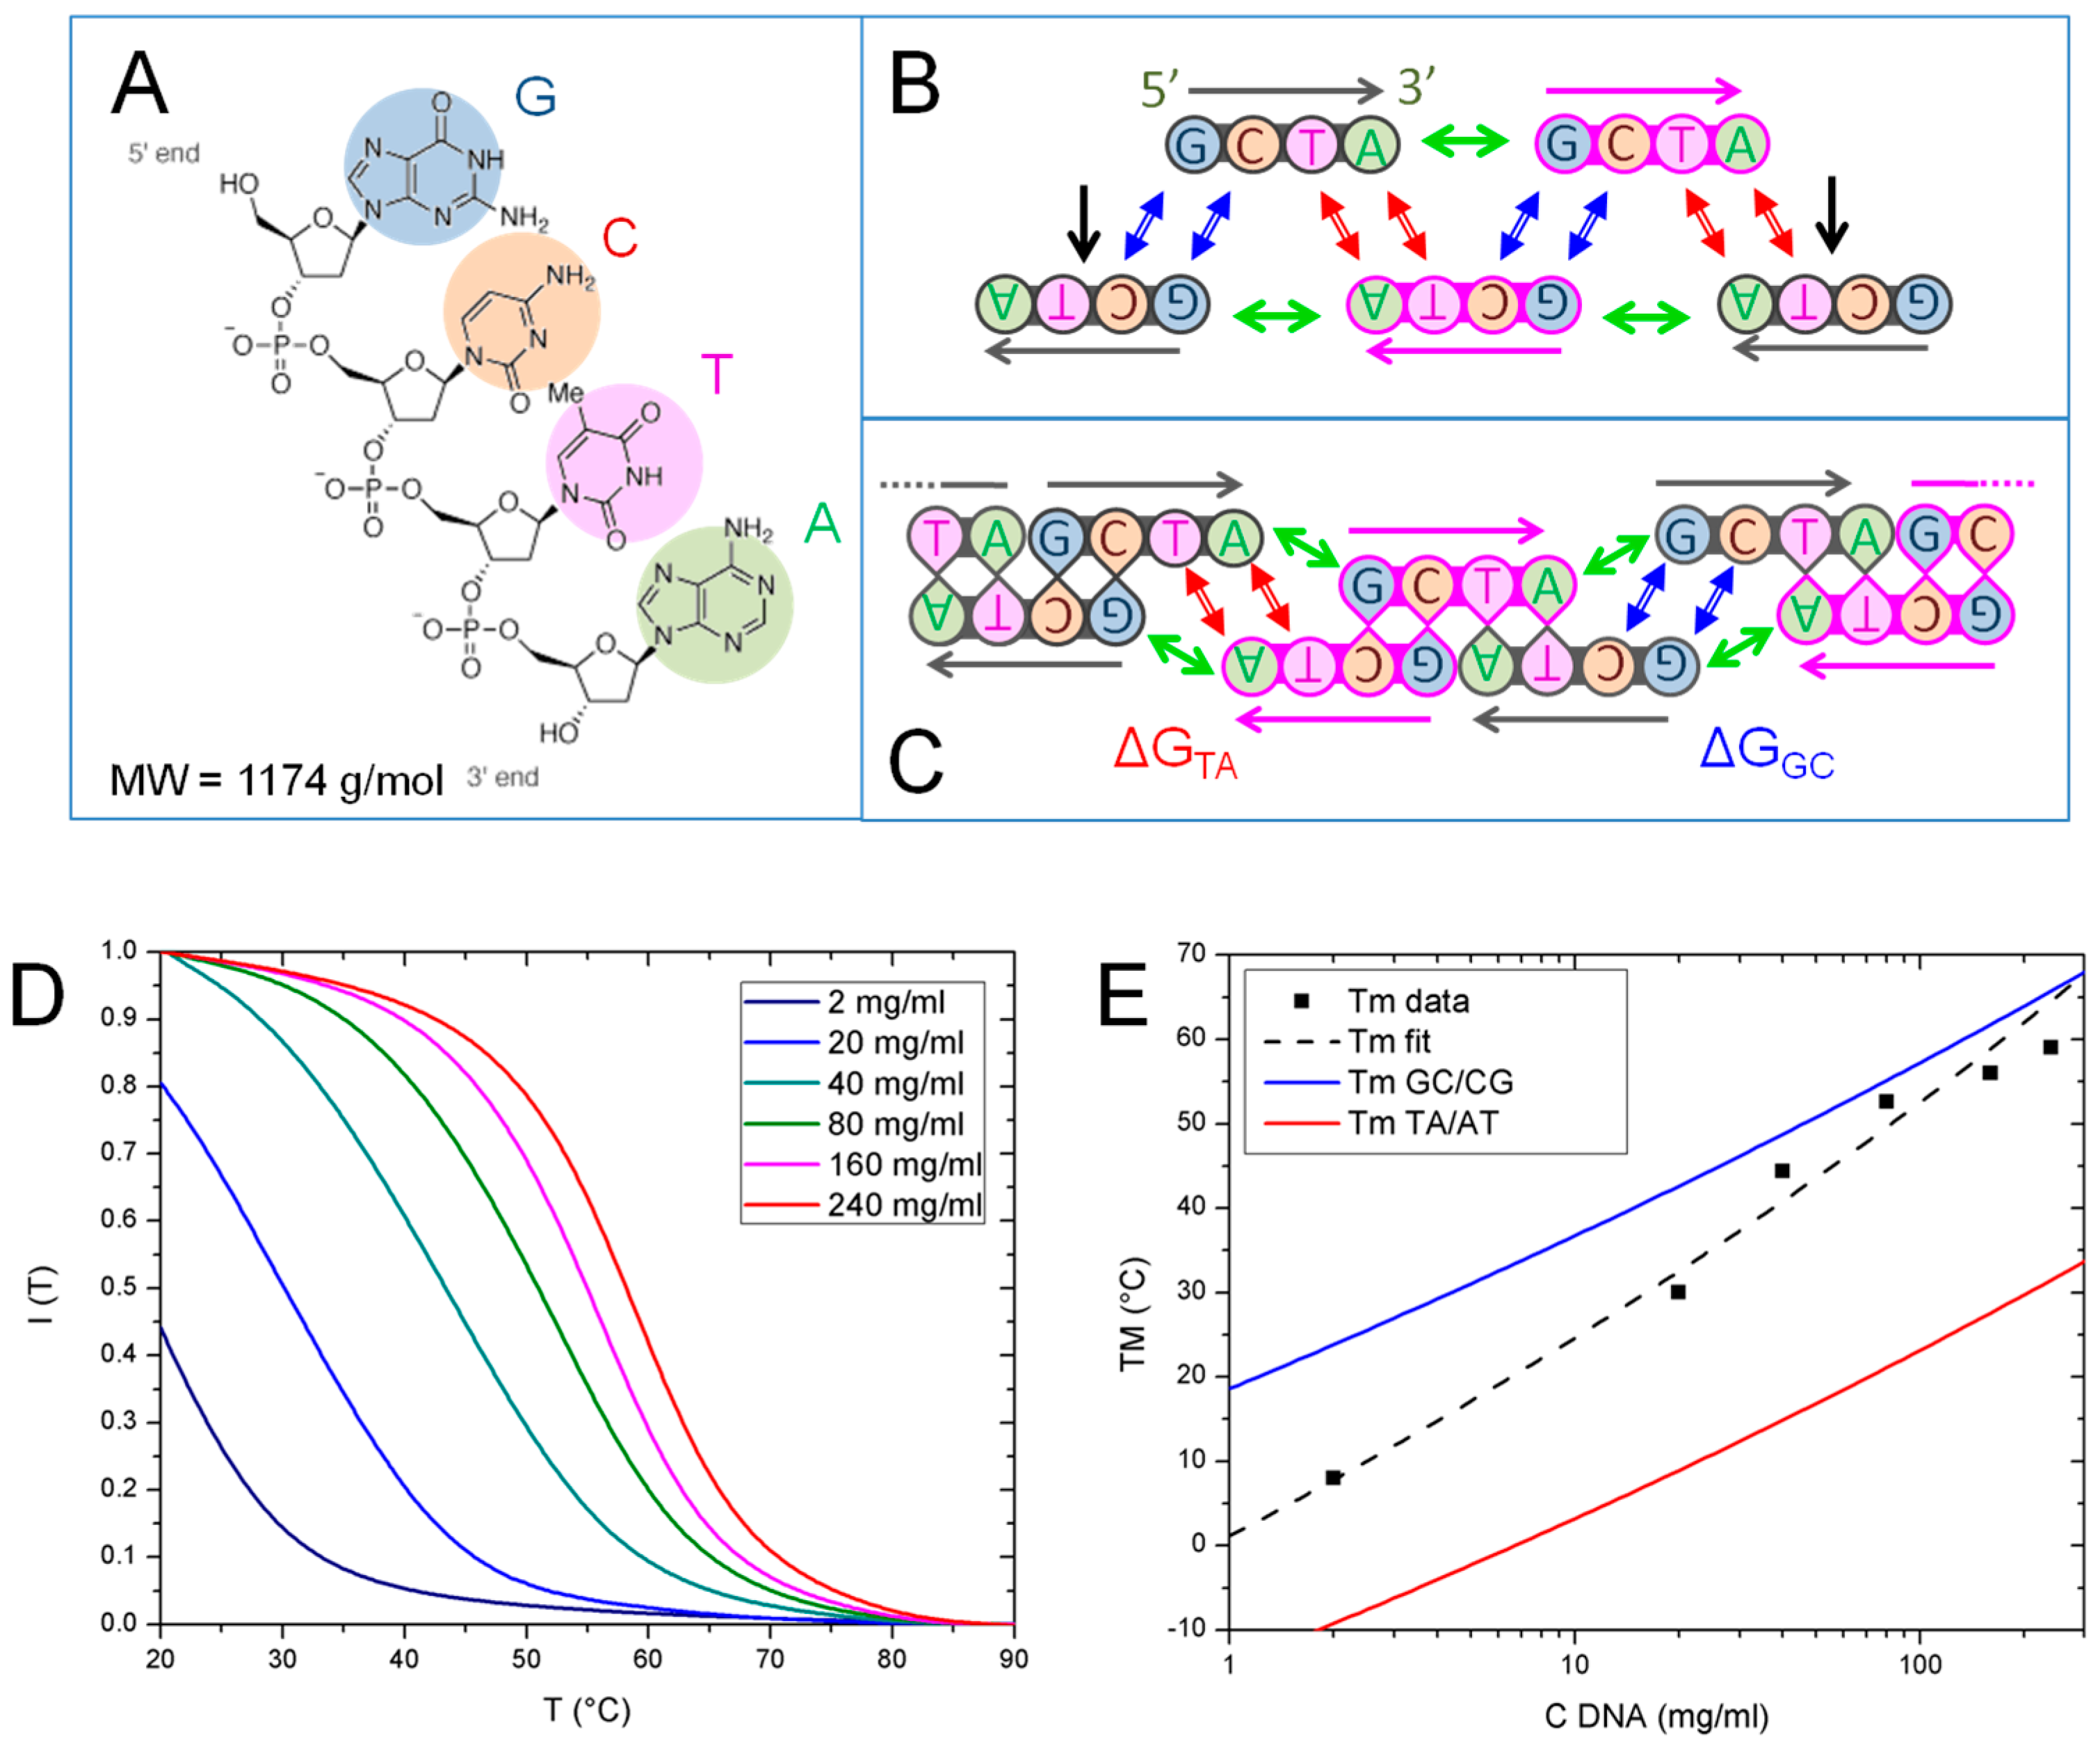
In Figure 2A–C, we sketch the DNA 4mer GCTA and the various modes of DNA–DNA interactions that contribute to the formation of the linear aggregates: (i) Watson–Crick pairing of bases (double blue and red arrows in Figure 2B,C); (ii) “coaxial stacking”, the stacking interaction between the terminal bases of two nicked strands (green arrows in Figure 2B,C) and (iii) “dangling ends”, the stacking of the first unpaired nucleobase in the overhang with the adjacent paired ones (black arrows in Figure 2B). Each interaction contributes to the overall stability with a free energy term which has been quantified in the context of nearest-neighbor (NN) models [17]. The calculation of the free energy, of its enthalpic and entropic components, ΔH and ΔS, is obtained by suitable summations of such free energy contributions.
In analogy to what is shown in Ref. [14], the main contribution to the stability of GCTA complexes comes from the interaction between the overhangs of two linear aggregates already composed by more than 3 strands. Such interaction involves either the formation of a GC/CG or of a TA/AT pair, having free energy ΔGGC and ΔGTA, respectively, as sketched in Figure 2C. In both cases, ΔG is given by the difference between the free energy, ΔG0, of the two distinct aggregates, each having an unpaired dangling end, and the free energy, ΔG1, of the bound state, where the two dangling ends have paired, forming a full quadruplet enclosed between two coaxial stacks:
where the various ΔG terms are contributions from initiation, , symmetry, , quadruplets, , dangling-ends term and coaxial stacking . By adopting the values reported in Ref. [17,18], we obtained the ΔG values in Table 1.
We explored the thermal stability of GCTA aggregates by measuring the T dependence of IF, the fluorescent emission of EtBr, a fluorophore whose fluorescence markedly increases when intercalated between paired nucleobases and decreases as they unbind. Thus, the drop of fluorescent emission of EtBr observed upon increasing T marks the temperature at which most of the bases unbind. Figure 2D reports the intensity measured in various samples at different GCTA concentration, from 2 to 240 mg/mL, normalized to their value at T = 0 °C. IF curves show a single decay occurring at T depending on cDNA. We extracted the temperature TM, the equivalent of the melting temperature for this running-bond type chains, as the temperature at which the maximum intensity drop is found. TM values are thus determined from the inflection point of IF (T) and reported in Figure 2E (black squares).
We compared the measured TM with the predictions of a model which describes the aggregate length distribution of sticky cylinders having end-to-end mutual interaction strength ΔG [19,20]. As generally found for living polymers [15,16], the model predicts that length distribution of the aggregates is exponential, , where m is the number of GCTA strands bound in the aggregate, M is characteristic chain length and the normalization factor A = e1/M − 1. According to the model, in the isotropic phase M depends on the monomers concentration, cDNA, on the interaction free energy, ΔG, and on temperature, T, as:
where wGCTA = 1174 g/mol is the molar weight and l stands for liters.
By adopting a procedure analogous to the one described in Ref. [14], we used Equation (2) to determine the mean interaction strength of the GCTA system, ΔG*, by fitting the experimental data with an expression of TM obtained from the aggregation model with ΔG as free parameter (dashed black line in Figure 2E). The values of ΔG* obtained in this way, reported in Table 1, are found to lie in between those of ΔGGC and ΔGTA, calculated from the NN model. The same comparison can be performed in Figure 2E where we plot TM vs. cDNA predicted by the model with the values of ΔGGC (blue line) and ΔGTA (red line) reported in Table 1. Since chains merging and breaking of GCTA chains involve a combination of GC and TA pairing, the fact that the observed thermal stability lies in the region between the GC and TA predicted TM lines is fully expected.
3.2. Phase Behavior of GCTA
The phase behavior of GCTA aqueous solution has been investigated at various cDNA and T, in the presence or absence of EtBr. Polarized transmission optical microscopy (PTOM) enables the identification of birefringent textures characteristic of liquid crystal ordering. The presence of EtBr is found to have a strong stabilizing effect on the LC phases of GCTA. This marks a difference between GCTA and the previously studied ATTAp and GCCGp, where the presence of EtBr had negligible effect on the phase diagram. Systematic inspection of samples reveals that this surprising difference is connected to the existence of a globular phase, found only in the case of GCTA, which competes with the LC ordering. In such globular phase, we observe the formation of micron-sized isotropic clusters of concentrated GCTA molecules. Apparently, the presence of EtBr has the effect of preventing the formation of such a phase, and thus enables the LC ordering to extend in a much wider region of the phase diagram. We argue that the effect of EtBr is related to its known ability to increase the stability of stacked base pairs. This effect is of little importance when the system is homogeneous and thus without internal structural competition, as in the case of ATTAp and GCCGp. When instead the inter-nucleobases forces are inhomogeneous, as in the case of GCTA, where GC pairing is stronger than AT pairing, EtBr favors the formation of the phase structures in which stacking of duplexes is the most prominent stabilization mechanism. The effect of EtBr might also be related to the absence in GCTA of the terminal phosphate, which is instead present in the other two molecules. Atomistic computer simulations have suggested that DNA stacking interactions in presence of phosphate terminal is stronger and more constraining to the natural helical continuity [21]. Thus, it could be argued that the presence of EtBr in GCTA has a more relevant role in stabilizing the interaction across the adjacent coaxially stacked strands, which is in this case weaker because of the absence of phosphate termination. In what follows we therefore compare the LC phases of GCTA measured in the presence of EtBr with those of ATTAp and GCCGp equally found in presence or absence of EtBr.
At low GCTA concentration, cDNA < 200 mg/mL, the system is isotropic at any temperature. Birefringent domains start to appear as cDNA ≥ 240 mg/mL, with textures typical of N* phase, as shown in Figure 3A. As T is raised, N* domains eventually melt to isotropic (Figure 3B) through the I-N* coexistence region.
The resulting phase diagram is shown in Figure 3C, where black, red and blue symbols indicate the I phase, the I-N* coexistence and the N* phase observed in the range 160 ≤ cDNA ≤ 480 mg/mL and 0 ≤ T ≤ 35 °C. N* thermal stability increases with increasing cDNA, as expected for lyotropic liquid crystals. Since this study is focused on N* phase, the current observations have not been extended at higher cDNA at which COL phase is found to appear.
The model of Ref. [20], from which we obtained the free energies, also enables predicting the shape of the ISO-N transition boundary. The result of the calculation using the previously extracted ΔG* is reported as grey line in Figure 3C for the cDNA interval of confidence for the model (220–440 mg/mL). The calculated ISO-N boundary is compatible with the experimental data in the low cDNA region of the phase diagram, while, at larger cDNA, it overestimates the phase stability.
Figure 3D compares the GCTA phase diagram with those GCCGp and ATTAp from Ref. [14]. The lines shown in the figure correspond to the isotropic side of the I-LC coexistence, marking the region where some LC domains are present in the sample. The thermal stability of the GCCGp LC phases is larger than the one of GCTA, which is in turn larger than ATTAp, as expected from the different interaction strengths of these systems, ΔGGCCG > ΔGGCTA > ΔGATTA. However, the LC of GCTA extends at slightly lower concentrations than GCCGp, maybe reflecting some slight differences in the temperature dependence of ΔG due to the absence of terminal phosphate of GCTA.
3.3. Characterization of GCTA N* Phase
When liquid crystals are made of chiral molecules, the broken mirror symmetry propagates to the whole phase, which thus becomes chiral. Indeed, the nematic phase found in DNA solutions is invariably chiral, characterized by the helical rotation of the nematic axis. The way chirality propagates from molecule to phase is a complex and still open issue that has been previously discussed in the context of DNA LC [22,23,24]. Cholesteric handedness and pitch, p, are found to depend on the sequence, the length and the structure (A vs. B DNA) of the oligonucleotides. While right-handed long B-DNA molecules always yield left-handed N* phases with p in the micrometer range [25], in the case of short DNA oligomers, the handedness of the phase does not always match the handedness of the constituent molecules [22]. In general, the N* phase of duplexes that form linear aggregates through the pairing of overhangs shows a left-handed chirality of the phase, as also verified in GCCGp. The pitch of GCCGp N* was found in the micrometer range, 1 < p < 5 μm, while its T and c dependence was not systematically investigated.
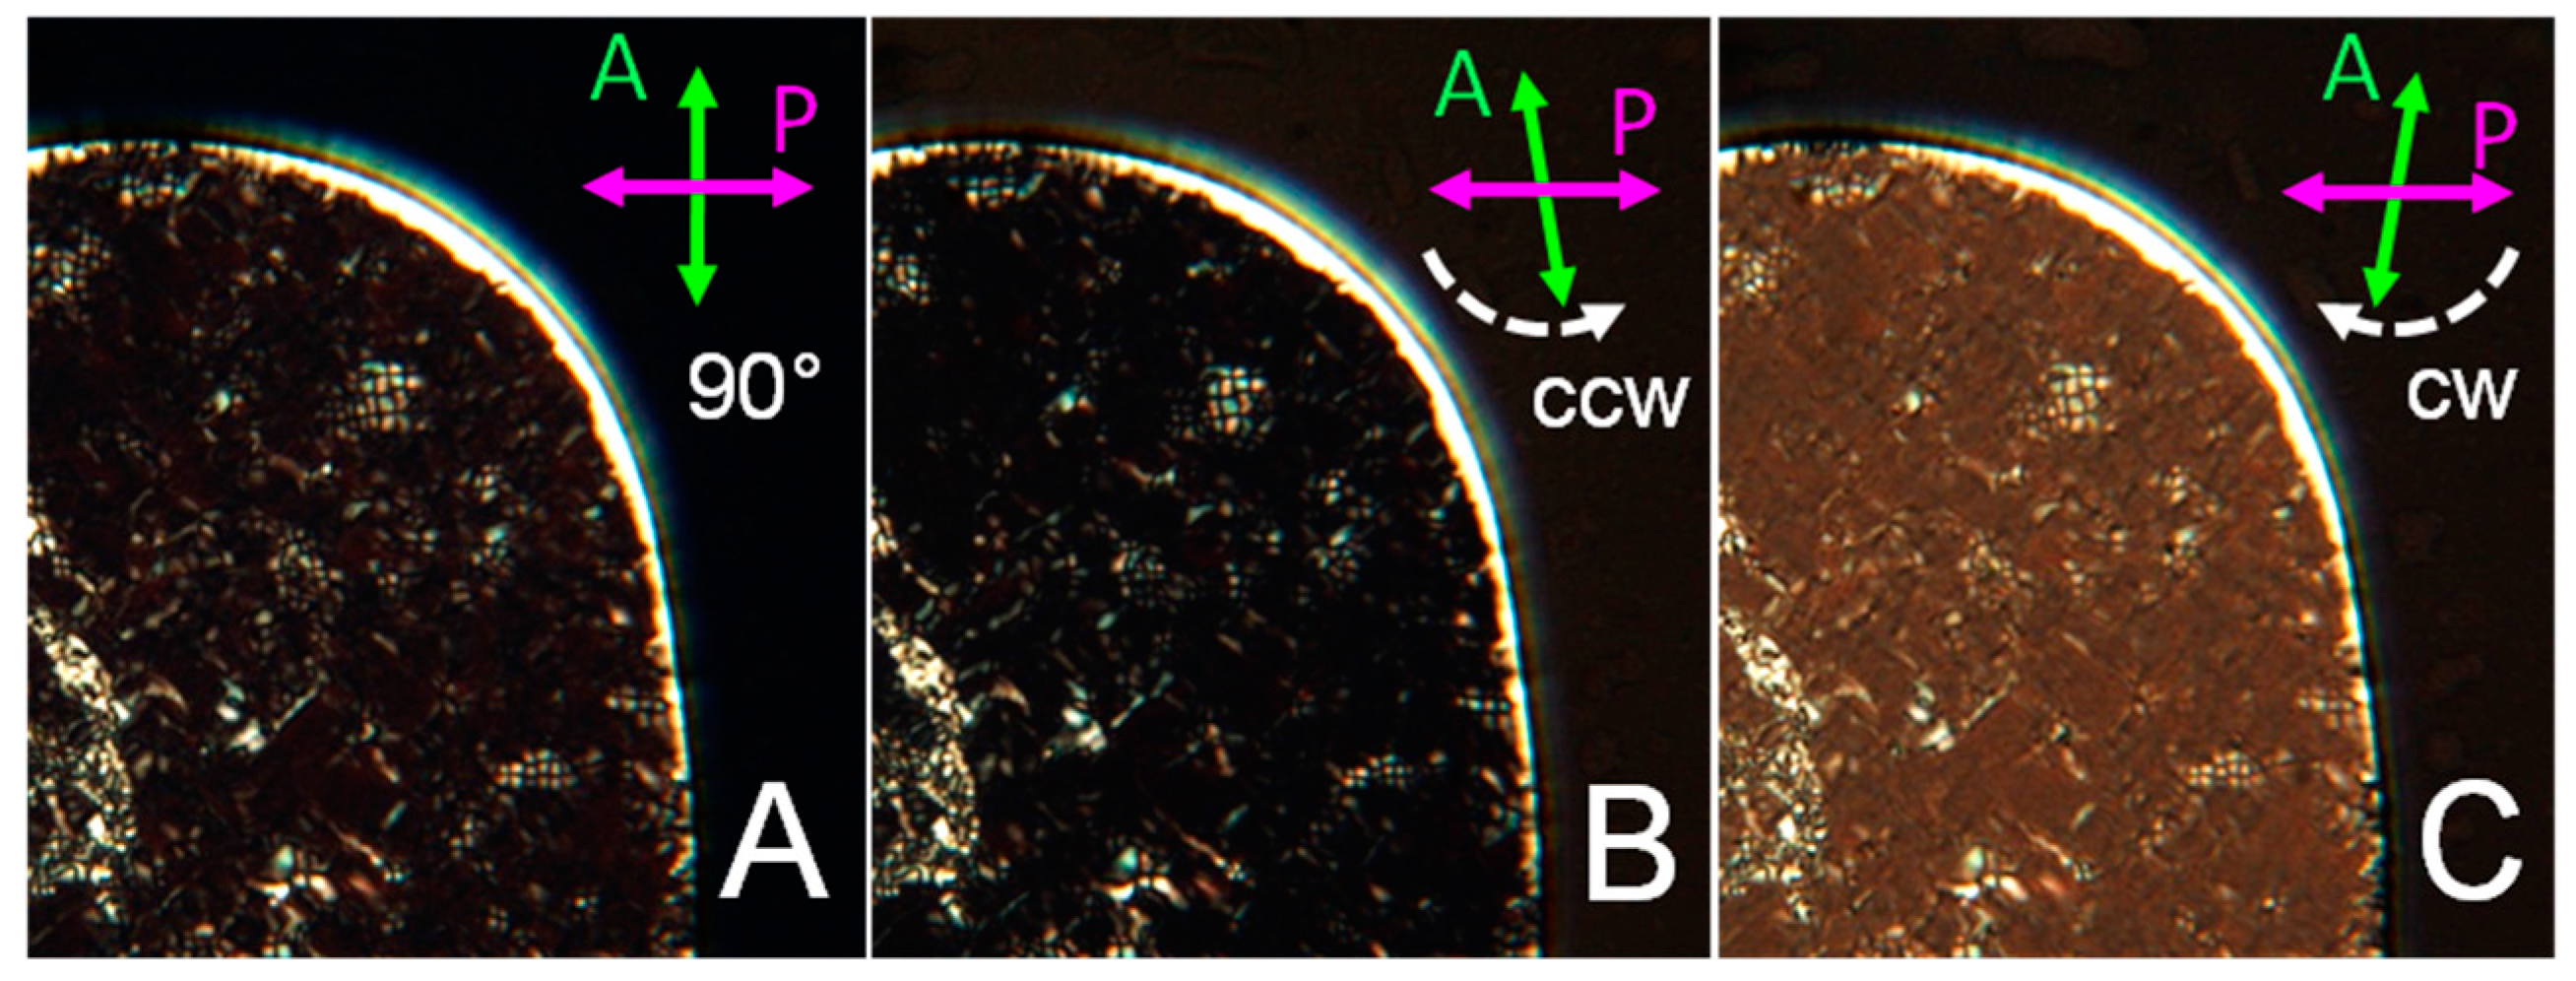
The characterization of GCTA N* phases has been performed through the PTOM observation of the N* textures and through the analysis of the spectra of the transmitted intensity IT (λ). As shown in Figure 4A the N* phase of GCTA has colored textures revealing that p is in the optical range. In this condition, when light propagates through domains in which the cholesteric axis is perpendicular to the cell plates, i.e., parallel to the direction of light propagation, selective reflection is observed. Colors are caused by the back reflection of the light having wavelength λ0/2n = p/2, where n is the average refractive index, and circular polarization matching the handedness of the N* phase. The handedness of GCTA N* phase can thus be determined by studying the polarization of the transmitted light. Figure 4A shows a PTOM image of GCTA N* texture between crossed polarizers, at cDNA = 400 mg/mL and T = 3 °C, having λ0 in the near infrared region, which can be extinguished by rotating the analyzer counter-clockwise (Figure 4B), while clockwise analyzer rotation increases the transmitted intensity (Figure 4C). This indicates that the N* phase of GCTA is left-handed.
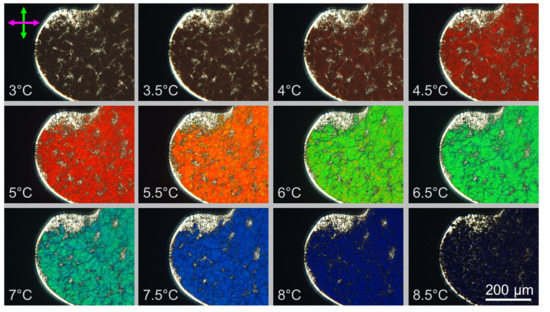
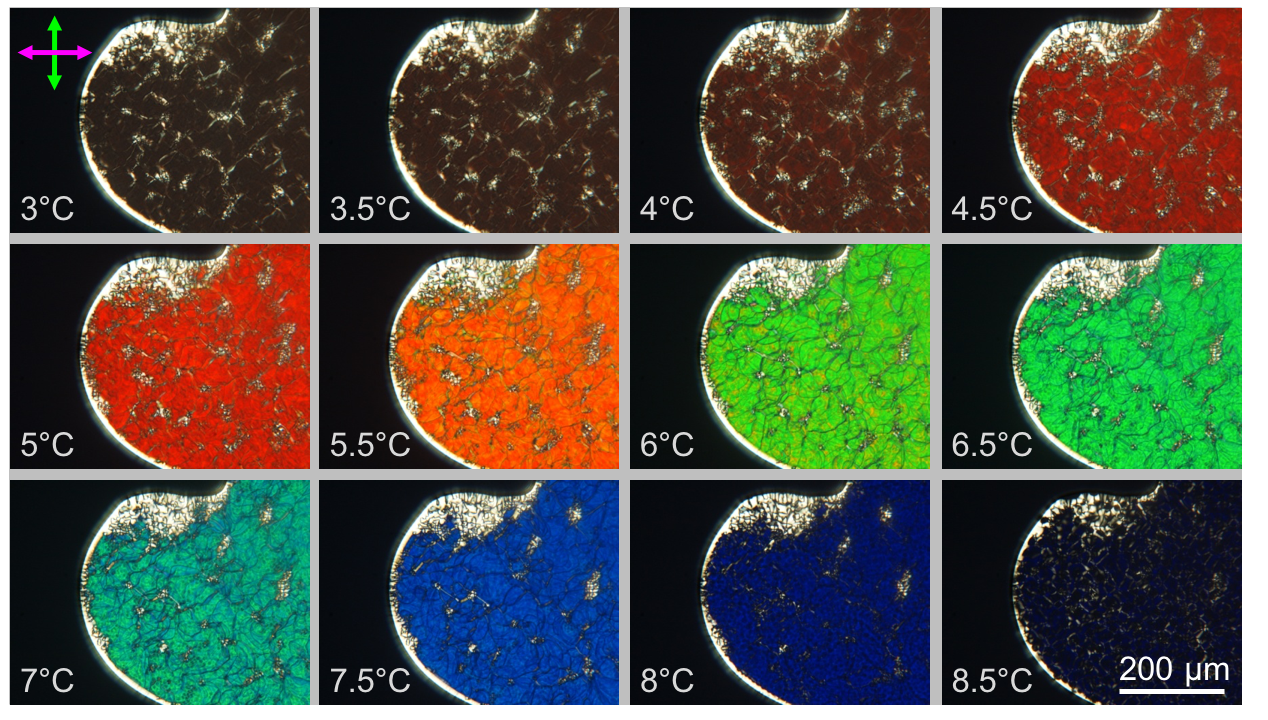
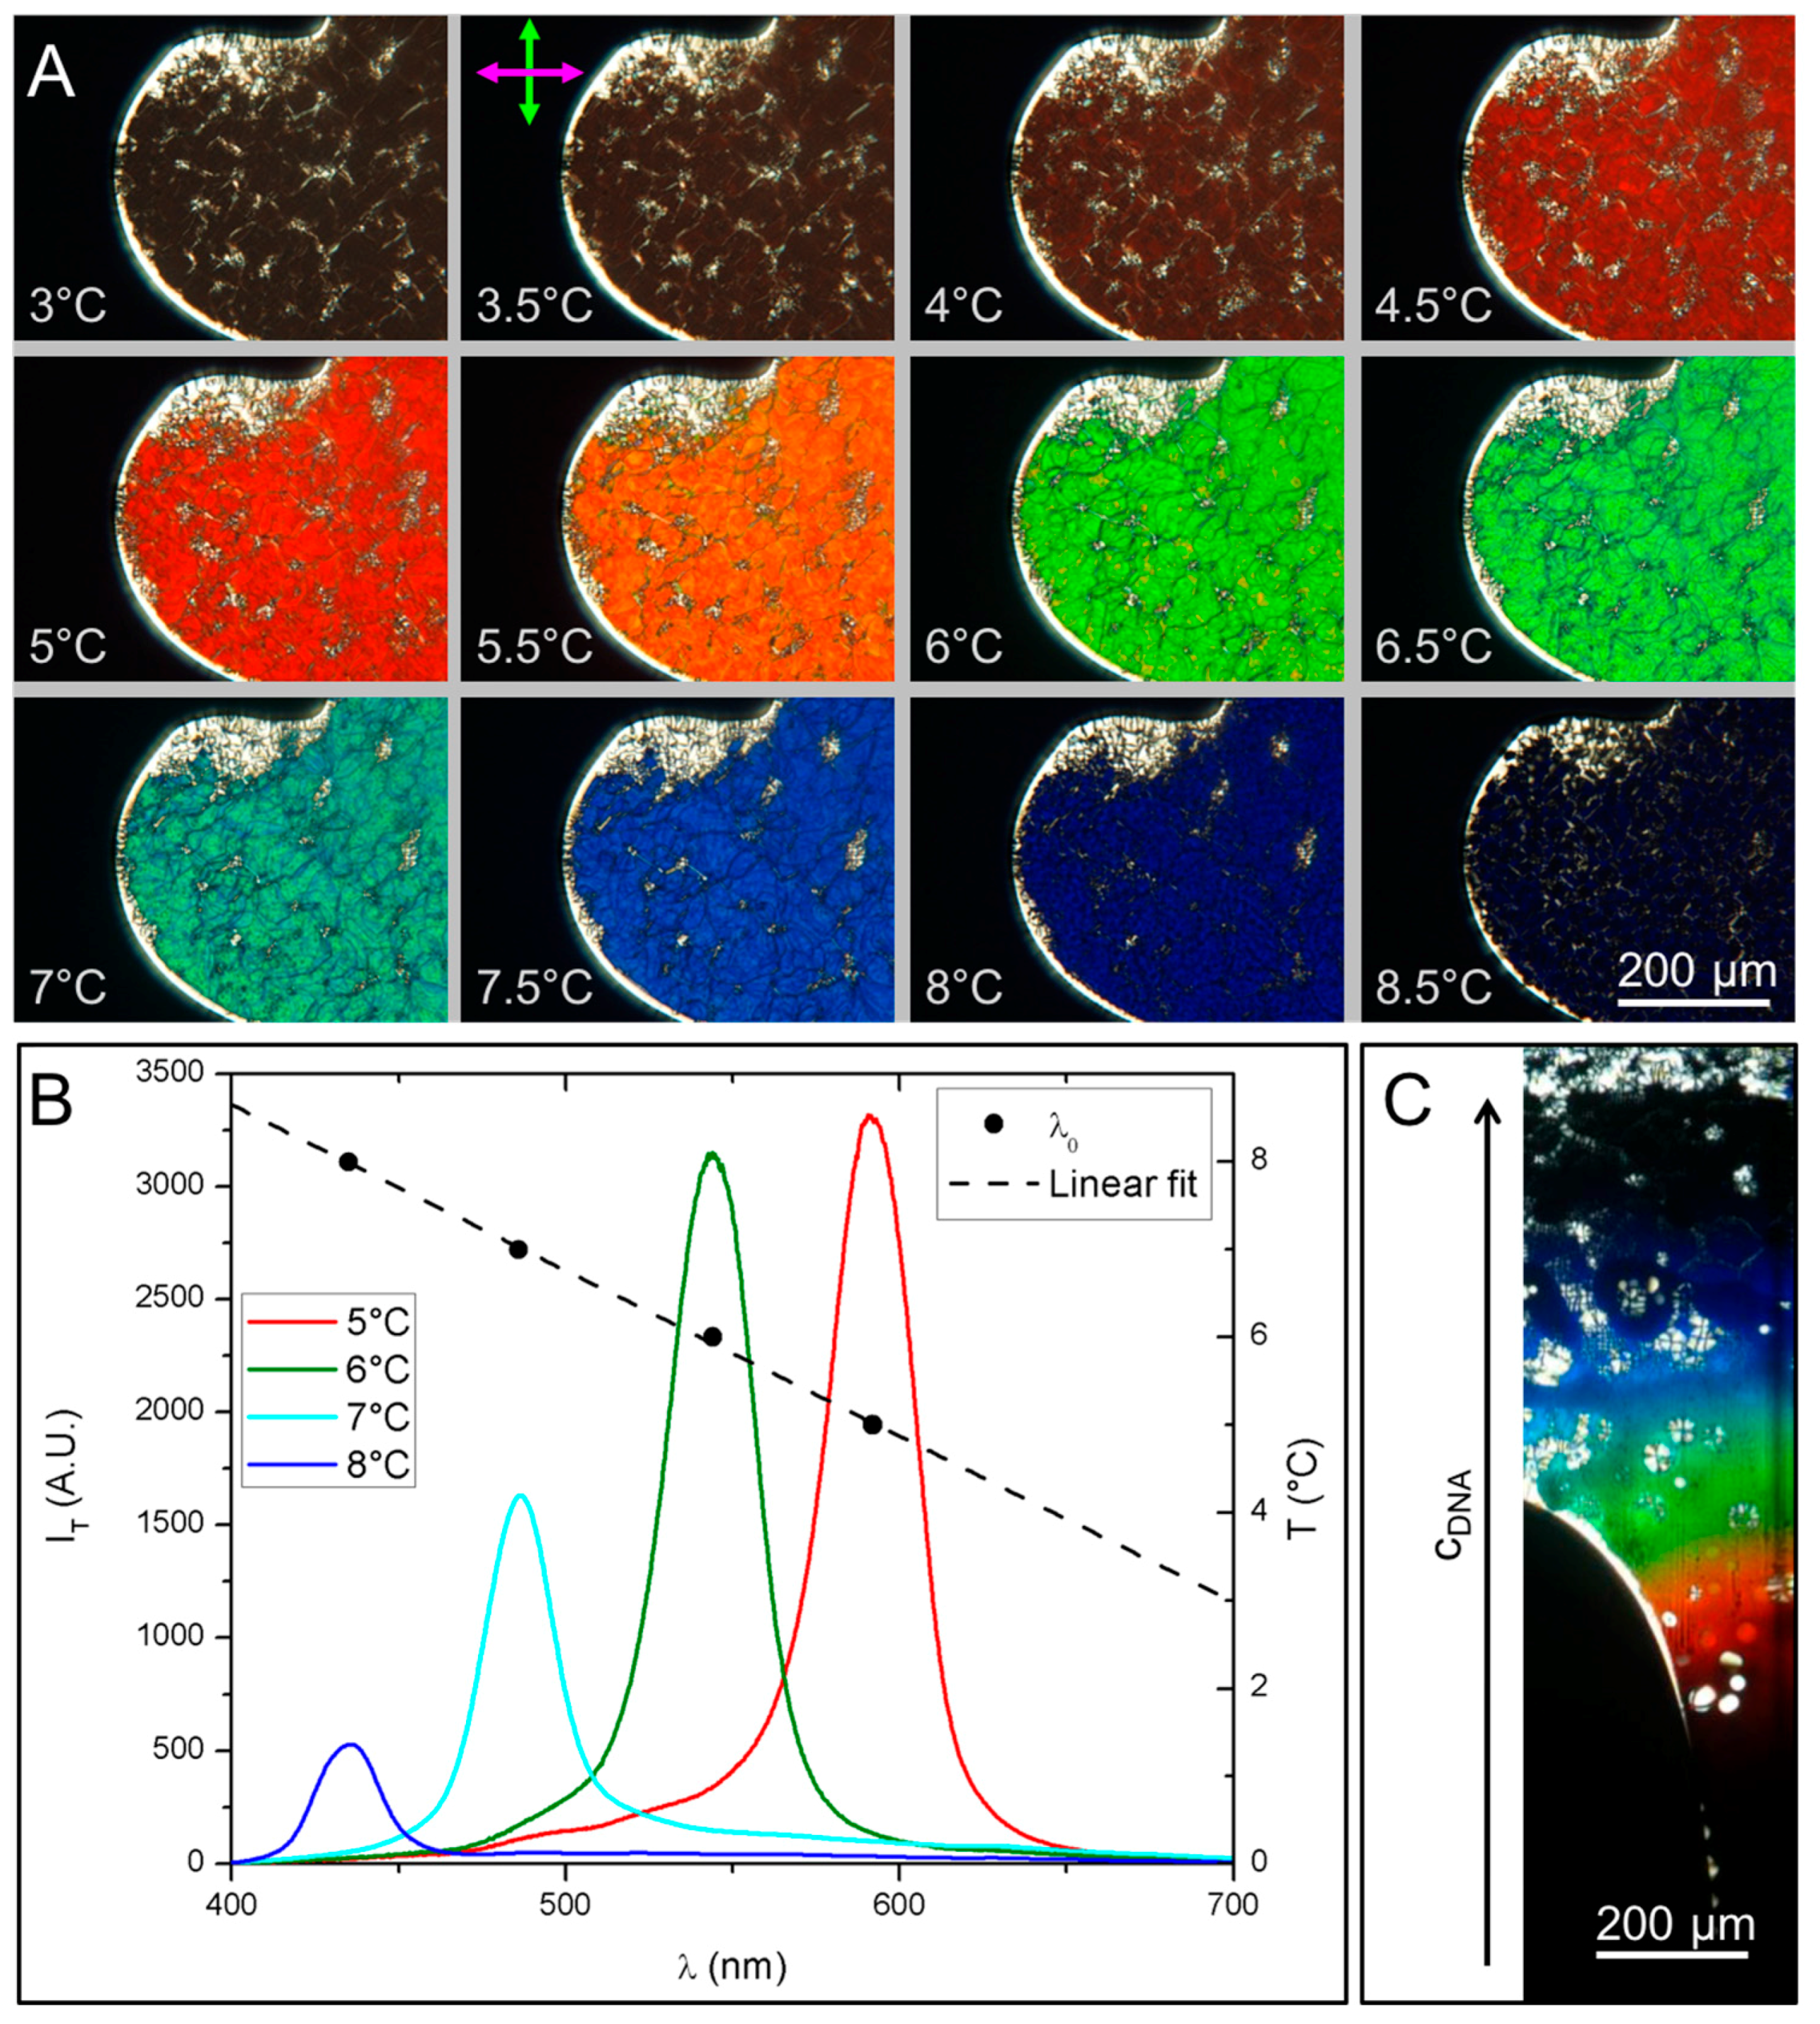
As T increases between 3 °C and 9 °C the color of the N* textures changes (Figure 5A) spanning the whole visible spectrum, from near infrared to UV border. We find that in this system even small T variations, of the order of 0.5 °C cause significant color variation, a direct sign of the decreasing of the cholesteric pitch. Transmitted light spectra, IT, at different T have been measured by a spectrometer coupled to the microscope and are shown in Figure 5B (red line at T = 5 °C, green line at T = 6 °C, light blue line at T = 7 °C and blue line at T = 8 °C). The drift of the peak position indicates that λ0 shifts toward the blue as T increases, in the range 435–592 nm. This corresponds to pitch variation in the range 313 < p < 426 nm, assuming n = 1.39 at cDNA = 400 mg/mL. Figure 5B also shows the temperature dependence of the peak position which appears to be linear. Pitch decreasing with T has also been predicted by recent models for the DNA N* phase [26].
Qualitative observations of the pitch dependence on concentration have been performed by letting evaporate the DNA solution in flat glass capillary tubes with 50 μm thickness. This procedure creates a gradient in cDNA. Figure 5C shows a PTOM picture of such capillary in which the evident change in texture colors along the direction of the concentration gradient reveals that the cholesteric pitch of GCTA decreases when cDNA increases.
The remarkably uniform and T controllable N* phase of GCTA appears particularly suitable as a platform for the measurement of the elastic properties of the LC phases of these ultra-short DNA oligomers with a recently introduced approach based on pump-probe optical torque [27]. Moreover, such a material could be an interesting dynamic system to explore the nonlinear optical response of DNA N* phases, which was recently demonstrated to be of the same order of that of thermotropic nematics [28].
4. Conclusions
The LC ordering of four-base-long DNA sequence GCTA has been observed and quantitatively studied. Despite the small size of this molecule, which does not yield a stable duplex at room T, LC N* ordering is induced by the cooperative linear chaining of the GCTA strands.
This work extends the previous studies on ATTAp and GCCGp 4mers to a molecule containing all the four DNA nucleobases and confirms that the current thermodynamic descriptions of DNA pairing and stacking, obtained from a database of DNA sequences with length larger than six bases, is suitable to describe the collective behavior of 4-base-long DNA oligomers [14].
This observation confirms the potential relevance of LC ordering in the context of the prebiotic origin of nucleic acids, where the most likely outcome of random chemistry would have been polymeric sequences containing all the possible nucleobases. The function of EtBr in stabilizing GCTA linear aggregates is in line with other observations suggesting the possible role of intercalating molecules in promoting polymerization in prebiotic conditions [29]. This finding can in principle extend the autocatalytic properties of LC ordering [12,13] to enhance non-enzymatic chemical ligation in concentrated solutions of EtBr and DNA oligomers.
Acknowledgments
Authors would like to acknowledge Giuliano Zanchetta, Marco Todisco and Paolo Mariani for useful discussions. This work was supported by a grant from the John Templeton Foundation provided through the Earth-Life Science Institute of the Tokyo Institute of Technology. This work was also supported by U.S. National Science Foundation MRSEC Grant No. DMR-1420736 and by National Science Foundation Grant No. DMR-1207606. The opinions expressed in this publication are those of the authors and do not necessarily reflect the views of the John Templeton Foundation or the Earth-Life Science Institute.
Author Contributions
T.P.F., T.B. and N.A.C. conceived the experiments; G.P.S. synthesized the DNA sequence, T.P.F. and G.P.S. performed the experiments; T.P.F. and T.B., interpreted the data and wrote the manuscript. All authors prepared the figures and reviewed the manuscript.
Conflicts of Interest
The authors declare no conflict of interest.
References
- Caruthers, H.M. Gene synthesis machines: DNA chemistry and its uses. Science 1985, 230, 281–285. [Google Scholar] [CrossRef] [PubMed]
- Rothemund, P.W.K. Folding DNA to create nanoscale shapes and patterns. Nature 2006, 440, 297–302. [Google Scholar] [CrossRef] [PubMed]
- Seeman, N.C. DNA in a material world. Nature 2003, 421, 427–431. [Google Scholar] [CrossRef] [PubMed]
- Sarkar, T.; Conwell, C.C.; Harvey, L.C.; Santai, C.T.; Hud, N.V. Condensation of oligonucleotides assembled into nicked and gapped duplexes: Potential structures for oligonucleotide delivery. Nucleic Acids Res. 2015, 33, 143–151. [Google Scholar] [CrossRef] [PubMed]
- Biffi, S.; Cerbino, R.; Bomboi, F.; Paraboschi, E.M.; Asselta, R.; Sciortino, F.; Bellini, T. Phase behavior and critical activated dynamics of limited-valence DNA nanostars. Proc. Natl. Acad. Sci. USA 2013, 110, 15633–15637. [Google Scholar] [CrossRef] [PubMed]
- Nakata, M.; Zanchetta, G.; Chapman, B.D.; Jones, C.D.; Cross, J.O.; Pindak, R.; Bellini, T.; Clark, N.A. End-to-end stacking and liquid crystal condensation of 6- to 20-base pair DNA duplexes. Science 2007, 318, 1276–1279. [Google Scholar] [CrossRef] [PubMed]
- Onsager, L. The effects of shape on the interaction of colloidal particles. Ann. N. Y. Acad. Sci. 1949, 51, 627–659. [Google Scholar] [CrossRef]
- Zanchetta, G.; Nakata, M.; Buscaglia, M.; Clark, N.A.; Bellini, T. Liquid crystal ordering of DNA and RNA oligomers with partially overlapping sequences. J. Phys. Condens. Matter 2008, 20, 494214. [Google Scholar] [CrossRef]
- Bellini, T.; Zanchetta, G.; Fraccia, T.P.; Cerbino, R.; Tsai, E.; Smith, G.P.; Moran, M.J.; Walba, D.M.; Clark, N.A. Liquid crystal self-assembly of random-sequence DNA oligomers. Proc. Natl. Acad. Sci. USA 2012, 109, 1110–1115. [Google Scholar] [CrossRef] [PubMed]
- Zanchetta, G.; Nakata, M.; Buscaglia, M.; Bellini, T.; Clark, N.A. Phase separation and liquid crystallization of complementary sequences in mixtures of nanoDNA oligomers. Proc. Natl. Acad. Sci. USA 2008, 105, 1111–1117. [Google Scholar] [CrossRef] [PubMed]
- Budin, I.; Szostak, J.W. Expanding roles for diverse physical phenomena during the origin of life. Annu. Rev. Biophys. 2010, 39, 245. [Google Scholar] [CrossRef] [PubMed]
- Fraccia, T.P.; Smith, G.P.; Zanchetta, G.; Paraboschi, E.; Yi, Y.; Walba, D.M.; Dieci, G.; Clark, N.A.; Bellini, T. Abiotic ligation of DNA oligomers templated by their liquid crystal ordering. Nat. Commun. 2015, 6, 6424. [Google Scholar] [CrossRef] [PubMed]
- Fraccia, T.P.; Zanchetta, G.; Rimoldi, V.; Clark, N.A.; Bellini, T. Evidence of Liquid Crystal–Assisted Abiotic Ligation of Nucleic Acids. Orig. Life Evol. Biosph. 2015, 45, 51–68. [Google Scholar] [CrossRef] [PubMed]
- Fraccia, T.P.; Smith, G.P.; Bethge, L.; Zanchetta, G.; Nava, G.; Klussmann, S.; Clark, N.A.; Bellini, T. Liquid crystal ordering and isotropic gelation in solutions of four-base-long DNA oligomers. ACS Nano 2016, 10, 8508–8516. [Google Scholar] [CrossRef] [PubMed]
- Taylor, M.P.; Herzfeld, J. Liquid-crystal phases of self-assembled molecular aggregates. J. Phys. Condens. Matter 1993, 5, 2651. [Google Scholar] [CrossRef]
- Van der Schoot, P.; Cates, M.E. Growth, static light scattering, and spontaneous ordering of rodlike micelles. Langmuir 1994, 10, 670–679. [Google Scholar] [CrossRef]
- SantaLucia, J.; Hicks, D. The thermodynamics of DNA structural motifs. Annu. Rev. Biophys. Biomol. Struct. 2004, 33, 415–440. [Google Scholar] [CrossRef] [PubMed]
- Peyret, N. Prediction of Nucleic Acid Hybridization: Parameters and Algorithms; Wayne State University: Detroit, MI, USA, 2000. [Google Scholar]
- De Michele, C.; Rovigatti, L.; Bellini, T.; Sciortino, F. Self-assembly of short DNA duplexes: From a coarse-grained model to experiments through a theoretical link. Soft Matter 2012, 8, 8388–8398. [Google Scholar] [CrossRef]
- De Michele, C.; Bellini, T.; Sciortino, F. Self-assembly of bifunctional patchy particles with anisotropic shape into polymers chains: Theory, simulations, and experiments. Macromolecules 2012, 45, 1090–1106. [Google Scholar] [CrossRef]
- Maffeo, C.; Luan, B.; Aksimentiev, A. End-to-end attraction of duplex DNA. Nucleic Acids Res. 2012, 40, 3812–3821. [Google Scholar] [CrossRef] [PubMed]
- Zanchetta, G.; Giavazzi, F.; Nakata, M.; Buscaglia, M.; Cerbino, R.; Clark, N.A.; Bellini, T. Right-handed double-helix ultrashort DNA yields chiral nematic phases with both right-and left-handed director twist. Proc. Natl. Acad. Sci. USA 2010, 107, 17497–17502. [Google Scholar] [CrossRef] [PubMed]
- Rossi, M.; Zanchetta, G.; Klussmann, S.; Clark, N.A.; Bellini, T. Propagation of chirality in mixtures of natural and enantiomeric DNA oligomers. Phys. Rev. Lett. 2013, 110, 107801. [Google Scholar] [CrossRef] [PubMed]
- Frezza, E.; Ferrarini, A.; Kolli, H.B.; Giacometti, A.; Cinacchi, G. The isotropic-to-nematic phase transition in hard helices: Theory and simulation. J. Chem. Phys. 2013, 138, 164906. [Google Scholar] [CrossRef] [PubMed]
- Livolant, F.; Maestre, M.F. Circular dichroism microscopy of compact forms of DNA and chromatin in vivo and in vitro: Cholesteric liquid-crystalline phases of DNA and single dinoflagellate nuclei. Biochemistry 1988, 27, 3056–3068. [Google Scholar] [CrossRef] [PubMed]
- De Michele, C.; Zanchetta, G.; Bellini, T.; Frezza, E.; Ferrarini, A. Hierarchical propagation of chirality through reversible polymerization: The cholesteric phase of DNA oligomers. ACS Macro Lett. 2016, 5, 208–212. [Google Scholar] [CrossRef]
- Lucchetti, L.; Fraccia, T.P.; Ciciulla, F.; Bellini, T. Non-linear optical measurement of the twist elastic constant in thermotropic and DNA lyotropic chiral nematics. Sci. Rep. 2017, 7, 4959. [Google Scholar] [CrossRef] [PubMed]
- Lucchetti, L.; Fraccia, T.P.; Ciciulla, F.; Simoni, F.; Bellini, T. Giant optical nonlinearity in DNA lyotropic liquid crystals. Opt. Express 2017, 25, 25951–25959. [Google Scholar] [CrossRef] [PubMed]
- Horowitz, E.D.; Engelhart, A.E.; Chen, M.C.; Quarles, K.A.; Smith, M.W.; Lynn, D.G.; Hud, N.V. Intercalation as a means to suppress cyclization and promote polymerization of base-pairing oligonucleotides in a prebiotic world. Proc. Natl. Acad. Sci. USA 2010, 107, 5288–5293. [Google Scholar] [CrossRef] [PubMed]
Figure 1.
MALDI-TOF measurements of the synthesized DNA strands. 5′-GCTA-3′ (GCTA) monomer (1174 g/mol) and dimer due to base-pair stickiness (2348 g/mol) are both marked. Peak multiplets are due to sodium substitution for hydrogen on the phosphodiester backbone.
Figure 1.
MALDI-TOF measurements of the synthesized DNA strands. 5′-GCTA-3′ (GCTA) monomer (1174 g/mol) and dimer due to base-pair stickiness (2348 g/mol) are both marked. Peak multiplets are due to sodium substitution for hydrogen on the phosphodiester backbone.

Figure 2.
GCTA pairing motifs and thermal stability. (A) Chemical structure of GCTA; (B) Sketch of the pairing and stacking interactions between GCTA oligomers: Watson–Crick GC/CG and TA/AT quartets (blue and red double arrows respectively), coaxial stacking A-G/CT (green arrows) and dangling ends (black arrows); (C) Sketch of the main interactions driving GCTA running-bond type linear chaining: pairing/breaking of terminal TA or GC tails of aggregates compose by more than 3 strands, respectively involving ΔGTA and ΔGGC free energy variation; (D) GCTA melting curves obtained by recording the fluorescence intensity emitted by EtBr vs. T, IF(T), for different cDNA from 2 to 240 mg/mL. TM is identified as the temperature of the inflection point of IF (T); (E) Plot of TM vs. cDNA experimental data (black squares) fitted by the prediction of the aggregation model (black dashed line). Predicted TM for ΔGGC (blue line) and ΔGTA (red line), are shown for comparison.

Figure 3.
Phase behavior of GCTA. (A,B) Polarized transmission optical microscopy (PTOM) pictures of the birefringent domains allows the identification of typical cholesteric, N*, textures (A) and I-N* coexistence (B); (C) cDNA–T experimental phase diagram. I, I-N* and N* phases are represented by black, red and blue symbols, respectively. The boundaries of N* phase and of I-N* coexistence are identified by the blue and red lines, respectively. Thick grey line is the predicted isotropic side of the phase boundary obtained from the aggregation model [14,20]. (D): comparison of the boundary of the I-LC coexistence of GCTA (grey line) with those of GCCGp (magenta line) and ATTAp (green line) in Ref. [14].
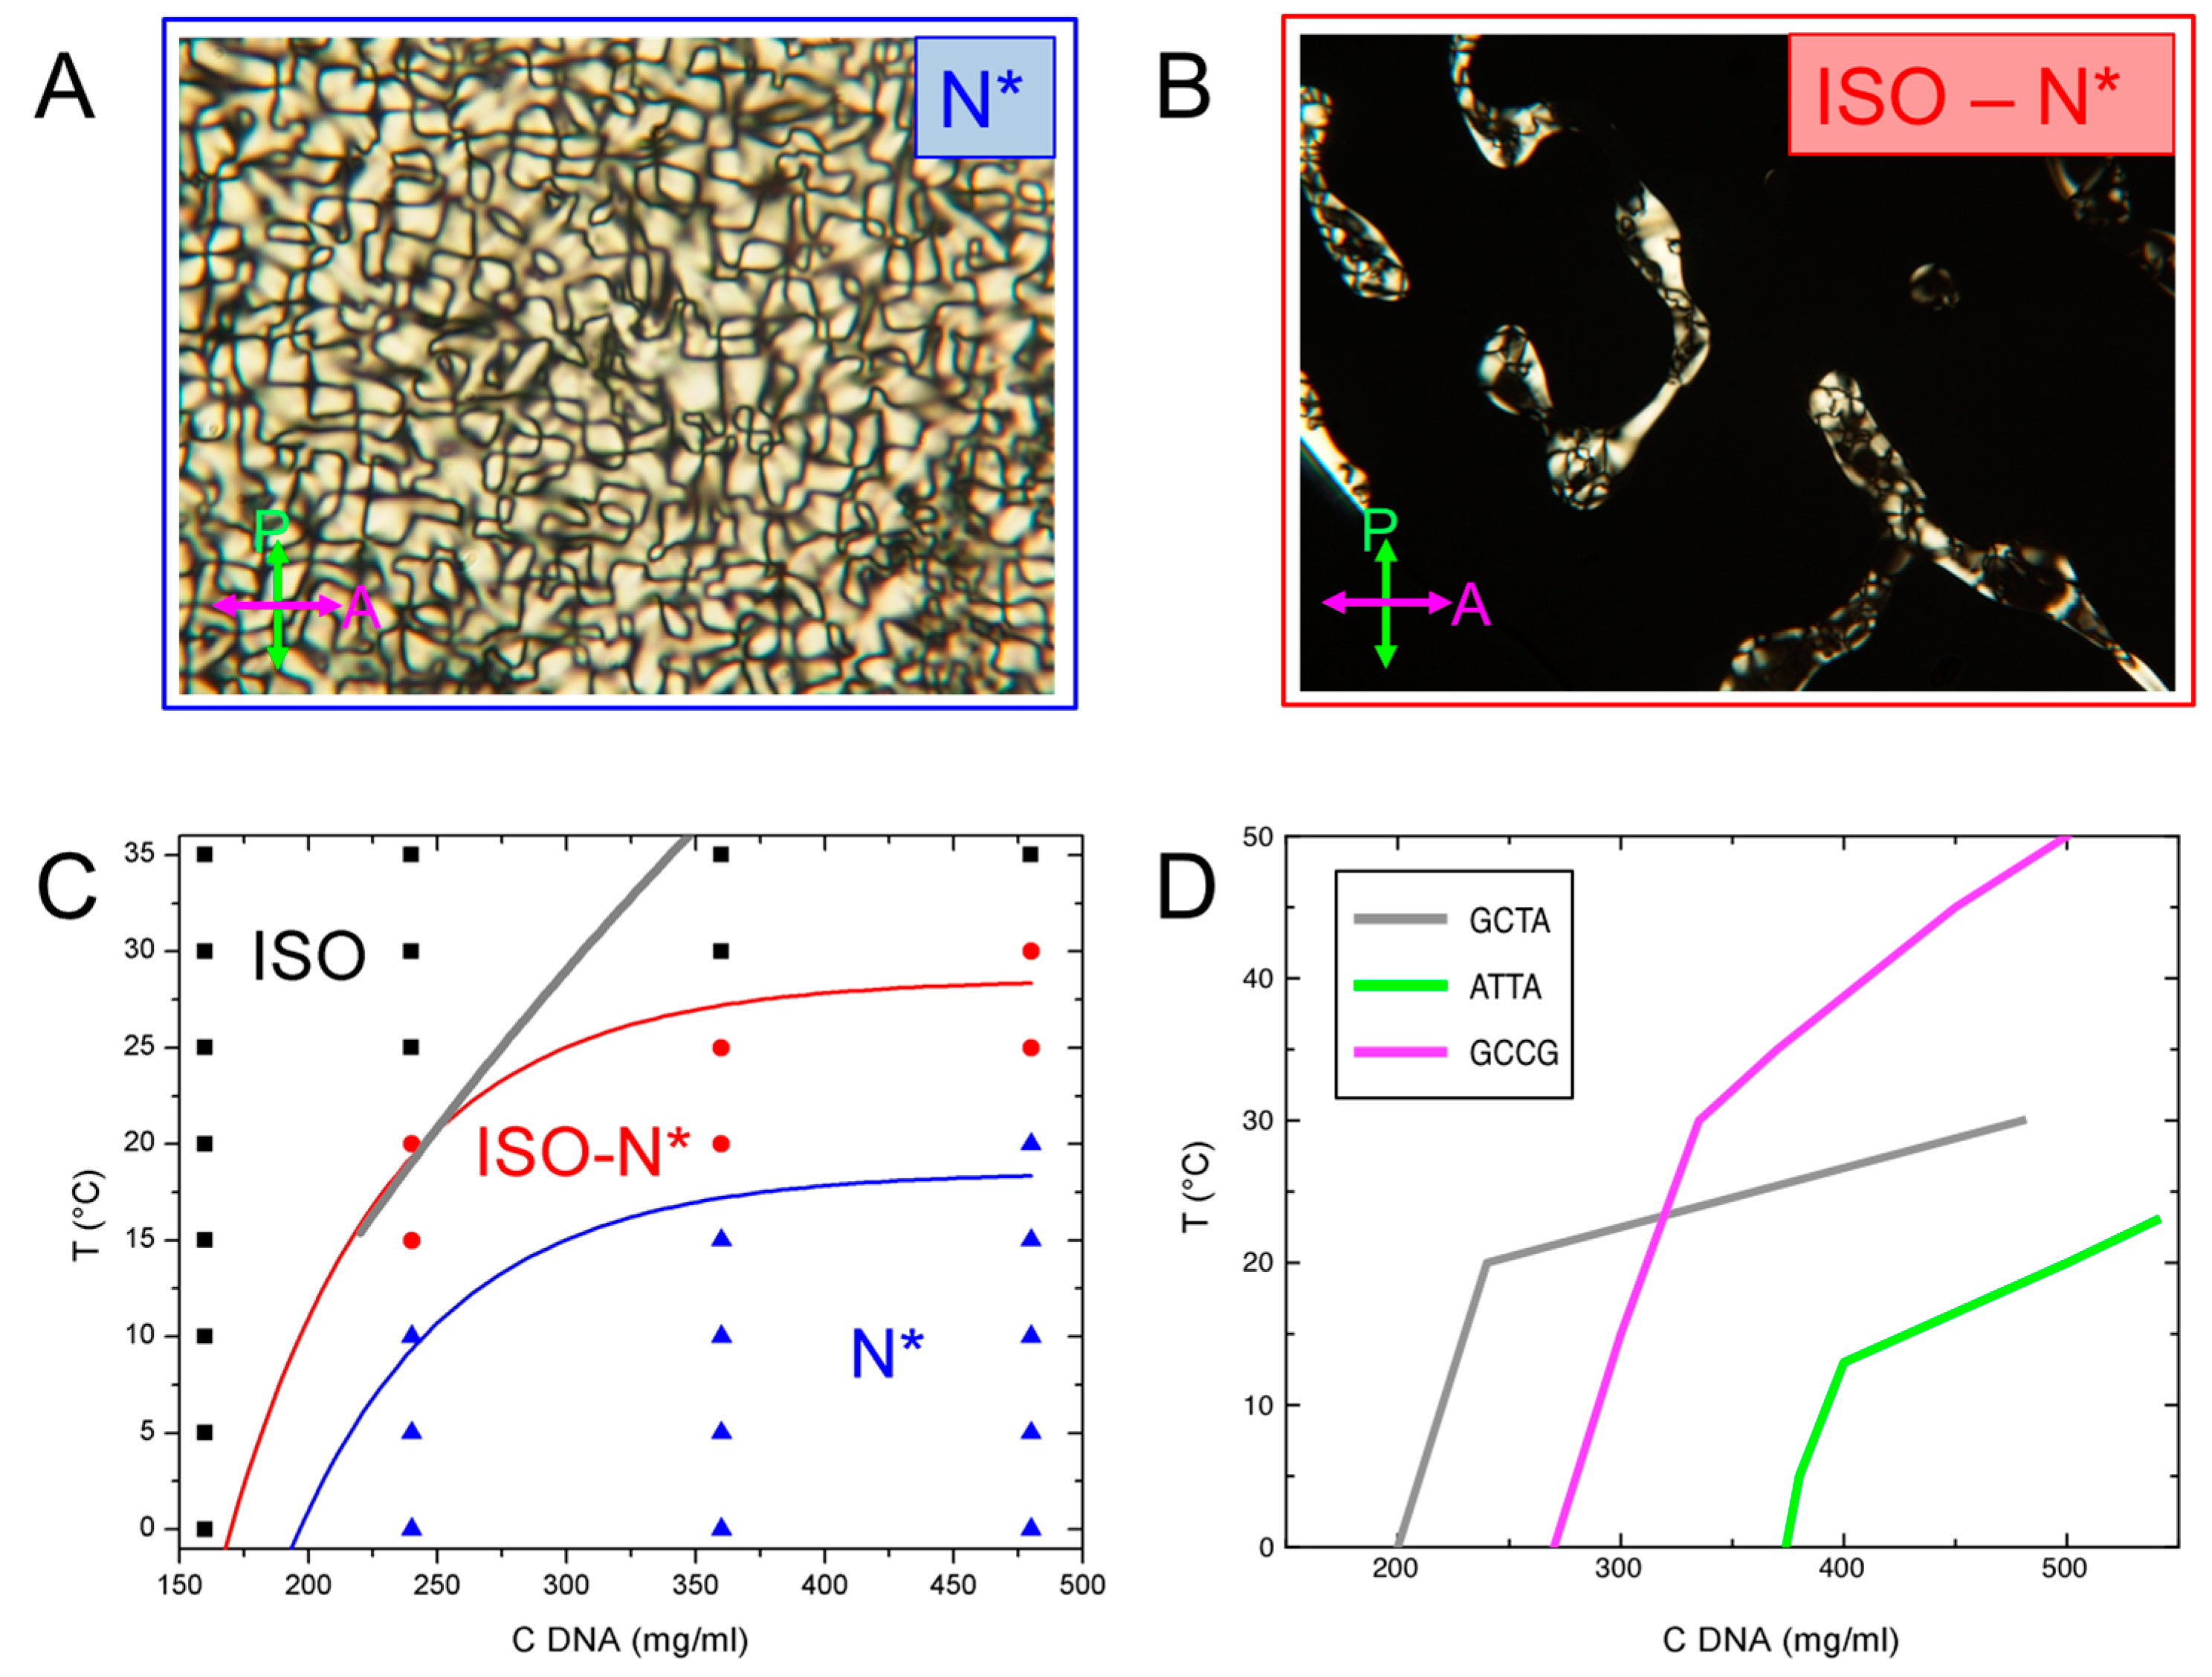
Figure 4.
Handedness of GCTA N* phase. PTOM images of N* texture between perpendicular polarizers (A), and after counter-clockwise (B) and clockwise (C) rotation of the analyzer. Maximum extinction can be achieved only rotating analyzer counter-clockwise, revealing the intrinsic left-handedness of the phase.

Figure 5.
Characterization of the N* phase. (A) PTOM images of a N* domain at increasing temperature. The change in texture color is due to the change of the selective refraction wavelength which in turn indicates variation of the cholesteric pitch, p; (B) Intensity spectrum of the transmitted light at four different temperatures (left axes) and the peak wavelength, λ0 = p·n (black dots) which is found to decrease with T (right axes); (C) PTOM image of N* textures under a cDNA gradient, induced by evaporation (direction of which is indicated by the arrow), shows p decrease upon cDNA increase.


Table 1.
ΔG values calculated for the formation of a GCTA linear aggregate, assuming a chain has two main growing motifs: the pairing of the GC 5′-overhangs (ΔGGC) or of the TA 3′-overhangs (ΔGTA). ΔG* is the value obtained fitting the melting temperature data, shown in Figure 2E, with the TM predicted by the aggregation model.
| ΔH (kcal mol−1) | ΔS (cal mol−1 K−1) | ΔG37 °C (kcal mol−1) | |
|---|---|---|---|
| ΔGGC | −27 | −72.2 | −4.61 |
| ΔGTA | −22.2 | −65.2 | −1.97 |
| ΔG* | −18.8 | −48 | −3.91 |
© 2017 by the authors. Licensee MDPI, Basel, Switzerland. This article is an open access article distributed under the terms and conditions of the Creative Commons Attribution (CC BY) license (http://creativecommons.org/licenses/by/4.0/).
Share and Cite
MDPI and ACS Style
Fraccia, T.P.; Smith, G.P.; Clark, N.A.; Bellini, T. Liquid Crystal Ordering of Four-Base-Long DNA Oligomers with Both G–C and A–T Pairing. Crystals 2018, 8, 5. https://doi.org/10.3390/cryst8010005
AMA Style
Fraccia TP, Smith GP, Clark NA, Bellini T. Liquid Crystal Ordering of Four-Base-Long DNA Oligomers with Both G–C and A–T Pairing. Crystals. 2018; 8(1):5. https://doi.org/10.3390/cryst8010005
Chicago/Turabian StyleFraccia, Tommaso P., Gregory P. Smith, Noel A. Clark, and Tommaso Bellini. 2018. "Liquid Crystal Ordering of Four-Base-Long DNA Oligomers with Both G–C and A–T Pairing" Crystals 8, no. 1: 5. https://doi.org/10.3390/cryst8010005
Note that from the first issue of 2016, this journal uses article numbers instead of page numbers. See further details here.