Article

Effect of Sonication Output Power on the Crystal Structure and Magnetism of SrFe12O19 Nanoparticles

by
Roberto L. Palomino Resendiz
1,
Félix Sánchez De Jesús
1,
Claudia A. Cortés Escobedo
2,
Leticia E. Hernández Cruz
1 and
Ana M. Bolarín Miró
1,*
1
Área Académica de Ciencias de la Tierra y Materiales, Universidad Autónoma del Estado de Hidalgo, Carretera Pachuca-Tulancingo Km. 4.5, Pachuca C.P. 42184 Hidalgo, Mexico
2
Centro de Investigación e Innovación Tecnológica del Instituto Politécnico Nacional, Cerrada Cecati s/n, Col. Sta. Catarina, Azcapotzalco C.P. 02250, Ciudad de México, Mexico
*
Author to whom correspondence should be addressed.
Crystals 2018, 8(1), 45; https://doi.org/10.3390/cryst8010045
Submission received: 24 November 2017 / Revised: 17 December 2017 / Accepted: 16 January 2018 / Published: 19 January 2018
(This article belongs to the Special Issue Crystal Structure of Magnetic Materials)

Abstract

:
We reported the effect of the sonication output power (SOP), from 120, 180, to 240 W, on the crystal structure, morphology, and magnetic properties of SrFe12O19 nanoparticles synthesized by sonochemical process assisted with heat treatment. X-ray Diffraction analysis of the obtained powder showed the formation of Fe3O4 with low crystallinity degree, which increased with the increase in SOP, together in a crystalline phase identified as SrCO3. The formation of SrFe12O19 started at 1073 K, and was completed at 1173 K. However, hexaferrite was obtained with the secondary phases α-Fe2O3 and SrFeO2.5. At 1323 K, the secondary phases vanished, and a single phase SrFe12O19 was detected. Vibrating Sample Magnetometry analysis showed that the SrFeO2.5 phase caused the formation of a hysteresis loop known as the Perminvar magnetic hysteresis loop. At 1323 K, the powder synthesized at 120 W showed a specific magnetization of 67.15 Am2/kg at 1.43 × 10⁶ A/m, and coercivity of 4.69 × 10⁴ A/m, with a spherical-like morphology and average particle size of 56.81 nm obtained by Scanning Electron Microscopy analysis. The increment of SOP promoted a high degree of crystallinity and decrease in crystal size. Additionally, it promoted the formation of secondary phases, induced agglomeration, and modified the morphology of the particles.

1. Introduction

In recent years, the synthesis of magnetic nanomaterials has been investigated for various applications due to their unique magnetic properties [1]. The hexagonal ferrite type-M is denoted by the formula MFe12O19, where M is a divalent metal ion, typically Sr2+, Ba2+, or Pb2+ [2]. Since its discovery in 1950 [3], the hexagonal ferrite type-M SrFe12O19 has played an important role in hard magnetic materials and has been studied for decades due to its good chemical stability, ferrimagnetic behavior, high Curie temperature, high saturation magnetization, high coercivity, high magneto-crystalline anisotropy (MCA), and it is inexpensive compared to similar compounds [4,5,6]. As it has magnetization values of about 60 Am2/kg and coercivity of 4.37 × 10⁵ A/m, it is widely used in magnetic recording material, data storage devices [7], magneto-optical recordings, microwave devices [8], permanent magnets, and electromagnetic devices [9]. A number of recent studies have considered SrFe12O19 nanoparticles (NPs) in a composite as a promising candidate material for biomedical applications, primarily because of their biocompatibility, an example of which is the treatment for cancer known as magnetic hyperthermia, where heat generated by magnetic nanoparticles in a radio frequency magnetic field is used to destroy malignant cells [10].
The structure of the ferrite type-M is formed by sequentially stacking the blocks of a cubic block S, with a spinel-type structure, and a hexagonal block R, that form SRS*R*, where * denotes a 180° rotation about the c axis. The unit cell of Sr-M contains two molecules SrFe12O19 (Z = 2) [1]. The structure comprises an S block, which is a spinel type structure denoted by the formula AB2O4 where the metal A2+ occupies tetrahedral interstitial sites, while the metal B3+ occupies octahedral interstitial sites [11], and a block R hexagonal type that contains the Sr2+ [2]. The hexagonal Sr-ferrite has a 24 magnetic Fe3+ ion per unit cell [12], which are distributed on five different crystallographic sites: three octahedral sites, 12k, 2a and 4f2, one tetrahedral site 4f1, and one trigonal bi-pyramidal site, 2b. Twelve Fe3+ ions have a chemical function, four of them have a spin in the downward direction at 4f1 (2Fe3+) and 4f2 (2Fe3+), and the eight Fe3+ ions have spin in the upward direction at 12k (6Fe3+), 2a (1Fe3+), and 2b (1Fe3+), according to the magnetic structure given by Gorter [13].
SrFe12O19 has been synthesized by several methods such as co-precipitation [14], mechanosynthesis [7], the hydrothermal process [5], and the sol-gel method [15] among others. However, these methods have a high cost, in addition, they are processes that are difficult to control and are tedious.
The use of ultrasonic irradiation for the synthesis of ferrites has been a research topic of great interest in recent years since it has high potential to produce nanocrystalline structures or nanoparticles [16]. Additionally, this synthesis method is friendly to the environment by using water as a solvent, and is also simpler and cheaper when compared to other synthetic routes [17]. Recently, we reported the synthesis of SrFe12O19 nanoparticles using the sonochemical assisted method, where the synthesis mechanism was described for particular experimental conditions [18]. Based on this study, the aim of this work was to extend knowledge on the synthesis mechanism and propose the best process parameters, particularly the sonication output power. In the process of sonochemistry, the molecules undergo a chemical reaction due to the application of ultrasound shockwaves with a combination of sinusoidal pressure waves at a frequency of 20 kHz [16,17,18,19,20]. Due to the effect of this ultrasonic irradiation, sonochemistry induces the phenomenon of acoustic cavitation (the formation, growth, and violent collapse of bubbles in a liquid medium). When the transient bubble collapses, localized points known as Hot Spots are formed, where extreme conditions of temperature (5000 K) and pressure (1800 kPa) are generated with a duration of nanoseconds within the bubbles [11]. According to some authors [18,19] the sonication of an aqueous medium produces the process known as sonolysis, which is the breakage of the homolytic bond of the present water molecules, generating H· and ·OH radicals, where these ·OH radicals recombine to form the strong oxidizer H2O2, which causes chemical and physical effects, as indicated in the following equations [17].
H 2 O ) ) ) HO · + H
H · + H ·   H 2
OH +   · OH   H 2 O 2
Fe 2 + +   H 2 O 2   Fe 3 + +   · 2 OH
Using ultrasonic waves in media with high viscosity leads to an effect of acceleration of the dynamics and rate of chemical reactions, improving the activity of the solid particle surface and the dynamic of the reaction, which induces an acceleration in the mass transfer process. By controlling parameters such as the sonication output power, different end-product properties can be obtained such as particle size, crystallinity, magnetic properties, morphology, etc. Unfortunately, there are very few studies in the published literature that describe in an understandable way the effects of the variation of the sonication output power (SOP) on the above-mentioned properties of the obtained end-product.
Kandjani et al. [16] and Hassanjani-Roshan et al. [19] reported on similar studies about the effects of SOP variation on the sonochemical synthesis of nanoparticles of ZnO and α-Fe2O3, respectively. Their results only described the effects on the crystal structure and morphology of the particles obtained at low SOP (1–45 W). Additionally, they did not report on the study of the magnetic properties; therefore, the effect of the SOP variation on the crystalline structure and its ratio with the magnetic properties of the obtained material are not well understood. The technological and biomedical applications of transition metal oxide nanoparticles are attributed to their unique characteristics, such as a large surface area, confinement of the quantum effect, optical and magnetic properties, etc. In recent studies, Kaviyarasu et al. [20,21] reported the synthesis of ZnO nanoparticles, for use in photocatalysis, antibacterial applications, and to reduce the cytotoxicity in a biological system of ZnO doped with TiO2.
The aim of this study was to investigate the effect of SOP applied in the synthesis of nanoparticles of strontium hexaferrite by a sonochemical assisted method using iron and strontium metallic acetates as precursor materials in a diethylene glycol solution and deionized water. To evaluate the effect of varying SOP and to compare with other authors [16,19], we used high SOP (120, 180, and 240 W). These values were chosen in the first instance as the maximum power available of the sonication device used was 300 W, therefore, the chosen values corresponded to 40%, 60%, and 80% of the maximum power of the device. In the second instance, it is well known that SOPs above 100 W are considered high sonication powers, and similar studies up until now have used SOPs below this value, for which it is expected that there are significant effects on the properties of the materials obtained. The effect of this high SOP on the complex crystal structure of the strontium hexaferrite, the morphology, and its influence on magnetic properties is discussed.

2. Materials and Methods

The sonochemical synthesis was performed using iron acetate (II) (anhydride, Fe 29.5% min, Alfa Aesar, Haverhill, MA, USA) and strontium acetate (99.995% purity, Sigma Aldrich, St. Louis, MO, USA) as precursors. Stoichiometric amounts of these materials were dissolved in 50 mL of solvent, a mixture of diethylene glycol (99%, Alfa Aesar, Haverhill, MA, USA) and deionized water (10% v/v) in a ratio of 2:1, for 1 h under mechanical stirring in an air atmosphere, following the reactions corresponding to obtaining strontium hexaferrite.
12 Fe ( C 2 H 3 O 2 ) 2 + Sr ( C 2 H 3 O 2 ) 2 + 13 H 2 O ) ) ) ,   DEG : H 2 O SrFe 12 O 19 + 26 ( C 2 H 4 O 2 )
The solution was sonicated using an Ultrasonic Homogenizer 300VT equipped with a piezoelectric transducer at a frequency of 20 kHz and a solid titanium tip of 9.5 mm, which was immersed directly into the solution up to 1.42 cm, in accordance with the operation manual of the device, which indicates that it must be submerged 1.5* (diameter of the tip). The experiments were performed at 120, 180, and 240 W of SOP. The baker was placed into an ice bucket, where the temperature of the solution in all cases did not exceed 318 K after 3 h of ultrasonic irradiation. In addition, there were no changes to the sonicated volume. Figure 1 shows a schematic diagram of the experimental sonochemical set up. After the sonochemical process, powders were washed three times using ethanol, and centrifuged at 12,000 m−1 for 15 min. Subsequently, the powders were dried at 353 K in air. The powders obtained (named “as obtained”) were heat treated at temperatures of 1073, 1173, and 1323 K in air.
The analysis of the crystal structure by X-ray diffraction (XRD) of the obtained powders was performed in a Equinox 2000 diffractometer (Inel, Artenay, France), using radiation Co. Kα1 (λ = 1.7890100 Å). Geometric symmetry sweep measurements were carried out from 20° to 80° in 2θ. Rietveld refinements were achieved on the X-ray diffraction patterns to obtain the percentages of the different phases, crystallite size, and microstrain of the powders. This method considers all the collected information in a diffraction pattern and uses a least-squares approach to refine the theoretical line profile until it matches the measured profile [22]. Crystallographic data were obtained from the Crystallographic Open Database [23]. Morphological analysis and particle size determination were accomplished with scanning electron microscopy (SEM) JEOL-100-CX II (JEOL, Tokyo, Japan). Magnetization studies were performed at room temperature using a EV7 vibrating sample magnetometer (VSM, Microsense, Lowell, MA, USA) with a ±1.43 × 10⁶ A/m field.

3. Results

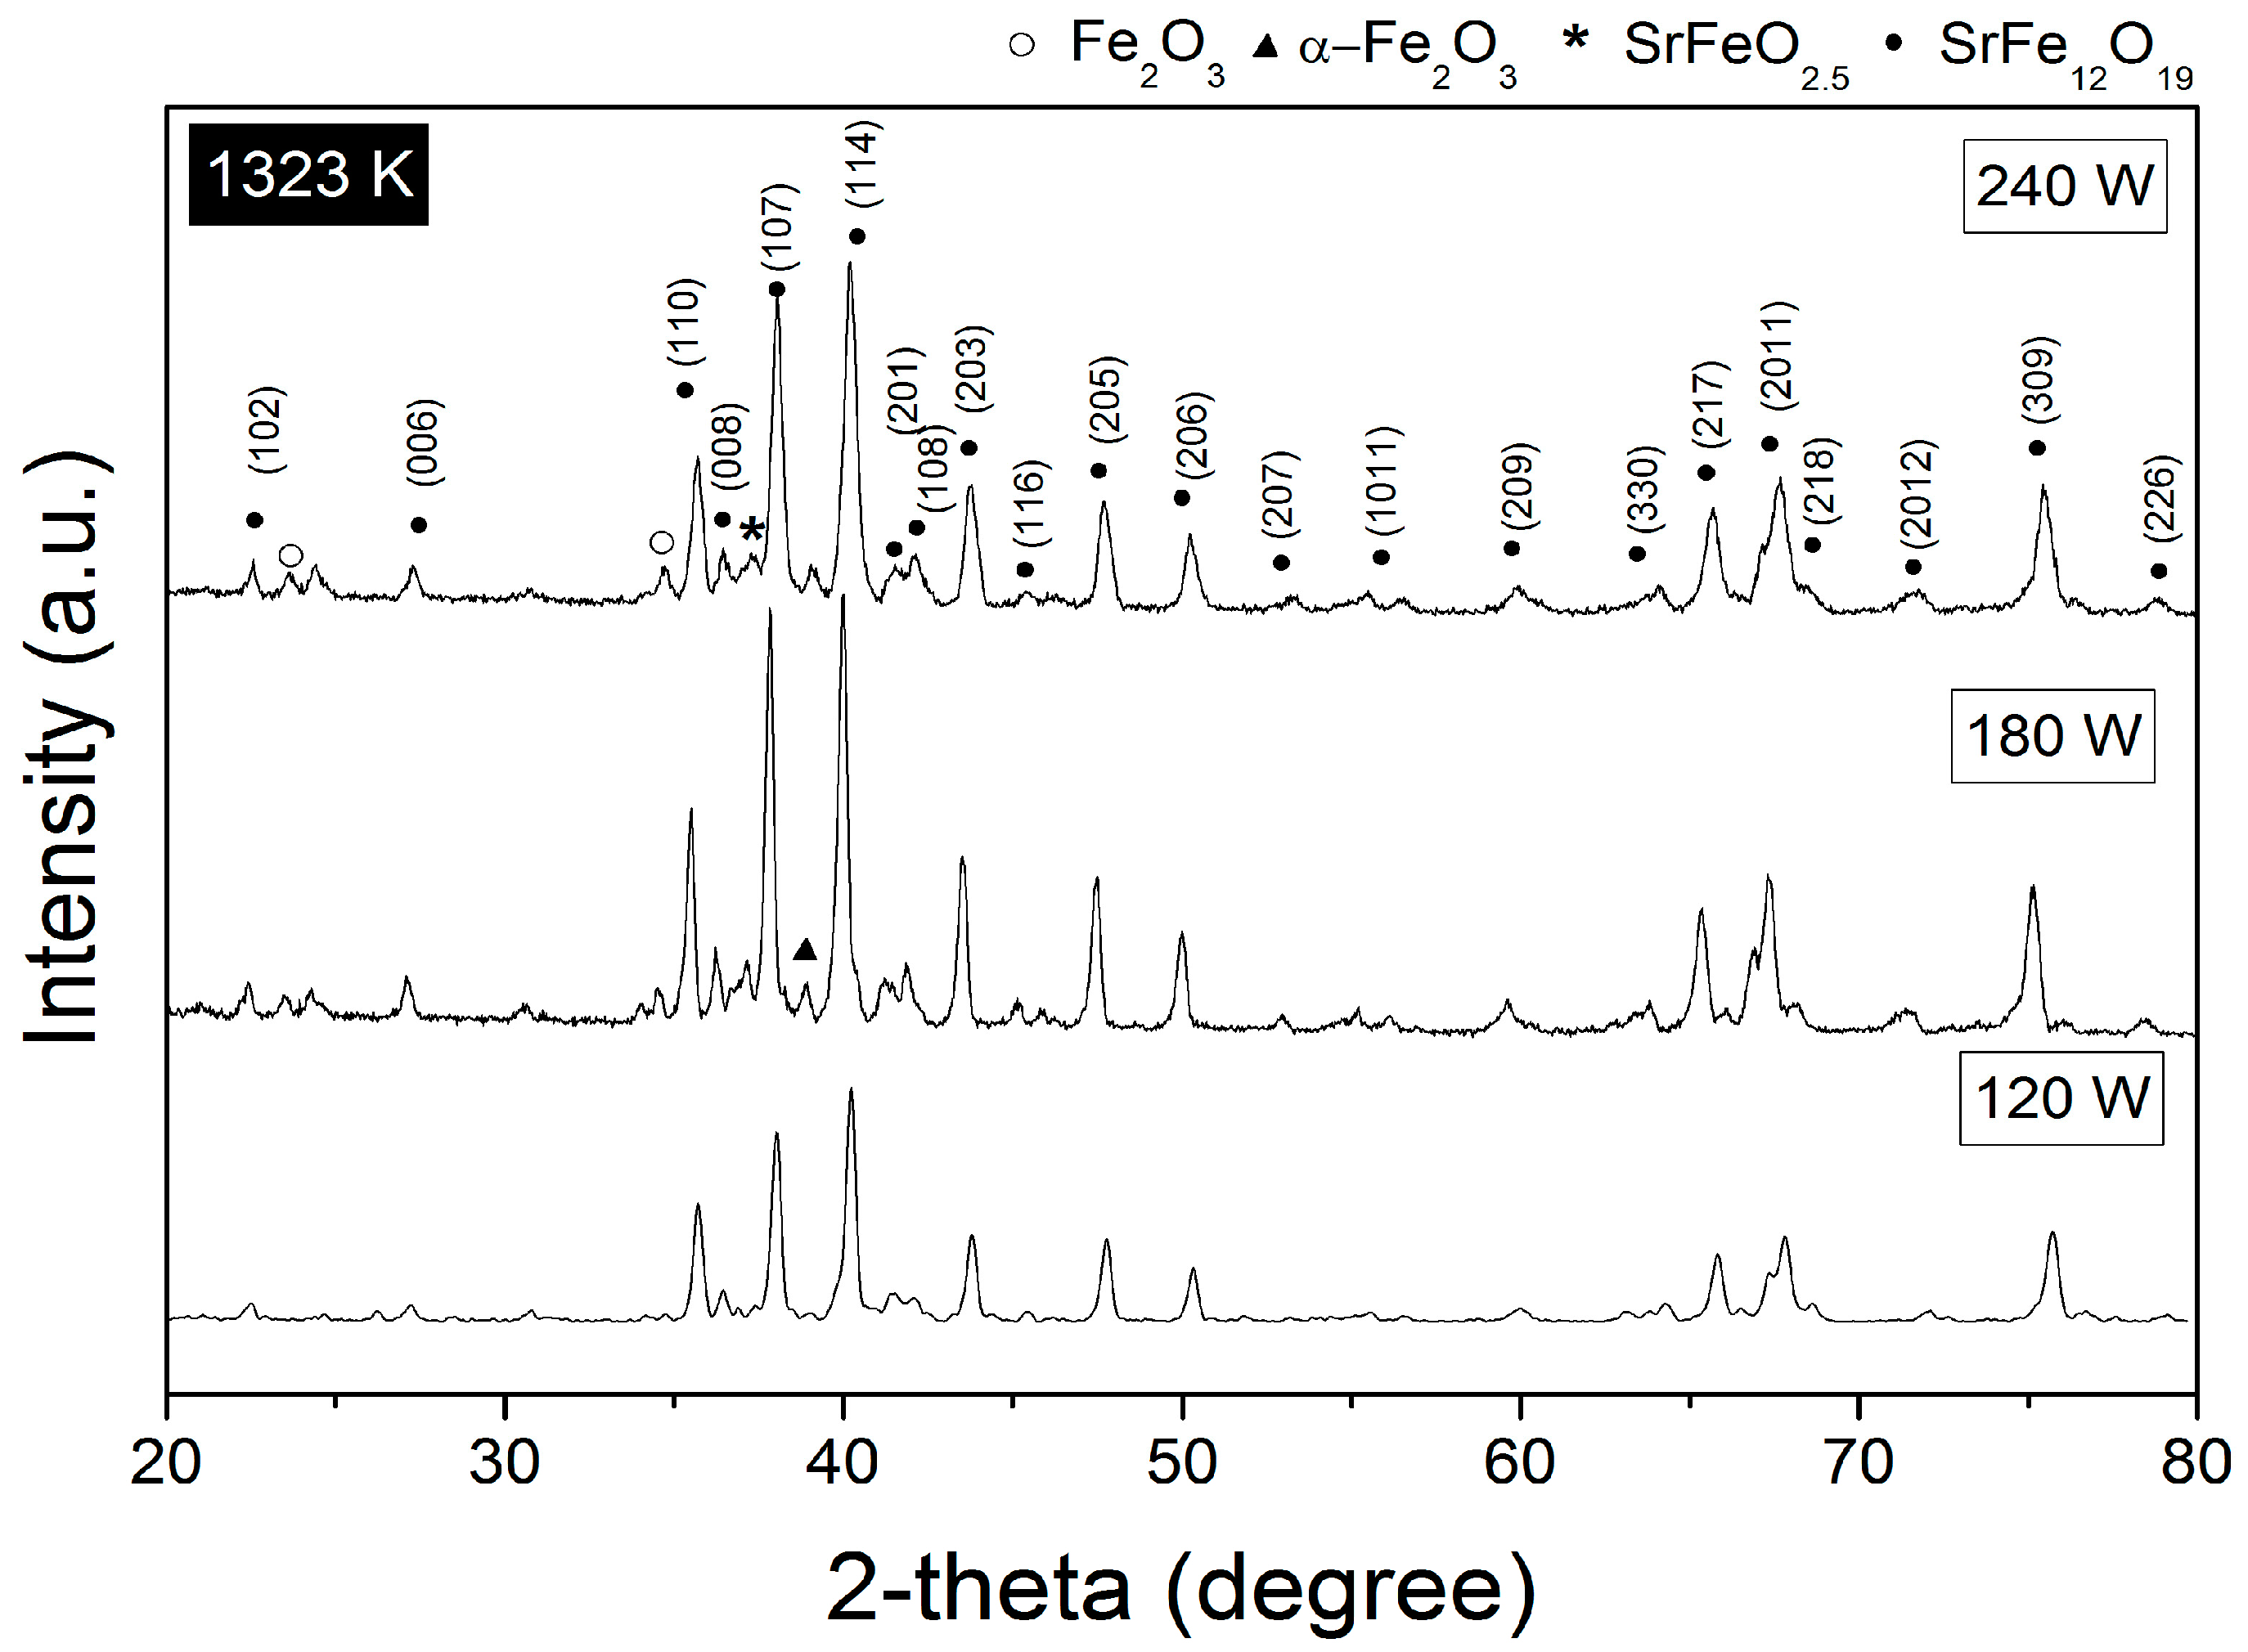
3.1. Crystal Structure

Figure 2 shows the XRD patterns of powders synthesized by sonochemistry using different SOPs (120, 180, and 240 W) over 3 h without heat treatment (as obtained). At an SOP of 120 W, it was observed that the powders consisted of a mixture of Fe3O4 (Powder Diffraction File (PDF)-2 00-065-3107), showing a low crystallinity degree, and SrCO3 (PDF-2 00-084-1778). Moreover, by increasing the SOP to 240 W, the phases remained the same, but the powders obtained showed a higher crystallinity degree, as observed through the sharpening of diffraction peaks as the power was increased. This fact can be attributed to the effect of SOP on the nucleation rate and crystal growth as a consequence of the increase in the number and rate of reactions, which is typical of the sonochemistry process [24]. At a higher SOP, a greater number of Hot Spots were produced, therefore, there was a greater number of reaction sites, which reached the energy necessary to generate nuclei and crystallize, in this case, an Fe3O4 phase.
Table 1 shows phase vol (%), crystallite size (D), and microstrain (µs) of the synthesized powders obtained by the Rietveld refinement of the XRD patterns in Figure 2. Additionally, it shows the crystallinity percentage index (%), which was calculated according to the following expression proposed by Bailey et al. [25]: Ic (%) = [1 − Imi/IMA] × 100; where, Ic is the minimum intensity peak value, Imi is the minimum intensity peak value, and IMA is the maximum intensity peak value.
As can be observed in Table 1, the results indicate that 120 W promoted the formation of nuclei and initiated the growth of the crystals. However, the energy provided was not sufficient for synthesized crystalline hexaferrite, forming amorphous magnetite and strontium carbonate. Furthermore, at 180 W and 240 W of SOP, the energy was enough to form nuclei and increased the percentage of crystallization. Therefore, the increase in SOP increased the percentage in volume of the Fe3O4, while the percentage of SrCO3 decreased. In addition, at 180 and 240 W, a high degree of crystallinity and decrease in the crystal size was promoted.
However, even when an increase in SOP produced a higher phase of Fe3O4 with a high degree of crystallinity, the sonochemical process did not provide sufficient energy for the synthesis of strontium hexaferrite. Therefore, it was necessary to add energy by means of a heat treatment to achieve the desired phase. Figure 3, Figure 4 and Figure 5 show the effect of an annealing temperature into the crystal structure of the sonicated powders.
Figure 3 shows the XRD patterns corresponding to the effect of annealing at 1073 K on the powders obtained using different SOP. As can be seen, the XRD pattern of the powder synthesized using 120 W of SOP identified diffraction peaks that corresponded to SrFe12O19 (PDF-2 00-079-1411) and α-Fe2O3 (PDF-2 01-084-0311). Additionally, in the XRD patterns of the powders synthesized using 180 and 240 W of SOP, peaks belonging to SrFe12O19 mixed with α-Fe2O3 were observed. In addition, an interesting difference was found in these patterns (180 and 240 W). The XRD patterns at 37.04° of 2θ presented a peak that increased its intensity in proportion to the increase of SOP; this phase was identified as a cubic type Perovskite structure SrFeO2.5 (PDF-2 00-033-0677). This phase formed from the reaction between SrCO3 and α-Fe2O3, which occurred at heat in a range from 1053 to 1173 K [5,26]. Moreover, peaks at 23.57° and 34.6 8° of 2θ were identified as a polymorphic phase of hematite, Fe2O3 (PDF-2 00-021-0920) [27]. Additionally, an increase in the intensity of the diffraction peak at 40.34° of 2θ was observed, which corresponded to FeO (PDF-2 00-049-1447). This phase was ascribed to the decomposition of Fe2O3 [28]. The presence of these secondary phases was attributed to the fact that the increase in SOP in the synthesis of the powders obtained at 180 and 240 W and the subsequent heat treatment at 1073 K produced an excess of the Fe3+ species that promotes the formation and crystallization of Sr-Fe oxides as contaminating phases in the powders.
The XDR for the “as obtained” powder annealed at 1173 K and 1323 K are shown in Figure 4 and Figure 5, respectively. The results showed the same behavior as that of the powder annealed at 1073 K, as previously described.
Table 2 shows the Rietveld refinement results of the phase vol %, the crystallite size (D), and the microstrain (µs) of the XRD patterns (Figure 3, Figure 4 and Figure 5). These results confirmed that high SOPs such as 180 and 240 W promoted the crystallization of secondary phases such as SrFeO2.5, α-Fe2O3, and Fe2O3, in annealed powders. Likewise, for the low annealing temperature of 1073 K, the crystal size decreased considerably with the SOP, achieving 4.9 nm at 240 W. In contrast, for the high annealing temperatures of 1173 K and 1323 K, the crystal size increased with the SOP due to the fact that at high annealing temperature, the nucleation of the SrFe12O19 is completed and the growing stage promoted. Therefore, it can be concluded that the best condition of SOP is 120 W, followed by annealing at 1323 K. Under these experimental conditions, an almost pure phase of SrFe12O19 (98.8%) with a crystal size around 64 nm was obtained. Furthermore, the microstrain did not show a significant difference and remained constant for each SOP due to the thermal treatment releasing the microstains.

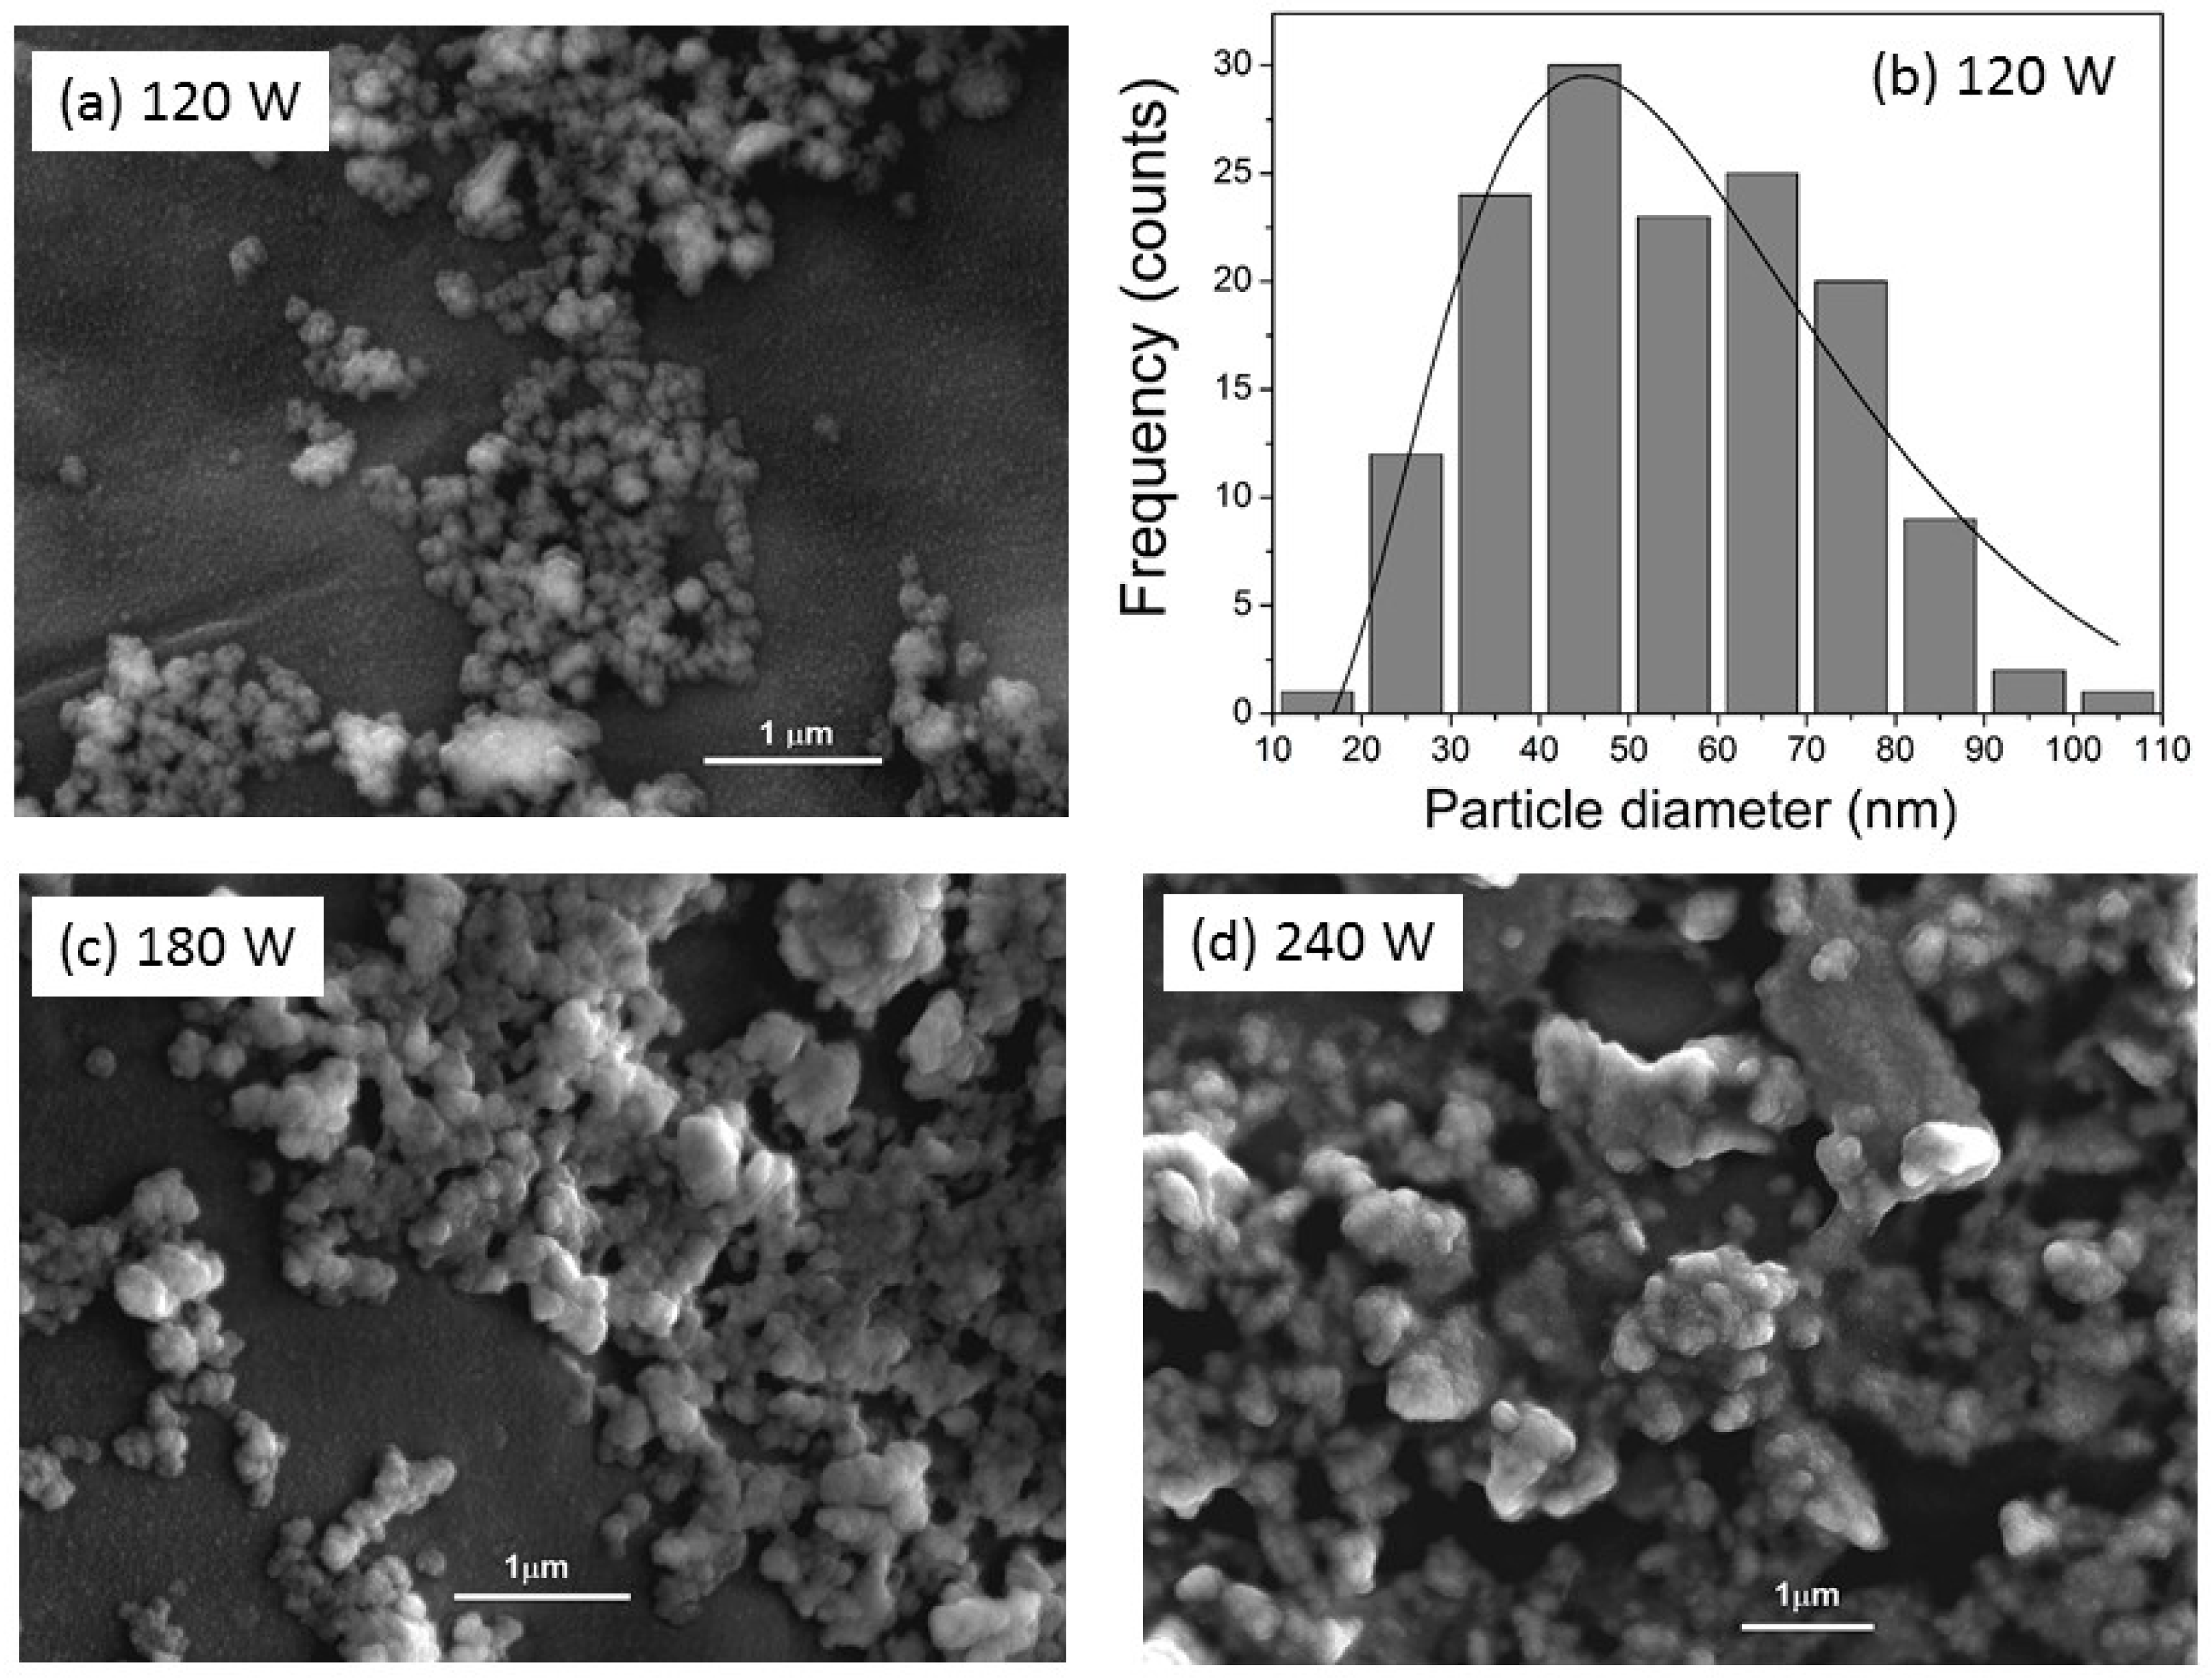
3.2. Morphology Analysis

To qualitatively determine the effect of increasing SOP on particle size and morphology of the heat treated powders, representative SEM micrographs (Figure 6) of the powders synthesized sonochemically by 120, 180, and 240 W of SOP with heat treatment at 1323 K are shown. As observed, the powders consisted in agglomerates of particles with rounded morphology, which formed a bigger particle. It can be further noted that the variation of SOP applied in the synthesis had an effect on their morphology and size. The powder obtained at 120 W qualitatively showed the lowest agglomerate size, and the greatest homogeneity in morphology and size. To quantitatively determine the average particle size of this powder, an image analysis was undertaken (the equivalent spherical projected area diameter was calculated by setting the projected area equal to the equivalent area of a circle), thereby obtaining the nanoparticle size distribution presented in the histogram (Figure 6b), where an average particle size diameter was estimated as 56.81 nm.
As observed in Figure 6, the nanoparticles obtained with 120 W (Figure 6a) of SOP had a spherical-like morphology, commonly produced by the sonochemical synthesis process [16,18,21]. On the other hand, by increasing the SOP at 180 W (Figure 6c), agglomerates of particles were observed, which acquired a quasi-rounded morphology. Finally, in Figure 6d, the powder obtained at 240 W was formed by large agglomerates and particles in bulk with an undefined morphology. It was expected that for higher levels of SOP (180 and 240 W), the particles obtained would show a greater homogeneity in their morphology and sizes; however, the results presented in Figure 6 indicate the opposite, where the effect of high levels SOP promoted an agglomeration of the obtained particles and a modification in its morphology independently of the thermal treatment, as the results shown belong to the thermal treatment at the same temperature (1323 K).

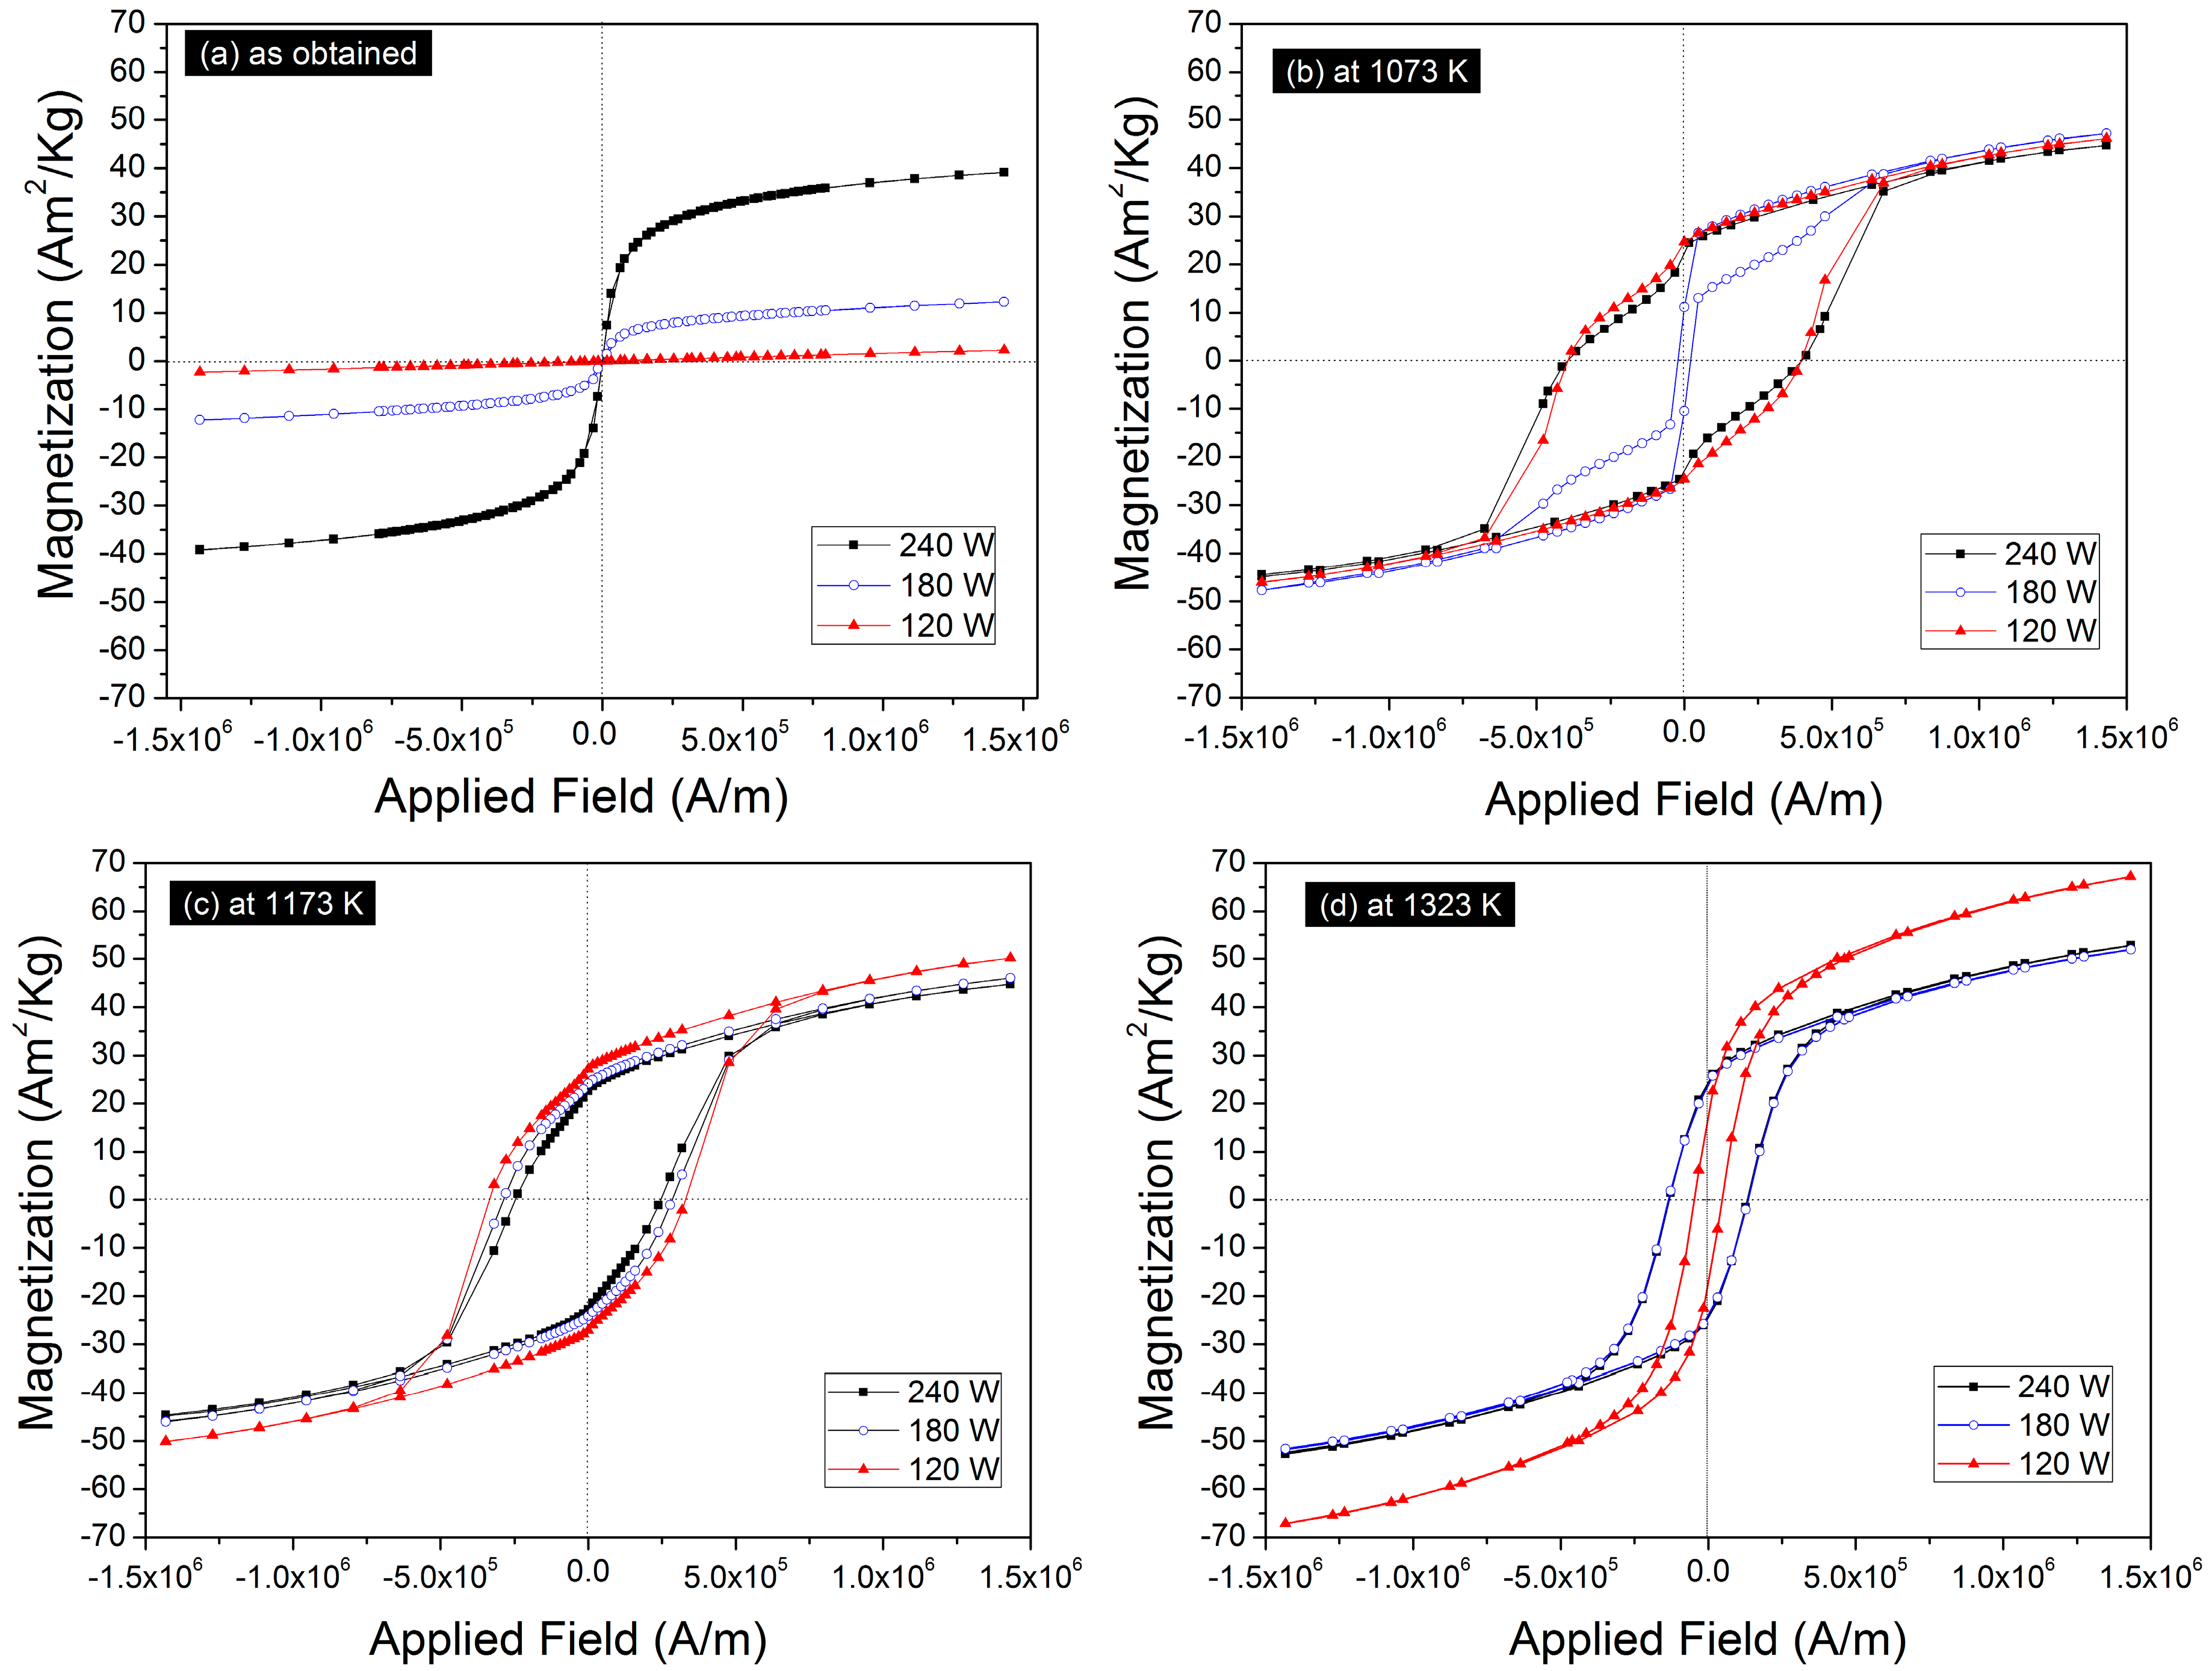
3.3. Magnetic Properties

Figure 7 shows the hysteresis loops M(H) of the powders obtained by sonochemistry with different levels of SOP (120, 180, 240 W) with heat treatment at 1073, 1173, and 1323 K. For the as obtained powder, at 120 W (Figure 7a) the material showed weak magnetic behavior (line with positive slope) with a specific magnetization of 2.2 Am2/kg at 1.43 × 10⁶ A/m. In the same figure, it can be observed that at 180 W, the specific magnetization increased to 12.4 Am2/kg at 1.43 × 10⁶ A/m; moreover, the shape of the curve obtained was typical of the ferrimagnetic behavior of Fe3O4. Finally, in the powder synthesized with 240 W, a significant increase in their specific magnetization (39.5 Am2/kg at 1.43 × 10⁶ A/m) was observed. The increase in the specific magnetization, as well as the change in the curve shape of the powders obtained at 120 and 180 W, was attributed to two main factors: the increases in the degree of crystallinity and the decrease of the crystallite size of the Fe3O4 by the increase in SOP, even when the mass percentage of this phase is similar for all cases. Therefore, there was an improvement in the homogeneity of Fe3O4 that increased the magnetic dominance of the particles, resulting in the alignment of the magnetic spins along the direction of the applied field. Another important factor was the contribution of nonmagnetic compound SrCO3. Due to the increase in SOP, the percentage in mass of this phase decreased as well as its degree of crystallinity, and its presence is reflected in the values of specific magnetization of Fe3O4. This was observed even with the increase of degree of crystallization in the Fe3O4 phase, where the values of specific magnetization were lower than those reported for this type of material.
Figure 7b shows the hysteresis loops M(H) of the powders obtained by sonochemistry at 120, 180, and 240 W of SOP, heat treated at 1073 K. As observed, all samples showed ferrimagnetic behavior with high specific magnetization (~46 Am2/kg in all cases of SOP) and high coercivity (in the case of the powders obtained at 120 and 240 W), confirming the presence of SrFe12O19. All annealed powders showed Perminvar hysteresis loops (also known as “wasp waist”), and were more noticeable in the material synthesized at 180 W, which showed an unexpected low coercivity of 2.31 × 10⁴ A/m. These types of hysteresis loops are associated with the antiferromagnetic coupling of hard and soft magnetic phases, in this case, SrFe12O19 and SrFeO2.5, respectively [29]. These loops are obtained during exposure of an external magnetic field with a very narrow width; when the magnetization is set to zero, the loop width reopens. The main feature of this type of form in the hysteresis loops occurs in the presence of soft magnetic materials and is highly favored by compounds where there is an excess of iron [30].
Increasing the temperature of the heat treatment to 1173 and 1323 K presented the hysteresis loops M(H) shown in Figure 7c,d, respectively. It was observed that all samples showed a change in the hysteresis loops, showing the typical behavior of a hard magnetic phase that corresponded to SrFe12O19, confirming that the reaction for obtaining the hexagonal SrFe12O19 was completed. The powders obtained from the 1173 K had a specific magnetization value below the values reported for strontium hexaferrite [4,13,18], this was due to the presence of secondary phases (SrFeO2.5, α-Fe2O3, Fe2O3) in the strontium hexaferrite that distort the collinear arrangement of parallel spin, therefore, it is known that the value of Ms in the SrFe12O19 is determined by the distribution of Fe3+ ions in five different crystallographic sites and by the super exchange interaction between the Fe-O-Fe bond. These cases are similar to the materials obtained at 180 and 240 W heat treated at 1323 K. The optimal results were shown in those obtained from the powder synthesized at 120 W of SOP as a significant increase in the specific magnetization was present in the powders obtained at 1173 K and reached a value of 67.15 Am2/kg with an Hc of 4.69 × 10⁴ A/m from the thermal treatment at 1323 K. Additionally, this powder had a decrease in the coercive field, which was due to the small D (56.81 nm) confirmed by SEM, where this value was below the critical radius of the hexaferrite (367.22 nm). This value separates the transition of a monodomain state to a magnetic multidomain [13]. Additionally, it showed behavior belonging to a superparamagnetic material, expected for single-domain nanoparticles. The decrease of the coercive field of mono-domain nanoparticles was strongly related to the crystallite size and can be explained by Herzer’s theory [31]. According to this theory, the coercivity of nanoparticles is proportional to D6, when the size is in a single-domain size and is inversely proportional, i.e., 1/D for multi-domain particles. Table 3 lists the values of the magnetic parameters, specific magnetization (Ms), remanent magnetization (Mr), and coercive field (Hc) obtained from the magnetic analysis at room temperature.
The value of remanent magnetization and the ratio (Mr/Ms) of the powders obtained at different SOPs, were calculated. This ratio takes values between 0 and 1, and represents the existence or absence of different types of exchanges of magnetic domains. When R < 0.5, particles interact through a magnetostatic interaction; when R = 0.5, it indicates that the particles do not interact, are randomly oriented, and undergo coherent rotations. When 0.5 < R < 1, it indicates that there is a strong interaction of change and coupling between the particles [32]. It is well known that the Ms and Mr decrease monotonously and that the coercive field increases or decreases randomly, which is attributed to microstructural characteristics (particle size, morphology, crystallinity, etc.), as well as the homogeneity of the material and the value of the magnetocrystalline anisotropy constant. However, these factors are not decisive when determining the variation of the coercive field, since in the synthesized samples of this work, these values were irregular with increases in SOP. This decrease in the coercive field of this specific case was due to the variation of any of these parameters, or the molar ratio of Fe3+ is much lower than 12 (which would produce vacancies of Fe3+ in the crystal structure of the SrFe12O19), as a result, when the material is subjected to magnetization and the demagnetization process, these ionic vacancies avoid movement of the Bloch walls. The experimental value of the ratio Mr/Ms for the powders obtained at 1323 K heat treatment with 180 and 240 W was 0.46, indicating that the particles were randomly oriented, while that obtained at 120 W was 0.25, indicating that there was magnetostatic interaction, which can be attributed to the particle size obtained.

4. Conclusions

This work presented the effects induced by the variation of the SOP applied at 120, 180, and 240 W in the synthesis of SrFe12O19 nanoparticles by a sonochemical assisted method of a mixture of metal salts dissolved in a polyol solution composed by DEG:H2O. The results confirmed a notable influence of the variation in SOP on the crystal structure, size crystal, size particle, morphology, and magnetic properties. Powders “as obtained” from the method of synthesis were identified as a phase of Fe3O4, which showed an increment of degree of crystallinity with the increase in the SOP applied; this phase, along with another phase identified as SrCO3, induced the synthesis of strontium hexaferrite after the mixture was subject to 1073, 1173, and 1323 K of heat treatment in air. The powders obtained at higher SOPs (180 and 240 W) had a higher rate of impurities in their composition due to an excess of Fe3+, such as α-Fe2O3, FeO, and the Perovskite SrFeO2.5; this last phase being obtained in the powders at 1073 K was the main cause of the formation of a hysteresis loop known as “wasp waist”. The heat treatment at 1173 K indicated the complete formation of strontium hexaferrite, and at 1323 K, a simple-phase was obtained. The magnetic properties of the particles of SrFe12O19 obtained at 120 W of SOP at 1323 K showed a high specific magnetization of 67.15 Am2/kg at 1.43 × 10⁶ A/m, and coercivity of 4.69 × 10⁴ A/m. Moreover, it had an average size of 56.81 nm, which indicated superparamagnetic behavior and showed a spherical morphology, which was confirmed by SEM. Therefore, a conclusion was reached where the effects of increases in SOP of the powders obtained from the process of synthesis produced a greater percentage in volume of the Fe3O4 phase, promoted a high degree of crystallinity, and decreased in the crystal size. Furthermore, it produced a crystallization of secondary phases in the powders obtained at 120, 180, and 240 W when heat treated. Using high SOPs (180 and 240 W) promoted an agglomeration of the obtained particles and a modification in its morphology. The magnetic properties were affected by the impurities present in the powders, which had a direct effect on the magnetic interactions of the material, resulting in significant changes in the magnetic properties of the hexaferrite strontium nanoparticles obtained. It can be concluded, in accordance with the results discussed above, that it is convenient to use a SOP of 120 W for the synthesis of a simple-phase of SrFe12O19 that is free of secondary phases with remarkable magnetic properties.

Acknowledgments

The authors thank the Center of Nanosciences and Micro and Nanotechnology of the National Polytechnic Institute, in particular Hugo Martínez Gutiérrez, for morphological characterization.

Author Contributions

Roberto L. Palomino Resendiz performed the experiments, discussed the experimental data, and wrote the paper. Félix Sánchez De Jesús performed the magnetic characterization and discussed the experimental data. Ana M. Bolarín Miró and Claudia A. Cortés Escobedo designed the experiments and discussed the experimental data. Leticia E. Hernández Cruz reviewed the manuscript.

Conflicts of Interest

The authors declare no conflict of interest.

References

  1. Chong, S.V.; Williams, G.V.M.; Kennedy, J.; Fang, F.; Tallon, J.L.; Kadowaki, K. Large low-temperature magnetoresistance in SrFe2As2 single crystals. EPL Europhys. Lett. 2013, 104, 17002. [Google Scholar] [CrossRef]
  2. Töpfer, J.; Seifert, D.; Le Breton, J.-M.; Langenhorts, F.; Chlan, V.; Kouril, K.; Stepánková, H. Hexagonal ferrites of X-, W-, and M-type in the system Sr-Fe-O: A comparative study. J. Solid State Chem. 2015, 226, 133–141. [Google Scholar] [CrossRef]
  3. Fang, C.M.; Kools, F.; Metselar, R.; de With, G.; de Groot, R.A. Magnetic and electronic propieties of strontium hexaferrite SrFe12O19 from first-principles calculations. J. Phys. Condens. Matter 2003, 15, 6229–6237. [Google Scholar] [CrossRef]
  4. Zi, Z.F.; Sun, Y.P.; Zhu, X.B.; Yang, Z.R.; Dai, J.M.; Song, W.H. Structural and magnetic properties of SrFe12O19 hexaferrite synthetized by a modified chemical co-precipitation method. J. Magn. Magn. Mater. 2008, 320, 2746–2751. [Google Scholar] [CrossRef]
  5. Xia, A.; Zuo, C.; Chen, L.; Jin, C.; Lv, Y. Hexagonal SrFe12O19 ferrites: Hydrothermal synthesis and their properties. J. Magn. Magn. Mater. 2013, 332, 186–191. [Google Scholar] [CrossRef]
  6. Kostishyn, V.G.; Panina, L.V.; Kozhitov, L.V.; Timofeev, A.V.; Kovalev, A.N. Synthesis and multiferroic properties of M-type SrFe12O19 hexaferrite ceramics. J. Alloys Compd. 2015, 645, 297–300. [Google Scholar] [CrossRef]
  7. Bolarín-Miró, A.M.; Sánchez-De Jesús, F.; Cortés-Escobedo, C.A.; Díaz-De la Torre, S.; Valenzuela, R. Synthesis of M-type SrFe12O19 by mechanosynthesis assisted by spark plasma sintering. J. Alloys Compd. 2015, 643, S226–S230. [Google Scholar] [CrossRef]
  8. Ganjali, M.; Ganjali, M.; Eskandari, A.; Aminzare, M. Effect of Heat Treatment on Structural and Magnetic Properties of Nanocrystalline SrFe12O19 Hexaferrite Synthesized by Co-Precipitation Method. J. Adv. Mater. Process. 2013, 4, 41–48. [Google Scholar] [CrossRef]
  9. Singhal, S.; Namgyal, T.; Singh, J.; Chandra, K.; Bansal, S. A comparative study on the magnetic properties of MFe12O19 and MAlFe11O19 (M = Sr, Ba and Pb) hexafererites with different morphologies. Ceram. Int. 2011, 37, 1833–1837. [Google Scholar] [CrossRef]
  10. Rashid, A.U.; Southern, P.; Darr, J.A.; Awan, S.; Manzoor, S. Strontium hexaferrite (SrFe12O19) based composites for hypertermia applications. J. Magn. Magn. Mater. 2013, 344, 134–139. [Google Scholar] [CrossRef]
  11. Choudhury, H.A.; Choudhary, A.; Sivakumar, M.; Moholkar, V.S. Mechanistic investigation of the sonochemical synthesis of zinc ferrite. Ultrason. Sonochem. 2013, 20, 294–302. [Google Scholar] [CrossRef] [PubMed]
  12. Dang, T.M.H.; Trinh, V.D.; Bui, D.H.; Phan, M.H.; Huynh, D.G. Sol-gel hydrothermal synthesis of strontium hexaferrite nanoparticles and relation between their crystal structure and high coercivity properties. Adv. Nat. Sci. Nanosci. Nanotechnol. 2012, 3, 025015. [Google Scholar] [CrossRef]
  13. Tenorio Gonzalez, F.N.; Bolarín Miró, A.M.; Sánchez De Jesús, F.; Cortés Escobedo, C.A. Mechanism and microstructural evolution of polyol mediated synthesis of nanostructure M-type SrFe12O19. J. Magn. Magn. Mater. 2016, 407, 188–194. [Google Scholar] [CrossRef]
  14. Hessien, M.M.; Rashad, M.M.; El-Barawy, K. Controlling the composition properties of strontium hexaferrite synthetized by co-precipitation method. J. Magn. Magn. Mater. 2008, 320, 336–343. [Google Scholar] [CrossRef]
  15. Viet Nga, T.T.; Duong, N.P.; Loan, T.T.; Hien, T.D. Key step in the synthesis of ultrafine strontium ferrite powders (SrFe12O19) by sol-gel method. J. Alloys Compd. 2014, 610, 630–634. [Google Scholar] [CrossRef]
  16. Kandjani, A.E.; Tabriz, M.F.; Pourabbas, B. Sonochemical synthesis of ZnO nanoparticles: The effect of temperature and sonocation power. Mater. Res. Bull. 2008, 43, 645–654. [Google Scholar] [CrossRef]
  17. Ohayon, E.; Gedanken, A. The application of ultrasound radiation to the synthesis of nanocystalline metal oxide in a non-aqueous solvent. Ultrason. Sonochem. 2010, 17, 173–178. [Google Scholar] [CrossRef] [PubMed]
  18. Palomino, R.L.; Bolarín Miró, A.M.; Tenorio, F.N.; Sánchez De Jesús, F.; Cortés Escobedo, C.A.; Ammar, S. Sonochemical assisted synthesis of SrFe12O19 nanoparticles. Ultrason. Sonochem. 2016, 29, 470–475. [Google Scholar] [CrossRef] [PubMed]
  19. Kaviyarasu, K.; Geetha, N.; Kanimozhi, K.; María Magdalane, C.; Sivaranjani, S.; Ayeshamariam, A.; Keneddy, J.; Maaza, M. In vitro citotoxicity effect and antibacterial performance of human lung epothelial cells A549 activity of Zinc oxide doped TiO2 nanocrystals: Investigation of bio-medical application by chemical method. Mater. Sci. Eng. C 2017, 74, 325–333. [Google Scholar] [CrossRef] [PubMed]
  20. Kaviyarasu, K.; Magdalane, C.M.; Kanimozhi, K.; Kennedy, J.; Siddhardha, B.; Reddy, E.S.; Rotte, N.K.; Sharma, C.S.; Thema, F.T.; Letsholathebe, D.; et al. Elucidation of photocatalysis, photoluminicense and antibacterial studies of ZnO thin films by spin coating method. J. Photochem. Photobiol. B 2017, 173, 466–475. [Google Scholar] [CrossRef] [PubMed]
  21. Hassanjani-Roshan, A.; Vaezi, M.R.; Shokuhfar, A.; Rajabali, Z. Synthesis of iron oxide nanoparticles via sonochemical method and their characterization. Particuology 2011, 9, 95–99. [Google Scholar] [CrossRef]
  22. Lutterotti, L.; Matthies, S.; Wenk, H.R. MAUD: A Friendly Program for Material Analysis Using Diffraction. IUCr Newsl. CPD 1999, 21, 14–15. [Google Scholar]
  23. COD, Crystallography Open Database. Available online: http://www.crystallography.net/cod/search.html (accessed on 17 January 2018).
  24. Israr, F.; Kim, D.K.; Kim, Y.; Oh, S.J.; Ng, K.C.; Chun, W. Synthesis of porous Cu-BTC with ultrasonic treatment: Effects of ultrasonic power and solvent condition. Ultrason. Sonochem. 2016, 29, 186–193. [Google Scholar] [CrossRef] [PubMed]
  25. Bailey, A.V.; Honold, E.; Skau, E.L. Topochemical mechanims involved in the preparation and deacetylation of partially acetylated cottons. Text. Res. J. 1958, 28, 861–873. [Google Scholar] [CrossRef]
  26. Nemury, A.; Weiss, M.; Gainetdinov, I.; Boldyrev, V.; Schöllhorn, R. Room temperature electrochemical redox reactions of the defect Perovskite SrFeO2.5−x. Chem. Mater. 1998, 10, 2403–2411. [Google Scholar] [CrossRef]
  27. Zhao, B.; Wang, Y.; Guo, H.; Wang, J.; He, Y.; Jiao, Z.; Wu, M. Iron oxide (III) nanoparticles fabricated by electron beam irradiation method. Mater. Sci. 2007, 25, 1143–1148. [Google Scholar]
  28. Hazen, R.M.; Jeanloz, R. Wustite (Fe1−xO): A review of its defect structure and physical properties. Rev. Geophys. Spa Phys. 1984, 22, 37–46. [Google Scholar] [CrossRef]
  29. Bennett, L.H.; Torre, E.D. Analysis of wasp-waist hysteresis loops. J. Appl. Phys. 2005, 97, 10E502. [Google Scholar] [CrossRef]
  30. Eckert, O. Ferrites with constricted loops and thermal magnetic treatment. Proc. IEEE 1956, 104, 428–432. [Google Scholar] [CrossRef]
  31. Herzer, G. Grain size dependence of coercivity and permeability in nanocrystalline ferromagnets. IEEE Trans. Magn. 1990, 26, 1397–1402. [Google Scholar] [CrossRef]
  32. Xu, Y.F.; Ma, Y.Q.; Xu, S.T.; Zan, F.L.; Zheng, G.H.; Dai, Z.X. Effects of vacancy and exchange-coupling between grains on magnetic properties of SrFe12O19 and α-Fe2O3 composites. Mater. Res. Bull. 2014, 57, 13–18. [Google Scholar] [CrossRef]
Figure 1. Schematic diagram of experimental sonochemical set up.
Crystals 08 00045 g001
Figure 2. X-ray diffraction patterns of powders “as obtained” with sonication output power of 120, 180, and 240 W over 3 h.
Crystals 08 00045 g002
Figure 3. XRD patterns of powders after applying different sonication output power (SOP) for 3 h and thermal treatment at 1073 K.
Crystals 08 00045 g003
Figure 4. XRD patterns of powders after applying different SOP for 3 h and thermal treatment at 1173 K.
Crystals 08 00045 g004
Figure 5. XRD patterns of powders after applying different SOP for 3 h and thermal treatedment at 1323 K.
Crystals 08 00045 g005
Figure 6. Micrographs of powders “as obtained” synthesized at different SOP values: (a) 120 W; (b) Histogram of particle size distribution of the powder obtained at 120 W; (c) 180 W; and (d) 240 W.
Crystals 08 00045 g006
Figure 7. Magnetic hysteresis cycles powders obtained by sonochemistry at 120, 180, and 240 W of SOP for 3 h. (a) Without annealing; (b) With annealing at 1073 K; (c) With annealing at 1173 K; and (d) With annealing at 1323 K.
Crystals 08 00045 g007
Table 1. Data from the Rietveld refinements of the X-ray diffraction patterns and index of crystallinity of the powders obtained at 120, 180, and 240 W without heat treatment.
PowerPhases, Space GroupCrystallography Open Database (COD) IDvol %Crystallite Size (nm)Microstrain (adim)Index of Crystallinity (%)
120 WFe3O4, Fd-3m900581685.96 ± 0.9512.4 ± 1.40.03002424.13
SrCO3, Pmcn900819814.04 ± 0.0318.6 ± 7.70.00532292.54
180 WFe3O4, Fd-3m900581686.95 ± 0.56.9 ± 1.80.00252463.99
SrCO3, Pmcn900819813.05 ± 0.0211.8 ± 1.00.00498085.08
240 WFe3O4, Fd-3m900581688.97 ± 0.135.7 ± 0.80.00004995.08
SrCO3, Pmcn900819811.02 ± 0.0115.3 ± 1.80.00049965.50
Table 2. Data from the Rietveld refinements of the XRD patterns of the powders obtained at 120, 180, and 240 W with heat treatment at 1073, 1173, and 1323 K.
PowerPhases, Space GroupCrystallography Open Database (COD) IDvol %Crystallite Size (nm)Microstrain (adim)
Annealed at 1073 K
120 WSrFe12O19, P63/mmc100600090.34 ± 0.081.7 ± 2.20.000958
α-Fe2O3, R-3c90150659.66 ± 0.647.1 ± 0.60.000304
180 WSrFe12O19, P63/mmc100600096.78 ± 1.161.09 ± 1.30.001088
α-Fe2O3, R-3c90150651.24 ± 0.029.6 ± 1.20.006622
SrFeO2.5, Pm-3m15025491.98 ± 2.19.9 ± 0.10.000603
240 WSrFe12O19, P63/mmc100600095.58 ± 0.7155.1 ± 1.70.001013
α-Fe2O3, R-3c90150651.54 ± 0.415.4 ± 0.70.001219
SrFeO2.5, Pm-3m15025492.41 ± 0.04.9 ± 0.630.000501
Fe2O3, R-3c10112400.30 ± 0.69.7 ± 1.80.002212
FeO, Pm-3m21069360.17 ± 0.474.2 ± 0.150.001980
Annealed at 1173 K
120 WSrFe12O19, P63/mmc100600097.24 ± 0.067.9 ± 1.70.000945
α-Fe2O3, R-3c90150652.24 ± 0.049.4 ± 0.450.001205
SrFeO2.5, Pm-3m15025490.52 ± 0.1911.7 ± 1.60.002191
180 WSrFe12O19, P63/mmc100600095.11 ± 0.575.5 ± 2.30.000839
α-Fe2O3, R-3c90150651.22 ± 0.018.9 ± 0.490.002454
SrFeO2.5, Pm-3m15025493.67 ± 0.599.9 ± 0.260.001775
240 WSrFe12O19, P63/mmc100600092.75 ± 0.077.2 ± 4.10.000838
α-Fe2O3, R-3c90150651.23 ± 0.043.3 ± 0.800.001243
SrFeO2.5, Pm-3m15025494.10 ± 0.308.7 ± 0.310.001365
Fe2O3, R-3c10112400.65 ± 0.54.7 ± 0.170.002753
FeO, Pm-3m21069360.25 ± 0.210 ± 0.90.023388
Annealed at 1323 K
120 WSrFe12O19, P63/mmc100600098.8 ± 1.9563.4 ± 1.580.000922
α-Fe2O3, R-3c90150651.2 ± 0.029.9 ± 0.150.011751
180 WSrFe12O19, P63/mmc100600091.92 ± 1.4773.3 ± 1.290.001342
α-Fe2O3, R-3c90150657.60 ± 0.0210.1 ± 0.260.010153
SrFeO2.5, Pm-3m15025490.48 ± 0.2710.0 ± 0.110.000604
240 WSrFe12O19, P63/mmc100600096.62 ± 9.4284.7 ± 1.350.001013
Fe2O3, R-3c10112403.38 ± 0.349.8 ± 0.260.000409
Table 3. Magnetic saturation (Ms), remanent magnetization (Mr), and coercitivity field (Hc) of sonicated powders at 120, 180, and 240 W of SOP thermal treatments.
SOP (W)Annealing Temperature (K)Ms (Am2/Kg)Mr (Am2/Kg)Hc (A/m)Mr/Ms (adim)
120107346.1324.653.94 × 1050.53
117352.0228.013.35 × 1050.53
132367.1517.034.69 × 1040.25
180107347.7115.232.31 × 1040.31
117345.6024.723.03 × 1050.54
132351.7123.931.36 × 1050.46
240107344.7222.623.91 × 1050.50
117345.0223.022.49 × 1050.51
132352.0124.241.47 × 1050.46

