Effects of Crystal Orientation on the Crack Propagation of Sapphire by Sequential Indentation Testing

1
Institute of Manufacturing Engineering, Huaqiao University, Xiamen 361021, China
2
MOE Engineering Research Center for Brittle Materials Machining, Huaqiao University, Xiamen 361021, China
3
College of Mechanical Engineering and Automation, Huaqiao University, Xiamen 361021, China
*
Author to whom correspondence should be addressed.
Crystals 2018, 8(1), 3; https://doi.org/10.3390/cryst8010003
Submission received: 18 October 2017
/
Revised: 15 December 2017
/
Accepted: 20 December 2017
/
Published: 25 December 2017
Abstract
:Single-crystal sapphire (α-Al2O3) is a hard and brittle material. Due to its highly crystalline nature, the fracture behavior of sapphire is strongly related to its crystal structure, and understanding the effects of crystal structure on the crack propagation of sapphire is essential for the successful application of this important material (e.g., as wafers in the electronics industry). In the present work, crack propagation that is induced by sequential indentation was investigated on the A-plane and C-plane of sapphire using a Vickers indenter on a micrometer scale. It was found that increasing indentation depth obviously increases the rate of crack propagation on the A-plane, but this effect is not so obvious on the C-plane because of the different slip systems induced by indentation on the different crystal planes of sapphire. Moreover, some parallel linear traces along the A-plane, which fracture with increasing indentation depth, are observed from the residual indentation on the A-plane. The fracture toughness of both A-plane and C-plane sapphire is smaller after indentation testing than that obtained using conventional testing methods. The subsurface damage was detected by transmission electron microscopy (TEM).
1. Introduction
Single-crystal sapphire (α-Al2O3) is one of the hardest natural minerals (nine on the Mohs’ scale) [1,2], and is widely used in industry, national defense, aerospace, and scientific research fields due to its superior chemical and physical properties [3,4]. In particular, A-plane sapphire is used as the screen panels and keyboards of smart phones, and C-plane sapphire is employed as substrates in electronic devices. However, due to its brittleness and hardness, the processing of sapphire is challenging, and understanding the fracture and removal mechanisms of sapphire at variable scales is essential for the optimization of processing parameters.
Indentation testing is one of the most common methods that are employed for studying the deformation and fracture mechanisms of materials. The method yields valuable information on the fundamental processes of brittle fracture in covalent-ionic solids, and serves as a simple microprobe for determining material fracture parameters, such as the toughness and crack-velocity exponent [5,6,7]. Mao et al. [2] studied the elastic-plastic characteristics of the C plane of single-crystal sapphire by means of ultra-low nanoindentation loads using a Berkovich indenter with an indentation depth of less than 60 nm. Mao et al. [8] investigated the pop-in behavior and the mechanical properties of single-crystal sapphire vertically indented to its R-plane by nanoindentation using a Berkovich indenter. Bhattacharya et al. [9] studied the effect of loading rate on the nanohardness of sapphire. Numerous studies have investigated the nanomechanical properties of some other single-crystal materials [10,11,12,13]. These studies have been predominantly conducted at the nanometer scale, which is more representative for precision machining. However, some processes occur at the micron scale. In particular, the scale of the material removal mechanism differs from that of precision machining. Numerous scholars have investigated the processing mechanisms of materials at the micron scale. Nowak et al. [14] addressed the singularity that was observed in the loading cycle of the indentation hysteresis loop for sapphire when deformed by a spherical indenter with a radius of 5 μm at a maximum load of 500 mN. Guillou et al. [15] studied the crack initiation and propagation of sapphire under contact fatigue conditions using the soft impresser technique. Haney et al. [16] conducted dynamic indentation experiments on C-plane and A-plane sapphire using a custom-made indentation system driven by a split Hopkinson bar. The results demonstrated that dynamic indentations result in shorter and less jagged cracks accompanied by increased localized spalling beneath each indentation site. Zhang et al. [17] studied the material removal mechanism and deformation features of C-plane sapphire in ultrasonic vibration-assisted scratch tests, and compared their results with those obtained in conventional scratch tests. Haney et al. [18] investigated crack interaction behavior due to two sequential static Vickers indentations on A-plane sapphire, and performed secondary indentations at various radial separations and angular positions around a primary indentation. Huang et al. [19] conducted nanoscratch tests at room temperature on M-plane sapphire under a ramp loading condition along a scratch length of 200 μm, with a scratch velocity of 1 μm·s−1 using a Berkovich indenter.
In previous research, indentation tests are typically single period loading-unloading tests, scratch tests, or tests conducted at a nanometer scale. However, the processes of crack initiation and growth could not be visually observed with increasing indentation depth, loading, and dwell period. In contrast, sequential indentation provides a number of material fracture characteristics, including the fracture mechanism and the processes of crack initiation and propagation, which promotes a much clearer evaluation of the fracture behavior of a material. Moreover, the crystal orientation has a significant influence on the mechanical properties of anisotropic materials. Investigating the mechanical anisotropy of materials is of great significance for improving the processing parameters of a material, and obtaining good surface quality and better design tools [20,21,22].
The objective of the present work is to investigate the effect of crystal orientation on the crack propagation of A-plane and C-plane sapphire based on the application of sequential-loading-unloading indentation tests on the A-plane and C-plane, respectively. First, the hardness and elastic modulus were measured by nanoindentation. The force signals applied during the loading portion are analyzed. The surface morphology obtained by scanning electron microscopy (SEM) is evaluated. The crack fracture mechanisms obtained by sequential indentation tests on A-plane and C-plane sapphire wafers are then analyzed according to the surface morphology, residual indentation depths, fracture toughness, and crack propagation behavior. In addition, crack fracture models are proposed for the A-plane and C-plane individually, and the corresponding fracture behavior is elucidated. The subsurface damage was detected by transmission electron microscopy (TEM).
2. Experimental Procedures
Two samples were prepared from A-plane and C-plane sapphire substrates that were provided by Unionlight Technology Co., Ltd. (Wuxi, China), with dimensions 9 mm × 9 mm × 0.65 mm. These single crystals were oriented according to their c-axis or a-axis, and polished to a profile roughness parameter Ra < 0.3 nm to eliminate crystal defects and residual stress. Figure 1 presents a schematic of the A-plane and C-plane sapphire substrate orientations. The hardness and elastic modulus were measured. All the nanoindentation experiments were conducted using an indenter (Nani indenter G200, Keysight Technologies, Inc., Santa Rosa, CA, USA) equipped with a three-sided pyramidal Berkovich diamond tip at room temperature. The radius of the tip is 100 nm. The force and displacement sensitivities of the instrument are 50 nN and 0.01 nm, respectively. Indentations were performed under a peak indentation depth of 1000 μm for five times. For all of the nanoindentation tests, the loading and unloading times were 20 s and holding time was set as 10 s at the peak indent loads. Sequential indentation tests were conducted using a custom-fabricated indentation tester employing a Vickers diamond indenter with a displacement resolution of 50 nm. The chisel edge of the Vickers diamond indenter is less than 1 μm measured by scanning electron microscopy. A loading range of 0 to 40 N was employed. The contact condition of the indenter and the specimen was determined during dynamic tensile and compression testing by a single channel Kistler 9203 force sensor (Kistler, Winterthur, Switzerland) with a resolution of 0.01 N, a rigidity of 40 N/μm, a natural frequency of 27 kHz, and a maximum measurement capacity of 500 N.
Samples were subjected to ultrasonic cleaning in alcohol at 50 °C prior to testing. Each sample was affixed onto the testing stage with paraffin. Sequential loading-unloading indentation tests were performed with the specifications that are listed in Table 1. Figure 2 illustrates the sequential indentation test procedure. The indentation process consisted of loading, a dwell period under loading, and complete unloading. After indentation testing, the surface morphology of the indentations was obtained using a Phenom ProX desktop SEM, which employs backscatter imaging. The magnification range is from 80× to 45,000×, with a resolution of 25 nm. The acceleration voltages are 5 kV, 10 kV and 15 kV. The material of the filament is CeB6. The instrument is widely used in the fields of materials science, metallurgy, and semiconductor materials and devices. The residual depth of indentation and pile-up of material were measured by a Zygo NV7300-3D three-dimensional (3D) optical profiler. The instrument is capable of measuring sample roughness, step height, outline, and the key parts size of the sample with high precision and accuracy qualitatively and quantitatively. The longitudinal measurement range is from less than 1 nm to 20 mm, and the vertical resolution is 0.1 nm, which meets the requirements of our indentation measurements. Metro Pro software was employed to conduct filtering and surface reconstruction of the results. A cross-sectional TEM specimen was prepared using a focussed ion beam (FIB) in a FEI Helios NanoLab 600i installation. The microstructure of the TEM specimen was investigated by high-resolution TEM in a FEI TECNAI G2 F20 S-TWIN.
3. Results and Discussion
3.1. Nanoindentation Results
Figure 3 shows the total of the load-displacement (P-h) curves of the indented (a) A-plane and (b) C-plane during nanoindentation. It is obvious that multiple displacement discontinuities or pop-in events occur during loading. The load corresponding to the first pop-in event is defined as the critical indentation load P (see inset in Figure 3). The width of pop-in extension is due to the slip of activated dislocation. According to the nanoindentation, the load of pop-in for A- and C-plane sapphire is from 0.6–1.3 mN, and the indentation depth of pop-in is from 26 nm to 46 nm. The value of E is 487.4 ± 3.1 GPa for A-plane sapphire and 534.3 ± 6.5 GPa for the C-plane measured, and the values of H measured are 32.99 ± 1.27 GPa (A-plane) and 29.36 ± 1.80 GPa (C-plane) at the indentation depth from 100 nm to 200 nm. According to the nanoindentation experimental results, hardness of C-plane sapphire obviously exhibits the indentation size effect (ISE), and the hardness is larger at the ISE region than which at the non-ISE region. The ISE region is to 50 nm. When the indentation depth is less than 50 nm, the value of H for A-plane sapphire is smaller than that of the C-plane.
3.2. Force Signal Analysis
Figure 4 shows the loading curve obtained during sequential indentation testing at a maximum indentation depth of 8 μm and a maximum load of 4.65 N on A-plane sapphire. The loading curve presents a stepwise increase in force during the loading stage and a stepwise decrease in force during the unloading stage. As shown in Figure 3, the sequential loading curve presents 16 force increments in total, corresponding to an indentation depth interval of 0.5 μm. It should be noted that only 12 intervals were obtained during the sequential unloading portion, which indicates that the plastic deformation of sapphire was about 4 intervals (2 μm). As shown in the inset of Figure 3, as obtained after low pass filtering at a frequency of 50 Hz, the force drops immediately when first applied due to the application of a stress level that exceeds the ultimate strength of the material. This can be correlated with the release of stress by crack initiation on the sapphire substrate. Then, the force declines slowly during the dwell period. According to the fracture behavior of brittle solids proposed by Lawn [23], rebound occurs during the unloading stage at the elastic deformation zone, and the residual stress plays a leading role in the formation of lateral cracks. In the inset, the force decreases only slightly during the dwell period at the first loading, which indicates that the initially formed crack extends very little over this period. During subsequent loading, the force initially continues to decrease slowly, but, with an increasing indentation depth, the rate of decline in the force increases gradually. Sapphire is a typically hard brittle material, and the load of elastic-plastic transformation is very small. The load of pop-in is from 0.5 mN to 2 mN (see Figure 3). That is to say that the process is a completely brittle fracture process. The energy is mainly consumed by the crack propagation, and the energy that is consumed by the plastic deformation is very small. So, we think that the decrease of force is mainly due to the crack propagation. The rate of crack growth gradually increases with an increasing indentation depth.
Figure 5 shows the rate at which the applied force declines during each dwell period of the loading stage corresponding to a series of indentation depths for (a) A-plane and (b) C-plane sapphire specimens. In this study, sequential loading-unloading indentation testing was conducted twice for each maximum indentation depth of 0 μm to 2 μm, 0 μm to 4 μm, 0 μm to 6 μm, and 0 μm to 8 μm. Therefore, eight data points were obtained for loading from 0 μm to 2 μm, six data points from 2 μm to 4 μm, four data points from 4 μm to 6 μm, and two data points from 6 μm to 8 μm, and the averages and standard deviations of the slope of the force measured at each dwell period were obtained. From Figure 5a, we see that the slope of the force decreases (i.e., the rate of decline increases) in a nearly monotonic fashion with increasing indentation depth for A-plane sapphire. However, this trend is not nearly as uniform for C-plane sapphire.
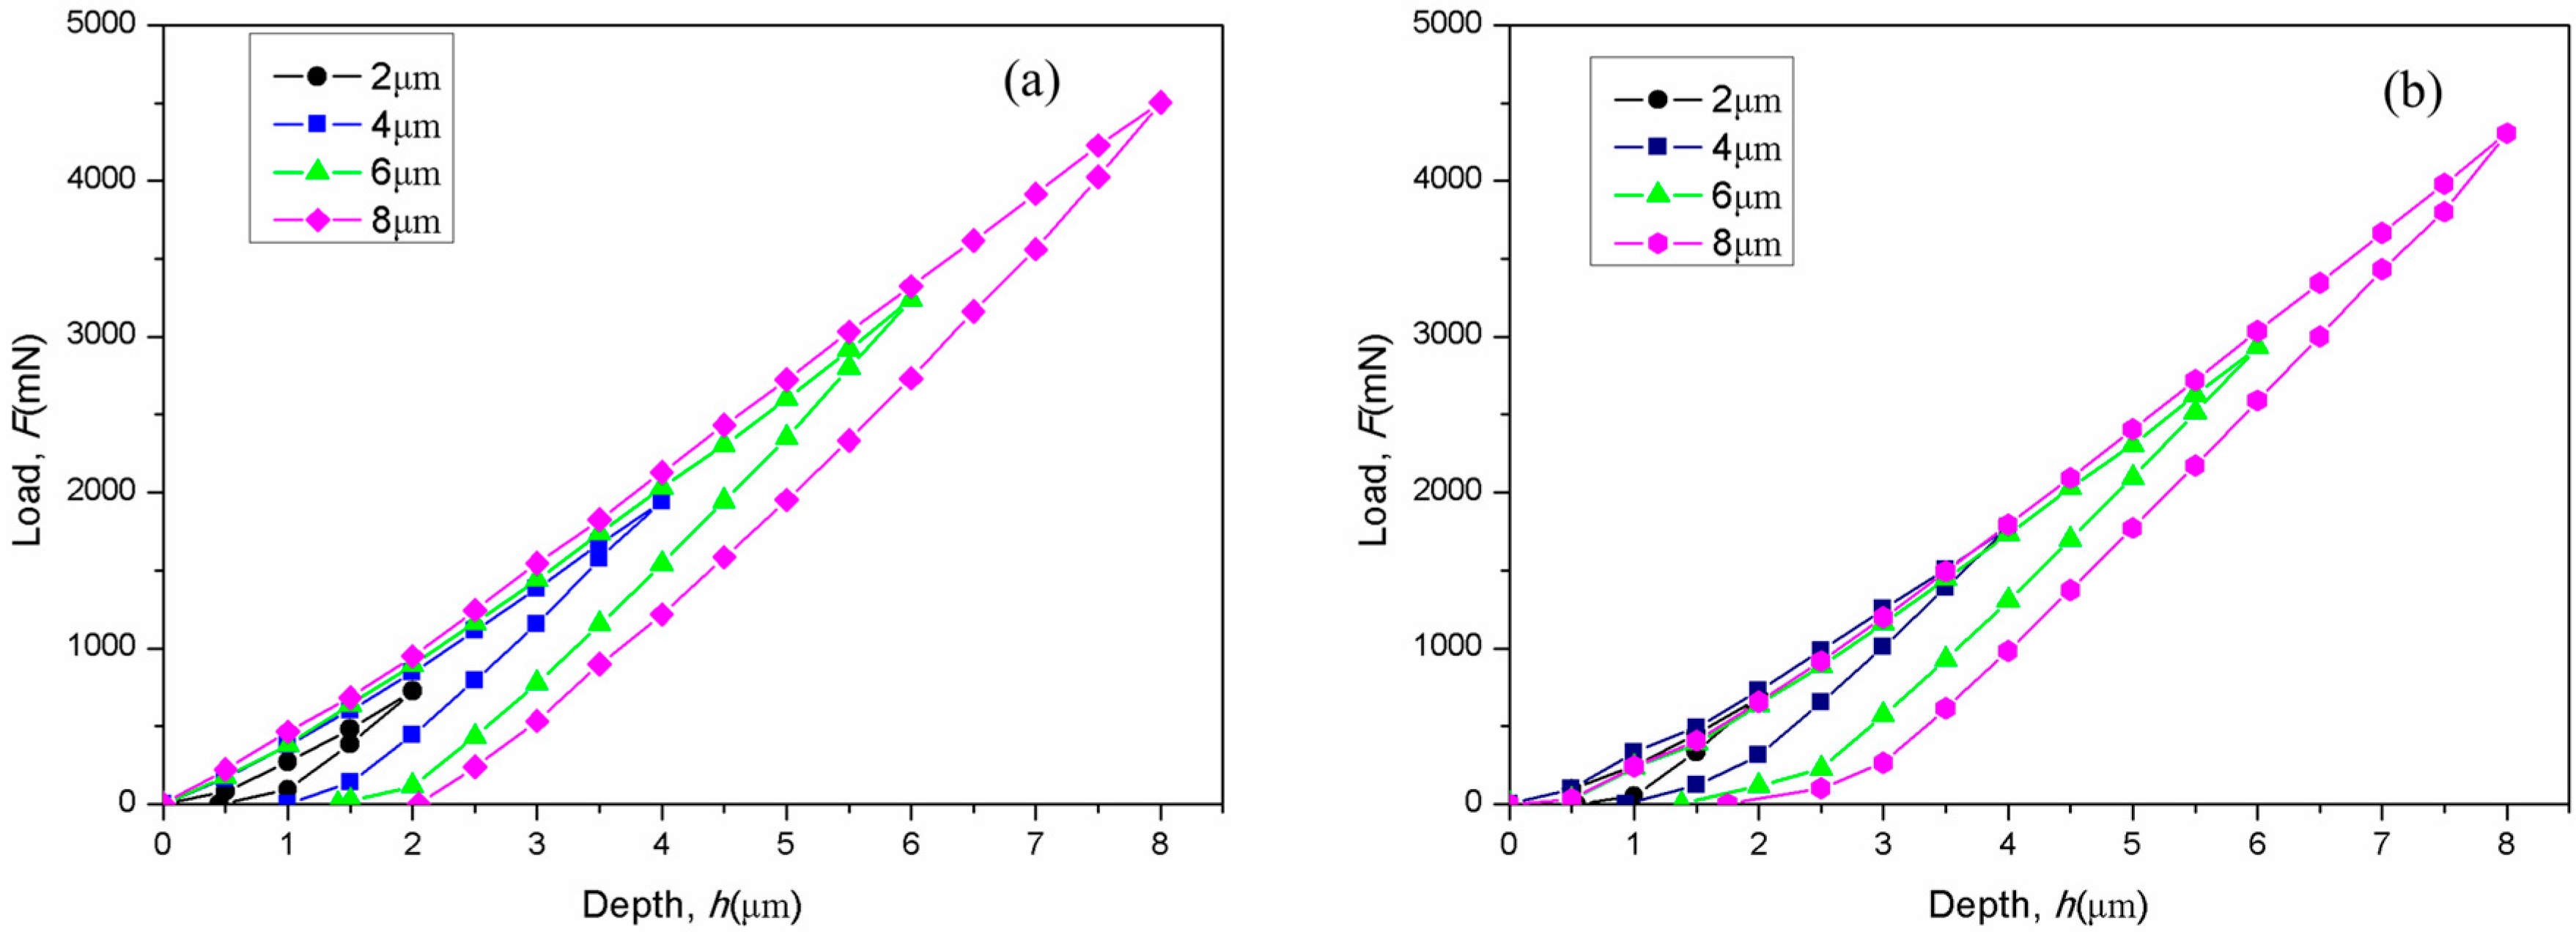
Figure 6 shows typical load-depth curves at different maximum indentation depths for A-plane and C-plane sapphire. It is obvious that the loading-unloading curves exhibit very similar characteristics, and that the curves of the loading stages are nearly equivalent. However, the slopes of the unloading curves differ considerably for C-plane sapphire, and the slopes of the indentation curves for the loading stage coincide considerably better for C-plane sapphire than for A-plane sapphire.
3.3. Analysis of Indentation Fracture Morphology
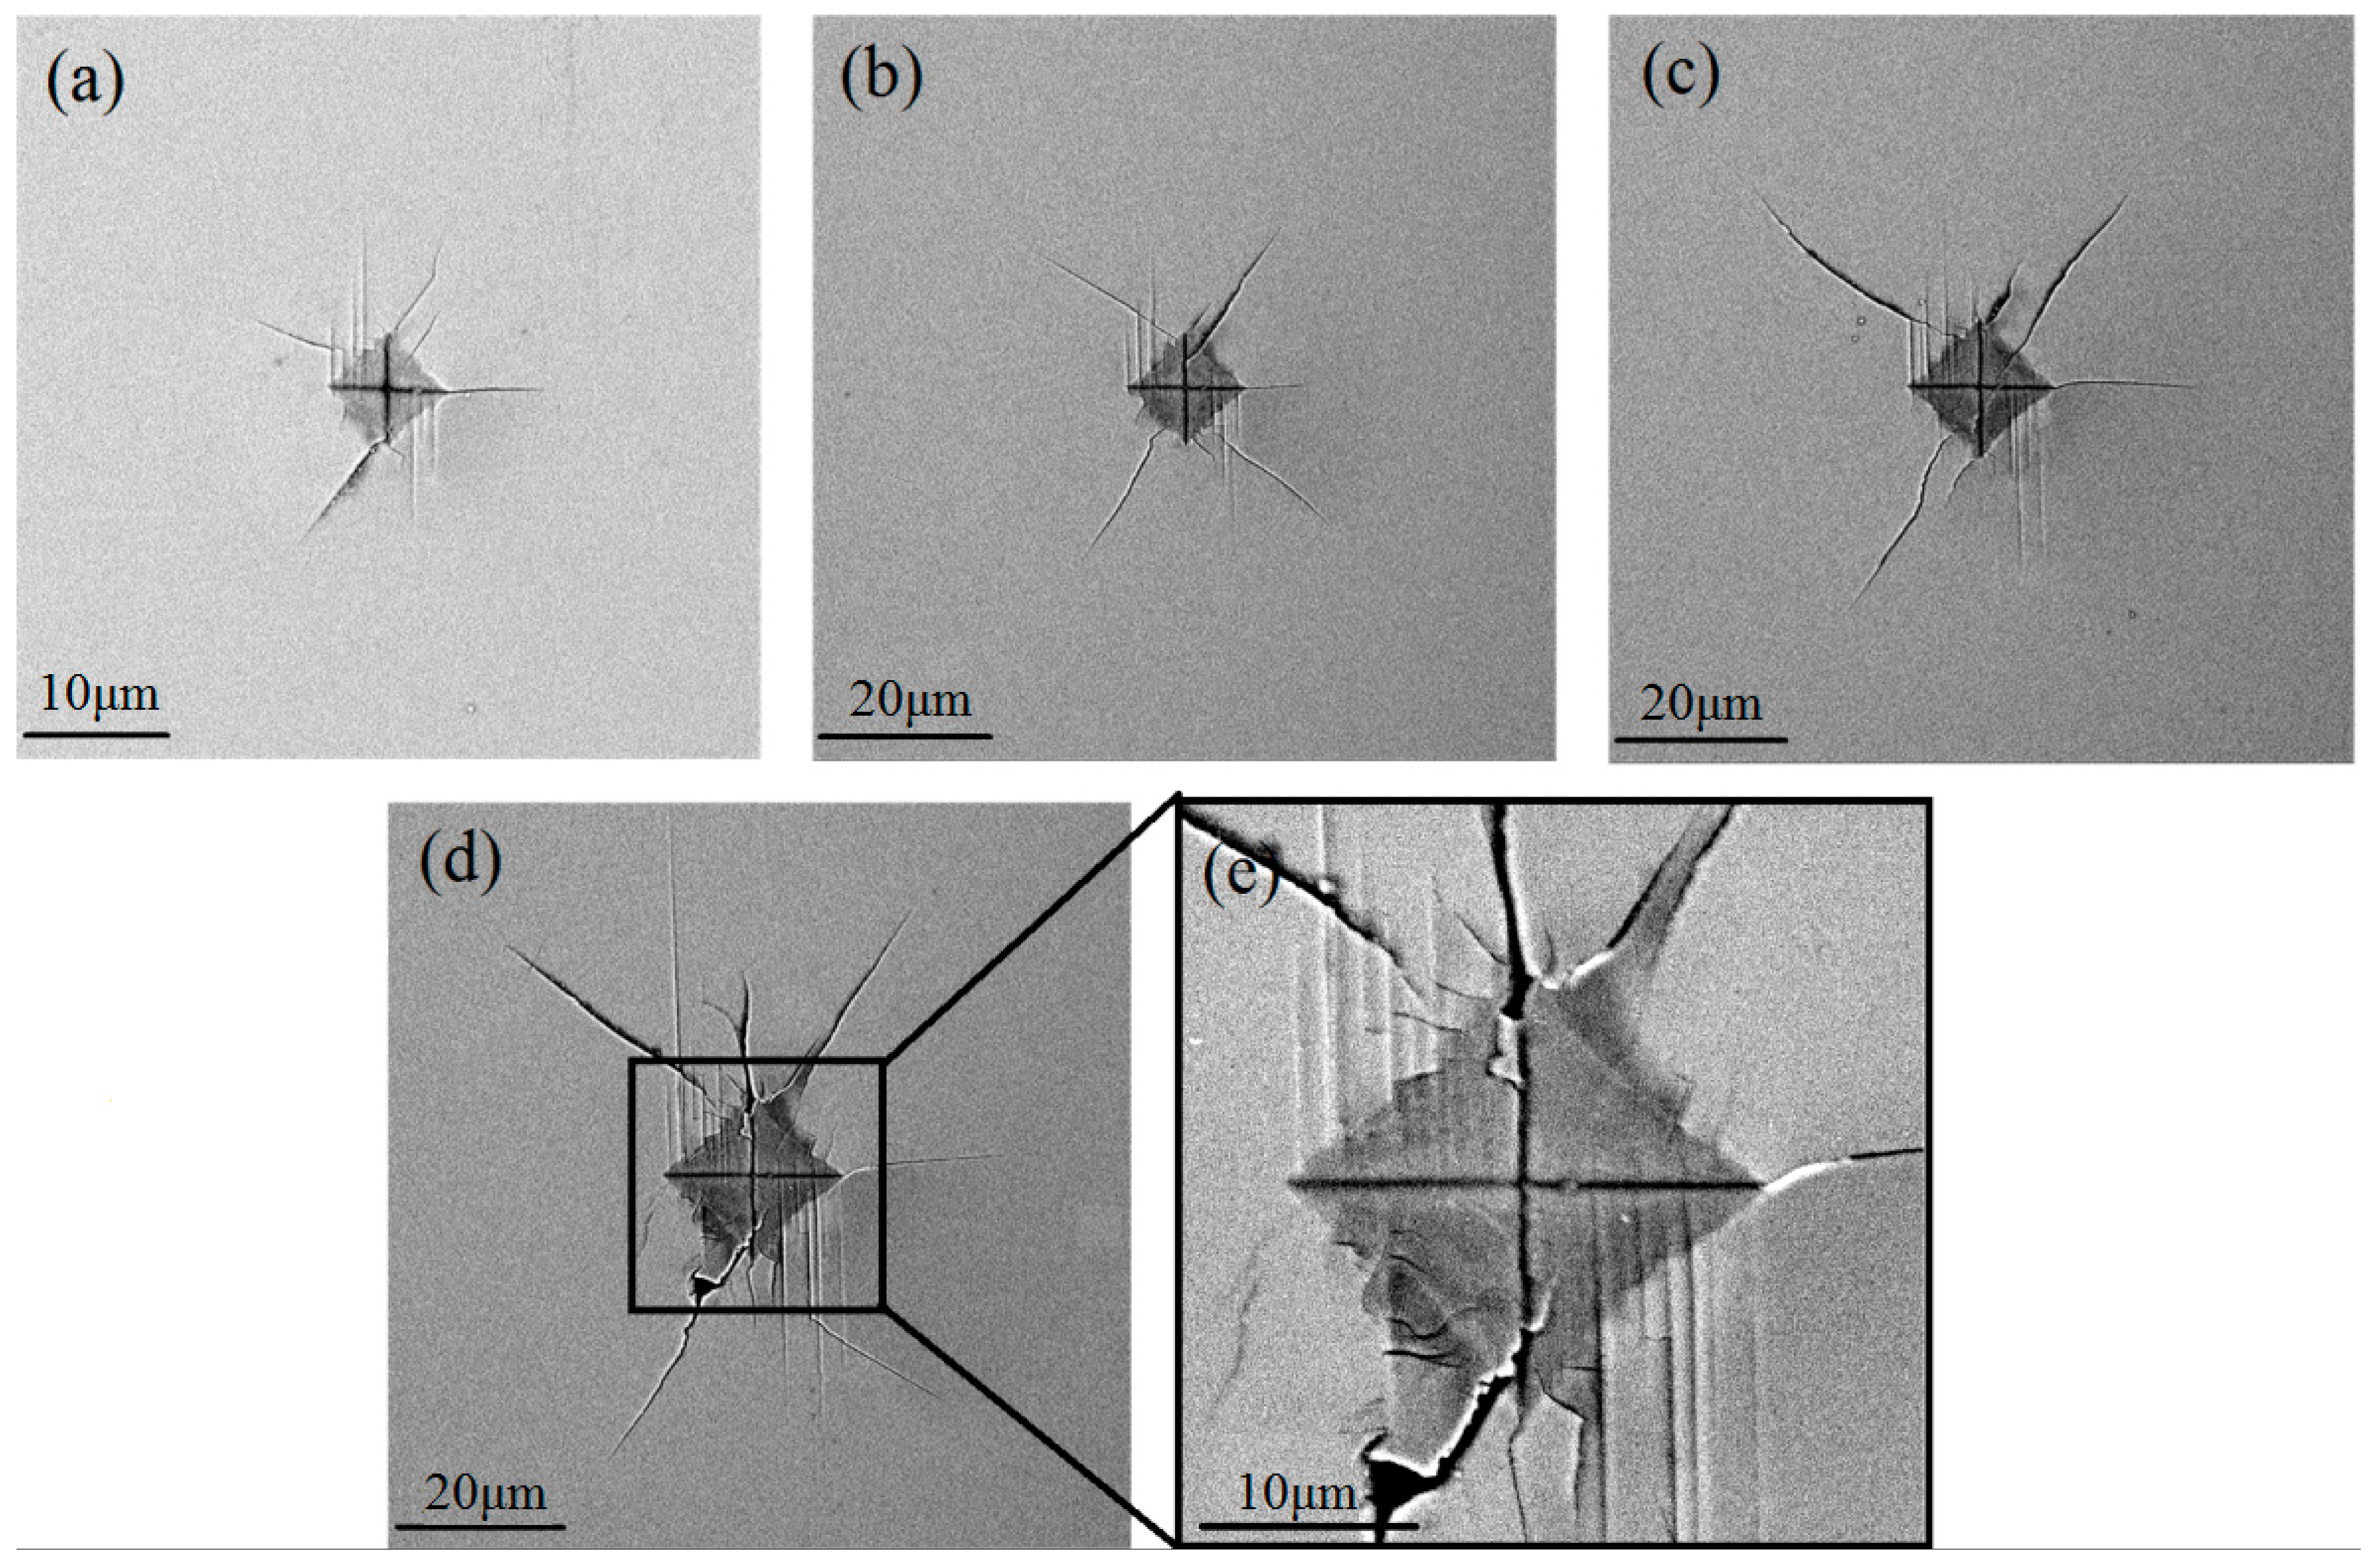
SEM images of the A-plane and C-plane sapphire surfaces after indentation testing are shown in Figure 7 and Figure 8, respectively, with (a) 2 μm, (b) 4 μm, (c) 6 μm, and (d) 8 μm depth indentations. It is obvious that the length of cracks and the area of the indentation correspondingly increase with an increasing indentation depth. The SEM images given in Figure 7 and Figure 8 show that that pile-up for the C-plane sapphire is more obvious than that for the A-plane sapphire. The cracks extend away from the center of the indentation.
For the A-plane sapphire, Figure 7a shows that cracks occur at an indentation depth of 2 μm. Figure 7d shows that the sapphire spalls at an indentation depth of 8 μm. Sequential indentation on A-plane sapphire reveals four distinct surface features, as illustrated in Figure 9. At a 2-μm depth indentation, some linear traces that are oriented perpendicular to the c-axis are observed, and the number of features gradually increases with increasing indentation depth. Some of the linear traces result in the fractures visible in Figure 7e at an 8-μm depth indentation. The traces observed are all straight, although wavy traces were observed for the static indentation results presented by Haney [16,18]. The orientations of these traces are consistent with earlier findings from Chan and Lawn, Nowak and Sakai, as well as Kim and Kim who all identified these features as basal twins [16]. A second set of cracks are oriented at 51.8° to the c-axis. This is consistent with the intersection of the R-plane and the A-plane, which is also consistent with the findings of Haney [16] and Kim [24]. A third set of cracks are oriented at 147.6° to the c-axis or 57.6° relative to the m-axis. These cracks coincide with the R-plane, which is perpendicular to the A-plane of the sample. A crack is also observed along the c-axis, but it is asymmetrical. As we know, the cracks occur at the position where the stress first reaches to the strength limit. The propagation of cracks follows the equilibrium theory. For the left side of the indentation, a crack propagated along the R-plane. But, the length of crack on the right side is not equal to the left. At the right corner of the indentation, the crack occurs due to the concentrate on the stress and reaching to the strength limit. In brittle materials, radial cracks typically initiate near the edges of the Vickers indenter tips where the highest stress concentrations occur. However, the first three sets of cracks on A-plane sapphire are not located exactly on the corners of the residual indentation impression due to the local crystallography of the sample. This would indicate that the energy that is required to propagate cracks along these preferential directions is less than that required to produce radial cracks, even with stress concentrations at the indenter corners [16]. The fourth set of cracks is generated from the right-hand corner of the indentation. The material piles up, and small plastic deformations are formed around the residual indentation impression on the A-plane. The cracks around the indentation exhibit no regularity. For convenience, we define the first set of crack directions as M1, the second set of crack directions as R2, the third set of crack directions as R1, and the fourth set of crack directions as C1 for A-plane sapphire.
Similar to A-plane sapphire, the area of the indentation on C-plane sapphire also increases correspondingly with increasing indentation depth. The cracks extend away from the center of the indentation. Figure 8a shows that cracks occur at an indentation depth of 2 μm. The pile-up of material and small plastic deformations can be seen clearly around the residual indentation impression. Two types of cracks appear to be visible on the surface around these indentation sites: (i) radial cracks and (ii) circumferential cracks. In contrast to A-plane sapphire, the radial cracks on the C-plane are located exactly on the corners of the residual indentation impression. However, the direction of crack propagation changes slightly, which is not similar to the behaviour that is seen in polycrystalline alumina. This is because single-crystal sapphire has a hexagonal structure. Linear surface traces are not observed around the residual indentation impression. Cracks perpendicular to the indentation edge are observed with an increasing indentation depth.
The length of the radial cracks was also obtained from the SEM images. It should be noted that the method employed here to measure the crack length is slightly different from conventional practice. In the case of indentation on A-plane sapphire, cracks do not appear at the corners, but rather initiate preferentially along specific crystallographic planes. A crack length 2c is herein defined as the distance between two opposing crack tips oriented along the same crystallographic plane [16].
The fracture toughness (KIC) can be obtained according to the equation:
where F is the load, H and E are the hardness and elastic modulus of sapphire, respectively, α is a proportionality constant related to the indenter geometry (0.016 for a Vickers indenter [25]), and Cm is a mean value that is obtained by averaging the lengths of the radial cracks.
According to the study results from Mao et al. [2], hardness of C-plane sapphire obviously exhibits the indentation size effect (ISE), and the hardness is larger at the ISE region than that at the non-ISE region. The ISE region is to 60 nm. In this study, the hardness we measured is out of the region. The results of hardness and modulus of elasticity see in Section 3.1. The lengths of the cracks extending from the corners of the residual indentation impression for C-plane sapphire exhibit no obvious differences. We hold that the values of KIC along the four directions are equivalent, and the value is determined to be 1.63 MN/m1.5 from Equation (1). The values of KIC for the various crack directions of A-plane and C-plane sapphire are given in Figure 10. These values are smaller than those that are obtained from Graça [4], Newcomb [26], and Wunderlich [27]. Because the dwell period employed was 10 s, the crack has sufficient time to propagate, and relieve the stress. For A-plane sapphire, the value of KIC for M1 is the largest, corresponding to the smallest crack length.
3.4. Three-Dimensional Morphology Analysis
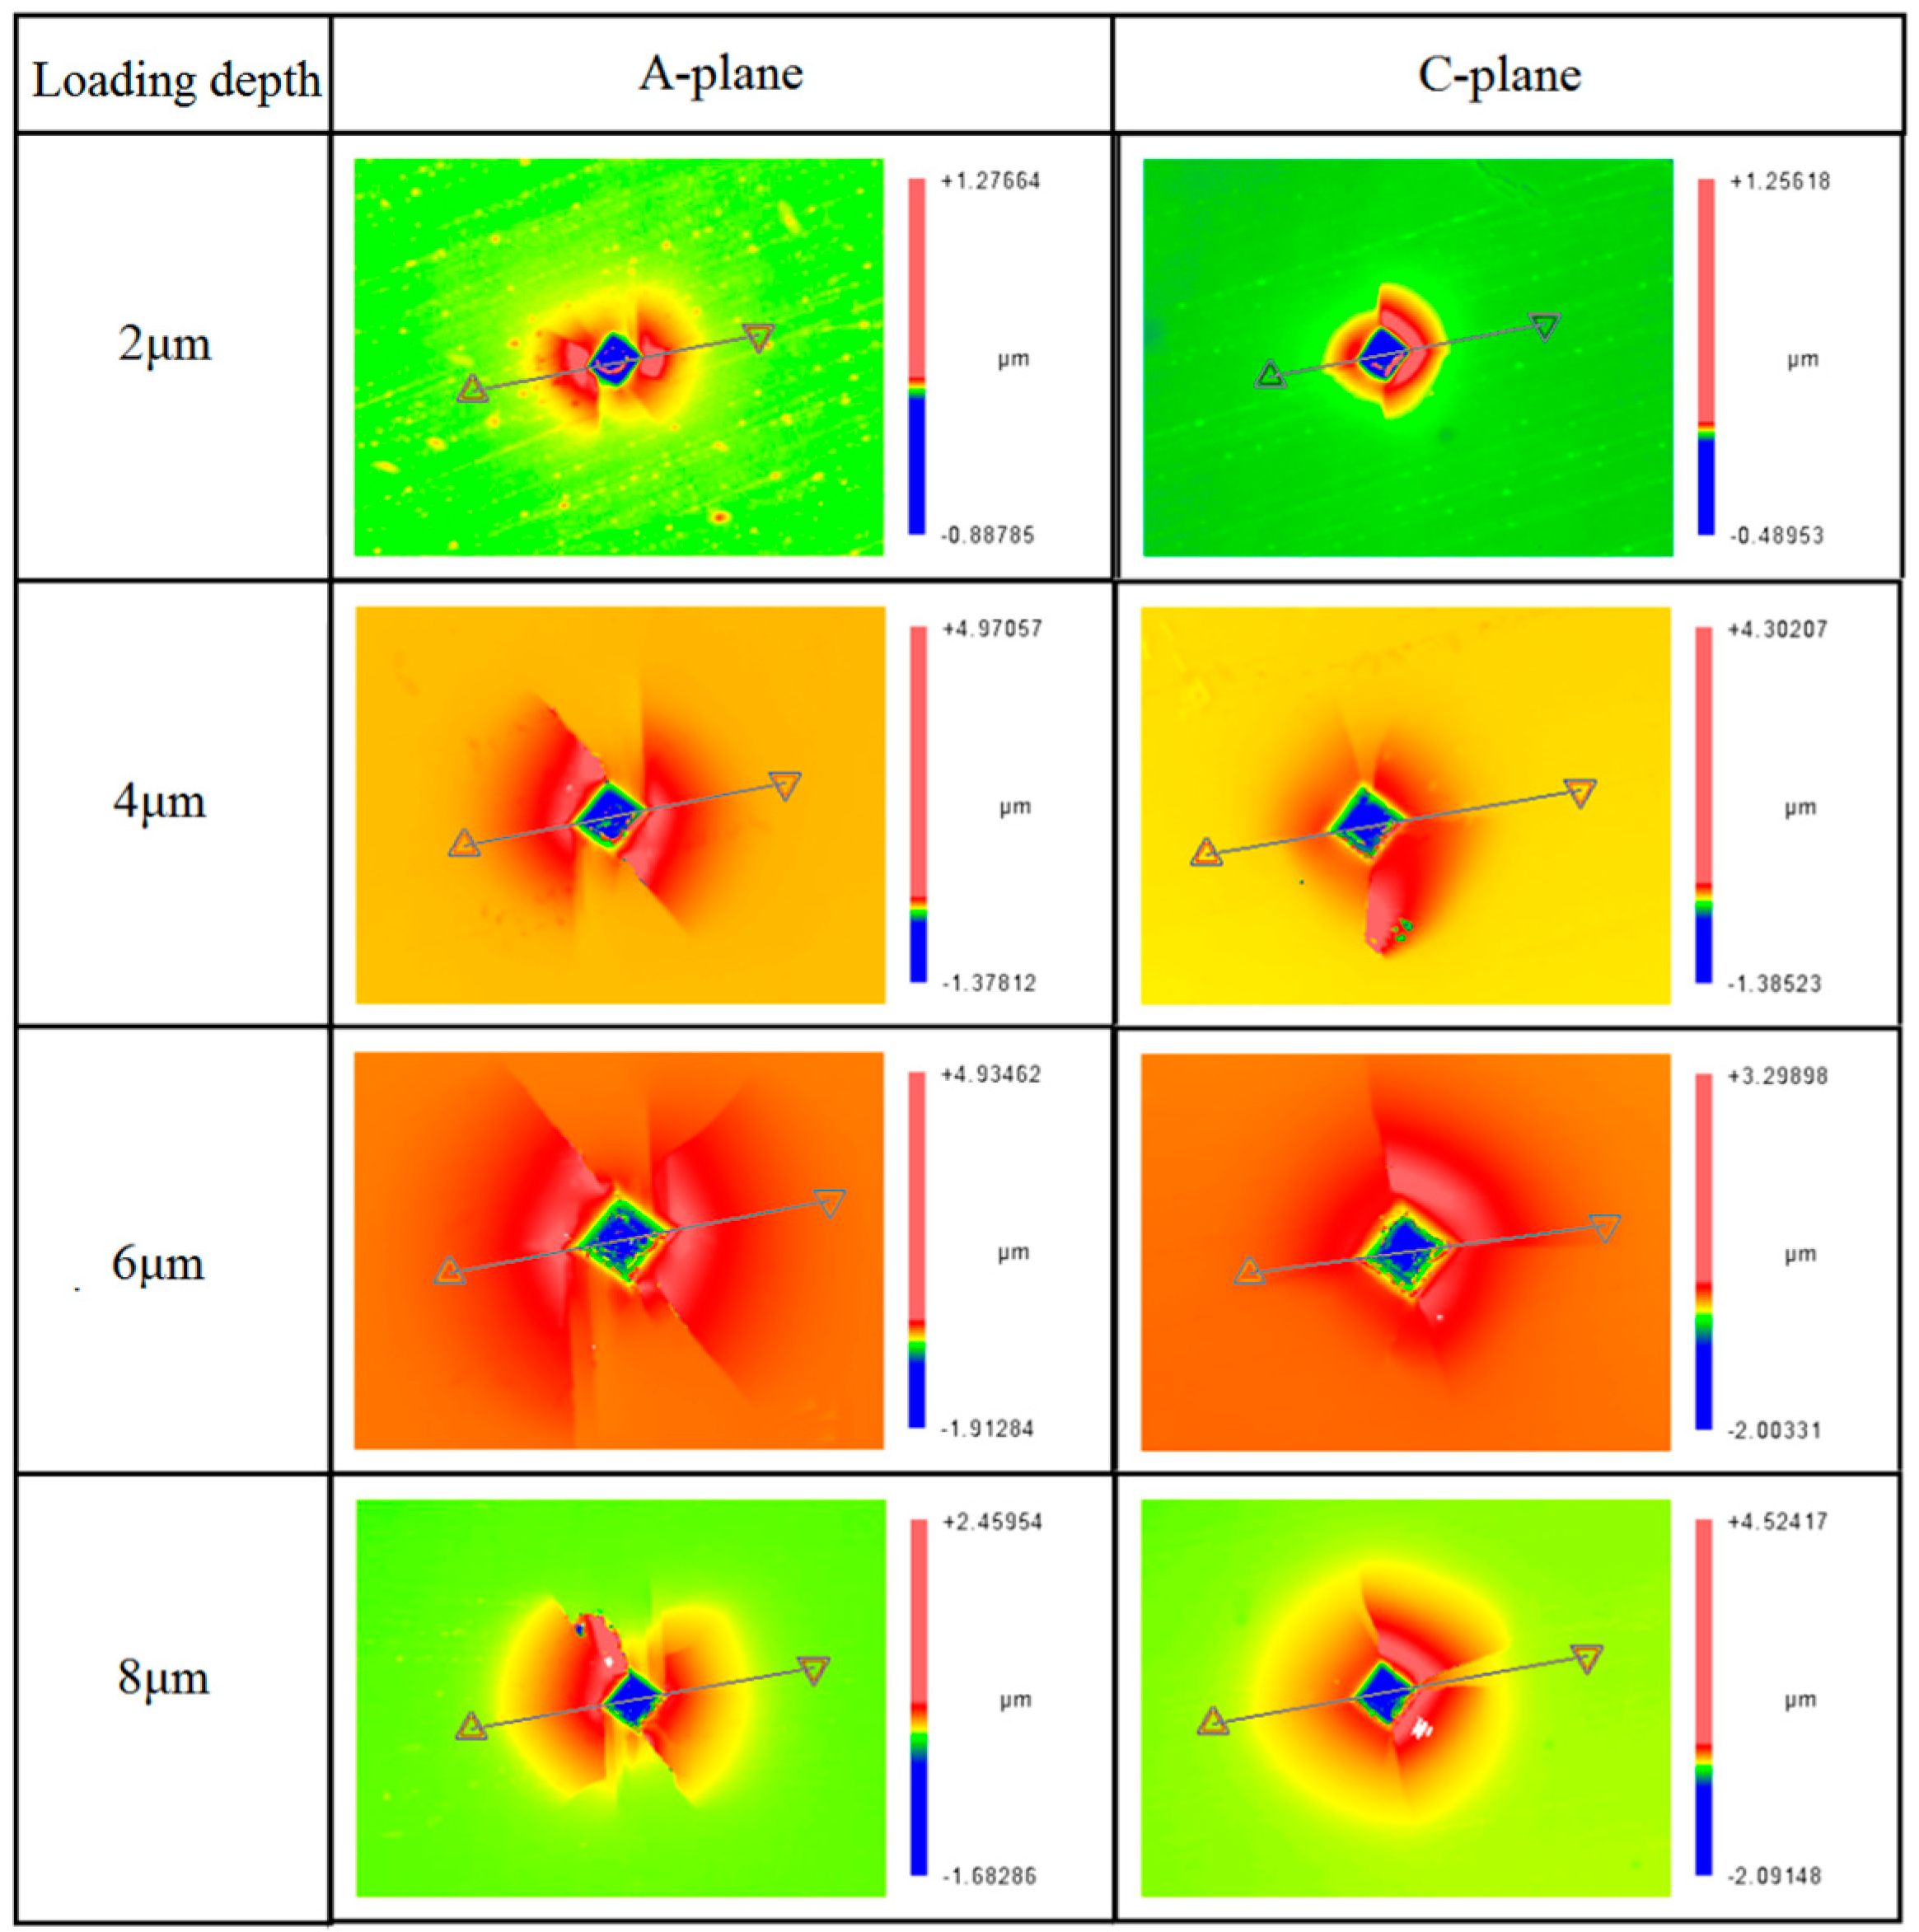
The 3D optical profiler parameters that are employed for measuring the 3D morphology are listed in Table 2. Figure 11 presents the 3D morphology obtained for A-plane and C-plane sapphire tested by sequential indentation after unloading. The 2 μm indicates that the maximun loading depth is 2 μm, respectively. The residual depth was obtained by measuring the cross-sectional profiles, and the cross-sectional profiles are shown at the position of the lines shown in Figure 11. Since sapphire is a kind of brittle material, the residual depth of indentation is smaller than the loading depth. The experiment is conducted at the micron scale, and our purpose is to test the fracture characteristics of materials at the micron scale. The last data of unloading process in Figure 6 is affected by the instrument accuracy. So, the residual depth using the 3D profiler is measured once again. The accuracy of 3D profile is 0.1 nm. These measurements are not affected by the pile-up. The residual depth is the distance from the lowest position of the indentation to material surface and the height of pile-up is not considered. Because the pile-up may be affected by the lateral cracks under the surface. The results are given in Figure 12.
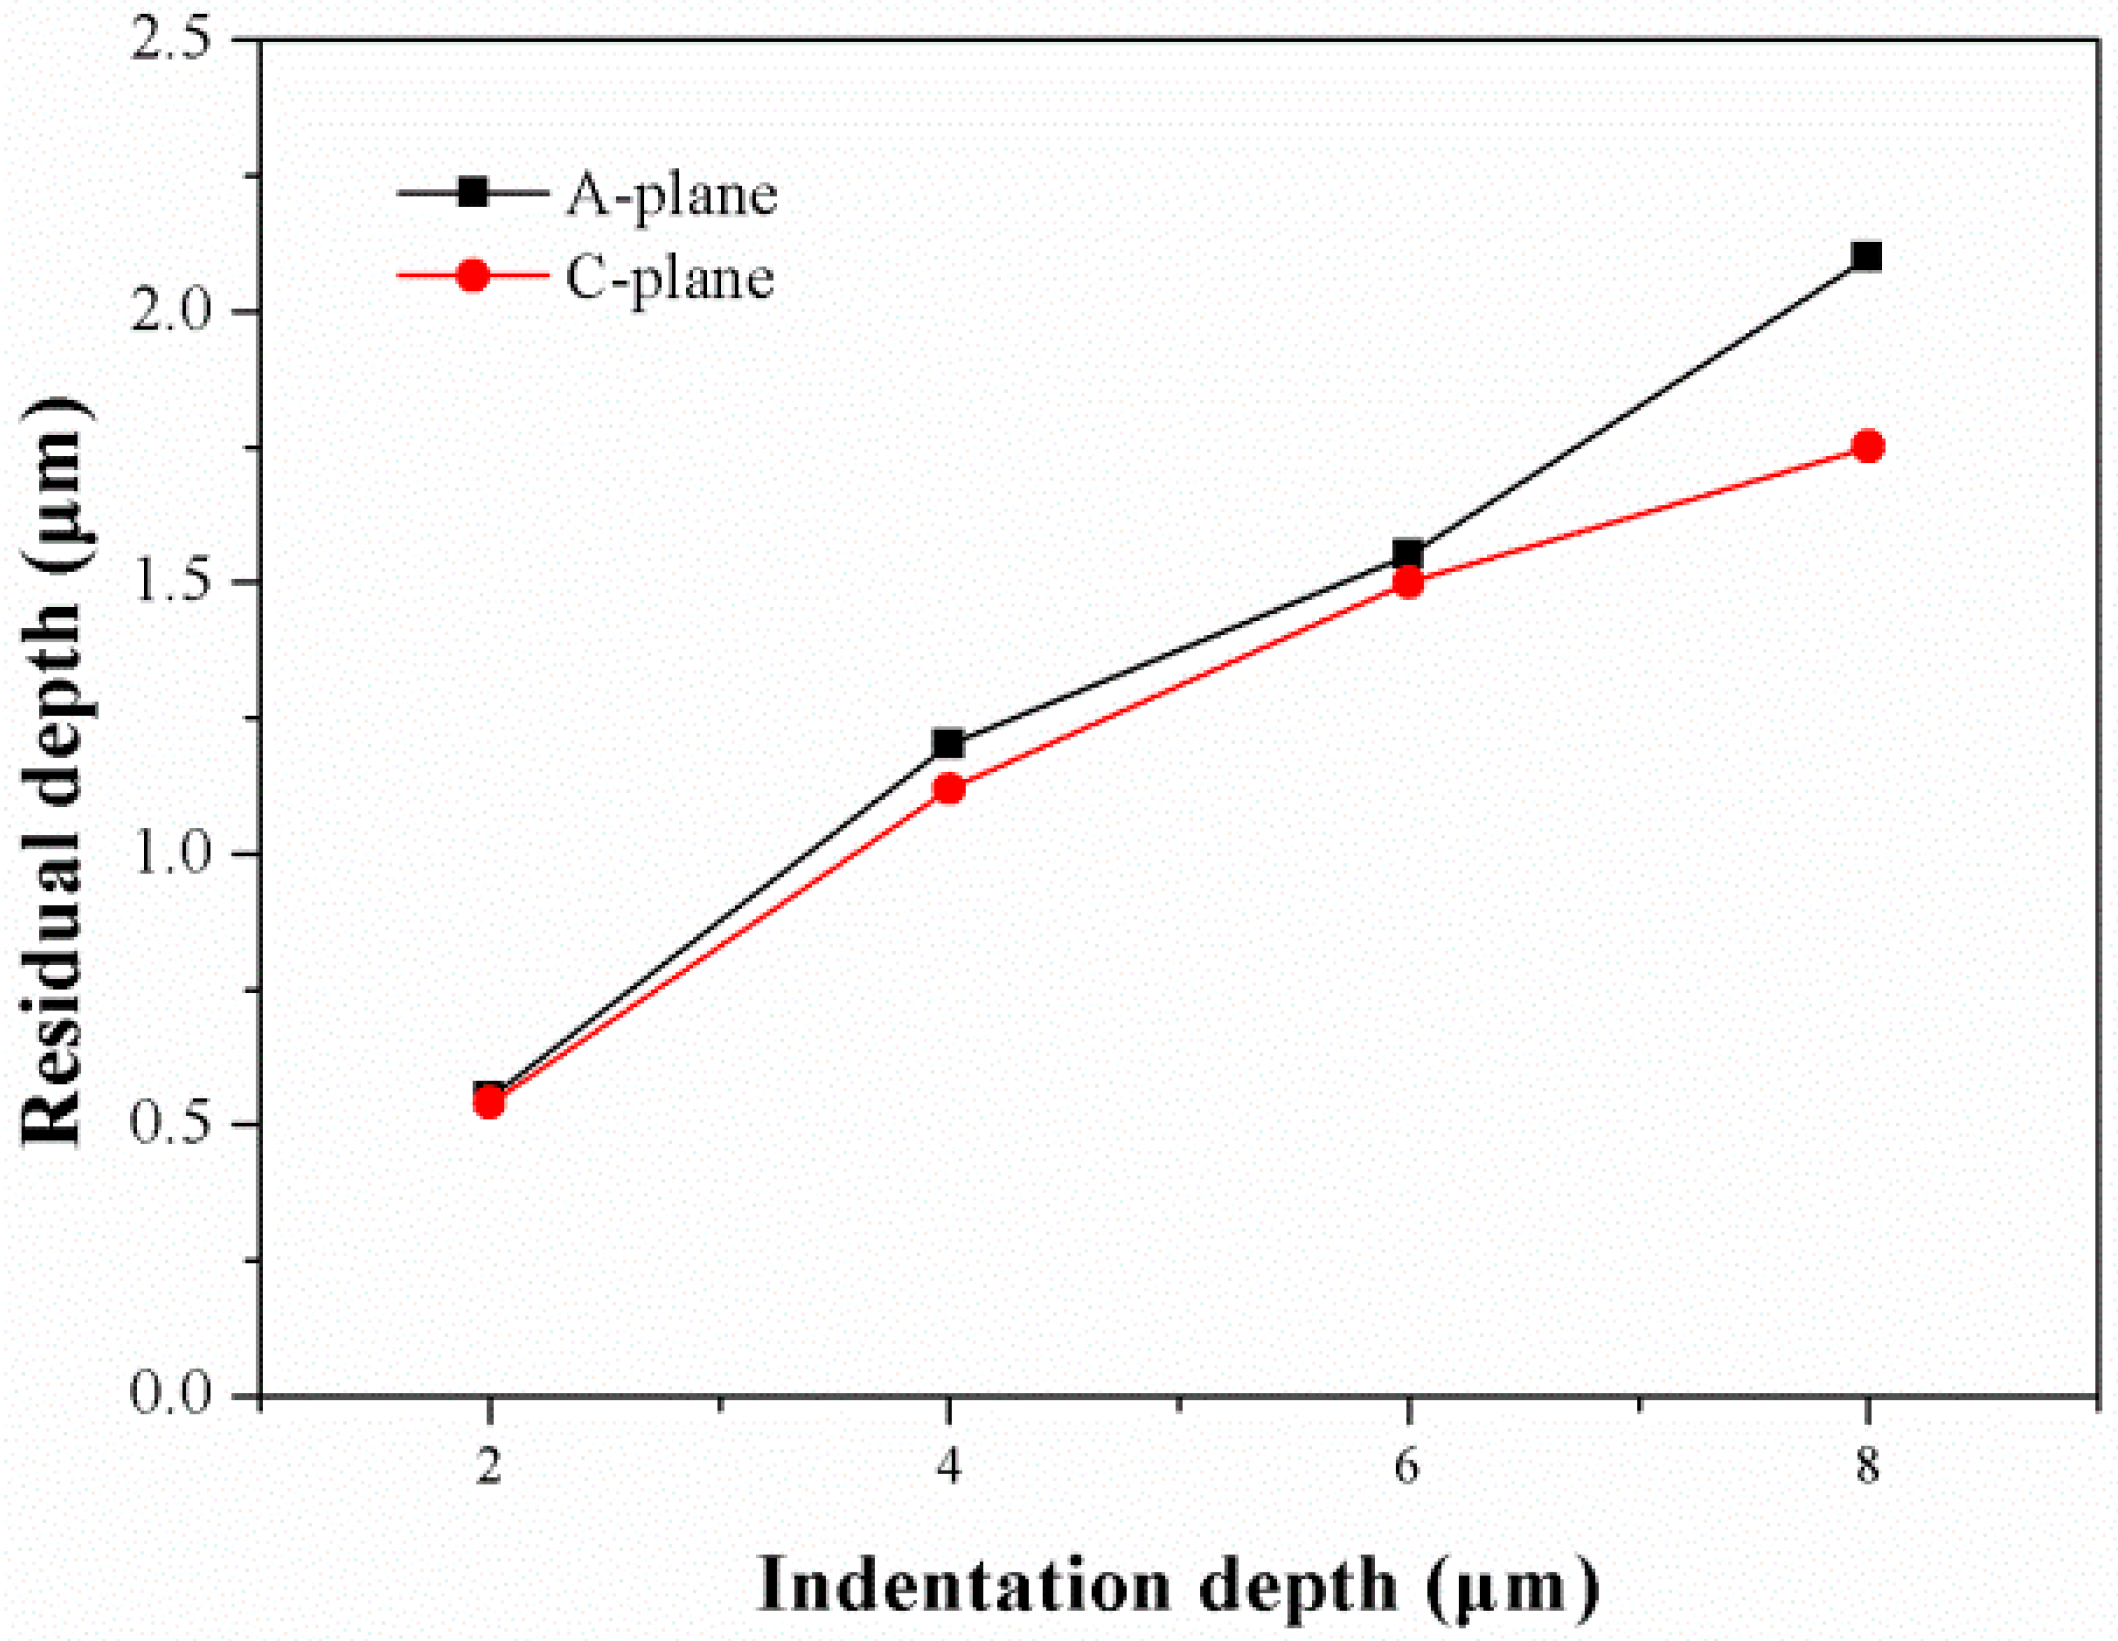
The residual depths of A-plane and C-plane sapphire indentations increase with an increasing indentation depth. The residual depth of the A-plane is greater than that of the C-plane. It may be that the value of H for A-plane sapphire is greater than that of the C-plane. The larger plastic deformation means that the indentation processing is in the plastic stage, but in fact, the experimental is almost in the brittle stage. The A-plane occurs more cracks than C-plane. The energy is consumed during crack propagation, and the stress is released. So, the residual depth for A-plane is larger than the C-plane. Moreover, the size of the affected area and the degree of pile-up of the material increases with increasing indentation depth. The range of pile-up corresponds to the position to which the radial cracks are extended. The pile-up begins from the edge of the indentation, and the height of the pile-up reduces along the direction away from the center of the indentation. Marshall et al. [28] proposed that the composite field at maximum load is the superposition of two components: elastic and residual stress. According to the fracture theory of ideal brittle materials, the median/radial crack system is driven by the principal stress, and the lateral crack system is driven by the residual stress. In the unloading process, the residual field becomes dominant, the residual stress relaxes, and lateral cracks formed at the elastic-plastic boundary of the sample expand. With increasing indentation depth, the position of lateral crack initiation will become deeper with respect to the surface, and the area of the pile-up will increase as well as the length of the lateral cracks. For C-plane sapphire, the pile-up occurs between the four radial cracks that divide the pile-up into four sections. However, for A-plane sapphire, the pile-up only occurs between the cracks along the c-axis, and the area between the cracks along the m-axis is not changed. This tendency is believed to be encouraged by prism slip mechanisms, which have the highest shear stress concentrations in the area oriented along the m-axis in accordance with the model proposed by Tymiak and Gerberich [29].
3.5. Subsurface Damage Analysis by TEM
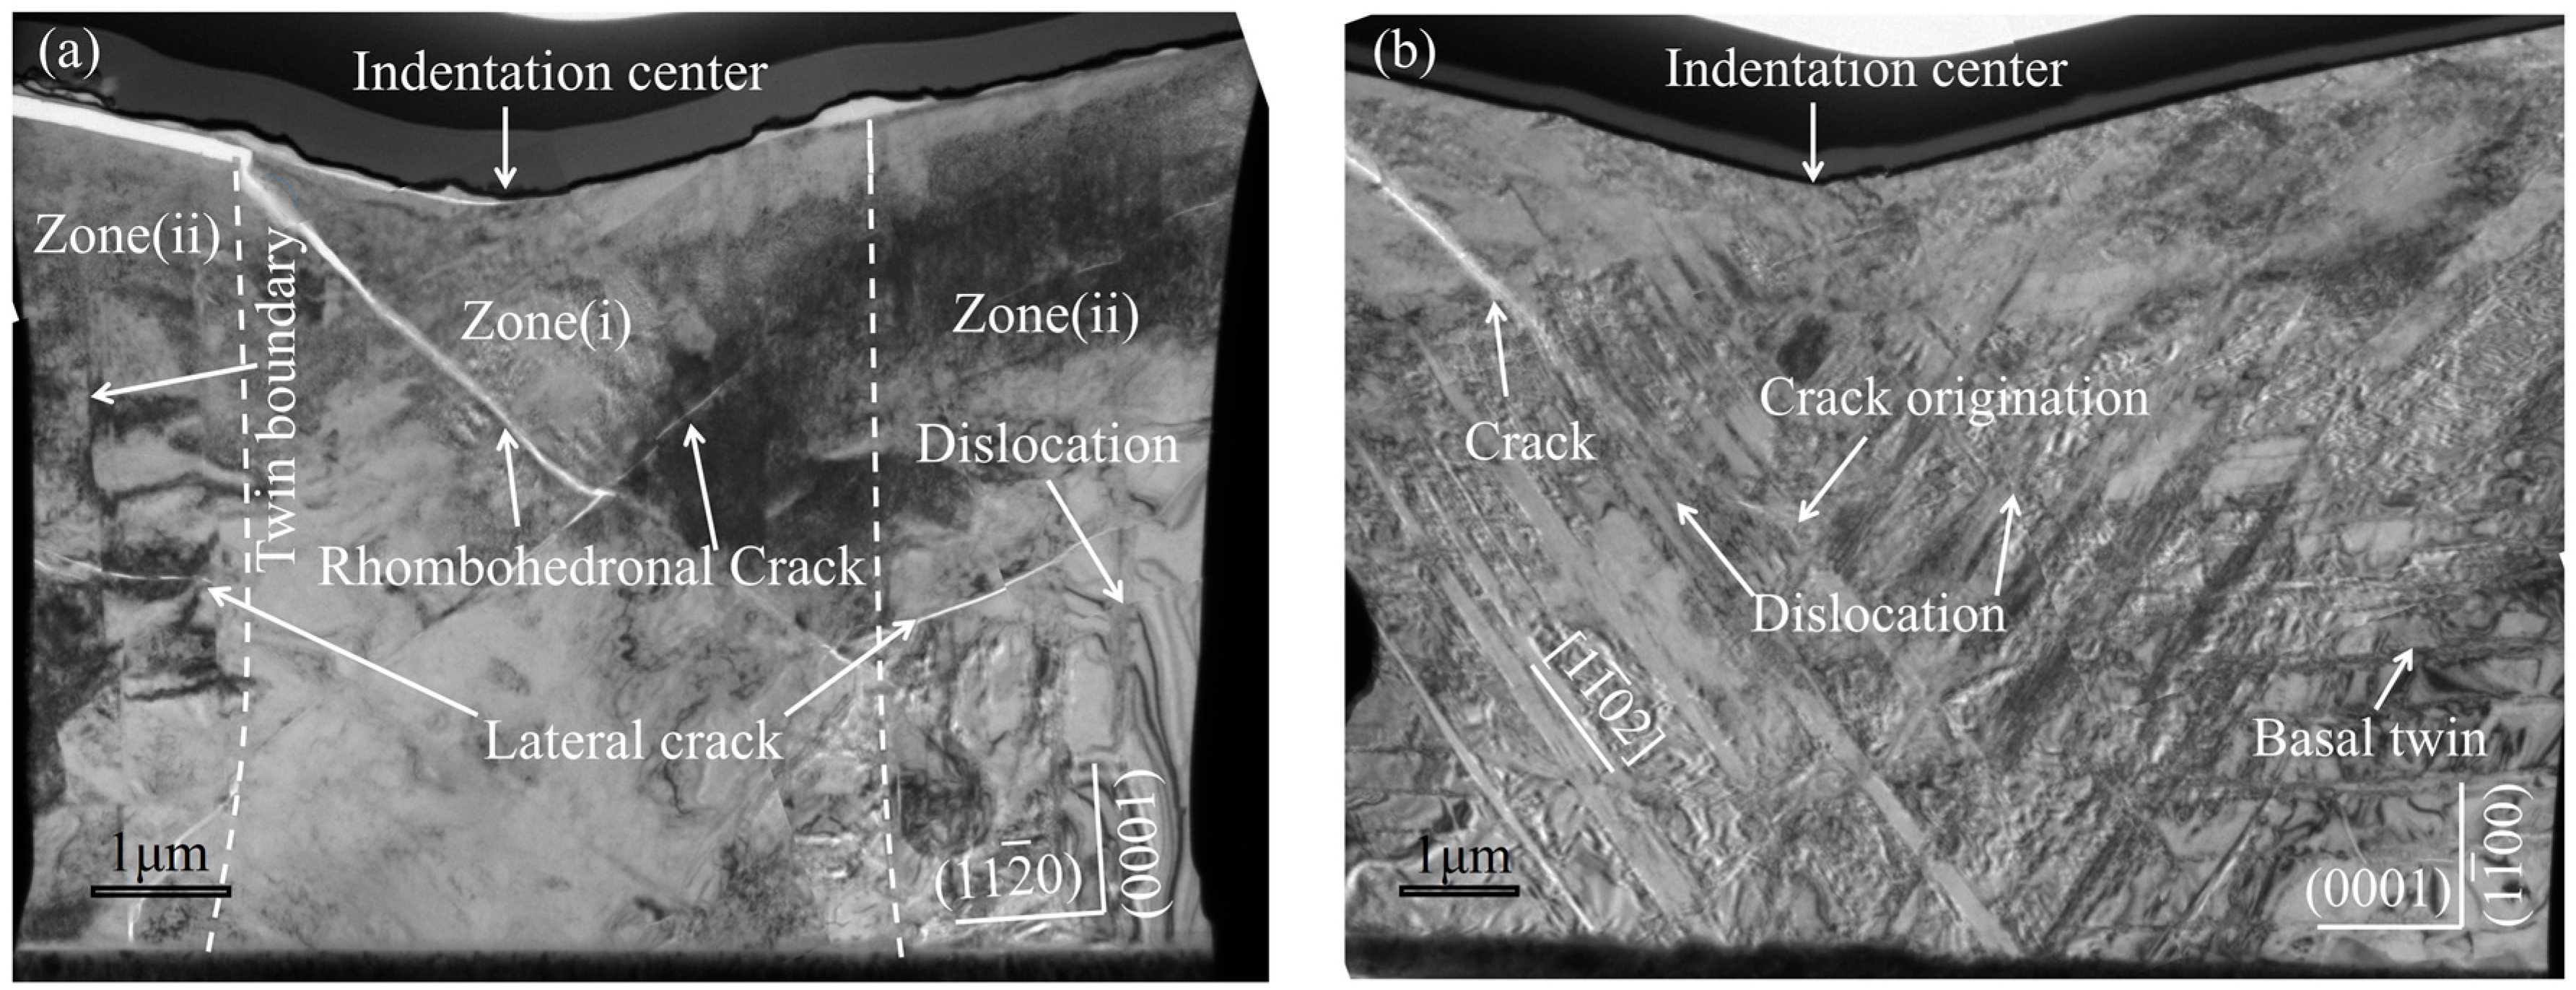
The thickness of the two TEM specimen is about 38.54 nm. Figure 12 shows a TEM cross-sectional image containing two indentations, (a) in the A-plane (110) imaged down (100) and (b) in the C-plane (0001) imaged down (110). The TEM image reveals the existence of a plastic deformation zone. The plastic deformation zone forms under the indenter due to hydrostatic pressure. The dominating deformation modes were observed to be basal twinning on (0001) perpendicular to the indentation surface and dislocations gliding on the non-basal slip planes (Figure 13a). Two zones may be identified at the cross-sectional image, namely (i) the center of image consisting of obvious cracks, and (ii) the two sides of the center cracks consisting of basal twinning, a very high density of dislocations, and small lateral cracks. This angle of the center cracks corresponds to the crystallographic intersection of the R-plane [102] with the M-plane (100). In the center of the indentation, cracks form along the slip systems. But, it does not provide a rationale for the appearance of this twinning trace over other possible rhombohedral twinning systems [16].
Most recently, Subhash [18] provided a comprehensive description of basal and rhombohedral crack plane interactions, and the experiment was conducted by sequential Vickers indentations on A-plane sapphire. Tymiak and Gerberich’s Modeling [29], which yielded a resolved shear stress (RSS) distribution map for all of the known slip and twinning systems, provides a good correlation with previous experimental activated by indentation at room temperature. As with the prismatic surface, the main deformation modes observed were basal twinning C-plane (0001) and dislocation R-plane [102], see in Figure 13b. The formation of a twin at compression along the C-axis shows shear along the rhombohedronal R-plane [3]. The maximum stress is just below the indentation, R-plane slip dominates the plastic deformation. Cracks could be observed along the R-plane due to the slip system. The slip along one rhombohedronal R-plane does not cause any substantial change in the crystal strength; however, the slip in two crossing rhombohedral planes results in a crack origination in the intersection point [3]. Since the strongest deformation under the indenter occurs on the C-plane (0001) due to slipping over the basal planes parallel to the surface, and the plane of the easiest slip is also C-plane (0001), with basal slip predominating in the direction (110) [3], the C-plane (0001) twinning could only be seen on both sides of the bottom for this specimen.
4. Conclusions
Sequential indentation tests were performed on A-plane and C-plane sapphire with a Vickers indenter to determine the effect of crystallography on crack propagation. The following conclusions were obtained.
- The rate of crack propagation on A-plane sapphire was affected by the depth of indentation, which exhibited an obvious regularity. However, the effect of the depth of indentation on crack propagation was not nearly as uniform for C-plane sapphire.
- Different crack systems were indicated for A-plane and C-plane sapphire. Four different crack systems were exhibited by A-plane sapphire. The fracture toughness values of A-plane and C-plane sapphire that were obtained here were smaller than those obtained in previous studies.
- The pile-up of material was observed around the indentations on the A-plane and C-plane faces. For A-plane sapphire, the area of pile-up occurred along the c-axis due to the mechanical anisotropy of sapphire.
- Cross-sectional TEM shows that the domination deformation in the sapphire of A-plane and C-plane was both non-basal dislocation and basal twin.
Through the research, the fracture process of sapphire in brittle stage is clearer, and the findings in this study have guiding significance for the precision and ultra precision machining of sapphire.
Acknowledgments
This project is supported by National Natural Science Foundation of China (Grant No. U1305241 and 51235004) and Graduates Cultivation Project of Huaqiao University for Research and Innovation Ability (Grant No. 1511103003).
Author Contributions
Xipeng Xu and Feng Jiang conceived and designed the experiments; Ningchang Wang performed the experiments; Ningchang Wang and Feng Jiang analyzed the data; Xizhao Lu contributed reagents/materials/analysis tools; Ningchang Wang wrote the paper.
Conflicts of Interest
The authors declare no conflict of interest.
References
- Júnior, A.F. Controlled wet erosive wear of sapphire. J. Eur. Ceram. Soc. 2005, 25, 3265–3268. [Google Scholar] [CrossRef]
- Mao, W.G.; Shen, Y.G.; Lu, C. Nanoscale elastic–plastic deformation and stress distributions of the c plane of sapphire single crystal during nanoindentation. J. Eur. Ceram. Soc. 2011, 31, 1865–1871. [Google Scholar] [CrossRef]
- Dobrovinskaya, E.R.; Lytvynov, L.A.; Pishchik, V. Sapphire Material, Manufacturing, Applications; Springer Science+Business Media: New York, NY, USA, 2009; pp. 106–187. ISBN 978-0-387-85695-7. [Google Scholar]
- Graça, S.S.; Trabadelo, V.; Neels, A.; Kuebler, J.; Nader, V.L.; Gamez, G.; Döbeli, M.; Wasmer, K. Influence of mosaicity on the fracture behavior of sapphire. Acta Mater. 2014, 67, 67–80. [Google Scholar] [CrossRef]
- Armstrong, R.W.; Walley, S.M.; Elban, W.L. Crystal Indentation Hardness. Crystals 2017, 7, 21. [Google Scholar] [CrossRef]
- Galanov, B.A.; Milman, Y.V.; Chugunova, S.I.; Goncharova, I.V.; Voskoboinik, I.V. Application of the Improved Inclusion Core Model of the Indentation Process for the Determination of Mechanical Properties of Materials. Crystals 2017, 7, 87. [Google Scholar] [CrossRef]
- Ruestes, C.J.; Alhafez, I.A.; Urbassek, H.M. Atomistic Studies of Nanoindentation—A Review of Recent Advances. Crystals 2017, 7, 293. [Google Scholar] [CrossRef]
- Mao, W.; Shen, Y. Nanoindentation study of pop-in phenomenon characteristics and mechanical properties of sapphire 102 crystal. J. Am. Ceram. Soc. 2012, 95, 3605–3612. [Google Scholar] [CrossRef]
- Bhattacharya, M.; Dey, A.; Mukhopadhyay, A.K. Influence of loading rate on nanohardness of sapphire. Ceram. Int. 2016, 42, 13378–13386. [Google Scholar] [CrossRef]
- Bradby, J.E.; Kucheyev, S.O.; Williams, J.S.; Wongleung, J.; Swain, M.V.; Munroe, P.; Li, G.; Phillips, M.R. Indentation-induced damage in GaN epilayers. Appl. Phys. Lett. 2002, 80, 383–385. [Google Scholar] [CrossRef]
- Nowak, R.; Manninen, T.; Heiskanen, K.; Sekino, T.; Hikasa, A.; Niihara, K.; Takagi, T. Peculiar surface deformation of sapphire Numerical simulation of nanoindentation. Appl. Phys. Lett. 2003, 83, 5214–5216. [Google Scholar] [CrossRef]
- Huang, J.; Xu, K.; Gong, X.J.; Wang, J.F.; Fan, Y.M.; Liu, J.Q.; Zeng, X.H.; Ren, G.Q.; Zhou, T.F.; Yang, H. Dislocation cross-slip in GaN single crystals under nanoindentation. Appl. Phys. Lett. 2011, 98, 221906:1–221906:3. [Google Scholar] [CrossRef]
- Zhang, Y.; Zhang, L.; Liu, M.; Zhang, F.; Mylvaganam, K.; Liu, W. Understanding the friction and wear of KDP crystals by nanoscratching. Wear 2015, 332–333, 900–906. [Google Scholar] [CrossRef]
- Nowak, R.; Sekino, T.; Maruno, S.; Niihara, K. Deformation of sapphire induced by a spherical indentation on the 100 plane. Appl. Phys. Lett. 1996, 68, 1063–1065. [Google Scholar] [CrossRef]
- Guillou, M.O.; Henshall, J.L.; Hooper, R.M. Indentation fracture and soft impresser fatigue in sapphire and polycrystalline alumina. Int. J. Refract. Met. Hard Mater. 1998, 16, 323–329. [Google Scholar] [CrossRef]
- Haney, E.J.; Subhash, G. Static and dynamic indentation response of basal and prism plane sapphire. J. Eur. Ceram. Soc. 2011, 31, 1713–1721. [Google Scholar] [CrossRef]
- Zhang, C.; Feng, P.; Zhang, J. Ultrasonic vibration-assisted scratch-induced characteristics of c-plane sapphire with a spherical indenter. Int. J. Mach. Tools Manuf. 2013, 64, 38–48. [Google Scholar] [CrossRef]
- Haney, E.J.; Subhash, G. Analysis of interacting cracks due to sequential indentations on sapphire. Acta Mater. 2011, 59, 3528–3536. [Google Scholar] [CrossRef]
- Huang, L.; Bonifacio, C.; Song, D.; Benthem, K.V.; Mukherjee, A.K.; Schoenung, J.M. Investigation into the microstructure evolution caused by nanoscratch-induced room temperature deformation in M-plane sapphire. Acta Mater. 2011, 59, 5181–5193. [Google Scholar] [CrossRef]
- Wang, S.; An, C.; Zhang, F.; Wang, J.; Lei, X.; Zhang, J. An experimental and theoretical investigation on the brittle ductile transition and cutting force anisotropy in cutting KDP crystal. Int. J. Mach. Tools Manuf. 2016, 106, 98–108. [Google Scholar] [CrossRef]
- Zong, W.J.; Wu, D.; Li, Z.Q. Strength dependent design method for the crystal orientation of diamond berkovich indenter. Mater. Des. 2015, 89, 1057–1070. [Google Scholar] [CrossRef]
- Li, X.; Li, Z.; Tao, X.F.; Ren, L.L.; Gao, S.T.; Xu, G.F. Distribution of residual strain around nanoindentations in silicon. Mater. Lett. 2014, 132, 285–289. [Google Scholar] [CrossRef]
- Lawn, B.R.; Evans, A.G.; Marshall, D.B. Elastic/plastic indentation damage in ceramics the median/radial crack system. J. Am. Ceram. Soc. 1980, 63, 574–581. [Google Scholar] [CrossRef]
- Kim, Y.G.; Kim, D.K. In situ observation of fracture sequence of physical vapor deposited tin film on 1120 sapphire. J. Mater. Res. 2005, 20, 1389–1395. [Google Scholar] [CrossRef]
- Anstis, G.R.; Chantikul, P.; Lawn, B.R.; Marshall, D.B. A critical evaluation of indentation techniques for measuring fracture toughness i, direct crack measurements. J. Am. Ceram. Soc. 1981, 64, 533–538. [Google Scholar] [CrossRef]
- Newcomb, S.A.; Tressler, R.E. High-temperature fracture toughness of sapphire. J. Am. Ceram. Sci. 1994, 77, 3030–3032. [Google Scholar] [CrossRef]
- Wunderlich, W.; Awaji, H. Molecular dynamics-simulations of the fracture toughness of sapphire. Prog. Theor. Phys. Suppl. 2001, 22, 53–59. [Google Scholar] [CrossRef]
- Marshall, D.B.; Lawn, B.R. Residual stress effects in sharp contact cracking. J. Mater. Sci. 1979, 14, 2001–2012. [Google Scholar] [CrossRef]
- Tymiak, N.I.; Gerberich, W.W. Initial stages of contact-induced plasticity in sapphire. I. Surface traces of slip and twinning. Philos. Mag. 2007, 87, 5143–5168. [Google Scholar] [CrossRef]
Figure 1.
Schematic of the orientation of (a) A-plane and (b) C-plane sapphire crystals.
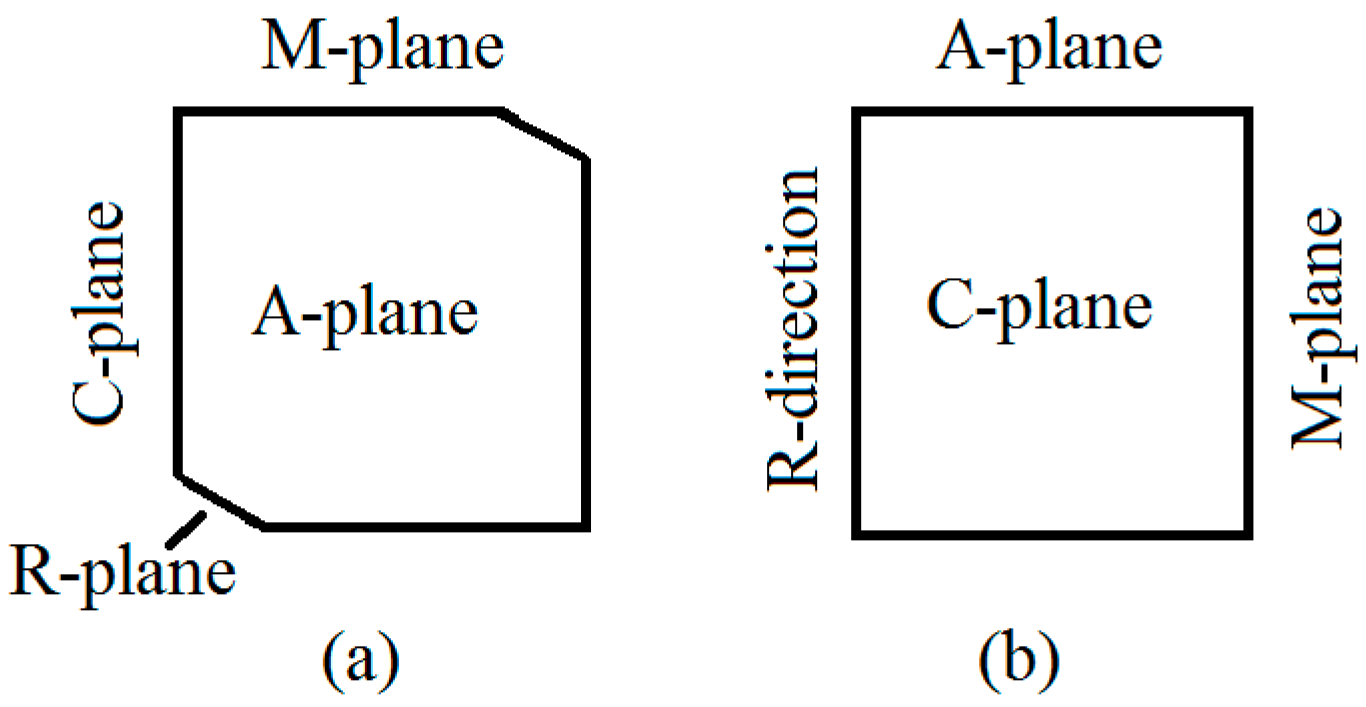
Figure 2.
Schematic of the sequential indentation testing procedure and infeed depth interval is 0.5 μm.
Figure 2.
Schematic of the sequential indentation testing procedure and infeed depth interval is 0.5 μm.
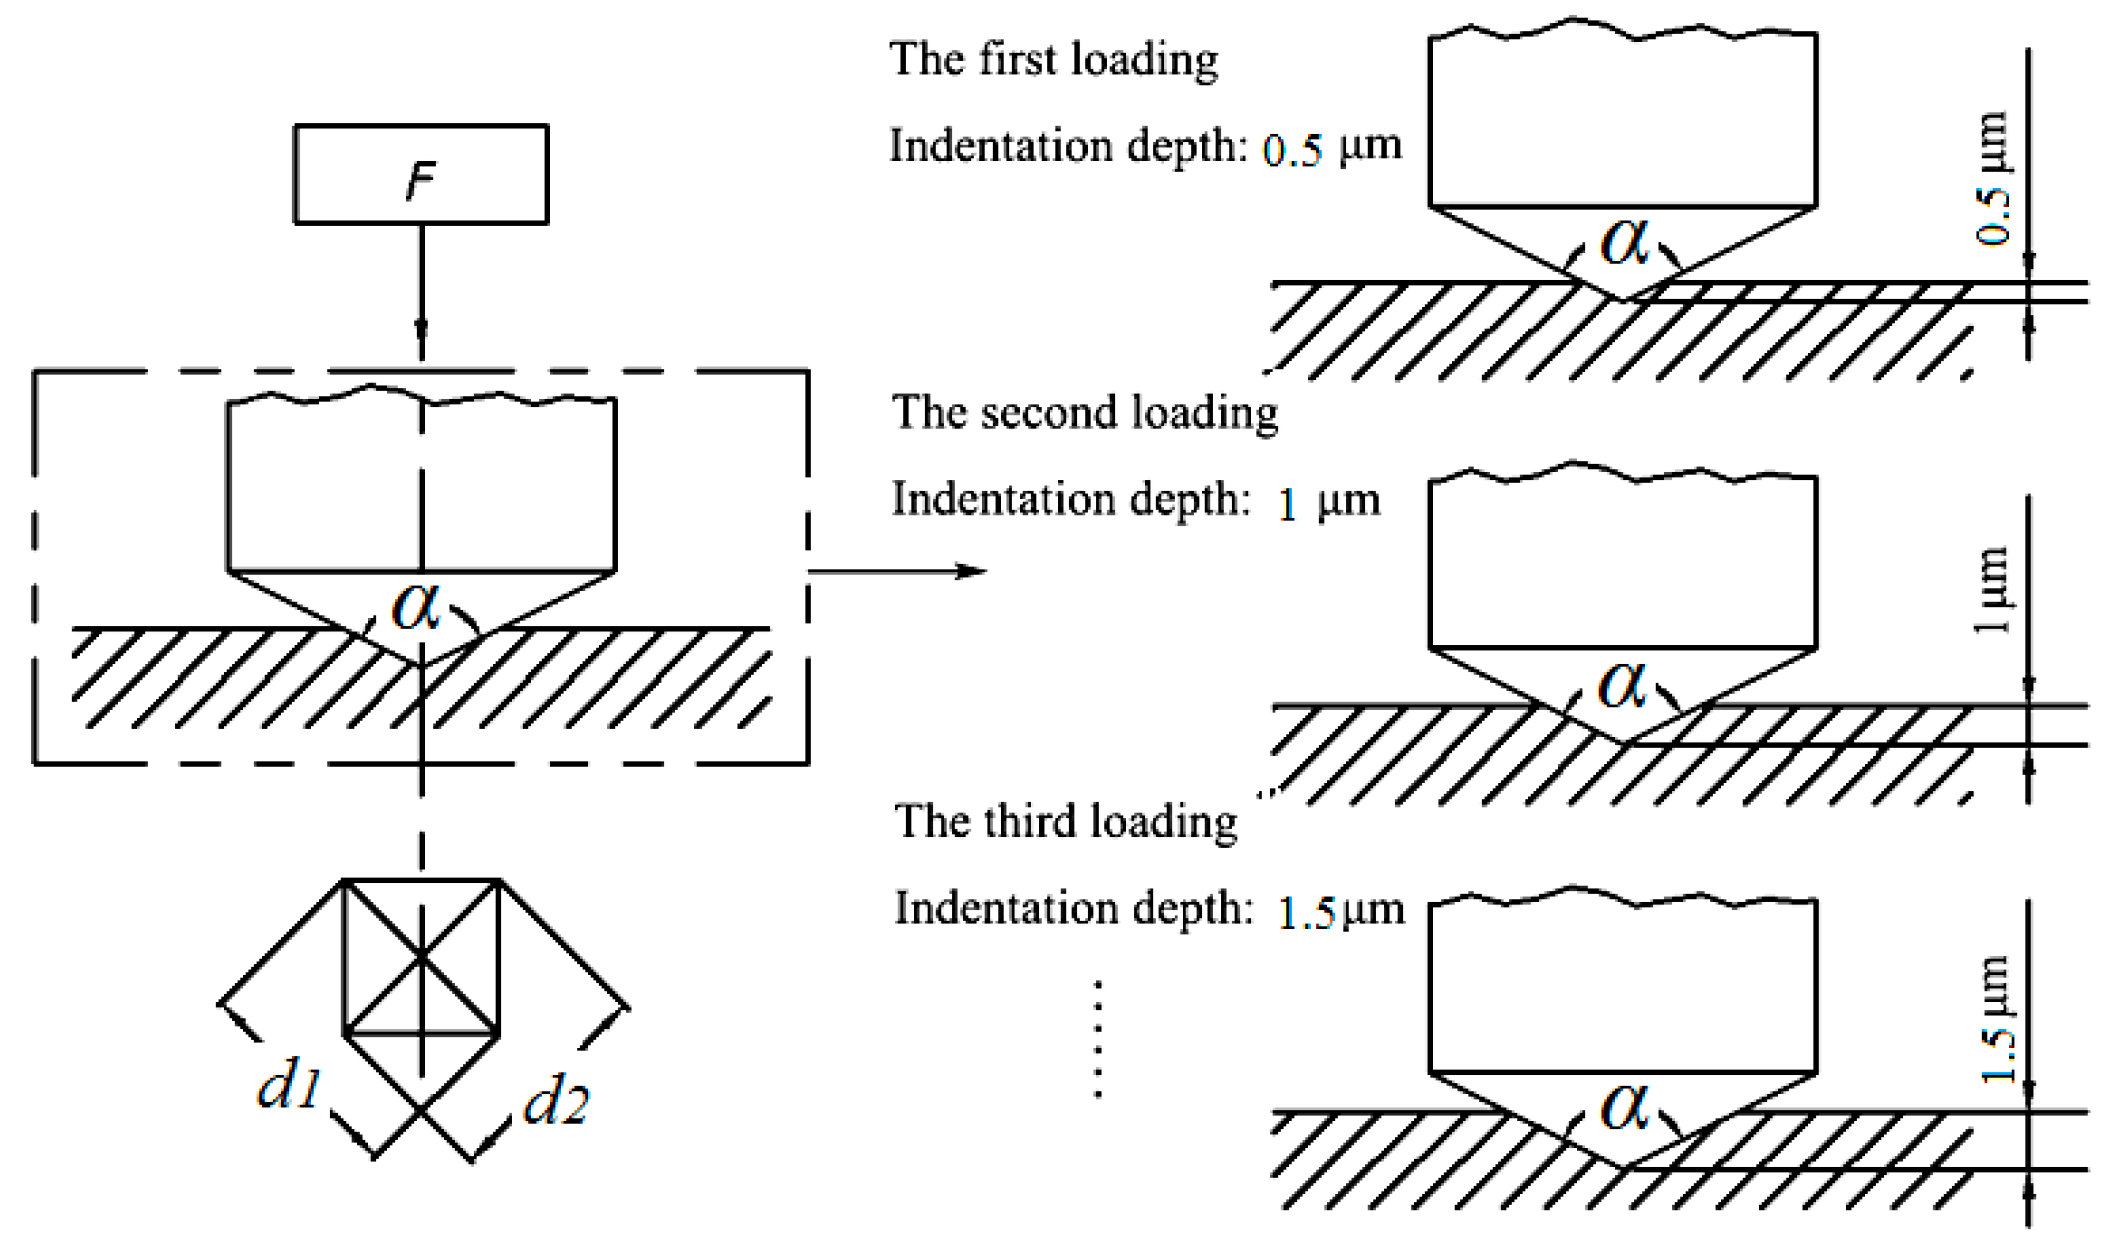
Figure 3.
Typical load-displacement curves of sapphire crystal indented on the (a) A-plane and (b) C-plane under ultra-low nanoindentation loads at room temperature. Inset is the magnified region indicated by a rectangle, which presents the pop-in during loading.
Figure 3.
Typical load-displacement curves of sapphire crystal indented on the (a) A-plane and (b) C-plane under ultra-low nanoindentation loads at room temperature. Inset is the magnified region indicated by a rectangle, which presents the pop-in during loading.
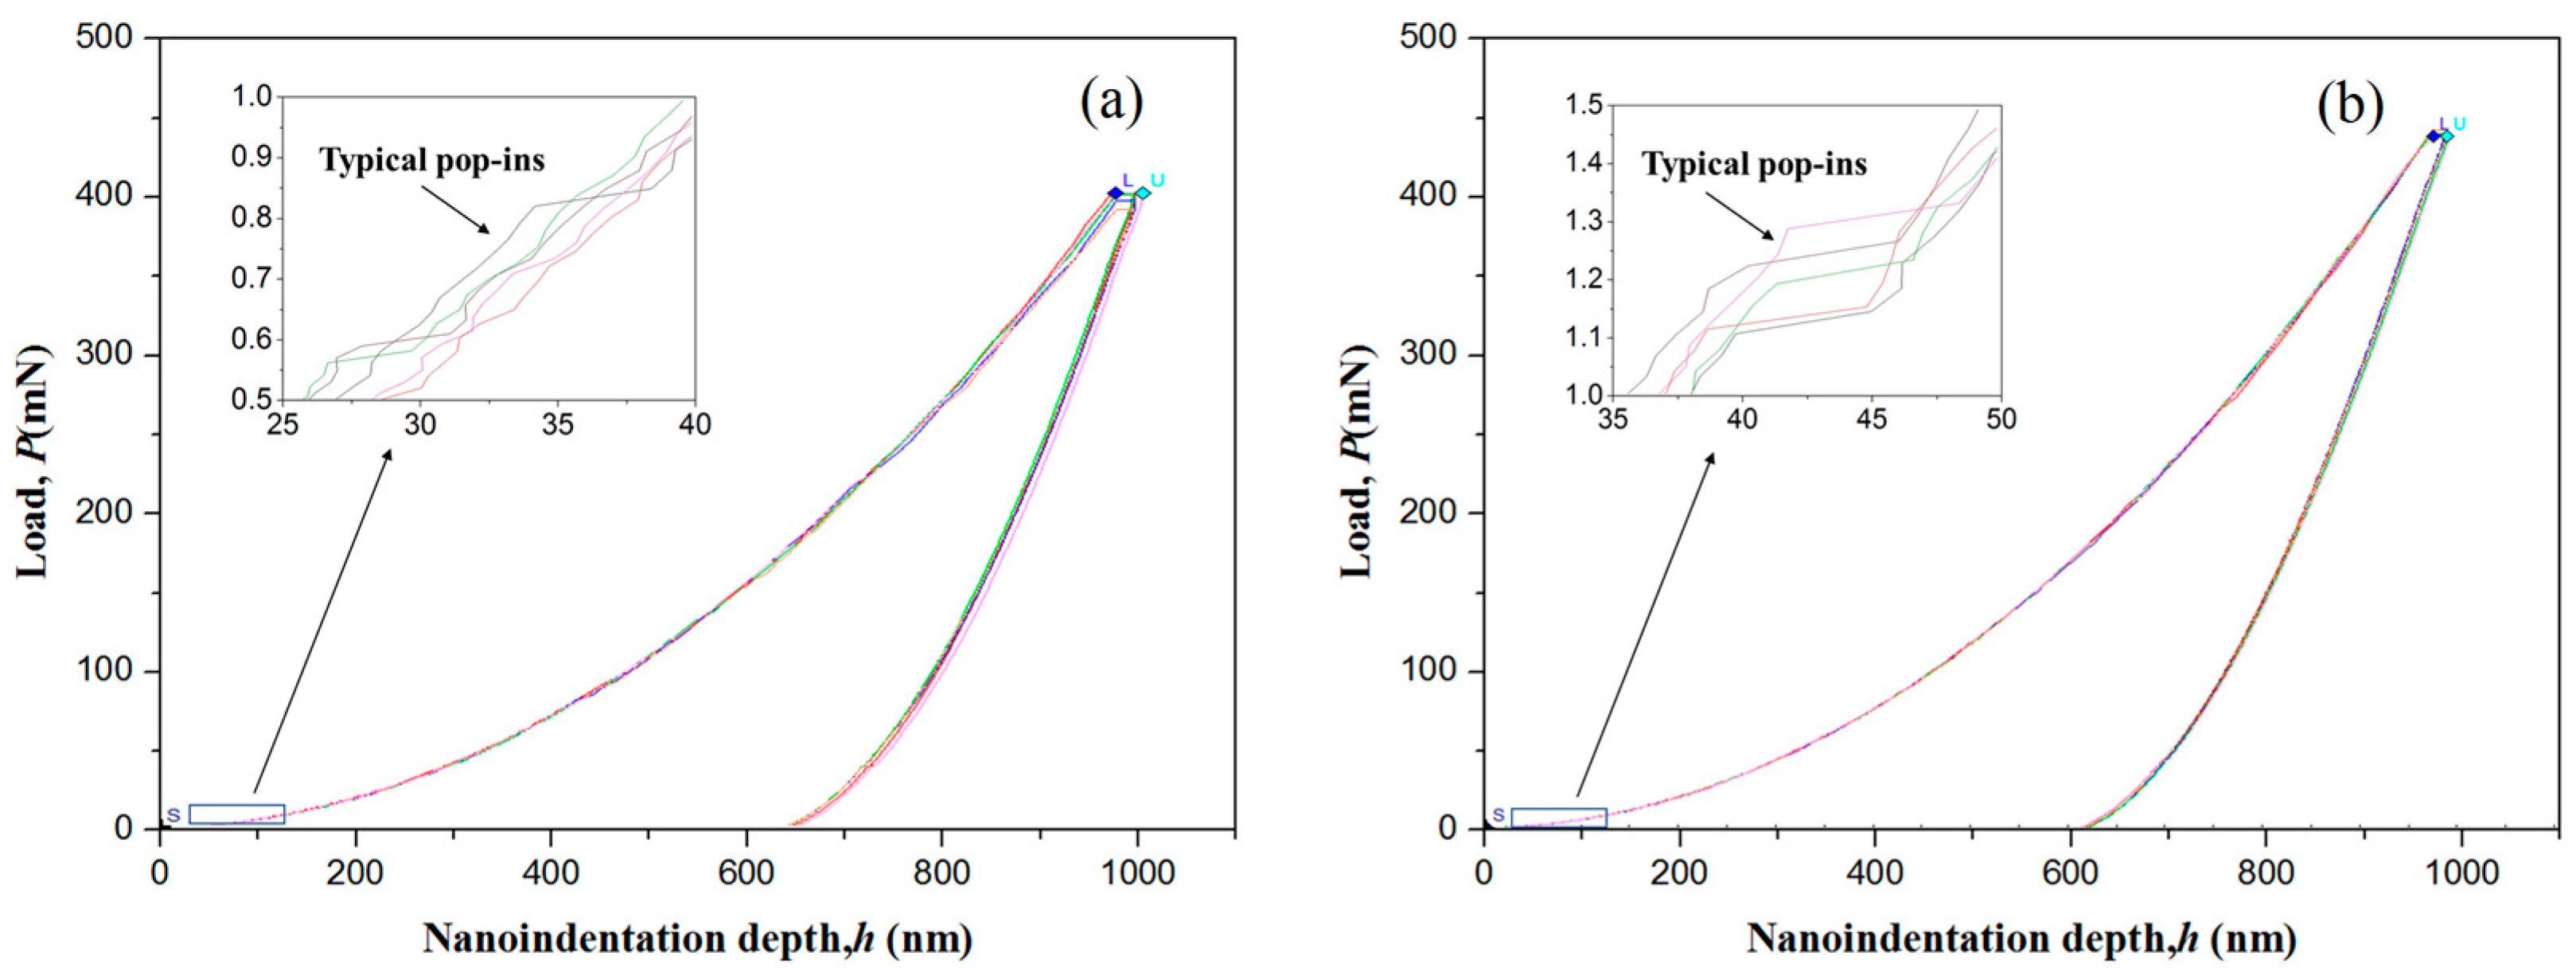
Figure 4.
The loading force versus time for an 8-μm indentation depth and a 10 s dwell period. The inset presents an expanded view of the selected region after low pass filtering.
Figure 4.
The loading force versus time for an 8-μm indentation depth and a 10 s dwell period. The inset presents an expanded view of the selected region after low pass filtering.
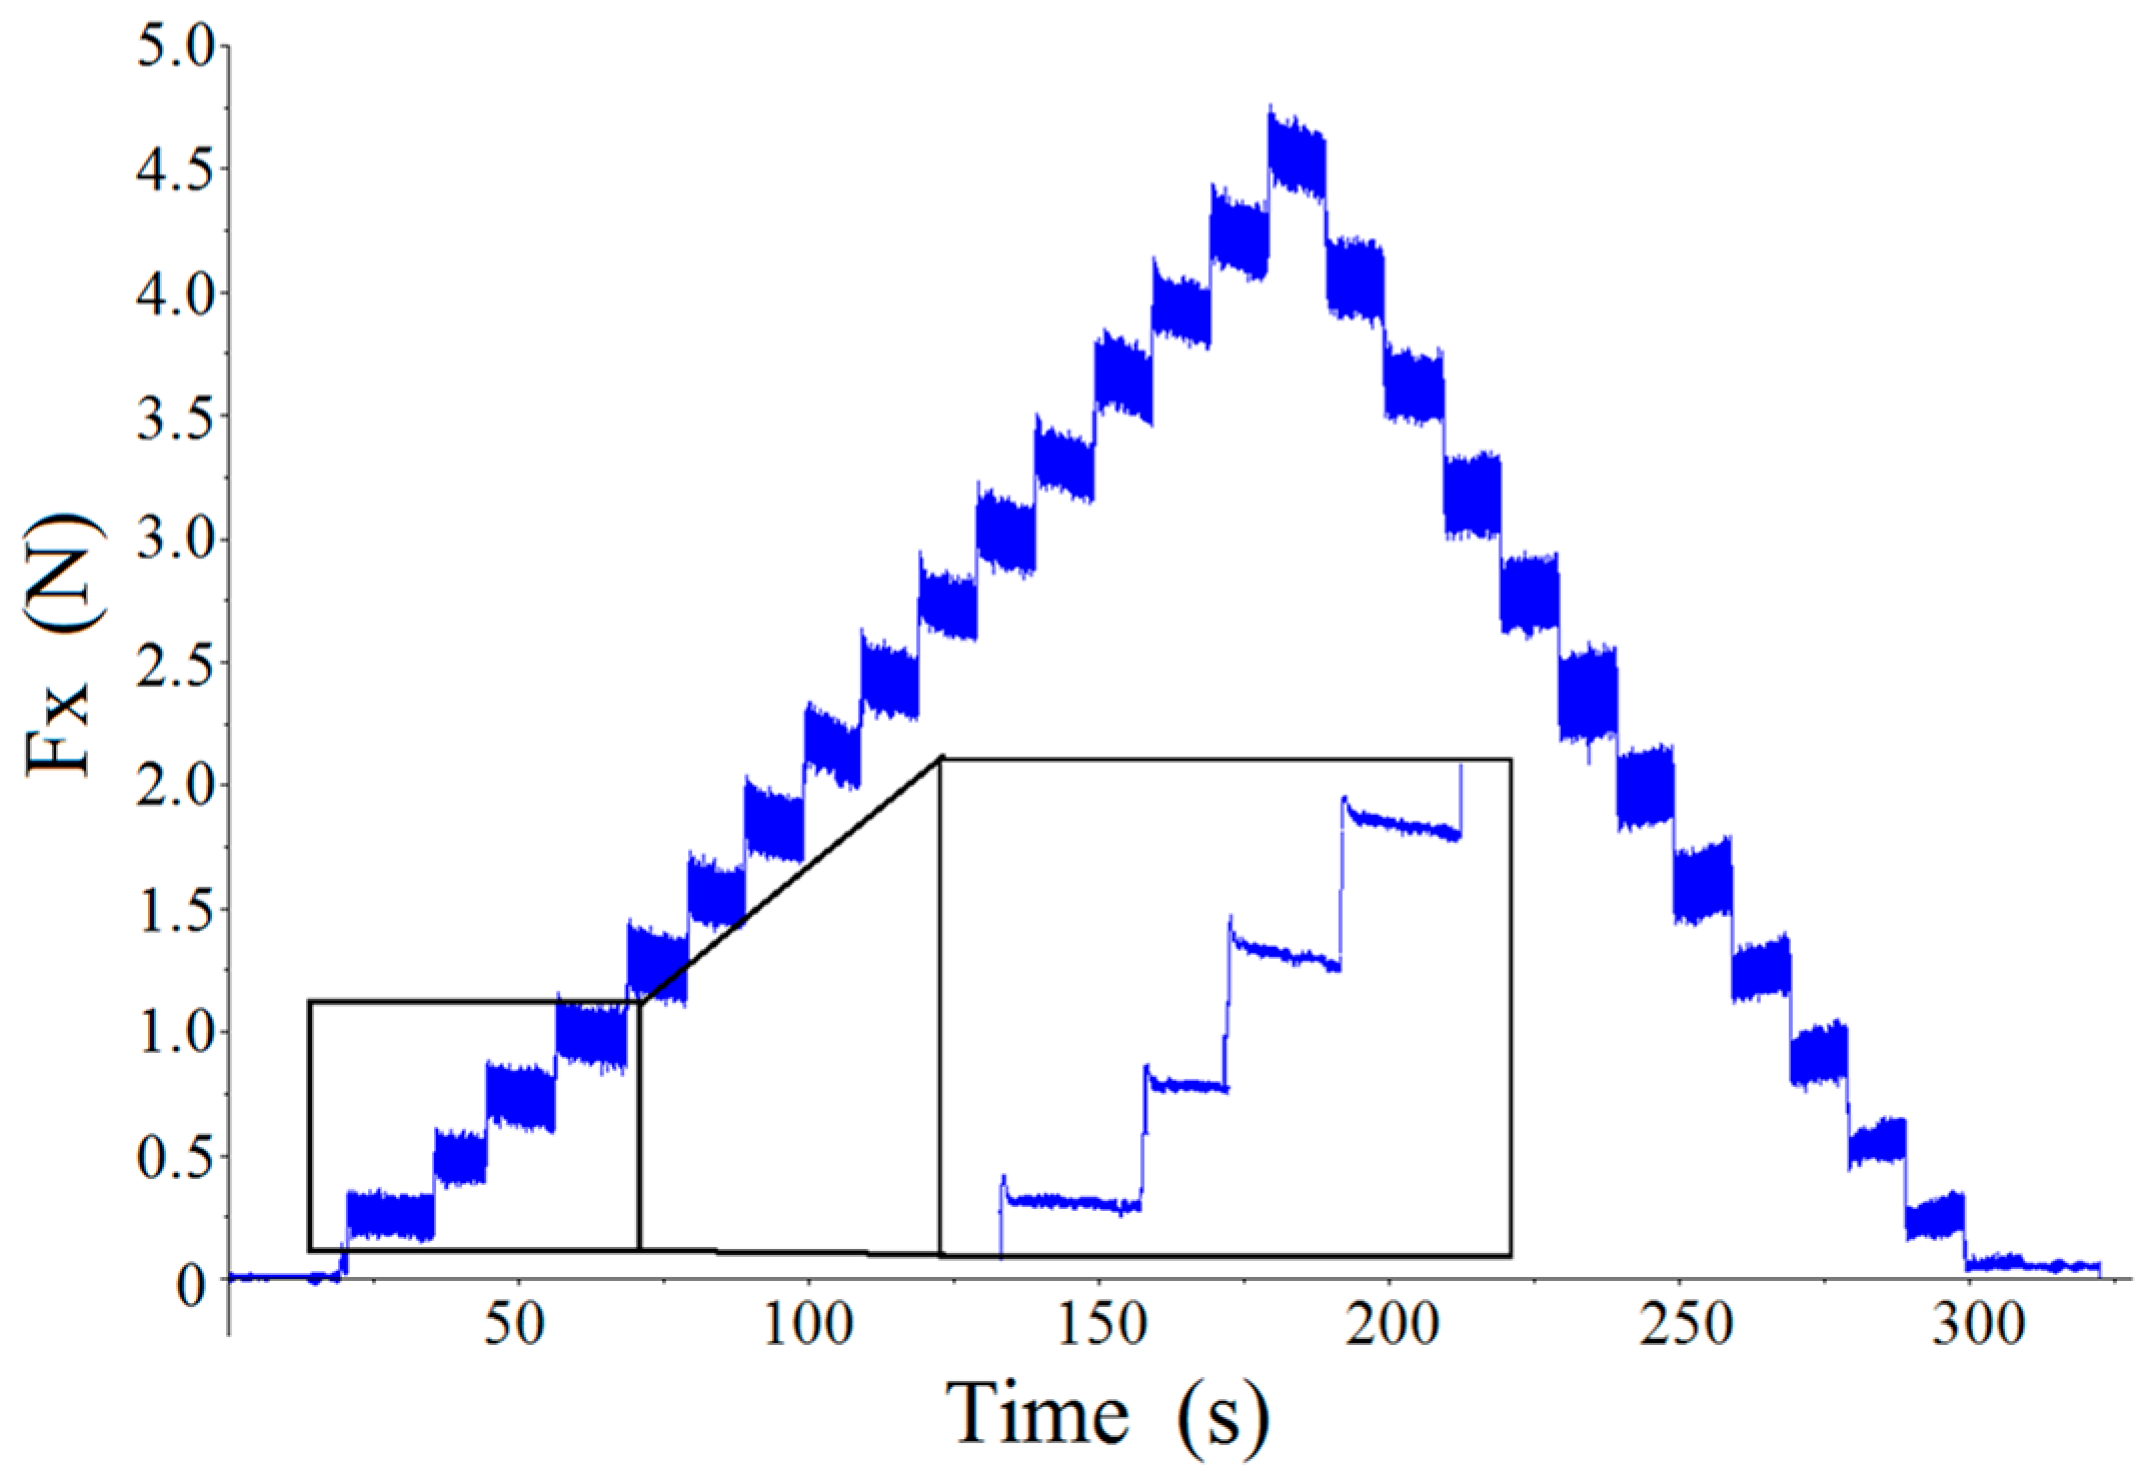
Figure 5.
The slope of the force decline during each dwell period of the loading stage corresponding to a series of indentation depths for (a) A-plane and (b) C-plane sapphire (indentation depth 8 μm, dwell period 10 s).
Figure 5.
The slope of the force decline during each dwell period of the loading stage corresponding to a series of indentation depths for (a) A-plane and (b) C-plane sapphire (indentation depth 8 μm, dwell period 10 s).
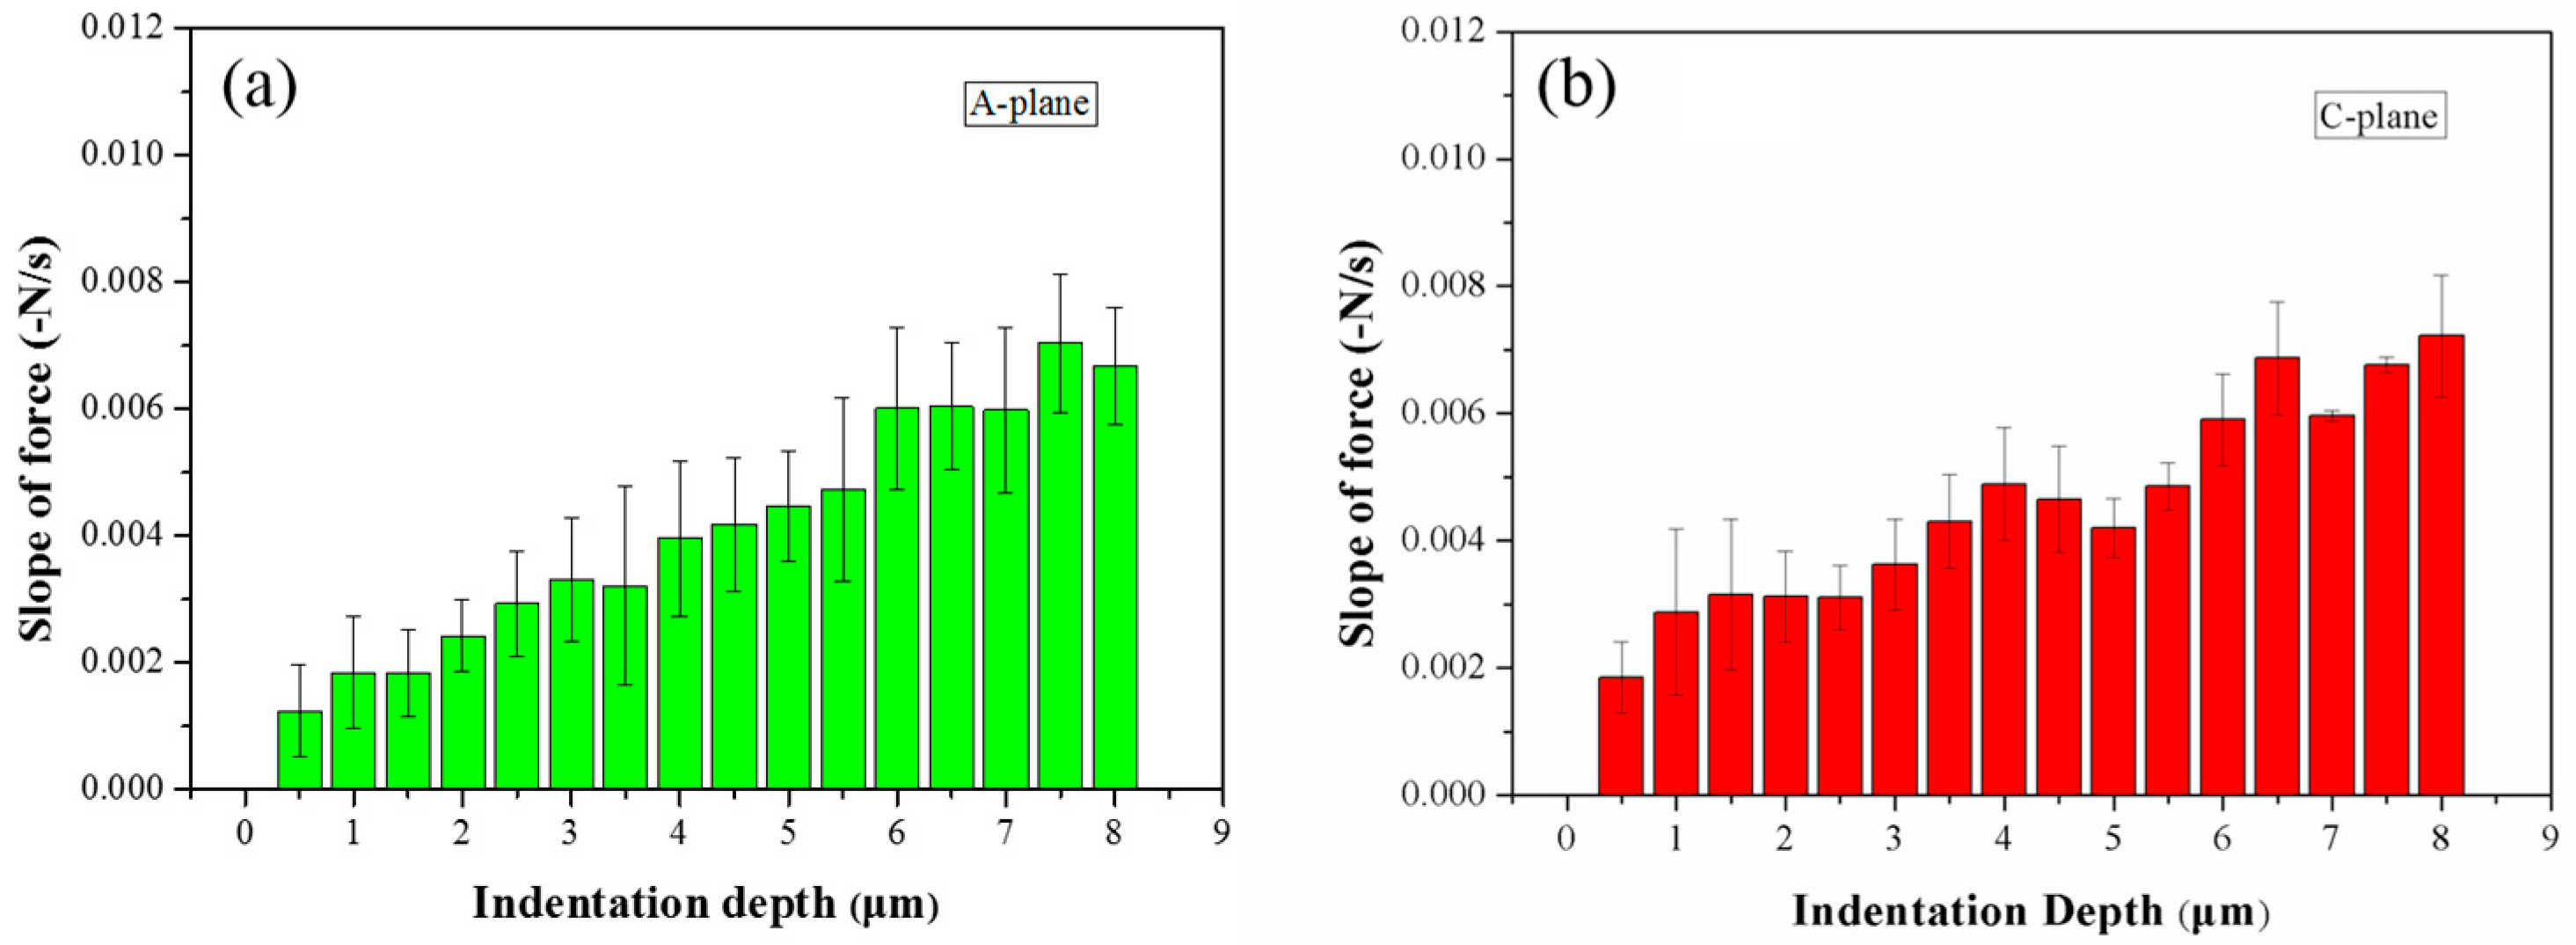
Figure 6.
Loading-unloading curves of (a) A-plane (b) C-plane sapphire.

Figure 7.
SEM images of A-plane sapphire for (a) 2 μm, (b) 4 μm, (c) 6 μm, and (d) 8 μm depth indentations, and (e) the enlarged detail of the selected region in (d).
Figure 7.
SEM images of A-plane sapphire for (a) 2 μm, (b) 4 μm, (c) 6 μm, and (d) 8 μm depth indentations, and (e) the enlarged detail of the selected region in (d).

Figure 8.
SEM images of C-plane sapphire for (a) 2 μm, (b) 4 μm, (c) 6 μm, and (d) 8 μm depth indentations, and (e) the enlarged detail of the selected region in (d).
Figure 8.
SEM images of C-plane sapphire for (a) 2 μm, (b) 4 μm, (c) 6 μm, and (d) 8 μm depth indentations, and (e) the enlarged detail of the selected region in (d).
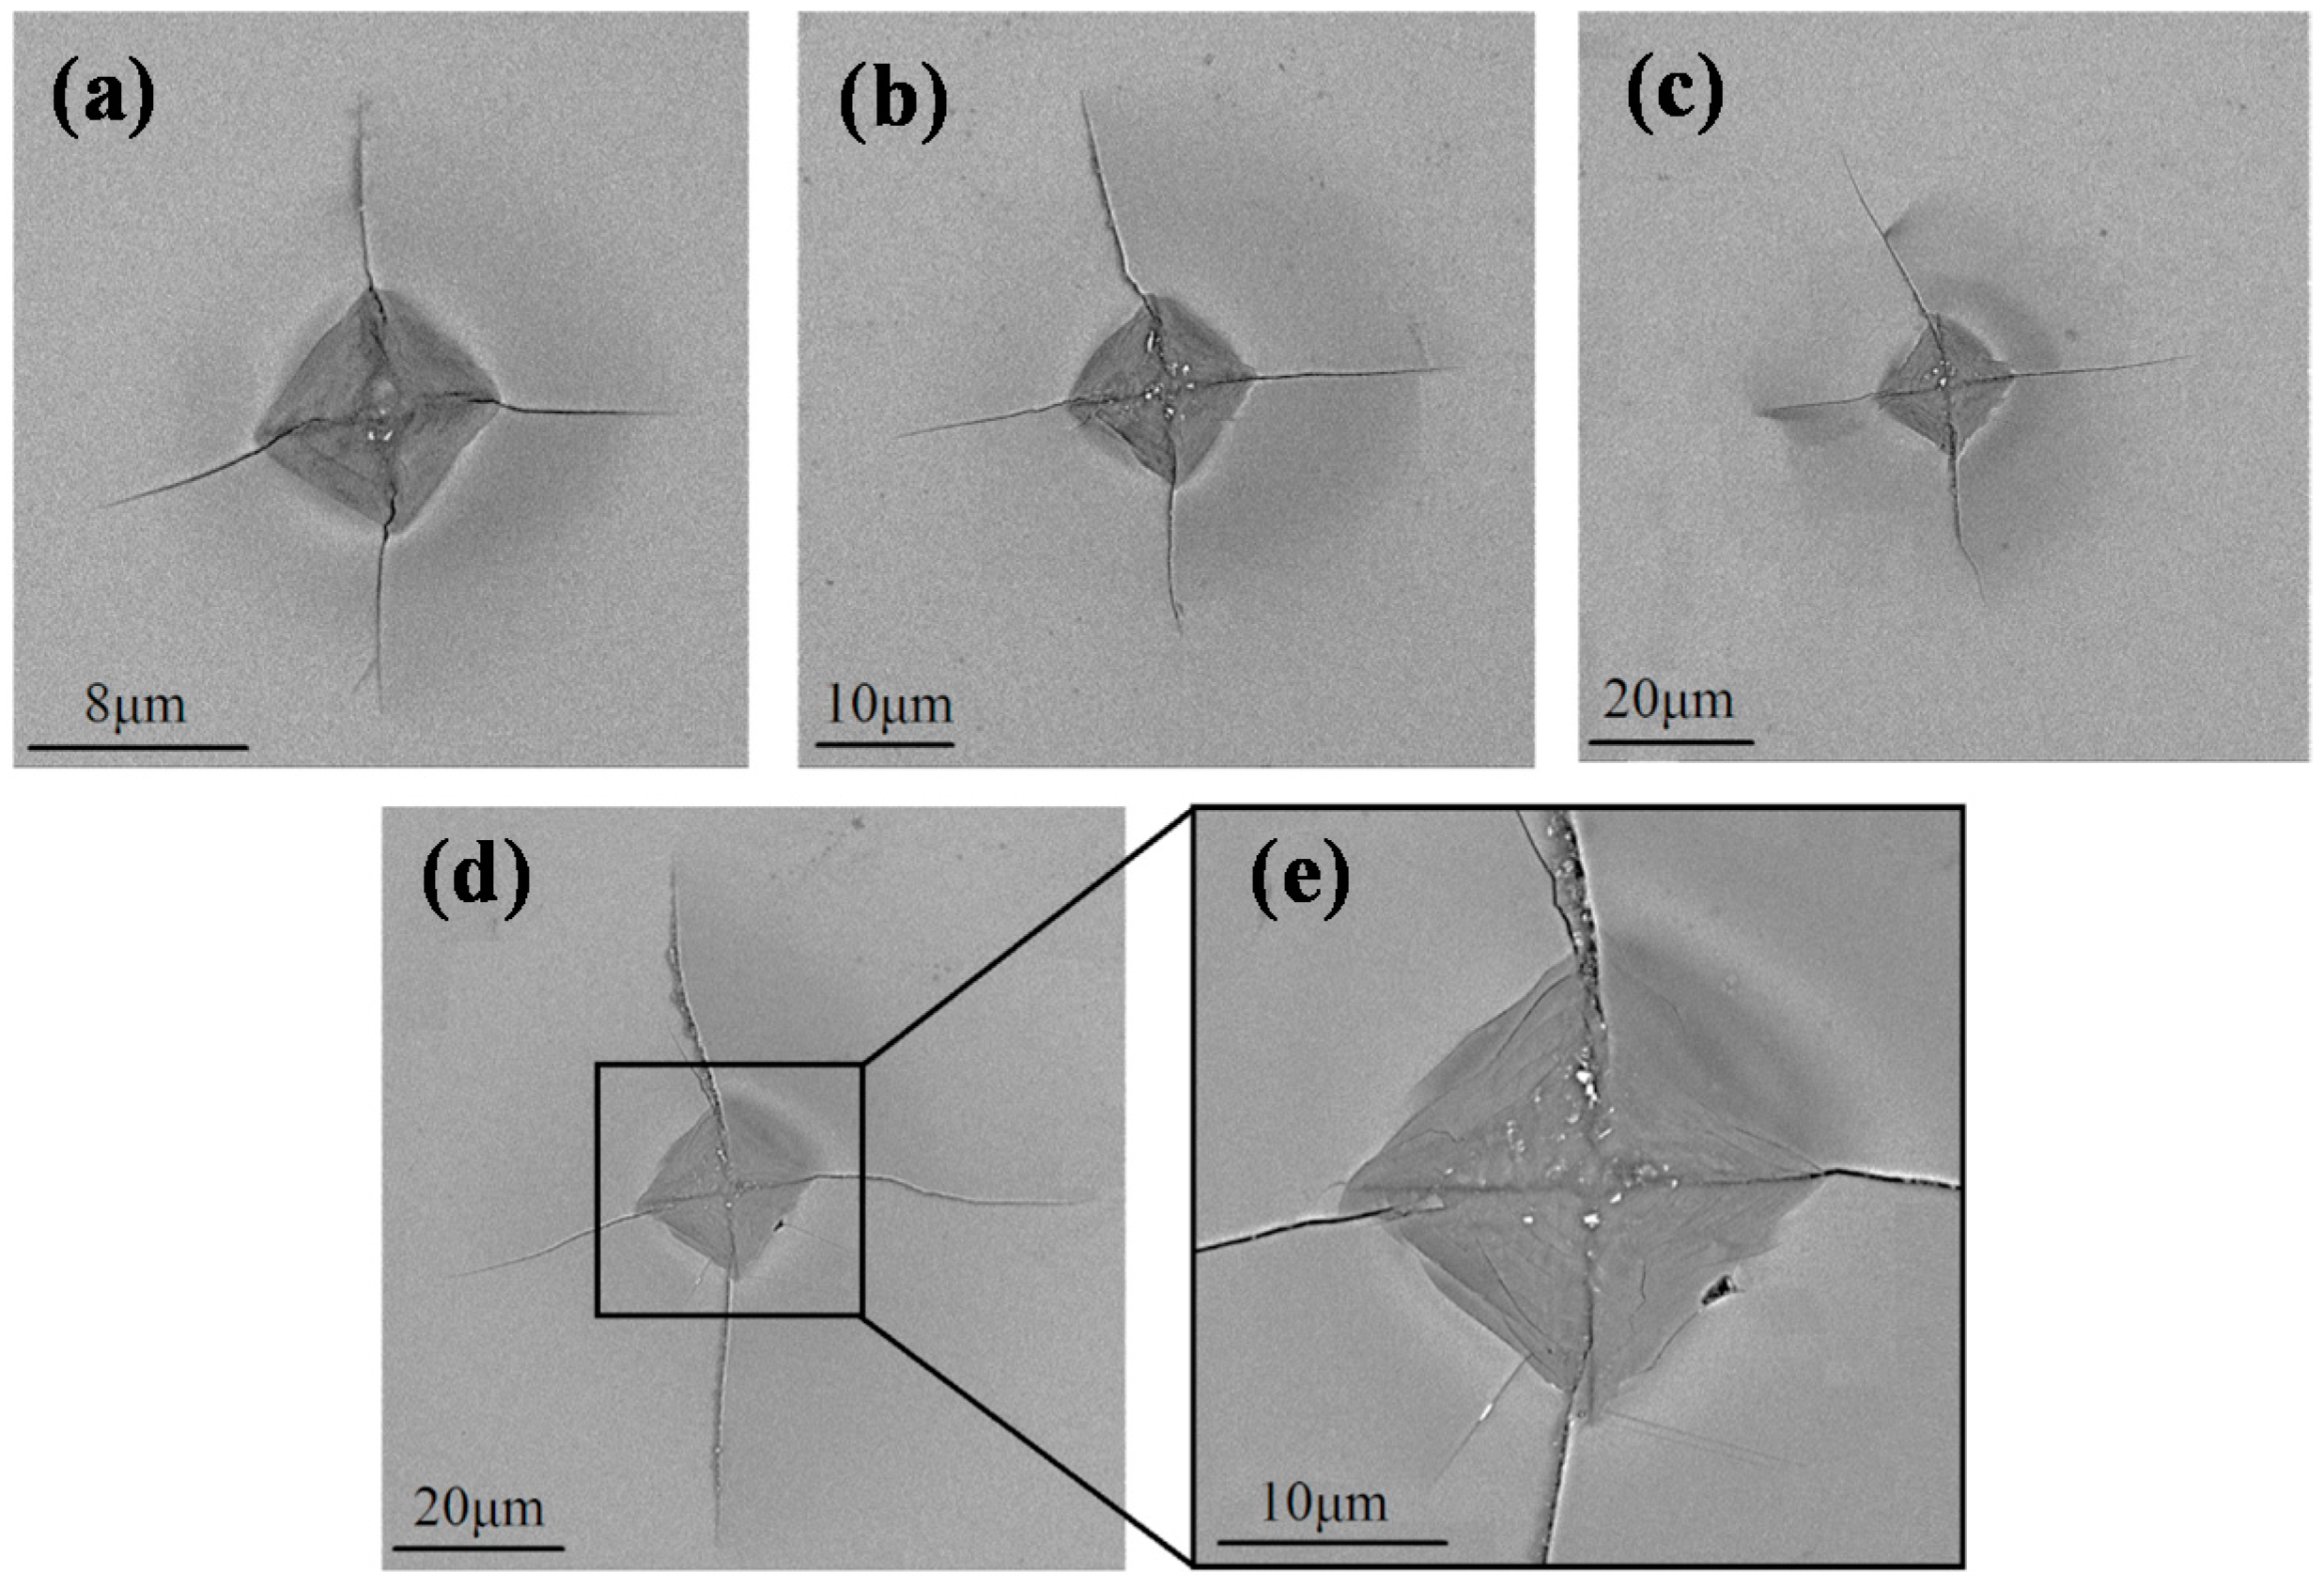
Figure 9.
Schematic of the crystal axes and the relevant preferential crack systems of A-plane sapphire.
Figure 9.
Schematic of the crystal axes and the relevant preferential crack systems of A-plane sapphire.
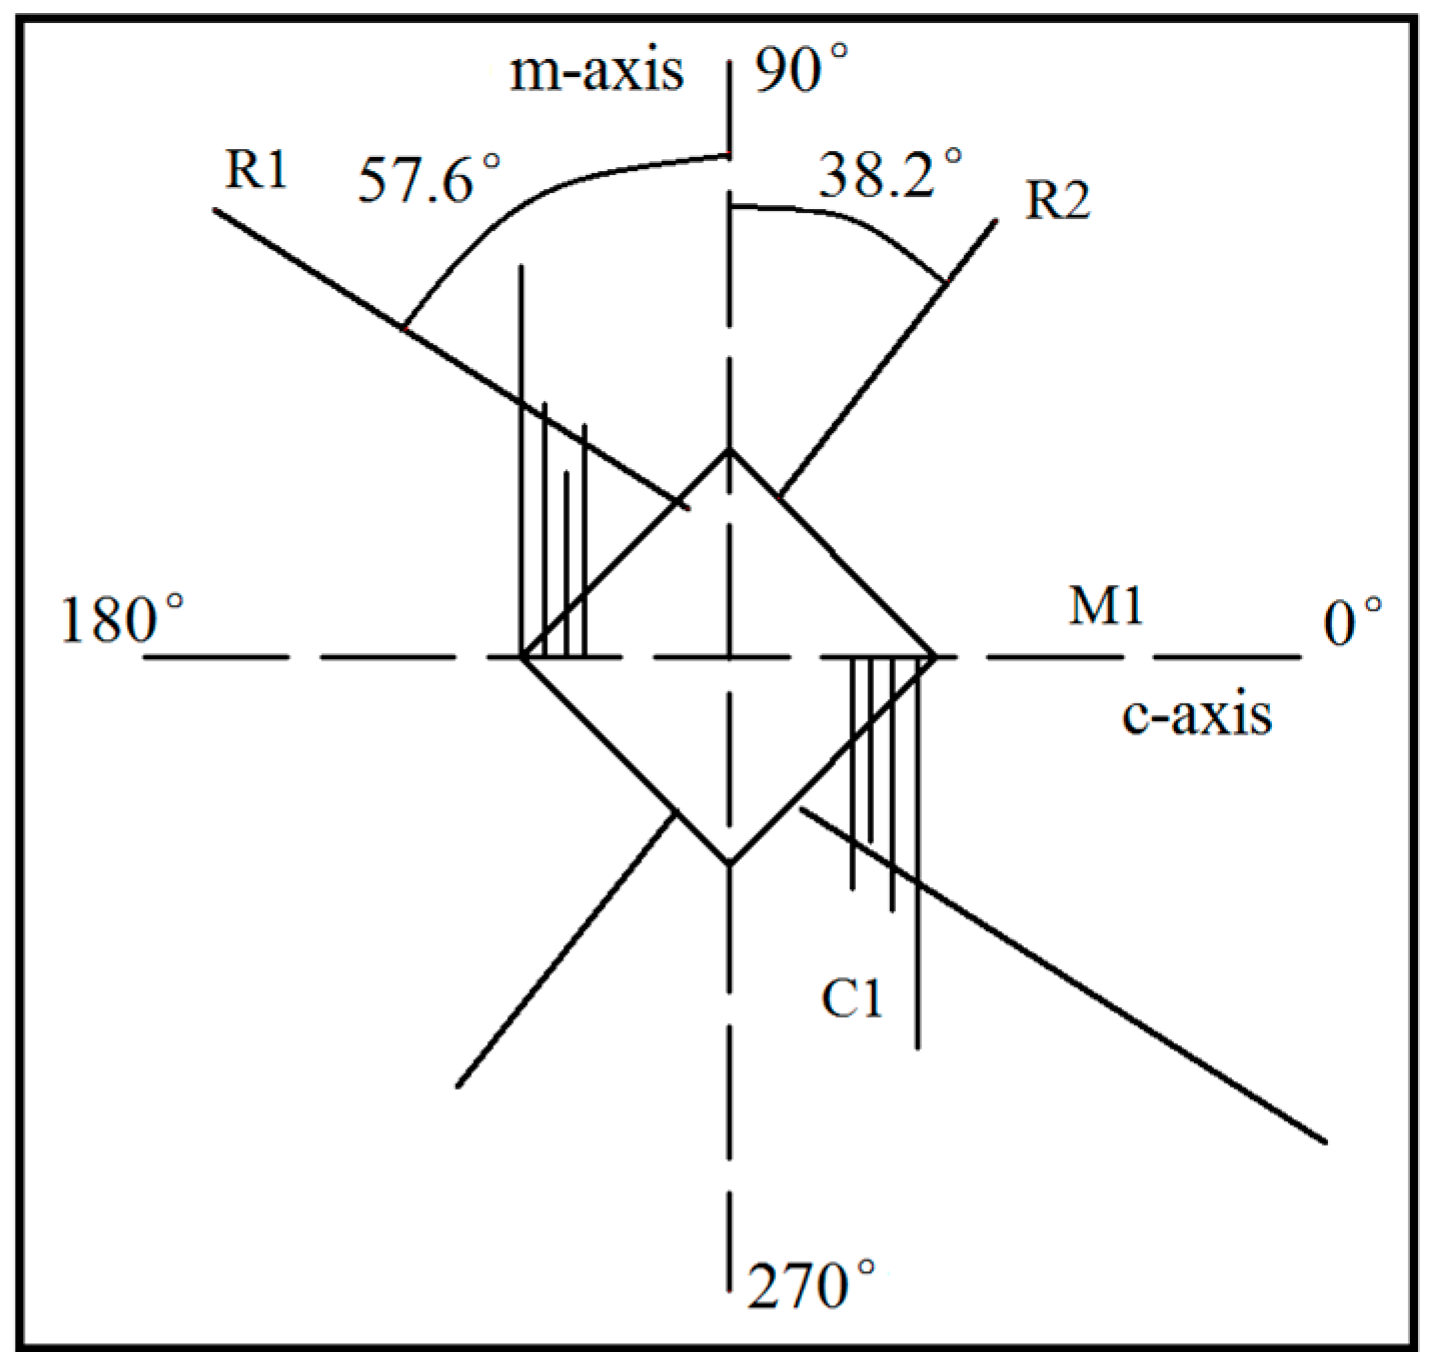
Figure 10.
The fracture toughness (KIC) of C-plane sapphire and A-plane sapphire for different crack directions R1, R2, M1, and C1.
Figure 10.
The fracture toughness (KIC) of C-plane sapphire and A-plane sapphire for different crack directions R1, R2, M1, and C1.
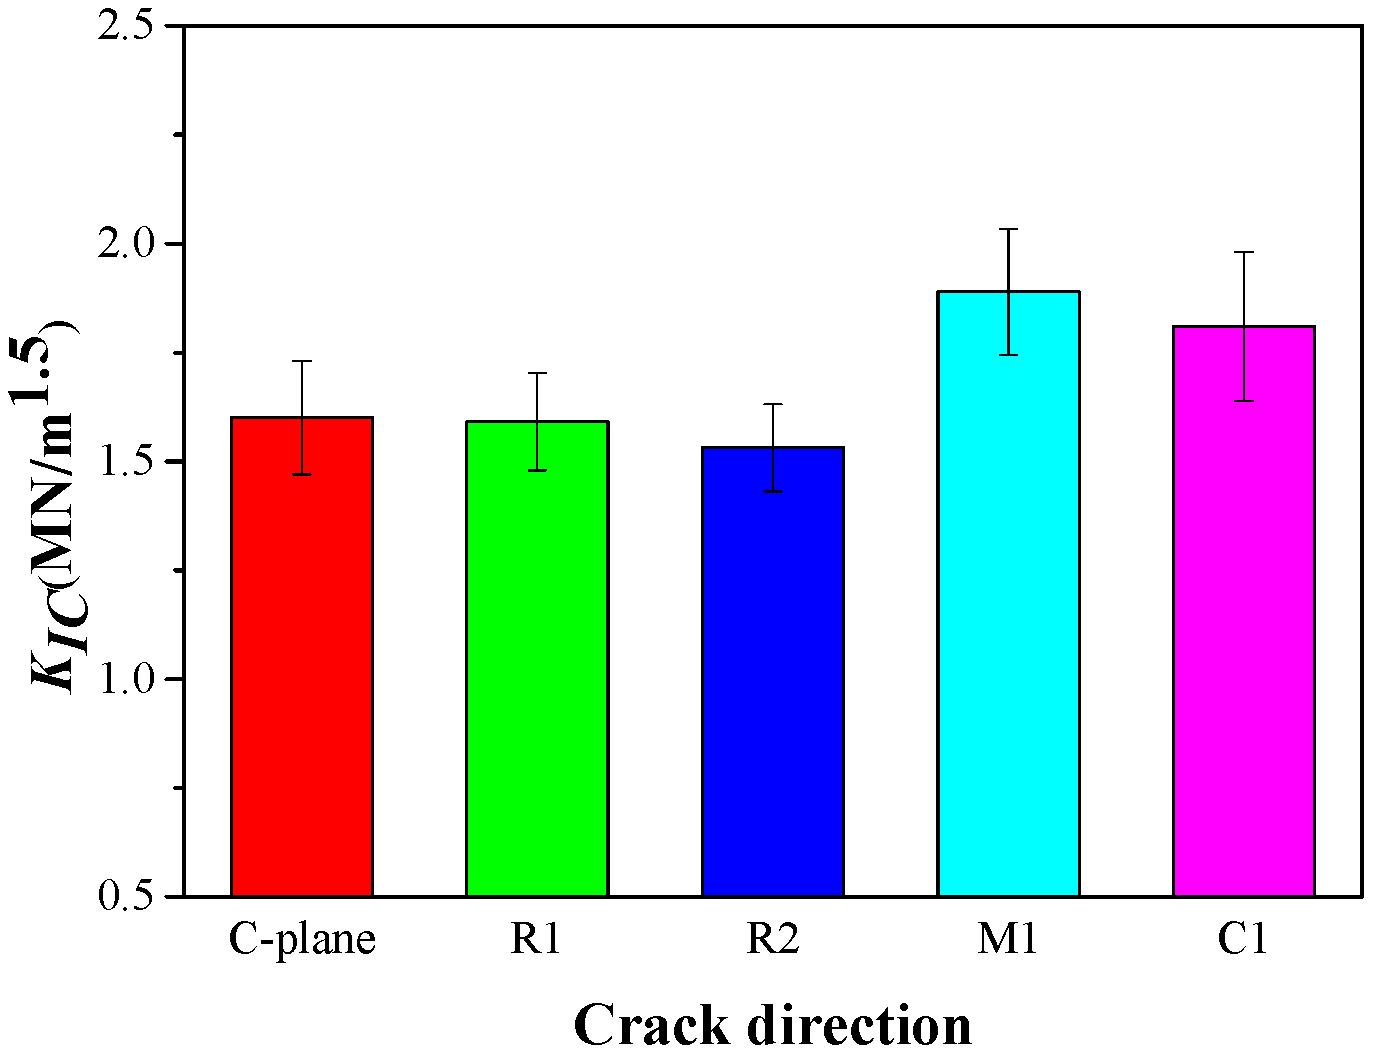
Figure 11.
3D morphology of A-plane and C-plane sapphire tested by sequential indentation after unloading measured by three-dimensional (3D) profile.
Figure 11.
3D morphology of A-plane and C-plane sapphire tested by sequential indentation after unloading measured by three-dimensional (3D) profile.

Figure 12.
Residual depths of A-plane and C-plane sapphire tested by sequential indentation.

Figure 13.
TEM cross-sectional image containing two indentations, (a) in the A-plane (110) imaged down (100), and (b) in the C-plane (0001) imaged down (110).
Figure 13.
TEM cross-sectional image containing two indentations, (a) in the A-plane (110) imaged down (100), and (b) in the C-plane (0001) imaged down (110).


Table 1.
Specifications of sequential loading-unloading indentation tests.
| Conditions | Value |
|---|---|
| Indentation load range | 0–10 N |
| Infeed depth interval | 0.5 μm |
| Dwell period | 10 s |
| Maximum Depths of Indentation | 2 μm, 4 μm, 6 μm and 8 μm |
Table 2.
Parameters of the 3D morphology measurements.
| Conditions | Value |
|---|---|
| Objective | ×50 |
| Zoom | ×2 |
| Scan length | 5 μm |
| Number of scans in average | 5 |
© 2017 by the authors. Licensee MDPI, Basel, Switzerland. This article is an open access article distributed under the terms and conditions of the Creative Commons Attribution (CC BY) license (http://creativecommons.org/licenses/by/4.0/).
Share and Cite
MDPI and ACS Style
Wang, N.; Jiang, F.; Xu, X.; Lu, X. Effects of Crystal Orientation on the Crack Propagation of Sapphire by Sequential Indentation Testing. Crystals 2018, 8, 3. https://doi.org/10.3390/cryst8010003
AMA Style
Wang N, Jiang F, Xu X, Lu X. Effects of Crystal Orientation on the Crack Propagation of Sapphire by Sequential Indentation Testing. Crystals. 2018; 8(1):3. https://doi.org/10.3390/cryst8010003
Chicago/Turabian StyleWang, Ningchang, Feng Jiang, Xipeng Xu, and Xizhao Lu. 2018. "Effects of Crystal Orientation on the Crack Propagation of Sapphire by Sequential Indentation Testing" Crystals 8, no. 1: 3. https://doi.org/10.3390/cryst8010003
Note that from the first issue of 2016, this journal uses article numbers instead of page numbers. See further details here.