Controllable Molecular Packing Motif and Overlap Type in Organic Nanomaterials for Advanced Optical Properties
by
Taoyu Zou
1,2, 
Xiaoyan Wang
1,
Haidong Ju
3,
Li Zhao
3,
Tingting Guo
1,
Wei Wu
4,* and
Hai Wang
1,2,* 1
Key Laboratory of Yunnan Provincial Higher Education Institutions for Organic Optoelectronic Materials and Devices, Kunming University, Kunming 650214, China
2
Kunming DeepLand Nanomaterial Research Institute, Yunnan Ocean Organic Optoelectronic Technology Ltd., Kunming 650106, China
3
Department of Chemistry, Kunming University, Kunming 650214, China
4
Department of Physics and Astronomy and London Centre for Nanotechnology, University College London, Gower Street, London WC1E 6BT, UK
*
Authors to whom correspondence should be addressed.
Crystals 2018, 8(1), 22; https://doi.org/10.3390/cryst8010022
Submission received: 3 November 2017
/
Revised: 1 January 2018
/
Accepted: 4 January 2018
/
Published: 11 January 2018
(This article belongs to the Special Issue Advance in Crystalline Thin Wires)
Abstract
:The optical properties of organic materials are very sensitive to subtle structural modification, and a proper understanding of the structure-property relationship is essential to improve the performance of organic electronic devices. The phase transitions of the η-CuPc to the α-CuPc, then to the β-CuPc were investigated using In situ X-ray diffraction and the differential scanning calorimetry (DSC). The five stages in the phase-transition process from low to high-temperature were observed, which consisted of (1) the η-CuPc; (2) a mixture of the η- and α-CuPc; (3) a mixture of the η-, α- and β-CuPc; (4) a mixture of the α- and β-CuPc; and (5) the β-CuPc. The vibrational and optical properties at different phase-transition stages were correlated to molecular packing motif and molecule overlap type through systematic analyses of the Fourier–transform infrared, Raman and UV-VIS spectra. Moreover, the mechanism for the morphology evolution was also discussed in detail.
1. Introduction
Organic nanomaterials have been widely used in the fabrication of electronic devices over the last few decades, such as organic field-effect transistors (OFET) [1], organic photovoltaics (OPV) [2] and sensors [3]. These extensive application prospects require a proper understanding of the effect of fundamental aspects in crystal structure, such as molecular packing motifs and molecular orbital overlap, on the performance of organic electronic devices. For planar small molecules, such as copper-phthalocyanine (CuPc), molecular packing motifs, typically herringbone and parallel (lamellar) packings, will significantly influence the inter-molecular overlaps and transfer integrals and, thus, the optical and electrical properties, which determine the performance characteristics of organic electronic devices [4,5]. For example, although both rubrene and pentacene have herringbone packing motifs, rubrene shows a higher carrier mobility owing to a larger co-facial π-π overlap [5,6]. The strong intermolecular vibrionic coupling is observed in the co-facial packing motif in distyrylbenzene derivatives as well, resulting in an excimer-like emission spectrum [7]. The effects of molecular packing in a series of π-conjugated organic materials on the optical properties have been discussed in the previous review [8].
It remains highly challenging to achieve desired functionality by controlling molecular packing motifs and molecular orbital overlap in organic materials [9,10]. Bredas et al. have studied the relationship between structures and transport properties from a few aspects, including inter-molecular separations, lateral displacements and chain lengths [10]. Bao’s group have reported a solution-processing technique, by which they obtained the shortest π-π stacking distance in organic semiconductors with a large orbital overlap, thus leading to increased charge carrier mobility [9]. The relative position of adjacent molecules is another important aspect in affecting the optical and electronic properties.
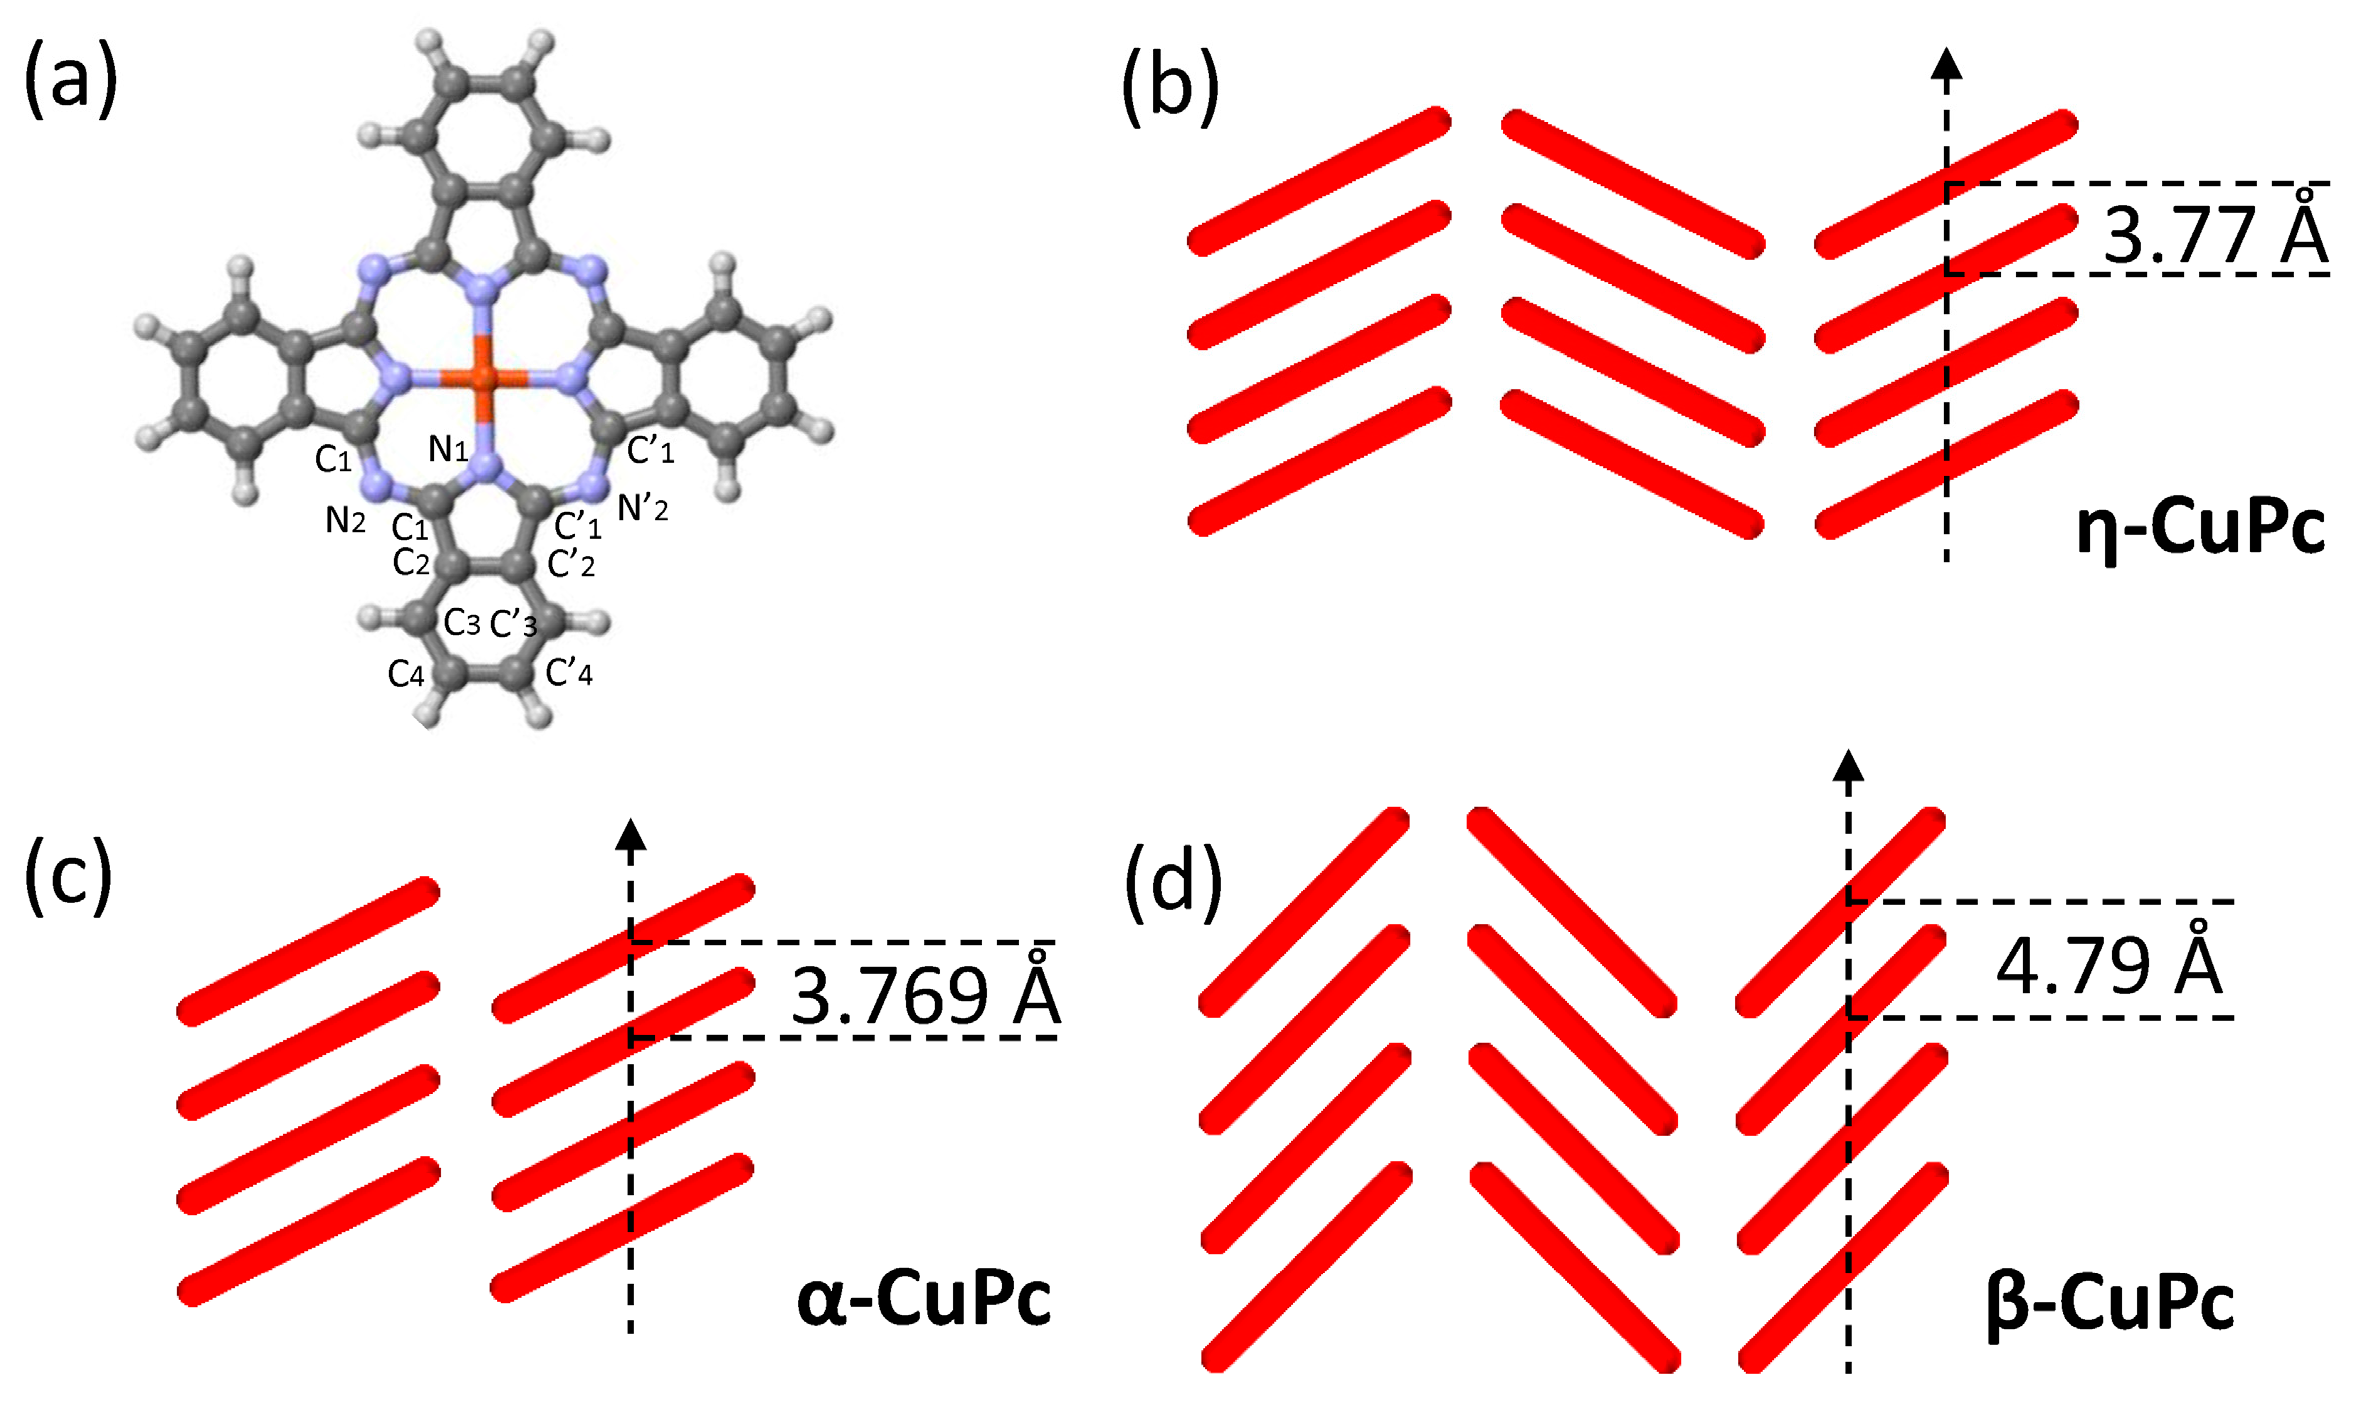
As one of the most well studied organic semiconducting materials, the planar small molecule, copper-phthalocyanine (CuPc), is an ideal platform for fundamental studies, not only due to its chemical and thermal stability, but also numerous polymorphs, which can be achieved by self-assembly into nanostructures. By carefully analyzing the parameters of different crystal structures of CuPc, as shown in Figure 1, we noticed that the η- and the α-CuPc show different packing motifs while sharing similar nearest-neighboring molecular displacement distances (Cu-Cu distance ~3.77 Å) within a chain [11]. In contrast, both the η- and the β-CuPc have a herringbone motif, but have different molecule displacement distances. These crystal-structure features make them suitable for the comparison study on the structure-property relationship. Although the studies of the α- and the β-CuPc phases have been reported in a large body of work, a systematic demonstration of the transitions from the η- to α-, then to β-CuPc, is scarce. In addition, we have explored the mechanism of crystal-structure phase transition, including the molecular packing motif transition and the change of molecule overlap type, and their impact on the morphological, optical, and electronic properties of these systems.
In this work, the transitions of the crystal structure of CuPc were investigated via in situ X-ray diffraction (XRD). As-prepared η-CuPc nanowires were annealed at a range of temperatures, and then measured by XRD and differential scanning calorimetry (DSC). The structure-property relationship was studied by Fourier-transformed infrared (FTIR), Raman and ultraviolet-visible (UV-VIS) spectroscopy.
2. Experimental and Computational Section
CuPc powders were purchased from Tokyo Chemical Industry Co., Ltd. (Tokyo, Japan) and used without further purification. They were then loaded in a quartz tube in a single-zone heating furnace. Before heating the powders, N2 gas (99.999%) was used to flush out ambient air at a rate of 400 standard cubic centimeters per minute (sccm) for 30 min. Then, the powders were heated at a precursor temperature of 450 °C for 300 min at a flow rate of 400 sccm and the η-CuPc nanowires were deposited at the room-temperature area. The as-prepared η-CuPc nanowires were annealed using a single-zone heating furnace under vacuum condition (~1 Pa) at a series of temperatures, 100 °C, 150 °C, 200 °C, 240 °C, 250 °C, 260 °C, 270 °C, 280 °C, 290 °C, 300 °C and 350 °C.
The in situ XRD patterns were collected with PANalytic EMPYREAN diffractometer (PANalytical, Almelo, The Netherlands) using Cu Kα (λ = 0.154056 nm) at 40 mA and 40 kV and the samples were loaded into an alumina boat for measurement. The morphology of CuPc crystals was observed using a scanning electron microscope (SEM, S-3400N, Hitachi, Tokyo, Japan). The FTIR spectra were obtained using a Cary 600 Series spectrophotometer (Agilent Technologies, California, USA) and the samples were prepared by the KBr pellet method. The Raman spectroscopy was carried out using an inVia Raman Microscope (Renishaw, Wotton under Edge, UK) with samples attached on the glass substrate. The UV-VIS optical absorption spectra of CuPc crystals with/without annealing were measured using a Hitachi U-4100 UV-VIS spectrometer (Hitachi, Tokyo, Japan) after slightly milling the sample on the quartz substrate. TGA and DSC measurements were performed on a METTLER TOLEDO STARe System (Mettler Toledo, Greifensee, Switzerland). As-prepared sample were placed in the vacuum drying oven at 50 °C for 12 h before measurements to remove the absorbed water on the surface. Approximately 4.65 mg of sample material was used for the measurement with a heating rate of 5 °C/min from room temperature to 600 °C under N2 atmosphere.
The first-principles calculations of the vibrational modes of a CuPc single molecule have been carried out based on density-functional theory (DFT), using hybrid-exchange density functional, B3LYP [12], with a 6-31G basis set, implemented in the Gaussian 09 code [13,14]. The advantages of B3LYP have been demonstrated in the previous work, including a partial elimination of self-interaction errors and a balancing between the tendencies to delocalize and localize one-electron Kohn-Sham orbitals, with an optimized mixture of exact Fock exchange energy with that from a generalized gradient approximation (GGA) exchange functional [12]. The previous calculation results based on the B3LYP functional have shown an accurate description of the electronic structure and magnetic properties for both inorganic and organic compounds [15,16,17,18,19,20].
3. Results
3.1. In Situ XRD Study on the Molecular Packing Transition
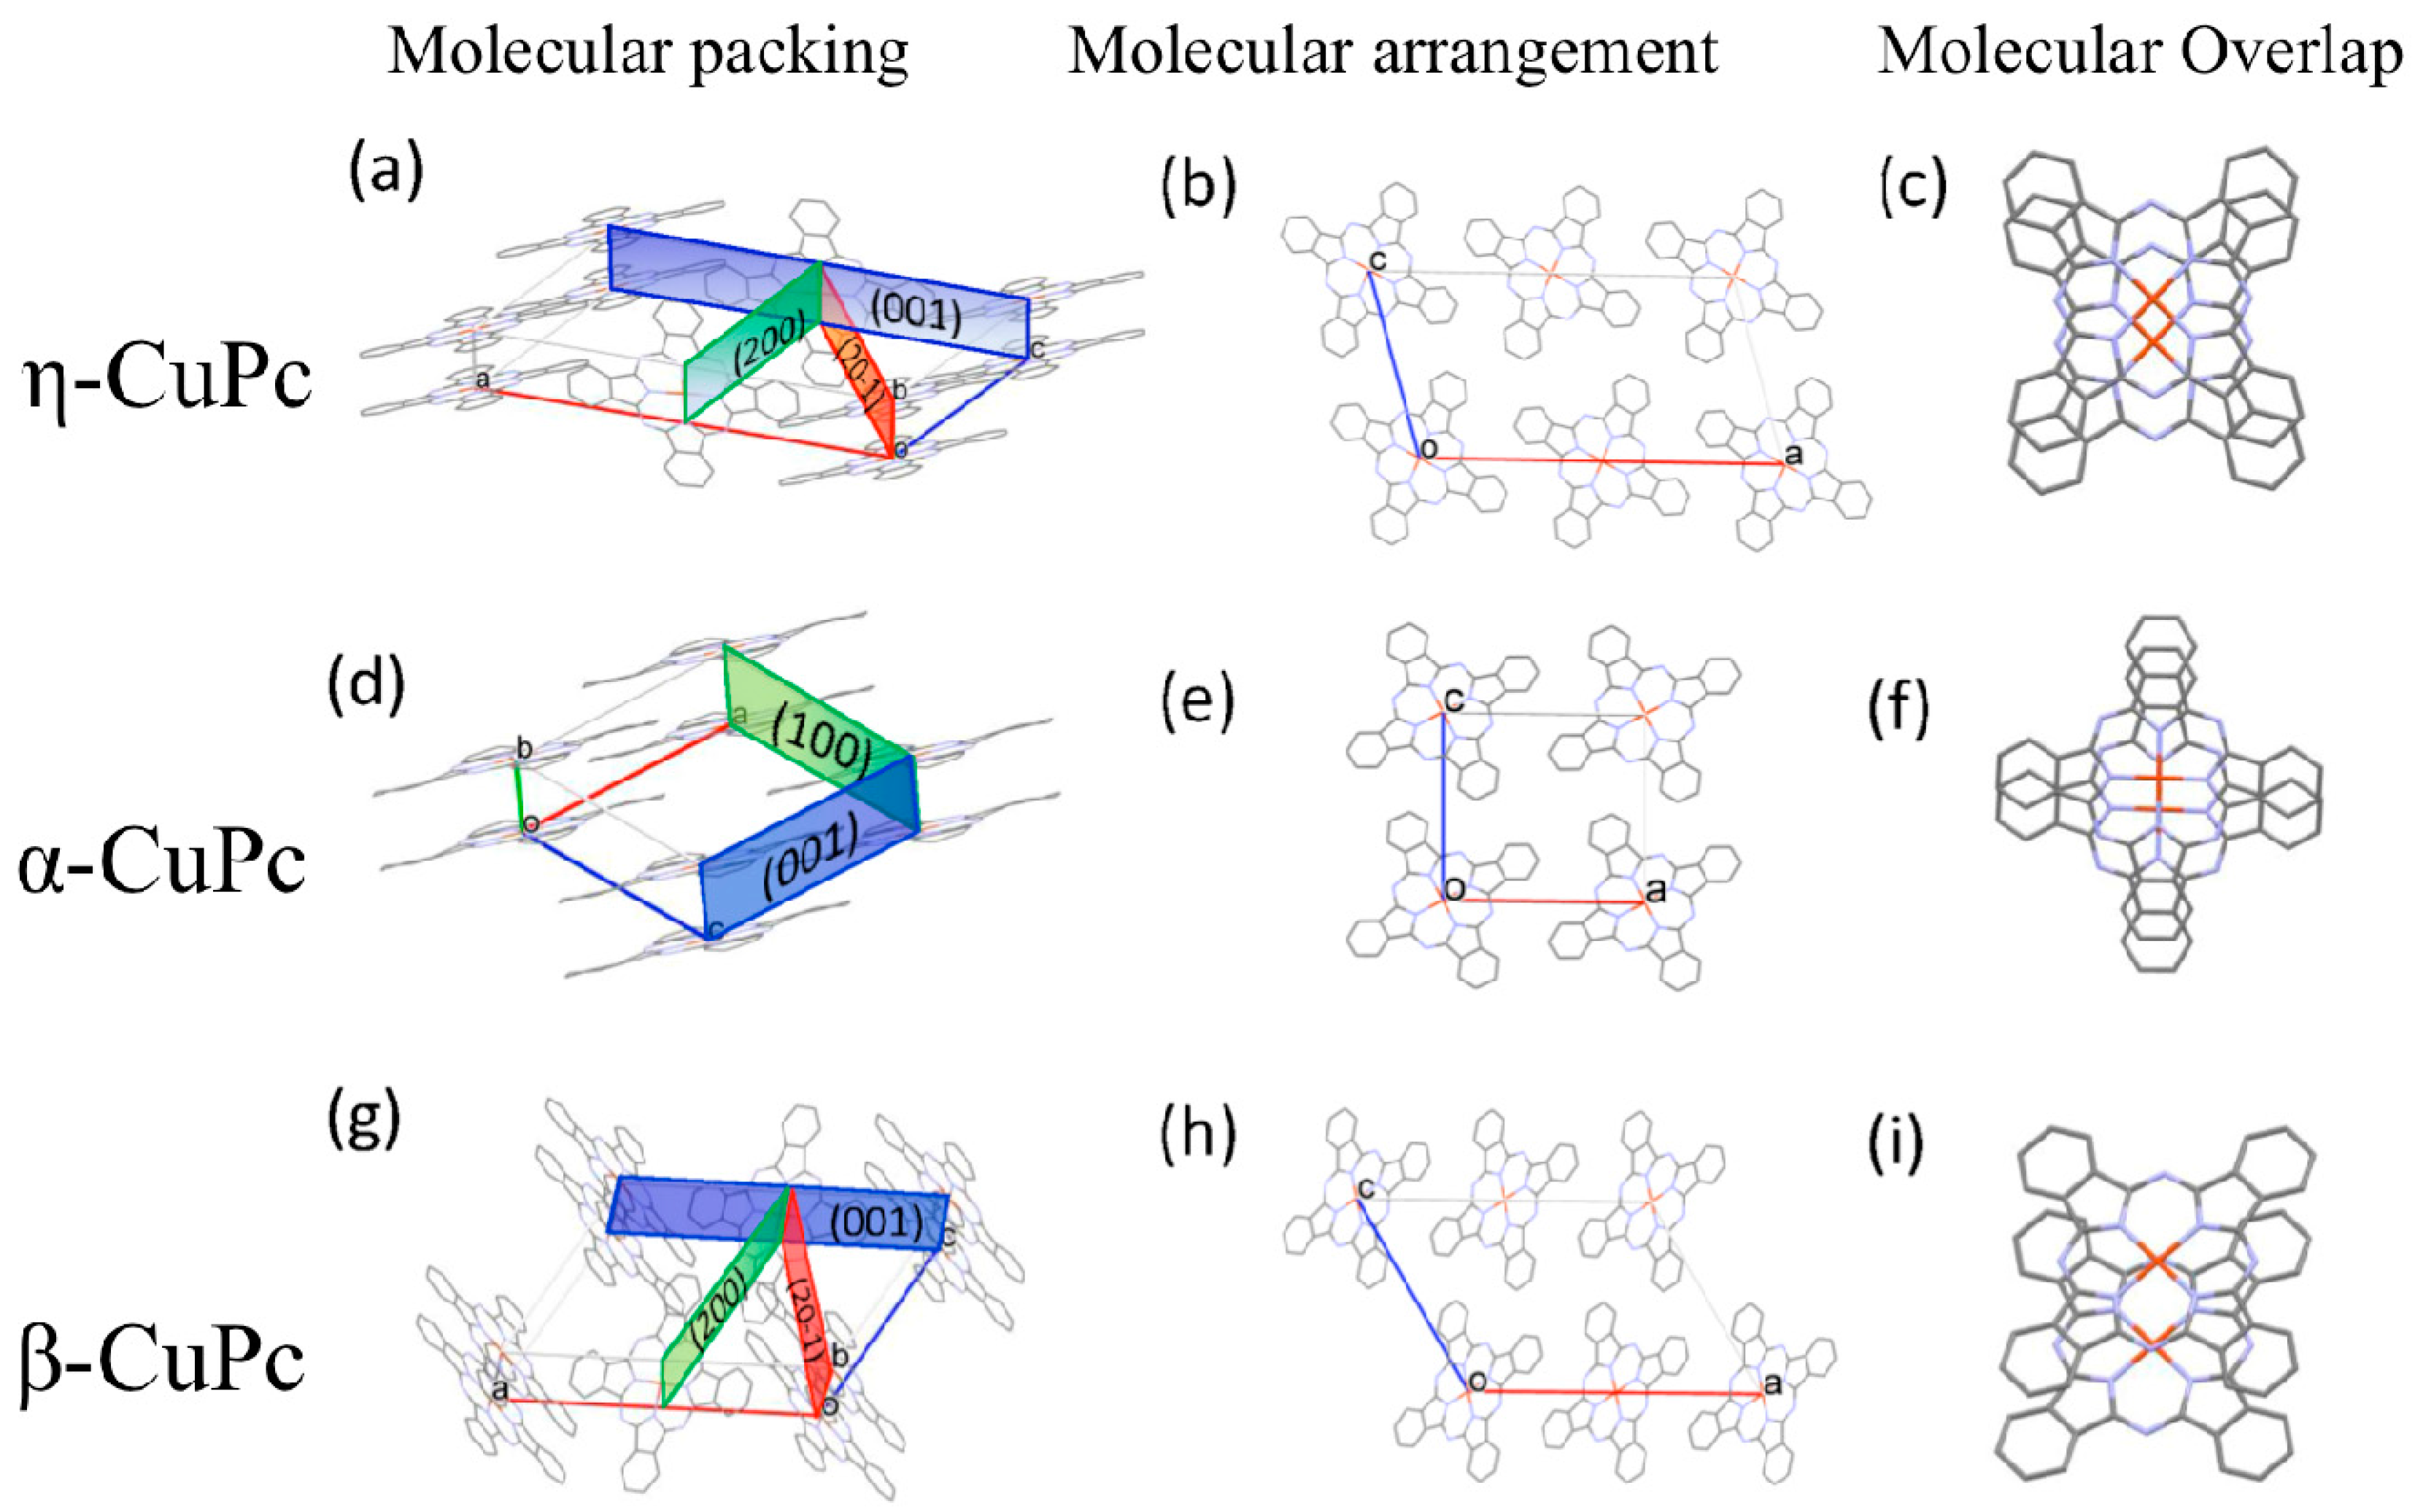
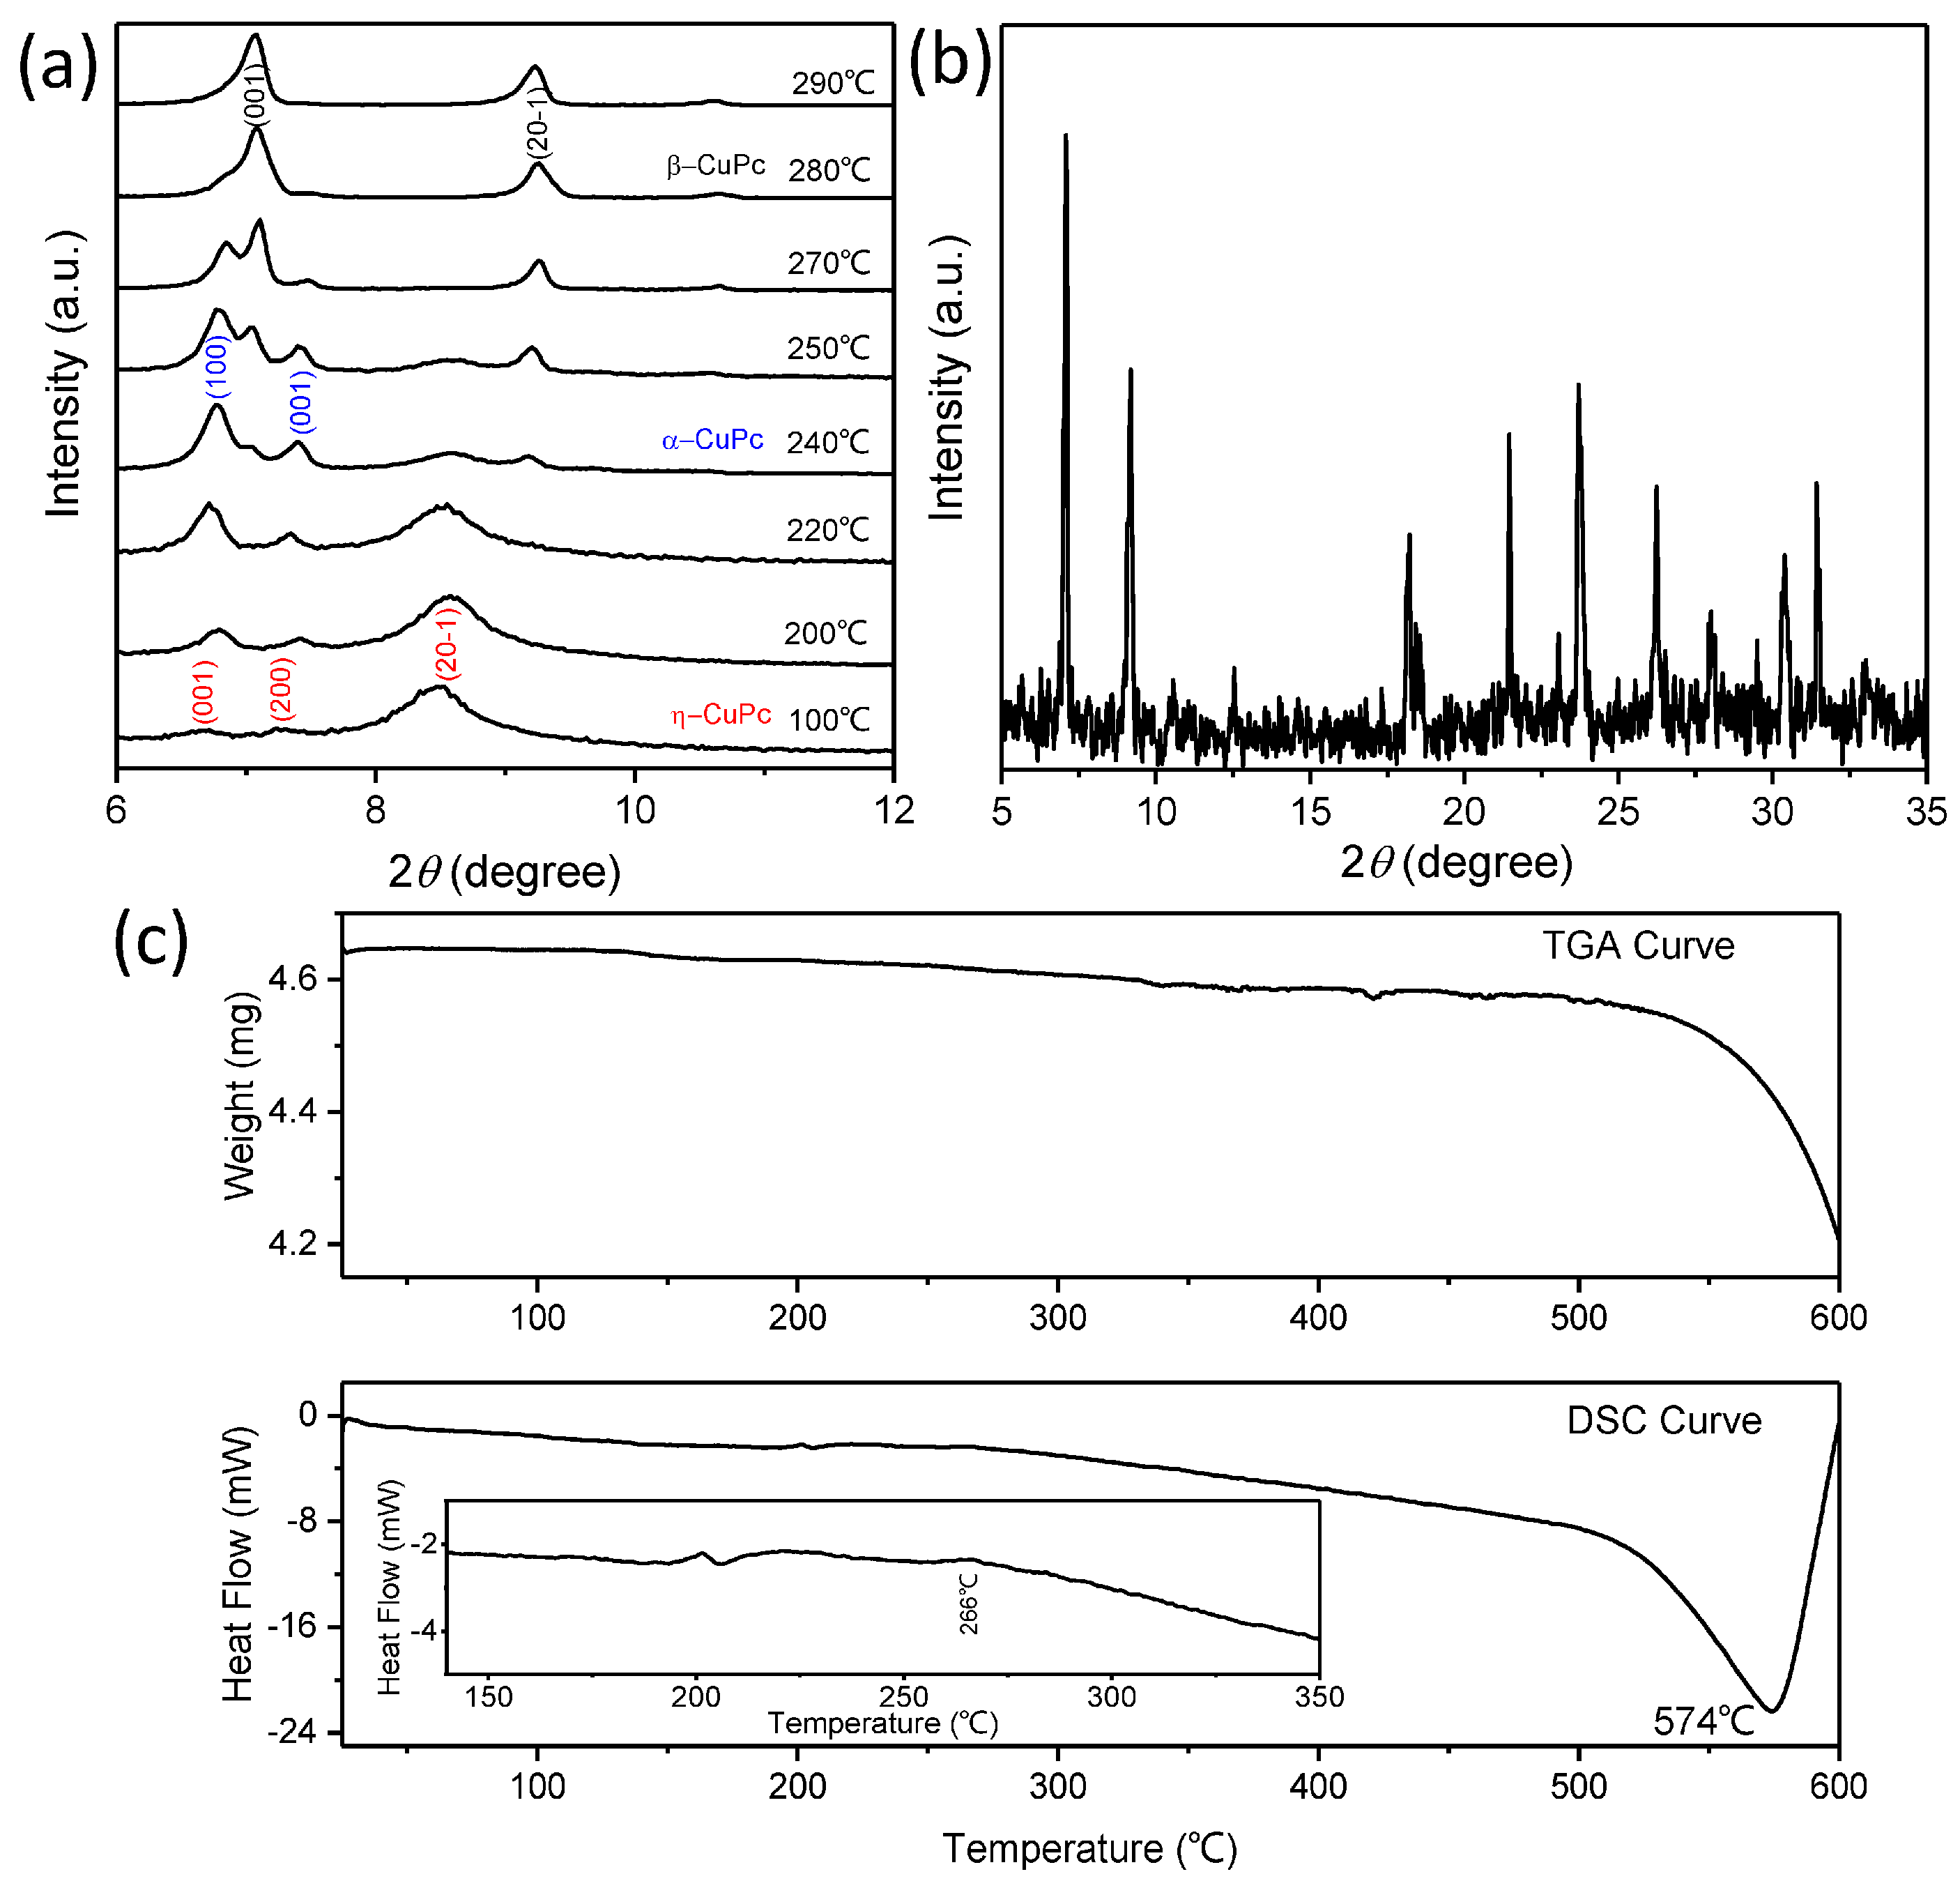
Since the crystal structure is known to have a significant impact on the performance of organic electronic devices, the identification and manipulation of molecular packing motifs and molecular overlap type are important for optimization of materials properties. The heating process of the sample during the In-situ XRD measurement was presented in Figure 2a. As shown in Figure 2b, in situ XRD patterns reveal the phase transitions among the η-, α-, and β-phases. For the as-prepared η-CuPc nanowires, three feature diffraction peaks at 6.76°, 7.21°, and 8.45°correspond to the lattice plane distances of 13.06 Å (d(001)), 12.25 Å (d(200)) and 10.46 Å (d(20-1)), respectively. At the temperature of 200 °C, the η-CuPc (with herringbone-packing motif) starts to change to the α-CuPc (with parallel-packing motif). By qualitatively analyzing the peak intensities as a function of the heating temperatures ranging from 200 °C to 230 °C, we can explain the transition process from the η- to the α-CuPc in the following two steps. First, the diffraction peak intensities at the peaks of 6.76° and 7.21° increased, while the intensity at 8.45° did not show any change, implying the major crystal-structure change happened in the (100) and (200) planes, which might cause the overlapping change of neighboring molecules from (x) type to (+) type. When the temperature rose to 230 °C, the intensity of the dominant peak at 8.45°, corresponding to (20-1) plane, dramatically decreased, indicating the herringbone-type molecular packing in (200) plane change gradually to parallel packing, as shown in Figure 3a–f. From the in situ XRD patterns, the η-CuPc mainly exists when the heating temperature is below 200 °C, and the η- and α-CuPc co-exist from the temperature of 200 °C to 220 °C.
The coexistence of the three phases can be observed at the heating temperature ranging from 230 °C to 245 °C; the α-CuPc is the dominant one among the three. The disappearance of the peak at 8.45° suggests a complete transition from the η- to the α-CuPc. As the temperature rises to 245 °C, the peaks at 6.92° and 8.99° strengthen; they are related to the (001) and (20-1) planes of the β-CuPc. This indicates a transition from the α- to the β-phase. The characteristic peak of the β-CuPc moves to 6.92°, corresponding to the (001) plane; the overlapping type changes from ‘+’ type to ‘x’ type.
3.2. XRD and TGA Analyses of CuPc Crystals Annealed at Different Temperature
The XRD patterns of CuPc crystals annealed at different temperatures in Figure 4a shows the crystal-structure phase transitions. When the annealing temperature is below 200 °C, the η-CuPc is the dominant phase with feature diffraction plans of (001), (200), and (20-1). As the annealing temperature is increased to 240 °C, the relatively strong intensity of the (001) reflection of the α-CuPc, along with a weaker intensity at the (20-1) reflection of the η-CuPc, indicates that, due to the molecule re-arrangement in the crystals, the molecular packing motif begins to transform from the herringbone type to the parallel type. On the other hand, the peaks of the η-CuPc at 6.76° and 7.21° are very close to those of the α-CuPc at 6.77° and 7.40°, which may be due to the similar displacement distance within one column in the η- and the α-CuPc. Additionally, the transition process from the η- to the α-CuPc can be simply considered as the molecule re-arrangement from herringbone to parallel type and molecule overlap adjustment within the molecule column from ‘x’-type to ‘+’-type, which results in the change of crystal structure. Furthermore, XRD patterns in Figure 4a illustrate the transition process from the α- to the β-CuPc. At the temperature of 250 °C, the α- and β-CuPc are the two dominant phases. Unlike the η- and the α-CuPc, the β-CuPc crystal shows totally different feature peaks at 7.031° and 9.209°, related to (001) and (20-1) diffraction planes, which implies the significant change in crystal structure. TGA and DSC measurements can also provide information about the phase-transition properties in Figure 4c. As the temperature goes up to 256 (±10) °C, an endothermic process occurs, which can be assigned to the phase transition to the stable β-phase, suggested by the significant changes of the molecular packing motif and the Cu-Cu distance within one molecule column. A clear peak happens at 574 °C which may correspond to the complete transition to β-CuPc. The XRD patterns of the sample after the TGA and DSC measurements up to 600 °C in Figure 4b further confirm the complete phase transition to β-CuPc.
The enthalpy difference between the α- and β-CuPc was measured by Beynon and Humphries, which revealed that the inner energy of the β-phase is lower than the α-phase by 2.57 kcal/mol [21]. Thus, we can infer that the η-phase should have a higher energy than the α-phase and can be another metastable state. In this work, the η-CuPc nanowires were rapidly grown by self-assembly from a vapor phase at the room temperature, which results in the extra energy in the crystallites. However, if the system can gain sufficient energy to overcome the activation barrier, such as by heat treatment, the η-CuPc crystals can naturally change to the α-phase (the other metastable phase), then to the stable β-phase, as shown in the Figure 2 and Figure 4.
Molecular orbital overlap type will determine the physical properties of the organic semiconductors, such as the optical and vibrational properties. Although the α- and η-phases have a similar molecule displacement distance between adjacent molecules, the properties of the two phases are different, essentially owing to the different molecule overlapping types, which cause the variance of molecular orbital overlap, as we can see in the following section.
3.3. Morphology Transition of CuPc Crystals
To gain more insight into the morphology evolution mechanism, the morphologies at different annealing temperatures were further investigated. The materials take on an obvious transition from flexible nanowires to nano-rods, then to ribbon crystal, as shown in Figure 5a–f. The transition mechanism can be analyzed in the following steps, as illustrated in Figure 5g. (1) The as-prepared η-CuPc is uniform flexible nanowire with a diameter of ~50 nm, which has beneficial properties, such as a large surface-to-volume ratio and excellent flexibility, implying a great potential for applications in the future flexible and bendable electronics; (2) at the annealing temperature of 240 °C, nanorods appear as shown in Figure 5b. It should be noted that the size distribution of the nanorods remains approximately the same as that of nanowires; (3) raising the annealing temperature, the diameters of nanorods increase, as shown in the inset of Figure 5c; (4) as the temperature increases, longer ribbon-like crystals are formed. Meanwhile, the borderline can be easily distinguished in the ribbon-like crystals, as indicated in the inset of Figure 5d,e, which gives a strong indication that the ribbon-like crystals derive from nanorods, due to the molecular thermodynamic movements during the annealing treatment; and (5) the long ribbon-like crystal may break and form short ribbon-like and sheet-like crystals with a further increase of the annealing temperature.
3.4. Vibrational and Optical Properties of CuPc Crystals
Vibrational spectroscopies (FTIR and Raman) and UV-VIS spectra have been found to be very useful techniques for studying crystal-structure phase transitions and molecular orientation in a wide range of materials, especially organic semiconductors. FTIR and Raman spectra of CuPc have been extensively explored to determine the orientation of thin films and the polymorphic transitions [22,23,24]. UV-VIS spectrum has been proved to be suitable to study the crystal structures of CuPc, especially as shown in the recent report of Microscopic UV-VIS absorption measurements [25].
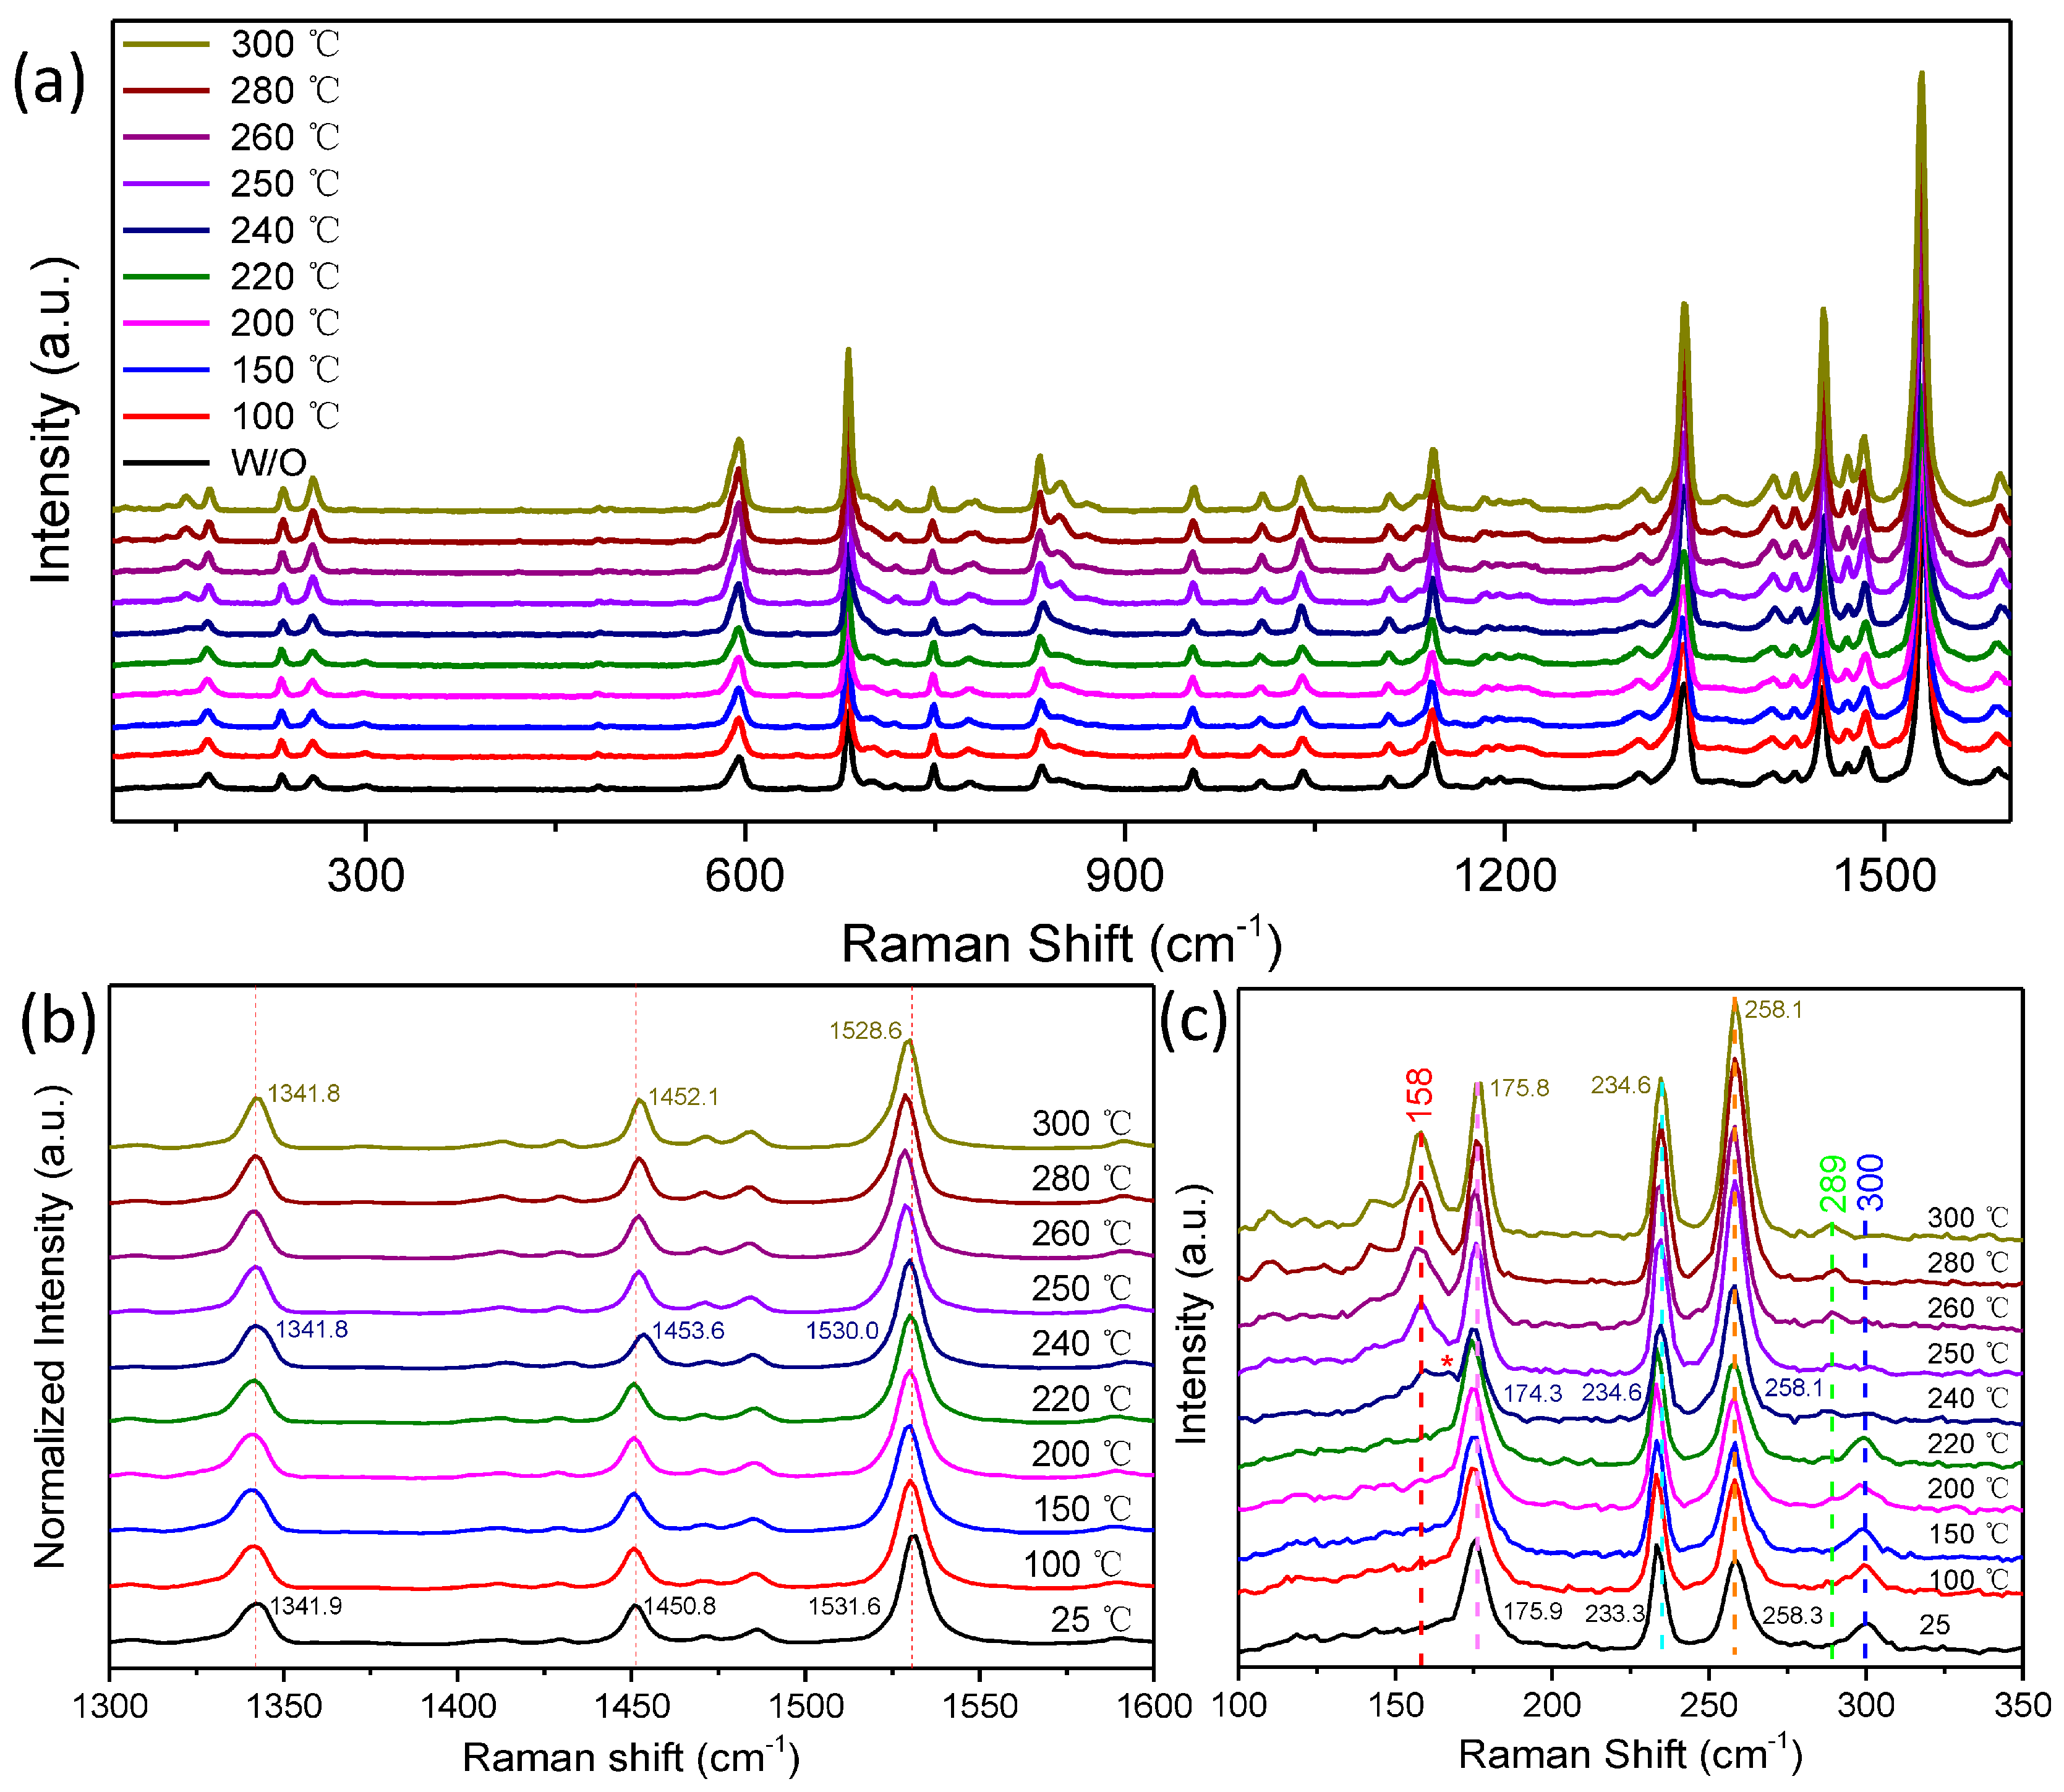
The previous studies of Raman spectra of CuPc crystals have revealed that the low-wavenumber region (below 200 cm−1) corresponds to the lattice vibrations and is determined by crystal symmetry, whereas the high-wavenumber regions (above 200 cm−1) are assigned to the intra-molecular modes, determined by the symmetry of CuPc (D4h) [24,26]. Moreover, Raman peaks in the high-wavenumber region are also strongly related to the intermolecular vibration [24]. The vibrational modes of a CuPc molecule can be found in [23,24,26], in which the A1g, B1g, and B2g are defined as in-plane vibrations and Eg an out-of-plane vibration mode. The Raman spectra of a CuPc crystal annealed at different temperatures are presented in Figure 6a with the wavenumbers ranging from 100 to 1600 cm−1. Meanwhile, to investigate the influence of lattice and molecular vibrations on the Raman spectra, more detailed spectra at high- and low-wavenumbers regions are shown in Figure 6b,c, respectively.
The region between 1300 and 1600 cm−1 is a fingerprint for intra-molecular vibrations to distinguish the crystal transition [26], the orientation of molecules [27], and metal ions in the center [23]. In Figure 6b, three dominant Raman peaks can be seen at 1341.9 cm−1, 1450.8 cm−1, and 1531.6 cm−1. The peak at 1341.9 cm−1 is due to B1g mode from C2-C2, C1-C2-C2, C3-C4, and C2-C3 (these labels are shown in Figure 1) in-plane vibrations. The peak at 1450.8 cm−1 can be assigned to B1g mode from C2-C2 and C2-C3-H in-plane and B2g mode from C1-N2, N1-C1-C2, and C-C-H in-plane vibrations. The peak at 1531.6 cm−1 can be attributed to the B1g mode from C1-C2 in-plane vibrations. A Raman shift appears for the peaks at 1450.8 cm−1 and 1531.6 cm−1. The dominant Raman peaks shift from 1450.8 and 1531.6 cm−1 in the η-CuPc to 1453.6 and 1530.0 cm−1 in the α-CuPc, then to 1452.1 and 1528.6 cm−1 in the β-CuPc. In Figure 6c, at the wavenumber above 200 cm−1, the peak at 233.3 cm−1 is due to the B2g mode from N1-Cu-N1 and C1-N2-C1 in-plane vibrations and Eg mode from C1-N1-Cu and C1-C2-C3 out-of-plane vibrations. The peak at 258.3 cm−1 is due to the A1g mode from Cu-N1 in-plane vibration and Eg mode form Cu-N1-C1 out-of-plane vibration. The Raman peaks shift from 300 cm−1 in the η-CuPc to 289 cm−1 in the α- and β-CuPc. The peak at 289 cm−1 is consistent with the previous report [22]. Raman shift may be influenced jointly by the nearest-neighboring molecular displacement distance within a chain which is 3.77 Å, 3.769 Å and 4.79 Å in the η-, α- and β-CuPc, respectively, and by overlap type of the η-(‘x’-type) , α-(‘+’-type), and β-phases (‘x’-type).
At the region below 200 cm−1, the peak at 158 cm−1 in the β-CuPc is best suited for the description of the crystal structure [24], however, this peak is absent in the η-CuPc. An additional peak at 170 cm−1 is observed, which may be ascribed to the lattice vibration in the α-CuPc. The Raman shift at the region below 200 cm–1 is mainly due to the lattice vibration, as we can see that the distances between adjacent molecule columns for η-CuPc are 12.4 Å in the a axis and 13.2 Å in the c axis, while for the β-CuPc, they are 19.4 Å and 14.628 Å, correspondingly. At the temperature of 240 °C, as the important spectral signature of structure modification, an abrupt variation in Raman shift can be easily identified both in the high- and low-wavenumber regions, which is the stagnation temperature point of the complete transition from the η-CuPc to the α-CuPc and the initial temperature point of the transition from the α-CuPc to β-CuPc, in agreement with the XRD patterns discussed above.
The experimental and calculated FTIR spectra are presented in Figure 7. The calculated CuPc single-molecule vibrational modes are given in Figure 7a and the featured peaks show a broad vibrational mode in the crystals structures of the η-, α-, and β-CuPc. The calculation results qualitatively cover the dominant areas in the experimental spectra, while the differences between them can be attributed to the interactions between molecules in the lattice. The main spectral features, especially the peaks at 726.1 and 1332.6 cm−1, can be used to distinguish the different crystalline forms of CuPc [28,29,30]. The featured peaks exhibit a clear dependence on the temperature, indicating the process of phase transitions. The bands at 722 and 1332 cm−1 originate from the macrocycle ring deformation and aromatic phenyl-ring vibration of the CuPc molecule [28,31]. At 100 °C, only the peak at 726.1 cm−1 shows up, which can be attributed to the η-CuPc. At 240 °C, the appearance of the peak at 722.2 cm−1 confirms the existence of the α-CuPc [28,32], indicating the coexistence of the α- and η-phases. At the annealing temperature of 250 °C, the peak at 729.9 cm−1 is due to the vibration of molecule in the β-CuPc. At the temperature of 250 °C, the annealed crystal contains the α-, η-, and β-CuPc phases. When the annealing temperature rises to 280 °C, the two peaks at 726.1 and 729.9 cm−1 are due to the vibrations in the α- and β-CuPc. Finally, only the peak at 729.9 cm−1 is found, implying a completed transition to the β-CuPc. Again, the transition process can be concluded as (1) the η-CuPc; (2) the η and α-CuPc; (3) the η, α, and β-CuPc; (4) the α and β-CuPc; and (5) the β-CuPc, which is in agreement with XRD results on CuPc structure. In addition, when increasing annealing temperature, the peaks at 1092.5 and 1332.6 cm−1 from the vibration in the η-CuPc shift to 1091.5 and 1333.5 cm−1 in the α-CuPc, then to 1089.6 and 1334.5 cm−1 in the β-CuPc. Moreover, the presence of peaks at 1101.2 and 1174.4 cm−1 is only observed in the β phase, consistent with the previous work [31].
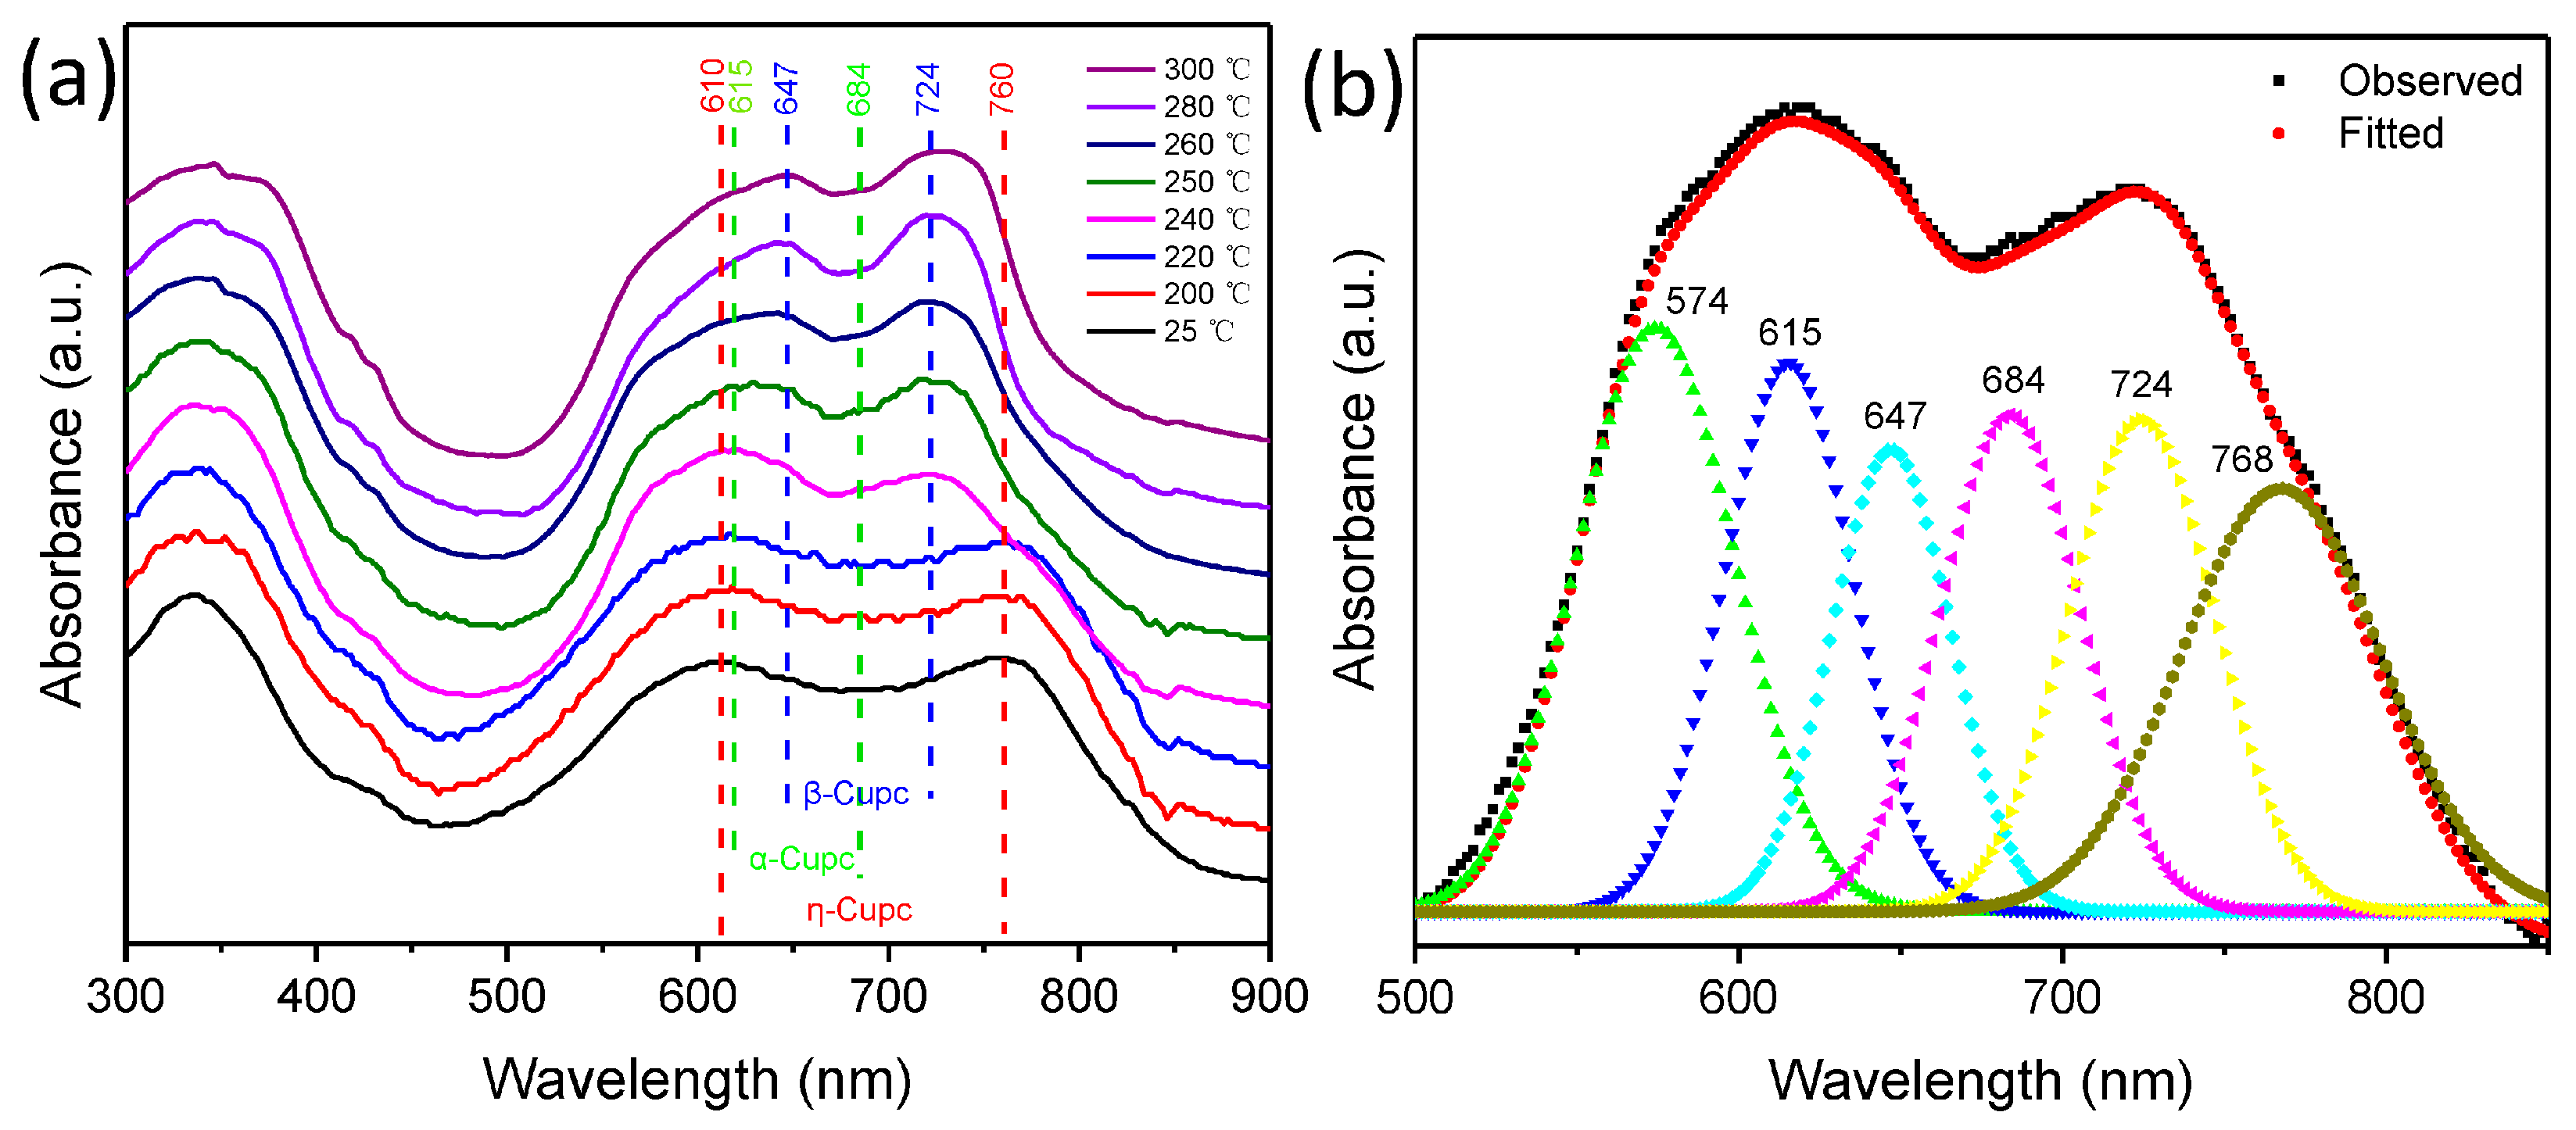
To have a better understanding of the impact of the orientation transition of the molecules and the crystal phase on the optical properties, UV-VIS spectroscopy was employed on the crystals annealed at different temperatures, as shown in Figure 8. The UV-VIS spectrum (250–800 nm, equivalent to ~1 to 5 eV) observed for CuPc originates from molecular orbitals within the aromatic 18-π-electron system and from overlapping orbitals on the central metal [33,34,35]. In the near-UV region, the B (or Soret) band, with a peak ranging from 335 to 350 nm for CuPc crystals in this work, is assigned to the electronic transition between π-π* (b2u to eg) orbitals [36]. In the visible region, the Q band representing the π-π* transition (b1u to eg) is usually split, probably by the Davydov splitting [35]. In the Q band, the high-energy peak is related to the electronic transition from π to π* orbitals of the phthalocyanine macrocycle [37,38], while the low-energy peak may be explained as a second π-π* transition (charge-transfer excited state), an exciton peak, a vibrational interval, or a surface state [39]. Nevertheless, the Q band is strongly localized on the phthalocyanine ring and is very sensitive to the environment of the molecule and to changes in the number and orientation of the nearest-neighbor Pcs in the crystal [40]. From Figure 8, it is clear that the position and relative intensity of peaks and the amount of Davydov splitting for the η-, α-, and β-CuPc are totally different, which depends strongly on the molecular orbital overlap. For the as-prepared η-CuPc crystal, the intensity of the higher-energy maximum peak (610 nm) is almost the same as that of the lower-energy peak (760 nm), with the largest amount of Davydov splitting of 150 nm among the three phases. The broad absorption spectrum in the visible light region in the η-CuPc is one of the most important features for achieving high performance of solar cell device. For the annealed CuPc crystals at 240 °C, as shown in Figure 8b, the higher-energy maximum peak (615 nm) is stronger than that of the lower-energy peak (684 nm), suggesting that the α-CuPc phase is the main phase [41]. When the annealing temperature is above 250 °C, the formation of the β-CuPc can be confirmed and become the dominant phase, as we can see that the lower-energy maximum peak (724 nm) is stronger than that of the higher-energy peak (647 nm) [41]. Interestingly, the higher-energy peaks for the η- and the α-CuPc are very close; we infer that this can be attributed to the similar Cu-Cu distance of neighboring molecules within one molecule column. However, the difference at the lower-energy peak for the η-CuPc (760 nm) and the α-CuPc (684 nm) is probably due to the overlapping type of neighboring molecules in one molecule column. It is the ‘x’-type for the η-CuPc phase, while the α-CuPc phase is the ‘+’-type, thus leading to the modification in the molecular orbital overlap, then the electronic transitions. We have, therefore, pointed out the routes for advanced optical properties by tuning the crystal structure including molecular displacement distance, molecular packing motif, and overlap type.
4. Conclusions
We have systematically studied the structure-property relationship for copper phthalocyanine from the point of view of the molecular packing motif and molecule overlap type. The crystal-structure transition and morphology evolution process consist of following stages: (1) the η-CuPc nanowires were obtained at room temperature; (2) the α-CuPc nanorods became dominant at a temperature of 240 °C; (3) β-CuPc, large micro- and nanoribbon, were formed at temperature of 300 °C. Combined with the DSC data, we found that the η-CuPc should be a metastable state of CuPc with the highest energy state among them. The spectra of FTIR, Raman and UV-VIS revealed that the optical properties were very sensitive to the subtle structural modification and imply that the molecule overlap type is one of the most important aspects that affect the optical properties in the organic materials. UV-VIS spectra manifested that the η-CuPc nanowires had the largest Davydov splitting among the three phases, suggesting the great potential in organic photovoltaic devices. This work provides a deep understanding of molecular packing motif and molecule overlap type of CuPc and their corresponding optical properties evolve with increasing annealing temperatures, which is critical for further improvement of organic electronic device performance and stability.
Acknowledgments
This work was supported by the National Nature Science Foundation of China (no. 11564023, no. 51562019), Candidates of the Young and Middle Aged Academic Leaders of Yunnan Province, program for IRTSTYN and Yunnnan local university Joint special funds for basic research 2017FH001-007.
Author Contributions
Taoyu Zou and Hai Wang conceived and designed the experiments; Li Zhao and Tingting Guo performed the experiments; Taoyu Zou and Li Zhao carried out the measurements; Wei Wu carried out the computational calculation; Taoyu Zou, Xiaoyan Wang, Haidong Ju, Wei Wu, and Hai Wang analyzed the experimental and computational data; the paper was written by Taoyu Zou. The final version of the manuscript was revised and approved by all authors.
Conflicts of Interest
The authors declare that there is no conflict of interest.
References
- Zhang, X.; Jie, J.; Deng, W.; Shang, Q.; Wang, J.; Wang, H.; Chen, X.; Zhang, X. Alignment and Patterning of Ordered Small-Molecule Organic Semiconductor Micro-/Nanocrystals for Device Applications. Adv. Mater. 2016, 28, 2475–2503. [Google Scholar] [CrossRef] [PubMed]
- Min, S.Y.; Kim, T.S.; Lee, Y.; Cho, H.; Xu, W.; Lee, T.W. Organic nanowire fabrication and device applications. Small 2015, 11, 45–62. [Google Scholar] [CrossRef] [PubMed]
- Zhang, C.; Chen, P.; Hu, W. Organic field-effect transistor-based gas sensors. Chem. Soc. Rev. 2015, 44, 2087–2107. [Google Scholar] [CrossRef] [PubMed]
- Bromley, S.T.; Mas-Torrent, M.; Hadley, P.; Rovira, C. Importance of intermolecular interactions in assessing hopping mobilities in organic field effect transistors: Pentacene versus dithiophene-tetrathiafulvalene. J. Am. Chem. Soc. 2004, 126, 6544–6545. [Google Scholar] [CrossRef] [PubMed]
- Da Silva Filho, D.A.; Kim, E.G.; Brédas, J.L. Transport Properties in the Rubrene Crystal: Electronic Coupling and Vibrational Reorganization Energy. Adv. Mater. 2005, 17, 1072–1076. [Google Scholar] [CrossRef]
- Sundar, V.C.; Zaumseil, J.; Podzorov, V.; Menard, E.; Willett, R.L.; Someya, T.; Gershenson, M.E.; Rogers, J.A. Elastomeric transistor stamps: Reversible probing of charge transport in organic crystals. Science 2004, 303, 1644–1646. [Google Scholar] [CrossRef] [PubMed]
- Gierschner, J.; Ehni, M.; Egelhaaf, H.J.; Milian Medina, B.; Beljonne, D.; Benmansour, H.; Bazan, G.C. Solid-state optical properties of linear polyconjugated molecules: Pi-stack contra herringbone. J. Chem. Phys. 2005, 123, 144914. [Google Scholar] [CrossRef] [PubMed]
- Varghese, S.; Das, S. Role of Molecular Packing in Determining Solid-State Optical Properties of π-Conjugated Materials. J. Phys. Chem. Lett. 2011, 2, 863–873. [Google Scholar] [CrossRef] [PubMed]
- Giri, G.; Verploegen, E.; Mannsfeld, S.C.B.; Atahan-Evrenk, S.; Kim, D.H.; Lee, S.Y.; Becerril, H.A.; Aspuru-Guzik, A.; Toney, M.F.; Bao, Z. Tuning charge transport in solution-sheared organic semiconductors using lattice strain. Nature 2011, 480, 504–508. [Google Scholar] [CrossRef] [PubMed] [Green Version]
- Bredas, J.L.; Calbert, J.P.; da Silva Filho, D.A.; Cornil, J. Organic semiconductors: A theoretical characterization of the basic parameters governing charge transport. Proc. Natl. Acad. Sci. USA 2002, 99, 5804–5809. [Google Scholar] [CrossRef] [PubMed]
- Wang, H.; Mauthoor, S.; Din, S.; Gardener, J.A.; Chang, R.; Warner, M.; Aeppli, G.; McComb, D.W.; Ryan, M.P.; Wu, W.; et al. Ultralong copper phthalocyanine nanowires with new crystal structure and broad optical absorption. ACS Nano 2010, 4, 3921–3926. [Google Scholar] [CrossRef] [PubMed]
- Becke, A.D. Density-functional thermochemistry. III. The role of exact exchange. J. Chem. Phys. 1993, 98, 5648–5652. [Google Scholar] [CrossRef]
- Ditchfield, R.; Hehre, W.J.; Pople, J.A. Self-Consistent Molecular-Orbital Methods. IX. An Extended Gaussian-Type Basis for Molecular-Orbital Studies of Organic Molecules. J. Chem. Phys. 1971, 54, 724–728. [Google Scholar] [CrossRef]
- Frisch, M.J.; Trucks, G.W.; Schlegel, H.B.; Scuseria, G.E.; Robb, M.A.; Cheeseman, J.R.; Montgomery, J.A., Jr.; Vreven, T.; Kudin, K.N.; Burant, J.C.; et al. Gaussian 03 (Gaussian, Inc., 2003). Available online: http://www.gaussian.com/g_tech/g_ur/g09help.htm (accessed on 9 November 2017).
- Serri, M.; Wu, W.; Fleet, L.R.; Harrison, N.M.; Hirjibehedin, C.F.; Kay, C.W.; Fisher, A.J.; Aeppli, G.; Heutz, S. High-temperature antiferromagnetism in molecular semiconductor thin films and nanostructures. Nat. Commun. 2014, 5. [Google Scholar] [CrossRef] [PubMed]
- Wang, X.; Wu, W.; Ju, H.; Zou, T.; Qiao, Z.; Gong, H.; Wang, H. Experimental and theoretical studies of the structure and optical properties of nickel phthalocyanine nanowires. Mater. Res. Express 2016, 3. [Google Scholar] [CrossRef]
- Wu, W.; Harrison, N.; Fisher, A. Electronic structure and exchange interactions in cobalt-phthalocyanine chains. Phys. Rev. B 2013, 88, 024426. [Google Scholar] [CrossRef]
- Wu, W.; Kerridge, A.; Harker, A.H.; Fisher, A.J. Structure-dependent exchange in the organic magnets Cu(II)Pc and Mn(II)Pc. Phys. Rev. B 2008, 77. [Google Scholar] [CrossRef] [Green Version]
- Muscat, J.; Wander, A.; Harrison, N.M. On the prediction of band gaps from hybrid functional theory. Chem. Phys. Lett. 2001, 342, 397–401. [Google Scholar] [CrossRef]
- Illas, F.; Moreira, I.P.R.; de Graaf, C.; Barone, V. Magnetic coupling in biradicals, binuclear complexes and wide-gap insulators: A survey of ab initio wave function and density functional theory approaches. Theor. Chem. Acc. Theory Comput. Model. (Theor. Chim. Acta) 2000, 104, 265–272. [Google Scholar] [CrossRef]
- Beynon, J.H.; Humphries, A.R. The enthalpy difference between α- and β-copper phthalocyanine measured with an isothermal calorimeter. Trans. Faraday Soc. 1955, 51, 1065–1071. [Google Scholar] [CrossRef]
- Defeyt, C.; Vandenabeele, P.; Gilbert, B.; Van Pevenage, J.; Cloots, R.; Strivay, D. Contribution to the identification of α-, β- and ε-copper phthalocyanine blue pigments in modern artists’ paints by X-ray powder diffraction, attenuated total reflectance micro-fourier transform infrared spectroscopy and micro-Raman spectroscopy. J. Raman Spectrosc. 2012, 43, 1772–1780. [Google Scholar] [CrossRef]
- Basova, T.V.; Kiselev, V.G.; Schuster, B.-E.; Peisert, H.; Chassé, T. Experimental and theoretical investigation of vibrational spectra of copper phthalocyanine: Polarized single-crystal Raman spectra, isotope effect and DFT calculations. J. Raman Spectrosc. 2009, 40, 2080–2087. [Google Scholar] [CrossRef]
- Kolesov, B.A.; Basova, T.V.; Igumenov, I.K. Determination of the orientation of CuPc film by raman spectroscopy. Thin Solid Films 1997, 304, 166–169. [Google Scholar] [CrossRef]
- McAfee, T.; Hoffman, B.C.; You, X.; Atkin, J.M.; Ade, H.; Dougherty, D.B. Morphological, Optical, and Electronic Consequences of Coexisting Crystal Orientations in β-Copper Phthalocyanine Thin Films. J. Phys. Chem. C 2016, 120, 18616–18621. [Google Scholar] [CrossRef]
- Ghorai, U.K.; Mazumder, N.; Mamgain, H.; Roy, R.; Saha, S.; Chattopadhyay, K.K. Raman Spectroscopic Observation of Gradual Polymorphic Transition and Phonon Modes in CuPc Nanorod. J. Phys. Chem. C 2017, 121, 6323–6328. [Google Scholar] [CrossRef]
- Kuwahara, M.; Mizutani, G.; Sakamoto, K.; Ushioda, S. Absolute Raman scattering cross sections of surface adsorbed Cu-phthalocyanine molecules. Surf. Sci. 1991, 242, 544–548. [Google Scholar] [CrossRef]
- Prabakaran, R.; Fortunato, E.; Martins, R.; Ferreira, I. Fabrication and characterization of hybrid solar cells based on copper phthalocyanine/porous silicon. J. Non-Cryst. Solids 2008, 354, 2892–2896. [Google Scholar] [CrossRef]
- Verma, D.; Dash, R.; Katti, K.S.; Schulz, D.L.; Caruso, A.N. Role of coordinated metal ions on the orientation of phthalocyanine based coatings. Spectrochim. Acta Part A Mol. Biomol. Spectrosc. 2008, 70, 1180–1186. [Google Scholar] [CrossRef] [PubMed]
- Li, D.; Peng, Z.; Deng, L.; Shen, Y.; Zhou, Y. Theoretical studies on molecular structure and vibrational spectra of copper phthalocyanine. Vib. Spectrosc. 2005, 39, 191–199. [Google Scholar] [CrossRef]
- Achar, B.N.; Lokesh, K.S. Studies on polymorphic modifications of copper phthalocyanine. J. Solid State Chem. 2004, 177, 1987–1993. [Google Scholar] [CrossRef]
- Kendall, D.N. Identification of Polymorphic Forms of Crystals by Infrared Spectroscopy. Anal. Chem. 1953, 25, 382–389. [Google Scholar] [CrossRef]
- Ough, E.A.; Stillman, M.J.; Creber, K.A.M. Absorption and magnetic circular dichroism spectra of nitrogen homologues of magnesium and zinc phthalocyanine. Can. J. Chem. 1993, 71, 1898–1909. [Google Scholar] [CrossRef]
- Karan, S.; Basak, D.; Mallik, B. Copper phthalocyanine nanoparticles and nanoflowers. Chem. Phys. Lett. 2007, 434, 265–270. [Google Scholar] [CrossRef]
- Karan, S.; Mallik, B. Effects of annealing on the morphology and optical property of copper (II) phthalocyanine nanostructured thin films. Solid State Commun. 2007, 143, 289–294. [Google Scholar] [CrossRef]
- Roy, D.; Das, N.M.; Shakti, N.; Gupta, P.S. Comparative study of optical, structural and electrical properties of zinc phthalocyanine Langmuir–Blodgett thin film on annealing. RSC Adv. 2014, 4, 42514–42522. [Google Scholar] [CrossRef]
- Mack, J.; Stillman, M.J. Assignment of the Optical Spectra of Metal Phthalocyanine Anions. Inorg. Chem. 1997, 36, 413–425. [Google Scholar] [CrossRef]
- Mack, J.; Stillman, M.J. Transition Assignments in the Ultraviolet−Visible Absorption and Magnetic Circular Dichroism Spectra of Phthalocyanines. Inorg. Chem. 2001, 40, 812–814. [Google Scholar] [CrossRef] [PubMed]
- Davidson, A.T. The effect of the metal atom on the absorption spectra of phthalocyanine films. J. Chem. Phys. 1982, 77, 168. [Google Scholar] [CrossRef]
- Chen, Q.; Gu, D.; Shu, J.; Tang, X.; Gan, F. Optical and recording properties of copper phthalocyanine films. Mater. Sci. Eng. B 1994, 25, 171–174. [Google Scholar] [CrossRef]
- Jungyoo, E.; Kim, S.; Lim, E.; Lee, K.; Cha, D.; Friedman, B. Effects of substrate temperature on copper(II) phthalocyanine thin films. Appl. Surf. Sci. 2003, 205, 274–279. [Google Scholar] [CrossRef]
Figure 1.
(a) Schematic of the molecular structure of CuPc, where H atoms are in light grey, C in grey, N in blue, and Cu in red. Schematic packings of the η-, α-, and β-phases of CuPc are shown in (b–d), respectively. Notice that a herringbone-packing motif in the η- and β- phases, but a parallel-packing motif in the α-phase.

Figure 2.
(a) The heating process of the sample during the In-situ XRD measurement. (b) The in situ XRD patterns of CuPc crystals as a function of temperature with the panel on the right show the phase type at different temperature regions.
Figure 2.
(a) The heating process of the sample during the In-situ XRD measurement. (b) The in situ XRD patterns of CuPc crystals as a function of temperature with the panel on the right show the phase type at different temperature regions.
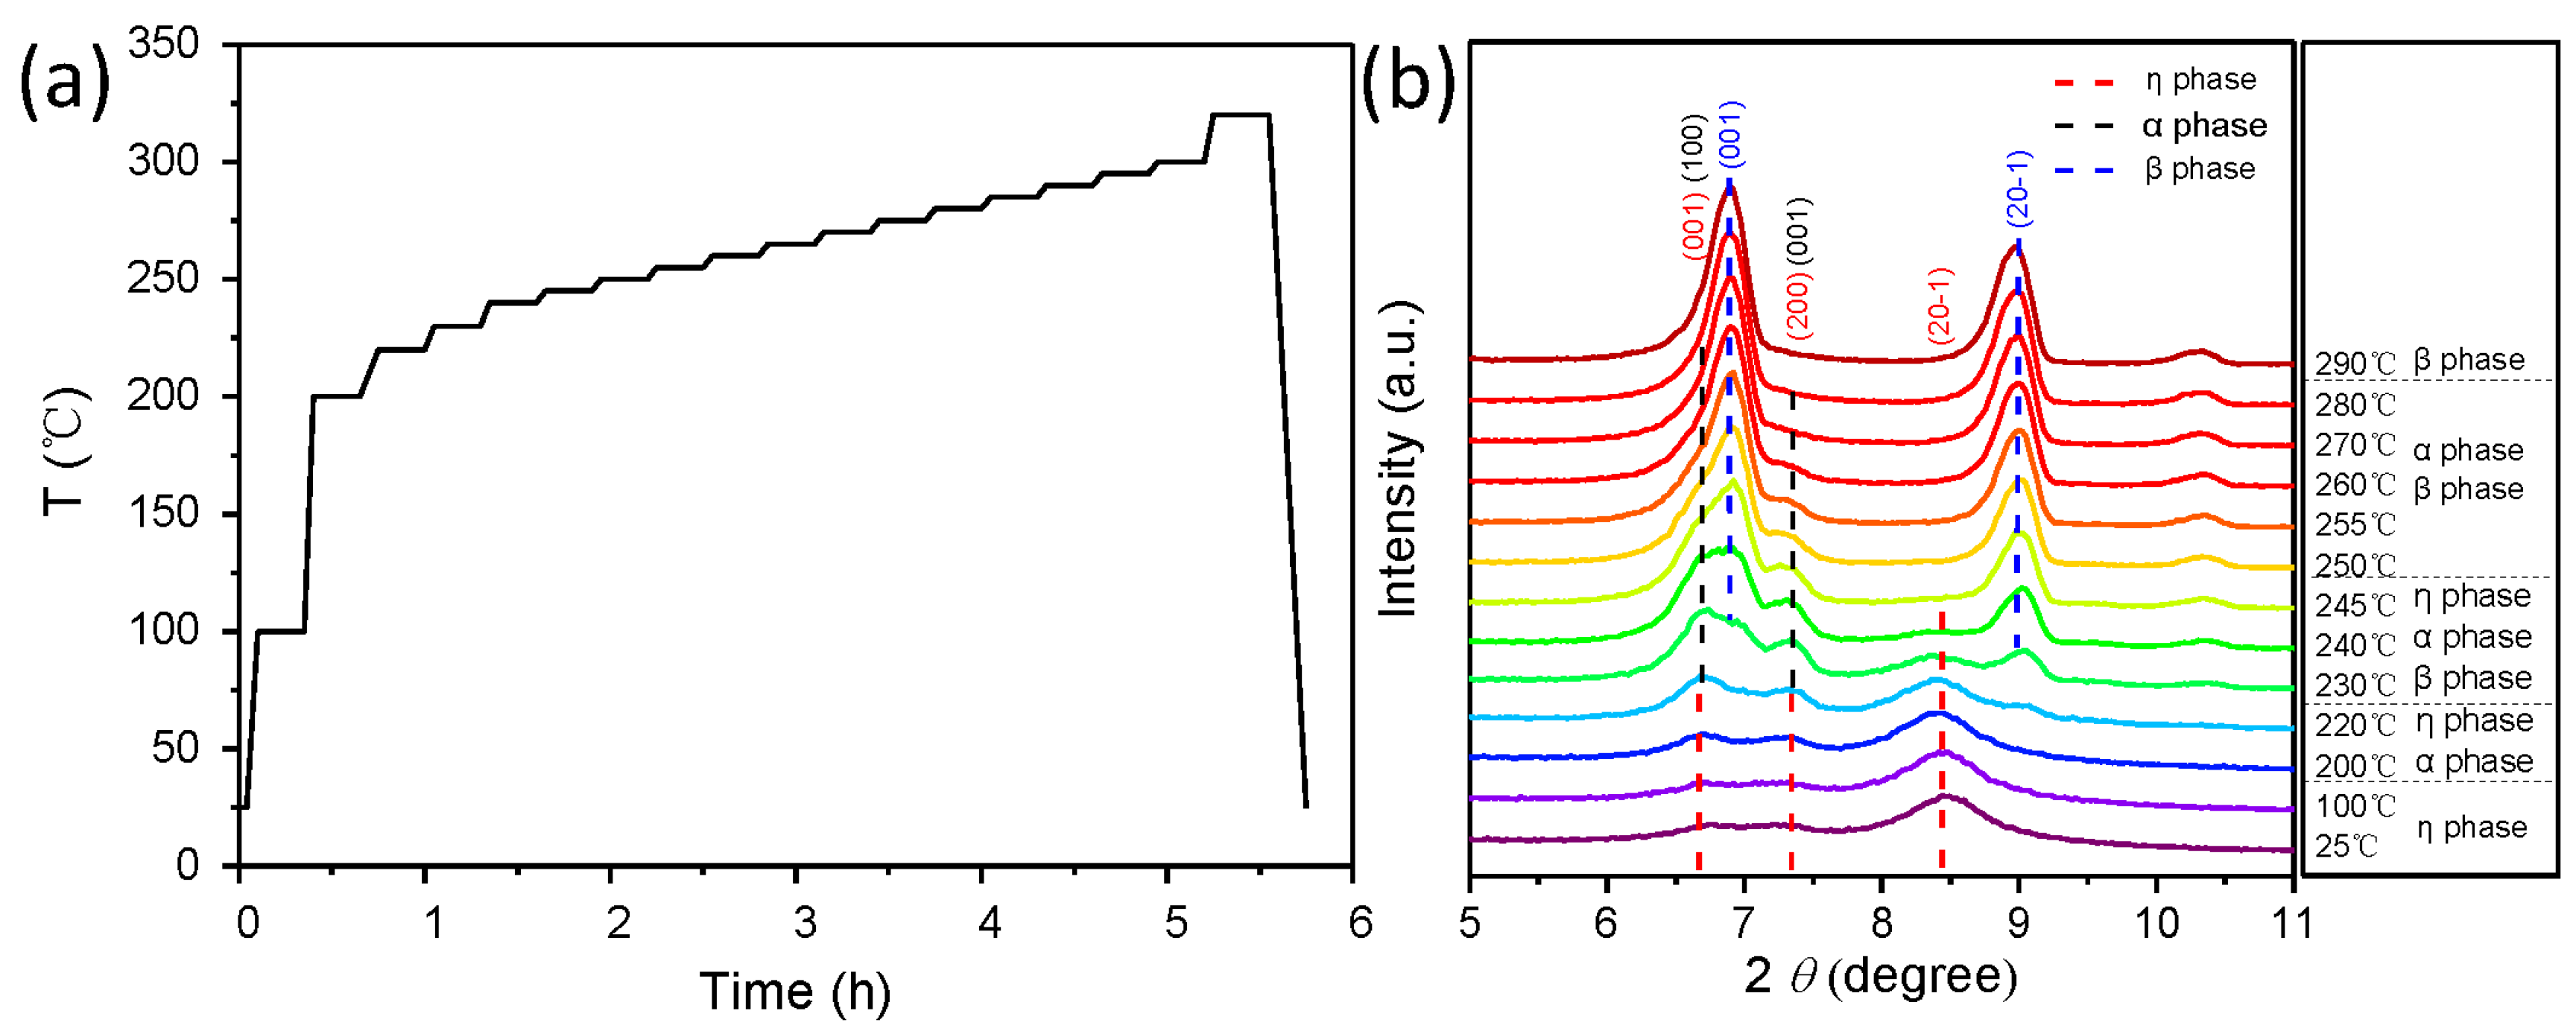
Figure 3.
Schematic packings of CuPc molecules into the η, α, and β-phase is shown in (a,d,g) respectively. Molecular arrangement schemes of them are shown in (b,e,h) respectively, as seen along [010]. CuPc molecule overlap types are shown in (c,f,i) respectively.
Figure 3.
Schematic packings of CuPc molecules into the η, α, and β-phase is shown in (a,d,g) respectively. Molecular arrangement schemes of them are shown in (b,e,h) respectively, as seen along [010]. CuPc molecule overlap types are shown in (c,f,i) respectively.

Figure 4.
(a) XRD patterns of CuPc crystals annealed at different temperature; (b) the XRD pattern of the remaining sample for CuPc materials after TGA and DSC measurements; and (c) the TGA curve and heat flow in the DSC curve as a function of temperature for as-prepared CuPc nanowires.
Figure 4.
(a) XRD patterns of CuPc crystals annealed at different temperature; (b) the XRD pattern of the remaining sample for CuPc materials after TGA and DSC measurements; and (c) the TGA curve and heat flow in the DSC curve as a function of temperature for as-prepared CuPc nanowires.

Figure 5.
SEM images of CuPc nanowires annealed at different temperatures: (a) without annealing, (b) 240 °C, (c) 270 °C, (d) 290 °C, (e) 300 °C, and (f) 350 °C (scale bar = 1 μm). (g) Schematic of the morphology transition process.
Figure 5.
SEM images of CuPc nanowires annealed at different temperatures: (a) without annealing, (b) 240 °C, (c) 270 °C, (d) 290 °C, (e) 300 °C, and (f) 350 °C (scale bar = 1 μm). (g) Schematic of the morphology transition process.
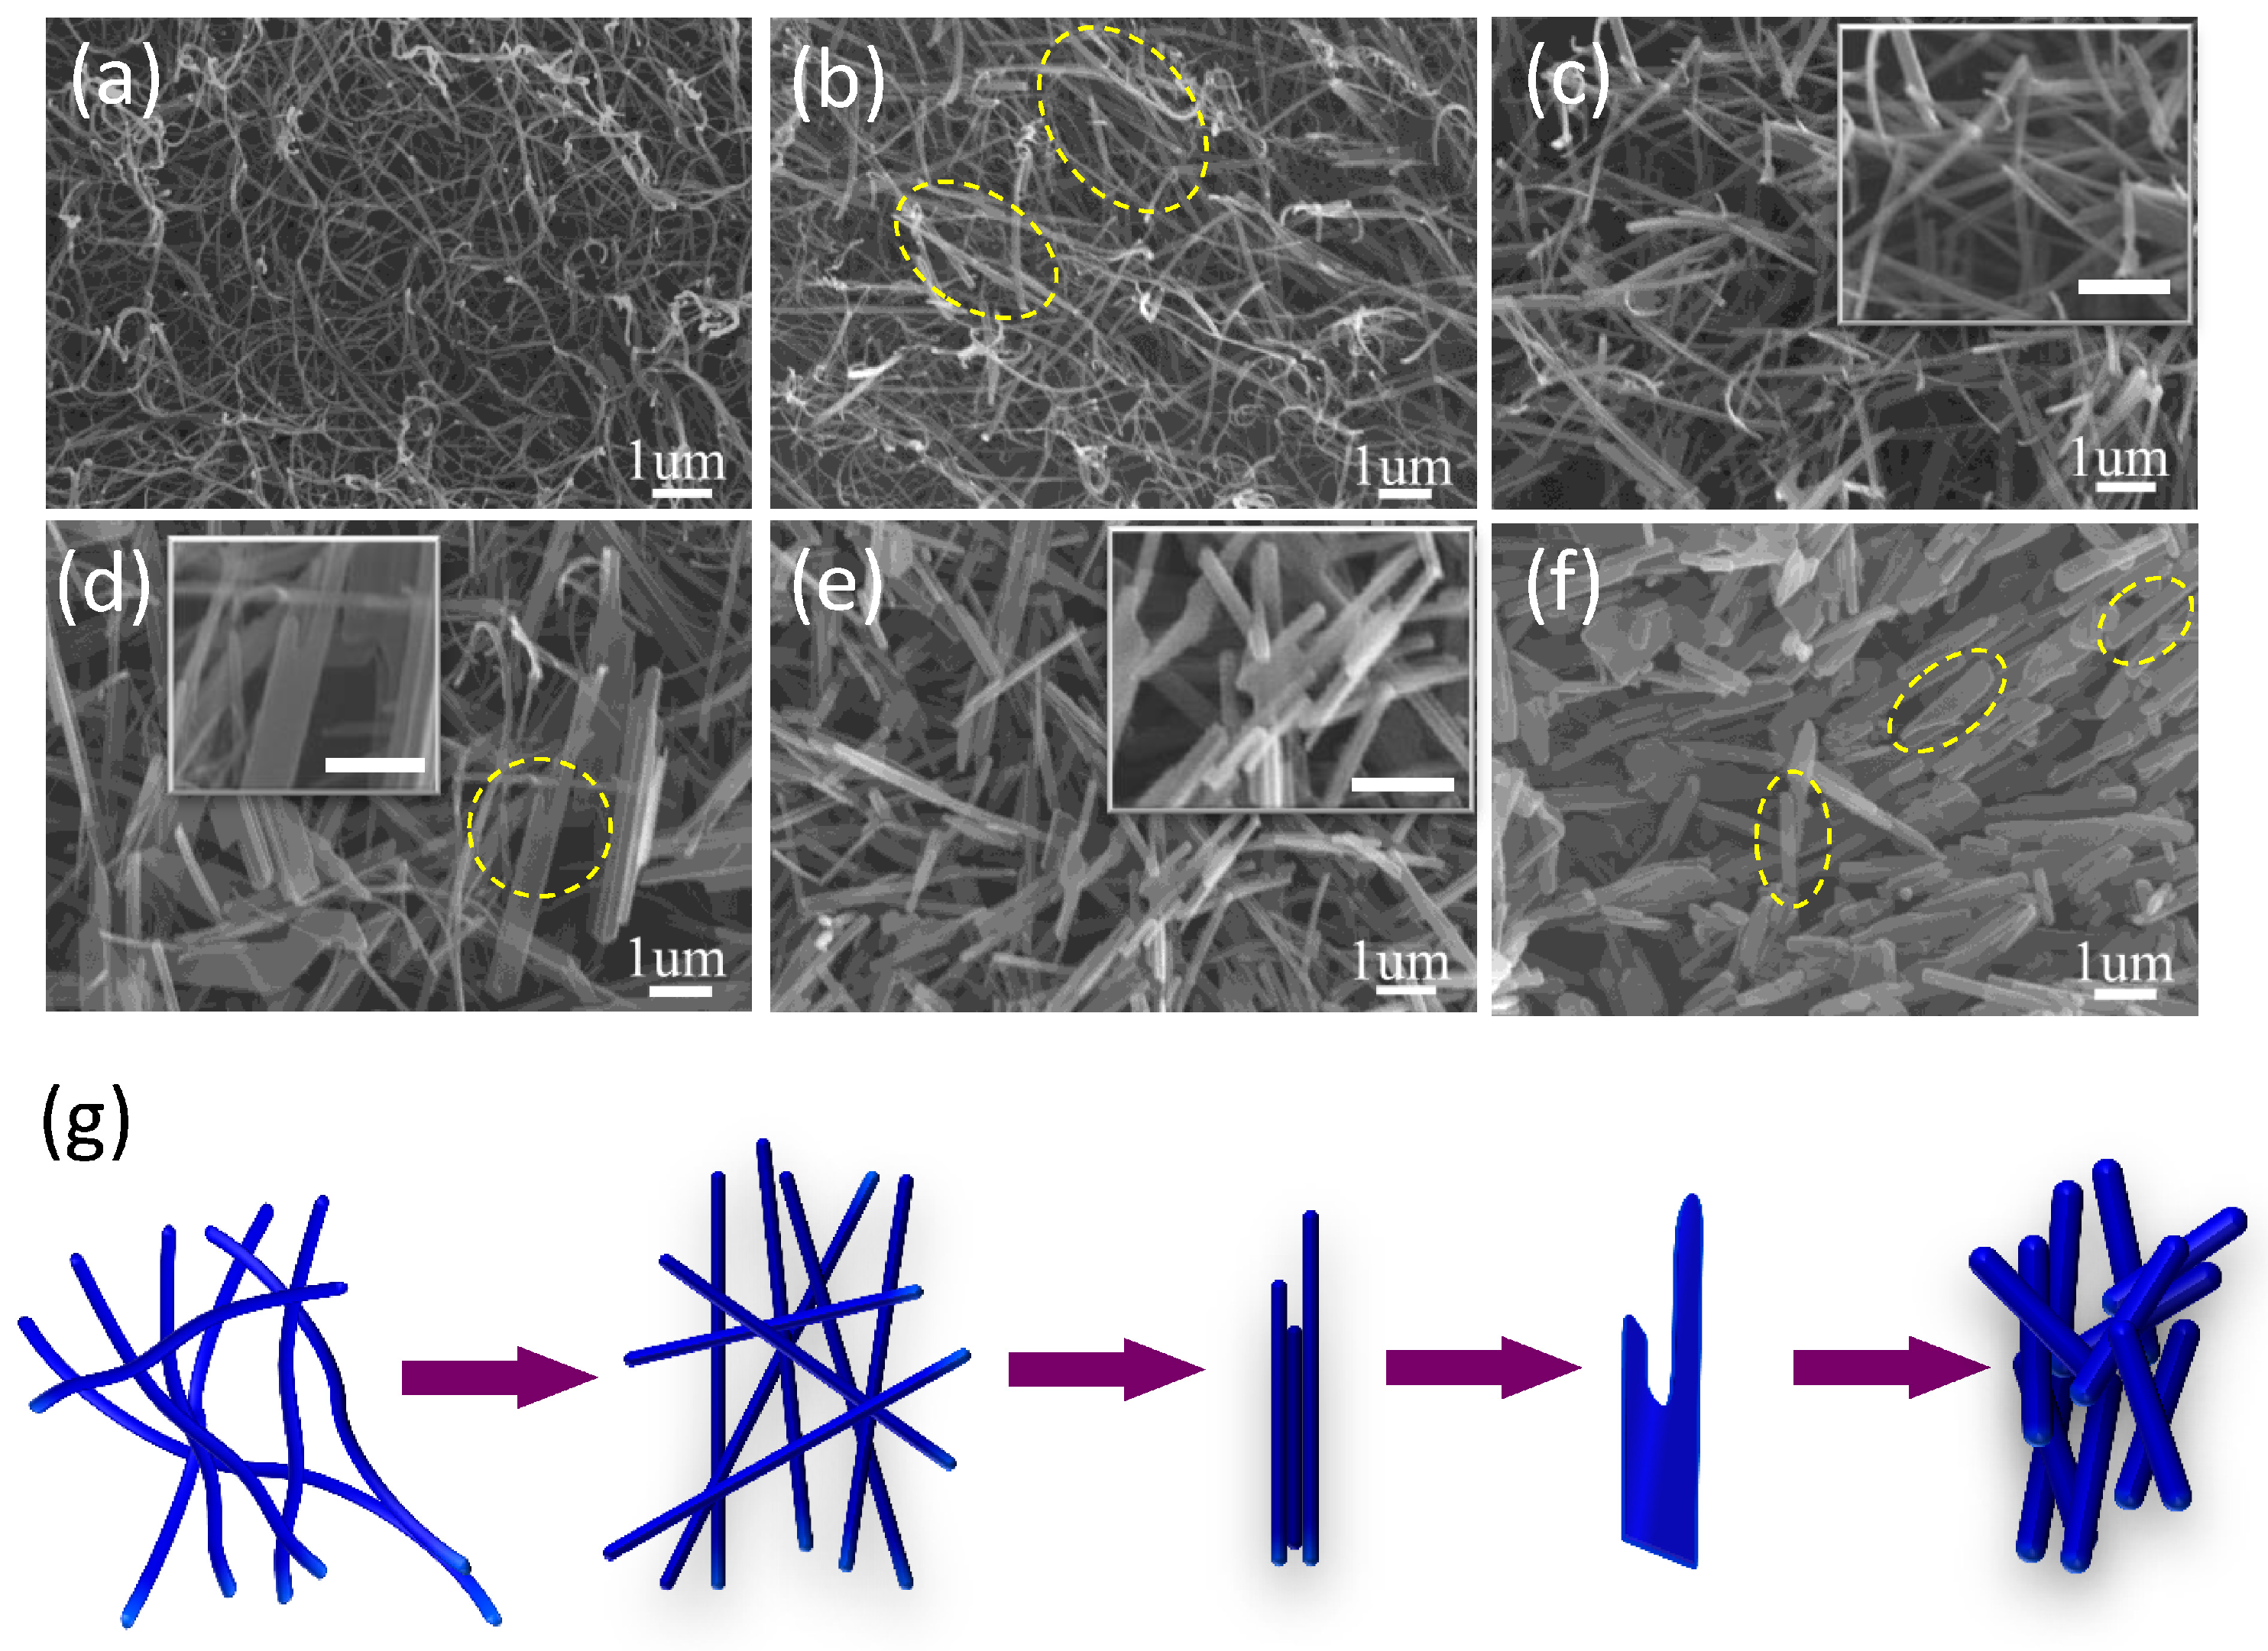
Figure 6.
The Raman spectra of CuPc crystals annealed at different temperatures. The Raman spectra with the wavenumber ranging from 100 to 1600 cm−1 are shown in (a), while more detailed spectra with the wavenumber at high (1300–1600 cm−1) and low regions (100–350 cm−1) are shown in (b,c), respectively.

Figure 7.
(a) Calculated CuPc single molecule vibrational modes by using density-functional theory; and (b) FTIR spectra of CuPc crystals annealed at different temperatures.
Figure 7.
(a) Calculated CuPc single molecule vibrational modes by using density-functional theory; and (b) FTIR spectra of CuPc crystals annealed at different temperatures.
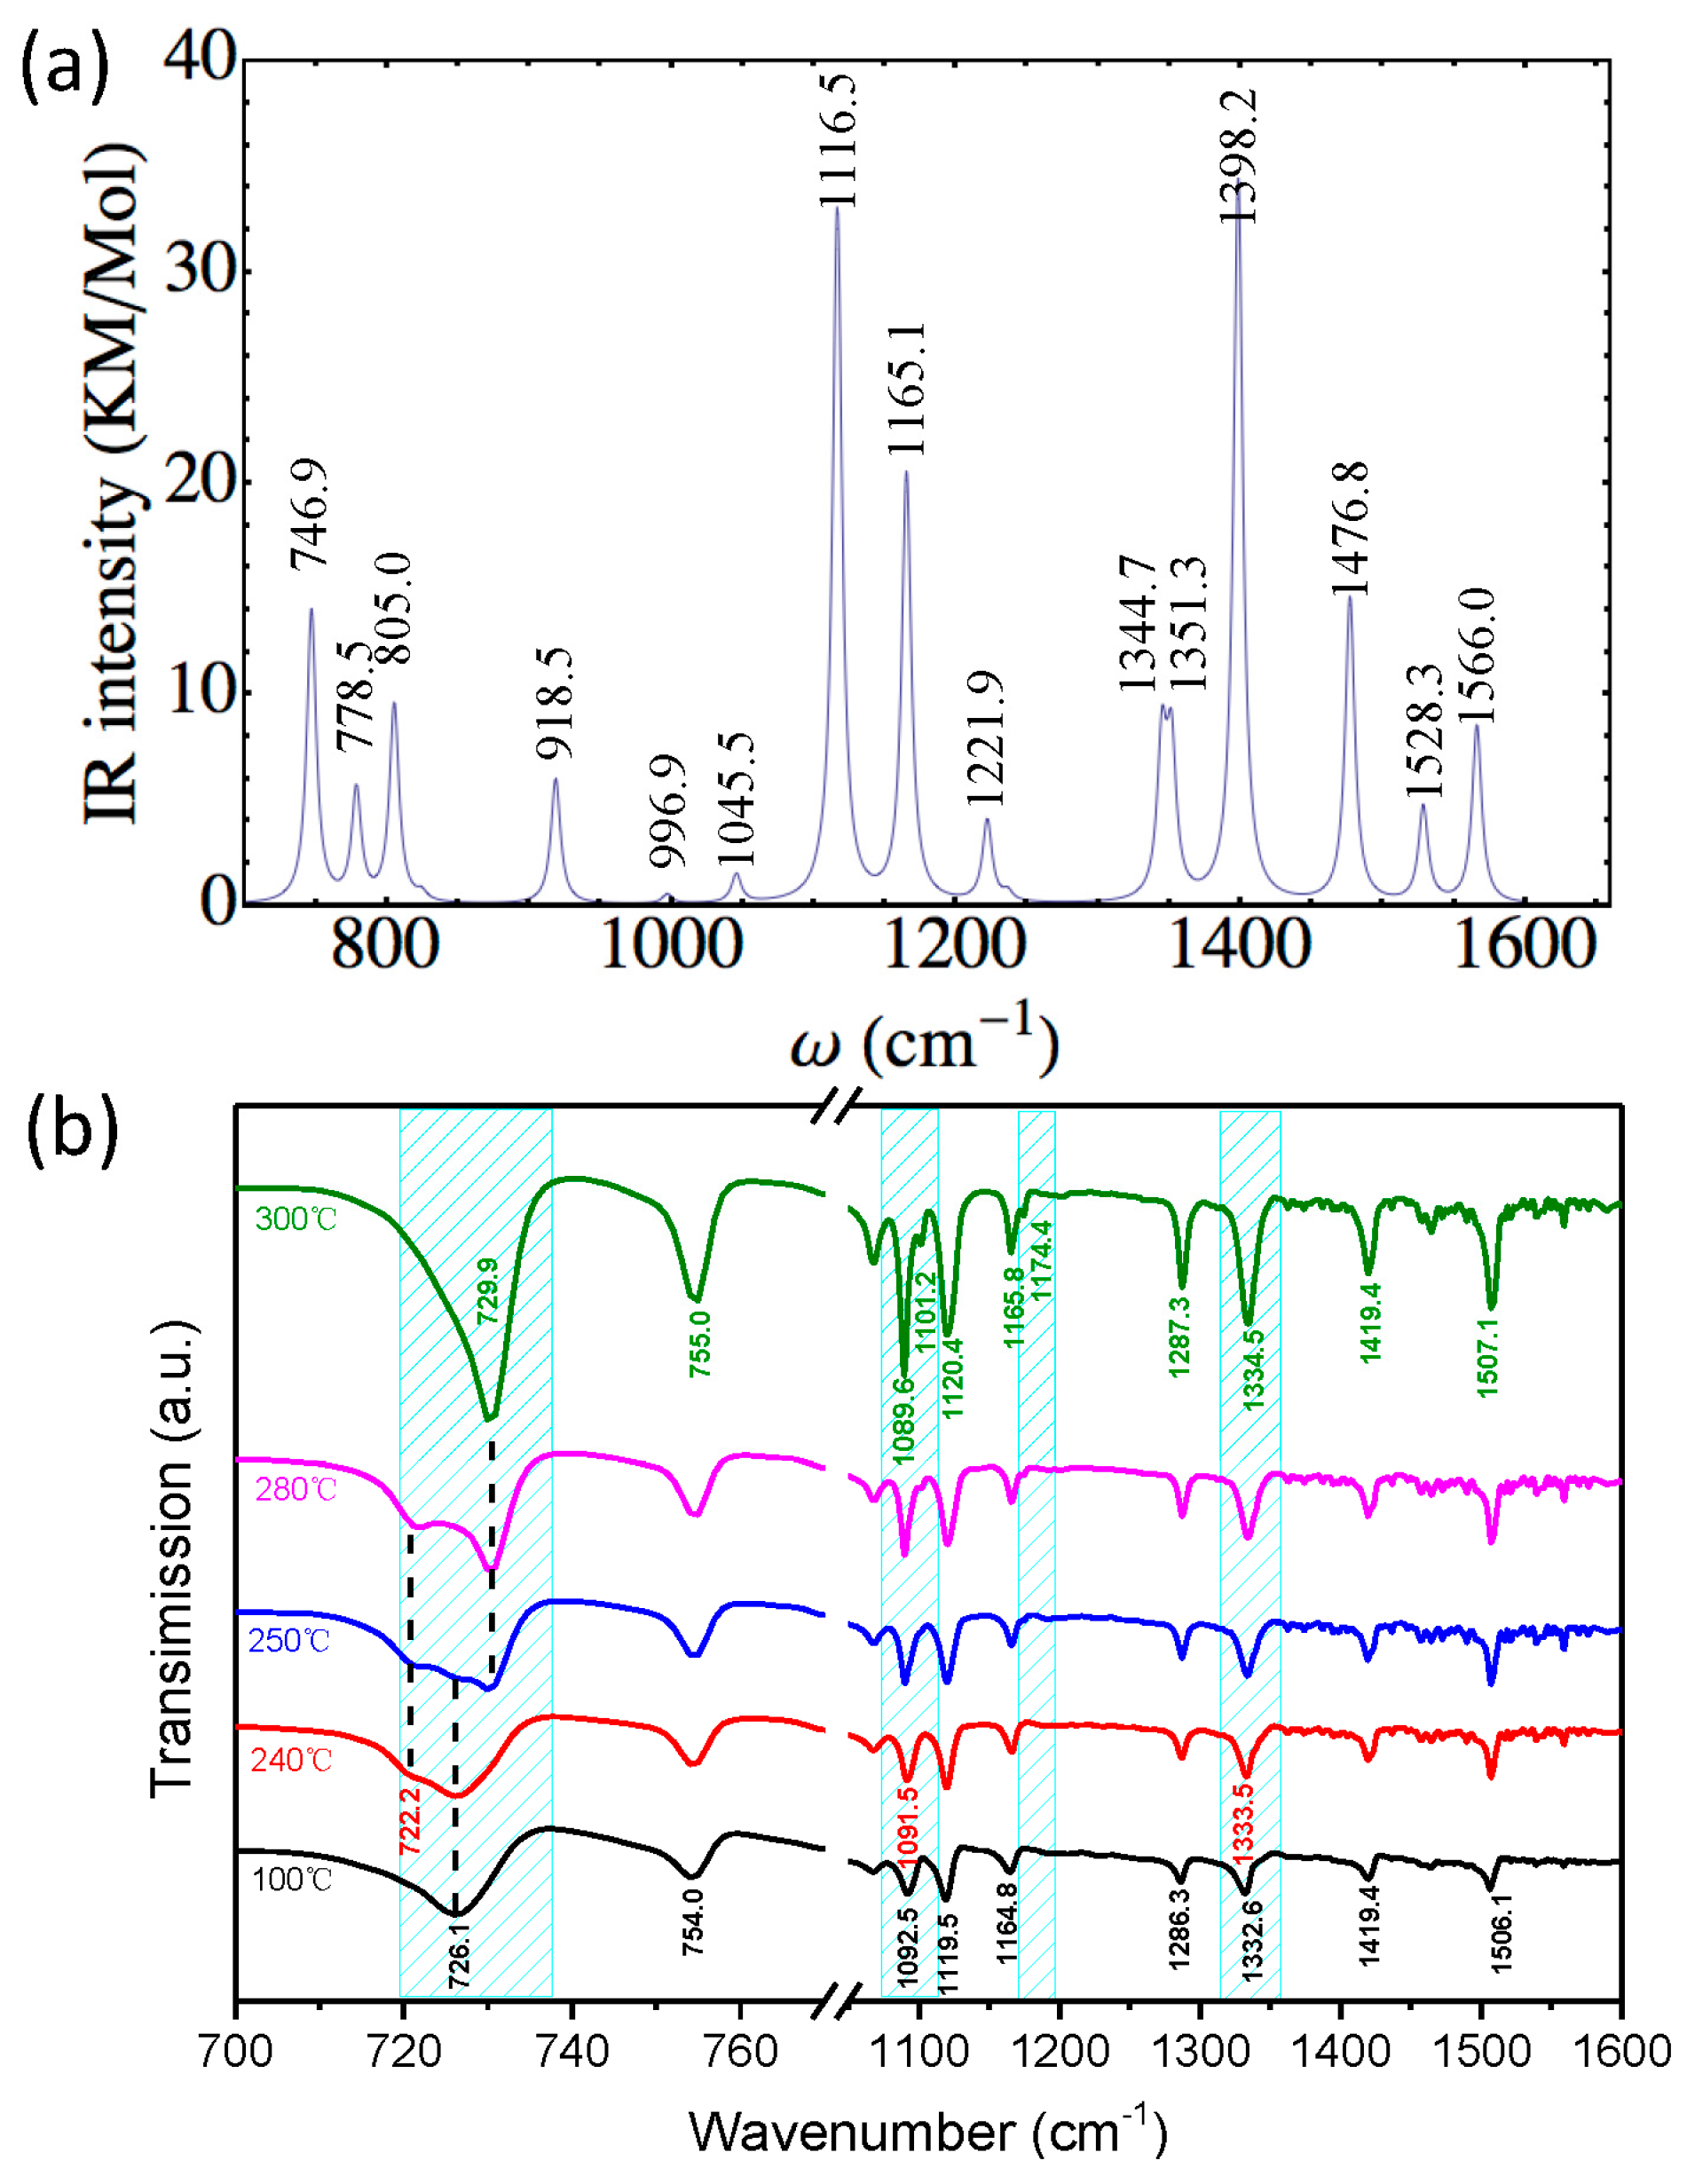
Figure 8.
(a) UV-VIS spectra of CuPc crystals annealed at different temperatures; and (b) observed and fitted spectra for CuPc crystals annealed at 240 °C in the visible region.
Figure 8.
(a) UV-VIS spectra of CuPc crystals annealed at different temperatures; and (b) observed and fitted spectra for CuPc crystals annealed at 240 °C in the visible region.
© 2018 by the authors. Licensee MDPI, Basel, Switzerland. This article is an open access article distributed under the terms and conditions of the Creative Commons Attribution (CC BY) license (http://creativecommons.org/licenses/by/4.0/).
Share and Cite
MDPI and ACS Style
Zou, T.; Wang, X.; Ju, H.; Zhao, L.; Guo, T.; Wu, W.; Wang, H. Controllable Molecular Packing Motif and Overlap Type in Organic Nanomaterials for Advanced Optical Properties. Crystals 2018, 8, 22. https://doi.org/10.3390/cryst8010022
AMA Style
Zou T, Wang X, Ju H, Zhao L, Guo T, Wu W, Wang H. Controllable Molecular Packing Motif and Overlap Type in Organic Nanomaterials for Advanced Optical Properties. Crystals. 2018; 8(1):22. https://doi.org/10.3390/cryst8010022
Chicago/Turabian StyleZou, Taoyu, Xiaoyan Wang, Haidong Ju, Li Zhao, Tingting Guo, Wei Wu, and Hai Wang. 2018. "Controllable Molecular Packing Motif and Overlap Type in Organic Nanomaterials for Advanced Optical Properties" Crystals 8, no. 1: 22. https://doi.org/10.3390/cryst8010022
Note that from the first issue of 2016, this journal uses article numbers instead of page numbers. See further details here.