
σ-Holes on Transition Metal Nanoclusters and Their Influence on the Local Lewis Acidity


1
Applied Physical Chemistry, School of Chemical Science and Engineering, KTH Royal Institute of Technology, Teknikringen 36, SE-100 44 Stockholm, Sweden
2
Swedish Nuclear Fuel and Waste Management Company (SKB), Evenemangsgatan 13, Box 3091, SE-169 03 Solna, Sweden
*
Author to whom correspondence should be addressed.
Crystals 2017, 7(7), 222; https://doi.org/10.3390/cryst7070222
Submission received: 10 June 2017
/
Revised: 10 July 2017
/
Accepted: 11 July 2017
/
Published: 14 July 2017
(This article belongs to the Special Issue Analysis of Halogen and Other σ-Hole Bonds in Crystals)
Abstract
:Understanding the molecular interaction behavior of transition metal nanoclusters lies at the heart of their efficient use in, e.g., heterogeneous catalysis, medical therapy and solar energy harvesting. For this purpose, we have evaluated the applicability of the surface electrostatic potential [VS(r)] and the local surface electron attachment energy [ES(r)] properties for characterizing the local Lewis acidity of a series of low-energy TM13 transition metal nanoclusters (TM = Au, Cu, Ru, Rh, Pd, Ir, Pt, Co), including also Pt7Cu6. The clusters have been studied using hybrid Kohn–Sham density functional theory (DFT) calculations. The VS(r) and ES(r), evaluated at 0.001 a.u. isodensity contours, are used to analyze the interactions with H2O. We find that the maxima of VS(r), σ-holes, are either localized or diffuse. This is rationalized in terms of the nanocluster geometry and occupation of the clusters’s, p and d valence orbitals. Our findings motivate a new scheme for characterizing σ-holes as σs (diffuse), σp (localized) or σd (localized) depending on their electronic origin. The positions of the maxima in VS(r) (and minima in ES(r)) are found to coincide with O-down adsorption sites of H2O, whereas minima in VS(r) leads to H-down adsorption. Linear relationships between VS,max (and ES,min) and H2O interaction energies are further discussed.
1. Introduction
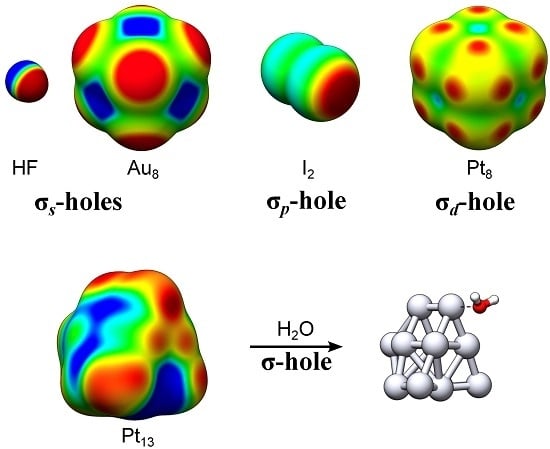
Surface maxima in the molecular electrostatic potential (VS,max) along the lateral extensions of intramolecular bonds are known as σ-holes [1]. These have been widely used to rationalize molecular interaction behavior and reactivity [2]. In the present contribution we introduce new categories of σ-holes based on the electronic origin of the VS,max; if the VS,max arises primarily as a consequence of electron deficiencies in the valence s-orbitals of the compound, we shall denote it an σs-hole. Similarly, VS,max originating from deficiencies in the p- or d-orbitals will be referred to as σp- or σd-holes. Mixtures of these exist. The new categorization is herein motivated by a detailed analysis of transition metal (TM) nanoclusters, and arises naturally from the occurrence of diffuse (non-directional) or localized (directional) σ-hole on the TM compounds. With some few exceptions, e.g., refs. [3,4,5,6,7], TM compounds have not commonly been characterized by surface electrostatic potential maps. We will here show that σ-holes are useful guides also for TM interactions with clear similarities to halogen or hydrogen bonding.
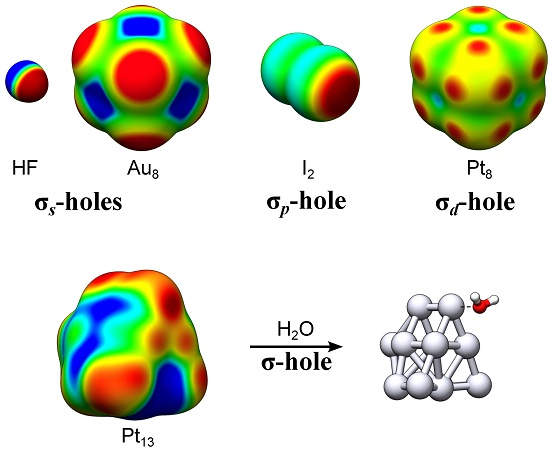
Representative examples of σs- and σp-holes can be found on hydrogen and singly coordinated halogen (X = Cl, Br and I) atoms participating in hydrogen and halogen bonding. The VS,max of the hydrogen atom of e.g., HF (Figure 1) arises because, upon formation of the covalent H–F bond, electron density is relocated from the non-bonding sides of the atoms to the bonding region between them. The large difference in electronegativity between H and F further leads to a strong polarization towards F in the bonding σ-orbital. The σ*-orbital is, on the other hand, highly polarized towards H but because it is unoccupied it will not compensate for the polarization of the σ-orbital. Consequently, the occupation of the σ-orbitals effectively results in a substantial electron deficiency on H. This is manifested by a large positive electrostatic potential at the H atom—an σs-hole since it originates in the hydrogen s-orbital occupation. Simultaneously a negative electrostatic potential is built up on F. Due to the spherical symmetry of the H 1s orbital, the corresponding σs-hole is diffused over the entire H end of the molecule. This explains the weak directionality of H-bond interactions, which often deviate significantly from 180° [8]. In the following we will show that common features of σs-holes are their diffuse and non-directional character. VS,max have also been used to rationalize the formation of non-covalent bonds between halogen atoms and electron donating compounds, i.e., halogen bonds [9,10]. In contrast to hydrogen bonds, halogen bonds are highly directional. This can be attributed to the partial occupation of the valence p- rather than s-orbitals. Figure 1 includes the example of the I2 molecule. The intramolecular bonding in I2 is, by and large, the consequence of the mixing of two I 5pz orbitals, leading to a σpz-bond where the σpz-orbital is occupied and the σ*pz-orbital is unoccupied. Similarly to HF, this gives rise to electron deficiencies in the lateral extensions of the I–I bond, with two corresponding VS,max at the edges of the σ-framework. Using the principles for σ-hole categorization from above, the VS,max of halogen atoms should be denoted σp-holes due to the p-origin of the hole. Owing to the largely directional character of the pz orbitals, the σp-holes are highly localized in the direction of the σ-bond. Consequently, the halogen bond interactions are, in contrast to hydrogen bonds, found to be directional with A⋯X–R angles close to 180° [8].
For TM compounds, we analogously find that areas of high electrostatic potential are sometimes localized along the extension of TM–TM bonds. In addition, multiple VS,max may arise on the same atom corresponding to up to one σ-hole per TM–TM bond. This can be traced to the partially occupied d-orbitals of the TM compound and will thus be called σd-holes. The square planar Pt4 cluster of Figure 1 can be taken as an example. Pt has a 5d96s1 valence configuration and accordingly the local electron deficiencies of Pt4 are a consequence of the redistribution of both s- and d-orbital densities (the minor mixing of 6p-orbitals is here neglected for the sake of simplicity). The s-deficiencies promote the creation of areas of high electrostatic potential on the corners of Pt4. The corners do, however, not correspond to maxima as the VS(r) profile is also affected by the d-occupation. This promotes the formation of VS,max at the extension of the σd-bonds created by the overlap of 5dz2 and 5dx2−y2 orbitals, i.e., at each side of the corners of the Pt4 square structure. These VS,max are thus best referred to as σd-holes. The σp- and σd-holes have in common that they are highly localized along the direction of the intramolecular bond.
In the present work, we shall investigate the presence and absence of the various kinds of σ-holes on a series of neutral, low-energy TM13 nanoclusters [14,15,16,17,18,19,20,21,22,23]. The nanoclusters comprise the mixed elemental Pt7Cu6 nanocluster as well as the Ir13, Pt13, Au13, Pd13, Rh13, Ru13, Cu13 and Co13 clusters. Nanomaterial based on TM elements are essential components in a range of emergent and established applications including heterogeneous catalysis, medical therapy and solar energy harvesting [24,25,26,27,28,29,30,31], and in order to design and efficiently utilize these materials, a thorough understanding of their interaction behavior with ambient molecules is necessary [32]. In line with this, we have recently suggested that the electrostatic potential profile, [VS(r)], obtained at contours of constant electron density, can be used to rationalize the catalytic activity of Au nanoparticles (NPs) of 0.5–3 nm sizes [3]. We have also found that, besides Au NPs, VS(r) can be used to characterize the interaction behavior of NPs of the other d10s1-valence elements, i.e., Ag and Cu [4,5]. By comparing the adsorption behavior of the H2O probe molecule with the surface electrostatic potential profiles (computed with hybrid KS–DFT) of the abovementioned group 8–11 TM13 nanoclusters, we will demonstrate that the positions of VS,max (σ-holes) and VS,min largely dictate the position and adsorption mode of H2O. In addition, we will compare the information obtained by the VS(r) to that of the local electron attachment energy, E(r) (vide infra) [33]. This quantity contains information, not only about the electrostatic contribution to an interaction, but also on the charge-transfer–polarization effects. When evaluated on an isodensity surface, E(r) is denoted ES(r) and has, similar to VS(r), been found to be a useful guide in the analysis of Au, Ag and Cu nanocluster interactions, [4] but also for characterizing electrophilicity and the Lewis acidity of organic molecules [33,34].
2. Theory
The electrostatic potential [V(r)] at a position r of a polyatomic system can be obtained by experimental [35,36] as well as computational methods. V(r) is rigorously defined via [2]
ZA and RA are the charge and spatial position of A, the nuclei of the system, while ρ(r’) is the total electronic density at position r’. For the study of interaction properties, V(r) is commonly evaluated on an isodensity contour surface of 0.001 a.u. and denoted VS(r). Maxima in VS(r), i.e., VS,max, indicate sites susceptible to interactions with nucleophiles (Lewis basis), e.g., the H2O molecule when interacting via its oxygen electron lone pairs. Correspondingly, minima in VS(r), i.e., VS,min, indicate sites prone to interaction with electrophiles (Lewis acids). VS(r) has been employed extensively in the study of molecular interactions including hydrogen and halogen bonding, biomolecular recognition interaction, estimations of pKA and molecular reactivity [2].
Whereas V(r) reflects the electrostatic character of an interaction, the local electron attachment energy, E(r)], is able to capture both the electrostatics and charge-transfer–polarization components of an interaction (see below) and can thus be used complementary to V(r). In the general case, E(r) = EE0(r) is obtained by summarizing overall virtual (spin) orbitals from LUMO up to a given cut-off level, E0, via [33]
Here ρi(r) and εi are the local density and eigenvalue of the ith virtual orbital. Within the generalized Kohn–Sham DFT (GKSDFT), it follows directly from Janak’s theorem (dEtot/dni = εi, Etot = total energy) [37], that E0 = 0 is a sensible choice. This is due to the fact that, if we assume a frozen orbital picture, only orbitals with εi < 0 will bind an electron. Hence, we define E(r) = EE0=0(r) as
Equation (3) bears resemblance to the local electron affinity property [EAL(r)] of Clark and co-workers [38,39]; the two quantities differ in the use of the E0 cut-off in E(r), whereas no cut-off is used in the evaluation of EAL(r), and in the normalization by the total virtual density in EAL(r), while E(r) is normalized by the total occupied electron density. Besides the purely physical arguments for only accounting for bound one-electron states (i.e., εi < 0) in E(r), the introduction of the energy offset greatly reduces the sensitivity of the property on the basis set size. Furthermore, the use of the unoccupied density in the denominator when evaluating EAL(r) incorrectly leads to the assignment of high reactivity to regions of low virtual density.
The E(r) quantity can, in analogy to its nucleophilic counterpart Ī(r) (the average local ionization energy [40,41]), be decomposed into contributions from the electrostatic potential, the kinetic energy density ti(r) and the exchange–correlation potential [VXC(r)] by [33,42]
where ti(r) = −½ψi*(r)∇2ψi(r). In Equation (4), the ti(r) term is the only one that directly depends on the functional forms of the virtual orbitals. This term gives the charge-transfer–polarization contribution to the E(r) quantity, whereas, when E(r) is determined on an isodensity contour (i.e., ES(r)), VXC(r) is approximately constant [33]. Minima in ES(r) are denoted ES,min and can be used to rationalize the electrophilic (Lewis acidic) behavior of Au, Ag, and Cu nanoparticles [4], as well as for characterizing halogen bonding and the local reactivity of aromatic and conjugated electrophilic organic molecules [33,34].
3. Computational Details
The TM nanoclusters were studied in vacuo using hydrid DFT calculations via the PBE0 exchange–correlation functional [11], augmented with Grimme’s D3 dispersion corrections [43], and employing Becke-Johnson damping [44]. The initial geometries for the Au13, Cu13, Pt13, Pt7Cu6, Pd13, Co13, Ir13, Rh13, and Ru13 TM nanoclusters were taken from documented low-energy structures (Figure 2) [14,15,16,17,18,19,20,21,22,23]. These were reoptimized under symmetry constraints in the Turbomole 6.4 software package [13] using the Def2–TVZP basis set; the Def2 basis set family of Ahlrichs and co-workers [12] employs effective core potentials (ECPs) for the 4d and 5d, but not for the 3d metals. The optimizations were repeated for all spin-states going from singlet (or doublet) up to tridecatet (or dodecatet). Co13 is an exception where a 2S + 1 = 28 spin-state has been reported as the ground state, which could be corroborated herein [14,18]. The identified ground states (lowest-energy spin-states), reported in Table 1, of all clusters were used in the continued study; see the discussion in the supplementary material for details (Section S1 and Table S2). Evaluation of the VS(r) and ES(r) quantities were performed at the 0.001 a.u. isodensity contours employing the in-house HS95 program (T. Brinck) and visualized using the UCSF Chimera software [45]. The evaluations were based on Kohn–Sham orbitals obtained from calculations performed in the Gaussian 09 program suite [46] using the Def2–TZVP(−fg) basis set at the optimized geometries. In separate calculations, water molecules were placed O-down at the identified VS,max sites of the TM nanoclusters. These structures were optimized with the Orca 3.0.2 program [47] using the RIJCOSX-approximation [48] and the Def2–TVZP basis set. The TM nanocluster atoms were constrained at their previously optimized positions. Final energies were determined using the Def2–TVZPP basis set without the RIJCOSX-approximations in both the Gaussian 09 and Orca 3.0.2 programs, yielding essentially identical results. All final electronic configurations were checked for internal (e.g., symmetry reduction) and external instabilities by the methods discussed in the references [49,50]. From the above, site-specific H2O interaction energies (ΔEint) could be determined by
where ETM-H2O, ETM, and EH2O correspond to the electronic energies of the H2O–TM nanocluster adduct, the bare TM nanocluster, and free H2O molecule, respectively. Note that neither zero-point nor any other thermochemical correction has been included in the interaction energy calculations. The valence s-, p- and d-occupations of the TM nanoclusters were studied by natural bond orbital (NBO) analysis using the NBO version 3.1 implementation in Gaussian 09 [51].
ΔEint = ETM-H2O − (ETM + EH2O),
4. Results and Discussion
In this part, we will examine the different kinds of σ-holes that emerge on TM nanoclusters, when to expect them and how these influence the local Lewis acidity (and basicity) of the cluster.
4.1. Exemplifying the Origin of the TM σs-Holes and σd-Holes—The TM2 and TM8 of Ir, Pt and Au
The valence occupation of the neutral compounds of the elements of the Cu-group (group 11) is approximately d10s1. Thus, their VS(r) profiles can be understood in terms of the p-mixed s-occupation [3,4]. For the TM elements to the left of the Cu-group in the periodic table, the occupation of the valence states is changed; especially the d-orbitals are monotonically emptied and consequently a variety of different spin-states become attainable. This affects the electrostatic potential profile of the corresponding TM NPs directly, by changing the electronic configuration, and indirectly by altering the favored geometrical structure [14]. The cubic octamers of Au, Pt and Ir are used as examples below to demonstrate the variations in the VS(r) profile with the d-occupation (Figure 3).
An NBO analysis of the cubic Au8 (singlet) cluster indeed suggests that it has approximately fully occupied 5d-orbitals and partially filled 6s-orbitals (NBO valence occupation: 5d9.926s0.866p0.22). As expected, the cubic Au8 (singlet) display VS,max at the corner sites. Although the cubic structure is not stable for Au8, it relaxes to a structure with Td symmetry (Figure 3) that still display VS,max at corner sites. It is worth noting at this point that the location of the σs-holes of Au8 at positions deviant from the extensions of the TM–TM bonds suggest that they may not be proper σ-holes; the VS,max are positioned at angles deviant from straight (180°) or right (90°) with respect to the σ-bonds of the cluster. This may instead motivate the coining of the term pseudo δ-hole (in analogy with the pseudo π-holes of planar structures [52]). However, we argue that the introduction of a pseudo δ-hole is unnecessary in this case and that the proper notation for the VS,max of Au8 (and similarly, VS,max in the continuation of this study) are σs-holes, since the positions of the σ-holes are located at extensions of the joint σs-orbital overlap of multiple bonds.
The cubic Oh structure is stable for both the Pt8 (nonet) and Ir8 (tridecatet) clusters. For Pt8, VS,min are created at the interatomic hollow and bridge sites but there are no VS,max on top of the corner atoms. Instead VS,max are present at three points at the sides of the corner atoms. These points correspond to the unoccupied positions of an octahedral bonding pattern. The positions of the VS,max also coincide with the expected extensions of the eg (dz2 and dx2−y2) orbitals of such an octahedral symmetry, and hence to the extensions of the σ-bonds created by the d-orbital overlap in the system. These VS,max are clear examples of σd-holes. We shall find, further on, that the local bonding symmetry is important for the creation of the localized and directional σd-holes. For Pt8, the nonet spin-state means that each atom has a magnetic moment of 1. The partially occupied orbitals of Pt8 are primarily comprised of mixed dx2−y2- and dz2-orbitals (NBO valence occupation: 5d9.046s0.756p0.21 with 5dxy1.975dxz1.975dyz1.975dx2−y21.565dz21.56). The corresponding average atomic magnetic moment of Ir8 is 1.5 with a clear mixing of 5d orbitals of all different angular momentums, as well as 6s (and 6p) orbitals in the partially occupied orbitals of highest energy. Due to this electronic configuration, the VS(r) profile is the result of an overlap between, on the one hand, the localized σd-holes created by cluster orbitals comprising large dz2 and dx2−y2 orbital contributions, and, on the other hand, diffuse σd-holes that superficially resemble σs-holes. The latter originate from d-orbitals of other angular momenta than dz2 and dx2−y2 (NBO valence occupation: 5d7.976s0.756p0.29 with 5dxy1.655dxz1.655dyz1.655dx2−y21.515dz21.51). This gives rise to the triangular shaped VS,max at the corner atoms of the cubic Oh Ir8 nanocluster. The resulting σ-holes can be seen as mixed σd-holes, or, alternatively, as σd-holes masked by pseudo σs-holes. We furthermore note that the cubic framework of the TM8 clusters greatly facilitates the analysis of the d-orbital angular momentum contributions, which will not be possible for the less symmetric TM13 clusters below.
4.2. Local Lewis Acidic (and Basic) Characteristics of the TM13 Nanoclusters
The by and large hypothetical TM8 compounds above are illustrative examples but may or may not be representative of nanoclusters active in real applications. For the purpose of evaluating the expected propensity of σs- and σd-holes on “real” compounds, we have studied a series of neutrally charged low-energy TM13 nanoclusters, TM = Co, Co, Au, Pt, Pd, Ir, Rh, Ru (Figure 2). In broad terms, the most favorable atomic conformation, magnetic spin-state and electronic valence configuration vary largely for clusters of different TM elements. A common feature is that as the size of the cluster grows, the favorable structure converges towards the compact, close-packed, bulk structure of the corresponding metal [53,54,55,56]. However, at the (sub) nanometer scale, it has been established that clusters of e.g., Rh, Ru, and Ir, adopt an open cubic structure, whereas 3d clusters of Cu, Au and Pd are often found to be compact and possibly disordered [14,57]. There is, furthermore, a preference for 3d clusters to adopt compact atomic configurations while 4d and 5d clusters are generally more open [14]. The TM13 cluster structures of this study will be further discussed below.
Table 1 summarizes the general features of the TM13 nanocluster: their electronic structure, ground-state spin multiplicity, electron valence configuration (as determined by NBO analysis [51]), as well as the number of unique atomic sites, and unique VS,max and ES,min. The VS(r) and ES(r) profiles of the nanoclusters are displayed at 0.001 a.u. isodensity contours in Figure 4. As can be seen in the figure, both σs- and σd-holes appear on the TM clusters. In general, the VS(r) profiles show areas of high electrostatic potential (i.e., VS,max) on top of atomic sites, whereas low electrostatic potential areas (i.e., VS,min) are located between atoms at bridge or hollow sites. Thus, at a first approach, it is expected that electron-donating molecules (e.g., H2O via the O lone-pairs) preferentially adsorb to the atomic on-top sites, whereas electron-accepting molecules (e.g., H2O via the H atoms) preferentially interact at hollow or bridge sites. VS,max of large magnitude are often found at atoms of low coordination. The ES(r) profiles, which can only be used to locate Lewis acidic and not Lewis basic sites, display local minima that largely coincide with the VS,max. Differences will be discussed in the following sections for each individual nanocluster. The effect of VS,max and ES,min on the adsorption behavior of H2O will also be discussed further below. Figure 5 show the most favorable sites of interaction for all nanoclusters. More details on the H2O–TM interactions are given further below and in the supplementary material (Table S4).
4.2.1. Au13, Pt13 and Ir13
The low-energy TM13 clusters of Au, Pt and Ir adopt quite dissimilar structures; Ir13 arrange in an open double cubic Ir12 atomic configuration with a 13th capping Ir ad-atom positioned at a bridge site of one of the elongated sides (see Figure 2) [14]. The Pt13 structure cannot be easily categorized, but comprises atoms with a relatively open arrangement [14]. Au13 has a slightly more compact structure based on a prism Au6 core with capping Au atoms arranged around it [19,21,22,23]. It should, at this point, be noted that 3D Au13 nanoclusters are only stable with respect to 2D clusters if valence electron spin-orbit effects are accounted for [14]. Although such effects are not explicitly included in the present study, we have used the putative global 3D minima structure of Au13 that, presumably, is only metastable at the considered level of theory.
Concerning the electronic structure of Au13, Pt13 and Ir13, NBO analysis [51] suggests that the 6s and 6p occupations vary only slightly over the three nanoclusters. The largest difference instead lies within the 5d orbitals where the d-occupation per atom is approximately d10, d9 and d8 for Au13 (doublet), Pt13 (triplet) and Ir13 (quartet), see Table 1. Similarly to the case of the TM8 example structures in Section 4.1, the Au13, Pt13 and Ir13 display very different VS(r) profiles (Figure 4). The principles extracted from the cubic examples are, by and large, manifested also on the TM13 clusters; on Au13, dispersed areas of high electrostatic potential are presented at the tips (on-top sites) of the Au atoms, amounting to one VS,max per atom. These VS,max are typical σs-holes arising mainly from the partially occupied 6s orbitals. On the other hand, both Pt13 and Ir13, favor the formation of localized VS,max that are positioned along the extension of atomic bonds instead of at the tip of an atomic on-top site. Compared to Au13, this gives rise to a larger number of unique VS,max on Pt13 and Ir13 with up to three VS,max per atomic site. These localized VS,max are to a large extent the product of the unsaturated d-orbitals of the Ir13 and Pt13 and are typical examples of σd-holes. Only two clear cases of σs-holes are identified on the Pt13 and Ir13 clusters. One is found above the Pt(2) site that is surrounded by a large area of low potential. The other σs-hole is found at the tip of the ad-atom site of Ir13. For Pt13, areas that superficially appear similar to σs-holes can be identified at the atoms 4, 8, 10 and 13. VS,max for all of these σ-holes are, however, located at the extension of TM–TM bonds and arranged according to an σd-hole pattern.
Analyzing the profile of the ES(r) in a similar fashion we find that ES,min sites, i.e., sites susceptible to interactions with electron donors, are located at all the observed VS,max on Au13, Pt13, and Ir13 except for the Au(12) site where no ES,min could be identified.
H2O molecules positioned at all VS,max (and hence ES,min) relaxes O-down to sites close to the initial starting positions, i.e., all unique σ-holes correspond to a unique adsorption site (see also discussion under Section 4.3 and reference [3]). For Au13, three adsorption positions deviate slightly from the VS,max position, namely the atomic sites 7, 10 and 12, where H2O moves towards a side-on position located in the linear extension of an Au–Au bond. The H2O adsorption data for Au13 were also discussed in reference [3] and found to correlate closely with CO adsorption. Figure 5 shows the structure of the favored adsorption site for all nanoclusters. Table 2 gives the corresponding adsorption energies, distances and magnitude of the local VS,max and ES,min. We find that there is a clear tendency for H2O to prefer the sites with larger magnitudes of VS,max (and ES,min). Linear relationships between VS,max (and ES,min) and H2O interaction energies are discussed further under Section 4.3.
We also investigated H2O adsorption towards the areas of low electrostatic potential. VS,min sites are generally found at bridge or hollow sites between atoms. For Au13, the most significant VS,min is located at the three-fold hollow site between atoms 1, 2 and 3 (h1-2-3, equivalent to the h5-5-6 position) above the central prism motif. Pt13 has its lowest VS,min in the four-fold hollow h1-7-9-12 site, and Ir13 at the three-fold hollow h2-6-7 site in proximity to the Ir(6) ad-atom. For both Au13 and Pt13, H2O preferentially adsorbs H-down (ΔEint = −0.23 and −0.29 eV for Au13 and Pt13) towards the abovementioned sites, whereas for Ir13, no H-down adsorption mode could be identified but instead H2O migrated to an adjacent VS,max and adsorbed O-down. A possible explanation for this is the on average stronger O-down interaction between Ir and H2O compared to e.g., Au; on Ir13 the flip from H-down to O-down would thus be more beneficial than for Au13.
4.2.2. Rh13 and Ru13
The Rh13 and Ru13 clusters’ structures arrange in a double cubic TM12 atomic configuration similar to that of Ir13. The 13th TM ad-atom (the capping atom) is, however, positioned at a four-fold hollow site at the extended side for Ru13 and Rh13, instead of at the bridge site position of Ir13 [14]. For Ru13, the cube motif underneath the ad-atom is distorted to form a parallelepiped structure (Figure 4). Rh13 (doublet) belongs to the same group of the periodic table (group 9) as Ir13, but its electronic valence structure is clearly redistributed as compared to Ir13: NBO analysis suggests a much lower s- and p-occupation and an increased d-occupation of d8.3 (Ir13: d7.97). Ru13 (tridecatet) shows a similar electronic valence distribution as Rh13, but with a d7.22-occupation. An analogous analysis for Rh13 in the decatet spin-state (almost degenerate to the doublet state) is provided in the supplementary material (Section S3, Figure S1, and Tables S3, S5 and S6). This also includes a discussion of the possibly multi-configurational character of Rh13 (and Ir13), and the usage of spin-contamination correction schemes.
The electronic structures described above affect the electrostatic potential of Rh13 and Ru13 compounds compared to the closely related Ir13 cluster. From Figure 4 we can conclude that the VS(r) profiles of the Rh13 and Ru13 clusters have both similarities and differences compared to the Ir13 cluster; for Rh13, the overall appearance of the VS(r) profile suggest that σd-holes are located at the extensions of all Rh–Rh bonds, similar to Ir13. However, true VS,max could only be identified at the capping atom, as well as on all six sites of the extended cubic side perpendicular to the position of the capping atom with respect to the cubic structure. Could this be an effect of the larger d-occupation of Rh13 compared to Ir13, or is it a geometrical effect of the position of the capping atom? While the position of the capping atom could certainly induce some electronic redistribution, the largest effect of its position is probably the split of the σ-hole of the capping atom into two σd-holes (σs-hole on Ir13). The relatively large d-occupation of Rh13 is, on the other hand likely to affect the shape of the σ-holes. At full d10-occupation (e.g., Au), as outlined above, we only expect σs-holes. Hence the increased d-occupation and reduced s-occupation of Rh13 is likely to partly quench the formation of σd-holes.
As concerning the ES(r) profile of Rh13 it contains σd-holes to a larger degree than VS(r) with ES,min located at the extension of all but the 6–3 and 12–9 bonds. There are in fact twice as many ES,min as VS,max, suggesting that there remains a driving force (including also charge-transfer–polarization effects) for interactions along the extension of all Rh–Rh bonds.
For Ru13 the positions of the identified VS,max are overlapped almost perfectly by ES,min sites. However, and similarly to the case of Rh13, Ru13 displays a larger number of ES,min compared to VS,max. A distinct difference compared to Rh13 is, however, that there is a larger amount of σs-holes on Ru13. For instance, the σ-hole located at the capping atom is a σs-hole for Ru13, whereas it is a σd-hole for Rh13. Characteristic σs-holes are also found at atoms 5 and 7. In addition, the σd-holes of the atoms 1, 3, 9, 10, 11 and 12 are clearly distorted from the ideal Ru–Ru bond extension, suggesting a mixed σs/d-hole, or alternatively, that the σd-holes are to some degree masked by overlapping σs-holes. In comparison to Rh13, Ru13 displays σ-holes in all directions.
H2O adsorption sites (O-down) were found on the TM13 clusters with only moderate deviations from the positions of the σ-holes for both Rh13 and Ru13 (see further discussion under Section 4.3). Two noteworthy exceptions are adsorption to the 5(7) and 9(10) positions of Ru13 where H2O moves from the σd position along the TM–TM bond extensions and instead resides at a typical σs site at an Ru–Ru–O angle significantly deviating from 90° or 180°. For Rh13, the most favorable position of adsorption corresponds to the site with the highest VS,max (atom 1 and 7), whereas for Ru13 the strongest interaction is at position 1 (and 3), which correspond to the second highest VS,max. The most favored adsorption sites are thus not the capping atoms, which can be explained by a relatively large coordination of these sites, with four neighbors compared to only three for the cubic corner sites (cf. Ir13 where the capping atom only has a coordination number of two and is the favored site of H2O adsorption). The global VS,min of Ru13 is found at the four-fold hollow h2-4-9-10 site, and for Rh13 at the three-fold hollow h5-10-13 site, which alternatively can be described as a low electrostatic potential ring around the capping atom. Similarly to the case of Ir13, H-down adsorption of H2O to Rh13 and Ru13 converges to the O-down adsorption modes.
4.2.3. Cu13 and Pt7Cu6
Cu13 and Au13 have many characteristics in common; both clusters adopt doublet spin-states, approximately fully occupied d-orbitals, and are organized in compact atomic configurations. The structure of Cu13 resembles a distorted biplanar hexagonal structure (see also Co13 below) [14]. Analogous to Au13, and in line with the conclusions of ref. [4], the VS(r) profile of Cu13 displays a delocalized σs-hole on top of each atomic site, with areas of low VS(r) located in between the atoms. This profile reflects the dominance of the partially occupied s-orbitals in the VS(r). As for Au13, the positions of the ES,min sites of Cu13 coincide well with the VS,max. H2O adsorbs O-down to the VS,max (and ES,min) sites with the optimized position of the interacting H2O deviating little from the VS,max (and ES,min) positions (see also Section 4.3). H-down adsorption (ΔEint = −0.27 eV) takes place at the VS,min sites, where the most prominent VS,min corresponds to the three-fold hollow h5-10-12 site—this adsorption mode is in line with previous reports of H2O interactions with Cu nanoclusters [5,58].
The low-energy structure of Pt7Cu6 (triplet) is compact and disordered [15]. The comparison between Cu13, Pt13 and Pt7Cu6 gives rise to several questions with regards to the VS(r). For instance: will σ-holes occur on both Pt and Cu atoms, or will the electrostatic potential be polarized to one atomic type; and if both atom types have associated σ-holes, will the preference of σd-holes for Pt and σs-holes for Cu be mirrored in the alloy nanocluster?
The average electronic valence configuration of Pt7Cu6 is approximately a mean value of that of the Cu13 and Pt13 clusters. Notably however, the NBO analysis implies that some electron density has been transferred from the s(p)-orbitals to the d-orbitals (Table 1). In particular, the analysis suggests that the occupation of the d-orbitals of Pt is increased at the expense of, primarily, a reduced Cu s-occupation. This is reflected in the detailed resolution of the VS(r) of Pt7Cu6. Whereas all Cu sites still display one single σs-hole on top of each atomic site—expected since the s-occupation still dominates the bonding of the Cu atoms—the characteristics of the Pt atoms are slightly modified compared to the pure Pt cluster. For Pt, and despite the average increase of the d-occupation, the Pt atoms do maintain their general preference for formation of σd-holes along the extension of Pt–Pt bonds. However, when there are no Pt neighbors, as is the case for e.g., the Pt(8) atom, σs-holes are formed also on the Pt atoms. The Pt(8) is in addition the Pt atom that possesses the highest d-occupation (d9.55), and hence electronically shows closest resemblance to Cu. Another notable feature is that only one σ-hole is identified per Pt atom, despite the fact that there is a larger number of possible sites along Pt–Pt extensions. This is partly attributed to the local bonding symmetry of the Pt atoms; in e.g., Pt8 or Pt13 the symmetric arrangement of atoms with (close to) linear or perpendicular angels allows for the distinction of different σd-holes. In Pt7Cu6, on the other hand, the disordered cluster structure prevents formation of VS,max along the extension of all Pt–Pt bonds. The overlap of different contributions to the VS,max further leads to the σd-holes being slightly distorted from the linear Pt–Pt…σd angle. In total, the Pt7Cu6 cluster has 12 σ-holes, one per atom (regardless if it is Cu or Pt). The exception is Pt(7), which does not have any VS,max. Instead, Pt(7) is surrounded by a large area of low electrostatic potential. One can further conclude that it is both the atomic arrangement and the atom type that determine the magnitude of the local VS(r); although the Pt atoms of the Pt7Cu6 cluster in general are associated with larger VS,max than Cu, the overall VS(r) maximum is located at a Cu atom.
Regarding the ES(r), we observe eleven ES,min but only seven coincide with VS,max. The location of the ES,min and VS,max overlap for all Pt atoms (except for the Pt(7) atom, vide supra), as well as for the Cu(1) site that display the ES,min and VS,max with the largest amplitude. For the remaining Cu atoms, ES,min are identified at bridge sites, whereas VS,max are located at atomic on-top sites. Upon adsorption of H2O to the atomic sites, it converges O-down to the σ-holes and not to the ES,min bridge sites of Cu. For about half of the sites, including both Cu and Pt atoms, the H2O does, however, show some preference for positions further along the extension of TM–TM bonds—i.e., potential σd-hole sites in close proximity to the original σs-hole. This includes both Cu and Pt sites.
H2O adsorbs H-down in proximity to the Pt(7) site with a ΔEint of −0.30 eV.
4.2.4. Pd13 and Co13
The low-energy structures of Co13 and Pd13 are closely related [14]; Co13 arranges in a C3 hexagonal bilayer structure that is constructed from two overlapping, close-packed hexagonal layers bearing resemblance to the bulk hexagonal close-packing (hcp) of Co. One of the overlapping layers has a triangular shape, while the other is arranged in a honeycomb structure. Pd13 adapts to a distorted hexagonal bilayer structure, similar to that of Cu13. On the average, Co13 has a somewhat decreased d8 occupation (NBO: d7.82), whereas for Pd13 a large redistribution from the s(p) orbitals leads to a notably large d-occupation of d9.34. Compared to Pt13, where Pt is placed just below Pd in the periodic table, the Pd13 cluster has a significantly different VS(r) profile with one VS,max per atom placed on top of the atomic sites. The exception is the 10(13) site that has a split VS,max resembling two σd-holes. Overall Pd13 has an σs-hole-dominated VS(r), whereas the VS(r) of Pt13 is dominated by σd-holes. This can be understood by the increased d-occupation of Pd13 compared to Pt13. VS,max and ES,min of Pd13 coincide well for the five sites with highest VS,max, but ES,min have a larger tendency to form σd-hole equivalents along the extensions of Pd–Pd bonds. VS,max and ES,min are located at different positions for the 6(12) site, and no ES,min could be identified at atom 3.
H2O adsorbs on top and O-down to all VS,max of Pd13 with a tendency to move towards the ES,min position of atomic site 4(5). The average deviation of the O positing of H2O compared to the VS,max is small (dσ-O,ave = 0.67Å, see Section 4.3). The most significant VS,min of Pd13 is located at the hollow site of atoms 2(7), 1(9) and 10(13), at which H2O adsorbs H-down with an ΔEint of −0.29 eV.
For Co13, the Cs symmetry results in only four unique atomic on-top adsorption sites: the triangular and honeycomb corner atoms, as well as the triangular edges and the hcp site on top of the honeycomb. The latter is associated with negative electrostatic potential and H2O is repelled from this site. Overall, all attempts to identify H-down structures converged to O-down adsorption to the corner and edge sites. The VS,max are all of σs-type and H2O adsorbs O-down to the three unique, positive σs-holes with small deviation of the optimized H2O position from the location of the σs-hole site (see Section 4.3). ES,min are identified at the corner and edge σs-hole sites of the triangular side, but for the honeycomb side the ES,min are located at the bridge sites.
4.3. General Discussion
From the above discussion, we can conclude on some general features of σs- and σd-holes. Diffuse and weakly directional σs-holes are created when there is an electron deficiency in the s-orbitals. Such deficiencies are present on all the TM nanoclusters, but may in some cases be weak in comparison to the effects of electron deficiencies in the d-orbitals. In such cases, the electron polarization within the d-orbitals leads to localized and directional σd-holes if certain criteria are fulfilled:
- Partially occupied d-orbitals
- Favorable electronic configuration (e.g., spin-state with low degree of spd-hybridization)
- Locally symmetric bonding arrangement (e.g., cubic)
The above should be seen in the light of the limited study in the current contribution and future work will be directed towards further understanding of the principles behind the creation of σs- and σd-holes. We found, however, that in cases where any one of the above criteria is not fulfilled, other types of σ-holes dominate over the prototypical σd-hole. If the d-orbitals are fully occupied (e.g., Au13 or Cu13), no σd-holes will be present but instead σs-holes will appear at the atomic on-top sites located at the corners of the nanoclusters. If the clusters have unsaturated d-orbitals but the overall d-occupation is large compared to the ideal occupation (e.g., d9 in Pt or d8 in Ir) ―for instance due to a large redistribution of s-electrons via s(p)d-hybridization―the σd-holes will be fully or partially quenched resulting in σs-holes or mixed σs/d-holes. Examples of this are Ru13, Rh13, and Pd13. In addition, if the local bonding symmetry is low with TM–TM bond angles deviating significantly from straight or right angles, σd-holes may, to a varying degree, be masked by the overlap of the diffuse σs-holes or by other σd-holes. This effectively yields (pseudo) σs-hole or mixed σs/d-hole dominated VS(r) profiles, e.g., Pt7Cu6 or the capping atoms of Ru13 and Ir13.
Overall, the locations of the various σ-holes coincide well with the sites of O-down H2O interactions. As a measure of this, Table 3 includes the average distance (dσ-O,ave) from the σ-holes to the optimized position of the O-atom of H2O for all of the TM13 nanoclusters. The dσ-O,ave are generally small and in the order of 0.37–0.91 Å. Some few exceptions are outlined in Section 4.2.2, Section 4.2.3 and Section 4.2.4. Additionally, it should be noted that the dσ-O,ave distance includes the difference between the position of the 0.001 isodensity surface relative to the TM atom centers (approximately 2.0–2.3 Å, Table 3) and the binding distance of the H2O molecule that adsorbs at slightly larger distances (2.2–2.6 Å). In general, there is a trend that the dσ-O,ave deviations for the σd-holes are smaller than for the σs-holes, in line with the proposed larger directionality of the σd-holes compared to the σs-holes. The σd-holes display, on the average, larger ΔEint (−0.54 eV) but reduced VS,max (11.5 kcal/mol) compared to the σs-holes (average ΔEint = −0.45 eV and VS,max = 13.0 kcal/mol). In addition, the maximum VS,max and strongest ΔEint are clearly larger for σs-holes (VS,max = 35.4 kcal/mol and ΔEint = −1.00 eV) compared to σd-holes (VS,max = 25.4 kcal/mol and ΔEint = −0.81 eV).
The ES(r) and VS(r) profiles show a strong mutual correlation where ES,min and VS,max sites generally overlap well, with some notable exceptions (see the discussion in Section 4.2.2, Section 4.2.3 and Section 4.2.4). The mutual correlation is not surprising bearing in mind that the ES(r) property includes a contribution from VS(r) (cf. Equation (4)). From a computational point of view this is an attractive feature of ES(r), because the computation of VS(r) is significantly more time-consuming than that of ES(r). The two quantities do, however, to a certain extent yield different and complementary information; ES(r) provides, besides information on electrostatics, a measure of the charge-transfer and polarization effects. Table 3 includes R2 (coefficient of determination) values for the correlation between the site resolved H2O interaction energies and the local ES,min and VS,max. As can be seen, there are clear correlations for both ES,min and VS,max, especially for the Au, Cu and Pt compounds. Pd13 shows weak correlations, while for Ru13, Ir13 and Rh13 the correlations are poor. Some insight into why certain trends are strong and others weak can be gained from the Ir13 case. Here there are 17 unique adsorption sites. By including only the eight sites with the strongest VS,max, a correlation of R2 = 0.90 can be found between VS,max and ΔEint. For the sites with weaker VS,max one can thus argue that factors other than electrostatics become dominant for the interaction.
The difficulties for VS,max and ES,min for ranking reactivity are most pronounced for the particles that have stronger interactions as well as for the particles that have partially occupied d-states (with the possible exception of Pt). Since ES(r) and VS(r) are ground-state properties, it is reasonable that a strong, partly covalent interaction (e.g., Ru13 or Rh13) that is associated with a large redistribution of the electronic configuration is more difficult to describe compared to a weak, non-covalent interaction (e.g., Cu13). The DFT methods are, in addition, known to exhibit difficulties in describing the multi-configurational character of certain TM elements, the exceptions being e.g., Au, Ag and Cu, whereas, as discussed further in the supplementary material (Sections S1 and S3), large spin contaminations are found for Ir13 and, especially, Rh13, indicating possible multi-configurational states. It can, moreover, be noted that the d-band model has also been reported to fail to reproduce adsorption trends for e.g., the Rh13, Ir13 and Pt13 nanoclusters [16].
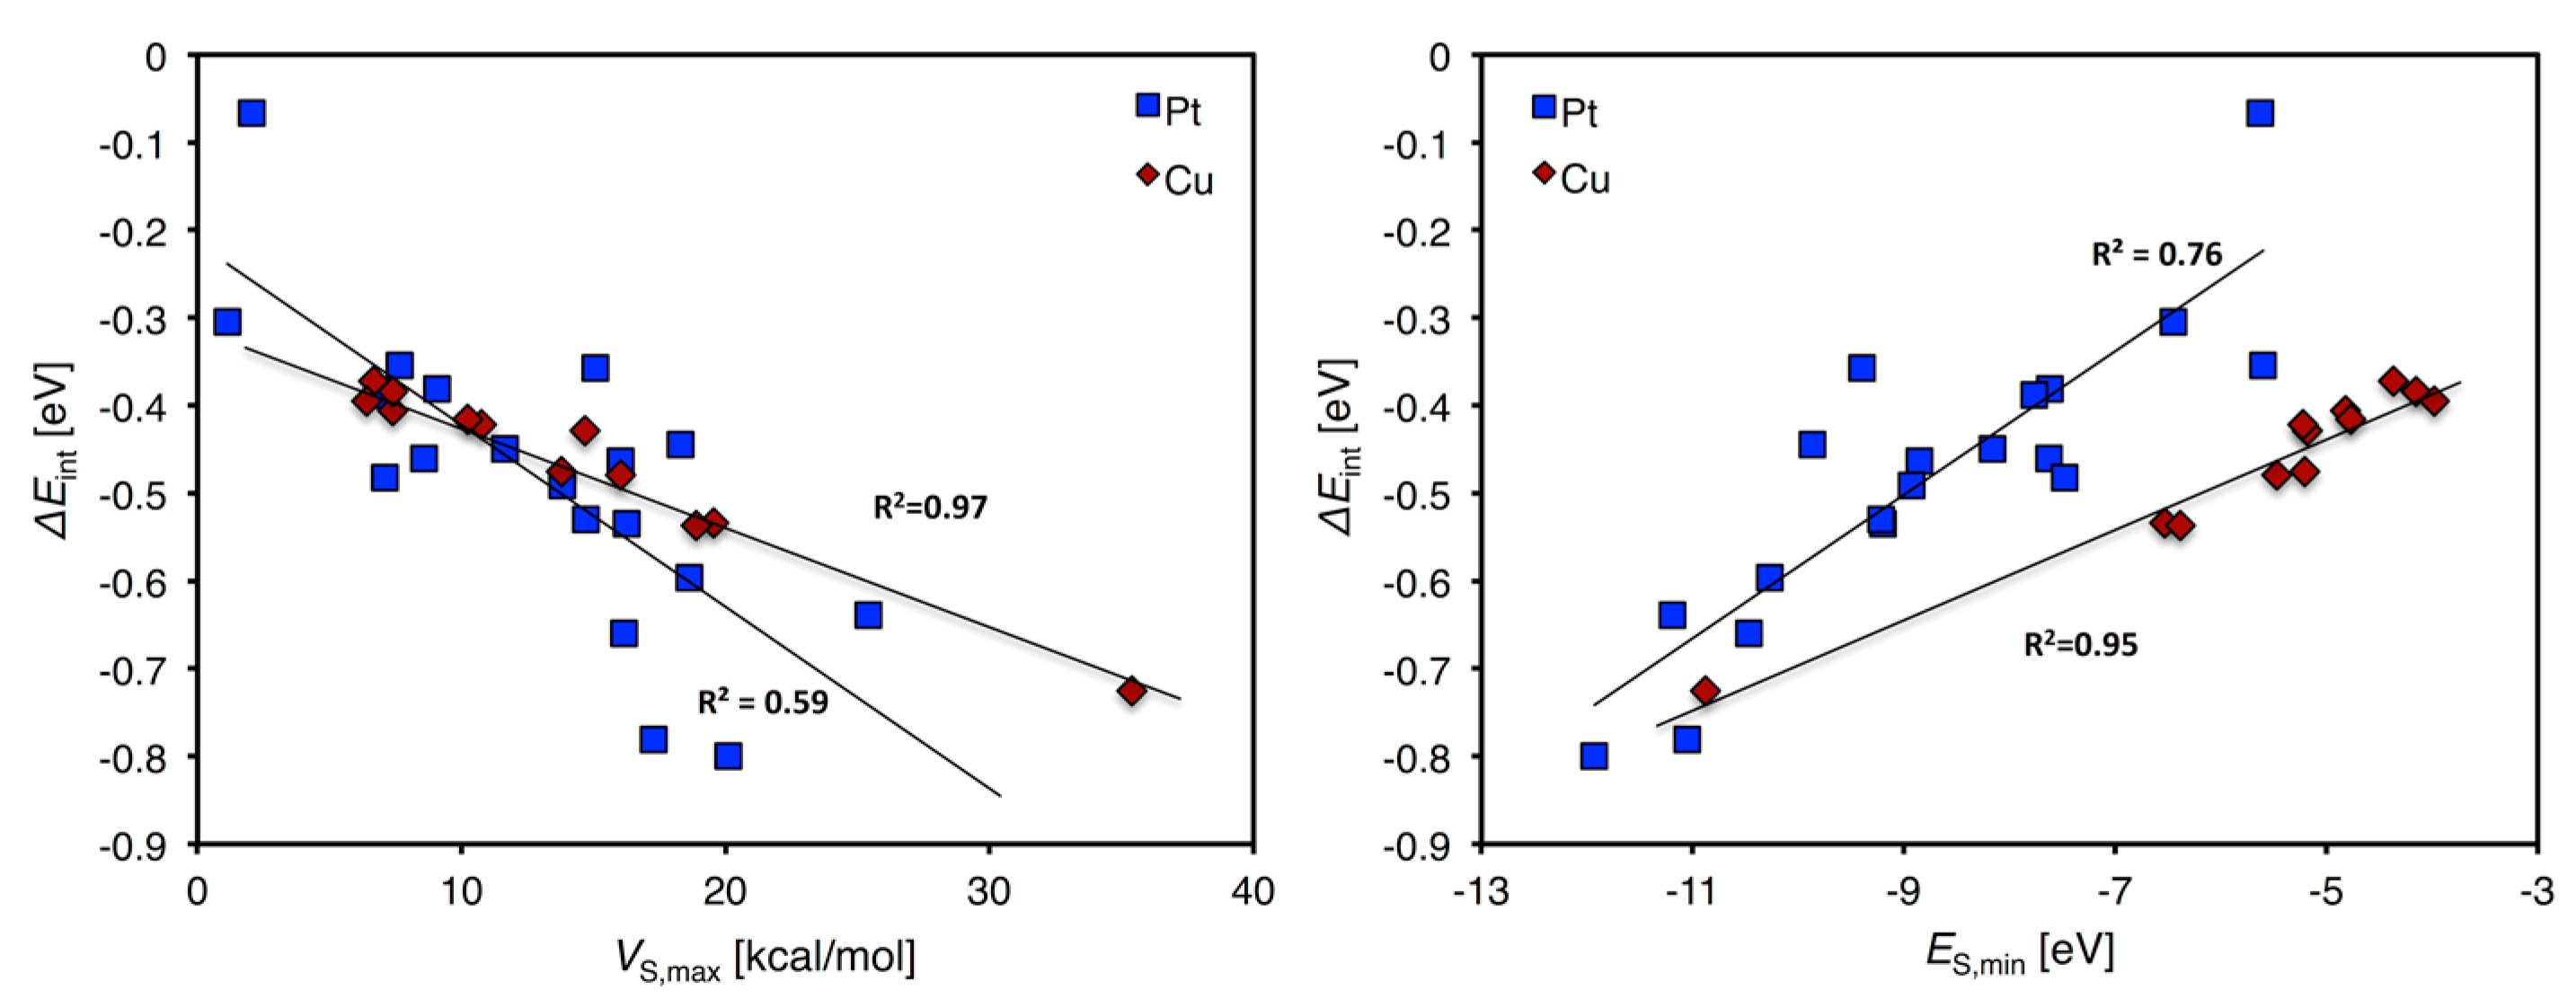
As discussed above, both ES,min and VS,max can successfully be used to rank the adsorption trends of Au13, Pt13, Cu13 and Pt7Cu6. Figure 6 shows as an example the ΔEint of H2O versus ES,min and VS,max resolved for all the combined Cu and Pt atoms of the Pt13, Cu13 and Pt7Cu6 compounds. It illustrates that the adsorption characteristics can be ranked also when including sites from multiple clusters. The trends are strong for Cu and weaker, but still clear, for Pt.
We lastly note that the localized VS,max (σd-holes) of the TM13 nanoclusters bear some resemblance to the concept of the π-holes [59], i.e., VS,max positioned perpendicular to the molecular (here particle) framework. In addition, and in analogy to the σ- and π-hole concept, one could also claim that the reported localized VS,max for some of the nanoclusters are in-fact δ–holes since these appear primarily as a consequence of electron deficiencies in the d-states of the clusters. However, based on the positions of the VS,max along the lateral extensions of the metal–metal bonds, i.e., in the direction of the nanoclusters’ σ-bonding system?either along the extensions of TM–TM σd-bonds or at the focal points (often at atomic on-top sites) of the joint s-orbital states of the cluster?we conclude that the VS,max identified on the TM nanoclusters are best described as σ-holes and that these can be divided into σs- and σd-holes.
5. Conclusions
We have herein discussed different types of maxima in the surface electrostatic potential, VS,max, also known as σ-holes, and their influence on the local Lewis acidity of TM nanoclusters. A new categorization is introduced where σ-holes are denoted σs, σp or σd depending on whether their origin can primarily be traced to the s-, p- or d-occupation. It is demonstrated that highly localized and directional σd-holes appear at the extension of TM–TM bonds when there is partially occupied d-orbitals, a relatively weak s(p)d-hybridization, and locally beneficial bonding symmetry. Under other circumstances, diffuse and weakly directional σs-holes that correspond to the half-filled s-orbitals—or similarly diffuse and mixed σs/d-holes (from the summarized contribution of the valence orbitals formed by the hybridization of s-, [p-] and d-orbitals)—dominate the surface electrostatic potential profile. In addition, the localized σd-holes can be fully or partly masked by the overlap of the diffuse σs-holes if such are present.
By studying a series of different TM13 nanoclusters, we have found, for example, that low-energy clusters of Ir13, Pt13, Rh13, Ru13 and Pt7Cu6 exhibit σd-holes. In contrast, only σs-holes and σs/d-holes are found on the Au13, Cu13, Pd13, and Co13 nanoclusters. No σp-holes were identified on the TM13 structures, but we argue that such holes are found on e.g., singly coordinated halogen atoms.
Regardless of the character of the VS,max (be it σs or σd), the interactions of the TM13 nanoclusters with water are found to be directed by the position of the VS,max with H2O adsorbing O-down at the site of the VS,max. Similarly, we found that areas of low surface electrostatic potential (VS,min) on all but the Ir13, Rh13 and Ru13 nanoclusters gave rise to a H-down adsorption mode of H2O. We furthermore note that the magnitude of the VS,max can be used to rank the interaction energies of H2O O-down adsorption with particularly strong correlations for the d10s1 TM elements as well as for Pt. Similarly, the local electron attachment energy quantity [ES(r)] can be used to identify adsorption sites, minima in ES(r) coincide well with the identified VS,max and H2O adsorption positions with some few exceptions. ES(r) can also be used to rank the H2O interaction energies for especially the d10s1 TM elements, as well as Pt nanoclusters.
Based on the findings of the present study, we predict that both VS(r) and ES(r) quantities will find general use in the study and rationalization of the interaction behavior of TM nanomaterials. We envisage applications in e.g., heterogeneous catalysis, medical therapy, drug delivery systems, nanotoxicity, sorption studies, dissolution and nucleation, as well as in nanoparticle transportation. Future studies should evaluate the applicability of VS(r) and ES(r) to e.g., larger TM and oxide particles, and to surfaces. Furthermore, they should include a thorough benchmark of the applicability of different DFT methods and basis sets.
Supplementary Materials
The following are available online at www.mdpi.com/2073-4352/7/7/222/s1, Figure S1: VS(r), ES(r) and the favored H2O adsorption structure for Rh13 at the decatet spin-state; Table S1: spin multiplicity and <S2> expectation values for the Pt4 and TM8 nanoclusters; Table S2: spin multiplicity and <S2> expectation values for the TM13 nanoclusters; Table S3: spin projection corrected and non-corrected H2O interaction energies for Ir13 and Rh13; Table S4: site-resolved H2O adsorption data, VS,max, and ES,min for all TM13 nanoclusters; Table S5: the number of VS,max, and ES,min as well as the s-, d- and p-occupation for Rh13 at the decatet spin-state; Table S6: site-resolved H2O adsorption data, VS,max, and ES,min for Rh13 at the decatet spin-state; additional computational data for Figure 1 and Figure 3; optimized coordinates; supplementary references [60,61,62,63,64,65,66,67,68,69,70,71,72].
Acknowledgments
Funding from the Swedish Nuclear Fuel and Waste Management Company (SKB) and the KTH CHE Excellence award (JHS) is gratefully acknowledged. The calculations were performed at resources provided by the Swedish National Infrastructure for Computing (SNIC) at the National Supercomputer Centre in Linköping University NSC as well as at the PDC Centre for High Performance Computing (PDC-HPC). A special thanks is directed to Dr. Juarez L. F. Da Silva and Dr. Anderson S. Chaves for providing coordinates of their optimized TM13 nanoclusters.
Author Contributions
Joakim H. Stenlid and Tore Brinck conceived and designed the computational study; Joakim H. Stenlid performed the calculations; Joakim H. Stenlid, Adam Johannes Johansson and Tore Brinck analyzed the data; Joakim H. Stenlid, Adam Johannes Johansson and Tore Brinck wrote the paper.
Conflicts of Interest
The authors declare no conflict of interest.
References and Notes
- Clark, T.; Hennemann, M.; Murray, J.; Politzer, P. Halogen bonding: The σ-hole. J. Mol. Model. 2007, 13, 291–296. [Google Scholar] [CrossRef] [PubMed]
- Murray, J.S.; Politzer, P. The electrostatic potential: An overview. Wiley. Interdiscip. Rev. Comput. Mol. Sci. 2011, 1, 153–163. [Google Scholar] [CrossRef]
- Stenlid, J.H.; Brinck, T. Unpublished work. 2017.
- Stenlid, J.H.; Johansson, A.J.; Brinck, T. Unpublished work. 2017.
- Stenlid, J.H.; Johansson, A.J.; Brinck, T. Searching for the thermodynamic limit—A DFT study of the step-wise water oxidation of the bipyramidal Cu7 cluster. Phys. Chem. Chem. Phys. 2014, 16, 2452–2464. [Google Scholar] [CrossRef] [PubMed]
- Farmanzadeh, D.; Abdollahi, T. Investigation on the chemical active sites of copper nanoclusters as nanocatalyst for the adsorption of acetylene: Calibration of DFT method and basis set. Theor. Chem. Acc. 2016, 135, 1–14. [Google Scholar] [CrossRef]
- Farmanzadeh, D.; Abdollahi, T. A model for the ethylene and acetylene adsorption on the surface of Cun(n = 10–15) nanoclusters: A theoretical study. Appl. Surf. Sci. 2016, 385, 241–248. [Google Scholar] [CrossRef]
- Shields, Z.P.; Murray, J.S.; Politzer, P. Directional tendencies of halogen and hydrogen bonds. Int. J. Quantum Chem. 2010, 110, 2823–2832. [Google Scholar] [CrossRef]
- Politzer, P.; Lane, P.; Concha, M.C.; Ma, Y.; Murray, J.S. An overview of halogen bonding. J. Mol. Model. 2007, 13, 305–311. [Google Scholar] [CrossRef] [PubMed]
- Brinck, T.; Murray, J.S.; Politzer, P. Surface electrostatic potentials of halogenated methanes as indicators of directional intermolecular interactions. Int. J. Quantum Chem. 1992, 44, 57–64. [Google Scholar] [CrossRef]
- Adamo, C.; Barone, V. Toward reliable density functional methods without adjustable parameters: The PBE0 model. J. Chem. Phys. 1999, 110, 6158–6170. [Google Scholar] [CrossRef]
- Weigend, F.; Ahlrichs, R. Balanced basis sets of split valence, triple zeta valence and quadruple zeta valence quality for H to Rn: Design and assessment of accuracy. Phys. Chem. Chem. Phys. 2005, 7, 3297. [Google Scholar] [CrossRef] [PubMed]
- TURBOMOLE V6.4 2012, a Development of University of Karlsruhe and Forschungszentrum Karlsruhe GmbH, 1989–2007, TURBOMOLE GmbH, Since 2007. Available online: http://www.turbomole.com (accessed on 28 March 2017).
- Piotrowski, M.J.; Piquini, P.; Da Silva, J.L.F. Density functional theory investigation of 3d, 4d, and 5d 13-atom metal clusters. Phys. Rev. B 2010, 81, 155446. [Google Scholar] [CrossRef]
- Chaves, A.S.; Piotrowski, M.J.; Guedes-Sobrinho, D.; Da Silva, J.L.F. Theoretical Investigation of the Adsorption Properties of CO, NO, and OH on Monometallic and Bimetallic 13-Atom Clusters: The example of Cu13, Pt7Cu6, and Pt13. J. Phys. Chem. A 2015, 119, 11565–11573. [Google Scholar] [CrossRef] [PubMed]
- Piotrowski, M.J.; Piquini, P.; Zeng, Z.; Da Silva, J.L.F. Adsorption of NO on the Rh13, Pd13, Ir13, and Pt13 clusters: A density functional theory investigation. J. Phys. Chem. C 2012, 116, 20540–20549. [Google Scholar] [CrossRef]
- Li, H.; Zhao, X.; Wei, D.; Li, L.; Li, S. Unexpected odd-even oscillation in the enhanced chemical activities of the Run (n = 2–14) Nanoclusters for H2O adsorption and splitting. J. Phys. Chem. C 2017, 121, 7188–7198. [Google Scholar] [CrossRef]
- Piotrowski, M.J.; Piquini, P.; Cândido, L.; Da Silva, J.L.F. The role of electron localization in the atomic structure of transition-metal 13-atom clusters: the example of Co13, Rh13, and Hf13. Phys. Chem. Chem. Phys. 2011, 13, 17242–17248. [Google Scholar] [CrossRef] [PubMed]
- Beret, E.C.; Ghiringhelli, L.M.; Scheffler, M. Free gold clusters: Beyond the static, monostructure description. Faraday Discuss. 2011, 152, 153–167. [Google Scholar] [CrossRef] [PubMed]
- Oezaslan, M.; Heggen, M.; Strasser, P. Size-dependent morphology of dealloyed bimetallic catalysts: Linking the nano to the macro scale. J. Am. Chem. Soc. 2012, 134, 514–524. [Google Scholar] [CrossRef] [PubMed]
- Gruber, M.; Heimel, G.; Romaner, L.; Brédas, J.-L.; Zojer, E. First-principles study of the geometric and electronic structure of Au13 clusters: Importance of the prism motif. Phys. Rev. B 2008, 77, 165411. [Google Scholar] [CrossRef]
- Sun, J.; Xie, X.; Cao, B.; Duan, H. A density-functional theory study of Au13, Pt13, Au12Pt and Pt12Au clusters. Comput. Theor. Chem. 2017, 1107, 127–135. [Google Scholar] [CrossRef]
- Amft, M.; Johansson, B.; Skorodumova, N.V. Influence of the cluster dimensionality on the binding behavior of CO and O2 on Au13. J. Chem. Phys. 2012, 136, 24312. [Google Scholar] [CrossRef] [PubMed]
- Ferrando, R.; Jellinek, J.; Johnston, R.L. Nanoalloys: From theory to applications of alloy clusters and nanoparticles. Chem. Rev. 2008, 108, 845–910. [Google Scholar] [CrossRef] [PubMed]
- Kim, J.; Dick, J.E.; Bard, A.J. Advanced electrochemistry of individual metal clusters electrodeposited atom by atom to nanometer by nanometer. Acc. Chem. Res. 2016, 49, 2587–2595. [Google Scholar] [CrossRef] [PubMed]
- Luo, Z.; Castleman, A.W.; Khanna, S.N. Reactivity of metal clusters. Chem. Rev. 2016, 116, 14456–14492. [Google Scholar] [CrossRef] [PubMed]
- Haruta, M.; Daté, M. Advances in the catalysis of Au nanoparticles. Appl. Catal. A 2001, 222, 427–437. [Google Scholar] [CrossRef]
- Zhou, N.; López-Puente, V.; Wang, Q.; Polavarapu, L.; Pastoriza-Santos, I.; Xu, Q.-H. Plasmon-enhanced light harvesting: Applications in enhanced photocatalysis, photodynamic therapy and photovoltaics. RCS Adv. 2015, 5, 29076–29097. [Google Scholar] [CrossRef]
- Di Pietro, P.; Strano, G.; Zuccarello, L.; Satriano, C. Gold and silver nanoparticles for applications in theranostics. Curr. Top. Med. Chem. 2016, 16, 3069–3102. [Google Scholar] [CrossRef]
- Kopp, M.; Kollenda, S.; Epple, M. Nanoparticle–protein interactions: Therapeutic approaches and supramolecular chemistry. Acc. Chem. Res. 2017, 50, 1383–1390. [Google Scholar] [CrossRef] [PubMed]
- Kwatra, D.; Venugopal, A.; Anant, S. Nanoparticles in radiation therapy: A summary of various approaches to enhance radiosensitization in cancer. Transl. Cancer Res. 2013, 2, 330–342. [Google Scholar]
- Liu, P.; Qin, R.; Fu, G.; Zheng, N. Surface coordination chemistry of metal nanomaterials. J. Am. Chem. Soc. 2017, 139, 2122–2131. [Google Scholar] [CrossRef] [PubMed]
- Brinck, T.; Carlqvist, P.; Stenlid, J.H. The local electron attraction energy and its use for predicting nucleophilic reactions and halogen bonding. J. Phys. Chem. A 2016, 120, 10023–10032. [Google Scholar] [CrossRef] [PubMed]
- Stenlid, J.H.; Brinck, T. Nucleophilic aromatic substitution reactions described by the local electron attachment energy. J. Org. Chem. 2017, 82, 3072–3083. [Google Scholar] [CrossRef] [PubMed]
- Stewart, R.F. On the mapping of electrostatic properties from Bragg diffraction data. Chem. Phys. Lett. 1979, 65, 335–342. [Google Scholar] [CrossRef]
- Politzer, P.; Truhlar, D.G. Chemical Applications of Atomic and Molecular Electrostatic Potentials; Plenum Press: Berlin, Germany, 1981. [Google Scholar]
- Janak, J.F. Proof that ∂E/∂ni = εi in density-functional theory. Phys. Rev. B 1978, 18, 7165–7168. [Google Scholar] [CrossRef]
- Ehresmann, B.; Martin, B.; Horn, A.H.C.; Clark, T. Local molecular properties and their use in predicting reactivity. J. Mol. Model. 2003, 9, 342–347. [Google Scholar] [CrossRef] [PubMed]
- Clark, T. The local electron affinity for non-minimal basis sets. J. Mol. Model. 2010, 16, 1231–1238. [Google Scholar] [CrossRef] [PubMed]
- Politzer, P.; Murray, J.S.; Bulat, F.A. Average local ionization energy: A review. J. Mol. Model. 2010, 16, 1731–1742. [Google Scholar] [CrossRef] [PubMed]
- Sjoberg, P.; Murray, J.S.; Brinck, T.; Politzer, P. Average local ionization energies on the molecular surfaces of aromatic systems as guides to chemical reactivity. Can. J. Chem. 1990, 68, 1440–1443. [Google Scholar] [CrossRef]
- Bulat, F.A.; Levy, M.; Politzer, P. Average local ionization energies in the Hartree−Fock and Kohn−Sham theories. J. Phys. Chem. A 2009, 113, 1384–1389. [Google Scholar] [CrossRef] [PubMed]
- Grimme, S.; Antony, J.; Ehrlich, S.; Krieg, H. A consistent and accurate ab initio parametrization of density functional dispersion correction (DFT-D) for the 94 elements H-Pu. J. Chem. Phys. 2010, 132, 154104. [Google Scholar] [CrossRef] [PubMed]
- Grimme, S.; Ehrlich, S.; Goerigk, L. Effect of the damping function in dispersion corrected density functional theory. J. Comput. Chem. 2011, 32, 1456–1465. [Google Scholar] [CrossRef] [PubMed]
- Pettersen, E.F.; Goddard, T.D.; Huang, C.C.; Couch, G.S.; Greenblatt, D.M.; Meng, E.C.; Ferrin, T.E. UCSF Chimera—A visualization system for exploratory research and analysis. J. Comput. Chem. 2004, 25, 1605–1612. [Google Scholar] [CrossRef] [PubMed]
- Frisch, M.J.; Trucks, G.W.; Schlegel, H.B.; Scuseria, G.E.; Robb, M.A.; Cheeseman, J.R.; Scalmani, G.; Barone, V.; Mennucci, B.; Petersson, G.A.; et al. Gaussian 09, Revision D.01. Gaussian, Inc.: Wallingford, CT, USA, 2009. [Google Scholar]
- Neese, F. The ORCA program system. WIREs Comput. Mol. Sci. 2012, 2, 73–78. [Google Scholar] [CrossRef]
- Neese, F.; Wennmohs, F.; Hansen, A.; Becker, U. Efficient, approximate and parallel Hartree–Fock and hybrid DFT calculations. A “chain-of-spheres” algorithm for the Hartree–Fock exchange. Chem. Phys. 2009, 356, 98–109. [Google Scholar] [CrossRef]
- Seeger, R.; Pople, J.A. Self-consistent molecular orbital methods. XVIII. Constraints and stability in Hartree–Fock theory. J. Chem. Phys. 1977, 66, 3045–3050. [Google Scholar] [CrossRef]
- Bauernschmitt, R.; Ahlrichs, R. Stability analysis for solutions of the closed shell Kohn–Sham equation. J. Chem. Phys. 1996, 104, 9047–9052. [Google Scholar] [CrossRef]
- Glendening, E.D.; Reed, A.E.; Carpenter, J.E.; Weinhold, F. The NBO 3.1 Program Manual; Theoretical Chemistry Institute and Department of Chemistry, University of Wisconsin: Madison, WI, USA, 1990. [Google Scholar]
- Kozuch, S. Should “anion–π interactions” be called “anion–σ interactions”? A revision of the origin of some hole-bonds and their nomenclature. Phys. Chem. Chem. Phys. 2016, 18, 30366–30369. [Google Scholar] [CrossRef] [PubMed]
- Böyükata, M.; Belchior, J.C. Structural and energetic analysis of copper clusters: MD study of Cun (n = 2–45). J. Braz. Chem. Soc. 2008, 19, 884–893. [Google Scholar] [CrossRef]
- Hu, Z.; Boyd, R.J. Structure sensitivity and cluster size convergence for formate adsorption on copper surfaces: A DFT cluster model study. J. Chem. Phys. 2000, 112, 9562–9568. [Google Scholar] [CrossRef]
- Itoh, M.; Kumar, V.; Adschiri, T.; Kawazoe, Y. Comprehensive study of sodium, copper, and silver clusters over a wide range of sizes 2 ≤ N ≤ 75. J. Chem. Phys. 2009, 131, 174510. [Google Scholar] [CrossRef] [PubMed]
- Wang, G.-C.; Jiang, L.; Pang, X.-Y.; Nakamura, J. Cluster and periodic DFT calculations: The adsorption of atomic nitrogen on M(111) (M = Cu, Ag, Au) surfaces. J. Phys. Chem. B 2005, 109, 17943–17950. [Google Scholar] [CrossRef] [PubMed]
- Oviedo, J.; Palmer, R.E. Amorphous structures of Cu, Ag, and Au nanoclusters from first principles calculations. J. Chem. Phys. 2002, 117, 9548–9551. [Google Scholar] [CrossRef]
- Stenlid, J.H.; Johansson, A.J.; Kloo, L.; Brinck, T. Aqueous solvation and surface oxidation of the cu7 nanoparticle: Insights from theoretical modeling. J. Phys. Chem. C 2016, 120, 1977–1988. [Google Scholar] [CrossRef]
- Murray, J.; Lane, P.; Clark, T.; Riley, K.; Politzer, P. σ-Holes, π-holes and electrostatically-driven interactions. J. Mol. Model. 2012, 18, 541–548. [Google Scholar] [CrossRef] [PubMed]
- Xiao, L.; Wang, L. Structures of platinum clusters: Planar or spherical? J. Phys. Chem. A 2004, 108, 8605–8614. [Google Scholar] [CrossRef]
- Zhang, W.; Xiao, L.; Hirata, Y.; Pawluk, T.; Wang, L. The simple cubic structure of Ir clusters and the element effect on cluster structures. Chem. Phys. Lett. 2004, 383, 67–71. [Google Scholar] [CrossRef]
- Du, J.; Sun, X.; Chen, J.; Jiang, G. A Theoretical study on small iridium clusters: Structural evolution, electronic and magnetic properties, and reactivity predictors. J. Phys. Chem. A 2010, 114, 12825–12833. [Google Scholar] [CrossRef] [PubMed]
- Reiher, M.; Salomon, O.; Hess, B.A. Reparameterization of hybrid functionals based on energy differences of states of different multiplicity. Theor. Chem. Acc. 2001, 107, 48–55. [Google Scholar] [CrossRef]
- Slimani, A.; Yu, X.; Muraoka, A.; Boukheddaden, K.; Yamashita, K. Reparametrization approach of DFT functionals based on the equilibrium temperature of spin-crossover compounds. J. Phys. Chem. A 2014, 118, 9005–9012. [Google Scholar] [CrossRef] [PubMed]
- Young, D.C. Spin Contamination. In Computational Chemistry; John Wiley & Sons, Inc.: San Francisco, CA, USA, 2001; pp. 227–230. [Google Scholar]
- Chaves, A.S.; Piotrowski, M.J.; Da Silva, J.L.F. Evolution of the structural, energetic, and electronic properties of the 3d, 4d, and 5d transition-metal clusters (30 TMn systems for n = 2–15): A density functional theory investigation. Phys. Chem. Chem. Phys. 2017, 19, 15484–15502. [Google Scholar] [CrossRef] [PubMed]
- Da Silva, J.L.F.; Piotrowski, M.J.; Aguilera-Granja, F. Hybrid density functional study of small Rhn n = 2–15 clusters. Phys. Rev. B 2012, 86, 125430. [Google Scholar] [CrossRef]
- Yamaguchi, K.; Jensen, F.; Dorigo, A.; Houk, K.N. A spin correction procedure for unrestricted Hartree-Fock and Møller-Plesset wavefunctions for singlet diradicals and polyradicals. Chem. Phys. Lett. 1988, 149, 537–542. [Google Scholar] [CrossRef]
- Yamaguchi, K.; Okumura, M.; Mori, W.; Maki, J.; Takada, K.; Noro, T.; Tanaka, K. Comparison between spin restricted and unrestricted post-Hartree–Fock calculations of effective exchange integrals in Ising and Heisenberg models. Chem. Phys. Lett. 1993, 210, 201–210. [Google Scholar] [CrossRef]
- Yasuda, N.; Kitagawa, Y.; Hatake, H.; Saito, T.; Kataoka, Y.; Matsui, T.; Kawakami, T.; Yamanaka, S.; Okumura, M.; Yamaguchi, K. Approximate spin projection for geometry optimization of biradical systems: Case studies of through-space and through-bond systems. In Quantum Systems in Chemistry and Physics; Springer: Dordrecht, The Netherlands, 2012; pp. 345–359. [Google Scholar]
- Heisenberg, W. Zur Theorie des Ferromagnetismus. Z. Phys. 1928, 49, 619–636. [Google Scholar] [CrossRef]
- Kambe, K. Paramagnetic susceptibilities of some polynuclear complex salts. J. Phys. Soc. Jpn. 1950, 5, 48–51. [Google Scholar] [CrossRef]
Figure 1.
The σs-, σp- and σd-holes are exemplified by the electrostatic potential profiles, VS(r), of HF, I2 and Pt4. The VS(r) was evaluated on the 0.001 a.u. isodensity contour at structures characterized at the PBE0/def2-TZVPP//def2-SV(P) level of theory [11,12] using the Turbomole 6.4 package [13]. Note that the VS,max of Pt4 are not located at the corners but at the extension of the bonds (dark red areas).
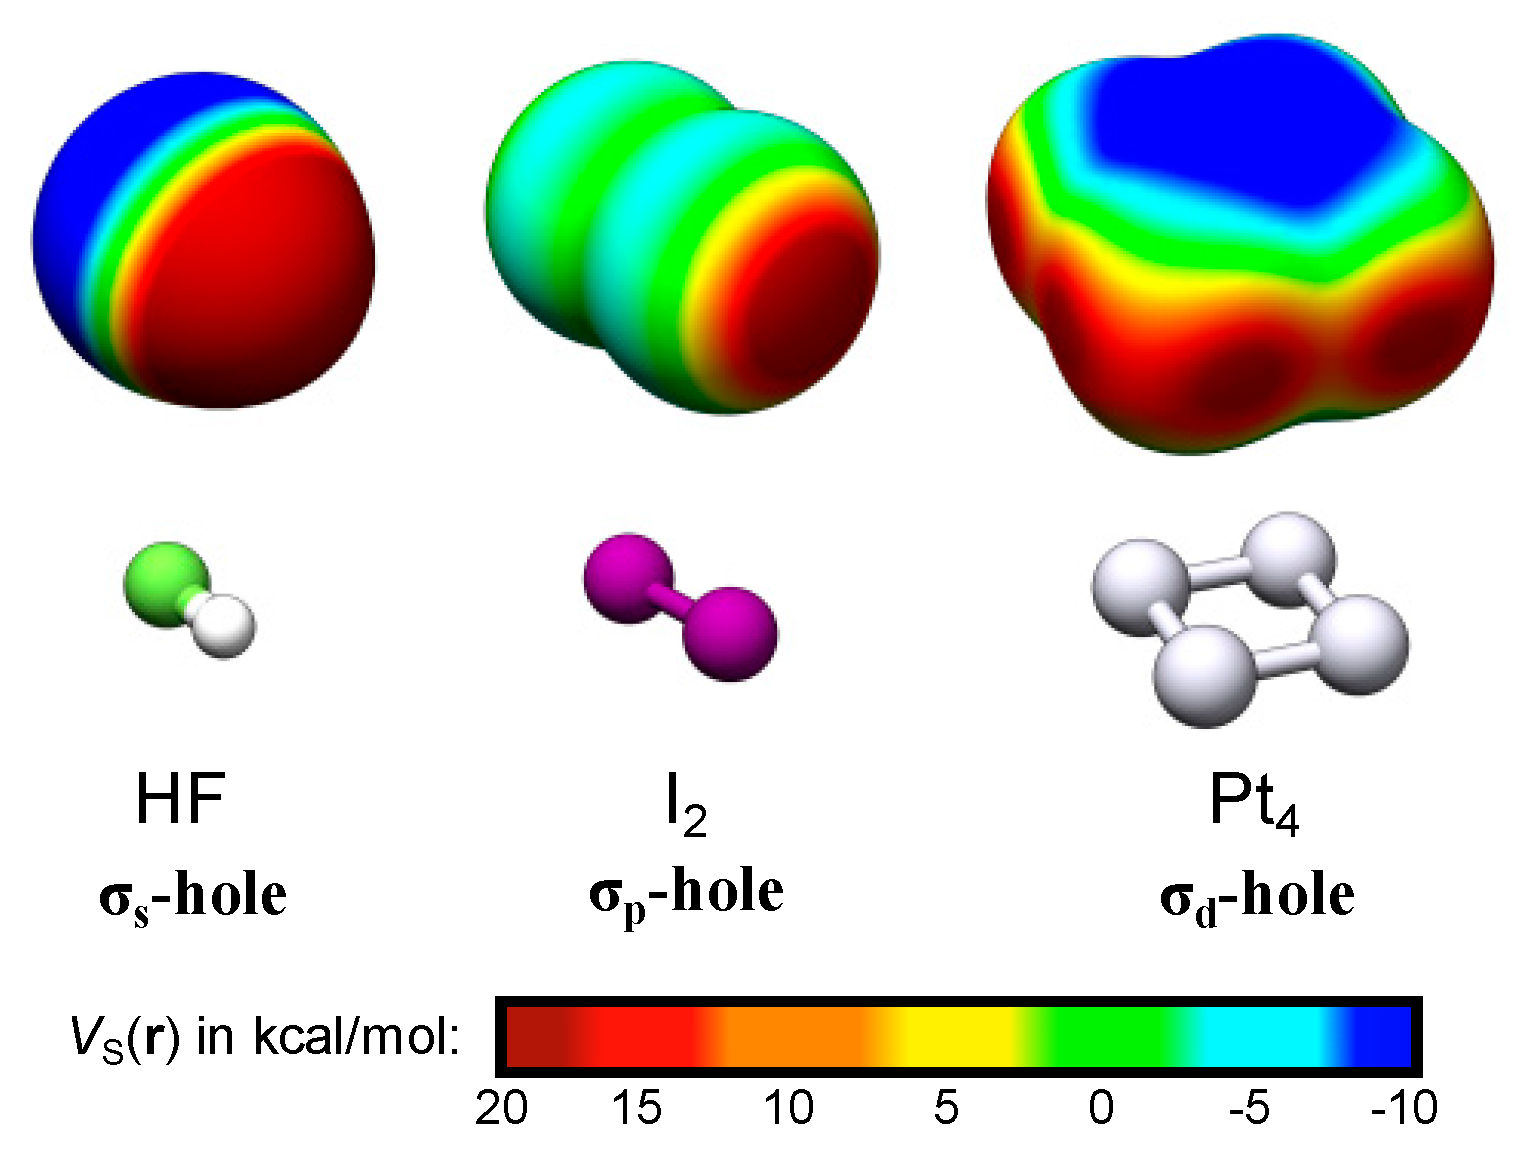
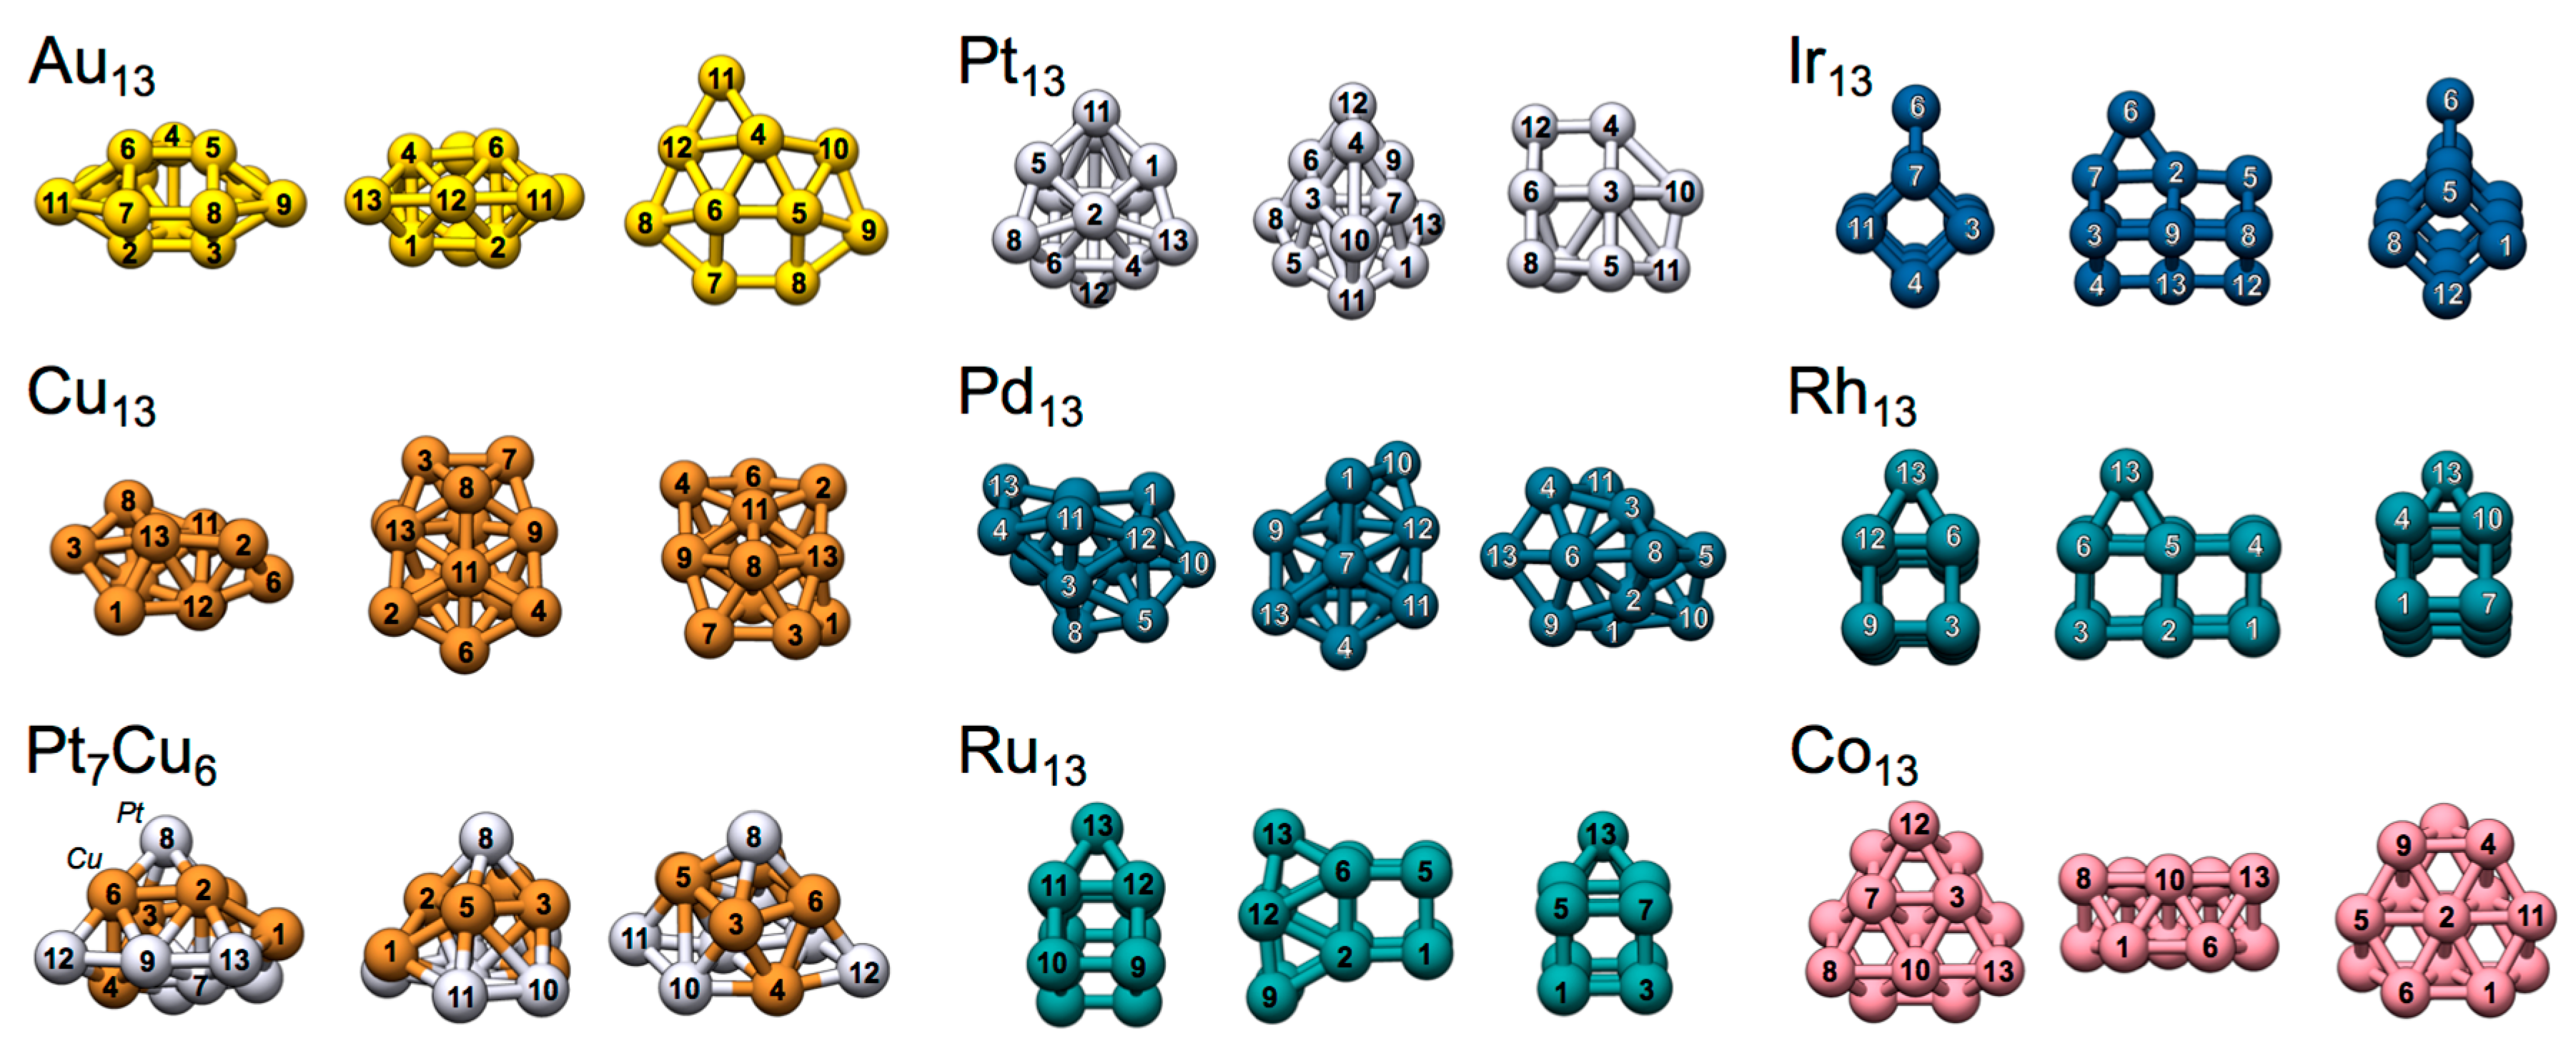
Figure 2.
Structures and atomic indexation of the TM13 nanoclusters shown from different angles.

Figure 3.
Au, Pt and Ir TM2 and TM8 nanoclusters optimized at the PBE0/def2-SV(P) level of theory [11,12] using the Turbomole 6.4 software package [13]. The electrostatic potential profiles, VS(r), were evaluated at the 0.001 a.u. isodensity surface at the PBE0/def2-TZVPP level of theory. See the supplementary material for further details (Section S4 and Table S1).
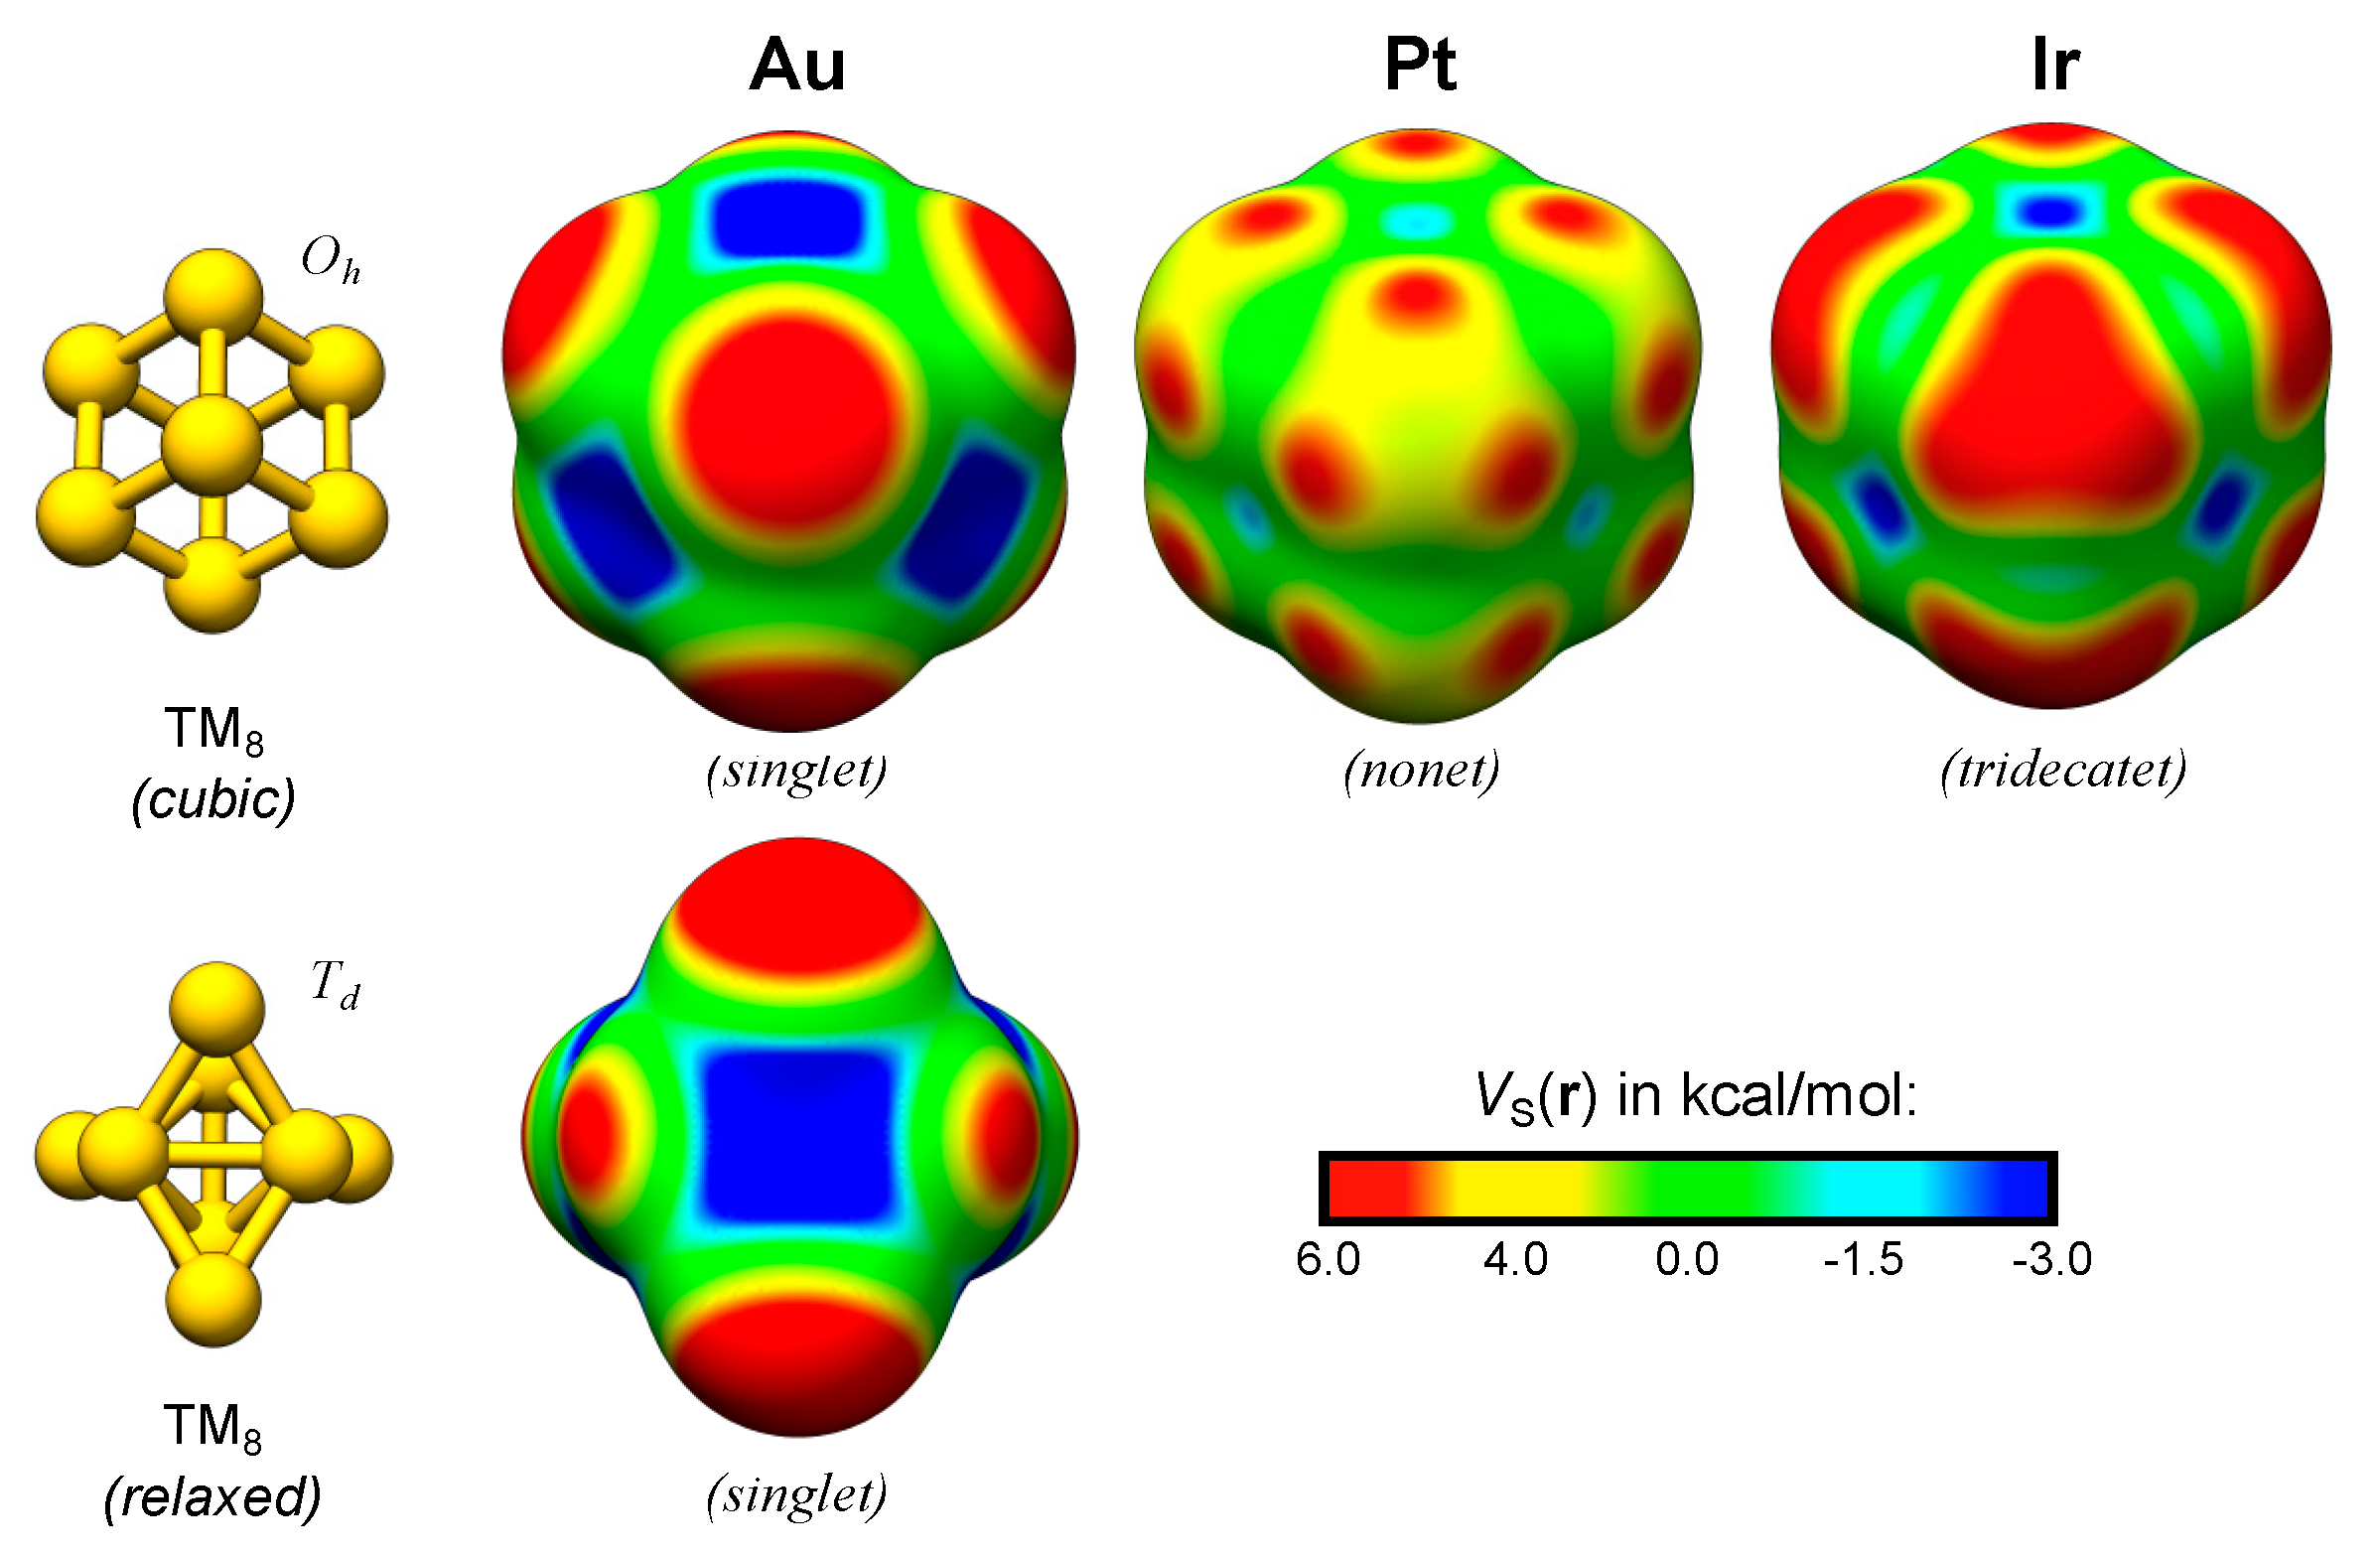
Figure 4.
The TM13 nanoparticles shown from different angles with the corresponding VS(r) and ES(r) maps obtained at the 0.001 a.u. isodensity surface. The color code is inserted in the bottom right corner. Red and yellow site correspond to Lewis acidic sites, while cyan and blue sites are Lewis basic. Values for the VS,max and ES,min are given in the supplementary material (Table S4).
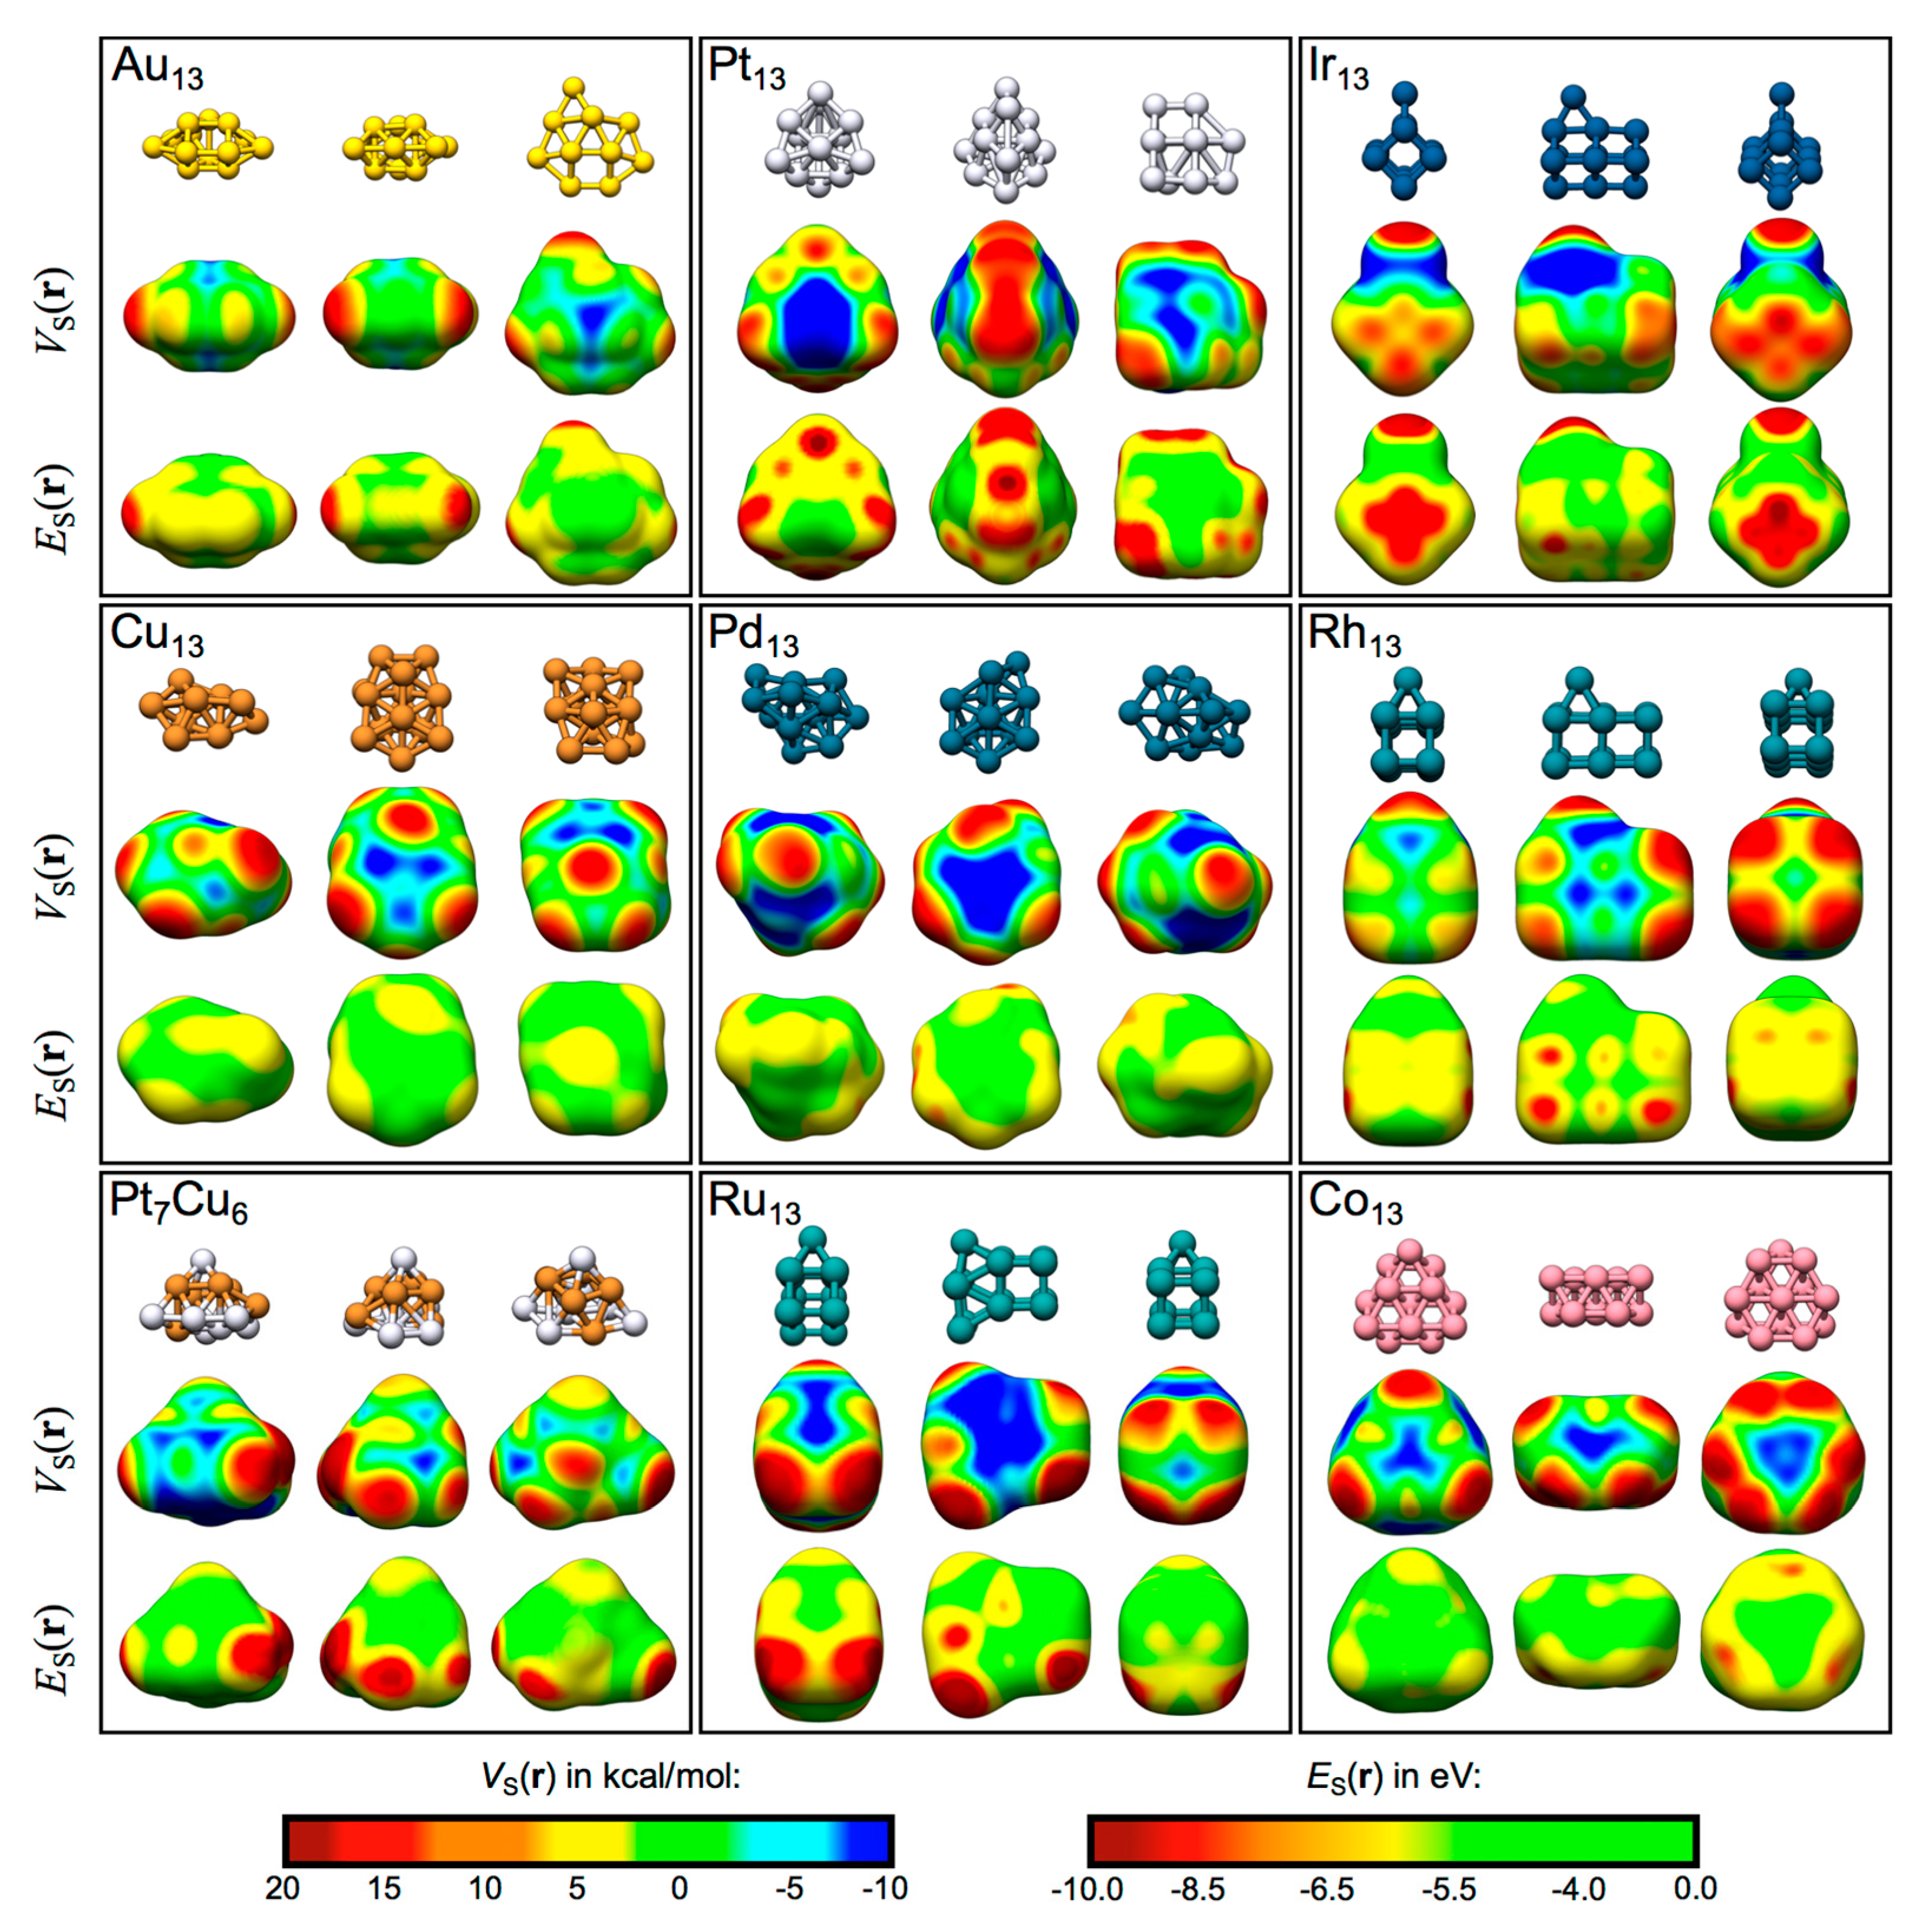
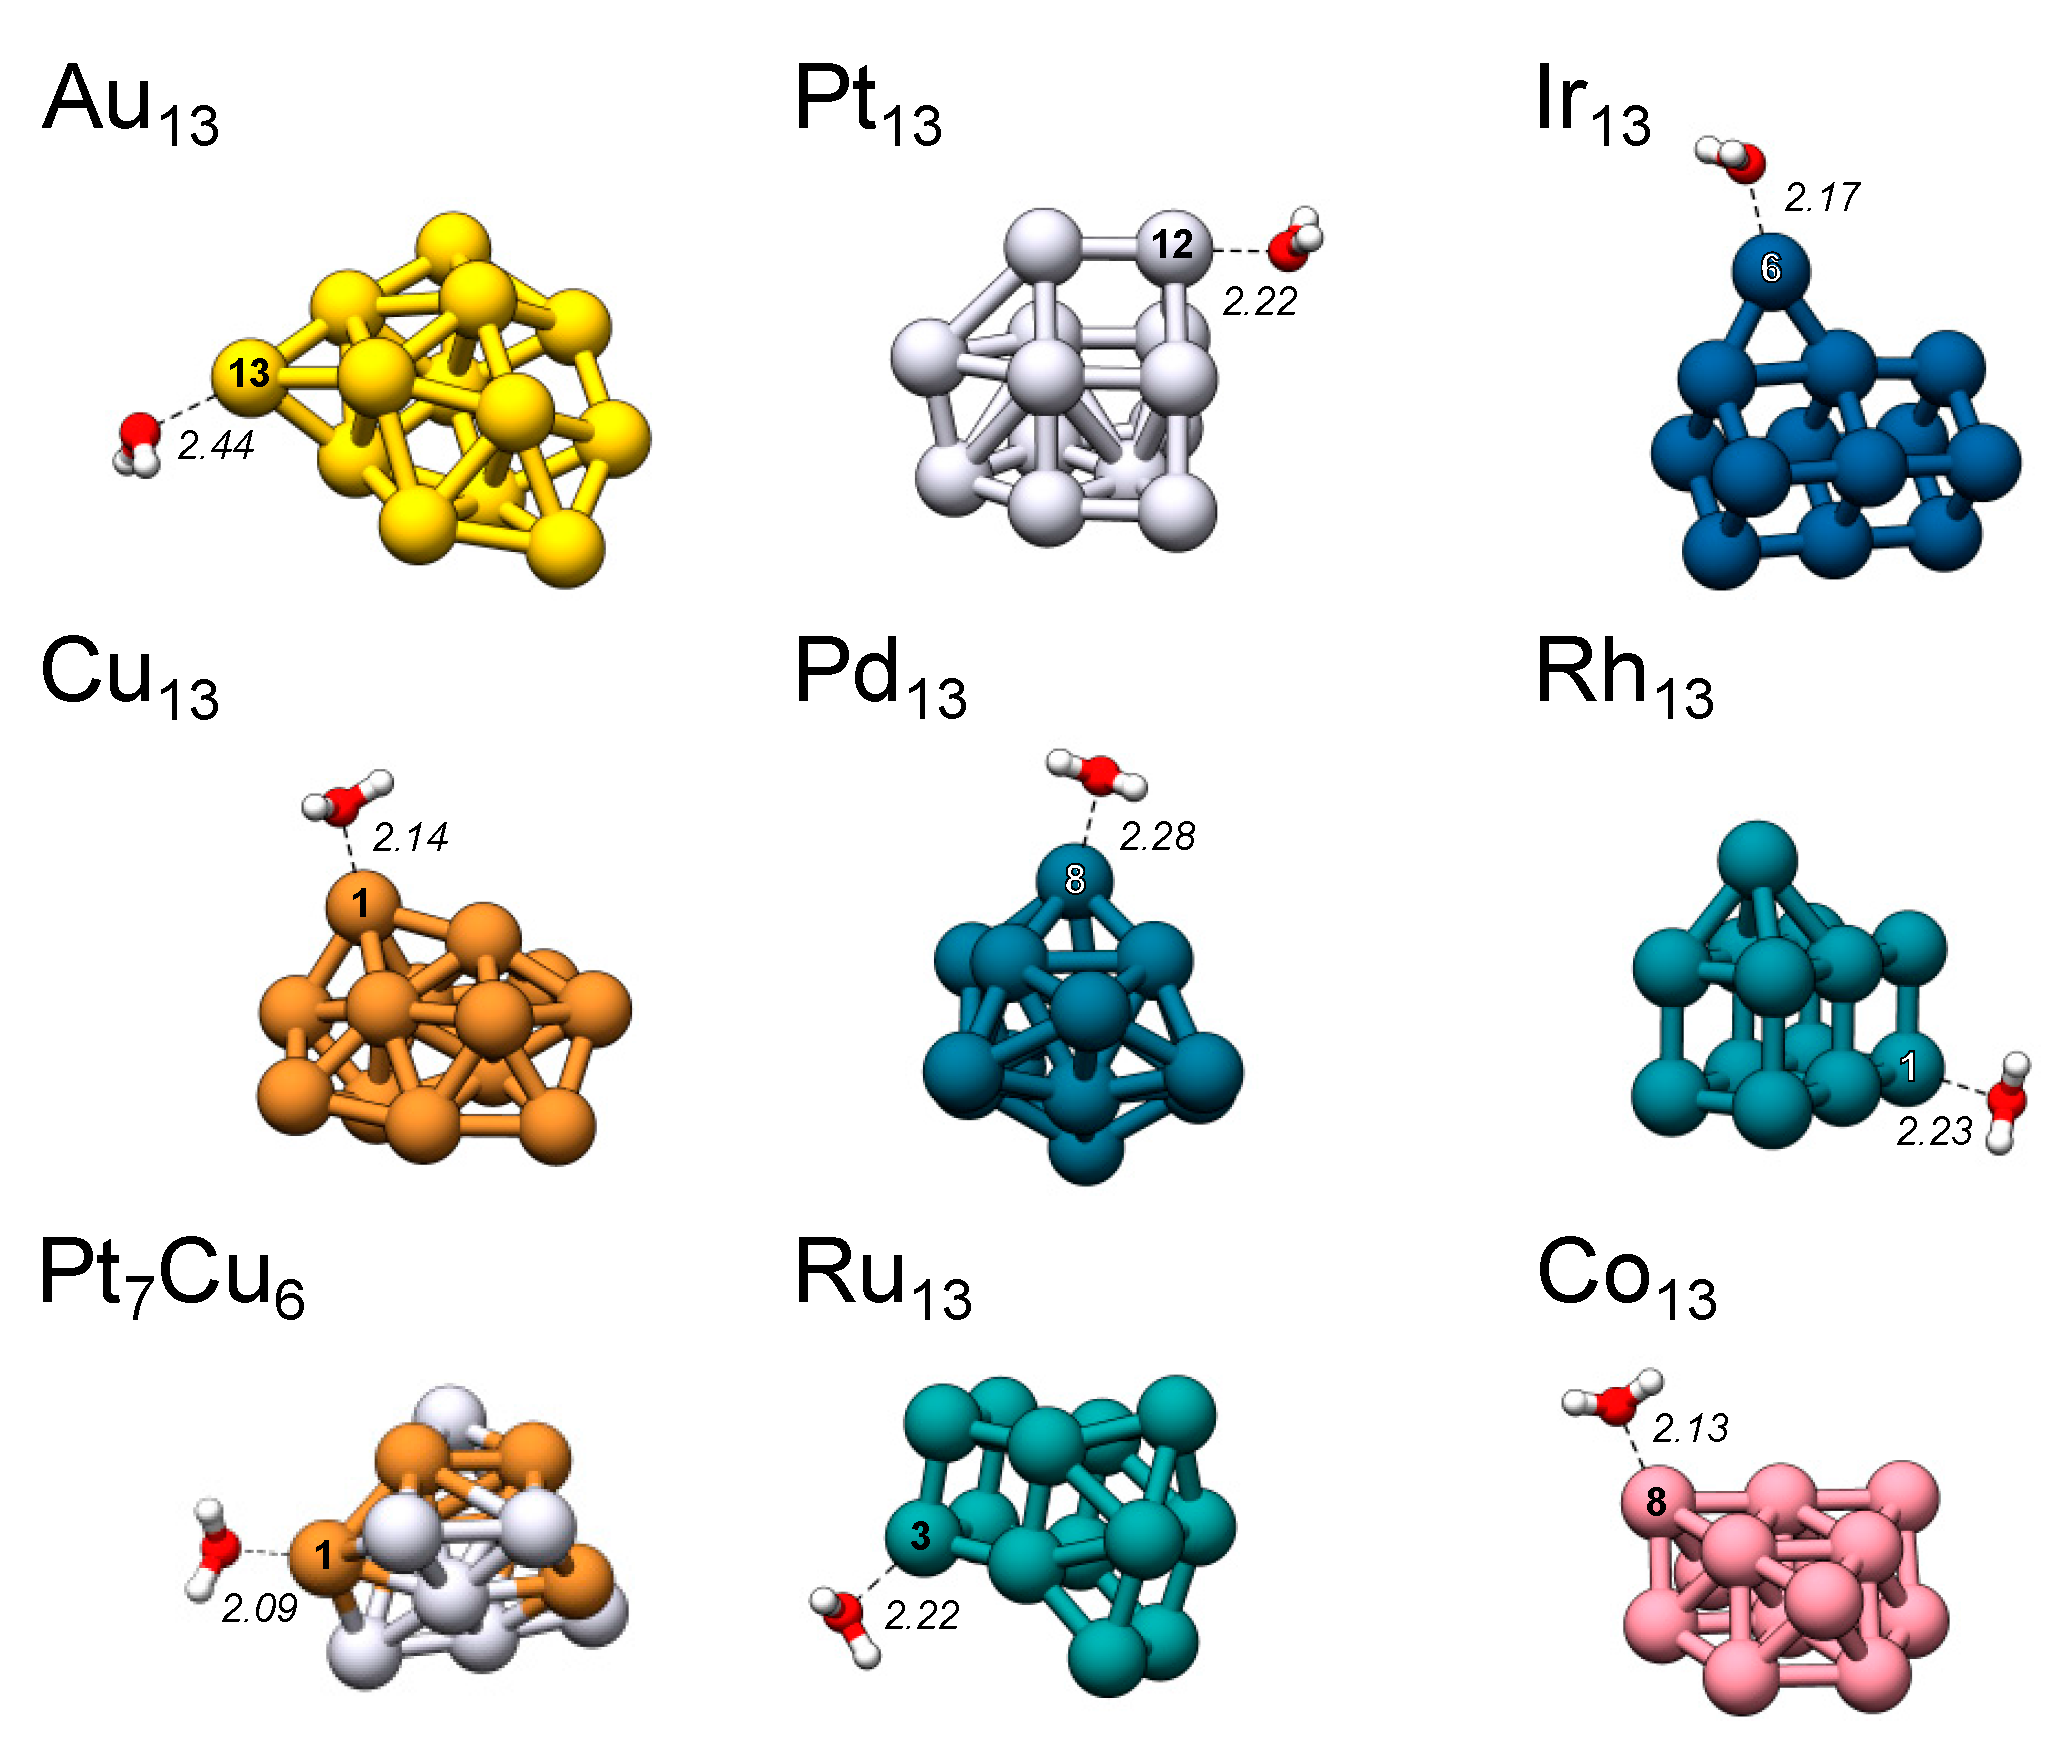
Figure 5.
All TM13 nanoparticles with H2O adsorbed at the favored position. Interaction distances are given in Å. Refer to the supplementary material for information on the remaining structures (Section S6 and Table S4).
Figure 5.
All TM13 nanoparticles with H2O adsorbed at the favored position. Interaction distances are given in Å. Refer to the supplementary material for information on the remaining structures (Section S6 and Table S4).
Figure 6.
Shows the total correlation for Pt (blue squares) and Cu (red rhombs) atoms for the site resolved H2O interaction energy of the Pt13, Pt7Cu6 and Cu13 nanoclusters combined (e.g., are all Pt atoms of all three compounds in the Pt series) versus the local VS,max (left) and ES,min (right).
Figure 6.
Shows the total correlation for Pt (blue squares) and Cu (red rhombs) atoms for the site resolved H2O interaction energy of the Pt13, Pt7Cu6 and Cu13 nanoclusters combined (e.g., are all Pt atoms of all three compounds in the Pt series) versus the local VS,max (left) and ES,min (right).

Table 1.
TM13 nanocluster Schönflies symmetry group (Sym), ground-state spin multiplicity (2S + 1), and the number of unique atom binding sites (AS), as well as unique VS,max sites (VS) and ES,min sites (ES) identified on each cluster. Included are also the atom average valence s-, d- and p-occupations (s-, d- and p-occ) as determined by NBO analysis [51].
| Sym | (2S + 1) | AS | VS | ES | s-occ 1 | d-occ 1 | p-occ 1 | |
|---|---|---|---|---|---|---|---|---|
| Au13 | Cs | 2 | 10 | 10 | 9 | 0.73 | 9.90 | 0.38 |
| Cu13 | C2 | 2 | 7 | 6 | 6 | 0.63 | 9.94 | 0.44 |
| Pt13 | Cs | 3 | 7 | 15 | 15 | 0.61 | 9.08 | 0.32 |
| Pt7Cu6 | C1 | 3 | 13 | 12 | 11 | 0.56 2 | 9.56 2 | 0.34 2 |
| Pd13 | C2 | 9 | 7 | 7 | 8 | 0.37 | 9.34 | 0.29 |
| Co13 | C3 | 28 | 4 | 4 | 3 | 0.65 | 7.82 | 0.52 |
| Rh13 | Cs | 2 3 | 7 | 7 | 14 | 0.43 | 8.30 | 0.27 |
| Ir13 | Cs | 4 | 10 | 17 | 15 | 0.67 | 7.97 | 0.37 |
| Ru13 | Cs | 13 | 7 | 6 | 9 | 0.46 | 7.22 | 0.34 |
1 In case the total valence occupation does not fully amount to the total number of valence electrons, the remaining electron density is spread over the +1 super-valence s-, p-, d-, and f-orbitals. 2 Average valence occupation Pt (s: 0.71, d: 9.25, p: 0.28) and Cu (s: 0.40, d: 9.92, p: 0.41). 3 The 2S + 1 = 10 state is almost degenerate, see supplementary material (Section S3 and Table S5).
Table 2.
H2O adsorption position and the corresponding VS,max (kcal/mol) and ES,min (eV) for the TM13 nanocluster. Interaction energies (ΔEint in eV) and distances (dTM-O in Å) are also included, as are the σ-hole character of the VS,max (σtype) and distance from the VS,max to the optimized position of the O-atom of H2O upon adsorption (dσ–O in Å).
| ASfav | VS,max | σtype | ES,min | ΔEint | dTM-O | dTM-σ | dσ-O | |
|---|---|---|---|---|---|---|---|---|
| Au13 | 13 | 16.80 | σs | −8.88 | −0.37 | 2.44 | 2.20 | 0.48 |
| Cu13 | 1(2) | 19.55 | σs | −6.53 | −0.54 | 2.14 | 2.02 | 0.56 |
| Pt13 | 12 | 20.12 | σd | −11.93 | −0.80 | 2.22 | 2.13 | 0.13 |
| Pt7Cu6 | 1 1 | 35.38 | σs | −10.88 | −0.73 | 2.09 | 1.91 | 0.23 |
| Pd13 | 8(11) 2 | 13.31 | σs | −5.14 | −0.59 | 2.28 | 2.16 | 1.35 |
| Co13 | 8 3 | 21.65 | σs | −5.64 | −0.48 | 2.13 | 2.06 | 0.90 |
| Rh13 | 1(7) | 20.43 | σd | −8.74 | −0.81 | 2.23 | 2.13 | 0.27 |
| Ir13 | 6 | 33.75 | σs | −12.86 | −1.00 | 2.17 | 2.18 | 0.33 |
| Ru13 | 3(1) 4 | 29.16 | σs | −12.11 | −0.92 | 2.22 | 2.07 | 0.96 |
1 Cu atom. 2 Fifth highest VS,max of series (AS 13 (two sites), 9 and 4 higher). 3 Same as position 12 and 13. 4 Second highest VS,max (AS 9 [10] higher).
Table 3.
Averaged data for the TM13 series: average O-down interaction energies (ΔEint in eV) and adsorption distances (dTM-O,ave in Å), as well as average distances from the nearby TM atom to the closest σ-hole upon H2O interaction (dTM-σ,ave), and the distance between the σ-hole and the O atom of the adsorbed H2O (dσ-O,ave). Included are also the coefficient of determination (R2) for the correlation between the H2O interaction energies and the local VS,max (R2V) or ES,min (R2E).
| ΔEint,ave | dTM-O,ave | dTM-σ,ave | dσ-O,ave | R2V | R2E | |
|---|---|---|---|---|---|---|
| Au13 | −0.29 | 2.57 | 2.21 | 0.83 | 0.84 | 0.81 |
| Cu13 | −0.47 | 2.19 | 2.06 | 0.43 | 0.85 | 0.95 |
| Pt13 | −0.47 | 2.38 | 2.20 | 0.46 | 0.67 1 | 0.82 1 |
| Pt7Cu6 | −0.47 2 | 2.30 2 | 2.09 | 0.57 2 | 0.92 2 | 0.65 2 |
| Pd13 | −0.45 | 2.34 | 2.15 | 0.82 | 0.58 | 0.25 |
| Co13 | −0.470 | 2.15 | 2.10 | 0.61 | n.a. 3 | n.a. 3 |
| Rh13 | −0.64 | 2.29 | 2.15 | 0.37 | 0.19 | 0.18 |
| Ir13 | −0.59 | 2.41 | 2.28 | 0.45 | 0.28 (0.90) 4 | 0.09 (0.75) 4 |
| Ru13 | −0.64 | 2.25 | 2.17 | 0.91 | 0.03 | 0.10 |
1 Including only the sites with identified VS,max. 2 Values resolved for the Cu (Pt) atoms are, in the order of the table columns: −0.46 (−0.45), 2.22 (2.39), 2.00 (2.17), 0.62 (0.52), 0.99 (0.85), and 0.98 (0.81). 3 Not applicable since there are only three unique adsorption sites. 4 Including only the eight strongest interaction sites.
© 2017 by the authors. Licensee MDPI, Basel, Switzerland. This article is an open access article distributed under the terms and conditions of the Creative Commons Attribution (CC BY) license (http://creativecommons.org/licenses/by/4.0/).
Share and Cite
MDPI and ACS Style
Stenlid, J.H.; Johansson, A.J.; Brinck, T. σ-Holes on Transition Metal Nanoclusters and Their Influence on the Local Lewis Acidity. Crystals 2017, 7, 222. https://doi.org/10.3390/cryst7070222
AMA Style
Stenlid JH, Johansson AJ, Brinck T. σ-Holes on Transition Metal Nanoclusters and Their Influence on the Local Lewis Acidity. Crystals. 2017; 7(7):222. https://doi.org/10.3390/cryst7070222
Chicago/Turabian StyleStenlid, Joakim H., Adam Johannes Johansson, and Tore Brinck. 2017. "σ-Holes on Transition Metal Nanoclusters and Their Influence on the Local Lewis Acidity" Crystals 7, no. 7: 222. https://doi.org/10.3390/cryst7070222
Note that from the first issue of 2016, this journal uses article numbers instead of page numbers. See further details here.