
Crystallization under an External Electric Field: A Case Study of Glucose Isomerase

1
National Syncrhotron Light Source, Upton, NY 11973, USA
2
Accenture, NewYork, NY 10105, USA
3
International Imaging Materials—IIMAK, Amherst, NY 14228, USA
4
National Syncrhotron Light Source II, Upton, NY 11973, USA
*
Author to whom correspondence should be addressed.
Crystals 2017, 7(7), 206; https://doi.org/10.3390/cryst7070206
Submission received: 9 May 2017
/
Revised: 8 June 2017
/
Accepted: 9 June 2017
/
Published: 6 July 2017
(This article belongs to the Special Issue Protein Crystallization under the Presence of an Electric Field)
Abstract
:Electric fields have been employed to promote macromolecular crystallization for several decades. Although crystals grown in electric fields seem to present higher diffraction quality, these methods are not widespread. For most configurations, electrodes are in direct contact with the protein solution. Here, we propose a configuration that can be easily extended to standard crystallization methods for which the electrodes are not in direct contact with the protein solution. Furthermore, the proposed electrode configuration supplies an external DC electric field. Glucose Isomerase from Streptomyces rubiginosus crystals were grown at room temperature using the microbatch method in the presence of 1, 2, 4, and 6 kV. Several crystallization trials were carried out for reproducibility and statistical analysis purposes. The comparison with crystals grown in the absence of electric fields showed that crystallization in the presence of electric fields increases the size of crystals, while decreasing the number of nucleations. X-ray diffraction analysis of the crystals showed that those grown in the presence of electric fields are of higher crystal quality.
1. Introduction
The growth of high quality macromolecular crystals has been addressed theoretically and experimentally by multiple studies. The nucleation and growth process of macromolecular crystals [1,2] depends on a variety of physical and chemical parameters. Essentially any crystallization method aims to drive a solution from an undersaturated condition to a supersaturation state. As macromolecules nuclei are formed and crystals start growing, the concentration of macromolecules in the solution decreases, eventually becoming equal to the solubility, and consequently leading to the cessation of the crystal growth process. Crystal growth rates typically respond to concentration changes at the growing interface and therefore respond to a combination of transport phenomena, such as the diffusion of chemical species and interface kinetics [3]. Several crystallization methods aim to control the former, since any inhomogeneities in the growth solution will lead to convective flow and sedimentation. These may be minimized under low gravity conditions [4,5]. The relatively small diffusion coefficient observed for macromolecules [6] may enhance the probability for uniform incorporation of the molecules at the growing interface. Similarly, the use of gels [7,8], lipidic cubic phase [9,10], or oils in near containerless systems [11] reduce convection and sedimentation by slowing down diffusive transport of the macromolecules. Growth kinetics has been mostly controlled through supersaturation and nucleation inductors, for example through seeding [12,13,14].
Electromagnetic fields have been employed to control growth rates, and specific magnetic fields have been employed to minimize buoyancy-driven convection and sedimentation [15,16] and have in turn improved crystal quality [17]. Internal and external electric fields have been applied to improve the macroscopic and microscopic quality of macromolecular crystals; for a review see, for example, Hammadi et al. [18,19]. Probably the first macromolecule to crystallize in an external DC electric field was Estradiol 17b-dehydrogenase from human placenta, in a study conducted by Chin et al. [20]. They obtained crystals by applying an increasing voltage from 100 to 300 kV over 24–48 h and estimated 1500 V/m electric field using a method they had devised, electrophoresis diffusion. However, hen egg white lysozyme (HEWL) is the macromolecule of choice to study the effect of electric fields on the nucleation and growth process. Adapting two flat electrodes to the usual hanging and sitting drop setup, Taleb and co-workers [21,22] reported that the largest effect was observed for the condition with the highest positive charge, 11 (pH = 4.5 and high NaCl concentrations (1 M) [23], and an external electrical field intensity, E = 7.5 × 10⁴ V/m. Larger field intensities, 1.5 × 10⁵ V/m, were reported by Nanev and Penkova [24,25], who developed a quasi 2D glass cell to crystallize HEWL and simultaneously control temperature and reduce convection. Garetz et al. [26] reported the effect of laser light on the improved crystallization quality of glycine crystals. They attributed the observed effect to the small dipole moment induced by an electric field of a laser light flash. They argued that the electric field induced by the laser light lowers the molecule energy, favoring molecular orientation along the polarization of the laser electric field. They attributed the effect to the molecule’s polarizability, which is acted on by the electric field of the laser light. A small dipole moment was induced and the molecule’s energy was lowered, favoring molecular orientation. Appropriate field intensities would induce electrically-driven solution flow [27], promoting molecules to align and consequently leading to crystallization. In spite of the improved crystal quality reported by the crystallization of proteins under the influence of electric fields, the use of electric fields to control the kinetics of protein crystallization is not widespread. One possible reason for this might be the necessity of special settings and the usage of large quantities of protein. Two types of settings are commonly used. In the first, the electrodes are in contact with the growth solution [28,29,30,31,32,33], while in the second, electrodes are placed externally [24,25,34,35,36,37].
Here, we explore the effect of external electric fields on the crystallization process of Glucose Isomerase (GI) from Streptomyces rubiginosus, an enzyme used industrially to convert glucose to fructose in the manufacturing of high-fructose corn syrup. We take advantage of the microbatch method [38,39] that allows for low protein consumption, and combine it with a unique design of electrodes that allow for flexibility and the simultaneous application of electric fields of different intensities. About 360 trials for each of the five electric field conditions studied were analyzed, and approximately 75 crystals were exposed to X-rays for quality assessment. Our results indicate that the quality of the crystals obtained increased, while the number of nucleation sites decreased with the increase of the electric field applied.
2. Results
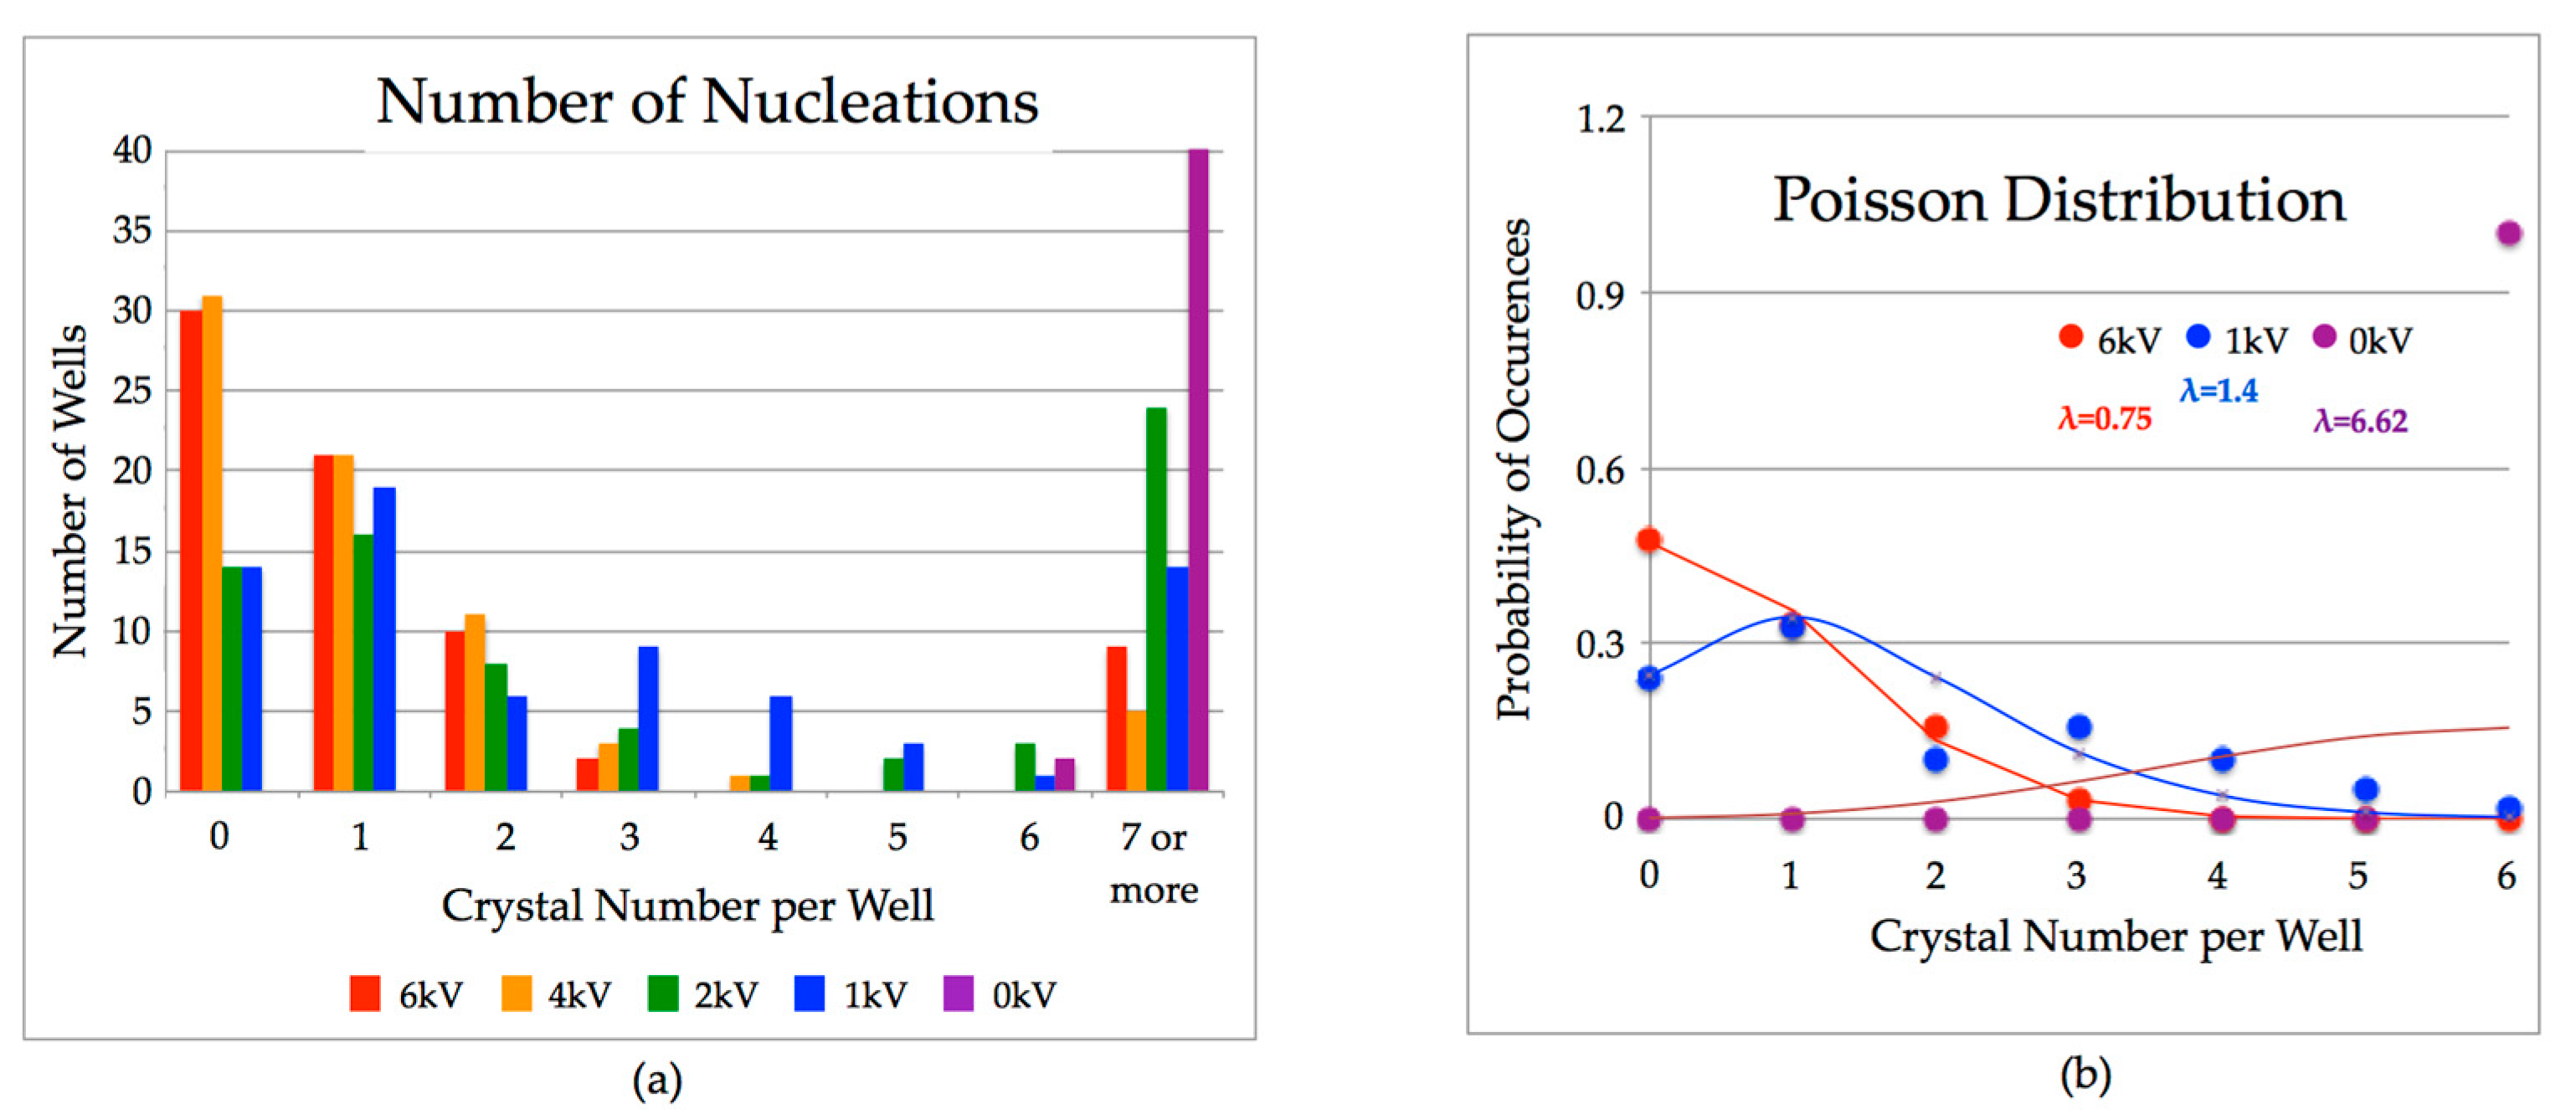
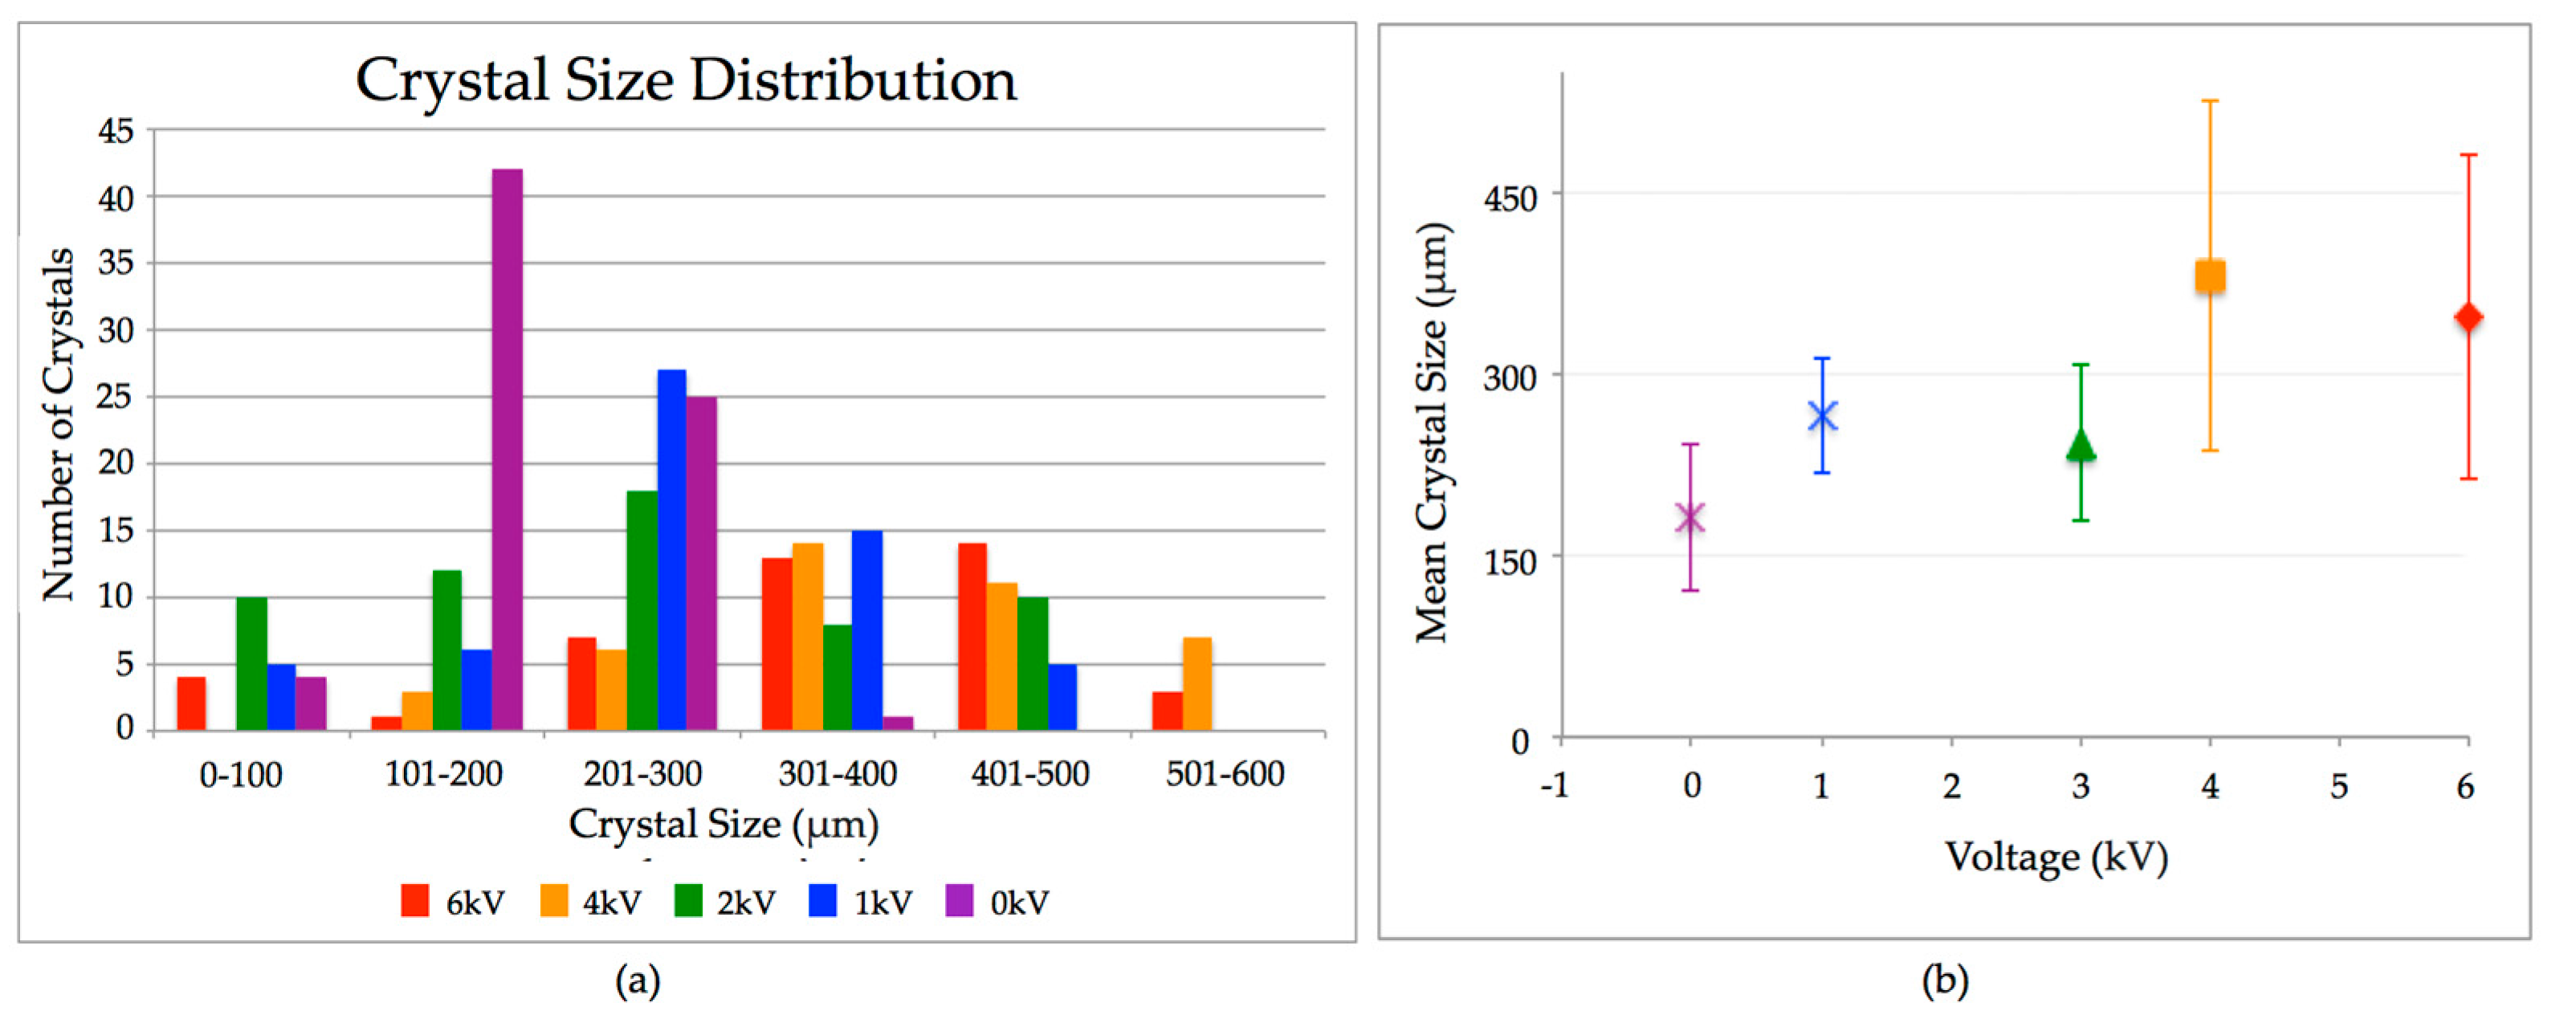
A total five experiments were carried out. For each experiment, five microbatch plates were prepared and respectively submitted to 0, 1, 2, 4, and 6 kV. Since each plate has 72 wells, 360 identical conditions were analyzed. For each trial, the number of crystals were recorded for the corresponding voltage, as shown in Figure 1. As the applied voltage increased, the number of nucleation centers decreased. A Poisson analysis of the number of nucleations per well as a function of electric field intensity or applied voltage shows that the least number of nucleations, i.e., the number of crystals per well, was observed for 6 kV, with less than one crystal per trial (λ = 0.75; where λ is the average number of crystals per trial). If crystallization takes place in the absence of an applied voltage, 6 to 7 crystals were expected per trial (λ = 6.62). The typical crystal size distribution is shown in Figure 2. The mean size distribution indicates that with an increase in the applied voltage, the size of the crystals also increased. The mean value chart shown in Figure 2b indicates that plates submitted to 4 and 6 kV were most likely to have crystals of 400 to 500 μm in size.
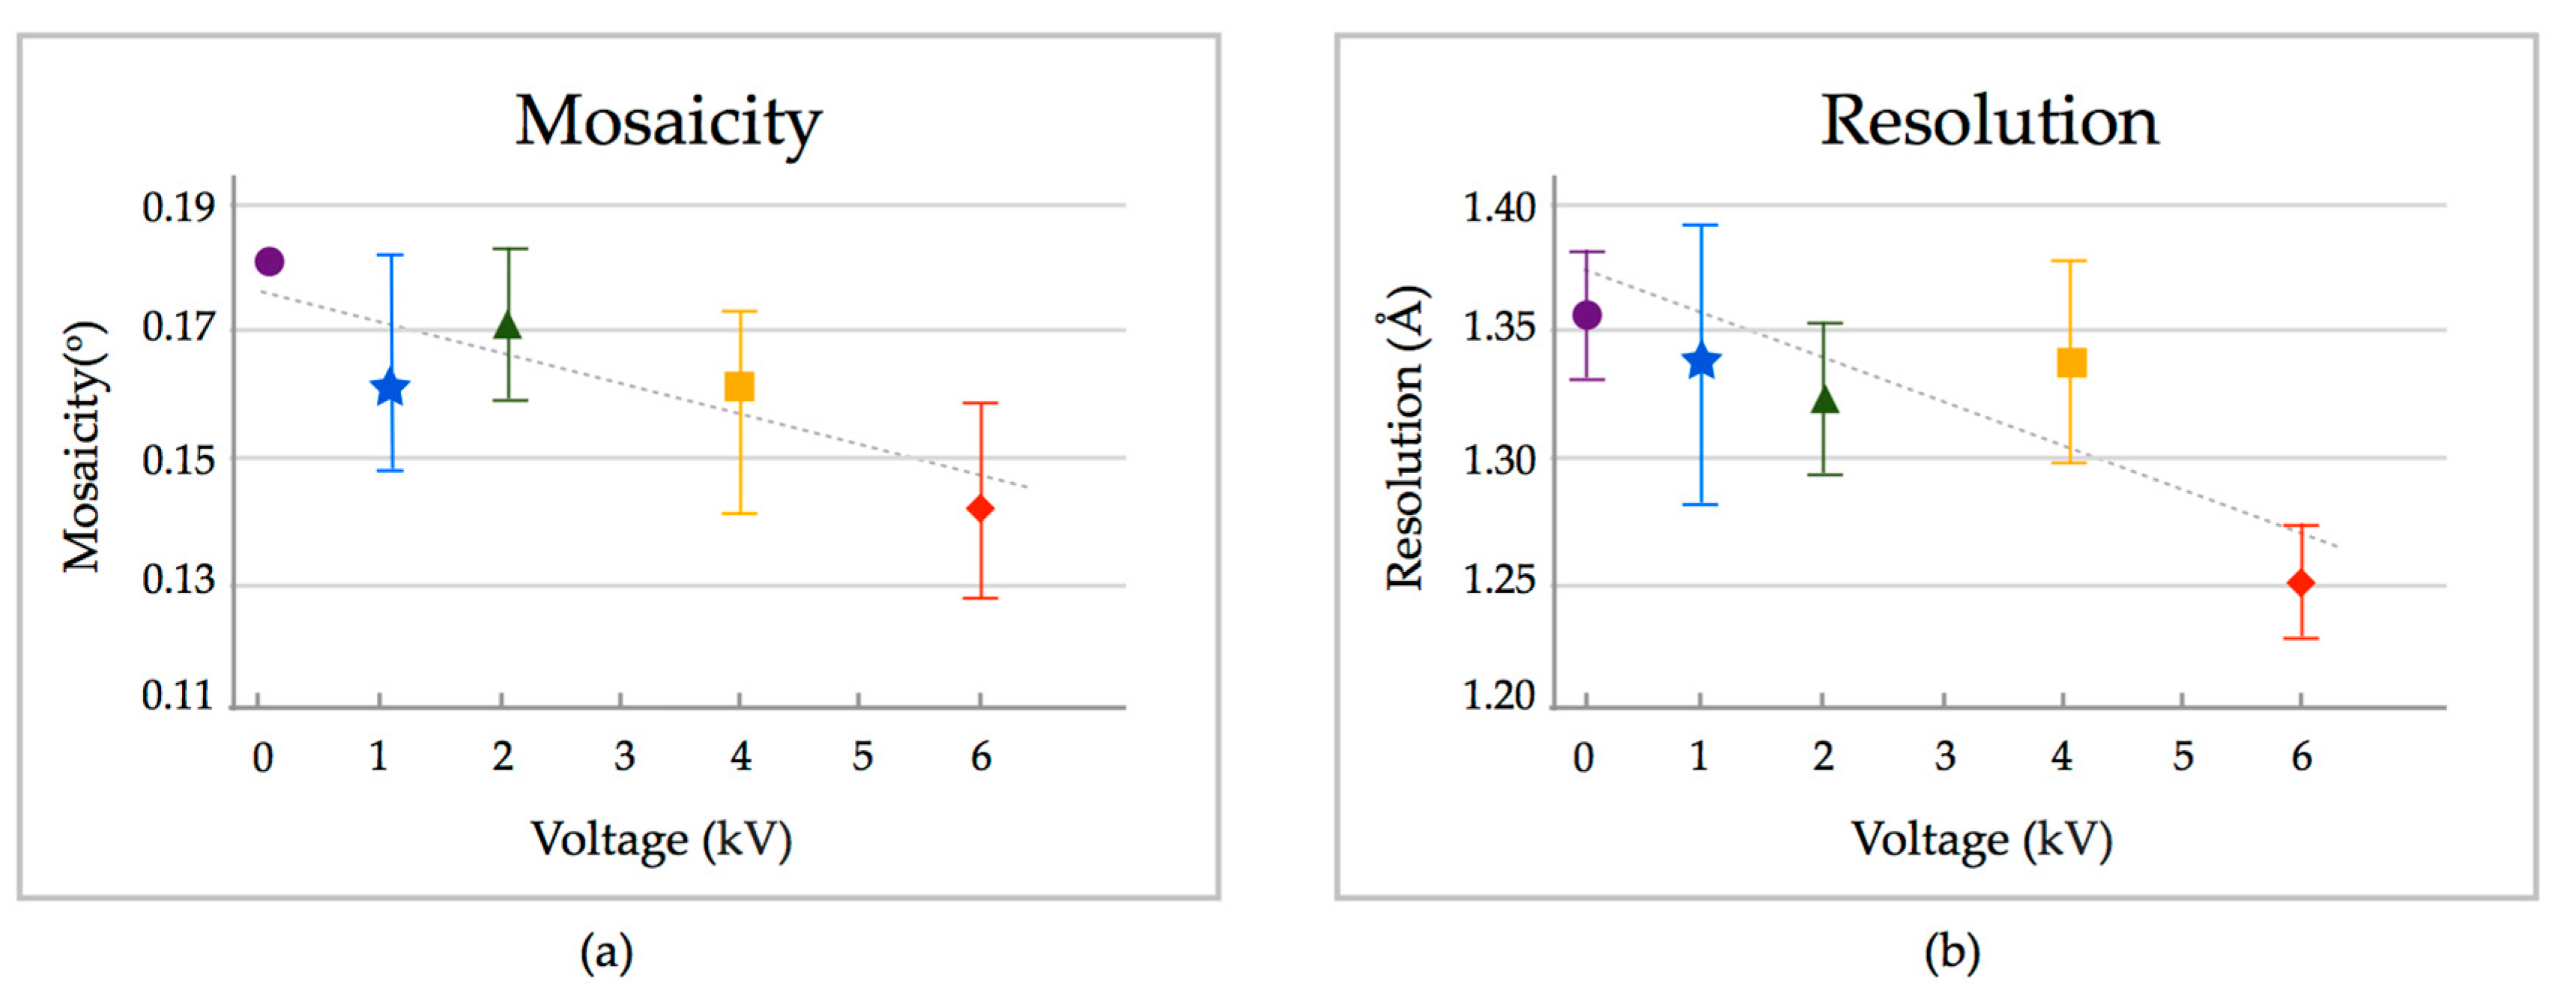
All Glucose Isomerase crystals analyzed belonged to the I222 space group, independent of the electric field applied. Crystal quality parameters were assessed from the X-ray diffraction patterns for three of the five experiments, due to beam time constraints. Parameters such as mosaicity, resolution, and signal-to-noise ratio (I/σI) were recorded for five crystals of similar dimensions randomly chosen from each crystallization plate and analyzed at room temperature. Mosaicity is a measure of disorder in a crystal. The lower the mosaicity, the more organized the molecular packing in the crystal. Lower mosaicity values indicate increased crystalline organization [17,18,19,20,21,22,23,24,25,26,27,28,29,30,31,32,33,34,35,36,37,38,39,40], that is reflected in an improved crystal structure determination. The lower mosaicity values observed for crystals grown under the influence of an electric field in comparison to the mosaicity determined for crystals grown in the absence of an electric field is an indication of the influence of electric fields on the nucleation and crystallization process. As the applied voltage increased, the mosaicity was observed to decrease, as shown in Figure 3a. Diffraction resolution is related to the smallest measurable distance between atoms in a crystal. The resolution values of the crystals grown in an electric field were lower than those determined for crystals grown without an electric field, as illustrated in Figure 3b. This finding indicates that the increase in voltage improved the diffraction resolution, giving the possibility of a more detailed structure determination and a better understanding of the molecular function.
3. Discussion
Improved crystal quality for macromolecules crystallized in the presence of internal and external electric fields has been reported by several authors. Initial crystallization trials conducted with the Efield microbatch device were performed using HEWL (results not published). The trials included the four DC fields, 1, 2, 4, 6 kV, as well as crystallization plates not submitted to an external electric field that served as a control. HEWL crystals grew larger in size and the number of crystals per well diminished for increasing electric field intensities. Similar results were reported by other authors [18,19,20,21,22,24,25,30,31,32,33,34,35,36,37], including reports that HEWL crystals formed preferentially close to the oil-growth solution interface [34]. Crystal alignment with the electric field was also observed [28,29,30,31,32,33,34,35,36,37]. X-ray diffraction analysis confirmed the increase in crystal quality with increasing field intensity [19]. Rocking curve measurements on different crystallographic planes, reported by the Koizumi’s group [35,36], showed the differential effect of the electric field. These measurements require specific experimental arrangements and are not available on the standard macromolecular crystallography synchrotron beam lines, but can provide valuable information on the growth process.
Glucose Isomerase from Streptomyces rubiginosus was crystalized in the Efield microbatch device in the presence of four different electric field intensities (applied DC voltages: 1, 2, 4, 6 kV) and, for a control, in the absence of a field. The intensity of the electric field provided by the setup according to the applied voltage was estimated with the help of Autodesk Inventor 2013 (https://www.autodesk.com/education/free-software/inventor-professional) and Ansoft Maxwell 3D version 12 software (http://ansoft-maxwell.narod.ru/en/CompleteMaxwell3D_V11.pdf). The results of these simulations were viewed in cross-section and included the finite element mesh used by the Maxwell 3D software: the voltage, the magnitude of the electric field, and the electric field vector lines within the model. The estimated electric field varied from ~102 V/m to ~103 V/m for the DC voltages applied. An example of the field intensity at different positions in the microbatch plate is shown in Figure 4 for a single well with an applied DC voltage of 6 kV.
Light microscopy analysis of GI crystals showed a decrease in the nucleation rate and an increase in crystal size with the increase in applied voltage. Poisson distribution analysis of the number of crystals per trial, shown in Figure 1b, indicates that the best response to an electric field would be achieved with applied voltages around 5 kV. The microbatch Efield device has been designed to supply pre-fixed voltages of 1, 2, 4, and 6 kV. To be able to select different DC voltages for the experiment would require a design modification, which is being pursued. X-ray diffraction analysis indicated that crystals grown in the presence of an electric field have lower mosaicity and present higher diffraction resolution [19,20,21,22,23,24,25,26,27,28,29,30,31,32,33,34,35,36], showing that the crystallization process improved in the presence of electric fields. The field intensity of the order of 3 × 10³ V/m is in accord with the field intensity estimated by Chin et al. [20], 1.5 × 10³ V/m, for the crystallization of human placental estradiol 17beta-dehydrogenase. However, it is three or four orders of magnitude smaller than those reported for HEWL crystallization in the presence of an external electric field ~106–107 V/m [18,24,34].
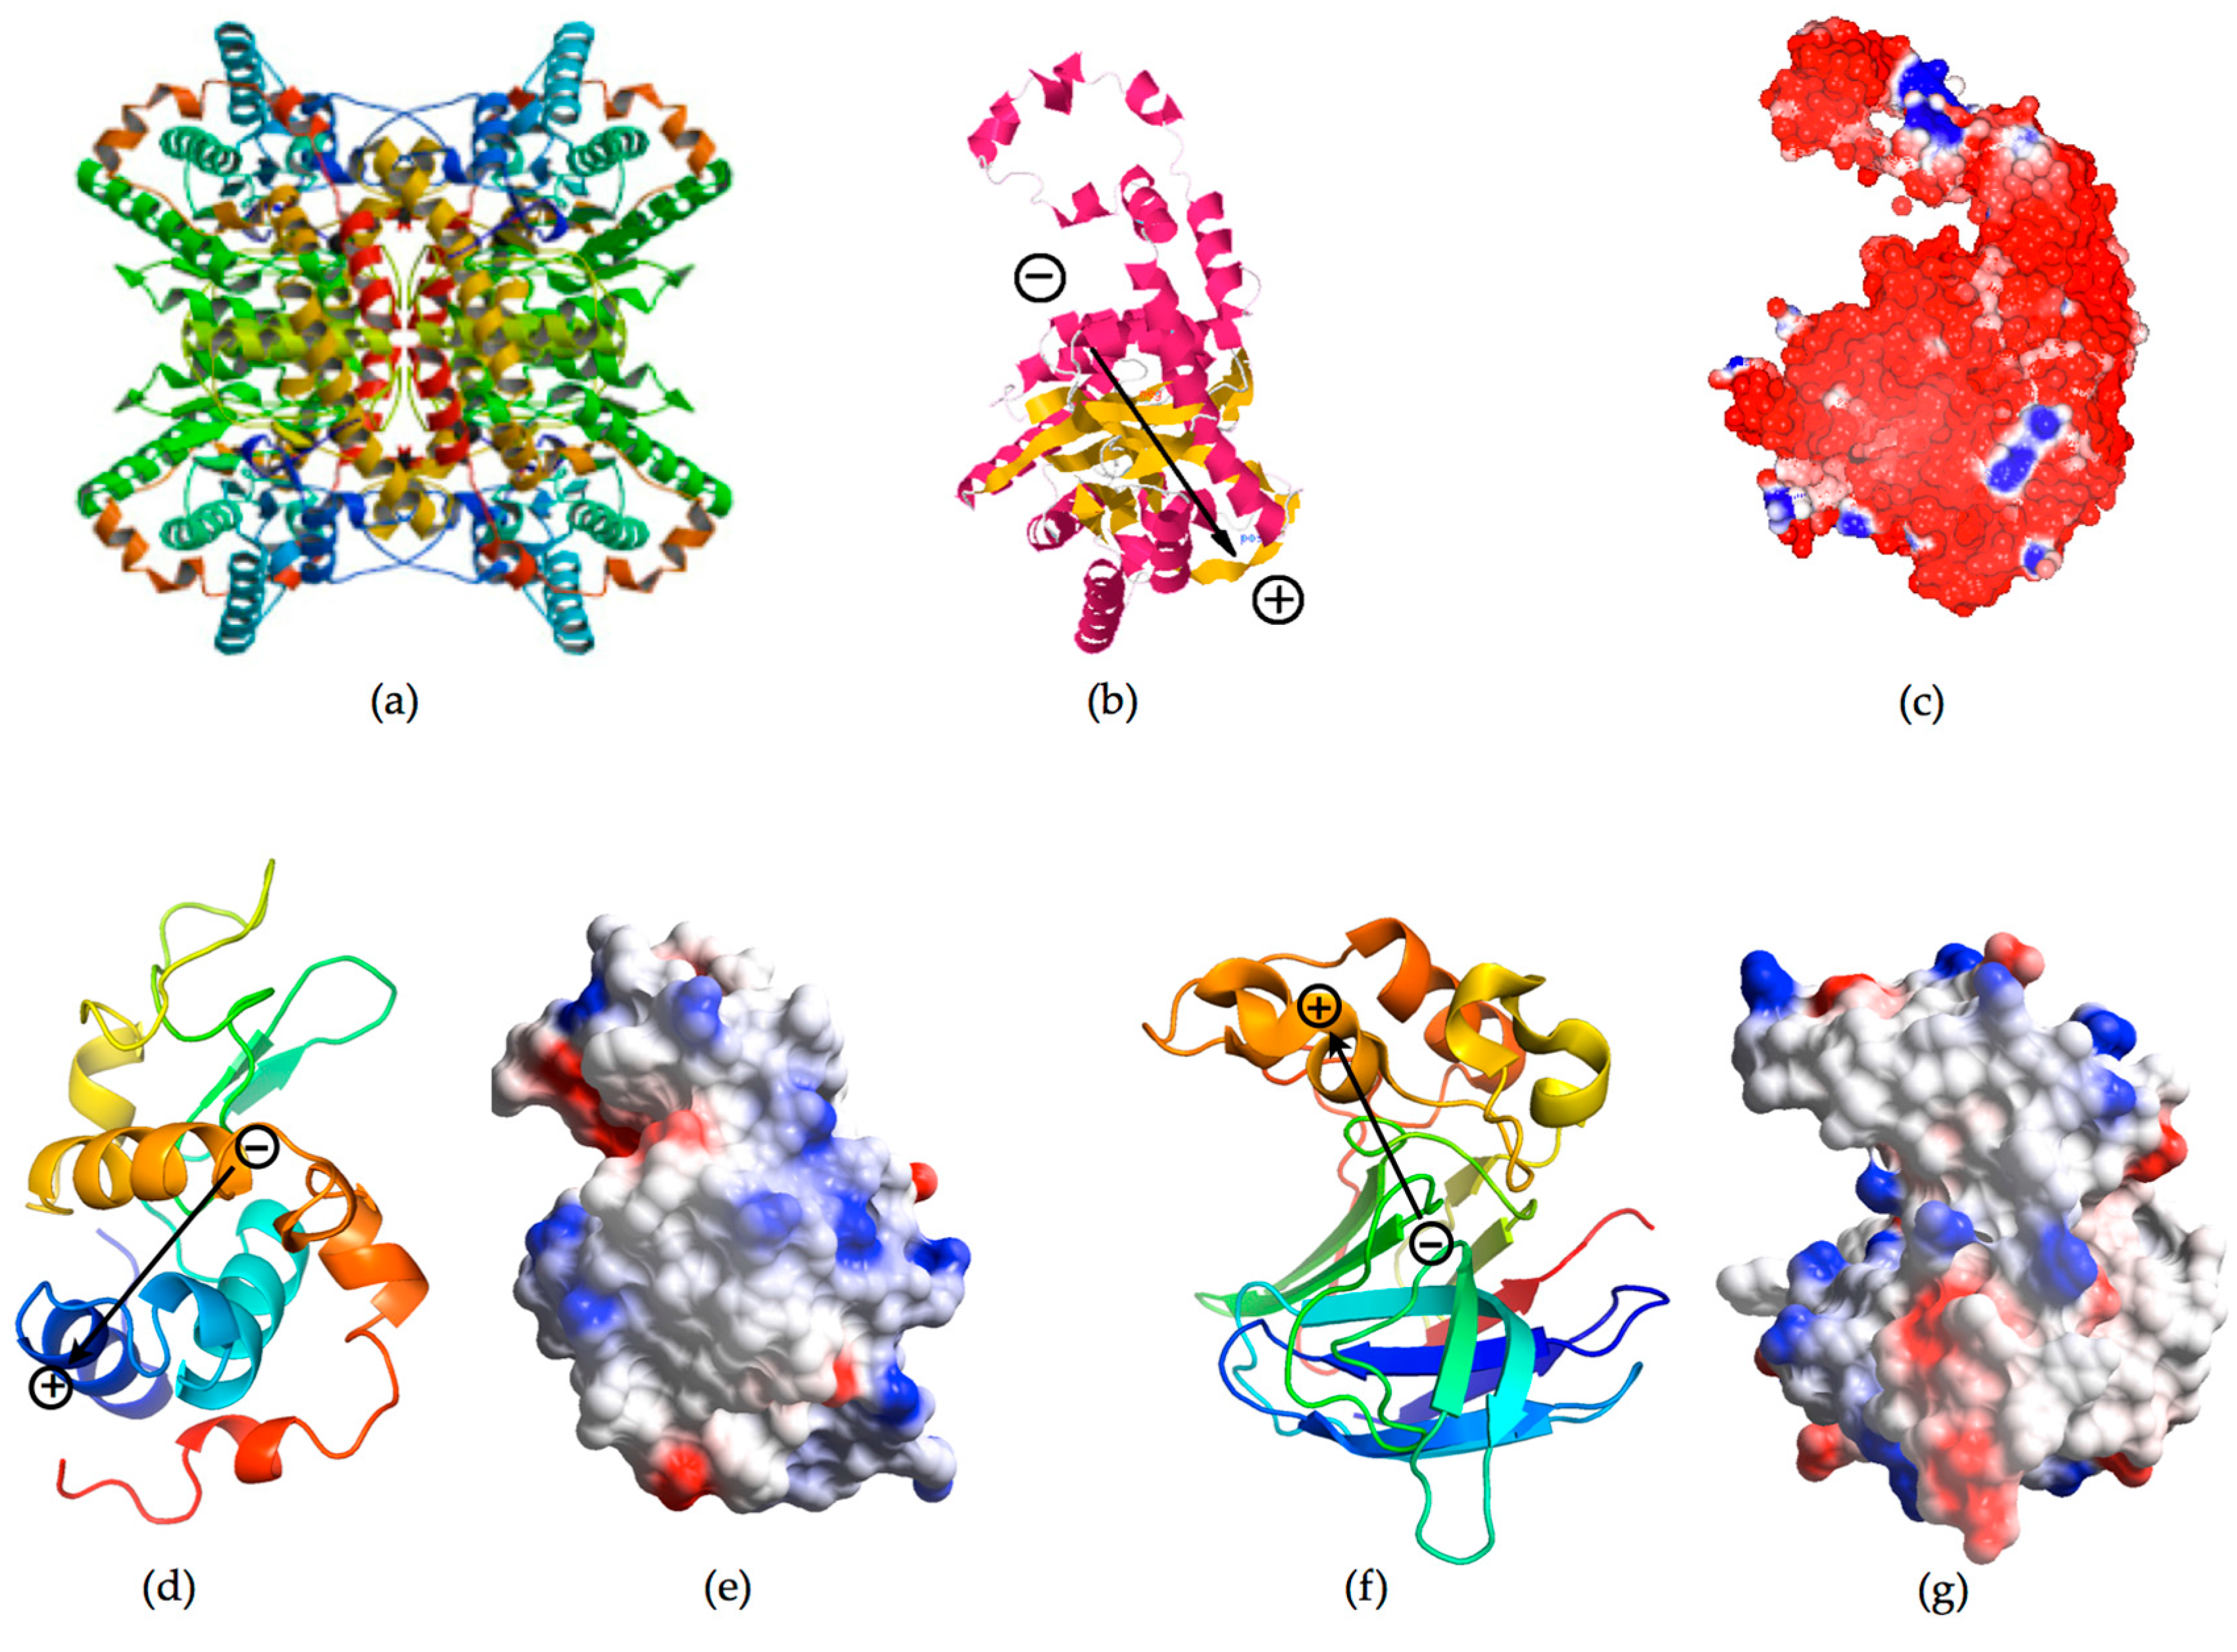
The electric dipole moment of Glucose Isomerase from Streptomyces rubiginosus was determined using the crystal structure reported in the protein data bank (PDB ID 4A8L) as input to the online software provided by the Weizman Institute, Israel (http://dipole.weizmann.ac.il) [41]. The monomer showing the electric dipole moment vector and surface charge (Coot: http://lmb.bioch.ox.ac.uk/coot/) [42] are represented in Figure 4. The electric dipole moment for other macromolecules frequently crystallized in the presence of an external electric field was also determined (Table 1). The dipole moment of HEWL (PDB ID 193L), 198D, is about 10 times smaller than the dipole moment determined for Glucose Isomerase (PDB ID 4A8L), 1045D. Furthermore, the magnitude of the molecular charge of HEWL is two times smaller and of a positive nature than the charge of Glucose Isomerase that is of a negative nature.
The differences observed in the dipole moment, net molecular charge, and ratio between the number of positive and negative residues may explain the differences in field intensities reported to be required for the crystallization of HEWL. It may also explain the different behavior presented by GI and HEWL crystals grown in the E-field microbatch device. While GI crystals tended to grow closer to the bottom and sides of the well in the presence of an electrical field, HEWL crystals grown in the same crystallization device could be observed preferentially at the oil-growth solution interface. The later was also observed by Koizumi et al. [34] who reported that HEWL crystals tend to be located at the oil-growth solution interface when grown in the presence of an AC external electric field. There is no question that crystallization in the presence of an electrical field leads to higher quality crystals [19,37], as was also observed for the GI crystals analyzed that were grown in a DC external field.
The smaller number of GI crystals observed for the higher fields may be traced back to a decrease in the nucleation rate with the increase of the DC field. Smaller nucleation rates reflected in the reduced numbers of crystals have been reported for HEWL crystallized in the presence of constant electrical fields [18,19]. Recent crystallization studies in the presence of AC electric fields have demonstrated that it is possible to control the nucleation rate of HEWL [34], although electrical fields applied were two to three orders of magnitude higher.
Thermodynamic studies and the classical theory of nucleation [43,44] indicate that electric fields may increase or decrease the free energy required for nucleation. On the other hand, the nucleation barrier height to nucleation is proportional to surface tension, and therefore a small change in surface tension may lead to significant changes in the nucleation rate. Electric fields with a strength of 105 to 106 V/m were reported in the control of the nucleation of NaCl crystals and the crystallization of other small molecules in aqueous mediums [43]. These electric fields actually cause a decrease in the values of kinetic parameters and, in the case of small molecules, stimulate the nucleation rate for crystallization conditions in saturated solutions. Contrary to the results observed for the crystallization of small molecules in the presence of electric fields, a drastic decrease in the number of nuclei is observed for crystallization of biological macromolecules in the presence of constant electric fields [18,19,21,24]. In fact, it seems to be possible to control nucleation through AC electric fields [35].
All reports so far have concluded that the crystallization of macromolecules in the presence of electric fields leads to a decrease of nucleation sites, and crystals tend to be significantly larger in size and of better crystallographic quality. However, there are still several questions to be answered. It is therefore important to consider the nature and properties of the macromolecule to be crystallized in the presence of an electrical field. The knowledge of the molecular properties should allow for the optimization of the intensity and nature of the field to be applied, allowing the study of the effect of a single parameter in this multiparametric process that is the crystallization of macromolecules.
4. Materials and Methods
4.1. Electric Field Crystallization Device—Efield Microbatch
The Efield microbatch device was designed with the intent to take advantage of existing crystallization methods to study the effect of a DC external field on the crystallization process of macromolecules. The first design included a high voltage power supply; it was bulky and not easily accessible. A second design was developed focusing on the ease for temperature control and mobility. The device is compact enough to fit into an incubator. The schematics and image of the device are shown in Figure 5.
4.2. Electric Field Simulation
The electric field experiment was simulated to better visualize the field’s effect on the protein droplets (Figure 6). Two programs were used in the simulation process: Autodesk Inventor 2013 and Ansoft Maxwell 3D version 12. Maxwell 3D is a simulation program that uses finite element analysis to solve electromagnetic fields on structures such as electric motors and other electromechanical devices. Inventor is a CAD program used for designing and drawing 3D objects. Inventor was used to draw the structures for the simulation, including the 72-well Terasaki plate with a lid, copper voltage plates, mineral oil droplets, and protein droplets. The structures were imported into Maxwell to perform the field simulations.
In Maxwell, the system was first defined as electrostatic, which set up the simulator for electric field calculations. The imported structures were assigned materials from Maxwell’s materials library. The microbatch plate and lid were assigned polystyrene, the voltage plates assigned copper, and the background assigned air. The protein droplets were assigned seawater, a good approximation since the major components of the droplets are water and salt in high concentration. There was no mineral oil available in the Maxwell library, so the material was user-generated using the relative permittivity and conductivity of real mineral oil. Voltages were assigned to the copper electrodes, with the top electrode being a positive voltage between 1 kV and 6 kV and the bottom electrode being 0 V. The last step was assigning the level of solution accuracy. This value was set to achieve an error of less than 0.0001%, forcing the program to refine its finite mesh and recalculate until the high accuracy was met.
4.3. Crystallization Conditions in Electric Fields
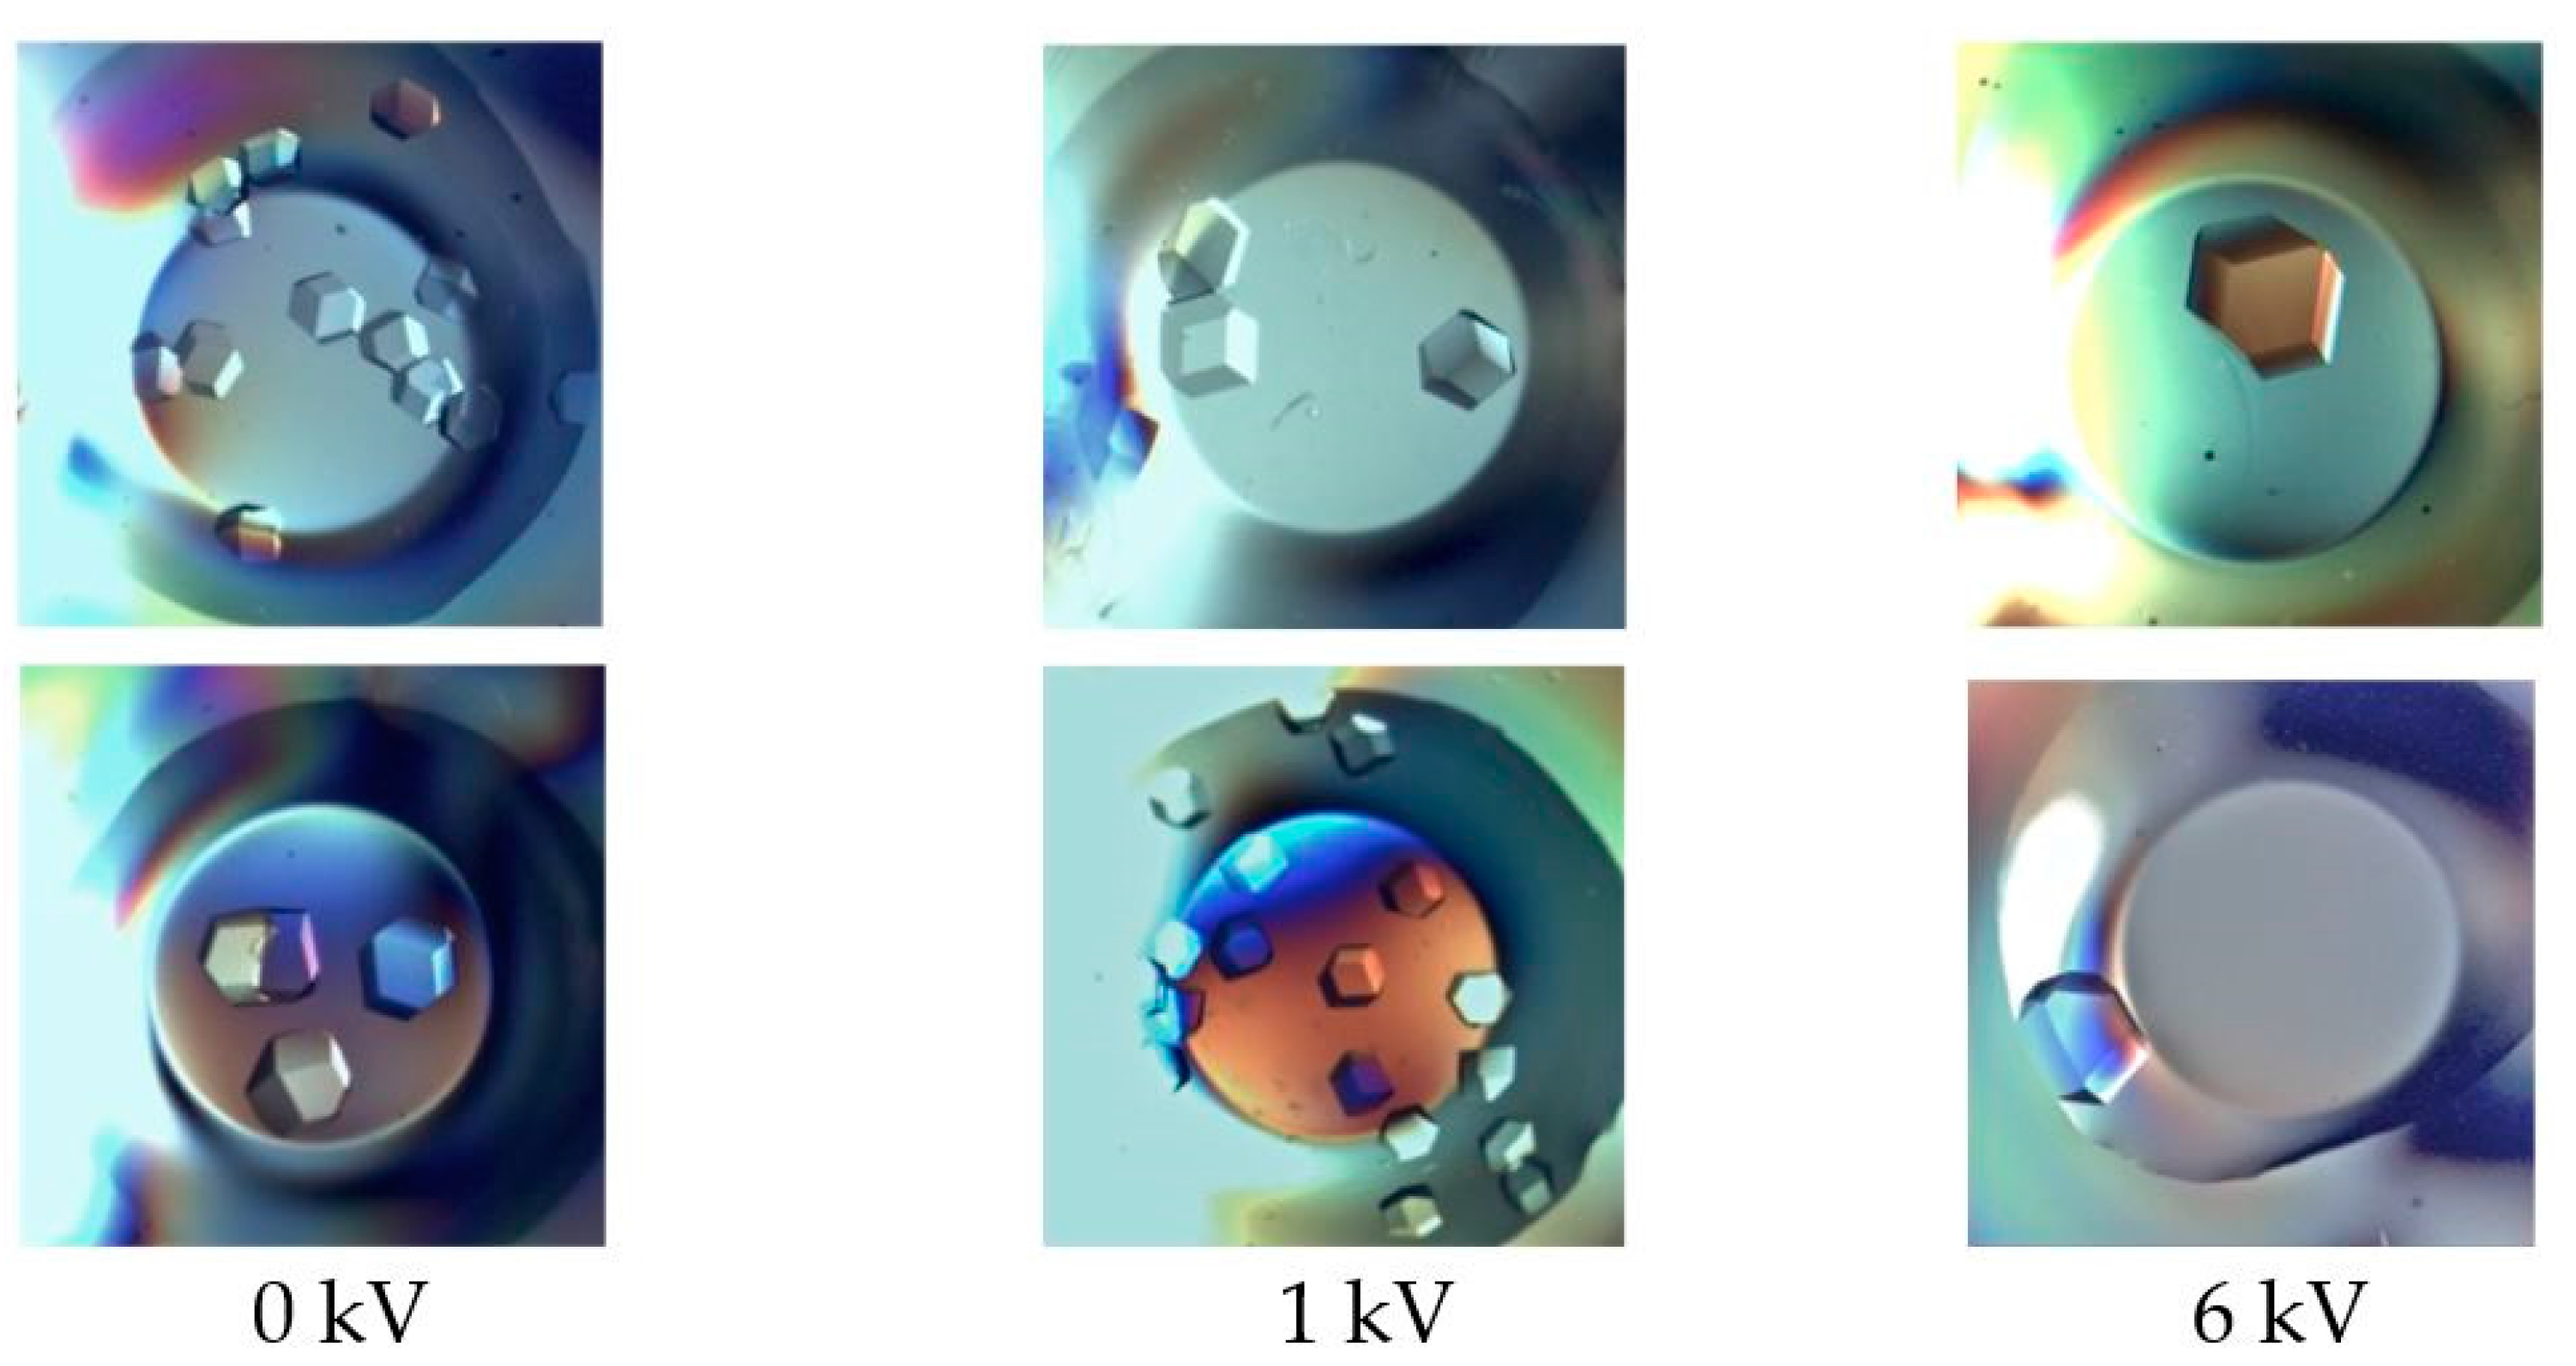
Glucose Isomerase from Streptomyces rubiginosus was crystallized in the microbatch method developed by Chayen [38,39]. Glucose Isomerase (HR7-102) purchased from Hampton Research was dialyzed versus 10 mM HEPES pH 7.0 and 1 mM magnesium chloride (MnCl2) (Sigma-Aldrich, St. Louis, MO, USA). Concentration of the dialyzed solution was measured using a UV-VIS (Thermo Spectronic spectrophotometer; Thermo-Fisher, Waltham, MA, USA). Several crystallization conditions were screened to find an optimal precipitant, acidity, and protein concentration. Crystallization conditions were obtained by mixing 1 μL of 60 mg/mL Glucose Isomerase with 1 μL sodium citrate (Sigma Aldrich); drops were covered with 10 μL mineral oil (Sigma Aldrich). Each experiment consisted of five 72-well microbatch crystallization plates, HR3-081 (Hampton Research, Aliso Viejo, CA, USA). For each experiment, five plates were prepared and submitted to five different DC voltages: 0, 1, 2, 4, and 6 kV for a 48-h period. For each trial, protein and crystallization solutions were prepared fresh. Five individual experimental sets were carried out to verify reproducibility over a period of two month. All experiments were carried out at room temperature, 20 ± 1 °C. At the end of each experiment, the five microbatch plates were stored in an incubator at 18 °C. Each individual plate was analyzed with a visible light microscope equipped with polarizers (Olympus ZTE 70; Olympus Scientific, Waltham, MA, USA). Each well, 72 per crystallization plate, was photographed, and the number of crystals and their size were recorded (Figure 7). Crystal size was determined while pictures were being recorded directly from the microscope, and later dimensions were confirmed using the open source software ImageJ (https://imagej.net/ImageJ).
4.4. Crystal Quality Assessment
For each condition, five Glucose Isomerase crystals of similar dimensions were randomly selected for each experiment. Crystals were mounted on MicroRT™ (MiTeGen LLC) capillary system. Then, 5 μL of mother liquor was added to the transparent polymer capillaries to prevent dehydration. X-ray diffraction data was collected at the X6A beam line at the National Synchrotron Light Source; the wavelength was kept constant at 0.799 Å and crystal rotation per frame 0.5°. Exposure times varied between 1 s and 10 s, depending on the electric field applied. For each crystal, 40 images and a total of 20 degrees were recorded, however, to minimize possible effects of radiation damage, only the first 10 frames were used to assess the crystal quality. All diffraction images were analyzed with the HKL2000 software package [45]. Parameters such as mosaicity, resolution, and signal-to-noise ratio (I/σI) were recorded and reported in this paper. For each experiment and for each individual crystallization plate, five crystals were exposed to X-rays for statistical analyses; in total, 75 crystals were processed for statistics. The average mosaicity and resolution recorded for each of the applied voltages were recorded (Figure 3).
Acknowledgments
We thank Dennis Poshka for his assistance in the design and construction of the external DC electric field device. Evgeniya Rubin and Christopher Owen thank the support received from the DOE Summer Undergraduate Laboratory Internship (SULI) program. The X6A beam line is funded by the National Institute of General Medical Sciences under agreement GM-0080. The National Synchrotron Light Source, Brookhaven National Laboratory was supported by the US Department of Energy under contract #DE-AC02-98CH10886. The LSBR is funded by the Department of Energy (DOE) BER program and the NIH NIGMS grant #.
Author Contributions
Vivian Stojanoff conceived and designed the experiments; Evgeniya Rubin and Vivian Stojanoff performed the experiments; Christopher Owen build and tested the DC external electric field device under Vivian Stojanoff guidance; Evgeniya Rubin, Christopher Owen and Vivian Stojanoff analyzed the data; Vivian Stojanoff wrote the paper.
Conflicts of Interest
The authors declare no conflict of interest. The founding sponsors had no role in the design of the study; in the collection, analyses, or interpretation of data; in the writing of the manuscript, and in the decision to publish the results.
References
- McPherson, A. Crystallization of Biological Macromolecules; Cold Spring Harbor Laboratory Press: New York, NY, USA, 1999; 402p. [Google Scholar]
- Chayen, N.E.; Helliwell, J.R., Jr.; Snell, E.H. Macromolecular Crystallization and Crystal Perfection. In IUCr Monographs on Crystallography 24; Oxford University Press: Oxford, UK, 2010; 21p., ISBN 978-0-19-921325-2. [Google Scholar]
- Allegre, C.J.; Provost, A.; Jaupart, C. Oscillatory zoning: A pathological case of crystal growth. Nature 1981, 294, 223–228. [Google Scholar] [CrossRef]
- Vergara, A.; Lorber, B.; Zagari, A.; Giege, R. Physical aspects of protein crystal growth investigated with the Advanced Protein Crystallization Facility in reduced-gravity environments. Acta Crystallogr. D 2003, 59, 2–15. [Google Scholar] [CrossRef] [PubMed]
- McPherson, A.; DeLuca, L.J. Microgravity protein crystallization. NPJ Microgravity 2015, 1, 15010. [Google Scholar] [CrossRef]
- Petsev, D.N.; Thomas, B.R.; Yau, S.; Vekilov, P.G. Interactions and aggregation of apoferritin molecules in solution: Effects of added electrolytes. Biophys. J. 2000, 78, 2060–2069. [Google Scholar] [CrossRef]
- Garcia-Ruiz, J.M.; Moreno, A.; Viedma, C.; Coil, M. Crystal quality of lysozyme single crystas grown by the gel acupuncture method. Mater. Res. Bull. 1993, 28, 541–546. [Google Scholar] [CrossRef]
- Garcia-Ruiz, J.M. Counterdiffusion Methods for Macromolecular Crystallization. Methods Enzimol. 2003, 368, 130–154. [Google Scholar] [CrossRef]
- Rummel, G.; Hardmeyer, A.; Widmer, C.; Chiu, M.L.; Nollert, P.; Locher, K.P.; Pedruzzi, I.; Landau, E.M.; Rosenbusch, J.P. Lipidic Cubic Phases: New Matrices for the three-dimensional crystallization of membrane proteins. J. Struct. Biol. 1998, 121, 82–91. [Google Scholar] [CrossRef] [PubMed]
- Caffrey, M. A comprehensive review of the lipid cubic phase or in meso method for crystallizing membrane and soluble porteins and complexes. Acta Crystallogr. F 2015, 71, 3–18. [Google Scholar] [CrossRef] [PubMed]
- Chayen, N.E. A novel technique for containerless protein crystallization. Protein Eng. Des. Sel. 1996, 9, 927–929. [Google Scholar] [CrossRef]
- Govada, L.; Leese, H.S.; Saridakis, E.; Kassen, S.; Chain, B.; Khurshid, S.; Menzel, R.; Hu, S.; Shaffer, M.S.P.; Chayen, N.E. Exploring Carbon Nanomaterial Diversity for Nucleation of Protein Crystals. Sci. Rep. 2016, 6, 20053. [Google Scholar] [CrossRef] [PubMed]
- Bergfors, T. Screening and optimization methods for nonautomated crystallization laboratories. Methods Mol. Biol. 2007, 363, 131–151. [Google Scholar] [PubMed]
- Bergfords, T. Seeds to crystals. J. Struct. Biol. 2003, 142, 66–76. [Google Scholar] [CrossRef]
- Wakayama, N.I. Effects of a Strong Magnetic Field on Protein Crystal Growth. Cryst. Growth Des. 2003, 3, 17–24. [Google Scholar] [CrossRef]
- Surade, S.; Ochi, T.; Nietlispach, D.; Chirgadze, D.; Moreno, A. Investigations into Protein Crystallization in the Presence of a Strong Magnetic Field. Cryst. Growth Des. 2010, 10, 691–699. [Google Scholar] [CrossRef]
- Moreno, A.; Yokaichiya, F.; Dimasi, E.; Stojanoff, V. Growth and Characterization of high-quality protein crystals for X-ray crystallography. Ann. N. Y. Acad. Sci. 2009, 1161, 429–436. [Google Scholar] [CrossRef] [PubMed]
- Hammadi, Z.; Veesler, S. New approaches on crystallization under electric fields. Prog. Biophys. Mol. Biol. 2009, 101, 38–44. [Google Scholar] [CrossRef] [PubMed]
- Pareja-Rivera, C.; Cuéllar-Cruz, M.; Esturau-Escofet, N.; Demitri, N.; Polentarutti, M.; Stojanoff, V.; Moreno, A. Recent Advances in the Understanding of the Influence of Electric and Magnetic Fields on Protein Crystal Growth. Cryst. Growth Des. 2017, 17, 135–145. [Google Scholar] [CrossRef]
- Chin, C.C.; Dence, J.B.; Warren, J.C. Crystallization of human placental estradiol 17beta-dehydrogenase. A new method for crystallizing labile enzymes. J. Biol. Chem. 1976, 251, 3700–3705. [Google Scholar] [PubMed]
- Taleb, M.; Didierjean, C.; Jelsch, C.; Mangeot, J.P.; Capelle, B.; Aubry, A. Crystallization of proteins under an external electric field. J. Cryst. Growth 1999, 200, 575–582. [Google Scholar] [CrossRef]
- Taleb, M.; Didierjean, C.; Jelsch, C.; Mangeat, J.P.; Aubry, A. Equilibrium kinetics of lysozyme crystallization under an external electric field. J. Cryst. Growth 2001, 232, 250–255. [Google Scholar] [CrossRef]
- Ries-Kautt, M.; Ducruix, A. From solution to crystals with a physico-chemical aspect. In Crystallization of Nucleic Acids and Proteins: A Practical Approach, 2nd ed.; Ducruix, A., Giégé, R., Eds.; Oxford University Press: Oxford, UK, 1999; pp. 269–312. [Google Scholar]
- Nanev, C.N.; Penkova, A. Nucleation of lysozyme crystals under external electric, ultrasonic fields. J. Cryst. Growth 2001, 232, 285–293. [Google Scholar] [CrossRef]
- Nanev, C.N.; Penkova, A. Nucleation and growth of lysozyme crystals under external electric field. Colloids Surf. A Physicochem. Eng. Asp. 2002, 209, 139–145. [Google Scholar] [CrossRef]
- Garetz, B.A.; Matic, J.; Myerson, A.S. Polarization Switching of Crystal Structure in the Nonphotochemical Light-Induced Nucleation of Supersaturated Aqueous Glycine Solutions. Phys. Rev. Lett. 2002, 89, 175501. [Google Scholar] [CrossRef] [PubMed]
- Penkova, A.; Gliko, O.; Dimitrov, I.L.; Hodjaoglu, F.V.; Nanev, C.; Vekilov, P.G. Enhancement and suppression of protein crystal nucleation due to electrically driven convection. J. Cryst. Growth 2005, 275, e1527–e1532. [Google Scholar] [CrossRef]
- Mirkin, N.; Frontana-Uribe, B.A.; Rodriguez-Romero, A.; Hernandez-Santoyo, A.; Moreno, A. The influence of an internal electric field upon protein crystallization using the gel-acupuncture method. Acta Crystallogr. 2003, D59, 1533–1538. [Google Scholar] [CrossRef]
- Moreno, A.; Sazaki, G. The use of a new ad hoc growth cell with parallel electrodes for the nucleation control of lysozyme. J. Cryst. Growth 2004, 264, 438–444. [Google Scholar] [CrossRef]
- Nieto-Mendoza, E.; Frontana-Uribe, B.A.; Sazaki, G.; Moreno, A. Investigations on electromigration phenomena for protein crystallization using crystal growth cells with multiple electrodes: Effect of the potential control. J. Cryst. Growth 2005, 275, e1437–e1446. [Google Scholar] [CrossRef]
- Gil-Alvaradejo, G.; Ruiz-Arellano, R.R.; Owen, C.; Rodriguez-Romero, A.; Rudino-Pinera, E.; Antwi, M.K.; Stojanoff, V.; Moreno, A. Novel Protein Crystal Growth Electrochemical Cell for Applications in X-ray Diffraction and Atomic Force Microscopy. Cryst. Growth Des. 2011, 11, 3917–3922. [Google Scholar] [CrossRef]
- Flores-Hernandez, E.; Stojanoff, V.; Arreguin-Espinosa, R.; Moreno, A.; Sanchez-Puig, N. An electrically assisted device for protein crystallization in a vapor-diffusion setup. J. Appl. Crystallogr. 2013, 46, 832–834. [Google Scholar] [CrossRef] [PubMed]
- Martinez-Caballero, S.; Cuellar-Cruz, M.; Demitri, N.; Polentarutti, M.; Rodriguez-Romero, A.; Moreno, A. Glucose Isomerase Polymorphs Obtained Using an Ad Hoc Protein Crystallization Temperature Device and a Growth Cell Applying an Electric Field. Cryst. Growth Des. 2016, 16, 1679–1686. [Google Scholar] [CrossRef]
- Koizumi, H.; Fujiwara, K.; Uda, S. Role of electric double layer in controlling the nucleation rate for tetragonal hen egg white lysozyme crystals by application of an external electric field. Cryst. Growth Des. 2010, 10, 2591–2595. [Google Scholar] [CrossRef]
- Koizumi, H.; Uda, S.; Fujiwara, K.; Tachibana, M.; Kojima, K.; Nozawa, J. Improvement of crystal quality for tetragonal hen egg white lysozyme crystals under application of an external alternating current electric field. J. Appl. Crystallogr. 2013, 46, 25–29. [Google Scholar] [CrossRef]
- Koizumi, H.; Uda, S.; Fujiwara, K.; Tachibana, M.; Kojima, K.; Nozawa, J. Crystallization of high-quality protein crystals using an external electric field. J. Appl. Crystallogr. 2015, 48, 1507–1513. [Google Scholar] [CrossRef]
- Koizumi, H.; Uda, S.; Fujiwara, K.; Tachibana, M.; Kojima, K.; Nozawa, J. Technique for High-Quality Protein Crystal Growth by Control of Subgrain Formation under an External Electric Field. Crystals 2016, 6, 95. [Google Scholar] [CrossRef]
- Chayen, N.E.; Shaw Stewart, P.D.; Blow, D.M. Microbatch crystallization under oil—A new technique allowing many small-volume crystallization trials. J. Cryst. Growth 1992, 122, 176–180. [Google Scholar] [CrossRef]
- Chayen, N.E.; Shaw Stewart, P.D.; Maeder, D.L.; Blow, D.M. An automated system for micro-batch protein crystallization and screening. J. Appl. Cryst. 1990, 23, 297–302. [Google Scholar] [CrossRef]
- Stojanoff, V. Crystal quality a quest for structural proteomics. In Synchrotron Radiation and Structural Proteomics; Riekel, C., Ed.; Pan Stanford Publishing: Temasek Boulevard, Singapore, 2011; pp. 383–407. [Google Scholar]
- Felder, C.F.; Prilusky, J.; Silman, I.; Sussman, J.L. A server and database for dipole moments of proteins. Nucleic Acids Res. 2007, 35, W512–W521. [Google Scholar] [CrossRef] [PubMed]
- Emsley, P.; Lohkamp, B.; Scott, W.G.; Cowtand, K. Features and development of Coot. Acta Crystallogr. 2010, D66, 486–501. [Google Scholar] [CrossRef]
- Saban, K.; Thomas, J.; Varughese, P.A.; Varghese, G. Thermodynamics of Crystal Nucleation in an External Electric Field. Cryst. Res. Technol. 2002, 37, 1188–1199. [Google Scholar] [CrossRef]
- Warshavsky, V.B.; Bykov, T.V.; Zeng, X.C. Effects of external electric field on the interfacial properties of weakly dipolar fluid. J. Chem. Phys. 2001, 114, 504–512. [Google Scholar] [CrossRef]
- Otwinowski, Z.; Minor, W. Processing of X-ray diffraction data collected in oscillation mode. Method Enzymol. 1997, 276, 307–362. [Google Scholar]
Figure 1.
Distribution of the number of Glucose Isomerase crystals grown by the microbatch method in the presence of an external DC electric field for 48 h. In total, 360 microbatch wells were probed. (a) Number of nucleation sites for the five voltages probed; (b) Poisson distribution of the number of crystals per well indicates that the optimal electric field for crystallization of Glucose Isomerase lies around 5 kV.

Figure 2.
Size distribution of Glucose Isomerase crystals grown by the microbatch method in the presence of an external DC electric field for 48 h. In total, 360 micro batch wells were probed. (a) Crystal size for the five voltages probed; (b) Mean crystal size as a function of applied voltage. The largest crystals were obtained for DC voltages between 4 and 6 kV.
Figure 3.
X-ray crystal quality analysis of Glucose Isomerase crystals grown by the microbatch method in the presence of an external DC electric field for 48 h. In total, 75 crystals grown by the microbatch method were probed; five crystals for each field condition. (a) Average mosaicity; (b) Average diffraction resolution. Color scheme follows that of previous figures; red 6 keV, orange 4 keV, green 2 keV, blue 1 keV and purple 0 keV.

Figure 4.
Top panel: Glucose Isomerase from Streptomyces rubiginosus, nearly 49% of the secondary structure is helical (192 residues in 20 helices) and only 10% is arranged in beta sheets (39 residues in 17 strands): (a) crystal structure (PDB ID 4A8L); (b) monomer showing the electric dipole moment vector (http://dipole.weizmann.ac.il); and (c) surface charge (Coot: http://lmb.bioch.ox.ac.uk/coot/). Bottom panel: Hen Egg White Lysozyme (HEWL) (PDB ID 193L) (d) monomer showing electric dipole moment and (e) surface charge; and Thaumatin (PDB ID 1RQW) (f) monomer showing electric dipole moment and (g) surface charge. Electric dipole moment vector was determined online through http://dipole.weizmann.ac.il and surface charge by Coot: http://lmb.bioch.ox.ac.uk/coot/.

Figure 5.
Crystal Growth Unit: External DC electric field set up. The instrument allows for four DC voltages 0, 1, 2, 4, and 6 KV to be applied to microbatch plates. Copper electrodes are 85 mm × 60 mm. The microbatch plates (Hampton Research) were 10 mm high. The bottom copper electrodes are fixed while the top electrodes are connected to a microbatch plate lid that is kept between crystallization trials. The device is interlocked during a crystallization experiment due to the high voltage being applied. Top view (a) schematics, (b) external DC electric field device with crystallization plates in place. Bottom view (c) the actual device showing the crystallization unit (left in the figure) and the power supply unit (right in the figure).
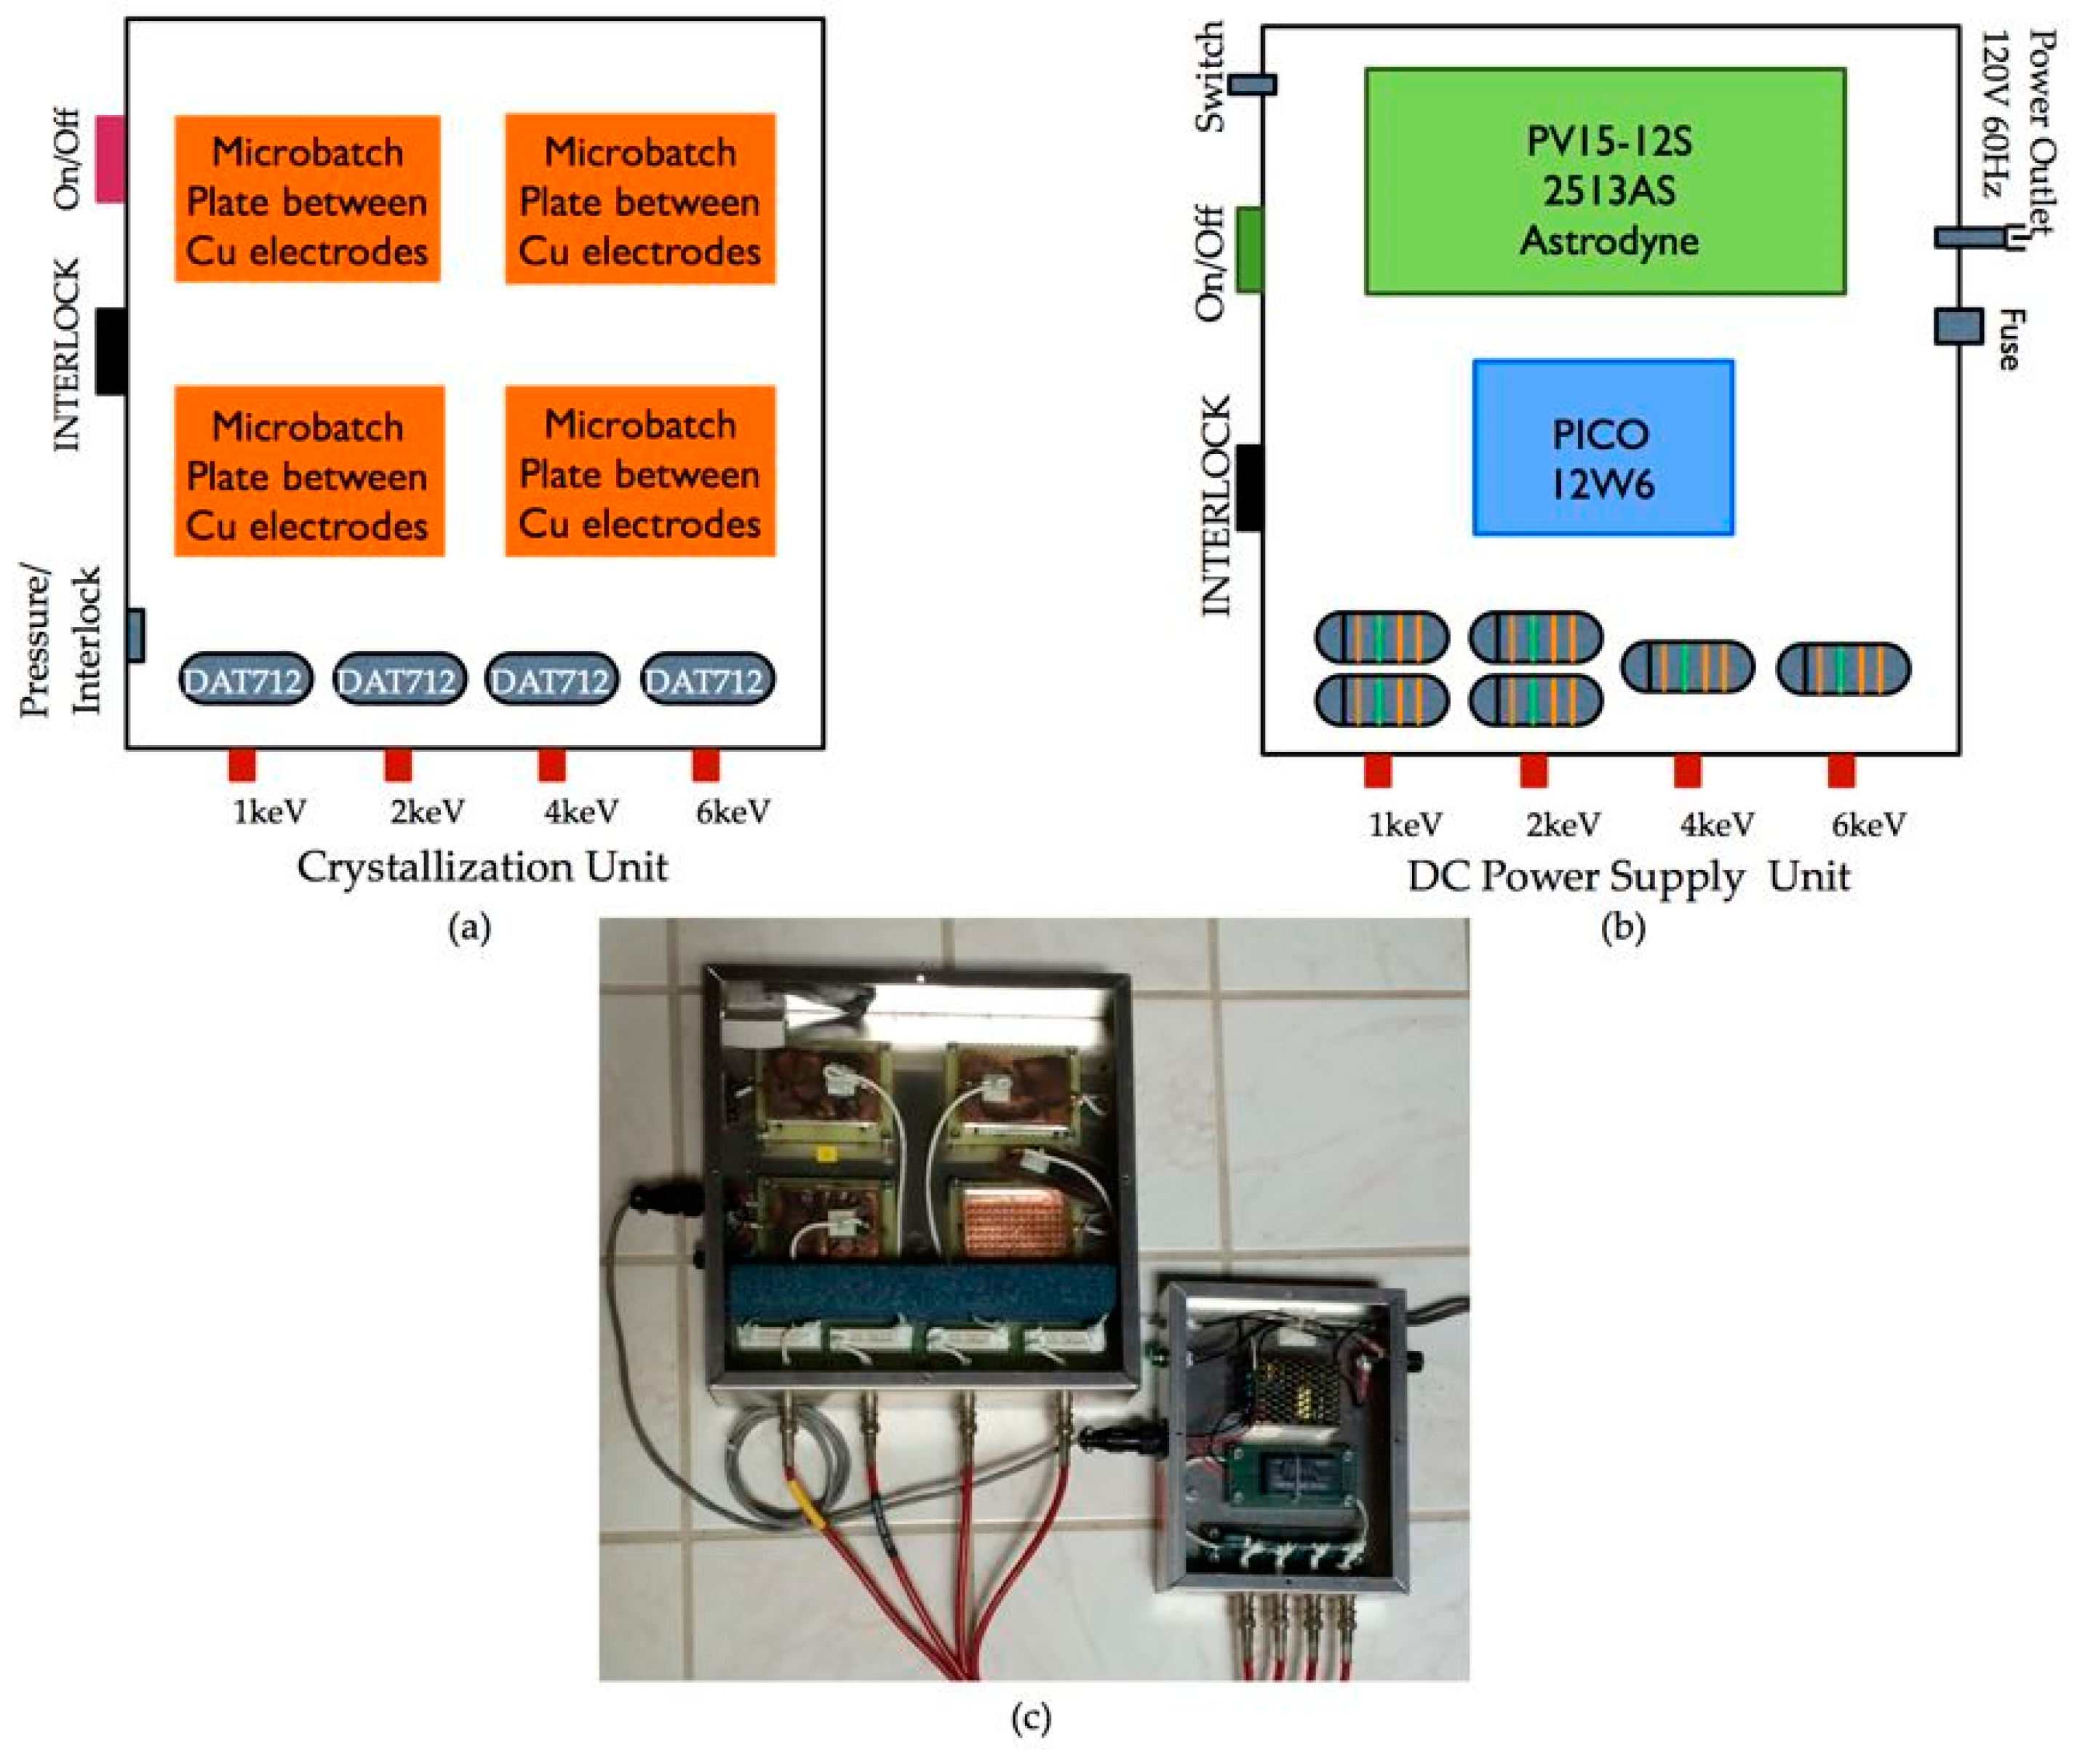
Figure 6.
Electric field intensity simulation for the microbatch plates. A single well is shown for clarity reasons. The false color sequence indicates the intensity of the field.
Figure 6.
Electric field intensity simulation for the microbatch plates. A single well is shown for clarity reasons. The false color sequence indicates the intensity of the field.
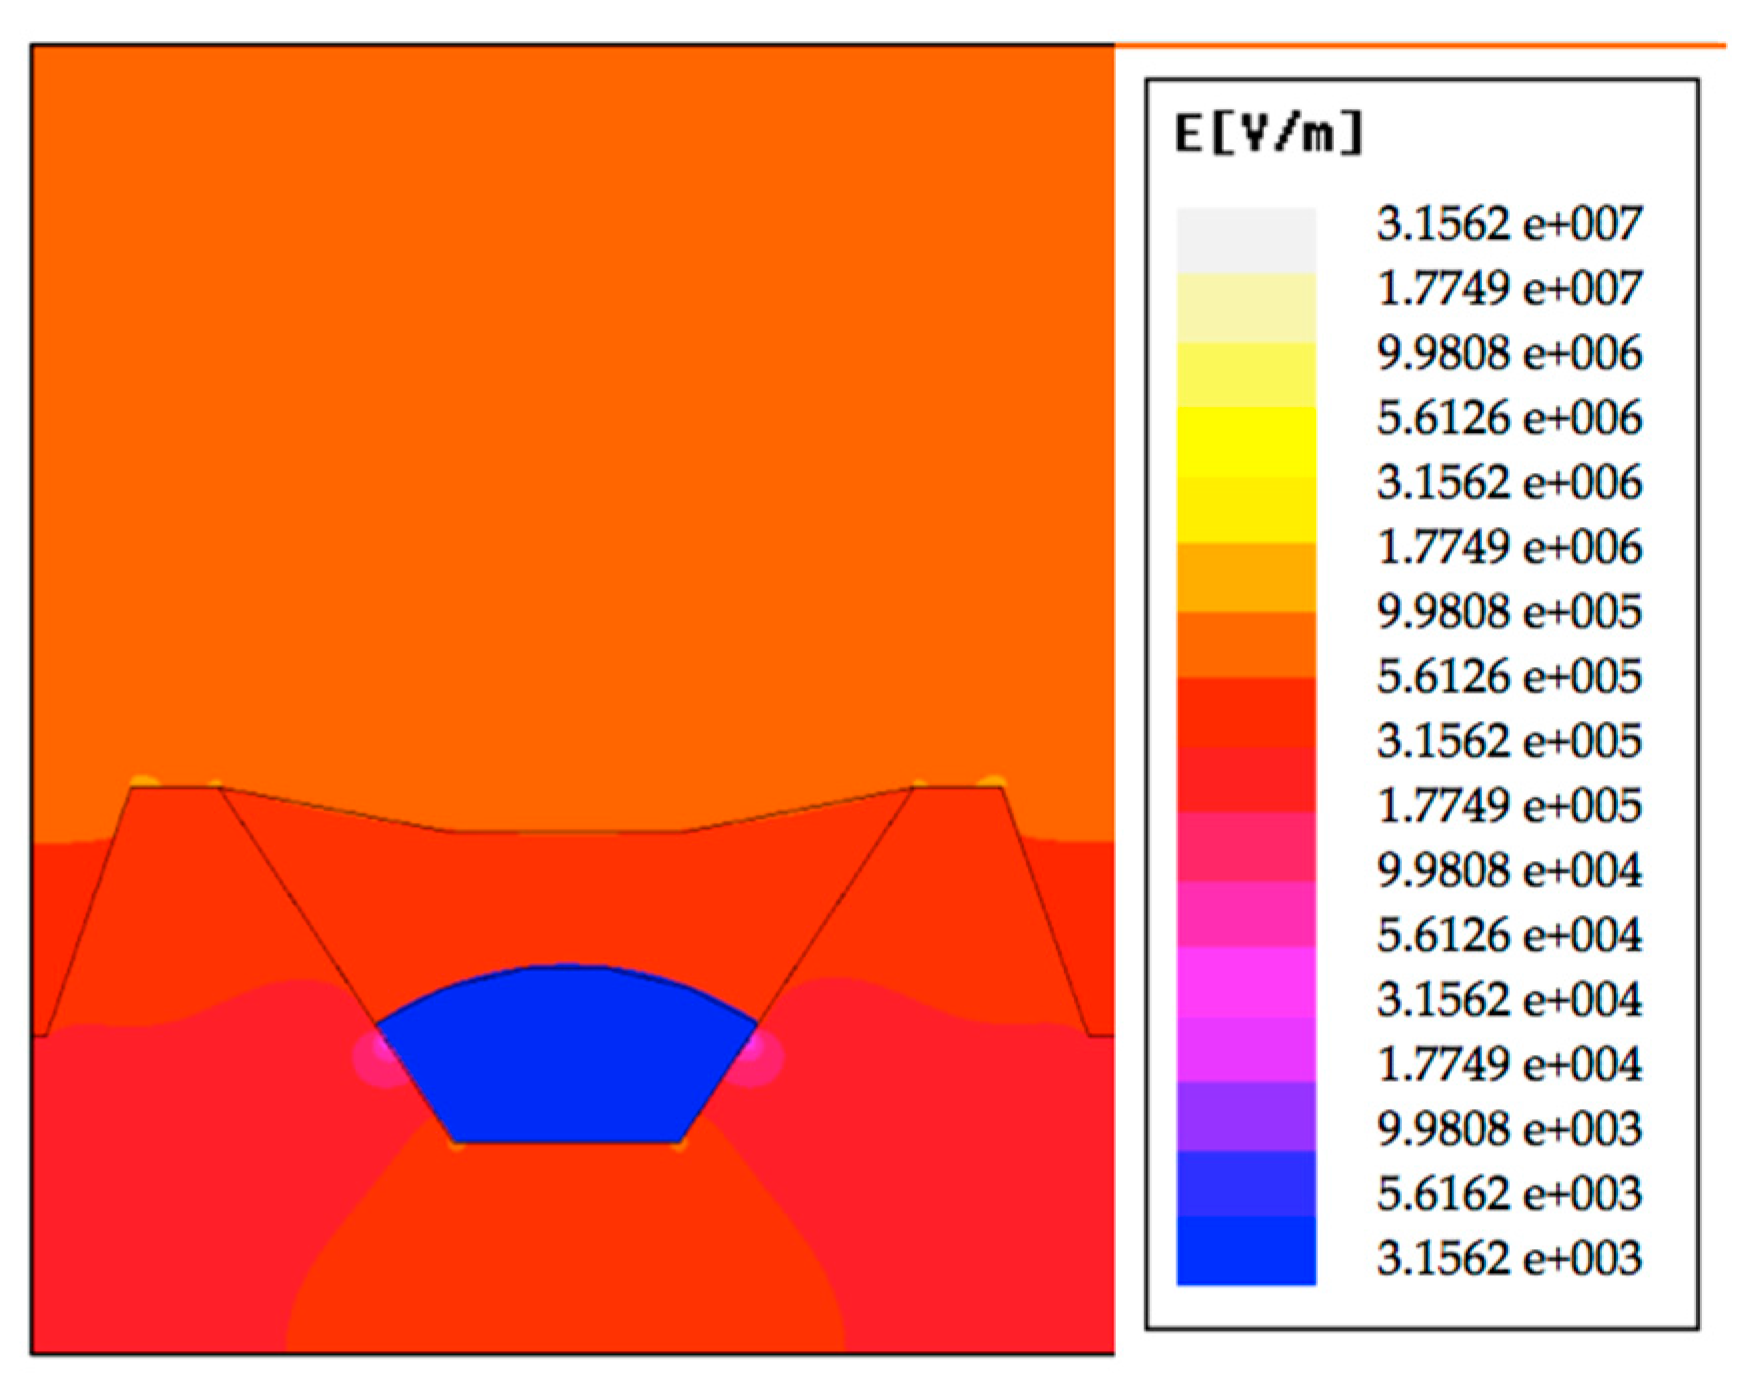
Figure 7.
Efield microbatch crystals of Glucose Isomerase from Streptomyces rubiginosus in the presence of different DC electric field intensities. Each experiment consisted of five 72-well microbatch crystallization plates (Hampton Research). For the experiments, 1 μL of protein (Glucose Isomerase) and 1 μL of precipitant solution (sodium citrate) and 10 μL of mineral oil were placed in each well. The trials were exposed to five different DC voltages: 0, 1, 2, 4, and 6 kV for a 48-h period. The top and bottom panels are typical results from experiments realized on separate dates.


Table 1.
Electric dipole moment computed for several macromolecules commonly crystallized in the presence of electric fields, DC or AC.
Table 1.
Electric dipole moment computed for several macromolecules commonly crystallized in the presence of electric fields, DC or AC.
| GI | HEWL | Thaumatin | HEHH | Ferritin | |
|---|---|---|---|---|---|
| PDB ID | 4A8L | 193L | 1RQW | 1QYW | 3F32 |
| dipole moment (D) | 1045 | 198 | 478 | 770 | 529 |
| # of atoms | 3187 | 1012 | 1604 | 2123 | 1411 |
| # of residues | 386 | 129 | 207 | 276 | 168 |
| # of positive residues | 46 | 16 | 24 | 29 | 19 |
| # of negative residues | 65 | 9 | 19 | 30 | 26 |
| charge | −19 | 8 | 5 | −1 | −7 |
© 2017 by the authors. Licensee MDPI, Basel, Switzerland. This article is an open access article distributed under the terms and conditions of the Creative Commons Attribution (CC BY) license (http://creativecommons.org/licenses/by/4.0/).
Share and Cite
MDPI and ACS Style
Rubin, E.; Owen, C.; Stojanoff, V. Crystallization under an External Electric Field: A Case Study of Glucose Isomerase. Crystals 2017, 7, 206. https://doi.org/10.3390/cryst7070206
AMA Style
Rubin E, Owen C, Stojanoff V. Crystallization under an External Electric Field: A Case Study of Glucose Isomerase. Crystals. 2017; 7(7):206. https://doi.org/10.3390/cryst7070206
Chicago/Turabian StyleRubin, Evgeniya, Christopher Owen, and Vivian Stojanoff. 2017. "Crystallization under an External Electric Field: A Case Study of Glucose Isomerase" Crystals 7, no. 7: 206. https://doi.org/10.3390/cryst7070206
Note that from the first issue of 2016, this journal uses article numbers instead of page numbers. See further details here.