
Modeling and Characterization of Grain Boundaries and Slip Transmission in Dislocation Density-Based Crystal Plasticity

School of Mechanical and Materials Engineering, Washington State University, Pullman, WA 99163, USA
*
Author to whom correspondence should be addressed.
Crystals 2017, 7(6), 152; https://doi.org/10.3390/cryst7060152
Submission received: 4 May 2017
/
Revised: 19 May 2017
/
Accepted: 22 May 2017
/
Published: 24 May 2017
(This article belongs to the Special Issue Plasticity of Crystals and Interfaces)
Abstract
:In this study, a dislocation density-based model is introduced to analyze slip transmission across grain boundaries in polycrystalline materials. The method applies a combination of the misorientation of neighboring grains and resolved shear stress on relative slip planes. This model is implemented into a continuum dislocation dynamics framework and extended to consider the physical interaction between mobile dislocations and grain boundaries. The model takes full account of the geometry of the grain boundary, the normal and direction of incoming and outgoing slip systems, and the extended stress field of the boundary and dislocation pileups at the boundary. The model predicts that slip transmission is easier across grain boundaries when the misorientation angle between the grains is small. The modeling results are verified with experimental nanoindentation results for polycrystalline copper samples.
1. Introduction
The interaction of the grain boundary (GB) and mobile dislocations plays an important role in the plasticity of polycrystals. Such interactions depend on the crystallographic orientation of the neighboring grains at the GB and the stress concentration on the corresponding slip planes that accommodate the plastic slip [1]. A full description of slip transmission across GBs involves several parameters such as the misorientation of the neighboring grains, the Burgers vector and the glide planes of the dislocations, the global stress, and temperature [1]. There are several studies that have analyzed the dislocation-GB interaction at a small scale using molecular dynamics, up to a large scale by applying continuum mechanic theories. Almost all of these studies show that this interaction is very complex [1].
Dislocation movement within grains and across the boundaries between adjacent grains cause the deformation of polycrystalline metals [2]. According to [3], the yield stress is directly affected by the density of grain boundaries in the metal. Most of the metals and alloys are polycrystalline structures with a grain size in the range of one micrometer. Polycrystalline metals have different mechanical properties than those of single crystal ones.
Although the grain and grain boundary have very important roles in the mechanical performance of metals, limited models have been developed based on a number of assumptions. One of the main models for grain size strengthening was proposed by Hall and Petch, based on the idea of dislocation pileup [4,5]. According to this model, dislocations pile up against the grain boundary and the leading dislocation can then pass through the grain boundary when the stress at the head of the pileup exceeds the critical obstacle strength, . The length of dislocation pileup depends on the number of dislocations in the pileup and the applied shear stress [6,7,8]. The stress at the tip of the pile up can be calculated as , where n is the number of dislocations in the pileup and is the applied shear stress. When considering the as the friction stress and substituting it in the Hall-Petch equation, one gets the following equation [8]:
where M is the Taylor factor (~3) and d is the grain size. The effect of dislocation pileup can be seen in a more general equation in terms of a power law formula given by the following equation [9,10]:
where and d are the yield stress and the mean grain size of the material, respectively, and and are the material constants that are usually referred to as the friction stress and the Hall-Petch slope, respectively.
Equation (1) or Equation (2) can be used to fit experimental data, but there are some issues with this model [11]. In general, this model predicts the basic role of the grain boundary as an obstacle to dislocation motion. However, the lack of consistency of this model with experiments and its shortfall in representing dislocation densities highlight the need to introduce a new model to address these deficiencies. The current work proposes a predictive model to simulate the deformation of metal polycrystals for any number of grains. The continuum dislocation dynamics model applies local grain boundary properties including the angle of the grain boundary plane, the misorientation of neighboring grains, and the size of the grains.
Experimental studies reveal the role of grain boundaries as a dislocation obstacle [12,13,14,15]. Additionally, it has been found that in the case of dislocation transmission, the choice of slip system for the incoming and outgoing slip system is predictable [16]. In this work, it is shown that the choice of slip systems is not only influenced by the grain boundary plane and the orientation relation between the neighboring grains that are involved in slip transmission, but also by the resolved shear stress on various activated slip systems on those planes.
In this research, a visco plastic self-consistent (VPSC) model is coupled with a continuum dislocation dynamics (CDD) model to simulate slip transmission across grain boundaries in polycrystalline metals based on dislocation mechanisms that can be clearly identified and quantified in discrete dislocation dynamics (DDD). By implementing dislocation- grain boundary theory in a 2D Voronoi tessellation diagram, with each voronoi cell representing an individual grain, we are able to capture the grain boundary-dislocation interaction effect. Although the framework and the theory developed in this work, as described in the following sections, are applicable for any type of polycrystalline material, the focus in this paper is on copper with an FCC crystallographic structure. A comparison between the results obtained from this model and observations from nanoindentation experiments sheds light on the deformation mechanisms in the crystals.
The hierarchy of this work is structured as following. In Section 3, the VPSC and CDD framework and the basic equations are introduced. The Grain boundary dislocation flux interaction methodology is explained at the end of this section. In Section 4, the implementation of the controlled voronoi tessellation (CPVT) model into VPSC-CDD is discussed. This section is followed by one in which the numerical results from tensile loading for different structures are analyzed. In the last part of this section, the effect of an extended stress field of the grain boundary and long-range interaction of grains in the structure is evaluated for several structures. In Section 5, experimental nanoindentation results for pure copper are analyzed and the mechanical behavior predictions from the model are compared with those results. Eventually, in the conclusion section, the results and achievements of this work are highlighted.
2. Dislocation Density-Based Crystal Plasticity
In this study, a multiscale framework is developed, coupling a continuum dislocation dynamics (CDD) model developed by [17,18] with a viscoplastic self-consistent (VPSC) model developed by [19]. The VPSC model describes the non-homogenous plastic deformation behavior in a polycrystalline material based on the theory of crystal plasticity and anisotropic materials. In this framework, anisotropic regions such as grains or phases are represented as viscoplastic inclusions located in a homogenous effective medium and surrounded by other grains of polycrystalline material [20]. The plastic deformation of each grain is initially analyzed by applying rate dependent crystal plasticity equations. In the next step, a homogenization pattern is introduced to calculate the macroscopic mechanical behavior and to evolve the texture of the polycrystalline material.
By coupling the CDD and VPSC models, the hardening of each grain is calculated with non-linear rate sensitive equations. The coupling of these two models makes it possible to capture the size effect. One equation which plays a key role in this coupling is the Orowan relation for the plastic shearing on each system [21]:
where b is the magnitude of the Burgers vector, is the mobile dislocation density of slip system α, and is the average dislocation glide velocity. In this relation, the hardening of each grain is related to internal state variables like the mobile dislocation density and velocity.
The average dislocation glide velocity is calculated from the following power law equation:
where is directly related to the ratio of the resolved shear stress to the critical resolved shear stress along the slip system α, ; is the reference velocity; and m is the strain rate sensitivity exponent. Here, is a numerical constant as the normalization factor which is set as [18] and the power factor m is set as 0.012 [22]. The critical resolved shear stress can be decomposed into two terms, i.e.,
where is the reference shear stress known as the lattice friction stress for moving dislocations, and is the forest dislocation hardening which is caused by the interaction between inserting dislocations. The forest dislocation hardening is given by the following equation:
This equation is known as Baily Hirsch relation [23], where µ is the shear modulus; α* is a numerical factor in the order of 0.1; and is a dislocation interaction matrix that describes the interaction between slip system s and slip system α where the elements of this matrix depend on the crystal structure, as well as the isotropic and anisotropic interaction of dislocations in the material [24]. Since we assume isotropic hardening, all the elements of this matrix are set to one [25]. The term is the total statistically stored dislocation density (SDD) on slip system s.
In the current CDD framework, the dislocation density on each slip system α is decomposed into a mobile dislocation density , and an immobile dislocation density, , i.e., terms . The evolution equations for and are given by the following equations:
where the first term in the evolution equation for corresponds to the dislocation flux which will be explained in detail in the following section. The second term refers to six specific dislocation interaction mechanisms; each of these mechanisms can be analyzed in discrete dislocation dynamics. For instant, mobile dislocations generated from the Frank-Read sources, in addition to the multiplication and propagation of resident dislocations, are defined as , where the is a mean free path of mobile dislocations in the α plane, which satisfies the Equation . Annihilation mechanisms for the mobile dislocations occur when two opposite sign dislocations move towards each other in same slip plane, and the rate is . Mobile dislocations and immobile dislocations can transform into each other in certain conditions. When mobile dislocations turn into immobile dislocations due to the interaction, such as the junction and dipole formation, the rate is concerned as , where is the dislocation mean free path. Conversely, immobile dislocations can also break junctions, dipoles, pinning parts, etc., at a critical stress condition, which gives and r is a numerical constant set to 0.5. Cross slipping also contributes to the dislocation densities with a rate of , where is the fraction of screw dislocations and is a matrix consisting of a 0 and 1 term that denotes the probability for a screw dislocation on the β slip plane to cross slip to the α plane; this parameter can be obtained from Monte-Carlo [17] analysis. Finally, the parameter represents annihilation between the mobile and immobile dislocations, which reduces the dislocation densities at the rate of , where is the critical radius for interaction between two dislocations which is set as fifteen times the Burgers vector. Combing all the mechanisms listed above, one gets the evolution equations for mobile and immobile dislocation densities, without the flux term.
where to are the material parameters which can be obtained from discrete dislocation dynamics analyses and experimental results curve fitting. Table 1 shows the definition of each of those terms. In passing, we note that the mobile dislocation density can be further decomposed into two sets: one for mobile dislocations with “positive” Burgers vectors and one for dislocations within “negative” Burgers vectors, which makes it possible to predict the dislocation patterning within each grain, but requires an extensive computational effort [26].
Grain Boundary Dislocation Flux Interaction Methodology
Bi-crystal experiments show that the orientation relationship between neighboring grains affects the grain boundary-dislocation interaction [27]. However, in polycrystals, the situation can be more complex, since there are many different possible orientation relationships between grains. According to [28,29], the distribution of these orientation relationships can be judged as a whole by applying statistical methods.
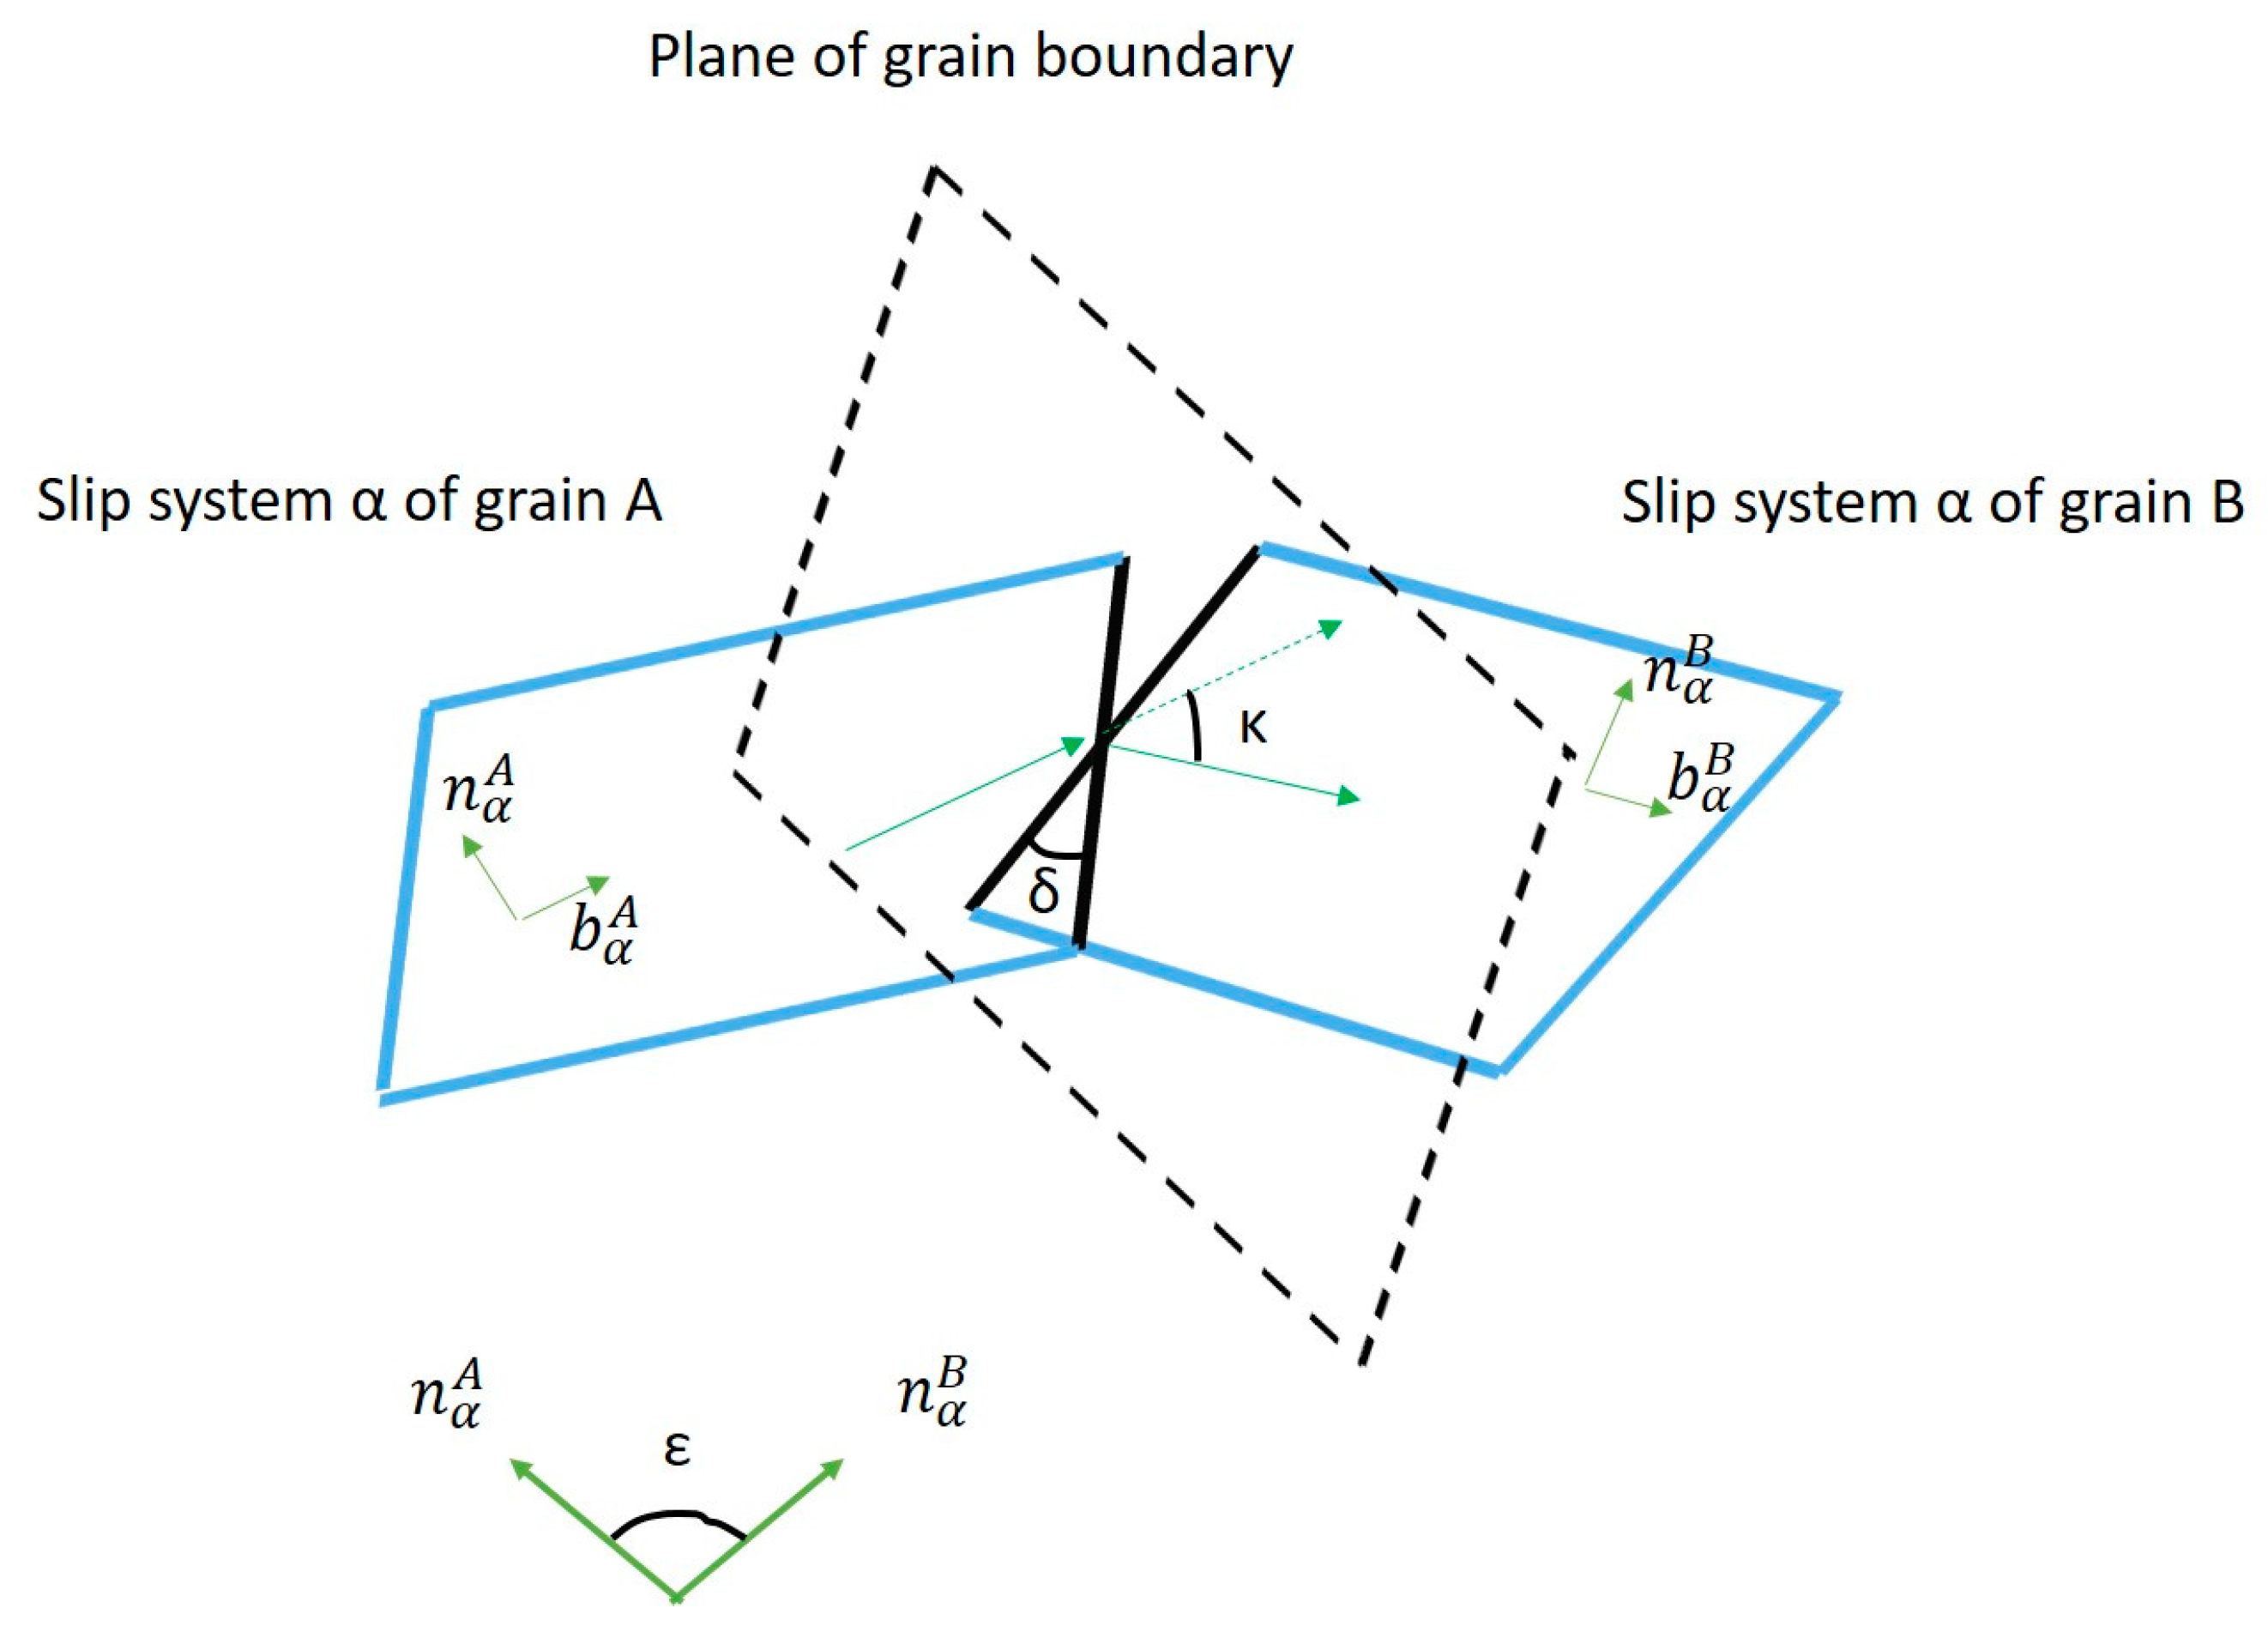
Two main conditions are considered here in order to select slip systems in each grain with enough potential for dislocation flux across the grain boundary: (1) the state of stress on each slip system; and (2) the geometry of slip direction and normal with respect to the grain boundary plane. According to [29], a simple geometrical condition can be applied between adjacent grains for slip transfer. Figure 1 shows a grain boundary and two slip systems from neighbor grains A and B. The angles δ (δ is the angle between the intersection lines of slip planes of the two grains with the boundary plane) and κ (κ is the angle between the slip directions laying in the considered slip planes) are introduced. It should be noted that δ and κ must not exceed critical values and respectively, in order to have slip transfer. As can be seen from Figure 1, δ = 0 makes a rooftop schematic, which is the most favorable configuration. For , the lines of intersection deviate and slip transfer thus requires the simultaneous initiation of dislocation loops in the neighbor grains in many parallel slip planes [30]. Therefore, the efficiency of slip transfer significantly reduces when δ increases. According to [31], 15 degrees is the critical limit for δ. From the figure below, the orientation of δ can only be evaluated if the orientation of the boundary plane is known. Since it is almost impossible to measure this orientation, determining δ would be a problem. To overcome this issue, the angle ε between the two slip planes’ normal is considered. ε lies in the range of 0 to 90 and . Moreover, there is a limit for the slip direction, i.e., degrees [31]. Considering all of these for a grain orientation relationship between neighboring grains for FCC crystals, are evaluated for all available slip systems for pile up and emitted grains. If are our Euler angles to characterize an orientation relationship for the texture, it is possible to assign a slip transmissivity number to each slip system in each grain, as shown below:
where and , respectively. It is necessary to mention that the same geometrical condition can be applied for BCC materials and even for phase boundaries as dislocation obstacles [31].
In order to predict all of the activated slip systems for dislocation flux across grain boundaries, the resolved shear stress on each potential plane needs to be considered, in combination with the geometrical condition [2]. For a given slip system on the incoming side of a boundary, the minimum value of is chosen from the values computed for all of the allowed outgoing slip systems. The transmissivity ranges from 0 to 1, representing the maximum and minimum grain boundary stress, respectively. Equation (12) reveals a proper estimate of the grain boundary strength by applying the transmissivity number calculated for each grain boundary from Equation (11).
where is the maximum grain boundary obstacle strength. Based on [32], the maximum grain boundary obstacle strength is considered as five times the yield strength of the material, which is 350 MPa for copper with a yield strength of 70 MPa. According to [2], the amount of stress needed for dislocation transmission can vary and depends on the Burgers vector of dislocation or the type of grain boundary, which is considered in this work by applying a specific transmissivity number () for each specific grain boundary.
If two slip systems from neighboring grains meet the necessary geometrical conditions, then the shear stress and critical resolved shear stress on those slip systems are evaluated. If the resolved shear stress is more than the critical resolved shear stress on the selected potential slip systems, then the velocity of the dislocations on those slip systems can be calculated by applying Equation (4). In order to compare the effect of these phenomena, an impenetrable grain boundary is designed which leads to a pileup of dislocations that have the potential to transfer across the grain boundaries.
Once the potential slip planes are recognized and they satisfy all of the conditions for slip transmission across the grain boundary, the flux term in Equation (7) is calculated as follows. Figure 2 shows a schematic of dislocation flux between two grains, A and B. Assuming that the flux is in the direction indicated in the figure, the dislocation flux term is approximated as:
Upon using the Orowan relation (3), Equation (13) can be written in terms of plastic shearing as:
where is the distance between the centers of grains A and B, and it is assumed that .
The above system of equations is numerically integrated with a fixed time step. At the end of each integration step, the redistribution of the mobile dislocation density is considered by adding the calculated net flux term to the mobile dislocation density rate in Equation (9) for each specific grain and slip system.
3. Implementation of 2D Controlled Poisson Voronoi Tessellation (CPVT) Model
The original development of the VPSC model is dimensionless, with no need to specify the spatial positions of the grains and domain size. However, in order to capture the grain boundary-dislocation interaction, a spatial representative domain representing the polycrystalline material is defined and appropriately discretized to represent grain size and distribution. In order to investigate the stochastic nature of the microstructure, a controlled Poisson Voronoi tessellation (CPVT) model is applied to generate a two-dimensional virtual grain structure. As discussed in [33,34], in this model, a parameter δ is defined as the minimum distance among the neighbor grains as:
where α ∈ [0, 1] represents a “regularity” parameter used to represent a proper grain size distribution and is the distance between any two adjacent seeds, namely:
with A0 being the domain area and N representing the number of hexagons in the domain. If the grain size values are normalized by the mean grain size, then a one-parameter gamma distribution function can also provide proper fitting for grain size distribution in terms of the area, as shown below:
where P is the grain size distribution function, is the gamma function, and the parameter (1) is the only distribution variable in the above functions [35].The relation between the parameter c and regularity α is given by:
where , , = 3.555, = 47.524, = 0.738895, = 0.323911, and = −0.4114367.
In this work, we generate the Voronoi tessellation by controlling the regularity parameter , which changes between 0 and 1. The details for determining the distribution parameter c can be found in [33]. In the future, we will consider how the parameter c affects the generation of the Voronoi space.
In a two-dimensional domain, the space can be discretized using the CVPT model described above, resulting in a triangular mesh with each element in the mesh representing a grain. Then, each grain is assigned a crystallographic orientation randomly, and its neighbors can be determined according to its spatial locations in the mesh. The stress state, strain, and dislocation densities in each element can be computed using the coupled CDD-VPSC model.
Here, we applied a free boundary condition for grains located at the domain borders and this may lead to less accurate results. This will be addressed in the future by applying other boundary conditions. The CPVT method can also be extended to three spatial dimensions, with an increased computational effort.
4. Numerical Results and Discussion
In this work, the effect of dislocation flux on the mechanical behavior of copper with a face center cubic (FCC) crystalline structure is analyzed. There are 12 Slip systems for the FCC lattice structure materials that are considered. A normal distribution function is applied for the initial dislocation density of each slip system within the microstructure for each grain; however, the immobile dislocation density is the same for all the slip systems in each grain. The average mobile dislocation density value is adjusted with experimental TEM results, which is 2 × 10¹³ m−2. The total dislocation density is , representing the sum of the mobile and immobile dislocation density in each slip system in each grain. Several simulations are considered under the following assumptions. Dislocations only interact with other dislocations within the same slip system in a single grain. The structure of the initial grains’ texture is almost random. Figure 3 shows the pole figure of the applied initial texture.
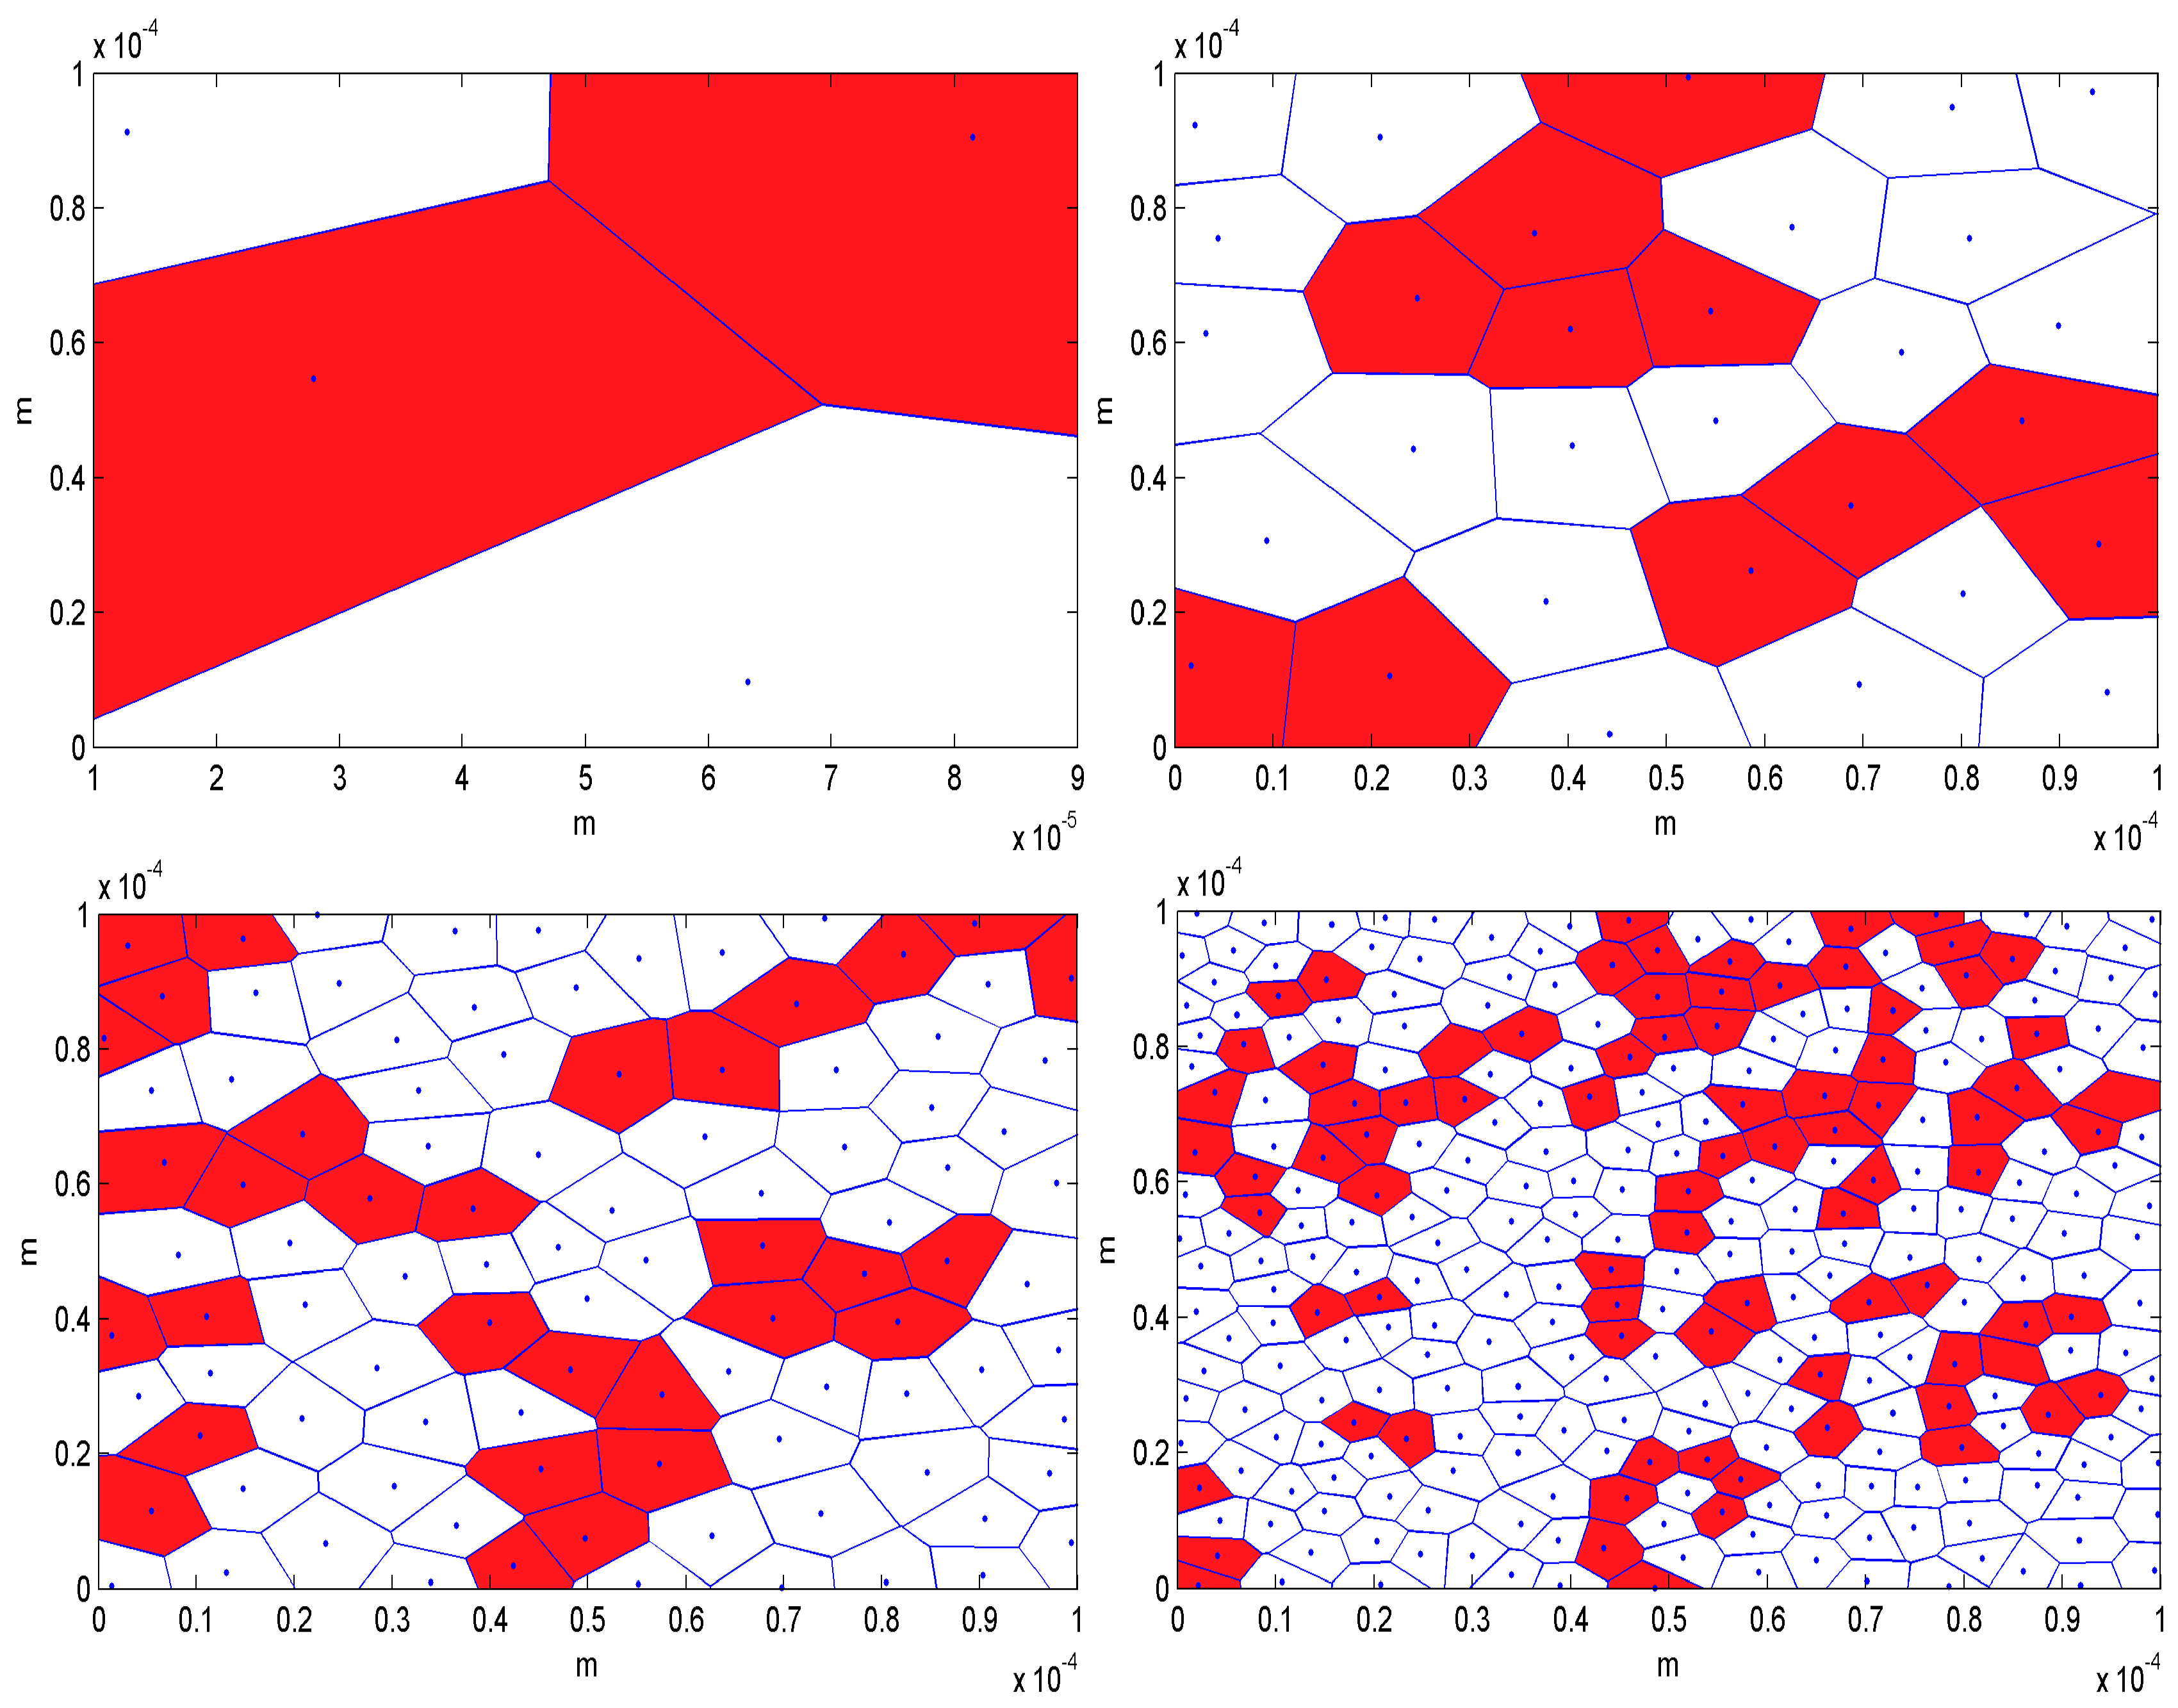
In order to show the interaction of grain boundaries and dislocations, textures with different numbers of grains are considered. The effect of dislocation flux across grain boundaries is analyzed for polycrystalline Cu textures with 4, 30, 100, and 300 grains. Figure 4 shows a 2D representation of these structures. The sample scale size is .
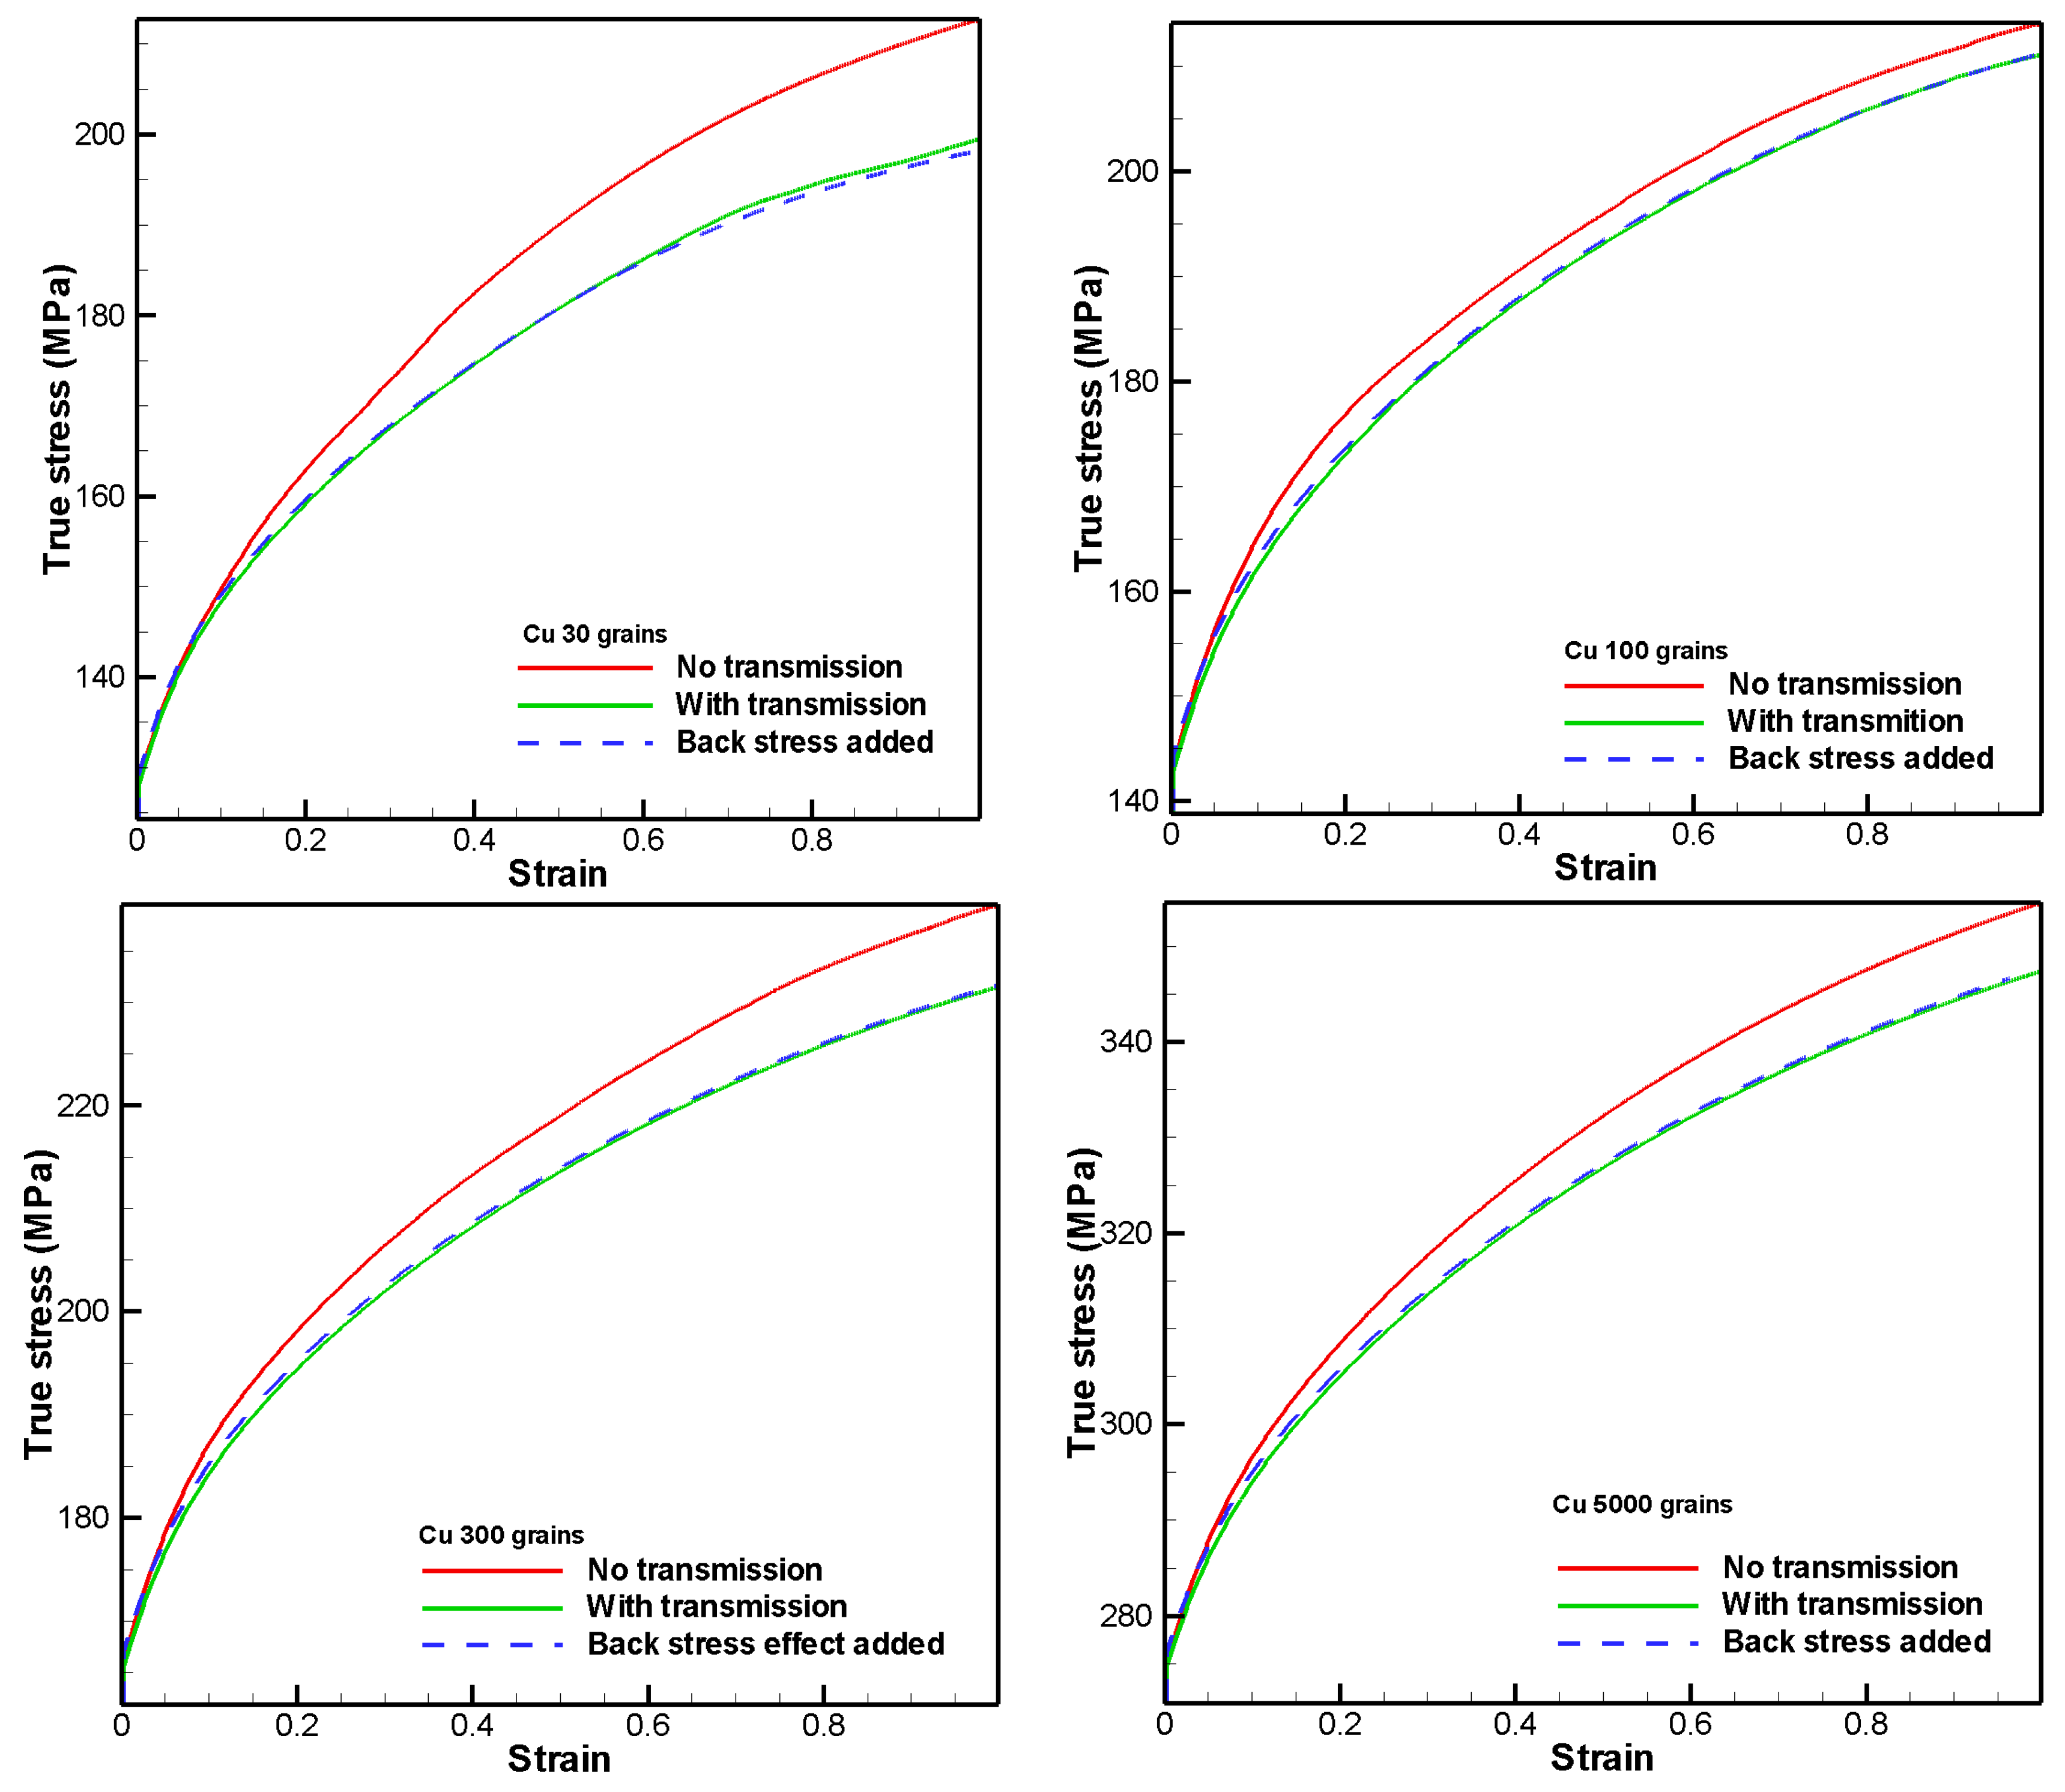
The mechanical response of copper for structures with different numbers of grains is studied by conducting a tensile test under a constant strain rate of 1 × 10⁻³ s−1. Figure 5 shows the true stress-strain curve of a polycrystalline copper sample with 4, 30, 100, and 300 grains. The dash lines are the stress-strain curves for the cases without slip transmission (impenetrable grain boundary) phenomena and the solid lines are with transmission. The comparison of curves shows that the dislocation transmission across the grain boundary causes relaxation of the structures. The model considers the orientation of the plane of grain boundaries, slip systems of neighboring grains, and state of shear stress on the slip systems, in order to be able to choose which slip systems have enough potential to display dislocation flux across that specific grain boundary.
Figure 6 shows the results for a polycrystal of Cu with 5000 grains. The number of grains that meet the mentioned conditions for slip transmission is increased in this structure. Again, it can clearly be seen that the slip transmission across grain boundaries has an impact on the stress-strain curve. However, as the total area of the sample is fixed, by increasing the number of grains, the grain size is decreased, leading to a reduction of the mean free path. Therefore, the dislocation-dislocation interaction within each grain would be the dominant mechanism for increasing the strength of the structure. Therefore, by increasing the number of grains, the difference in the stress-strain response between the cases with and without slip transmission becomes smaller.
Effect of Extended Stress Field of Grain Boundary and Long-Range Interaction of Dislocations
The model presented in the previous section for the dislocation-grain boundary interaction, and similarly to Hall-Petch models, treats the grain boundary as an obstacle, which has a local intrinsic strength that dislocations need to overcome in order to cross the boundary. However, in a more accurate treatment, the grain boundary, as well as the dislocation pileups against it, have extended stress fields, which in turn, exert back stress on dislocations within the grain interior. In this section, the effect of the long-range interaction of dislocation densities in neighboring grains on each grain and the stress field of the grain boundary is considered.
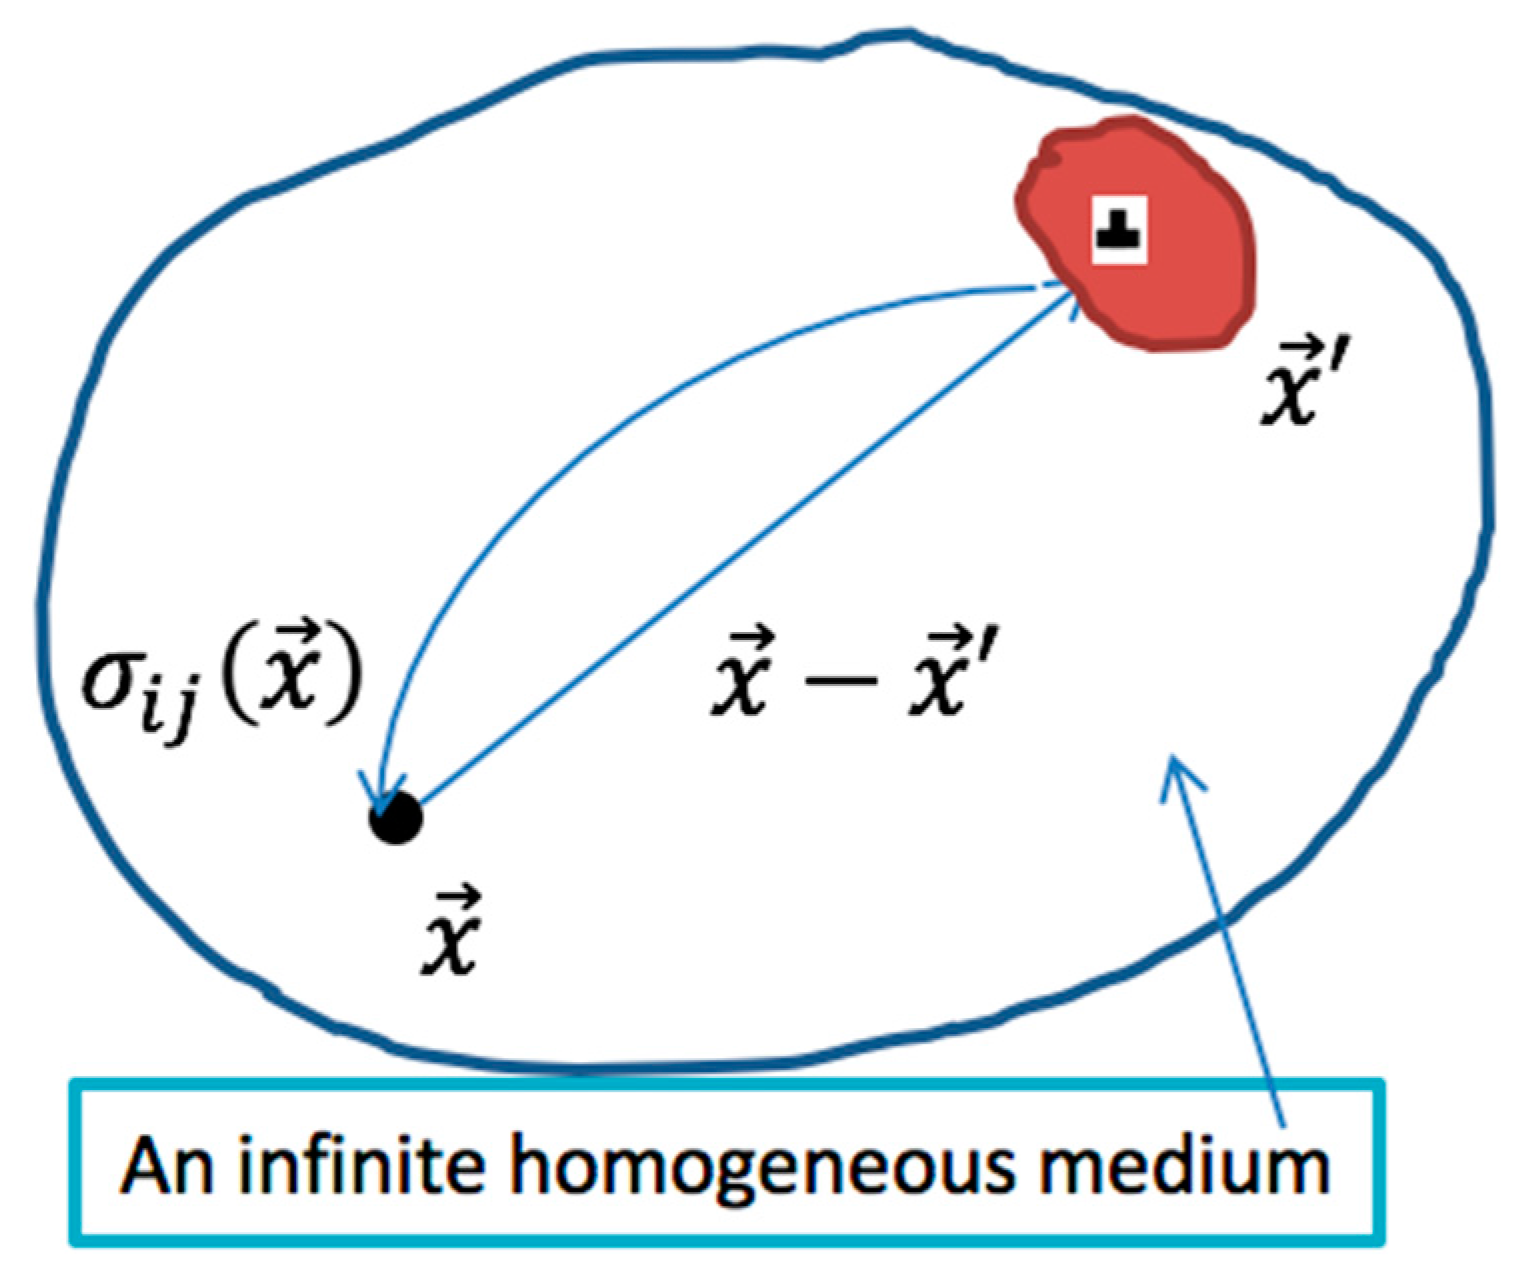
In a generalized treatment, dislocations at material point can be represented in terms of Nye’s tensor , which in turn represents the net dislocation density that gives rise to long-range stress field (Figure 7). The long-range stress field is given by Mura’s integral equation [36]:
where is the elasticity forth-order tensor, is the permutation tensor, is Greens function, and “q” indicates the spatial derivative. For the isotropic elasticity assumed in this work, the term is expressed as:
in which R = and is Dirac’s delta function.
Within the continuum plasticity framework, the rate form of Nye’s tensor is the curl of the plastic stretching tensor [37], i.e.,
This equation is implemented in the VPSC-CDD numerical model using the voronoi tessellation model (CPVT). At each integration step, once the strain and strain rate tensors are evaluated for each grain, the spatial gradients and thus the dislocation density tensor can compute numerically at the center of each grain. Here, the gradient of the plastic strain results from different strains across neighboring grains, and hence the resulting dislocation density tensor, reflects the density of the dislocation pileups at the grain boundaries (see insert in Figure 8).
As discussed above, classical models treat the grain boundary as a local obstacle with an intrinsic strength. In a more accurate treatment, one can represent the grain boundary (small-angle and large-angle boundaries) as an ensemble of sets of discrete dislocations whose Burgers vectors B, line senses , and spacing can be computed using Frank’s Formula [8]. Then, by modeling the boundary as a boundary layer (see insert in Figure 8) which has a small thickness of the order of a few Burgers vectors (~5b) [36], the discrete dislocations in the boundary can then expressed in terms of the continuous distribution of the dislocation density tensor [38]:
where m is the total number of grain boundary dislocation sets: 1, 2, or 3, depending on the characteristics of the boundary, and is the dislocation density in the boundary.
The long-range stress field, from both the dislocation density tensor due to the dislocation pileup Equation (22), and from the grain boundary dislocations, is implemented into the VPSC-CDD model. Since the stress field decreases when increasing the distance from the dislocation source, here, we only focus on calculating the long-range internal stress at the center of a given grain that is caused by dislocations in the neighboring grains. The long-range stress is considered as a back stress, which in turn contributes to the effect of the resolved shear stress:
where are the Schmid factor, applied stress, and back stress, respectively.
The dislocation transmission across grain boundaries, with the effect of back stresses, is re-examined for four microstructures with 30, 100, 300, and 5000 grains in the VPSC-CDD framework. The blue dash line shows this effect in each graph. As can be readily seen in the stress-strain curves, the long-range internal stress effect does not have a significant effect on the overall macroscopic stress-strain behavior. This can be explained by putting the results shown in Figure 8 in perspective. Here, we simulate the deformation behavior of two grains whose boundary is treated as a thin material layer with dislocations using the VPSC-CDD model. The shear stress field resulting from the dislocation density tensor representing the net dislocations in the boundary layer is shown. As can be deduced from the figure, the stress decreases rapidly away from the boundary; at 200b away from the boundary, the shear stress is almost negligible in comparison to the flow stresses shown in Figure 9. For Cu, b = 0.25 nm and this distance is about 50 nm, which is far away from the center of the grain. However, at distances close to the grain boundary (less than 50b), this can be important for the dislocation grain boundary interaction, since the shear stress of the dislocations at the tip of the incoming pileup of dislocations toward the grain boundary should be greater than the stress field of the grain boundary, in order to be able to pass the boundary. As can be seen form Figure 8, the stress field is singular at the center of the boundary, as expected. Thus, the stress field does not have a long-range effect and is more localized around the core of the boundary. The curve in Figure 8 can be curve fitted with a power law equation with n = 1.27. This shows a faster decay of the stress field of the grain boundary when compared to the long-range stress field of a single dislocation where n = 1. Since the stress field is singular at the center of the boundary, a cutoff corresponding to the strength of the boundary is assumed. As was explained earlier, the strength of the grain boundaries for copper in this work is considered to be 350 MPa. This internal stress behavior is verified by the nanoindentation results by SPM image in experimental study section, where it is shown that the hardness close to the grain boundary is more than the hardness in the middle of the grain, far from the grain boundary.
By considering the behavior of the internal stress field described above and the fact that in VPSC–CDD each integration point is located at the center of each grain (Figure 4), the negligible effect of the back stress field of the grain boundary on the overall stress-strain behavior is justifiable (Figure 8). However, this effect is more pronounced in the vicinity of the grain boundary and will have implications for a more accurate treatment and modeling of the grain boundary-dislocation interaction at finer scales.
5. Experimental Study
In order to illustrate the capability of the model to predict the grain boundary slip transmission conditions, the results from nanoindentation experiments on annealed polycrystalline Cu are presented below. Nanoindentation tests were performed using a Hysitron TI900 Triboscope on a 99.999% pure polycrystalline copper sample. In an effort to obtain larger grains and to reduce dislocation populations in the sample, the sample was annealed in an air furnace at 700 °C for 72 h and then furnace cooled to room temperature. The sample was then mechanically polished down to about 1 μm, before being electropolished using an electrolyte of 1:1 phosphoric acid and deionized water. Transmission electron microscopy (TEM) analysis on the samples prepared using a similar method has a dislocation density of approximately 2 × 10¹³ m−2. This value is used as the initial average dislocation density in the model. Figure 10 shows the electron backscattered diffraction (EBSD) analysis on a sampled area of the electropolished polycrystalline copper sample. It can be seen from the inversed pole figure (IPF) scan that the grains are approximately equiaxed and the average grain size is ~65 μm. In addition, the pole figures from different projections of the scanned area demonstrated that the grains are randomly oriented. According to the above EBSD analysis, the polycrystalline Cu sample prepared for the nanoindentation experiment satisfies the assumption for the model that the initial microstructure of the polycrystal is random.
A cube corner probe, which is an inverted pyramid having an included angle of 90°, was used for the nanoindentation tests. A simple load-hold-unload schedule was used. The load was increased at a constant rate of 400 μN/s to the maximum load, Pmax. This load was held for 10s, before unloading at a constant rate of −400 μN/s. Two different Pmax values were used in this study. A higher Pmax at 2000 μN was used to make larger indents in order to qualitatively study the plastic deformation zone surrounding the indent, whereas a lower Pmax at 500 μN was used to quantitatively study the mechanical property, especially the hardness, H, of the sample.
The location of the indents can be pre-selected with the help of the scanning probe microscopy (SPM) image acquired using the indenter probe right before making an indent. Using this technique, the location of the indent can be made within about 100nm from the desired location. This allows for a relatively precise placement of the nanoindents in the proximity from a selected grain boundary.
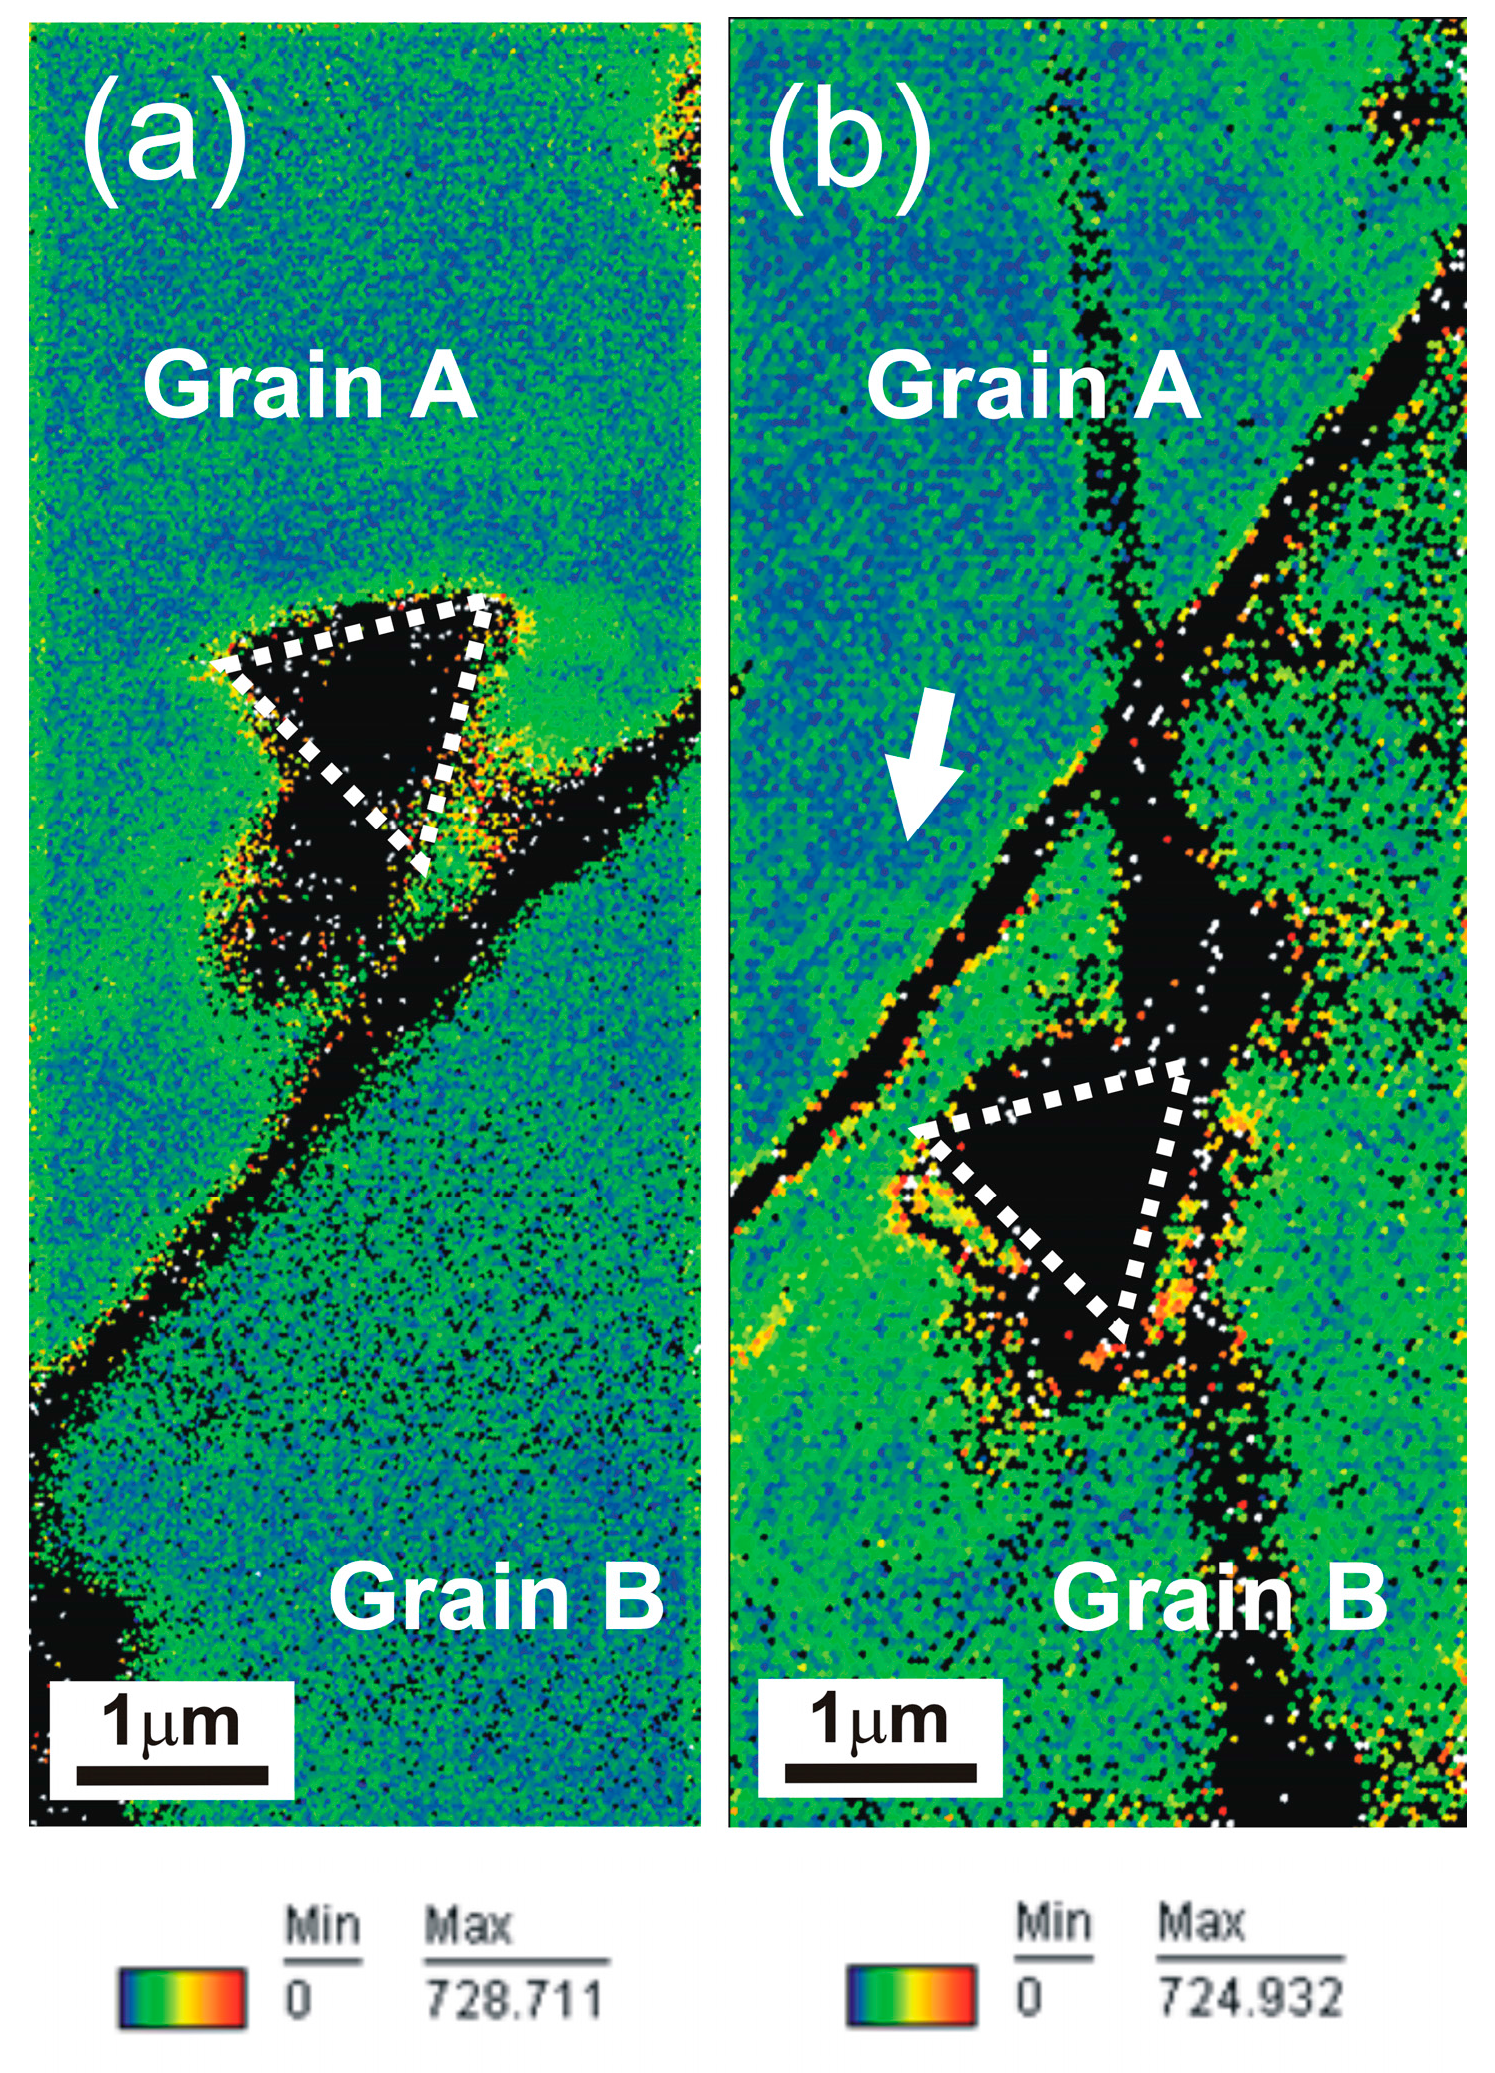
Indentations were made on two adjacent grains randomly selected based on their large size (>100 µm), rather than their specific orientations. The grains selected for indentation are indicated as grain A and B in Figure 10. The Euler angles (φ1, φ, φ2) of these two grains are (355.2°, 37.6°, 123.8°) for grain A and (176.4°, 49.6°, 164.0°) for grain B. Fifty indents were made on each of the two adjacent grains, at least 45 µm away from any grain boundaries. Indentations were also made close to (center of the indent <3 µm from) the grain boundary between grain A and B. The interaction between the plastic deformation zone created by the indent and the grain boundary of interest were examined through EBSD and SPM imaging obtained immediately after the indentation test using the cube-corner indenter probe. The EBSD scans are presented according to the intensity of the geometrically necessary dislocations (GNDs) of the examined areas (Figure 11). The heavy deformation within the indent and the material pile-up around the indent leads to difficulties in obtaining a solution for crystal orientation in these areas, which are shown as black pixels in the figures.
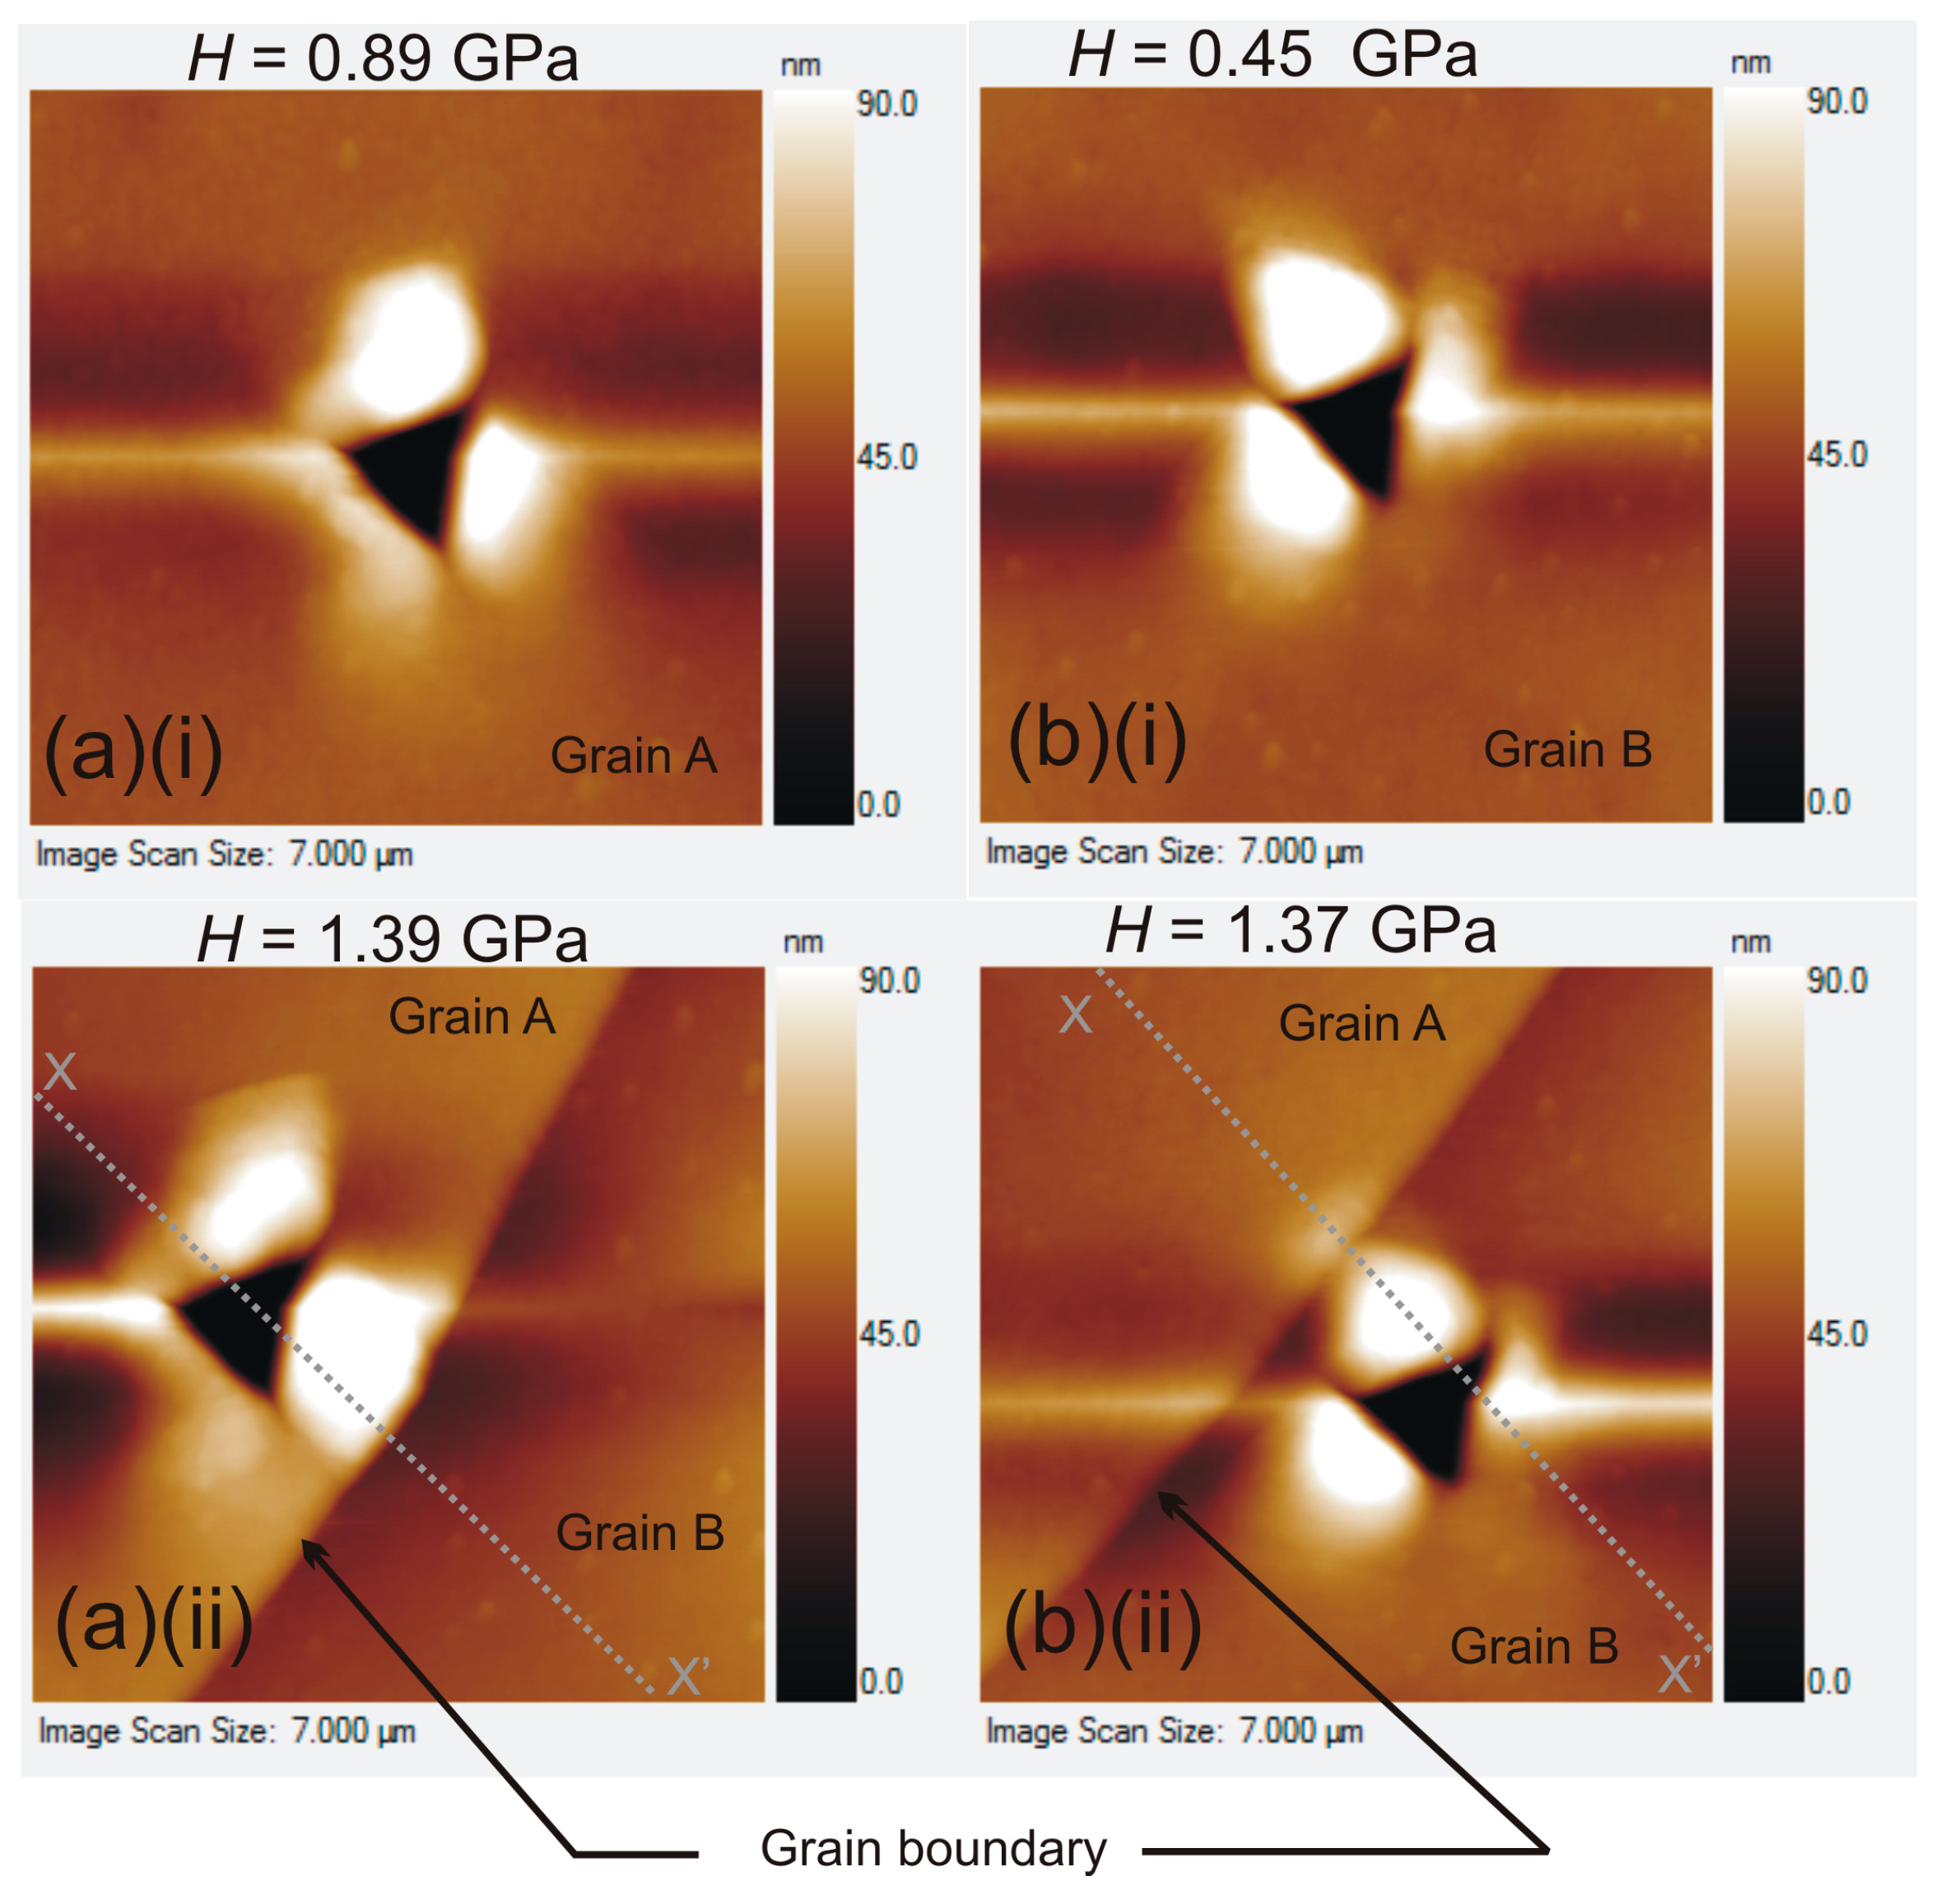
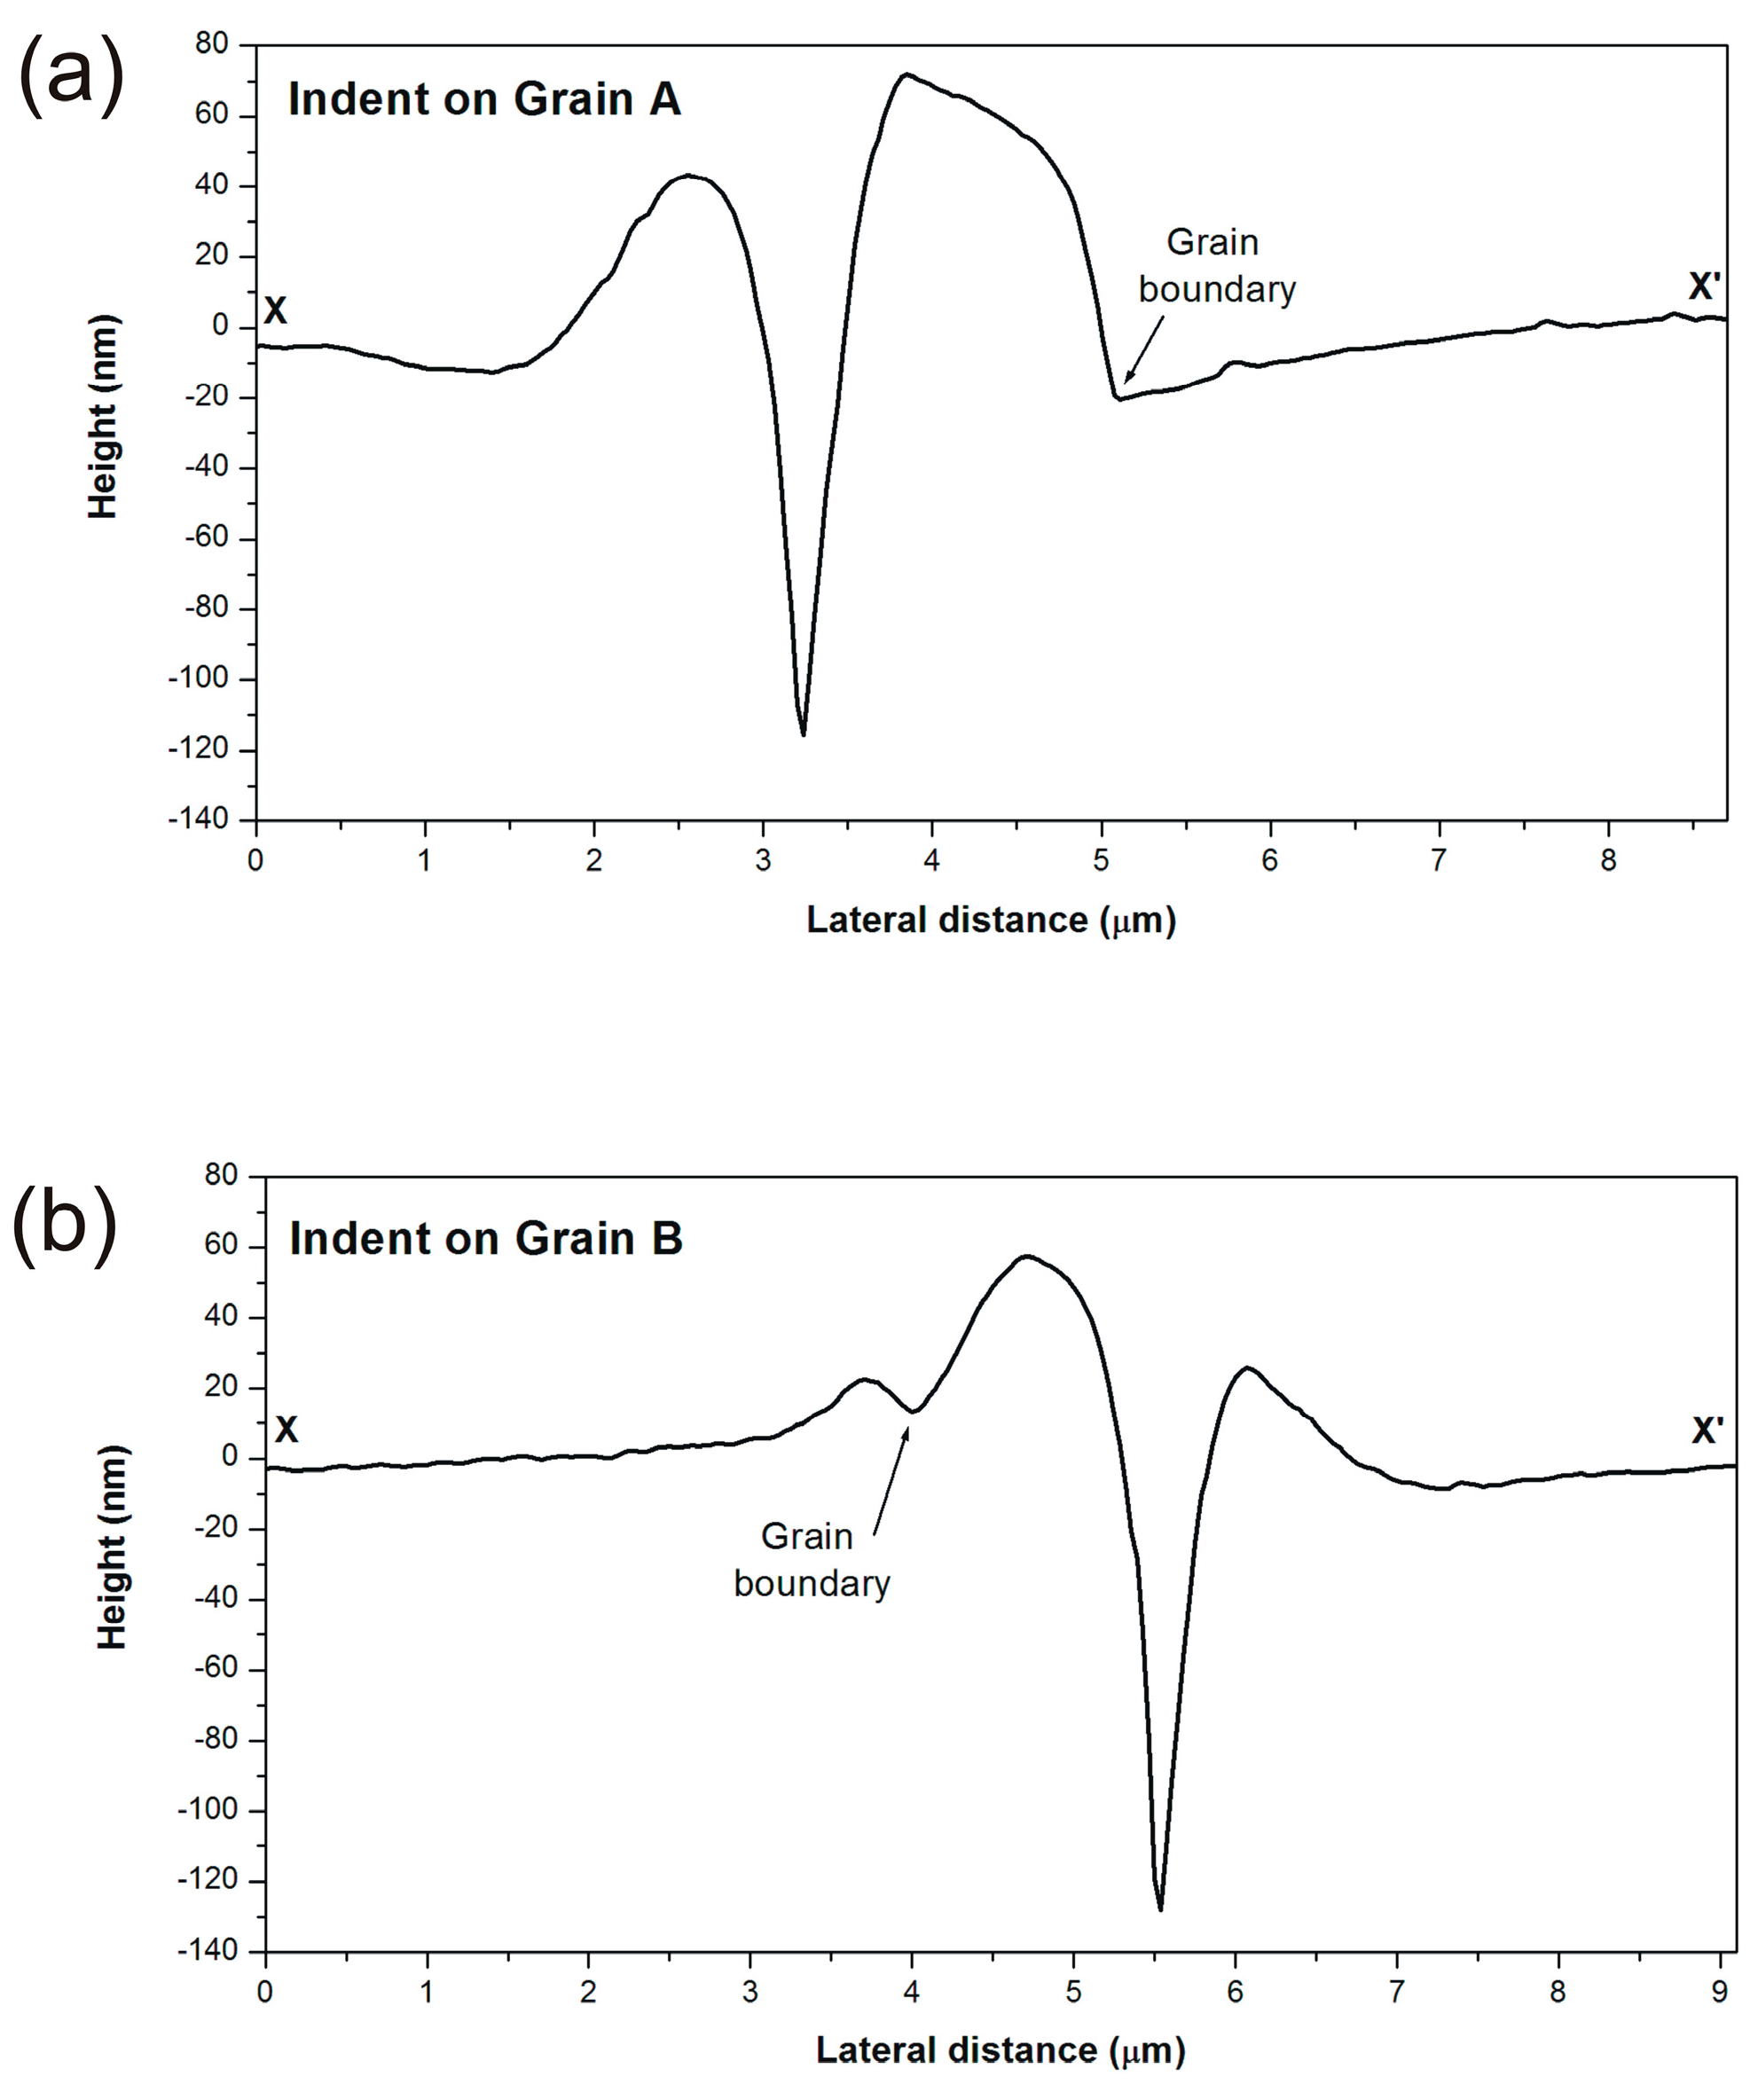
These same indents were also examined using SPM and are shown in Figure 12. Typical indents made with Pmax = 2000 µm in grain A and B without a significant influence from the grain boundaries are shown in Figure 12a(i),b(i), respectively. The projected area of these indents is about the same and is equivalent to a circle having a radius of 0.52 µm. In addition, the in-plane plastic deformation zone around these two indents is approximately circular, having a radius of 1.96 µm. SPM images of the indents on grain A and B near the grain boundary between these grains are shown in Figure 12a(ii),b(ii). The plastic deformation zone around the indent made on grain A appears abruptly terminated at the same grain boundary, such that no plastic deformation is observable on grain B (Figure 12a(ii)). This is clearly demonstrated from the significant material pile-up between the indent and the grain boundary observed from the cross-section profile of a plane from the SPM image that cut across this indent and the grain boundary which is indicated as X-X’ in Figure 13a. Further, as observed from Figure 11a, there is a high intensity of GND between this indent on grain A and the grain boundary, while there is no observable increase of GND intensity on the other side of the grain boundary. On the other hand, when the indent was made on grain B, slip transmission is clearly observed across the grain boundary into grain A. The plastic deformation zone associated with this indent that appears to have transmitted across the grain boundary is somewhat distorted, as observed in the SPM image (Figure 12b(ii)). In addition, the cross-section profile of a plane cutting across this indent on grain B and the grain boundary (indicated as X-X’) on the SPM image shows that there is material pile up between the indent and the grain boundary, as well as on the other side of the grain boundary (Figure 13b).
This observation suggests that some material that piles up between the indent and the grain boundary had propagated through the grain boundary. The GND intensity map around this indent (Figure 11b) also shows an observation in agreement with the observation that there is a high GND concentration on both sides of the grain boundary near the indent on grain B, indicating that deformation in that area is somewhat relieved, likely through slip across the grain boundary. Similar dual slip transmission behavior across grain A and B has also been reported in other studies, e.g., [39,40], which can be related to the different back stress field of the grain boundary, as discussed earlier. To simplify the analysis, we now consider the slip transmission of the same grain boundary from the two grains separately. The hardness value, H, calculated using the Oliver-Pharr method from the unloading part of the indentation curve [41] of the indent made near the grain boundary in grain A shown in Figure 12a(ii) was 1.39 GPa, and H of the indent far from any grain boundary in grain A shown in Figure 12a(i) was 0.89 GPa. The indent made on grain B shown in Figure 12b(ii) was 1.37 GPa and H of the indent within grain B shown in Figure 12b(i) was 0.45 GPa. The above H comparisons suggest a possible grain boundary elastic back stress field effect, as predicted by the model, such that the H value close to the grain boundary (less than 50b) is higher than that from the grain interior when it is far away from the boundary. In order to get better statistics on the H measurements, 50 indents were made within the two grains using Pmax = 500 µN. These indents are smaller in size compared to those shown in Figure 11 and Figure 12 and so more indents could be made in the same grains. The H measurements obtained from these smaller indents are listed in Table 2. The higher H values obtained using a lower Pmax are likely to be the result of an indentation size effect. Nevertheless, the results obtained from these sets of indentation data using Pmax = 500 µN also demonstrated a grain boundary hardening effect. As hardness is directly proportional to the yield stress, σy, of a material [42]:
where C is a constant approximately equal to three when the deformation is fully plastic [43]. The indentation results above demonstrated that the yield stress is higher ( when slip transmission is blocked at a grain boundary from grain A to grain B, whereas the yield stress is lower ( when slip transmission across a grain boundary from grain B to grain A is allowed. It is worth noting that even though the near grain boundary, indents made using the two different Pmax values were both placed at about 1.5 µm from the same grain boundary, the difference between the H values obtained near and far from this grain boundary is much higher (two orders of magnitude higher) when a lower Pmax = 500 µN is used (Table 2). The H values near the same grain boundary were only about two to three times higher than that obtained far from any grain boundaries when a higher Pmax = 2000 µN was used (Figure 10). This is likely to be the result of a more significant effect from the interaction between the highly concentrated GND within a smaller stressed volume created by a smaller indent and the dislocations near or at the grain boundary, leading to a much higher apparent H value near the grain boundary. In the case when using a higher Pmax = 2000 µN, the corresponding stressed volume is larger, ‘diluting’ the hardening effect due to the interaction between the GND around the indent and the dislocations at the grain boundary. In addition, a larger stressed volume around a larger indent made with a higher Pmax has a higher chance of interacting with the grain boundary under the sample surface if the grain boundary is not perpendicular to the sample surface, causing slip transmission across the grain boundary under the surface that may lead to a lower H value. This effect, however, would not be observable from non-destructive defect analysis such as SEM or SPM. This observation is in agreement with the simulated tension test results shown in Figure 4. Close observations from Figure 4 show that the strength is ~10 MPa higher when only four grains were considered. As the slip transmission across the grain boundary depends on the orientations, misorientation between grains, etc., the more grains being considered, the more varieties of hardening factors become important, ‘diluting’ the significance of each factor on the potential grain boundary effect. The nanoindentation experiment described above practically tested only one grain boundary as the indents are so small that influences from any other grain boundaries, except the one nearby, can be considered to be negligible. Therefore, the higher hardness measured from the indent near the grain boundary on both grains compared to those made within the corresponding grains is likely to be an acceptable measurement, rather than an outliner.
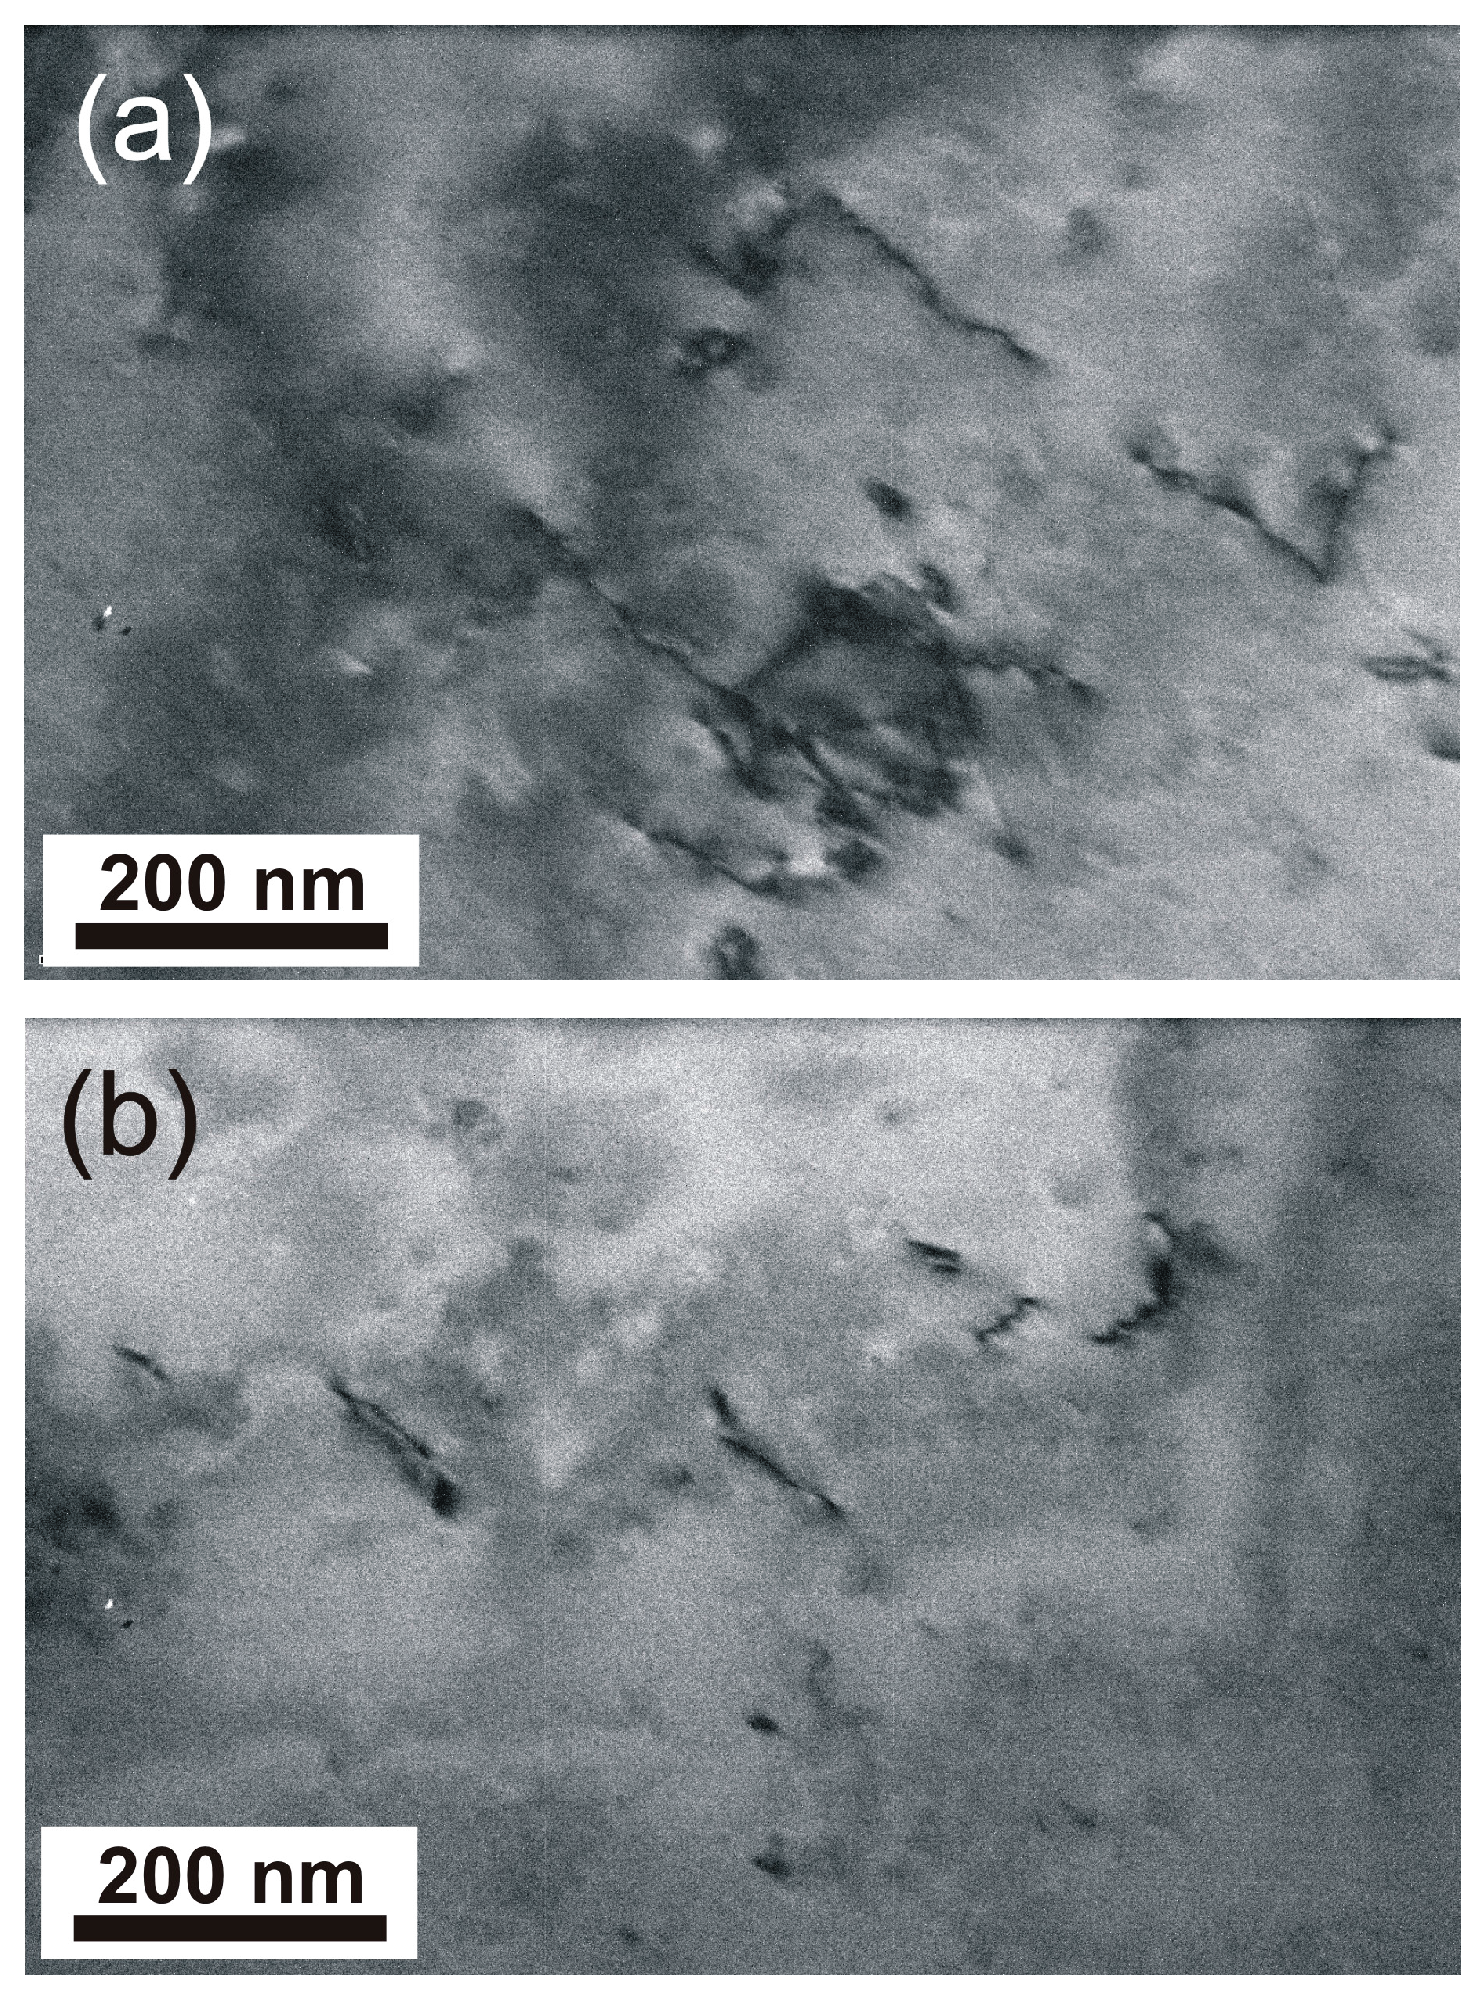
As discussed above, the dual grain boundary slip transmission behaviors depending on which of the adjacent grains the indents were made have been reported in the literature and in prior works performed by the current authors. If Equation (11) is a plausible prediction for slip transmission across a grain boundary, slip transmission observed from grain B to grain A suggests that the dislocation flux is in the direction from grain B to grain A. This implies that the initial mobile dislocation density is higher in grain B. This is a reasonable assumption as TEM examinations of a similar Cu sample have shown that the dislocation density could be different from grain to grain and dislocation clusters or a higher dislocation density were also observed from some grains, as shown in Figure 14.
6. Conclusions
This work has introduced a dislocation density-based model for slip transfer across grain boundaries with a new approach. A continuum dislocation density-based model is coupled with crystal plasticity formulation to characterize the dislocation flux grain boundary interaction phenomena for polycrystalline copper with different numbers of grains. The model considers the orientation of grain boundaries, slip systems of neighboring grains, and the state of shear stress on all available slip systems in order to determine which slip system has enough potential to display dislocation flux from that specific grain boundary. Additionally, the stress field of the grain boundary and dislocation pileups is modeled to have a better understanding of the strength of the grain boundary and the stress field in its vicinity. By introducing Nye’s tensor, the extended stress field induced by the pileups and the grain boundary is calculated using Mura’s integral equations, which in turn is introduced as back stress in the expression for the resolved shear stress for slip. It is shown that the extended stress field is more dominant close to the boundary and fades away very quickly far away from the boundary. The results show that while the strength of the boundary has a significant effect on the macroscopic stress-strain behavior, the effect of the extended stress field is negligible. In order to illustrate the capability of the model to predict the grain boundary slip transmission conditions, a series of nanoindentation tests was performed on a copper sample. The results from the nanoindentation results and EBSD and SPM imaging clearly show slip transmission across the grain boundary, verifying the dislocation flux model.
Acknowledgments
The support provided by the National Science Foundation’s CMMI program under Grant No. 1434879 is gratefully acknowledged.
Author Contributions
Mehdi Hamid, Hao Lyu and Hussein M Zbib were responsible for developing the main idea of the paper. Pui Ching Wo was responsible for designing the experiments. Ben Jared Schuessler performed the experiments. Pui Ching Wo contributed in writing the experimental section. Mehdi Hamid was responsible for the modeling and writing the paper.
Conflicts of Interest
The authors declare no conflict of interest.
References
- Stricker, M.; Gagel, J.; Schmitt, S.; Schulz, K.; Weygand, D.; Gumbsch, P. On slip transmission and grain boundary yielding. Comput. Micromech. Mater. 2016, 51, 271–278. [Google Scholar] [CrossRef]
- Shen, Z.; Wagoner, R.H.; Clsrk, W.A.T. Dislocation and grain boundary interactions in metals. Entomophaga 1994, 39, 107–119. [Google Scholar] [CrossRef]
- Hirth, J.P. The influence of grain boundaries on mechanical properties. Metall. Trans. 1972, 3, 3047–3067. [Google Scholar] [CrossRef]
- Petch, N.J. The cleavage strength of polycrystals. J. Iron Steel Inst. 1953, 174, 25–28. [Google Scholar]
- Hall, E.O. The deformation and ageing of mild steel. Proc. Phys. Soc. B 1951, 64, 747. [Google Scholar] [CrossRef]
- Leibfried, G. Verteilung von Versetzungen im statischen Gleichgewicht. Z. Phys. 1951, 130, 214–226. [Google Scholar] [CrossRef]
- Esheby, J.D.; Frank, F.; Nabarro, F.R. The equilibrium of linear arrays of dislocations. Philos. Mag. 1951, 42, 351–364. [Google Scholar] [CrossRef]
- Hirth, J.P.; Lothe, J. Theory of Dislocations; McGraw-Hill: New York, NY, USA, 1969. [Google Scholar]
- Shao, S.; Medyanik, S.N. Interaction of dislocations with incoherent interfaces in nanoscale FCC–BCC metallic bi-layers. Model. Simul. Mater. Sci. Eng. 2010, 18, 55010. [Google Scholar] [CrossRef]
- Askari, H.; Zbib, H.M.; Sun, X. Multiscale modeling of inclusions and precipitation hardening in metal matrix composites: Application to advanced high-strength steels. ASCE J. Nanomech. Micromech. 2013, 3, 24–33. [Google Scholar] [CrossRef]
- Lim, H.; Lee, M.G.; Kim, J.H.; Adams, B.L.; Wagoner, R.H. Simulation of polycrystal deformation with grain and grain boundary effects. Int. J. Plast. 2011, 27, 1328–1354. [Google Scholar] [CrossRef]
- Brentnall, W.D.; Rostoker, W. Some observations on microyielding. Acta Metall. 1965, 13, 187–198. [Google Scholar] [CrossRef]
- Hauser, J.J.; Chalmers, B. The plastic deformation of bicrystals of f.c.c. metals. Acta Metall. 1961, 9, 802–818. [Google Scholar] [CrossRef]
- Worthington, P.J.; Smith, E. The formation of slip bands in polycrystalline 3% silicon iron in the pre-yield microstrain region. Acta Metall. 1964, 12, 1277–1281. [Google Scholar] [CrossRef]
- Carrington, W.E.; McLean, D. Slip nuclei in silicon-iron. Acta Metall. 1965, 13, 493–499. [Google Scholar] [CrossRef]
- Bamford, T.A.; Hardiman, B.; Shen, Z.; Clark, W.A.T.; Wagoner, R.H. Micromechanism of slip propagation through a high angle boundary in alpha brass. Scr. Metall. 1986, 20, 253–258. [Google Scholar]
- Li, D.; Zbib, H.; Sun, X.; Khaleel, M. Predicting plastic flow and irradiation hardening of iron single crystal with mechanism-based continuum dislocation dynamics. Int. J. Plast. 2014, 52, 3–17. [Google Scholar] [CrossRef]
- Askari, H.; Young, J.; Field, D.; Kridli, G.; Li, D.; Zbib, H. A study of the hot and cold deformation of twin-roll cast magnesium alloy AZ31. Philos. Mag. 2014, 94, 381–403. [Google Scholar] [CrossRef]
- Lebensohn, R.A.; Tomé, C.N. A selfconsistent approach for the simulation of plastic deformation and texture development of polycrystals: Application to Zirconium alloys. Acta Metall. 1993, 41, 2611–2624. [Google Scholar] [CrossRef]
- Tomé, C.; Lebensohn, R.A. A self-consistant visco-plastic model: Calculation of rolling texture of anisotropic materials. Mater. Sci. Eng. A 1994, 175, 71–82. [Google Scholar]
- Orowan, E. Problems of plastic gliding. Proc. Phys. Soc. 1940, 52, 8–22. [Google Scholar] [CrossRef]
- Wei, Q.; Kecskes, L.; Jiao, T.; Hartwig, K.T.; Ramesh, K.T.; Ma, E. Adiabatic shear banding in ultrafine-grained Fe processed by severe plastic deformation. Acta Mater. 2004, 52, 1859–1869. [Google Scholar] [CrossRef]
- Bailey, J.E.; Hirsch, P.B. The dislocation distribution, flow stress, stored energy in cold worked polycrystalline silver. Philos. Mag. 1960, 5, 485–497. [Google Scholar] [CrossRef]
- Alankar, A. Development of a 3D Microstructure Sensetive Crystal Plasticity Model for Aluminum; Washington State University: Pullman, WA, USA, 2010. [Google Scholar]
- Ohashi, T.; K, M.; Zbib, H. A multiscale approach for modeling scale-dependent yield stress in polycrystalline metals. Int. J. Plast. 2007, 23, 897–914. [Google Scholar] [CrossRef]
- Taheri-Nassaj, N.; Zbib, H.M. A Mesoscale Model of Plasticity: Dislocation Dynamics and Patterning (1D). J. Eng. Mater. Technol. 2016, 138, 41015. [Google Scholar] [CrossRef]
- Hingwe, A.K.; Subramanian, K.N. Deformation of duplex crystals and two-phase bicrystals of alpha-beta brass. J. Mater. Sci. 1975, 10, 183–188. [Google Scholar] [CrossRef]
- Prantl, W.; Werner, E.; Stuwe, H.P. Statistical Treatment of Measured Orientation Relationships. Textures Microstruct. 1988, 8–9, 483. [Google Scholar] [CrossRef]
- Werner, E.; Prantel, W. Slip transfer across grain and phase boundaries. Acta Metall. Mater 1989, 38, 533–537. [Google Scholar] [CrossRef]
- Lange, F.F. Mathematical characterization of a general bicrystal. Acta Metllall. 1967, 15, 311–318. [Google Scholar] [CrossRef]
- Davis, K.G.; Teightsoonian, E.; Lu, A. Slip band continuity across grain boundaries in aluminum. Acta Metall. 1996, 14, 1677–1684. [Google Scholar] [CrossRef]
- Shen, Z.; Wagoner, R.H.; Clark, W.A. Dislocation pile-up and grain boundary interactions in 304 stainless stee. Scr. Metall. 1986, 20, 921–926. [Google Scholar] [CrossRef]
- Zhang, P.; Balint, D.; Lin, J. Controlled Poisson Voronoi tessellation for virtual grain structure generation: A statistical evaluation. Philos. Mag. 2011, 91, 4555–4573. [Google Scholar] [CrossRef]
- Zhang, P.; Karimpour, D.; Balint, D.; Lin, J.; Farrugia, D. A controlled Poisson Voronoi tessellation for grain and cohesive boundary generation applied to crystal plasticity analysis. Comput. Mater. Sci. 2012, 64, 84–89. [Google Scholar] [CrossRef]
- Cao, J.; Zhuang, W.; Wang, S.; Ho, K.; Zhang, N.; Lin, J.; Dean, T. An integrated crystal plasticity FE system for microforming simulation. J. Multiscale Model. 2009, 1, 107–124. [Google Scholar] [CrossRef]
- Akarapu, S. Dislocation Interactions with Interfaces; Washington State University: Pullman, WA, USA, 2009. [Google Scholar]
- Shizawa, K.; Zbib, H.M. A thermodynamical theory of gradient elastoplasticity with dislocation density tensor. I: Fundamentals. Int. J. Plast. 1999, 15, 899–938. [Google Scholar] [CrossRef]
- Nye, J. Some geometrical relations in dislcoated crystals. Acta Metall. 2015, 8, 159–168. [Google Scholar]
- Soer, W.A.; de Hosson, J.T.M. Detection of grain boundary resistance to slip transfer using nanoindentation. Mater. Lett. 2005, 59, 3192–3195. [Google Scholar] [CrossRef]
- Soifer, Y.M.; Verdyan, A.; Kazakevich, M.; Rabkin, E. Nanohardness of copper in the vicinity of grain boundary. Scr. Mater. 2002, 47, 799–804. [Google Scholar] [CrossRef]
- Oliver, W.; Pharr, G.M.J. An improved technique for determining hardness and elastic modulus using load and displacement sensing indentation experiments. J. Mater. Res. 1992, 7, 1564–1583. [Google Scholar] [CrossRef]
- Boyer, H.E. Hardness Testing; Metals Park: Geauga, OH, USA, 1987. [Google Scholar]
- Tabor, D. Hardness of Metal; Calrendon Press: Wotton-under-Edge, UK, 1951. [Google Scholar]
Figure 1.
Geometrical relation for slip planes in neighbor grains A and B.

Figure 2.
Schematic of the computation of dislocation flux between two grains.
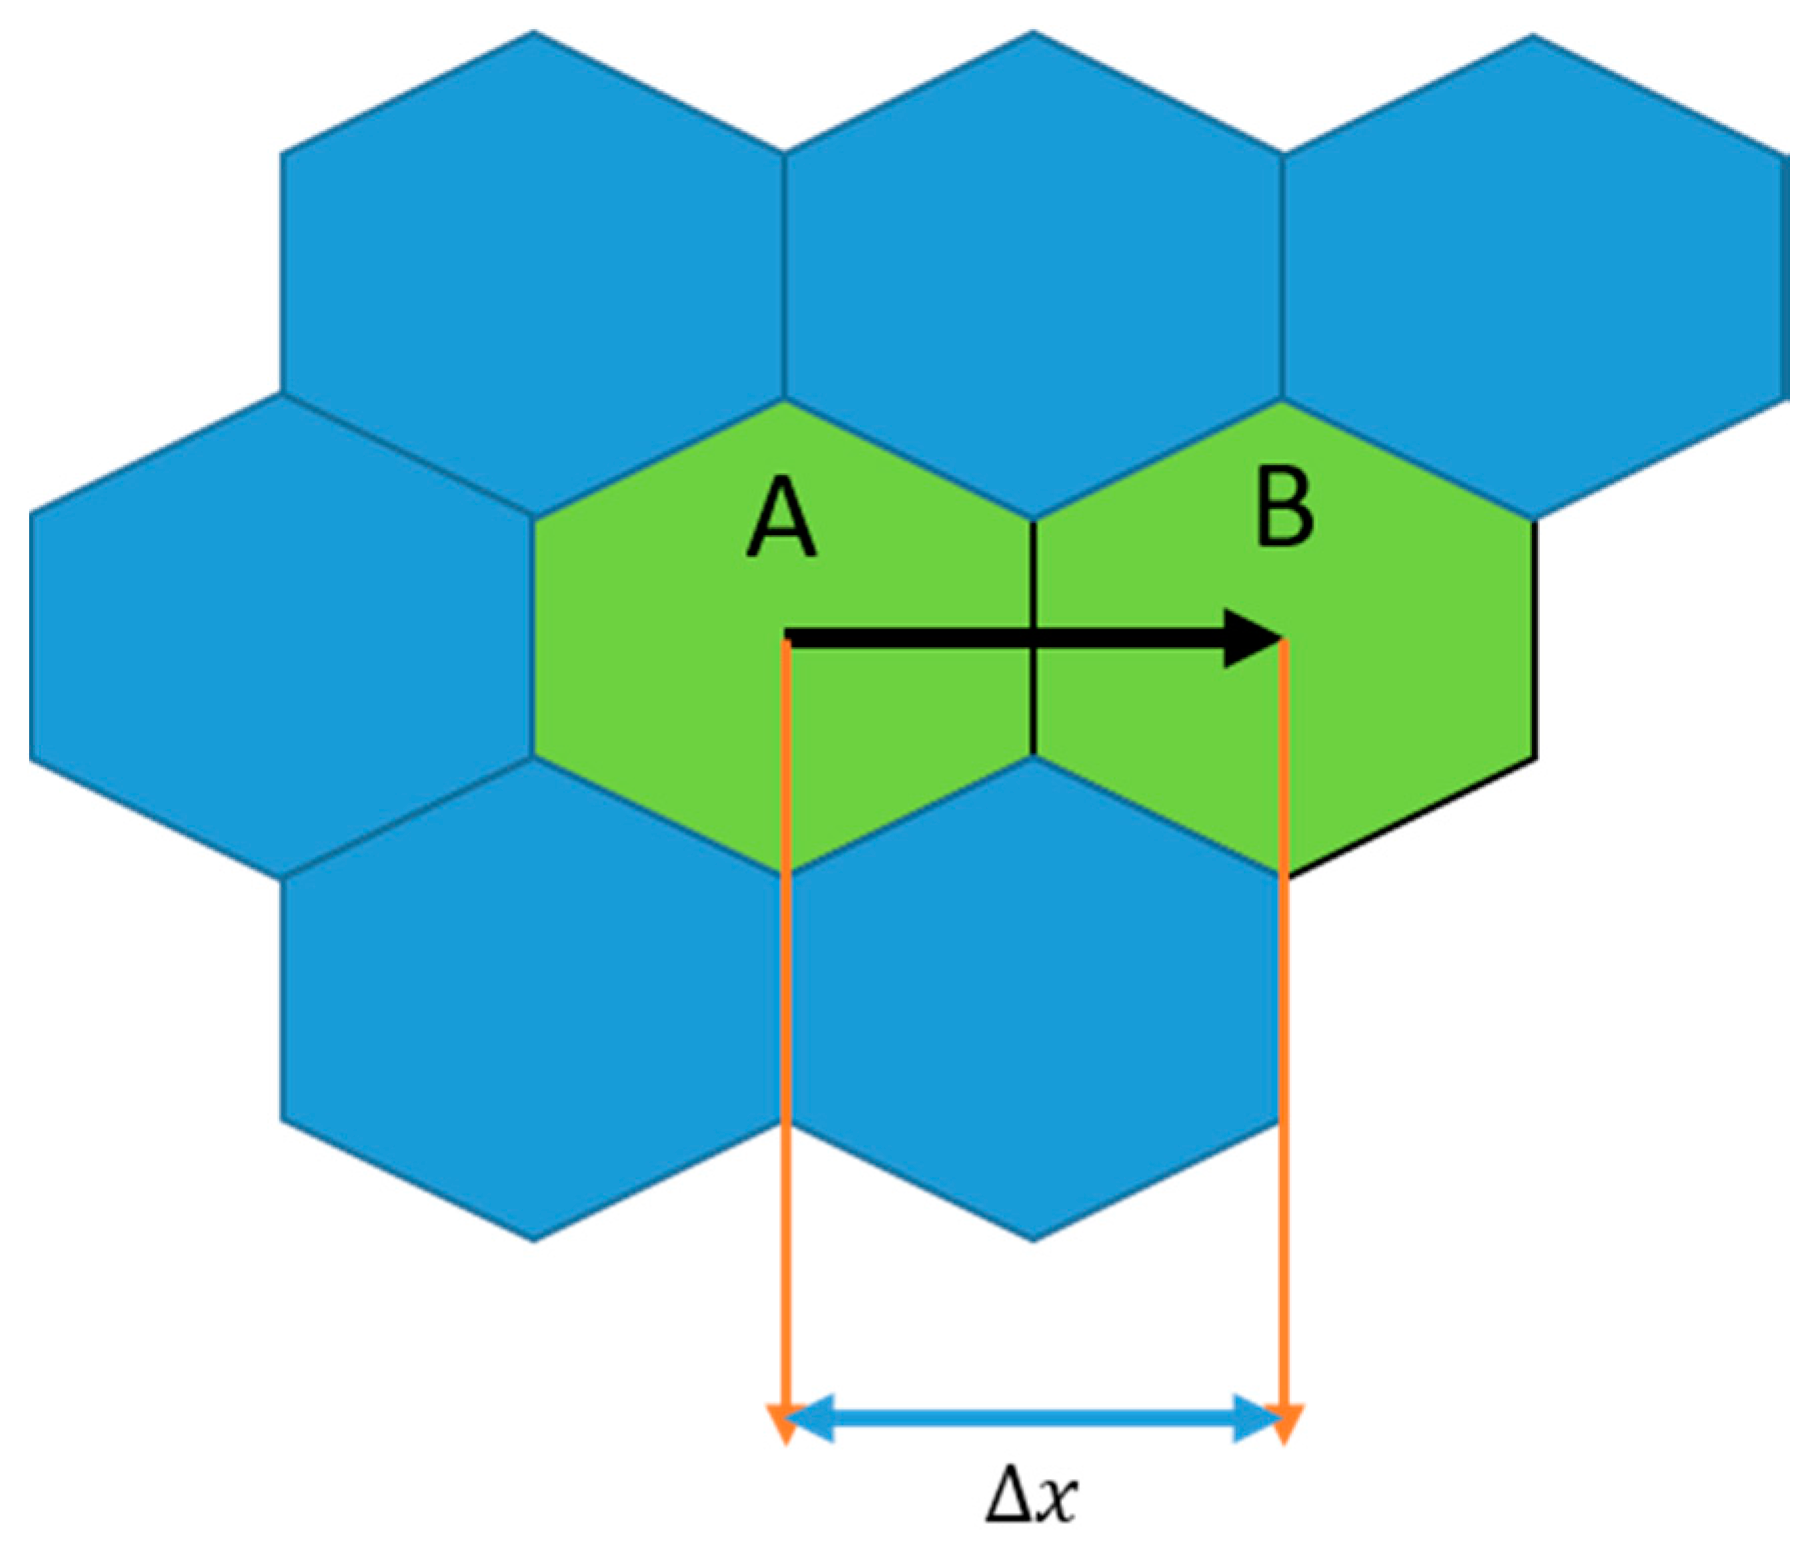
Figure 3.
The pole figure of initial texture.
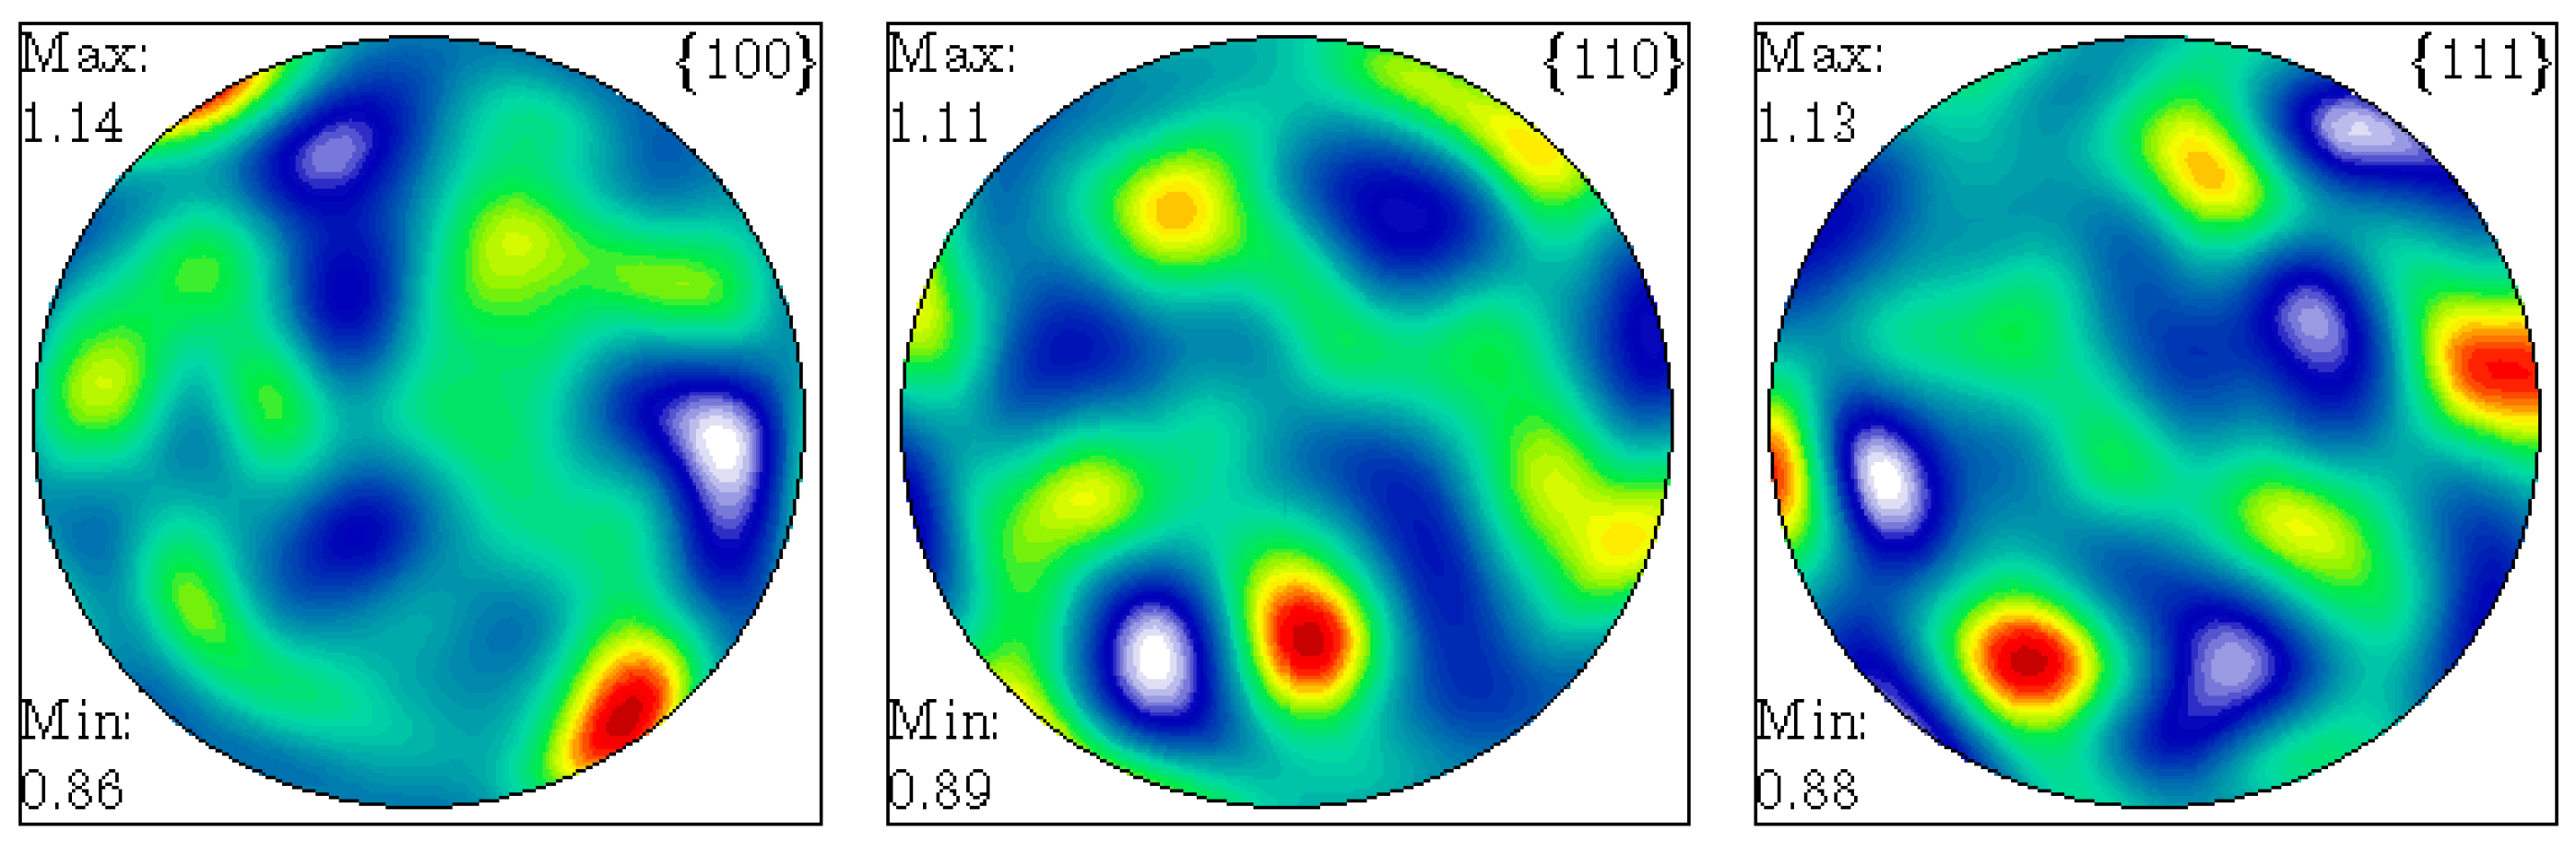
Figure 4.
Dislocation flux across grain boundaries in a 4, 30, 100, and 300 grain polycrystalline structure of Cu. (The colored grains are grains that experienced dislocation flux).
Figure 4.
Dislocation flux across grain boundaries in a 4, 30, 100, and 300 grain polycrystalline structure of Cu. (The colored grains are grains that experienced dislocation flux).

Figure 5.
True stress-strain graphs for 4 and 30 grain polycrystalline structures of Cu. The solid lines show the polycrystalline structure behavior with dislocation flux behavior.
Figure 5.
True stress-strain graphs for 4 and 30 grain polycrystalline structures of Cu. The solid lines show the polycrystalline structure behavior with dislocation flux behavior.
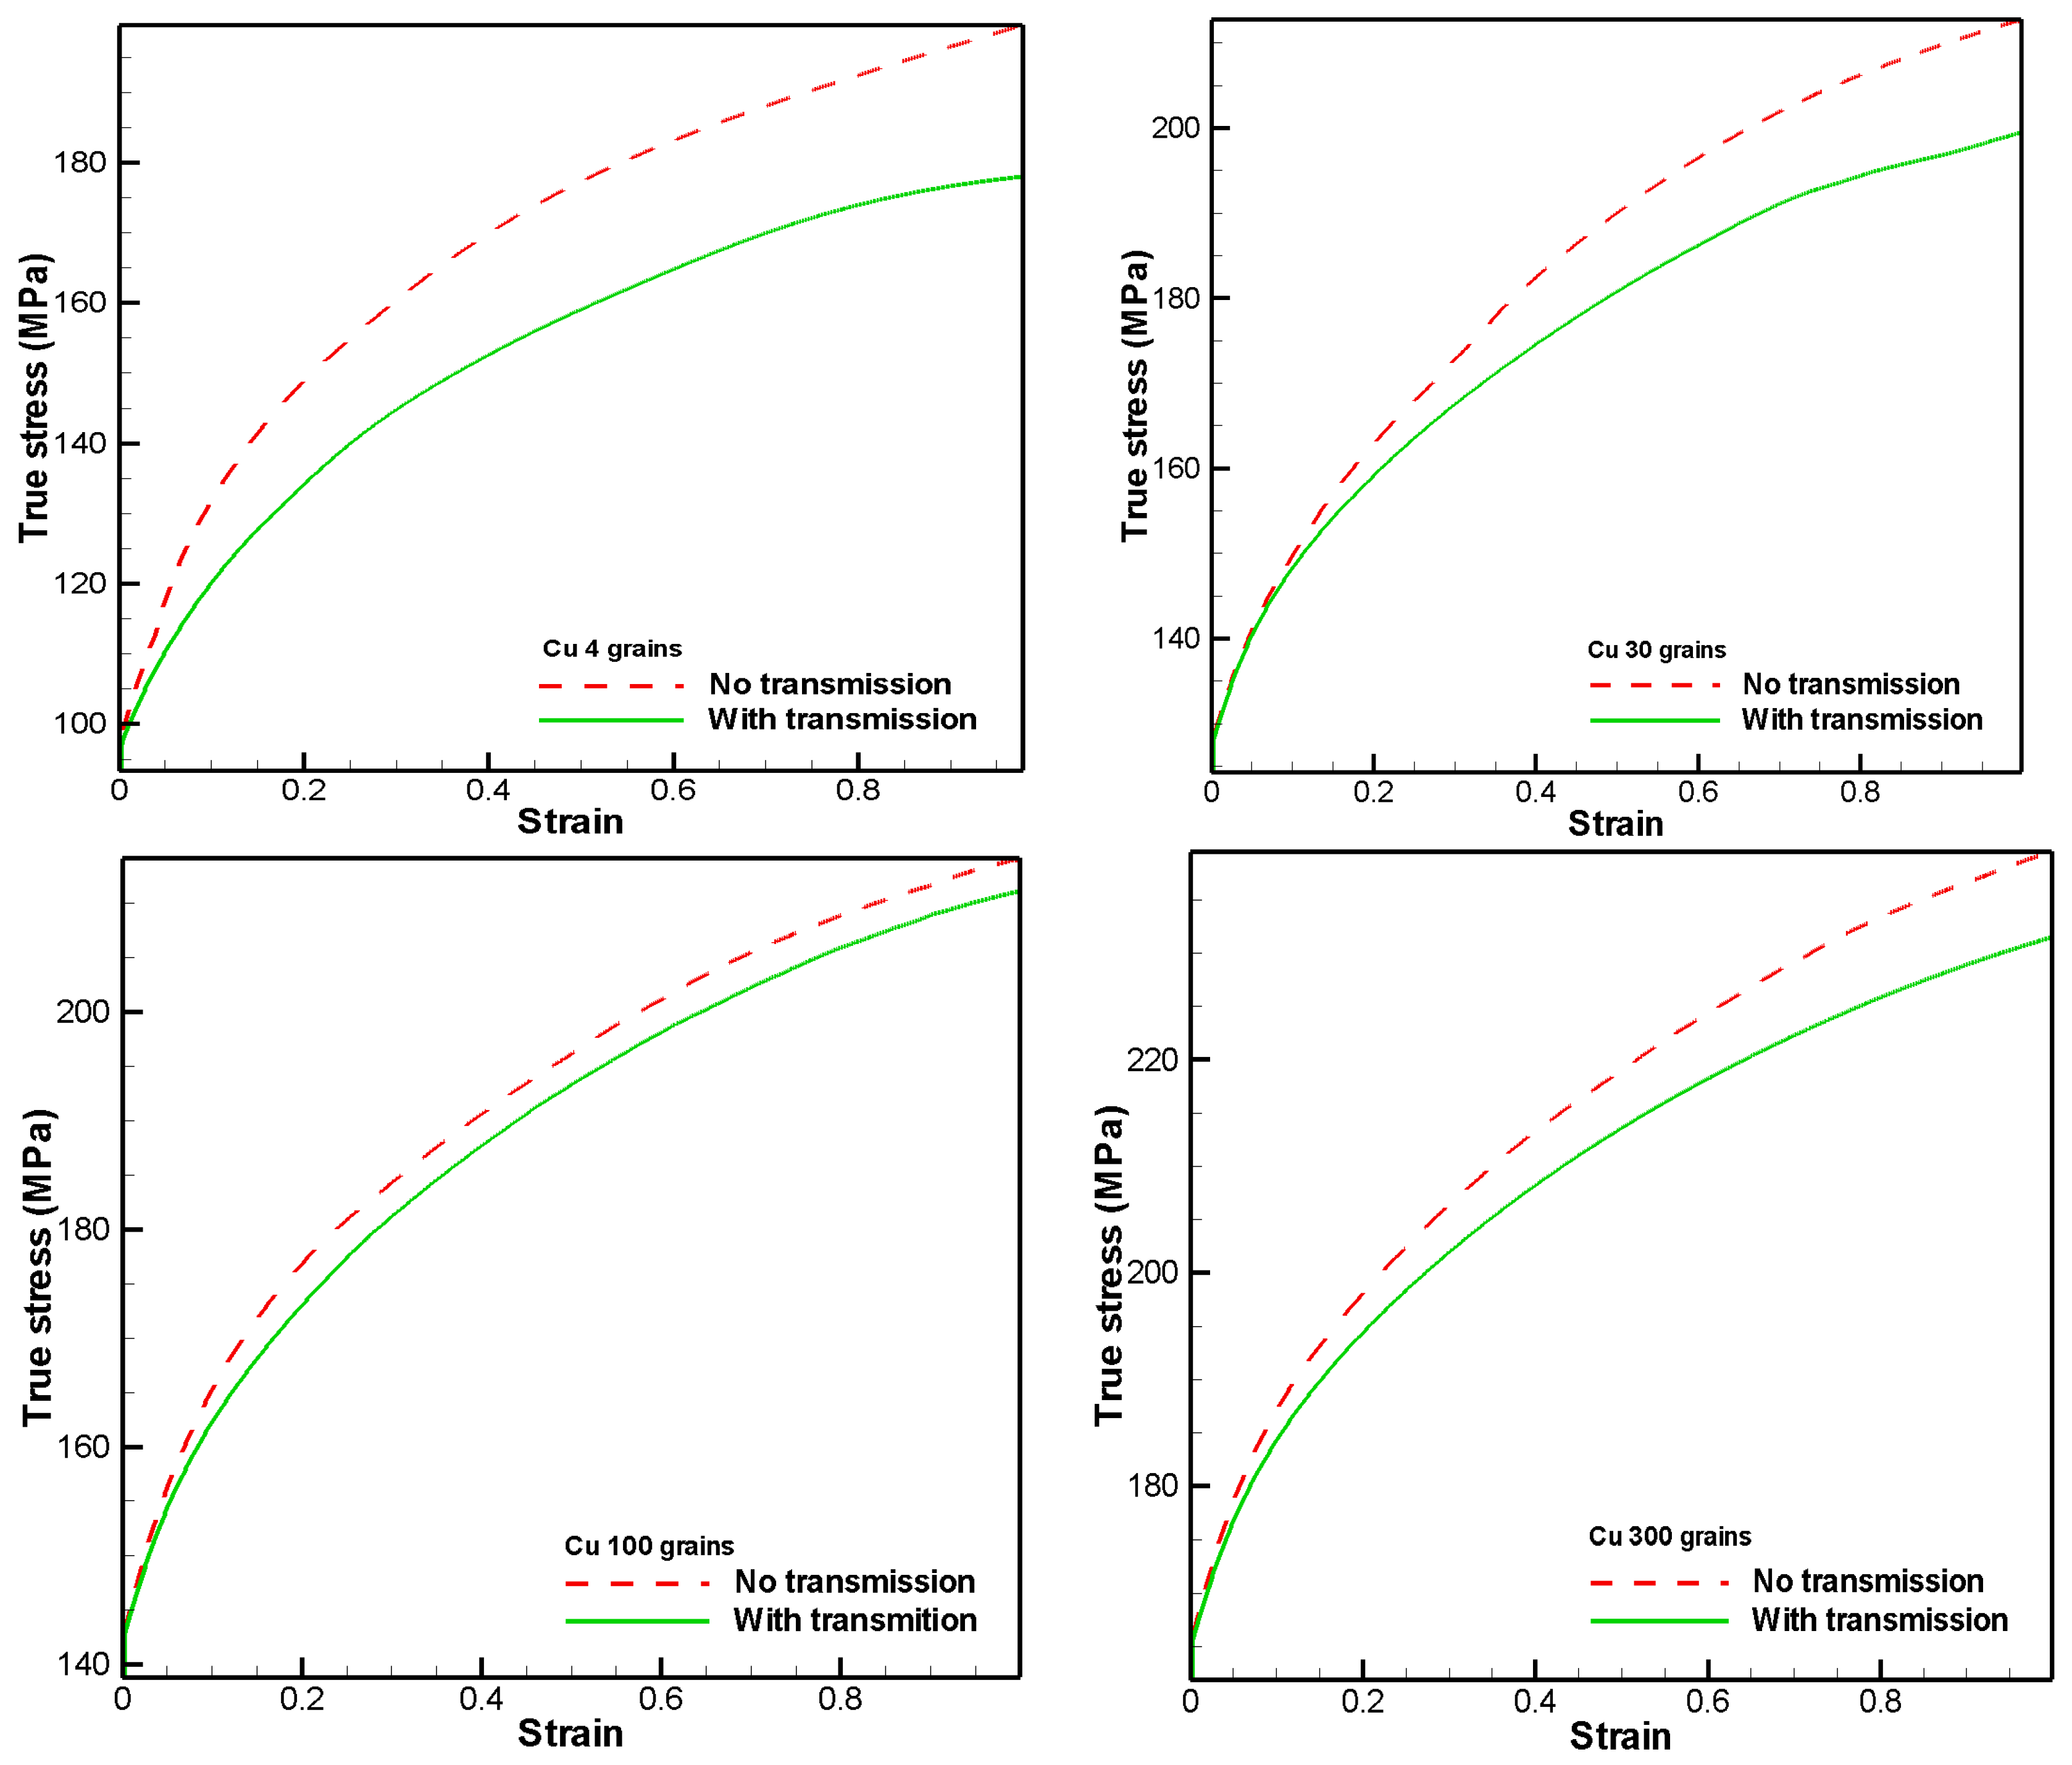
Figure 6.
True stress-strain curve for a polycrystal of Cu with 5000 grains.
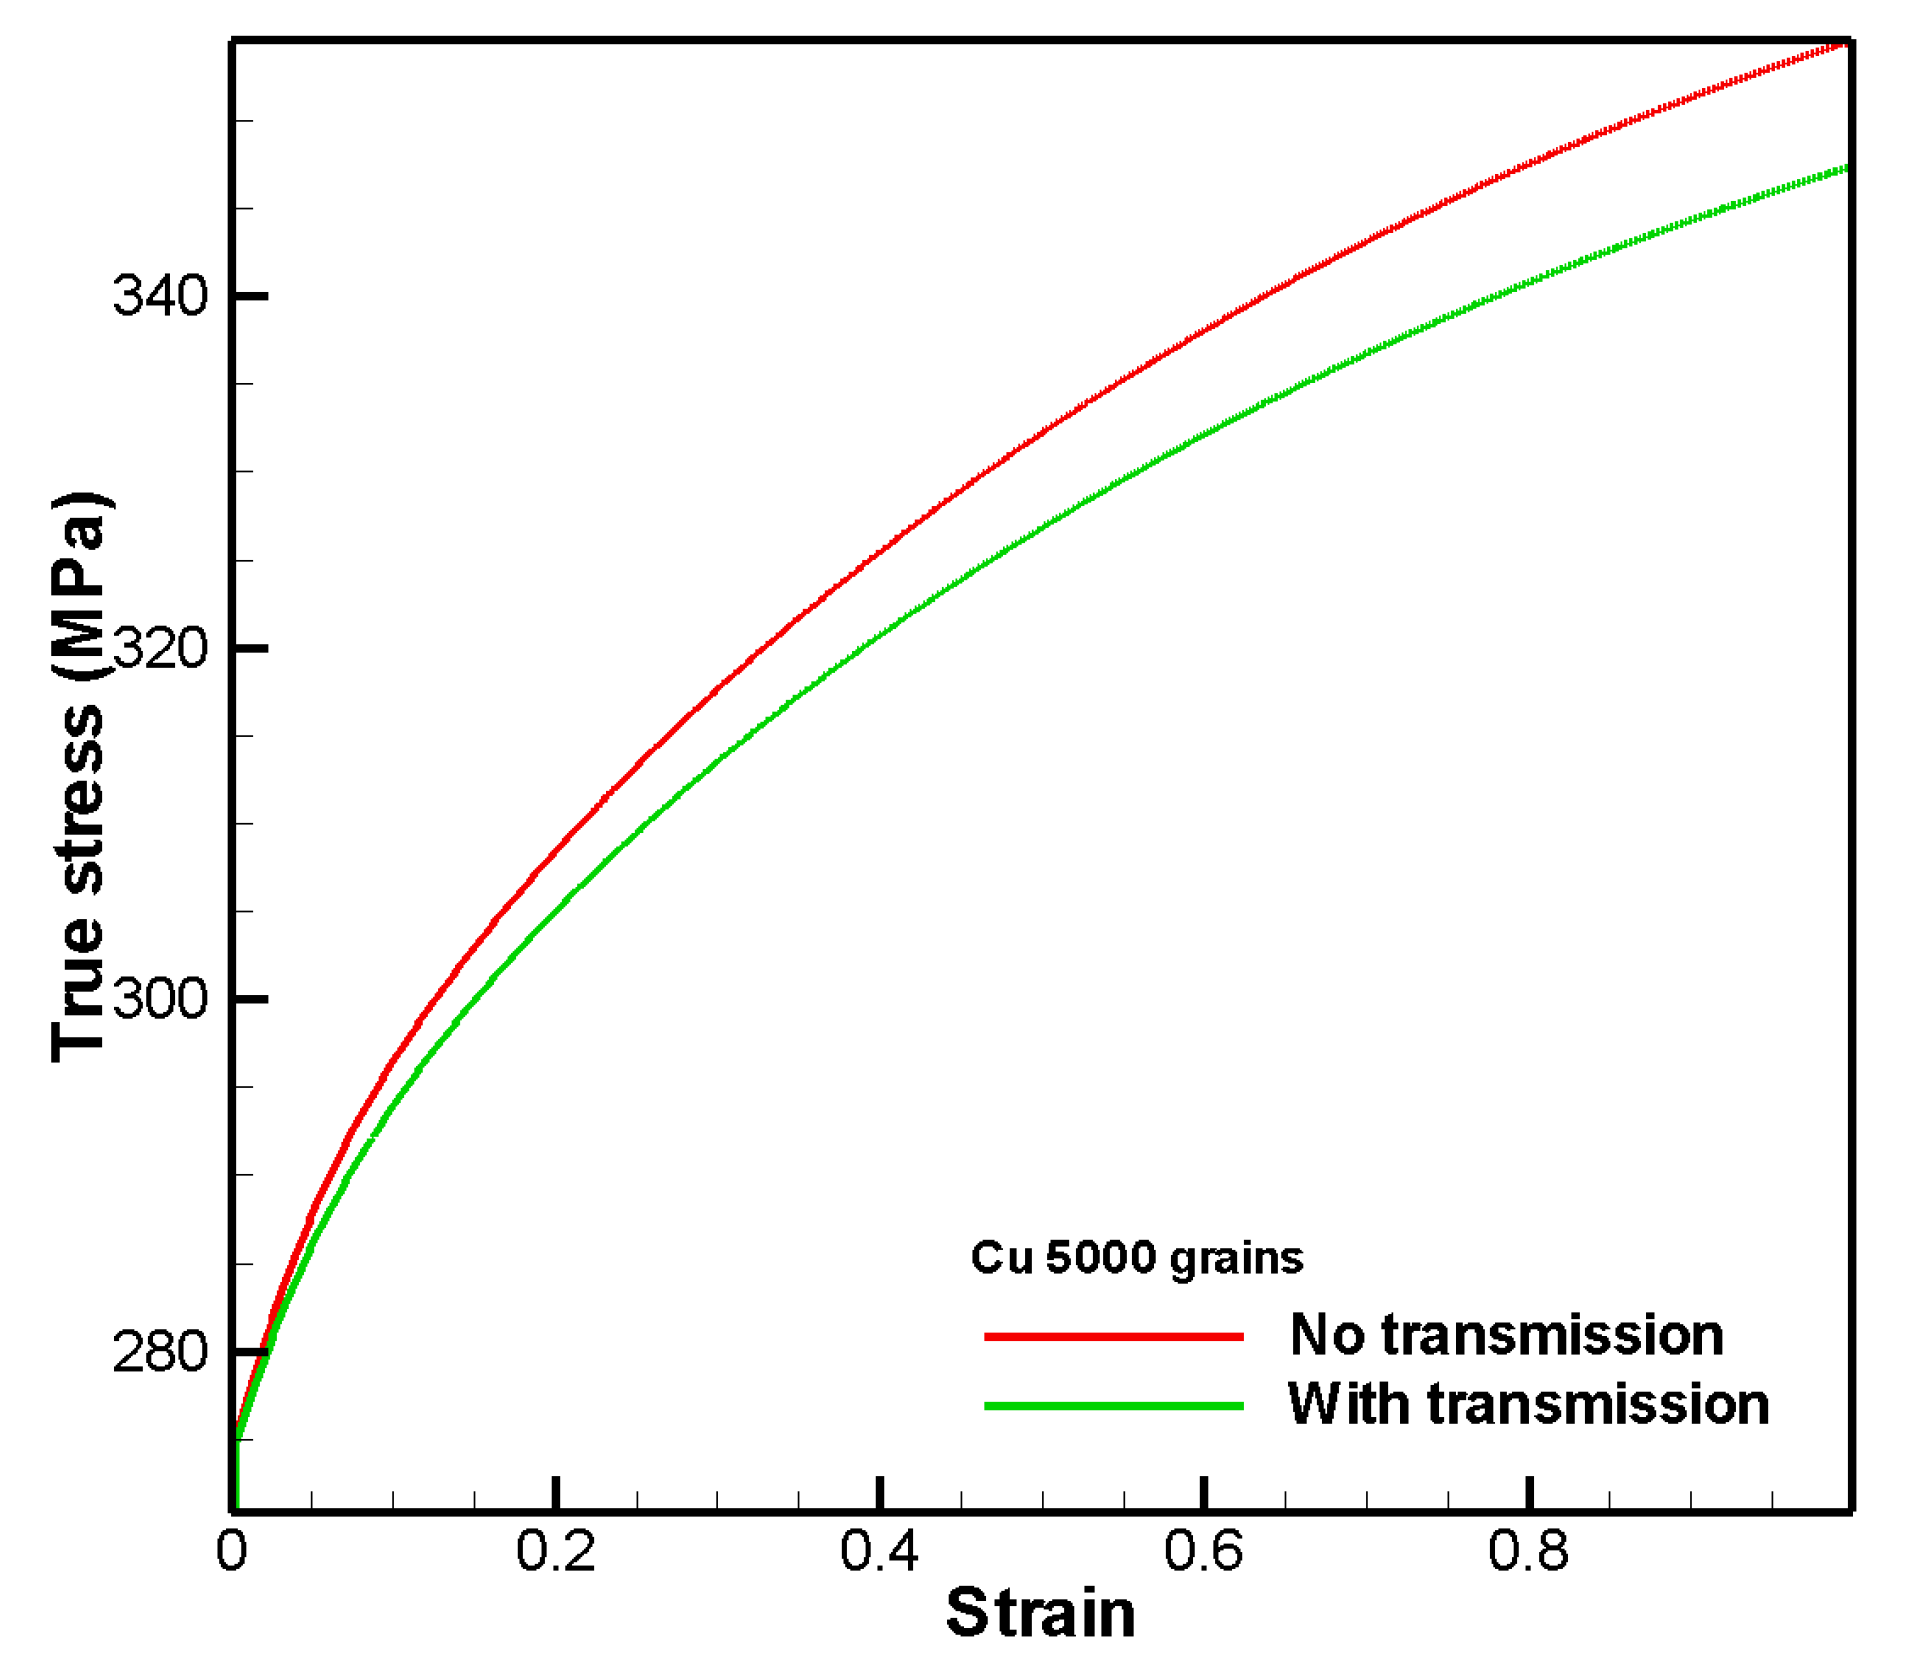
Figure 7.
A general schematic of the long-range interaction of dislocations in an infinite homogenous medium.
Figure 7.
A general schematic of the long-range interaction of dislocations in an infinite homogenous medium.

Figure 8.
Stress field of a sample grain boundary-distance. Insert: Dislocation pileup, and representation of grain boundary as an ensemble of dislocation boundaries.
Figure 8.
Stress field of a sample grain boundary-distance. Insert: Dislocation pileup, and representation of grain boundary as an ensemble of dislocation boundaries.
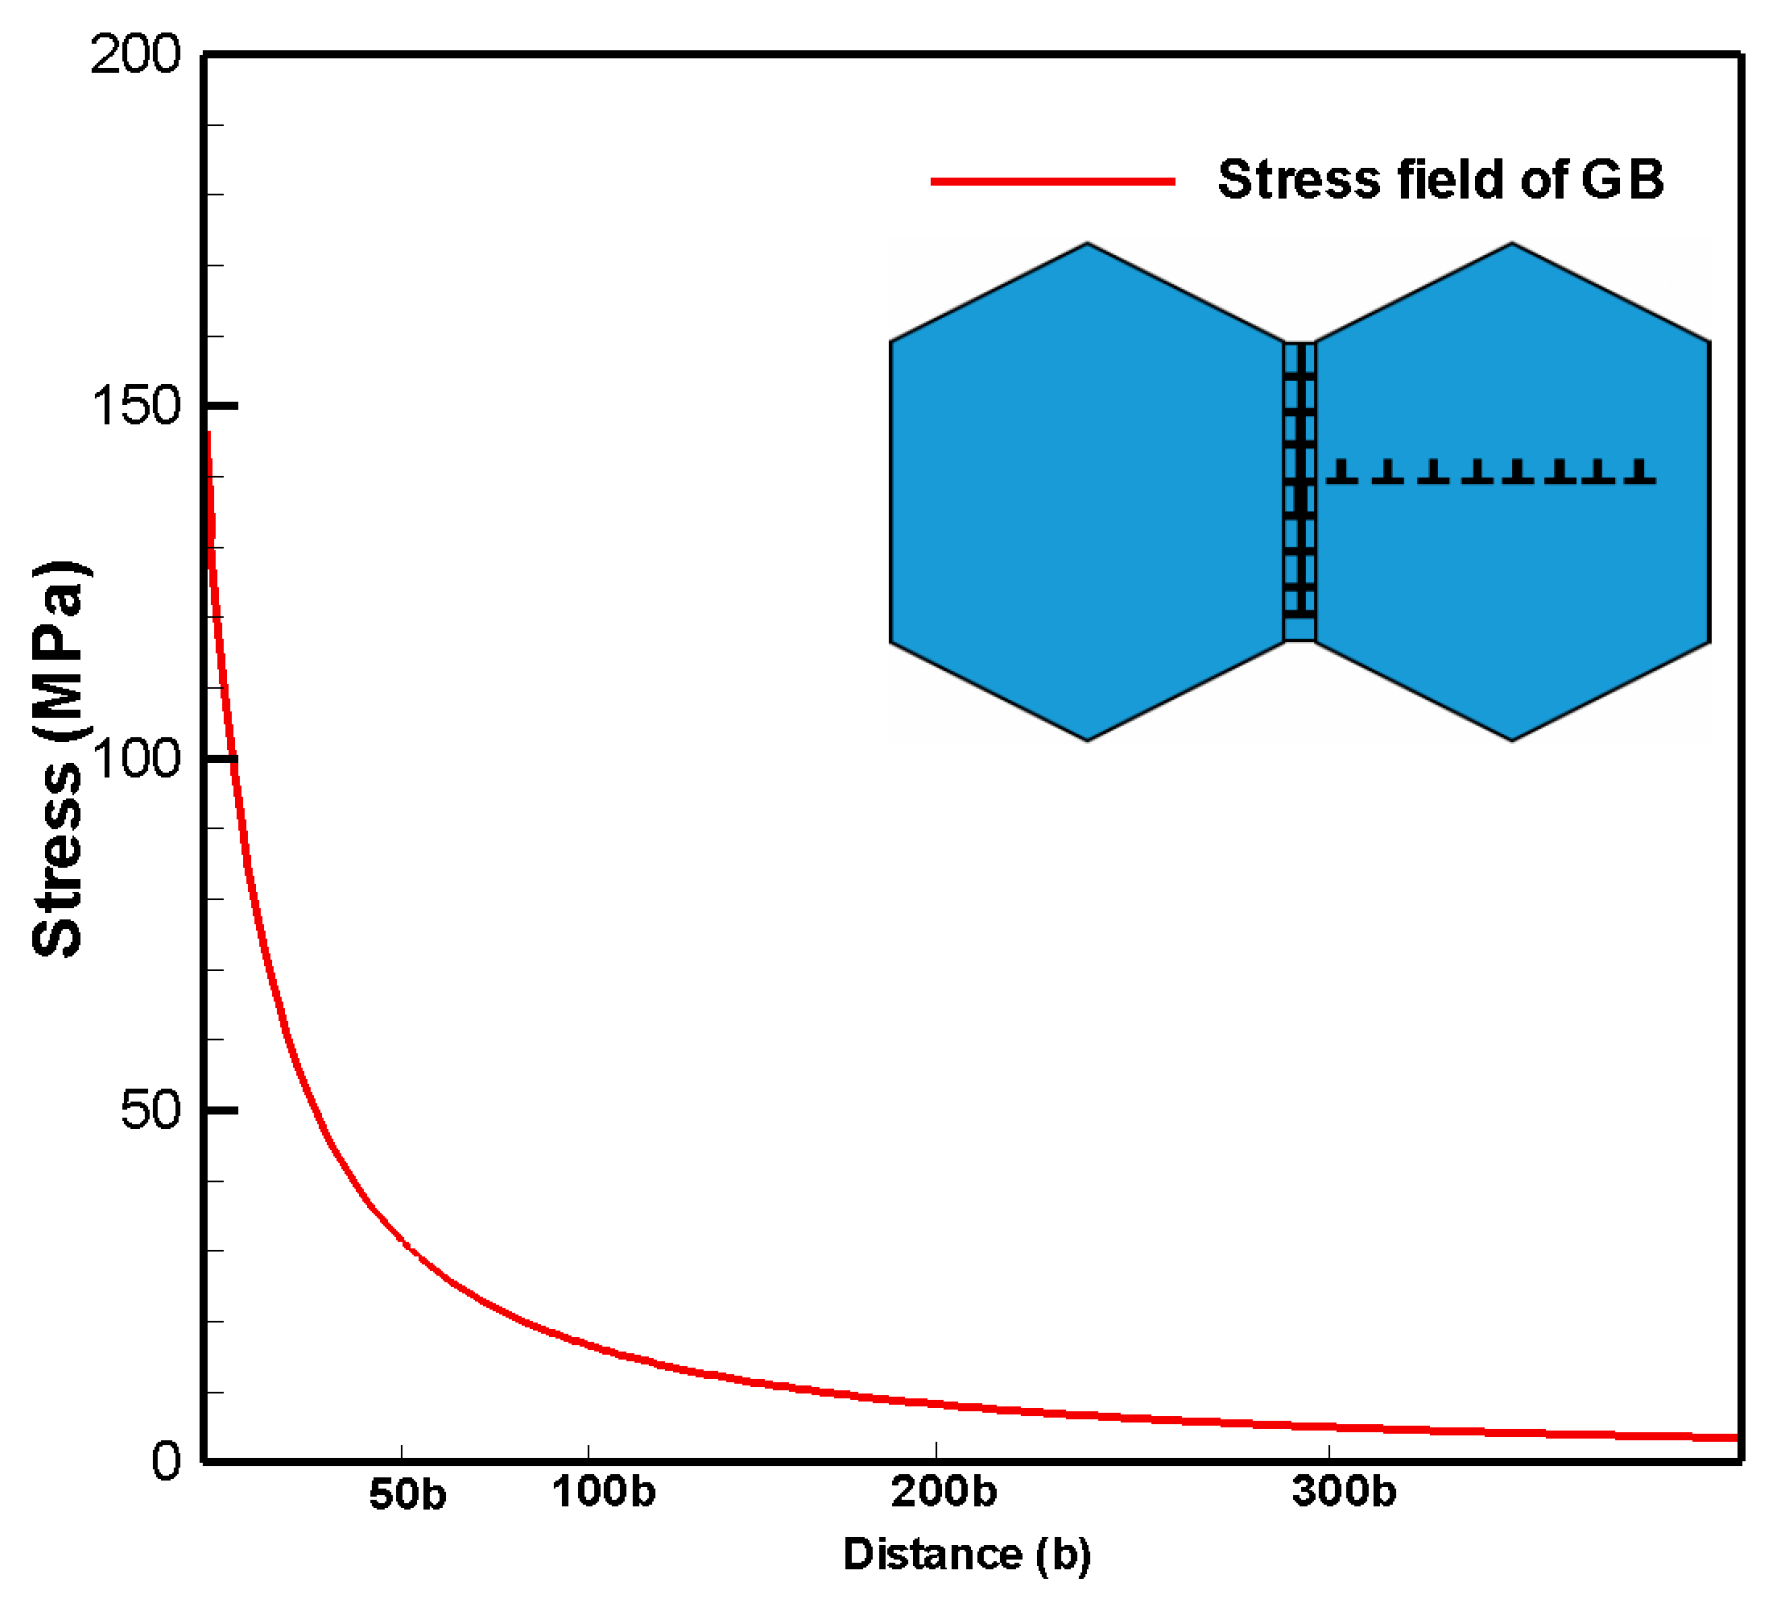
Figure 9.
The back stress effect on the dislocation transmission across the GB for 30, 100, 300, and 5000 grains.
Figure 9.
The back stress effect on the dislocation transmission across the GB for 30, 100, 300, and 5000 grains.

Figure 10.
Inversed pole figure (IPF) representation of an EBSD scan over an arbitrary area in the Cu sample and the corresponding pole figures in 111, 100, and 110 projections. Nanoindentation tests were carried out on grain A and B indicated in the IPF scan.
Figure 10.
Inversed pole figure (IPF) representation of an EBSD scan over an arbitrary area in the Cu sample and the corresponding pole figures in 111, 100, and 110 projections. Nanoindentation tests were carried out on grain A and B indicated in the IPF scan.
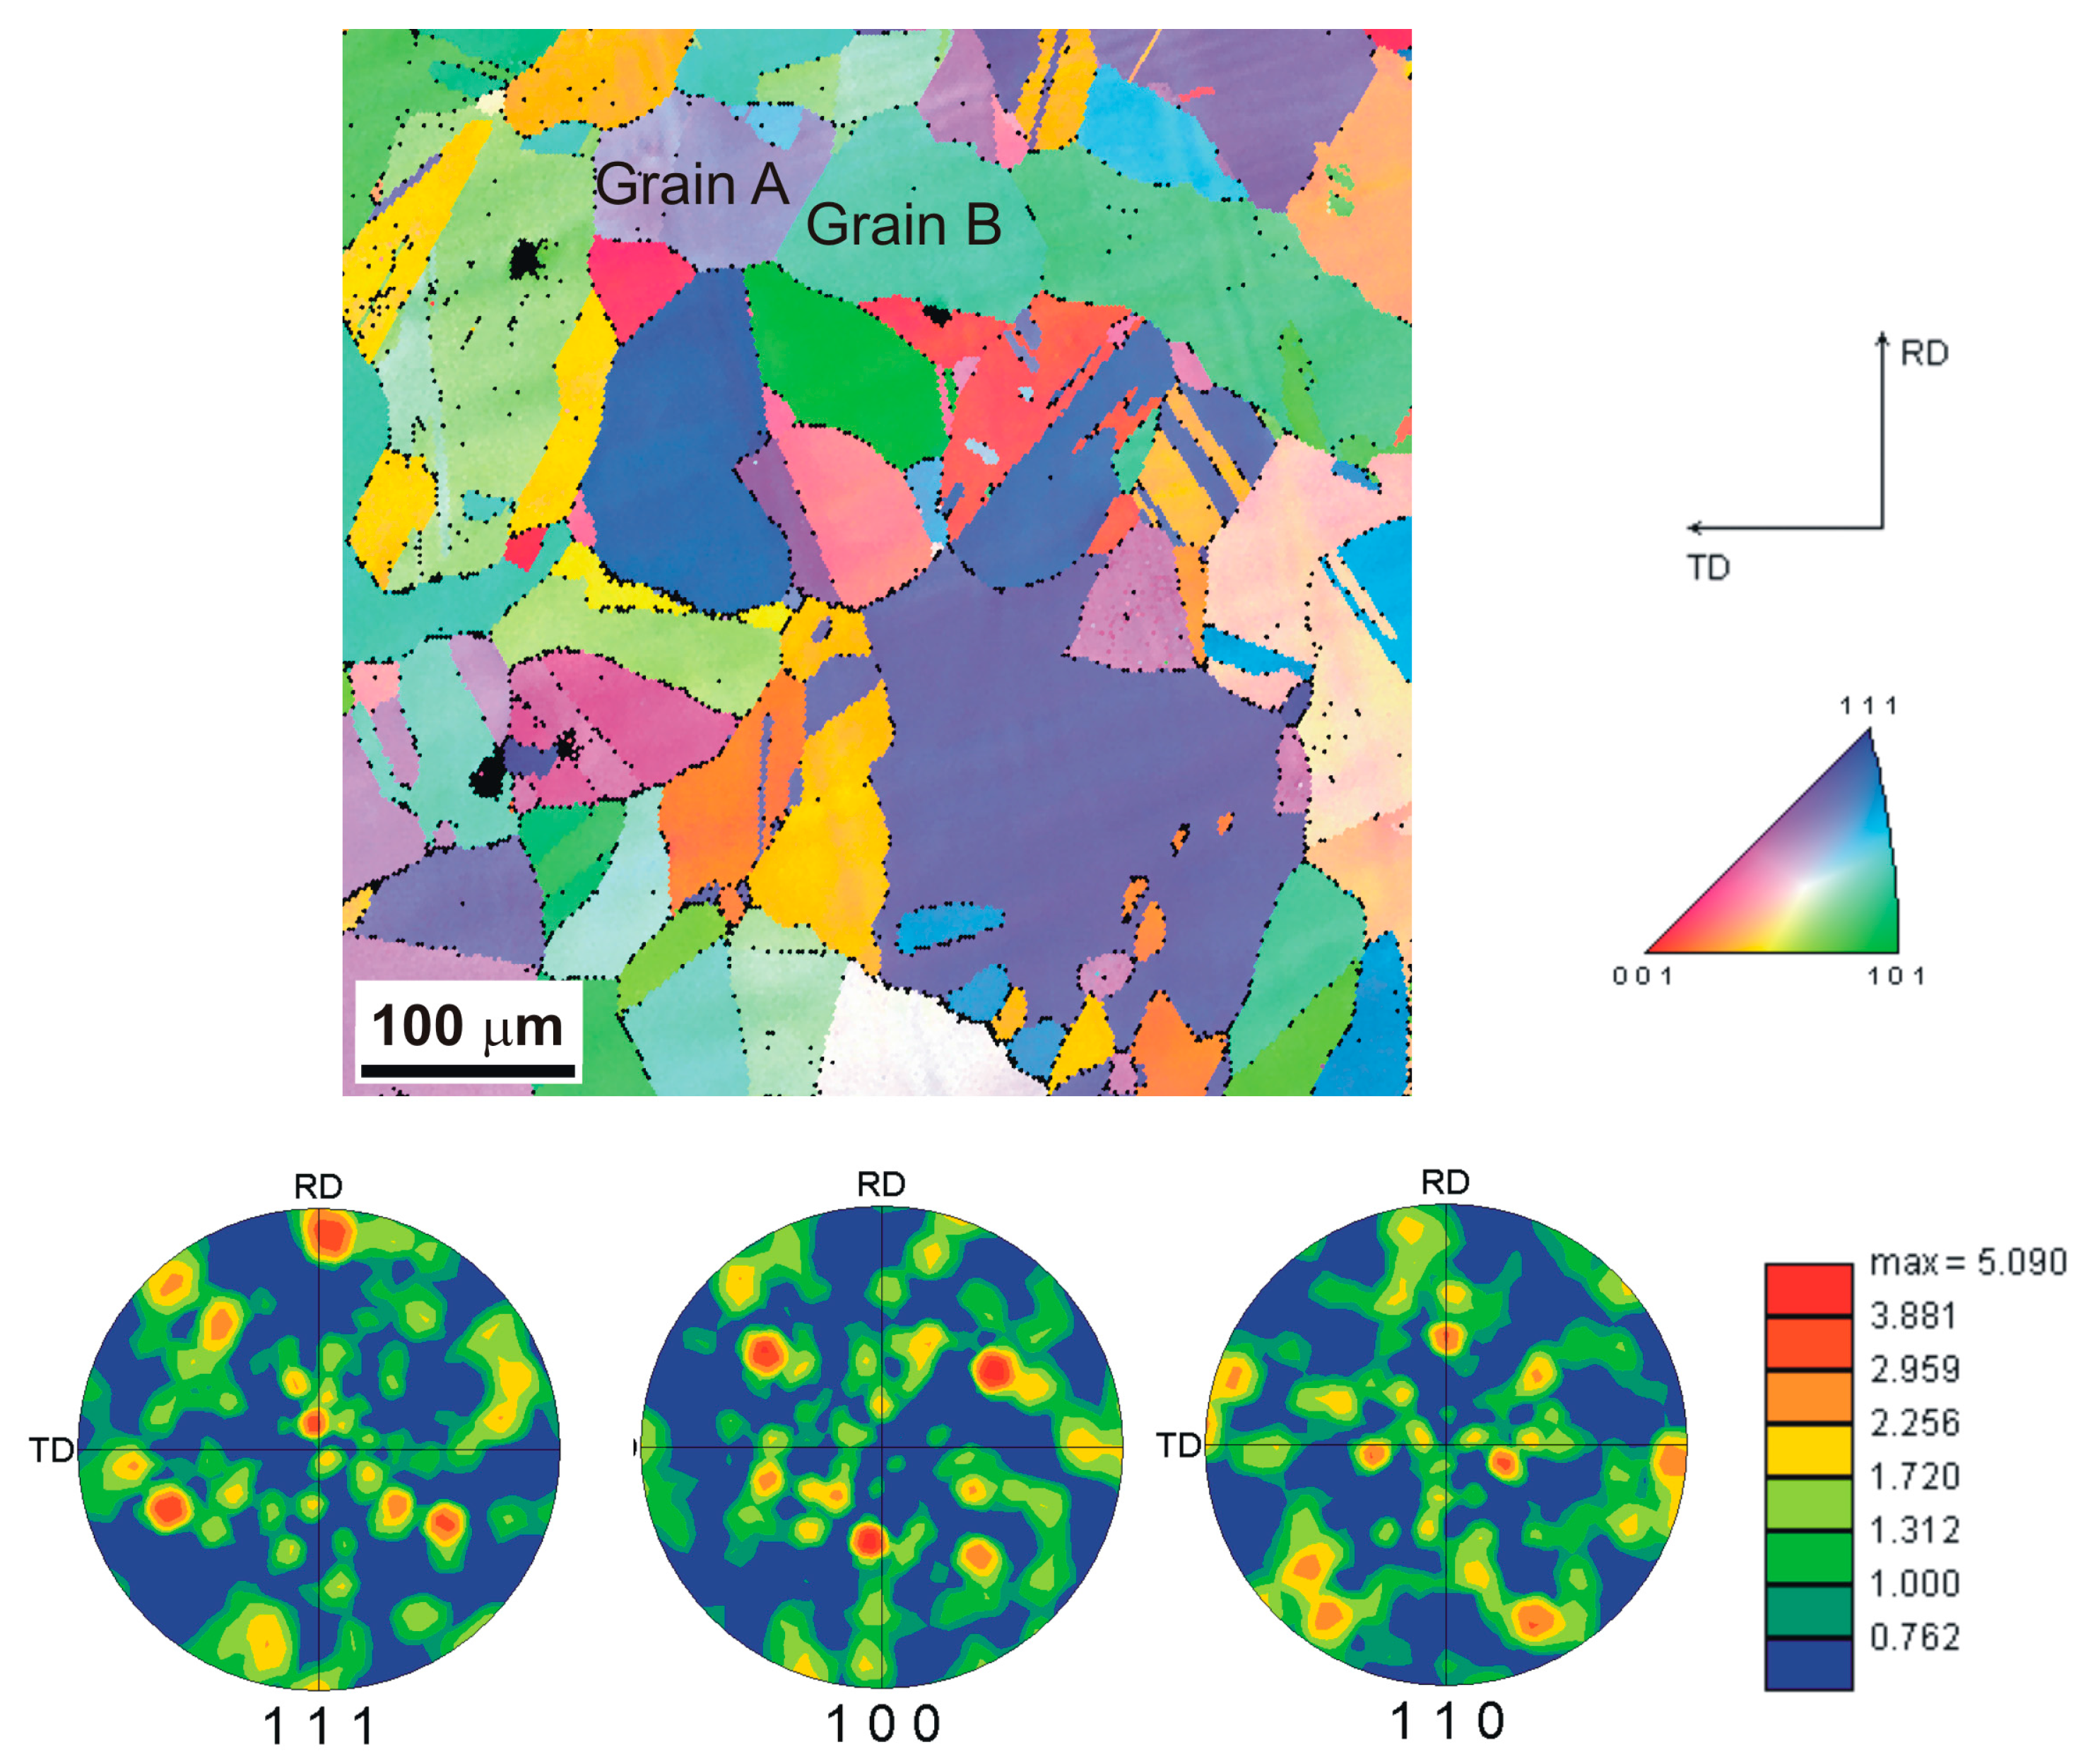
Figure 11.
GND intensity representation of EBSD scans of areas around the near grain boundary indent on (a) grain A and (b) grain B. The indent mark is approximately outlined with dotted lines. Arrow in Figure (b) indicates the higher GND concentration across the grain boundary on grain A.
Figure 11.
GND intensity representation of EBSD scans of areas around the near grain boundary indent on (a) grain A and (b) grain B. The indent mark is approximately outlined with dotted lines. Arrow in Figure (b) indicates the higher GND concentration across the grain boundary on grain A.

Figure 12.
SPM images of indents made with Pmax = 2000 µN > 45 µm from any grain boundaries (a) (i) on grain A and (b) (i) on grain B; and near the grain boundary (a) (ii) on grain A and (b) (ii) on grain B.
Figure 12.
SPM images of indents made with Pmax = 2000 µN > 45 µm from any grain boundaries (a) (i) on grain A and (b) (i) on grain B; and near the grain boundary (a) (ii) on grain A and (b) (ii) on grain B.

Figure 13.
Cross-sectional profile of a plane (X-X’) obtained from the SPM images shown in Figure 12 that cut across the grain boundary and the indents made in (a) grain A and (b) grain B.
Figure 13.
Cross-sectional profile of a plane (X-X’) obtained from the SPM images shown in Figure 12 that cut across the grain boundary and the indents made in (a) grain A and (b) grain B.

Figure 14.
Bright field TEM images showing (a) an area of a dislocation rich region and (b) an area of a dislocation deficient region from the same Cu sample. The beam direction of the two images are both close to {111}.
Figure 14.
Bright field TEM images showing (a) an area of a dislocation rich region and (b) an area of a dislocation deficient region from the same Cu sample. The beam direction of the two images are both close to {111}.


Table 1.
Definition of each term in evaluation Equations (9) and (10).
| Terms | Definition |
|---|---|
| Multiplication and growth of resident dislocations as well as the production of new dislocations from Frank-Reed sources in the slip system α | |
| Mutual annihilation of two mobile edge or screw dislocations | |
| Mobile dislocations turns into immobile dislocations | |
| Immobile dislocations turns to mobilization | |
| cross-slip | |
| Annihilation between mobile and immobile dislocations |
Table 2.
Hardness measurements on grain A and B using Pmax = 500 µN.
| H (GPa) of Indent Made in Grain A | H (GPa) of Indent Made in Grain B | |
|---|---|---|
| Far from any grain boundaries (n = 50) * | 1.89, standard deviation = 0.09 | 1.70, standard deviation = 0.11 |
| Near the same grain boundary (n = 1) * | 94.72 (at ~2.0 µm from the grain boundary) | 113.34 (at ~1.5 µm from the grain boundary) |
* n = the number of indents made to obtain the mean and standard deviation of the sets of data above.
© 2017 by the authors. Licensee MDPI, Basel, Switzerland. This article is an open access article distributed under the terms and conditions of the Creative Commons Attribution (CC BY) license (http://creativecommons.org/licenses/by/4.0/).
Share and Cite
MDPI and ACS Style
Hamid, M.; Lyu, H.; Schuessler, B.J.; Wo, P.C.; Zbib, H.M. Modeling and Characterization of Grain Boundaries and Slip Transmission in Dislocation Density-Based Crystal Plasticity. Crystals 2017, 7, 152. https://doi.org/10.3390/cryst7060152
AMA Style
Hamid M, Lyu H, Schuessler BJ, Wo PC, Zbib HM. Modeling and Characterization of Grain Boundaries and Slip Transmission in Dislocation Density-Based Crystal Plasticity. Crystals. 2017; 7(6):152. https://doi.org/10.3390/cryst7060152
Chicago/Turabian StyleHamid, Mehdi, Hao Lyu, Ben Jared Schuessler, Pui Ching Wo, and Hussein M Zbib. 2017. "Modeling and Characterization of Grain Boundaries and Slip Transmission in Dislocation Density-Based Crystal Plasticity" Crystals 7, no. 6: 152. https://doi.org/10.3390/cryst7060152
Note that from the first issue of 2016, this journal uses article numbers instead of page numbers. See further details here.