Article

Synchrotron Radiation Pair Distribution Function Analysis of Gels in Cements

by
Ana Cuesta
1,
Jesus D. Zea-Garcia
2,
Diana Londono-Zuluaga
2,
Angeles G. De la Torre
2,
Isabel Santacruz
2,
Oriol Vallcorba
1 and
Miguel A.G. Aranda
1,*
1
ALBA Synchrotron radiation facility, Carrer de la Llum 2-26, 08290 Cerdanyola del Vallès, Spain
2
Departamento de Química Inorgánica, Cristalografía y Mineralogía, Universidad de Málaga, 29071 Málaga, Spain
*
Author to whom correspondence should be addressed.
Crystals 2017, 7(10), 317; https://doi.org/10.3390/cryst7100317
Submission received: 22 September 2017 / Revised: 12 October 2017 / Accepted: 17 October 2017 / Published: 18 October 2017

Abstract

:
The analysis of atomic ordering in a nanocrystalline phase with small particle sizes, below ≈5 nm, is intrinsically complicated because of the lack of long-range order. Furthermore, the presence of additional crystalline phase(s) may exacerbate the problem, as is the case in cement pastes. Here, we use the synchrotron pair distribution function (PDF) chiefly to characterize the local atomic order of the nanocrystalline phases, gels, in cement pastes. We have used a multi r-range analysis approach, where the ~4–7 nm r-range allows determining the crystalline phase contents; the ~1–2.5 nm r-range is used to characterize the atomic ordering in the nanocrystalline component; and the ~0.2–1.0 nm r-range gives insights about additional amorphous components. Specifically, we have prepared four alite pastes with variable water contents, and the analyses showed that a defective tobermorite, Ca11Si9O28(OH)2·8.5H2O, gave the best fit. Furthermore, the PDF analyses suggest that the calcium silicate hydrate gel is composed of this tobermorite and amorphous calcium hydroxide. Finally, this approach has been used to study alternative cements. The hydration of monocalcium aluminate and ye’elimite pastes yield aluminum hydroxide gels. PDF analyses show that these gels are constituted of nanocrystalline gibbsite, and the particle size can be as small as 2.5 nm.

1. Introduction

1.1. Cements

Portland cement (PC) is considered the most manufactured product in the world, as it is the main component of the construction industry [1]. PC is composed of the Portland clinker, the setting regulator (a calcium sulfate source), and in many cases additions and admixtures [2]. The four main phases of any Portland clinker are: ~65 wt% alite or Ca3SiO5; ~15 wt% belite, or Ca2SiO4; ~15 wt% ferrite, or Ca4Al2Fe2O10, and ~5 wt% tricalcium aluminate, or Ca3Al2O6 [2].
The hydration of PC basically consists of two different types of reactions that interact with each other: the silicate hydration reactions, and the aluminate hydration reactions. The reaction kinetics of alite and tricalcium aluminate are quite fast; comparatively, the kinetics of belite and ferrite hydration reactions are much slower [2,3]. Hereafter, and for PC hydration, we restrict the introduction and discussion to the hydration of pure alite, although we are aware that this is a simplification.
The main hydration reaction in PC is that produced by alite. It consists of the dissolution of Ca3SiO5, the supersaturation of the medium with the different ionic species, and then, the precipitation of a calcium silicate hydrate, C-S-H gel in cement nomenclature, and the crystallization of portlandite, c-Ca(OH)2, which can be followed by powder diffraction [4]. This set of actions can be schematically represented by reaction (1), but the different processes (may) have different kinetics and be locally inhomogeneous. Therefore, reaction (1) is a simplification for alite hydration.
Ca3SiO5 + 5.2H2O → crystalline: 1.2Ca(OH)2 + gel: (CaO)1.8(SiO2)(H2O)4.0
The literature includes descriptions of slightly different hydration reactions for alite, which lead to calcium silicate hydrate gels with slightly different densities and compositions [5,6,7,8]. Here, we have chosen the Ca-to-Si average ratio of 1.8, because it is compatible with many previous reports, which gave values ranging from 1.7–2.0. The calcium-silicate-hydrate (C-S-H) gel is the main hydrated phase in PC pastes, and it is the main constituent responsible for the strength and durability of the resulting mortars and concretes. However, there is still controversy about the atomic structure of the C-S-H gel, and consequently, many recent works have reviewed and addressed this issue [9,10,11].
There are many studies showing that the C-S-H gel contains water within large pores and a calcium silicate hydrate of nanocrystalline nature. However, due to the low degree of crystallinity of this phase (and the presence of other crystalline phases such as portlandite, unreacted alite, calcium carbonate from partial carbonation, and several other phases in real cements), there is still no consensus on whether this nanocrystalline phase is close to tobermorite-14Å, Ca5Si6O16(OH)2·7H2O, ρ = 2.19 g/cm3; tobermorite-11Å, Ca4Si6O15(OH)2·5H2O, ρ = 2.40 g/cm3; or jennite, Ca9Si6O18(OH)6·8H2O, ρ = 2.31 g/cm3 minerals/structures [12]. This is key to understanding the density of the C-S-H gel that governs the space-filling nature of the cement paste. Several experimental and theoretical techniques have proposed that tobermorite better justifies the properties of this calcium silicate hydrate [13,14,15].
If this emerging picture is correct, then it opens another conundrum: how can nanocrystalline tobermorite, which has a Ca/Si ratio of 0.67 or 0.83, explain the observed Ca/Si ratio in gels, which commonly range from 1.7 to 1.9 in pastes without additions? Defective tobermorite could justify a Ca/Si atomic ratio close to 1.2–1.3, but not higher than that. One way to reconcile all of the observations is to suppose that the microstructure of the C-S-H gel, arising from the hydration of alite, is a fine intermixing of tobermorite with amorphous Ca(OH)2 plus the water in the small and large gel pores [6,13,16]. An updated mechanism of growth of the C-S-H gel, and consequently, the evolution and nature of the gel water, have been very recently proposed [17].
Portland cement is not the only cement that is commercially available. Calcium aluminate cements (CAC) [18] are another kind of cements that is currently used for several special applications. The main component of CAC cements is monocalcium aluminate, or CaAl2O4. At temperatures higher than 30 °C, CaAl2O4 hydrates according to reaction (2), and after its dissolution, the crystallization of hydrogarnet, Ca3Al2(OH)12, and the precipitation of a nanocrystalline aluminum hydroxide gel take place.
3CaAl2O4 + (12+4n)H2O → crystalline: Ca3Al2(OH)12 + nanocrystalline: 4Al(OH)3(H2O)n
Furthermore, another type of cement that is also commercially available for special applications are calcium sulfoaluminate (CSA) cements [19]. These cements have calcium sulfoaluminate, or ye’elimite Ca4Al6O12SO4, as its major constituent. The hydration of ye’elimite depends upon the available sulfate content [20]. In the presence of enough sulfate, it results in the crystallization of ettringite [Ca6Al2(OH)12(SO4)3·26H2O or AFt] and the precipitation of a nanocrystalline aluminum hydroxide gel, see reaction (3):
Ca4Al6O12SO4 + 2CaSO4·2H2O + (34+4n)H2O → crystalline: Ca6Al2(OH)12(SO4)3·26H2O + nanocrystalline: 4Al(OH)3(H2O)n

1.2. X-ray Pair Distribution Function Analysis

In addition, the pair distribution function (PDF), also known as G(r), shows the probability of finding pairs of atoms separated by a distance r. G(r) is experimentally obtained by a Fourier transform of the total scattering powder pattern, according to Equation (4) [21,22,23].
G ( r ) = 4 π r [ ρ ( r ) ρ 0 ] = 2 π 0 Q [ S ( Q ) 1 ] sin ( Q r ) d Q
where ρ(r) is the microscopic atomic pair density, ρ0 is the average atomic number density, S(Q) is the total scattering structure function, and Q is the momentum transfer, Q = 4πsin(θ)/λ). In order to obtain PDF patterns of very high quality, the recorded Q-range has to be large. For this reason, the use of short wavelength X-rays and high 2θ diffracting angles is very important [24]. Total scattering data analyzed by PDF methodology may distinguish phases that are amorphous, nanocrystalline, or crystalline, and this methodology provides quantitative information concerning phase contents and local bonding environments [21].
In order to shed light and open questions in the chemistry and local atomic structure of C-S-H gels, neutron and synchrotron total scattering data analyzed by PDF methodology have been used, and these studies have been reviewed [25,26]. Here, we distinguish the PDF studies on synthetic C-S-H gels [13,27,28,29] from those carried out for C-S-H gels formed from the hydration of alite [29,30,31], as the local atomic arrangements could be quite different. These investigations have revealed that the C-S-H gel from alite hydration presents a nanocrystalline nature with atomic ordering up to approximately 40 Å [29,31]. Very recently, it has been reported that C-S-H gel has an atomic arrangement close to that of tobermorite, and the presence of nanosheets of calcium hydroxide was inferred by using a differential PDF approach [13].
Moreover, we have reported a PDF study on the hydration of CaAl2O4 to get insight into the nanocrystalline nature of the resulting aluminum hydroxide gel. It was shown that this phase was nanocrystalline gibbsite, with an average particle size close to 5.5 nm [32].
The overall objective of this research is to quantitatively analyze the atomic structure of the amorphous/nanocrystalline gels in cement pastes by using the synchrotron X-ray pair distribution function. Specifically, the questions addressed here address whether it is possible to confirm that tobermorite fits the scattering signal of C-S-H gel samples produced by the hydration of alite better than jennite. This study also investigated whether different water-to-alite ratios modify the nanocrystalline nature of the resulting C-S-H gels. Finally, this type of research has been extended to the aluminum hydroxide gels produced in the hydration of monocalcium aluminate and ye’elimite samples.

2. Results and Discussion
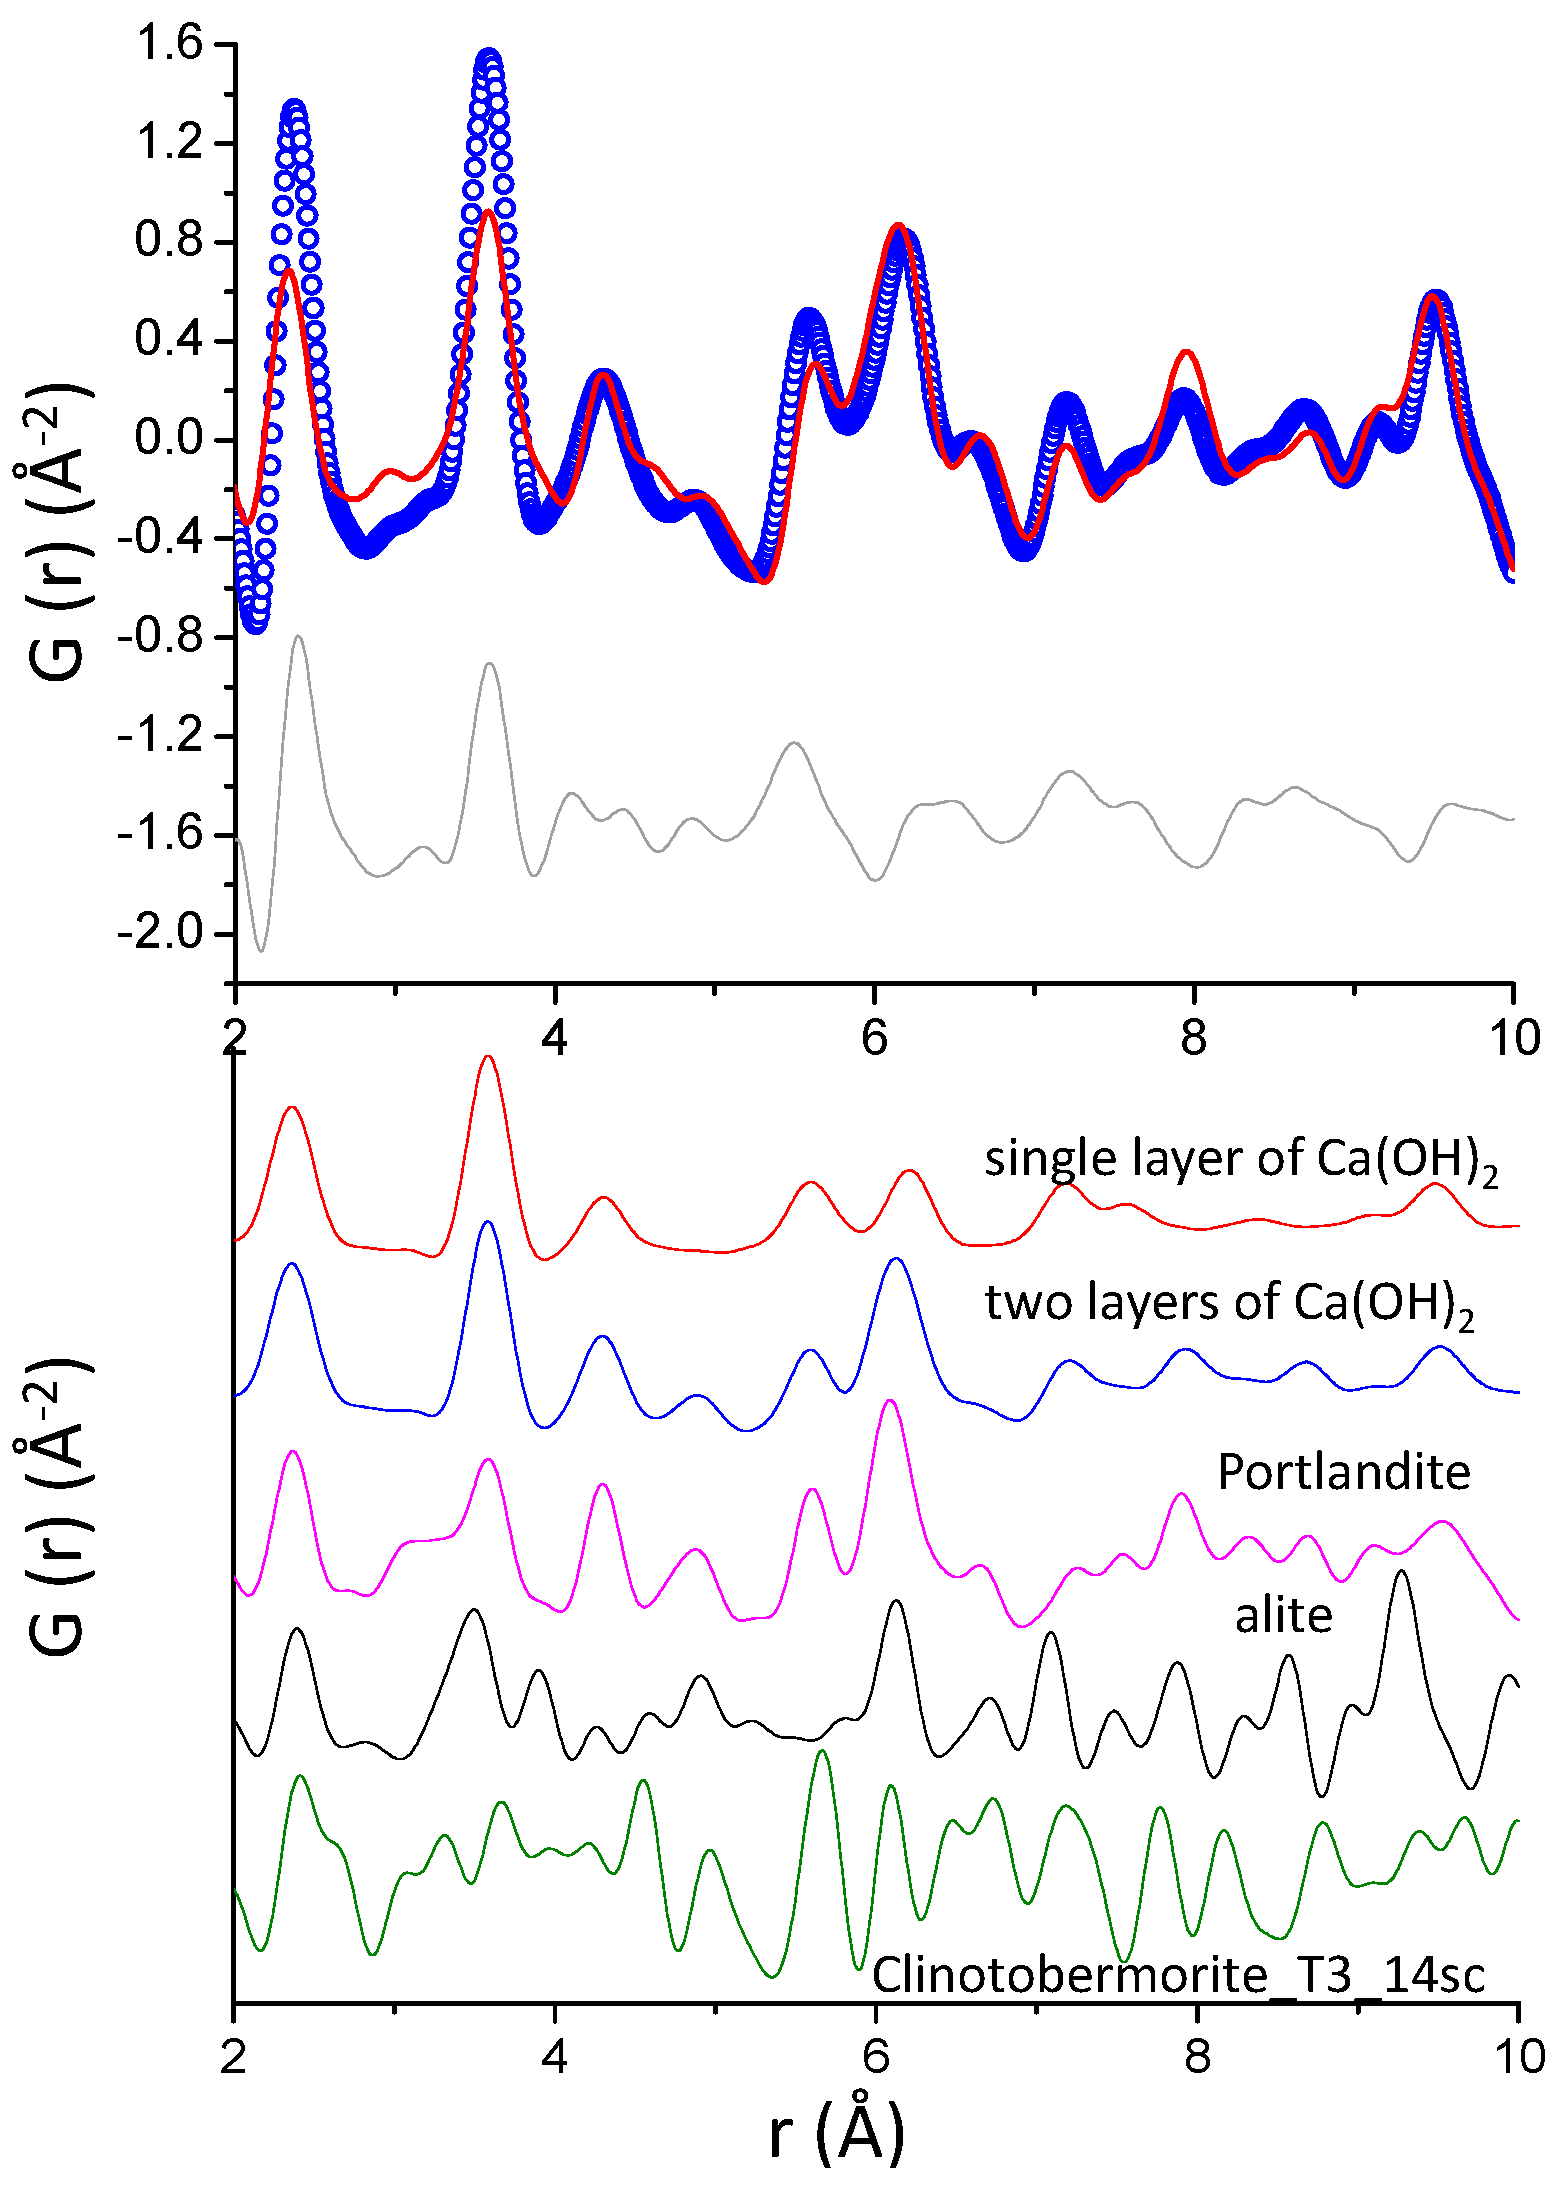
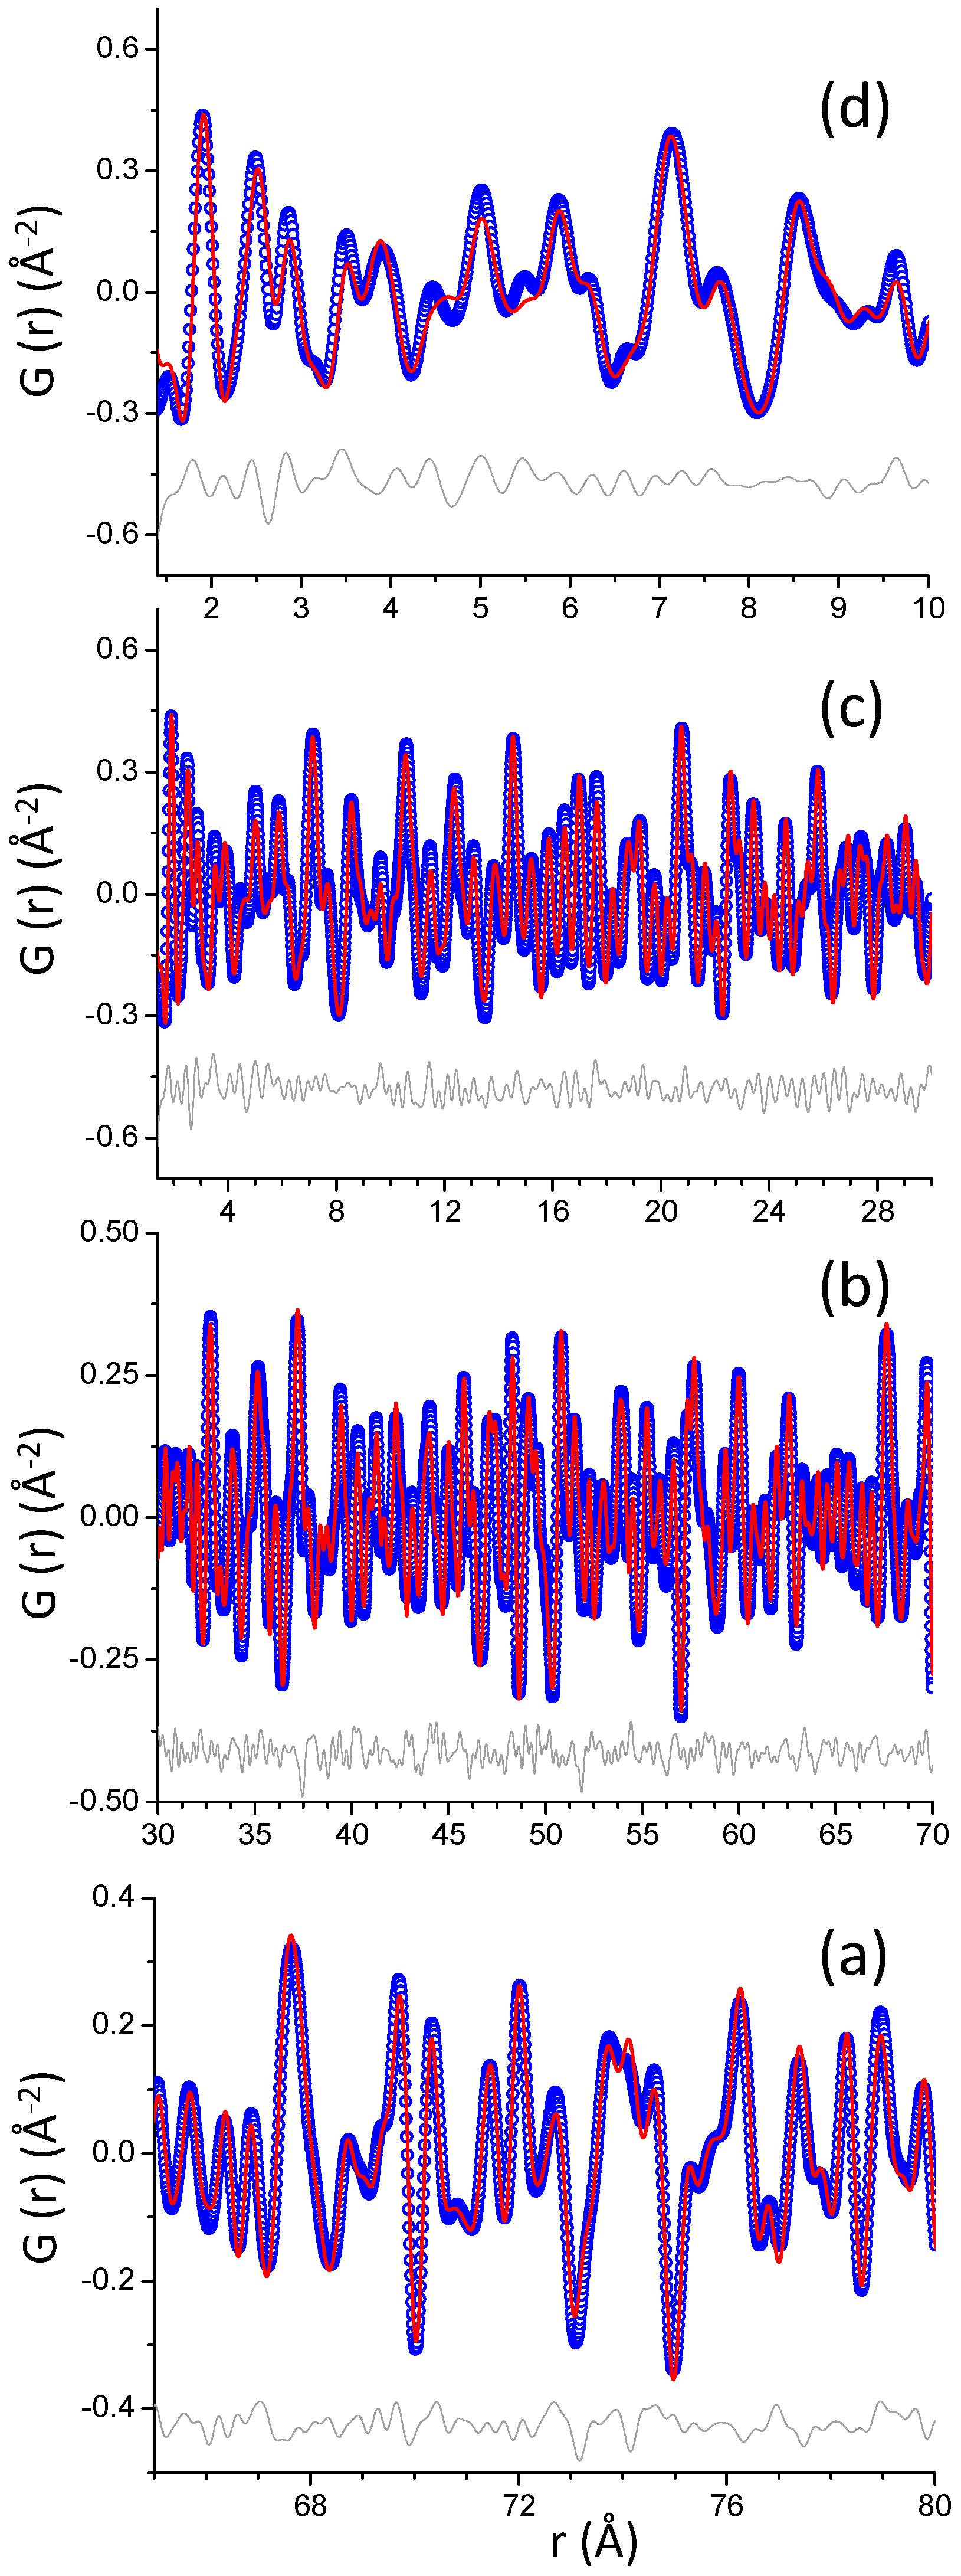
The hydration of three different set of samples, Ca3SiO5, CaAl2O4, and Ca4Al6O12SO4 have been studied here. These cementitious phases were investigated in order to simplify the problem, as the real cements containing these phases yield even more complex pastes. In any case, all of the cementitious hydrated systems contained at least a crystalline phase and a nanocrystalline/amorphous gel, which have both been characterized by several techniques, and chiefly by synchrotron total scattering using pair distribution functions.

2.1. Alite Pastes

Since the alite hydration kinetics depends upon the average particle size [33,34], the particle size distribution for Ca3SiO5 was measured (dv,50 = 13.8 µm). The particle size distribution plot is shown in Figure S1a. Four alite pastes were prepared at water-to-solid (w/s) mass ratios of 0.46, 0.55, 0.65, and 0.80, for 34 days. After the hydration was arrested, as described in the methods section, Rietveld quantitative phase analyses, using the internal standard methodology, were performed for these pastes. The Rietveld analyses were carried out using the crystal structures reported for alite [35] and portlandite [36]. Table S1 shows the quantitative phase analysis results for each paste. For these model samples, the ACn (Amorphous and Crystalline non-quantified content) values are mainly the C-S-H gel contents that include the nanocrystalline calcium silicate, plus any amorphous component (water in the pores and possibly calcium hydroxide). We recall that the free water is removed in the arresting process. The amount of unreacted alite ranges from 13 to 10 wt% for the samples w/s = 0.46 and 0.80, respectively. Consequently, the amount of crystalline portlandite was larger for the w/s = 0.80 sample, ~22 wt%, which decreased to ~18 wt% for the w/s = 0.46 sample. Crystalline calcite contents, from the partial carbonation of portlandite, were always lower than 1.5 wt%, and the amorphous content was close to 66 wt%. As an example, Figure 1 shows the laboratory X-ray powder diffraction (LXRPD) Rietveld plot for the w/s = 0.80 paste with the main peaks labelled.
The thermogravimetric data for the alite pastes are shown in Figure S2. The water loss from the nanocrystalline C-S-H gel takes place between room temperature and 250 °C. The water loss from crystalline portlandite, Ca(OH)2, is measured between 400 °C to 600 °C, with a strong peak centered close to 460 °C. The water loss observed between 250 °C and 400 °C could have a contribution from the dehydration of amorphous calcium hydroxide, see below. Finally, the small weight loss above 600 °C is due to calcium carbonate. Two small signals are observed at 660 and 860 °C. The weight loss observed close to 860 is due to the decarbonation of crystalline calcite. We speculate that the minor loss observed close to 660 °C comes from the decarbonation of amorphous calcite, and it could also be due to remnant organic solvent absorbed in the C-S-H gel [37]. Table S2 gives full details of the weight losses from the TGA study for the four alite pastes.
The raw PDF data for the four hydrated pastes are displayed in Figure 2 in the 1.5–10 Å selected range. No significant differences are observed between the samples in this low-r region of the PDF curves. Initially, the PDF pattern for the w/s = 0.80 sample, which had the highest alite reaction degree, was quantitatively studied using the PDFgui software. The main objective of this study was to quantify the C-S-H nanocrystalline gel content, and to determine which crystal structure fits better the PDF signal arising from this phase.
The full PDF data for alite pastes are very complex due to the presence of different phases of different natures: crystalline (e.g., portlandite and unreacted Ca3SiO5), nanocrystalline (e.g., C-S-H gel) and possibly amorphous phase(s). The following strategy was used for the PDF fit. Initially, a high r-region, i.e., 40–70 Å, was analyzed, where the contributions are mainly due to crystalline phases: portlandite, alite, and calcite. As there was a significant amount of unreacted alite, the PDF pattern of as-received Ca3SiO5 was also collected and fitted using PDFGui, see Figure S3. The unit cell parameters and atomic displacement parameters (ADP) were optimized. These values were used for the analysis of the four pastes, and only the scale factors for alite were refined. This strategy has been previously reported [31]. The contribution of crystalline portlandite was computed by optimizing the scale factor, the unit cell parameters, the anisotropic ADPs values for Ca and O, and the atomic positions for O (Ca is located at a special position). As the sample contained crystalline calcium carbonate as an impurity, the scale factor of this phase was also refined in this region. The final RW value was 28.8%. The fit is displayed in Figure 3. The unit cell values for portlandite converged to a = 3.594 Å and c = 4.916 Å, and the final ADPs values and atomic positions for portlandite are reported in Table S3.
After this refinement, all of the previous parameters were kept fixed, and the contribution from the nanocrystalline C-S-H gel was studied in the intermediate r-region, from 10 to 25 Å. As there is controversy about the ‘average’ crystal structure of the precipitated C-S-H nanocrystalline gel, different crystal structures have been tested. Table 1 gives the RW values for each PDF fit using selected structural descriptions for the nanocrystalline gel, and also includes the quantitative phase analysis results for the different phases. Firstly, it is quite important to distinguish which structure yields a better fit: tobermorite-14Å, tobermorite-11Å, or jennite. Secondly, several models for different defective tobermorites have been tested in this study.
A summary of the results for the PDF study of the w/s = 0.80 sample, in the 10–25 Å intermediate r-region, is given in Table 1. It is evident that the jennite structure led to a worse fit than the tobermorite structures. Although some crystal structures for tobermorite led to relatively similar RW values, see Table 1, the defective structure clinotobermorite T3_14sc [9] was selected due to the lowest RW value, and also because it matched properly the peak at 15.8 Å, see Figure 4. The clinotobermorite T3_14sc structure represents a hypothetical ‘trimer’ derived from a staggered-chain clinotobermorite, yielding a formula of Ca11Si9O28(OH)2·8.5H2O with a calculated theoretical density of 2.49 g/cm3 [9]. The unit cell values for the clinotobermorite T3_14sc structure converged to a = 11.258 Å, b = 7.307 Å, c = 42.538 Å and β = 94.3°, and the isotropic ADPs were 0.0065, 0.0833, and 0.0160 Å2 for Ca, Si, and O, respectively. Figure 4 shows the PDF fit in the region from 10 to 25 Å without the clinotobermorite T3_14sc contribution (a), and with its contribution (b). The selected clinotobermorite structural description improved the PDF fit as the RW value decreased from 36.3% to 28.5%. It is worth noting that the average length of the silicate chains in this defective clinotobermorite is three, and the Ca/Si atomic ratio is 1.22.
Finally, for this sample, all of the previous parameters were fixed to study the lowest r-region, 2–10 Å. In this case, the delta2 value (low-r correlated motion peak sharpening factor) was fixed to 2 Å2. The high RW value, 45.6%, indicated the presence of an additional scattering contribution in this region, see Figure 5. This unfitted contribution, highlighted in the difference curve, is consistent with the theoretical PDF signal of an isolated single layer of Ca(OH)2 arranged as in portlandite, as very recently suggested [13]. Figure 5 shows the PDF fit in the r-region, 2–10 Å, including the simulated PDF curves for the crystal structures that have been included in the fit: crystalline portlandite, alite, and clinotobermorite T3_14sc, as well as the simulated curves for an isolated layer and two consecutives layers of Ca(OH)2.
For the remaining three alite hydrated samples, the same procedure was followed. The final RW values in the 40–70 Å region were 22.8%, 27.6%, and 26.8%, for w/s = 0.65, 0.55, and 0.46 samples, respectively. In the r-region, 10–25 Å, only clinotobermorite T3_14sc and jennite structural descriptions were tested in order to show whether the fits by using clinotobermorite T3_14sc were better than those using jennite. Table S4 shows the RW values and the quantitative phase analysis results for the three pastes, using both, or either, jennite and clinotobermorite, as crystal structures to fit the nanocrystalline gel contribution. Invariably, clinotobermorite T3_14sc gave a better fit. The refined unit cell values of portlandite and clinotobermorite for the three pastes were very similar, and they are reported in Table S5. Finally, the PDF fits in the 2–10 Å r-region were very similar to that reported above for the paste at w/s = 0.80, and hence they are not shown here.

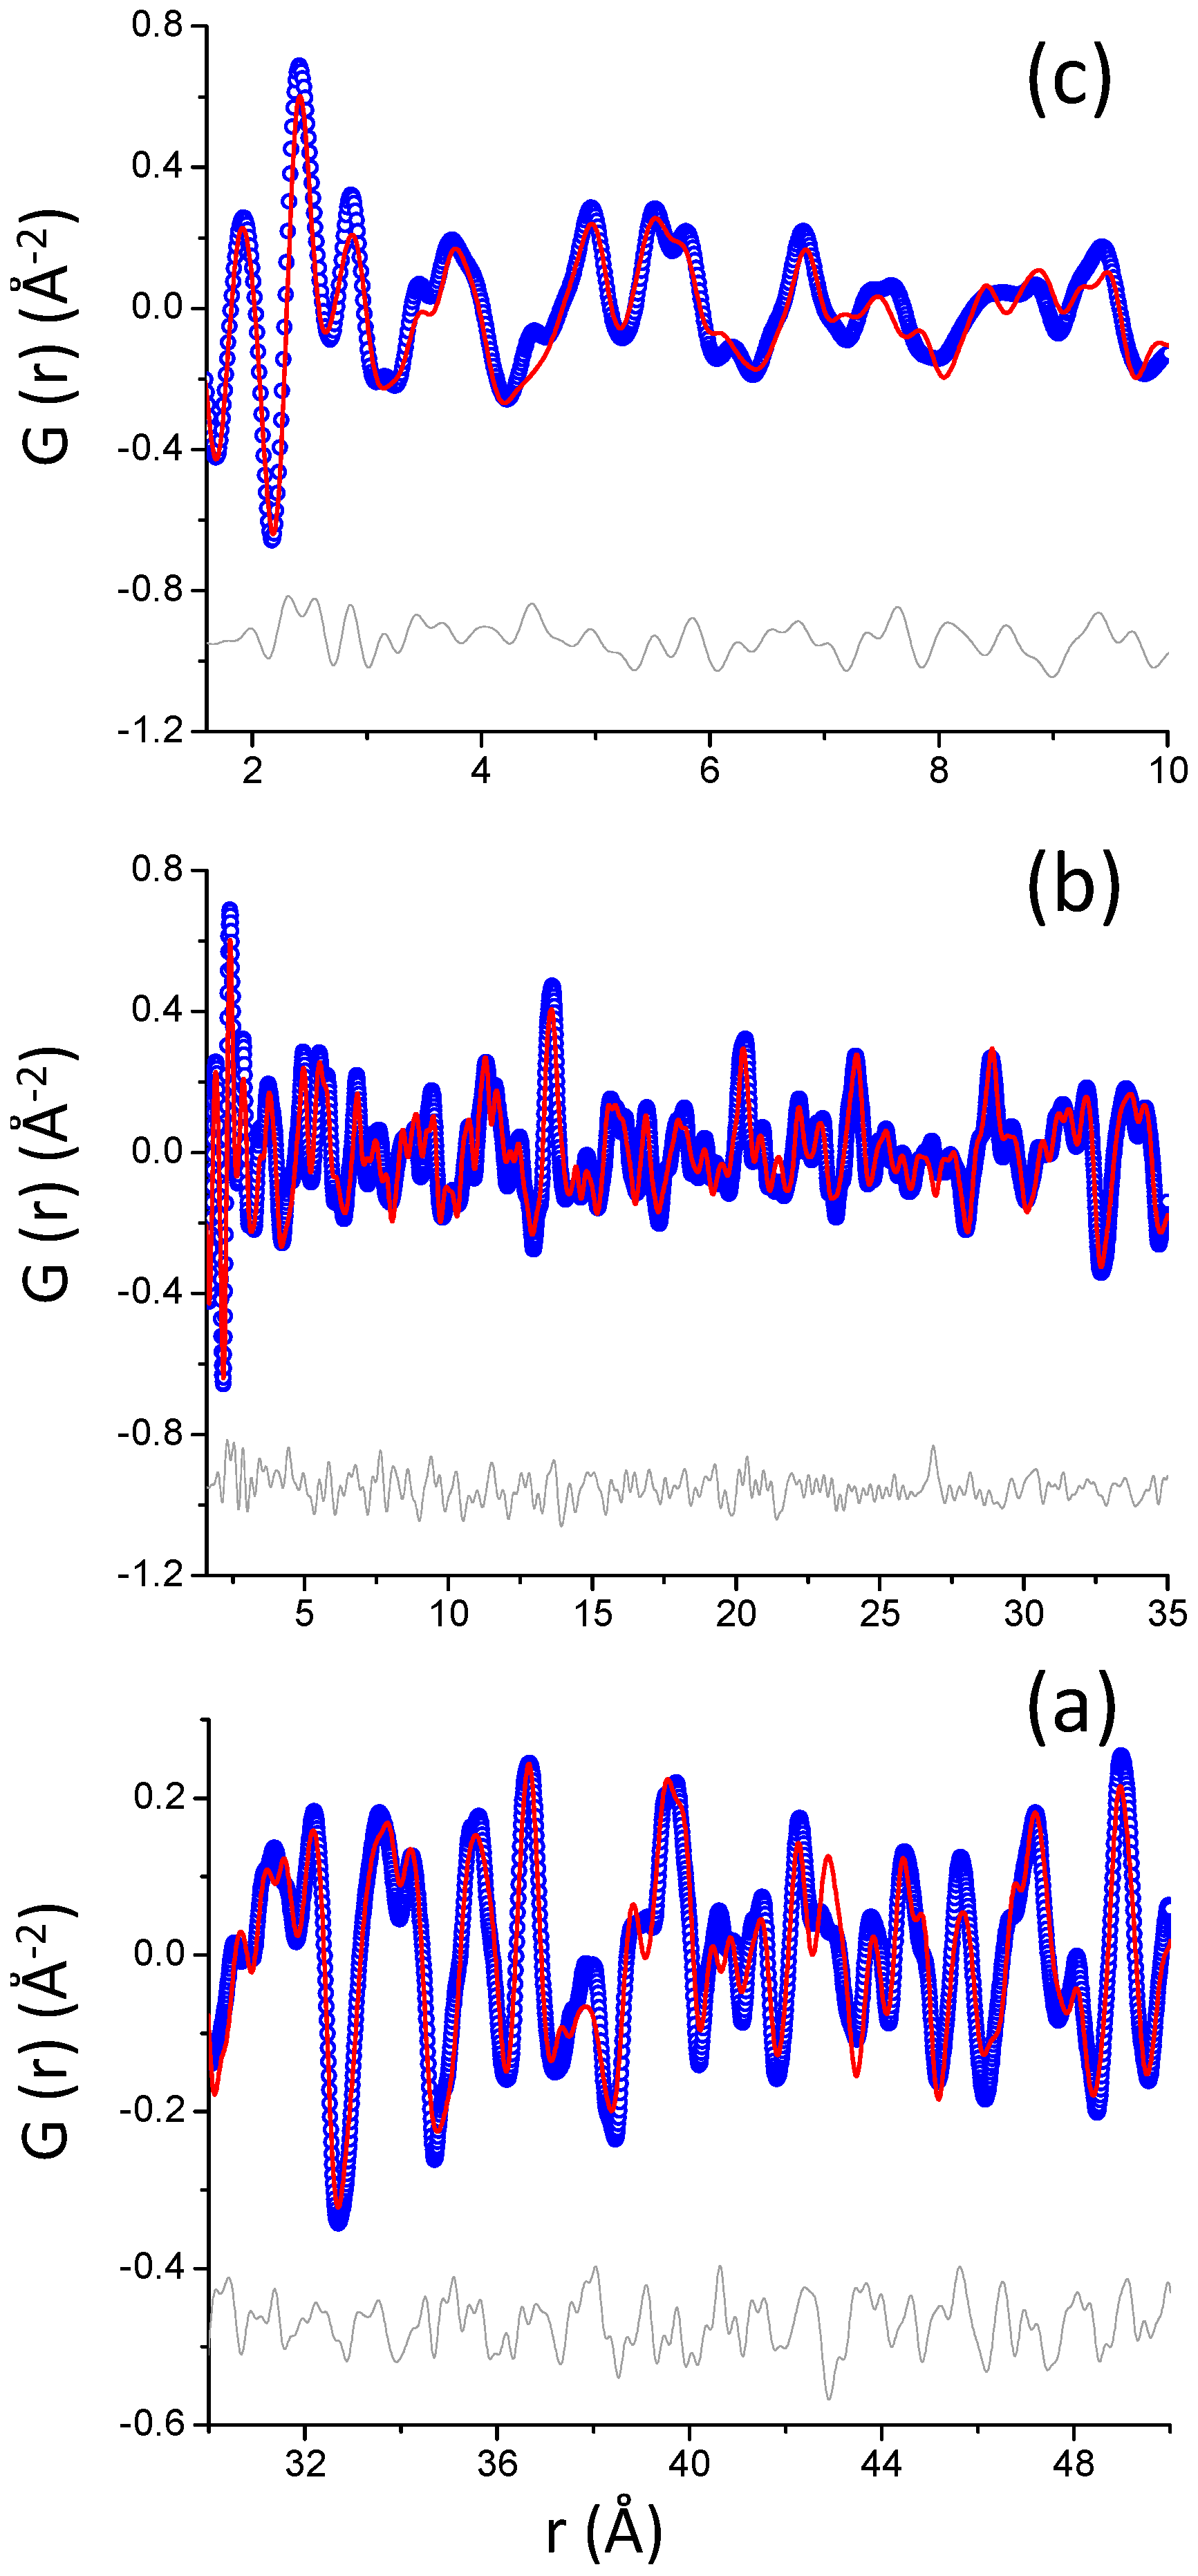
2.2. Calcium Aluminate Pastes

The particle size distribution was also measured for CaAl2O4, where the dv,50 value obtained was 3.3 µm, and the particle size distribution plot is shown in Figure S1b. The second type of cementitious system studied was calcium aluminate pastes, which were initially studied by the PDF methodology in a previous publication [32] with a fixed water–solid ratio of 1.0. Here, we expand the research by varying the water-to-solid ratio, which is known to affect the hydration.
In this work, CaAl2O4 was hydrated for 30 days with a w/s ratio of 0.55 and 1.20 at 35 °C. In order to study the influence of temperature, CaAl2O4 was also hydrated, w/s = 0.55, at 45 °C.
Rietveld analyses were also performed for these three samples. These pastes contain a crystalline phase, hydrogarnet, and a nanocrystalline phase, aluminum hydroxide gel, as previously reported for a related sample [32]. No anhydrous calcium aluminate was found in any paste. Table S6 shows the quantitative phase analysis results for each paste. Again, the ACn content chiefly includes the nanocrystalline aluminum hydroxide gel. No important differences were found between the samples.
Figure S4 shows the thermogravimetric plot for the three CaAl2O4 pastes. The overall measured weight losses (up to 600 °C) were 32.2, 32.7, and 30.9 wt% for the pastes with a w/s = 0.55 at 35 °C, 1.20 at 35 °C, and 0.55 at 45 °C, respectively. The temperatures for the two main water loss steps, nanocrystalline gel and hydrogarnet, are located around 260 and 300 °C, and they are partly overlapped. The expected water loss depends upon the sample composition (and water content of the aluminum hydroxide gel), as previously reported [32].
The PDF methodology was applied to find possible differences in the precipitated nanocrystalline aluminum hydroxide gels in the three pastes. The raw PDF patterns from 1–10 Å were displayed in Figure 2. For the PDF fits of these three samples, the methodology already reported (Cuesta et al., [32]) was followed. Firstly, the PDF data in a high r-region, 65–80 Å, were fitted with the crystal structure of the crystalline hydrogarnet. After optimizing the scale factors, unit cell, and ADPs, the RW values converged to 13.6%, 16.9%, and 16.2% for the pastes hydrated with a w/s of 0.55 at 35 °C, 1.20 at 35 °C, and 0.55 at 45 °C, respectively. The unit cell values and the final ADPs values (for Ca, Al, and O) are shown in Table S7. Then, all of the parameters for the crystalline phase were kept fixed, and the r-region, 1.5–70 Å, was used to fit the additional contribution of the nanocrystalline phase, aluminum hydroxide gel. The gibbsite crystal structure was used for fitting this nanocrystalline phase. The optimized parameters were the scale factors, unit cell parameters, ADPs, delta2, atomic parameters, and sp. diameter, the average diameter of the nanoparticles. Table S7 also includes the unit cell parameters and ADPs for the gibbsite crystal structure that was used to fit the contribution of aluminum hydroxide gel. A hemicarbonate hydrated phase was also added in the final PDF fit, as it was present as a side phase in these pastes. A summary of the results for the three PDF fits are reported in Table 2. As an example, Figure 6 displays the PDF fit for the w/s = 0.55 paste hydrated at 35 °C split in four r-ranges for better visualization.
It is worth noting that the measured sp. diameter values for the calcium aluminate pastes evolved as expected. The average particle size for the paste hydrated with w/s = 0.55 at 35 °C was 6.2 nm, which decreases to 5.0 nm for the paste hydrated at the same temperature with more water, w/s = 1.2. Increasing the hydrating temperature to 45 °C, with the same w/s ratio = 0.55, resulted in a larger average particle size, 6.6 nm, as the temperature favors crystallization.

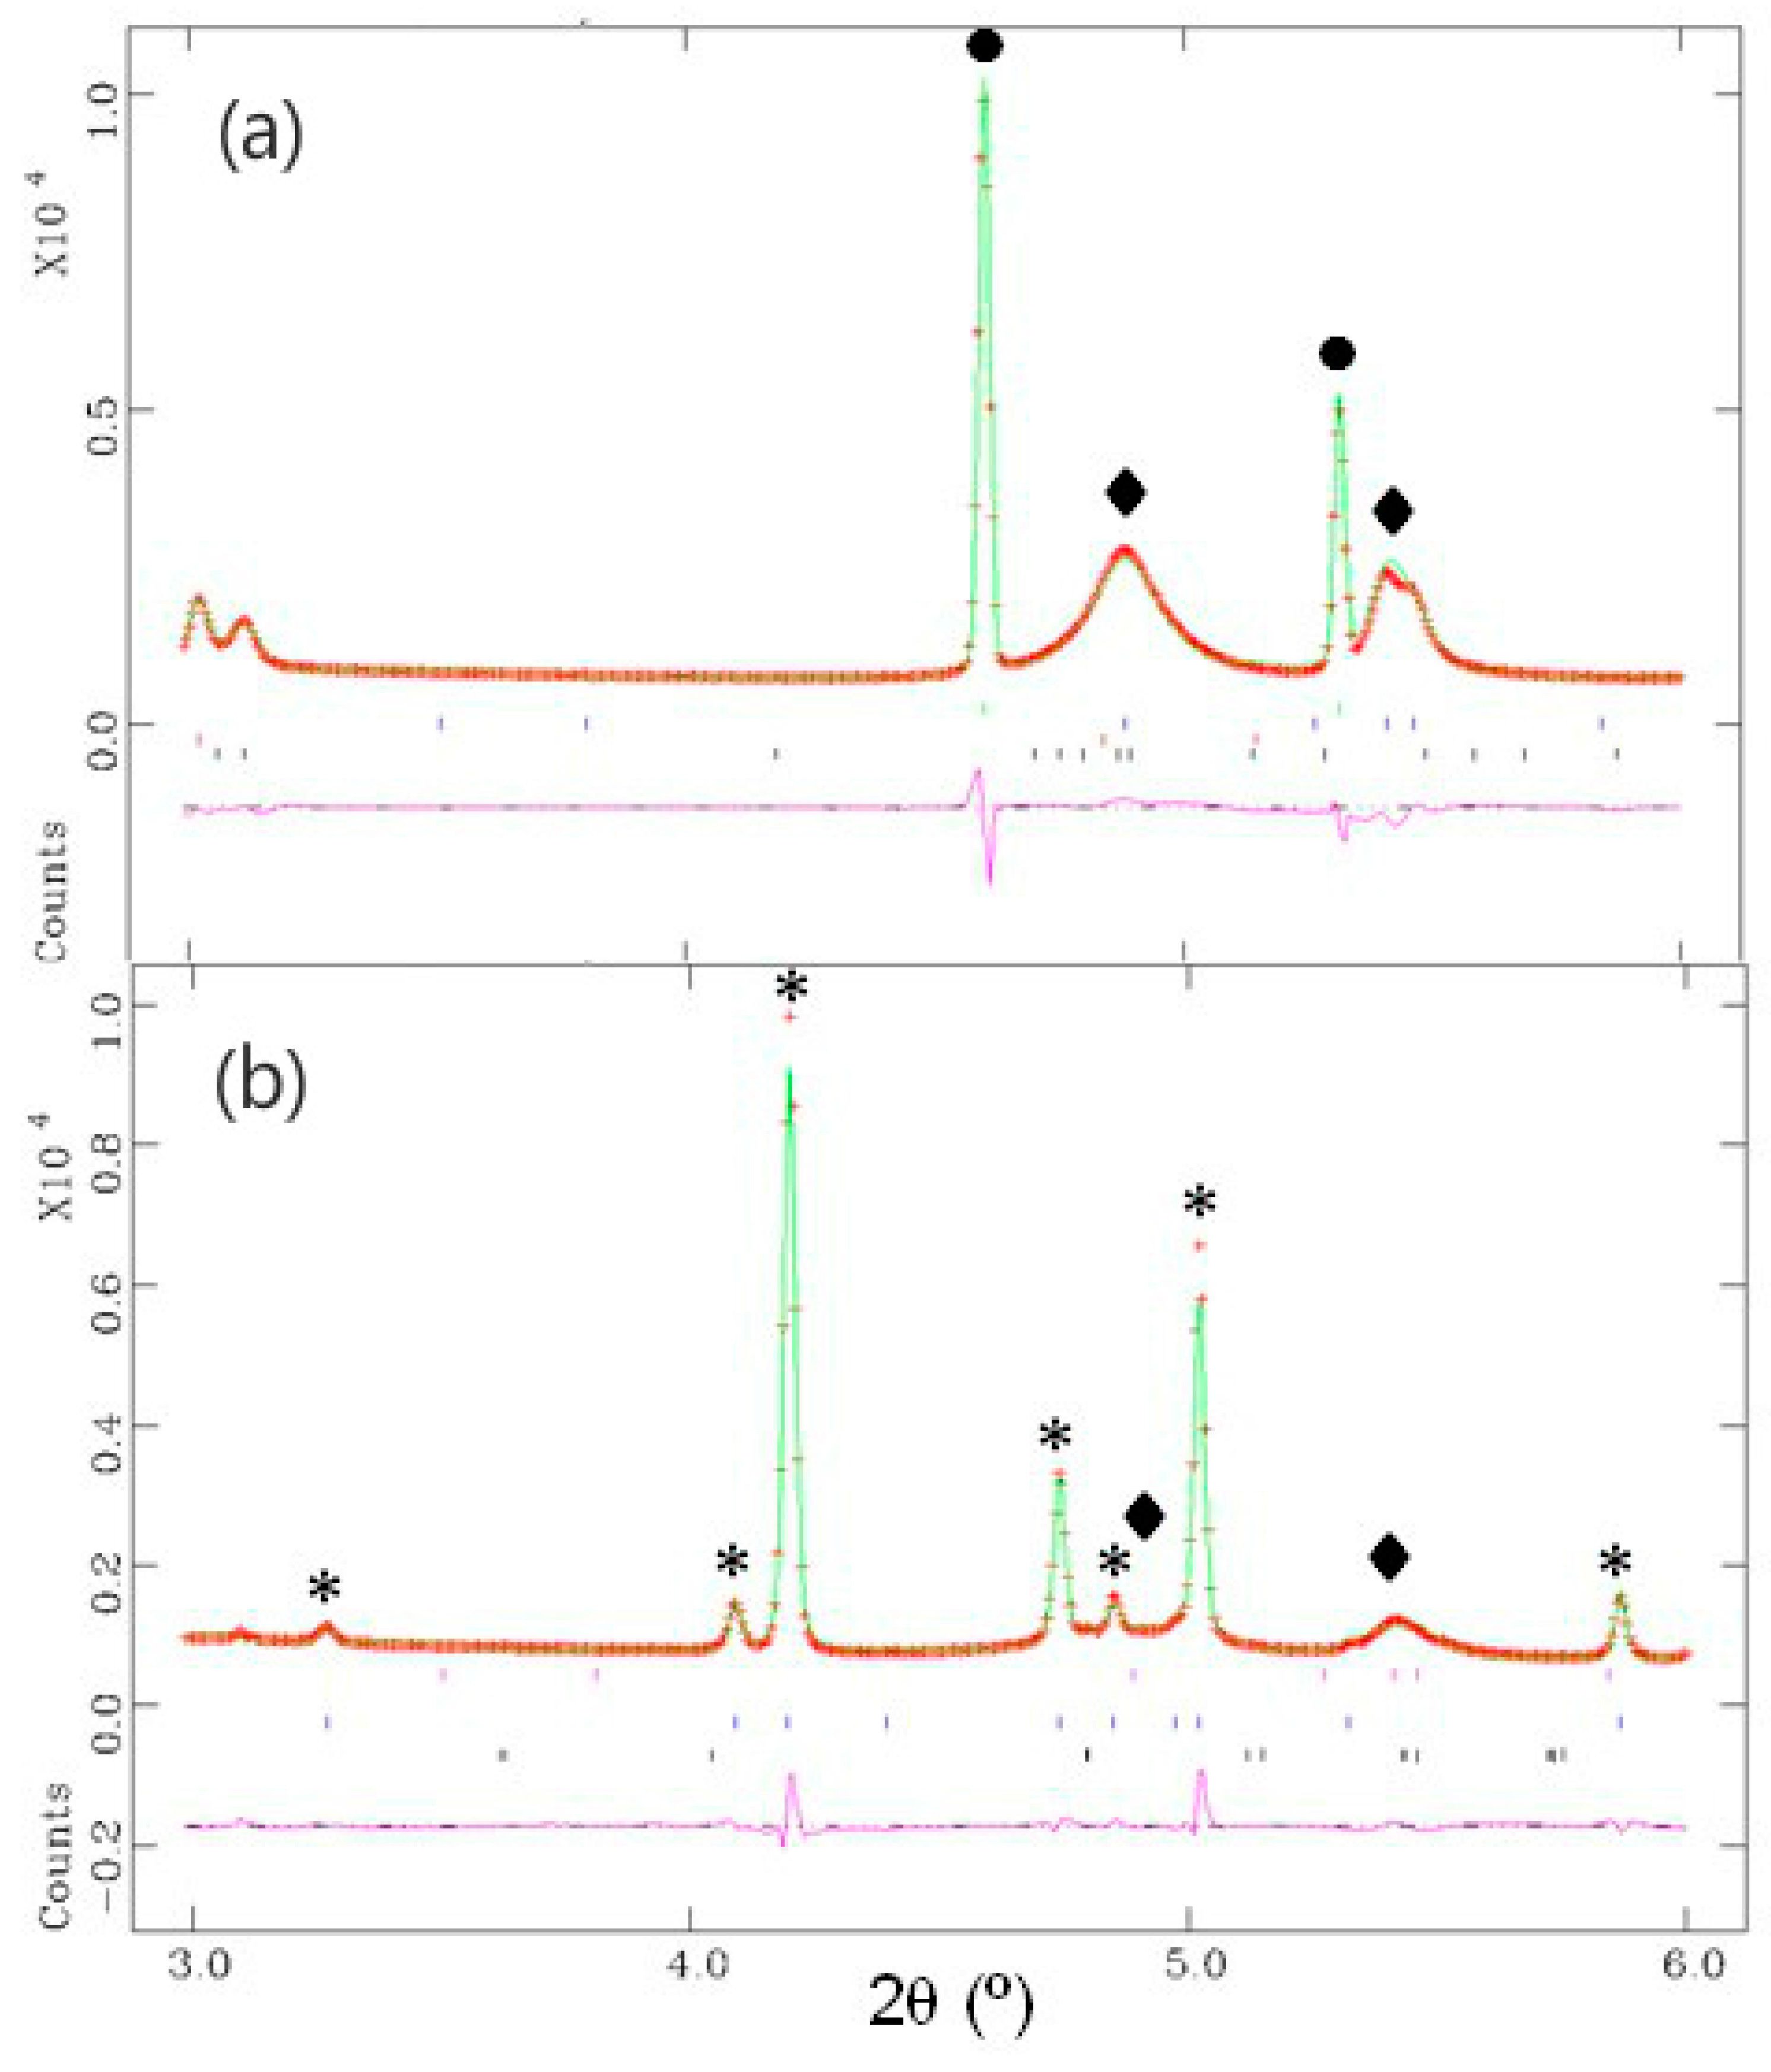
2.3. Ye’elimite with Gypsum Paste

The particle size distribution analysis for Ca4Al6O12SO4 gave a dv,50 value of 9.0 µm, and the particle size distribution plot is shown in Figure S1c. The ye’elimite–gypsum sample was hydrated at a w/s ratio of 1.20 for 21 days at room temperature. The second sample, ye’elimite–bassanite, was also hydrated at w/s = 1.20 for 14 days at room temperature. Although at late hydration ages, the ye’elimite with gypsum or bassanite paste should lead to the same hydrated phases, ettringite and aluminum hydroxide gel; the possibility of the precipitation of gels with different natures or nanoparticle sizes has to be unraveled. Firstly, the samples were studied by LXRPD and the Rietveld method, coupled with the internal standard. As it has been previously reported [20,38], this type of paste contains a crystalline phase, ettringite, and also an amorphous/nanocrystalline gel of aluminum hydroxide. Rietveld quantitative phase analysis of these samples gave the following phase assemblages: for the ye’elimite–gypsum hydrated sample: 1.5 wt% of unreacted ye’elimite, 59.0 wt% of ettringite, and 39.5 wt% of ACn; for the ye’elimite–bassanite hydrated sample: 63.9 wt% of ettringite, and 36.1 wt% of ACn. The ACn values chiefly include the aluminum hydroxide gel content.
The thermogravimetric data for the ye’elimite pastes are shown in Figure S5. The total weight losses up to 600 °C were 43.5% and 46.5% for the ye’elimite–gypsum and ye’elimite–bassanite pastes, respectively. These values are in agreement with previously reported data for a similar sample [38].
The raw PDF data in the low r-region for these pastes were also displayed in Figure 2. These pastes contained crystalline ettringite and an aluminum hydroxide gel with crystal structure that can be described as nanocrystalline gibbsite. This is a similar situation to the hydration of CaAl2O4, where crystalline hydrogarnet is replaced by crystalline ettringite; see above. Therefore, a similar strategy has been used here. Initially, the PDF data in the high r-region—in this case, 30–50 Å—were fitted with the crystal structure of the crystalline phase, ettringite; see Figure 7a for the ye’elimite–gypsum paste. The fit for the ye’elimite–bassanite paste was quite similar, see Figure S6a. For the ye’elimite–gypsum sample, the RW converged to 27.2% after optimizing the following parameters: the scale factors, unit cell, and ADPs. The unit cell value for ettringite converged to a = 11.238 Å and c = 21.468 Å, and the final ADPs values obtained were 0.0061, 0.0087, 0.0103, and 0.0260 Å2 for Al, Ca, S, and O, respectively. The small amount of unreacted ye’elimite (1.5 wt% determined by Rietveld analysis) was not included, as its presence did not improve the PDF fit. Then, all the parameters for the crystalline ettringite phase were kept fixed, and the low r-region, 1.5–35 Å, was used to fit the nanocrystalline aluminum hydroxide gel contribution. The gibbsite crystal structure was also used for this nanocrystalline phase. After optimizing the following parameters: the scale factor, unit cell parameters, ADPs, delta2, atomic parameters and sp. diameter, RW converged to 27.5%. The final fit is displayed in Figure 7b, including an enlarged view of the smallest r-range (Figure 7c). The unit cell value for nanocrystalline gibbsite converged to a = 8.815 Å, b = 4.982 Å, c = 9.507 Å, β = 94.9°, and the final ADPs values obtained were 0.0007 and 0.0176 Å2 for Al and O, respectively. The phase contents and sp. diameter values are given in Table 3. The PDF fit for the ye’elimite–bassanite paste was very similar, see Figure S6a–c. The final phase contents and sp. diameter values are also given in Table 3. We note that the presence of aluminum oxo-hydroxide boehmite was discarded, because there was no additional signal in the PDF difference curve at the characteristic boehmite interatomic distances, 3.40 and 4.17 Å [32].
Therefore, it is shown here that the aluminum hydroxide gel, see reaction (3), has a nanocrystalline gibbsite local structure, which has been previously named ‘amorphous gibbsite’. However, its local atomic environment has been characterized here for the first time, to the best of our knowledge.

3. General Discussion

Four alite pastes that were prepared using different w/s mass ratios have been studied by synchrotron PDF and additional characterization techniques. Preliminary Rietveld and thermogravimetric characterization indicated that the samples contained minor amounts of calcium carbonate from partial carbonation, and the amount of unreacted alite ranged 10–13 wt%. Here, we have used a multi r-range analysis approach to characterize the different components of the pastes: (i) the 40–70 Å r-range allows determining the crystalline phase contents; (ii) the 10–25 Å r-range is used to characterize the nanocrystalline atomic ordering in the calcium silicate hydrate constituent of the C-S-H gel; and (iii) the 2–10 Å r-range provides information about additional amorphous components.
The PDF analysis of the total scattering data in the 40–70 Å r-range confirmed the crystalline phase contents already determined by Rietveld methodology. Chiefly, the analysis of the data in the 10–25 Å r-range indicates that clinotobermorite fits the total scattering data of the C-S-H gel better than jennite or tobermorite-14, see Table 1. It is important to highlight that the stoichiometry corresponding to this defective tobermorite was Ca11Si9O28(OH)2·8.5H2O, with a calculated theoretical density of 2.40 g/cm3 and an average silicate chain length of 3.0 [9]. This analysis was extended to the remaining three alite pastes, and clinotobermorite invariably gave better fits. However, it is well established that the overall Ca/Si ratio in the C-S-H gel ranges from 1.7–1.9 [2,6,7]; meanwhile, the Ca/Si ratio of this clinotobermorite is 1.22. The analysis of the PDF data in the 2–10 Å r-range help to address this issue, as another component is needed in order to justify the measured scattering data, see Figure 5. The theoretical scattering data from a single layer with the portlandite structure, see Figure 5, justify the PDF data, as it has very recently been suggested in an independent study [13]. We hereafter name this component amorphous calcium hydroxide to distinguish its scattering contribution from that of the crystalline calcium hydroxide, portlandite, already observed in the 40–70 Å r-range, as well as in Rietveld analysis. This allows us to reformulate reaction (1) as reaction (5), where the different components are explicitly named. The components of the gel are nanocrystalline defective tobermorite, amorphous (single layer portlandite) calcium hydroxide, and water within the gel pores. This pore water [39] should not be confused with capillary (free water), which is removed when arresting the hydration reaction(s).
Ca3SiO5 + 5.2H2O → crystalline: 1.2Ca(OH)2 + gel: 1/9Ca11Si9O28(OH)2·8.5H2O//0.58Ca(OH)2//2.36H2O
Furthermore, by using synchrotron PDF data, it has also been demonstrated that the precipitated aluminum hydroxide gel in monocalcium aluminate pastes and ye’elimite with calcium sulfate pastes have the same nature: nanocrystalline gibbsite. The sp. diameter values for gibbsite, which measures the average particle sizes, are much larger for the calcium aluminate pastes (5–6 nm) than for the sulfoaluminate pastes (close to 3 nm). This fact can be qualitative observed by inspecting the selected region of the synchrotron X-ray powder diffraction (SXRPD) pattern for both types of samples, see Figure 8. The gibbsite peaks for the calcium aluminate paste hydrated with w/s = 0.55 for 30 days at 35 °C are broad, but easy to identify. Conversely, the gibbsite peaks in the ye’elimite–gypsum paste are hardly visible, and PDF analysis methodology gave a relatively good fit; see Table 3 and Figure 7.
Finally, the analysis of the thermogravimetric data for the monocalcium aluminate pastes indicated the water content of the aluminum hydroxide gel must be quite small, close to Al(OH)3(H2O)0.1. However, the same calculations for the ye’elimite pastes gave a larger water content, close to Al(OH)3(H2O)0.7. We rationalize these results as the very small particle sizes of the gel in the ye’elimite pastes, which are smaller than 3 nm, can retain the water in the interparticle space/pores.

4. Materials and Methods

4.1. Sample Preparation

Three different sets of samples have been selected for this study:
(a)
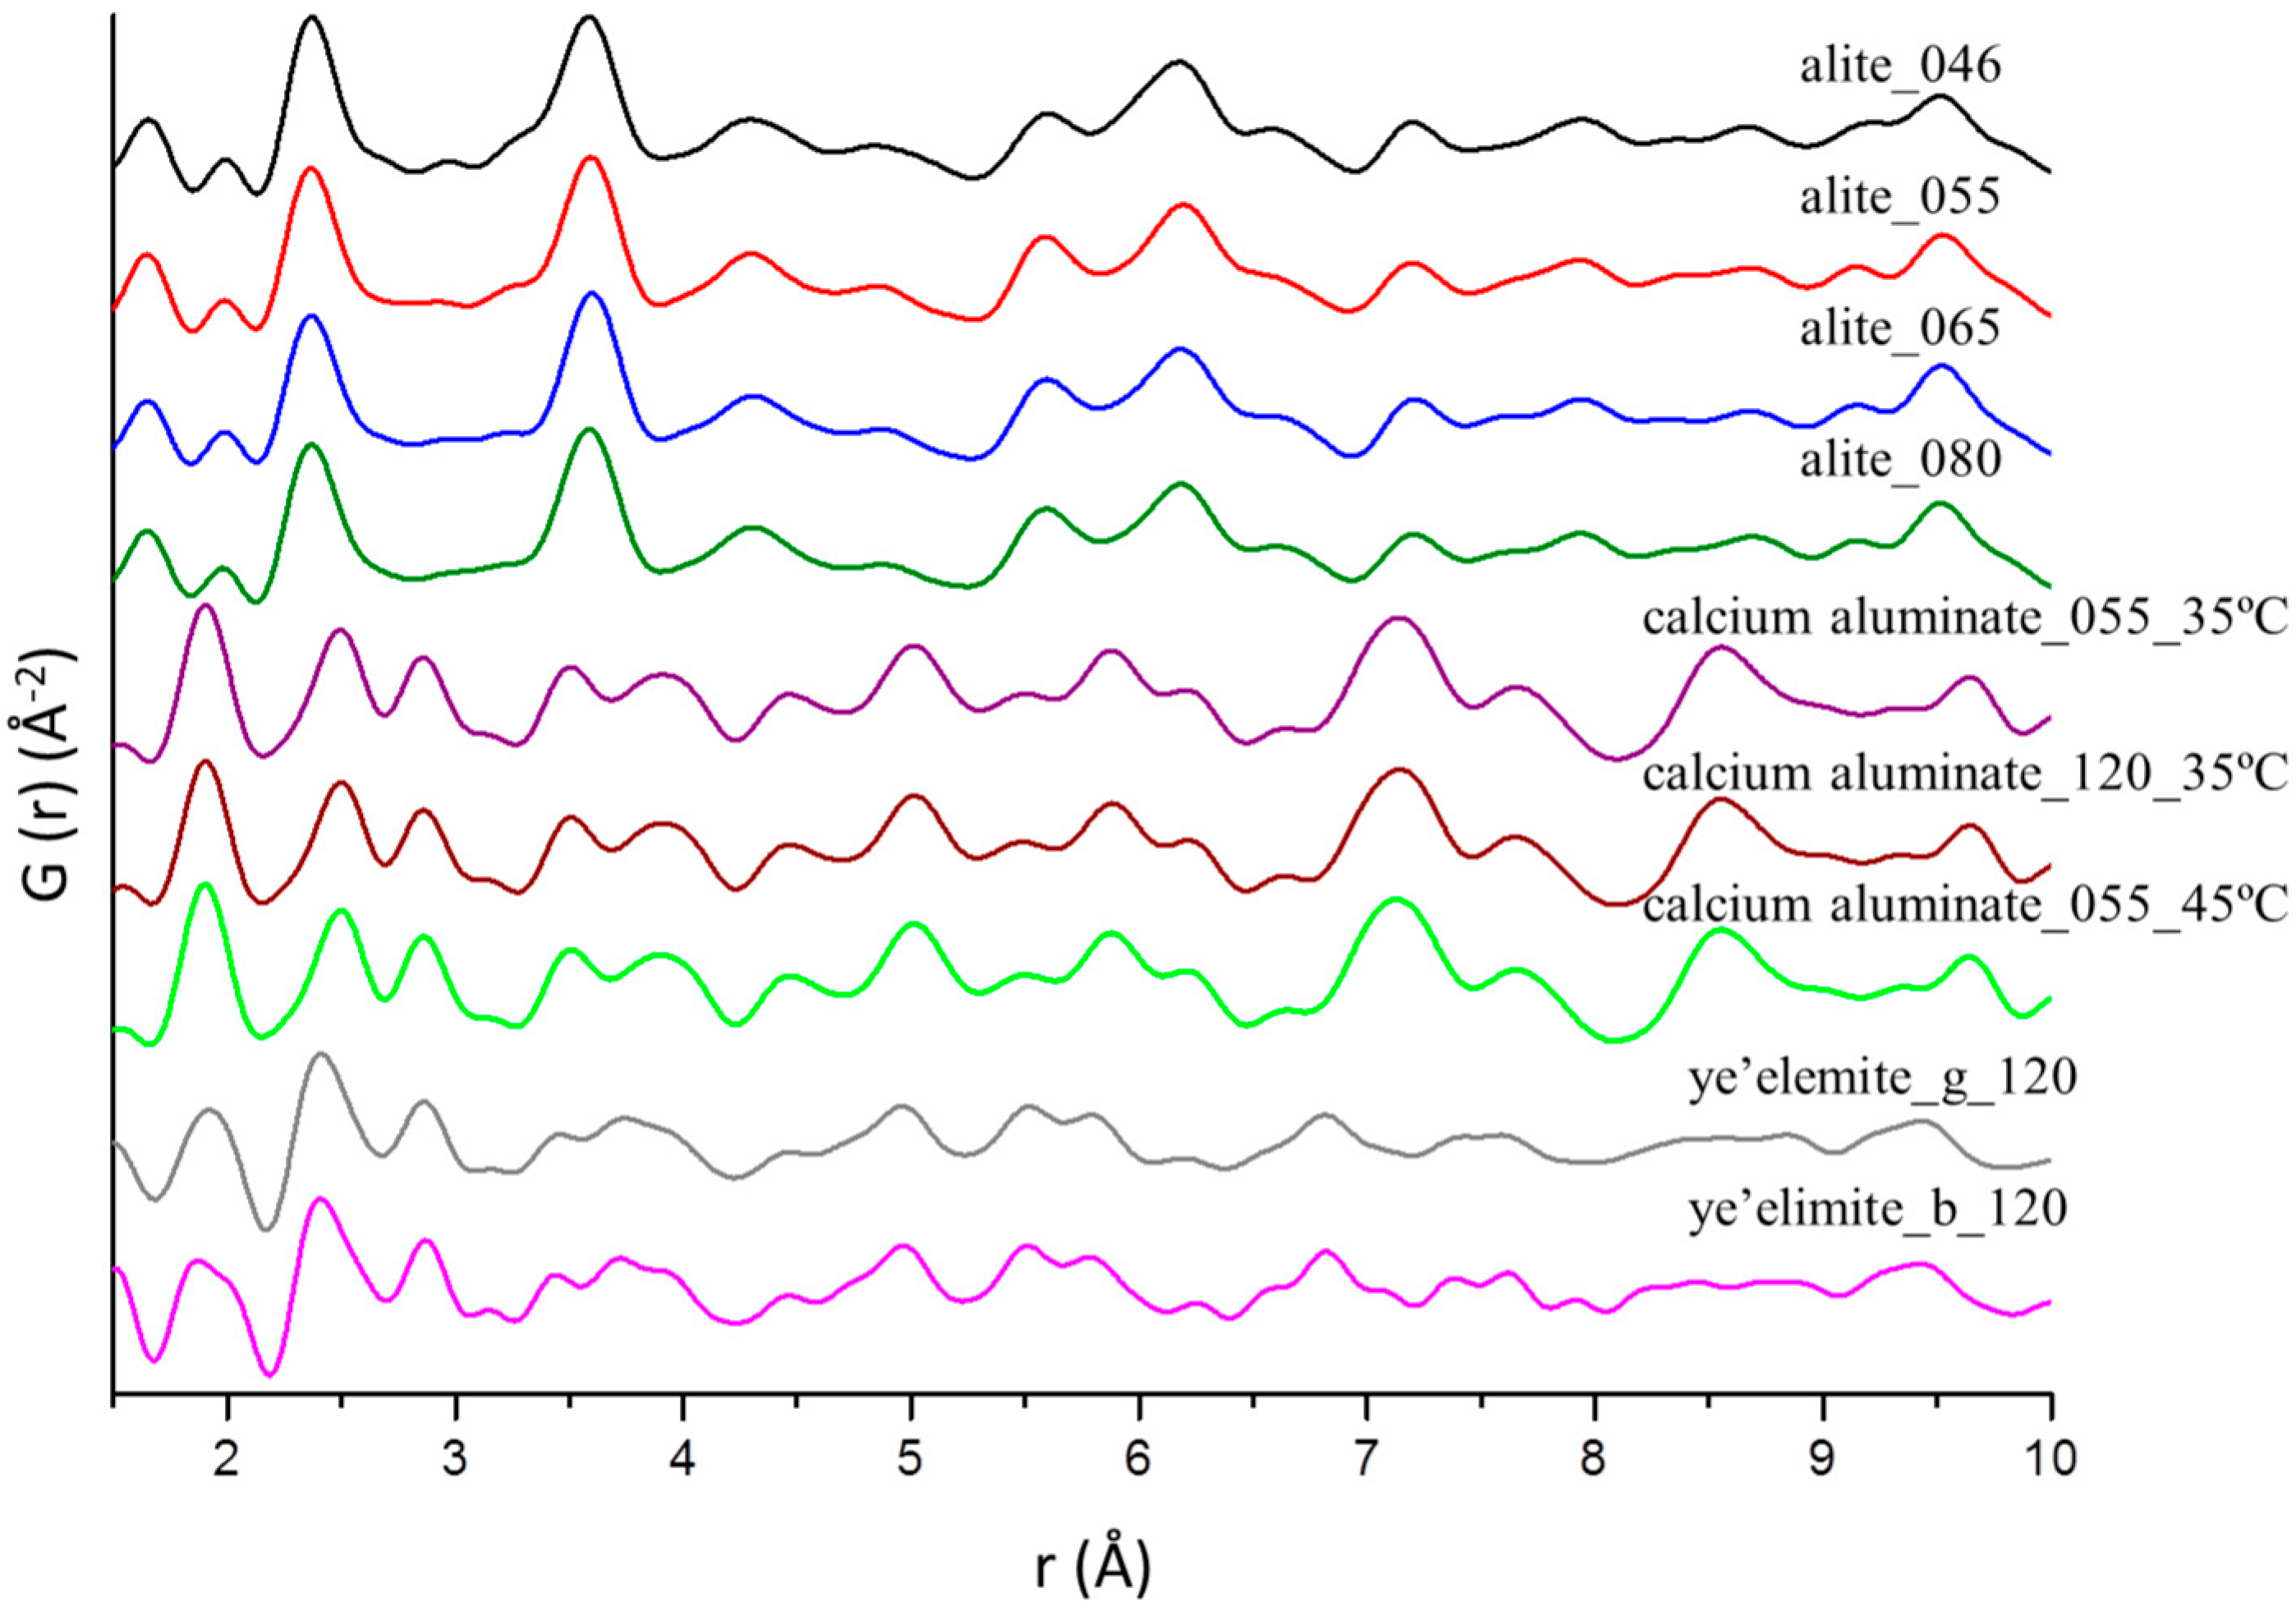
Tricalcium silicate, alite, has been purchased from Mineral Research Processing (M.R.PRO). Alite was hydrated at different w/s mass ratios, 0.46, 0.55, 0.65, and 0.80, for 34 days at room temperature.
(b)
Calcium aluminate, CaAl2O4, was prepared as previously reported [32]. This sample was hydrated at a w/s ratio of 0.55 and 1.20, at 35 °C for 30 days. Moreover, to study the influence of the temperature, the sample with a w/s ratio of 0.55 was also hydrated at 45 °C.
(c)
Ye’elimite was synthetized as previously reported [40]. Ye’elimite was mixed with the stoichiometric amount of gypsum according to reaction (3), and the mixture was hydrated at a w/s ratio of 1.2 for 21 days at room temperature. A second sample was prepared by mixing ye’elimite with bassanite, instead of gypsum, also at a w/s ratio of 1.2 for 14 days. In this case, the bassanite dosage was an excess of 18% with respect to the theoretical amount needed to yield ettringite.
All of the pastes were poured into hermetically closed Teflon® cylinder shaped molds for one day. Then, samples were taken out and stored within demineralized (and boiled, in the case of alite) water. Pieces were taken out at the selected age. At this stage, the pastes were milled to fine powder in an agate mortar. To remove the excess of water, samples were filtered in a Whatman system (90 mm diameter Whatman filter with a pore size of 2.5 μm on a Teflon support), and washed twice with isopropanol, and finally with ether [41].

4.2. Particle Size Distribution (PSD)

The average particle size and particle size distribution of the samples were measured using a laser analyzer, Mastersizer S, Malvern, UK.

4.3. Thermal Analysis

Differential thermal analysis (DTA) and thermogravimetric (TGA) measurements were performed in a SDT-Q600 analyzer from TA instruments (New Castle, DE). The temperature varied from RT to 1000 °C at a heating rate of 10 °C/min. Measurements were carried out in open platinum crucibles under nitrogen flow. The weighed loss from RT to 600 °C was considered to be water, and that from 600 to 1000 °C was considered as CO2.

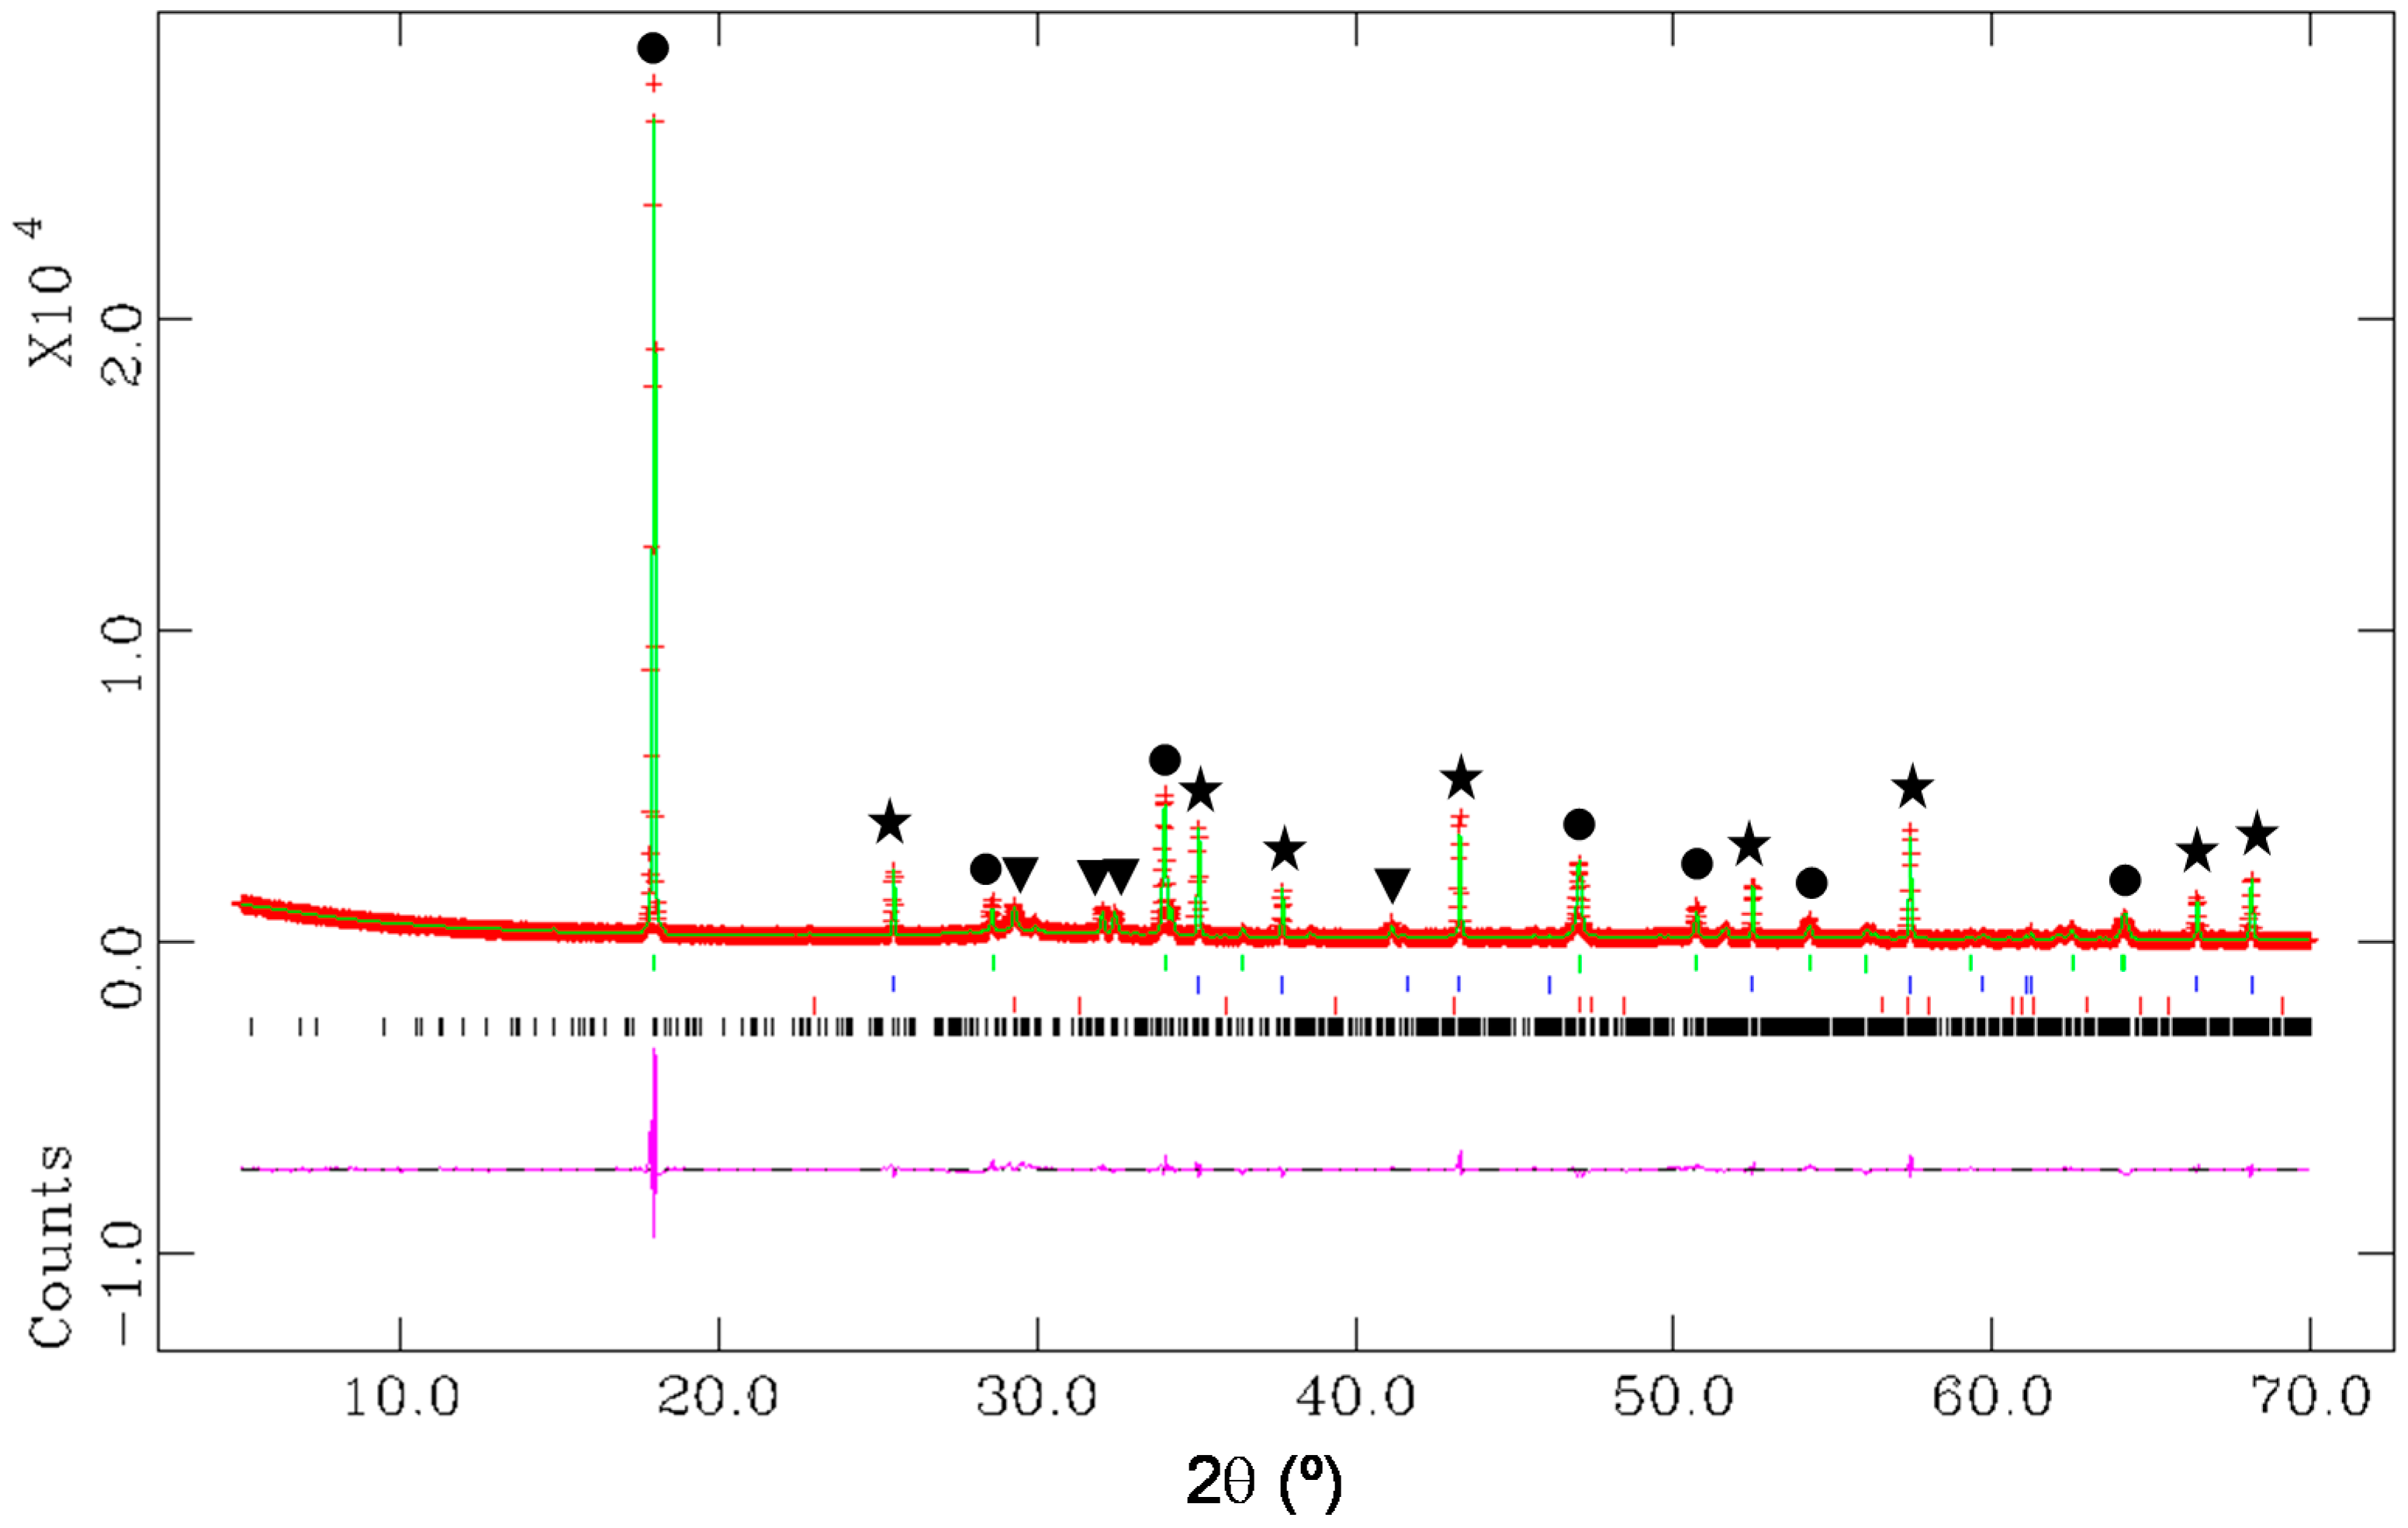
4.4. Synchrotron X-ray Powder Diffraction (SXRPD)

SXRPD data were collected in Debye–Scherrer (transmission) mode using the X-ray powder diffraction endstation of BL04-MSPD beamline at ALBA synchrotron (Barcelona, Spain) [42]. The wavelength, 0.41225(1) Å (30 keV), was selected with a double-crystal Si (111) monochromator and determined from a Si640d NIST standard (a = 5.43123 Å) measurement. The diffractometer was equipped with a MYTHEN detector especially suited for acquiring time-resolved and extremely good signal-to-noise ratio data sets. The shortest usable wavelength is dictated by the efficiency of the detector, as a higher energy X-ray that would allow a larger Q-range to be probed would yield a poorer signal because a fraction of the scattered photons would not be measured by this Si-based detector. The glass capillaries, which were 0.7 mm in diameter, were rotated during data collection to improve diffracting particle statistics. The data acquisition time was 37 min per each individual pattern. Five patterns were collected for each sample and added in order to improve the signal-to-noise ratio in the large recorded angular range, 1–120° (2θ). Therefore, every final total scattering pattern took 3.09 h. No changes between individual patterns were observed.

4.5. Laboratory X-ray Powder Diffraction (LXRPD) with Internal Standard

LXRPD data were recorded on an X’Pert MDP PRO (PANalytical) diffractometer (SCAI, Universidad de Malaga) equipped with a Ge (111) primary monochromator, using strictly monochromatic CuKα1 radiation (λ = 1.54059 Å) and an X’Celerator detector. An overall measurement time of ~2 h per pattern was required to have good statistics over the angular range 5.0–70.0° (2θ), with a 0.017° step size. Samples were mixed with 20 wt% of Al2O3 (AlfaAesar 42571) as internal standard. Al2O3 was previously heated up to 1500 °C for 20 h and sieved (<125 µm).

4.6. Rietveld Data Analysis

Rietveld analyses were performed using the GSAS suite of programs and the EXPGUI graphic interface [43]. Final global optimized parameters were: background coefficients, zero-shift error, cell parameters, and peak shape parameters using a pseudo-Voigt function. The non-crystalline content of the samples was determined by internal standard methodology [44] from LXRPD data.

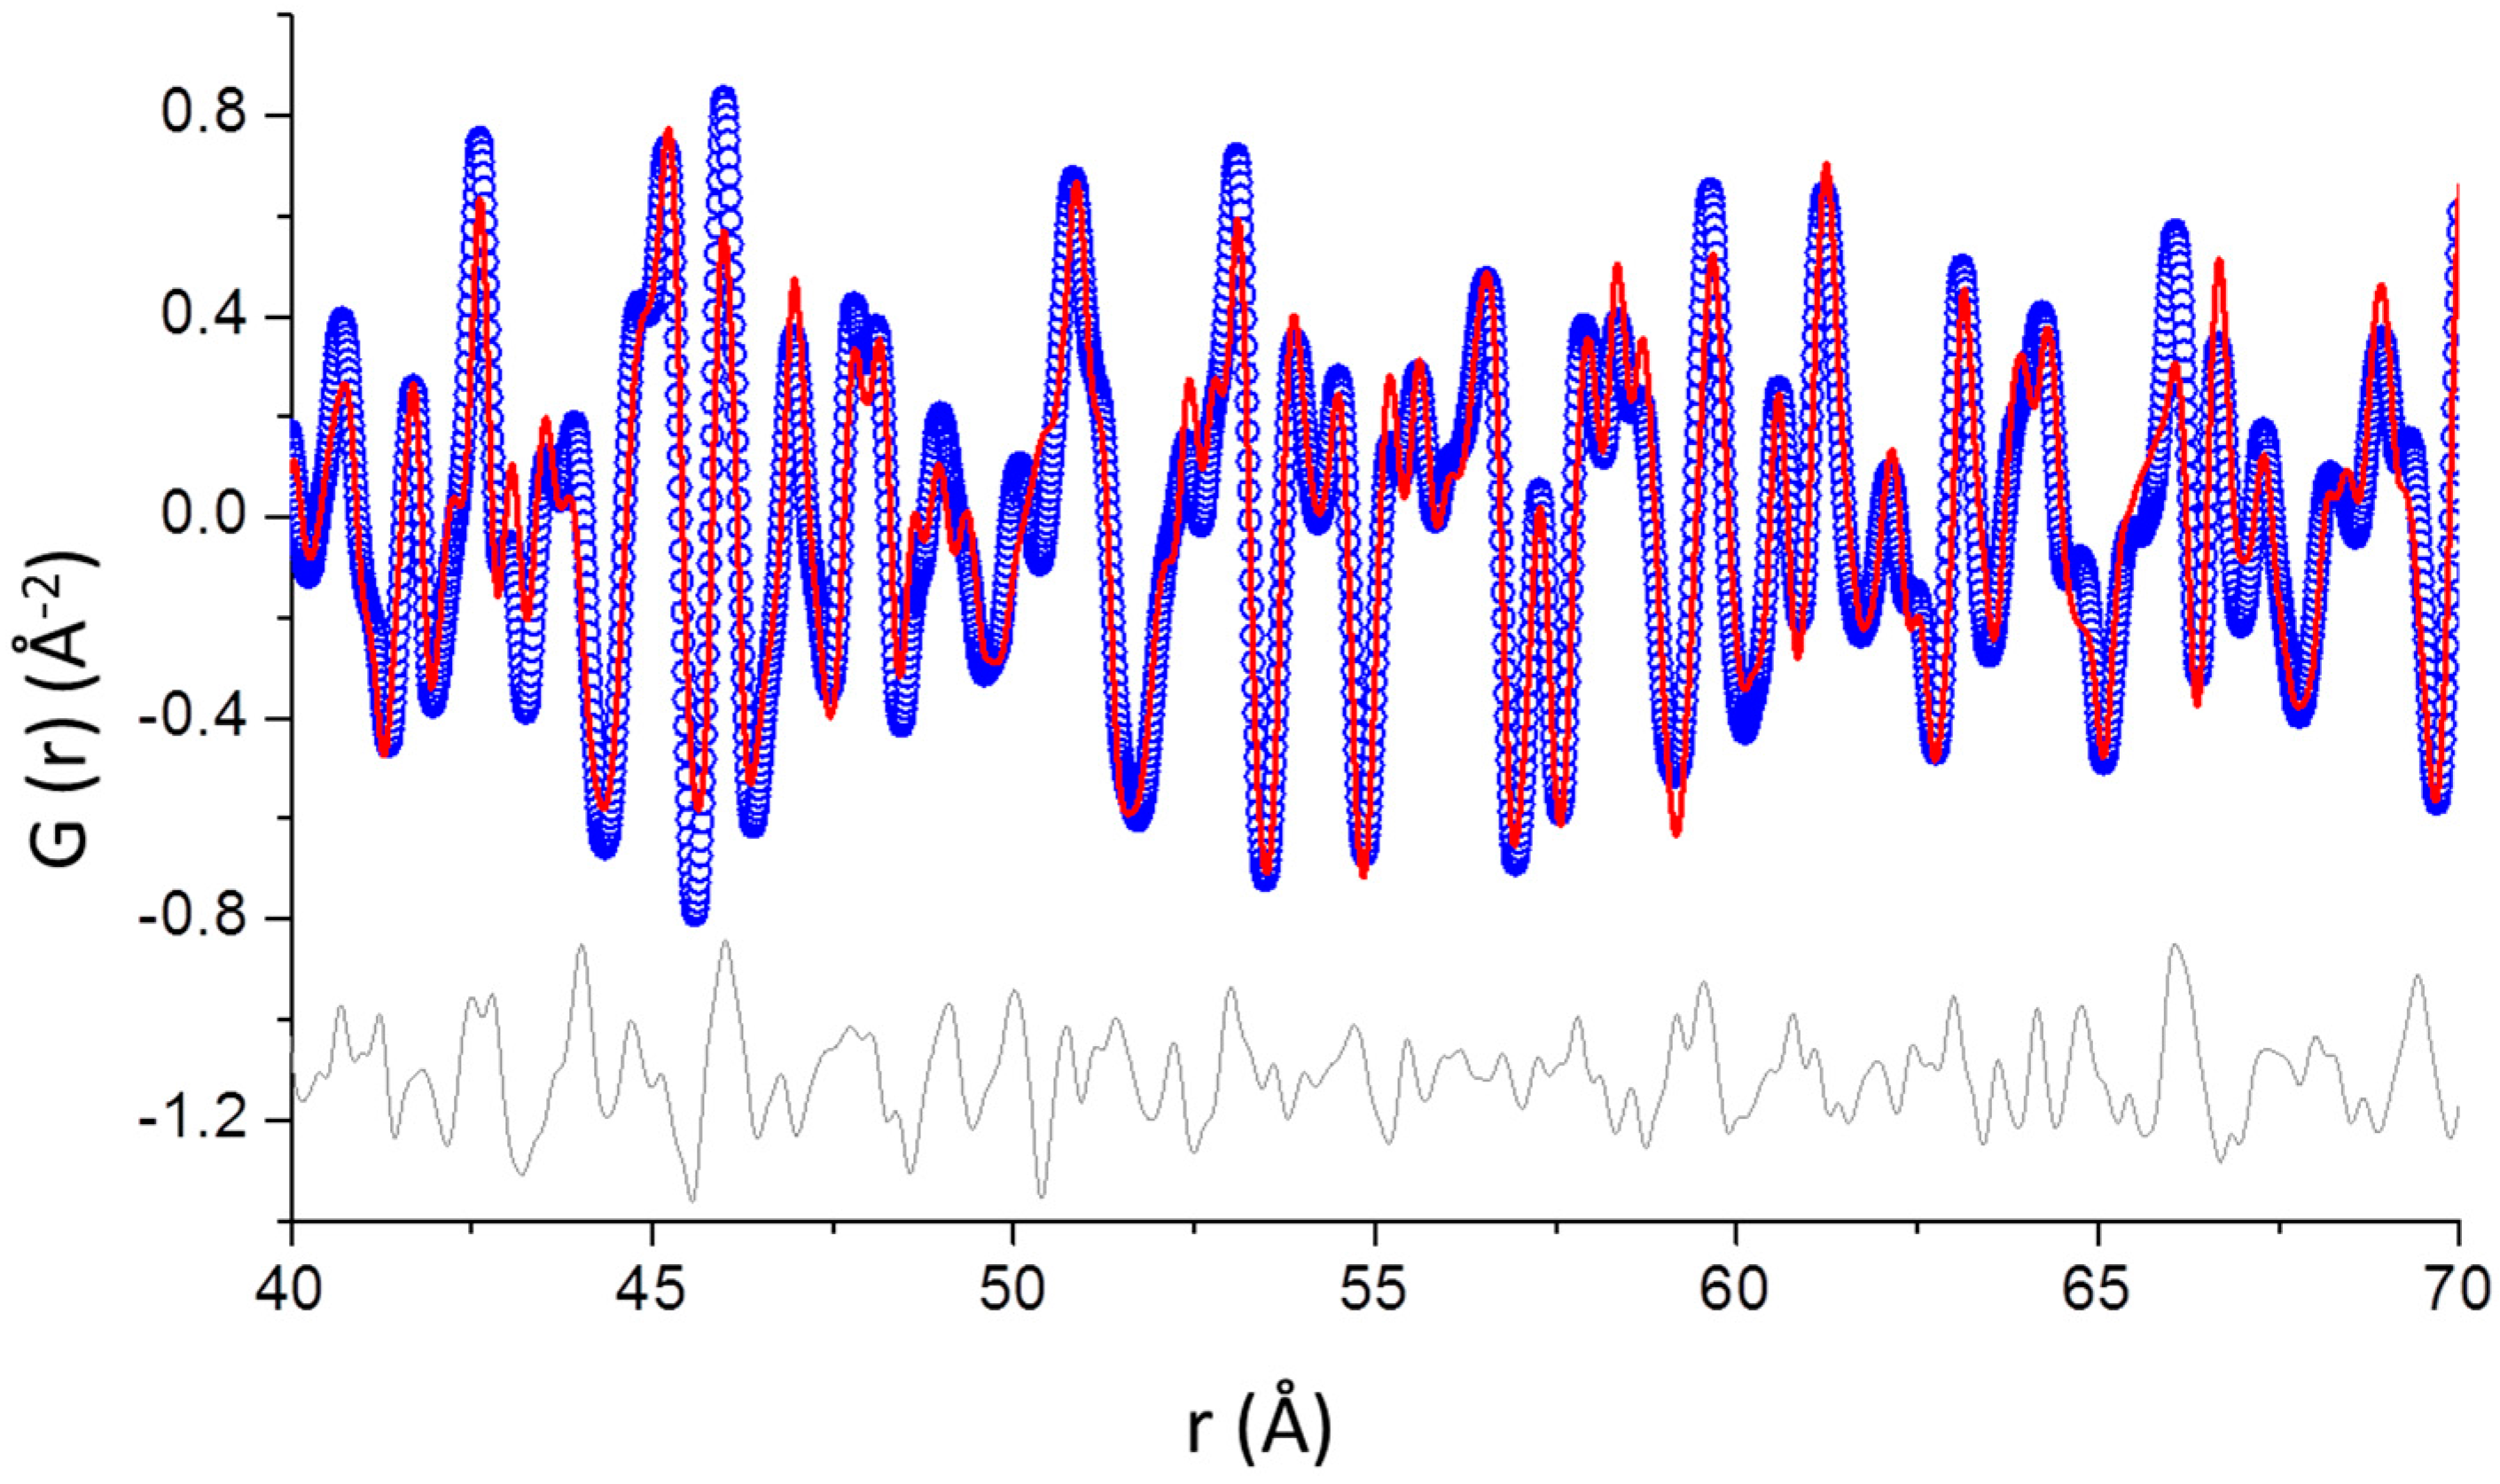
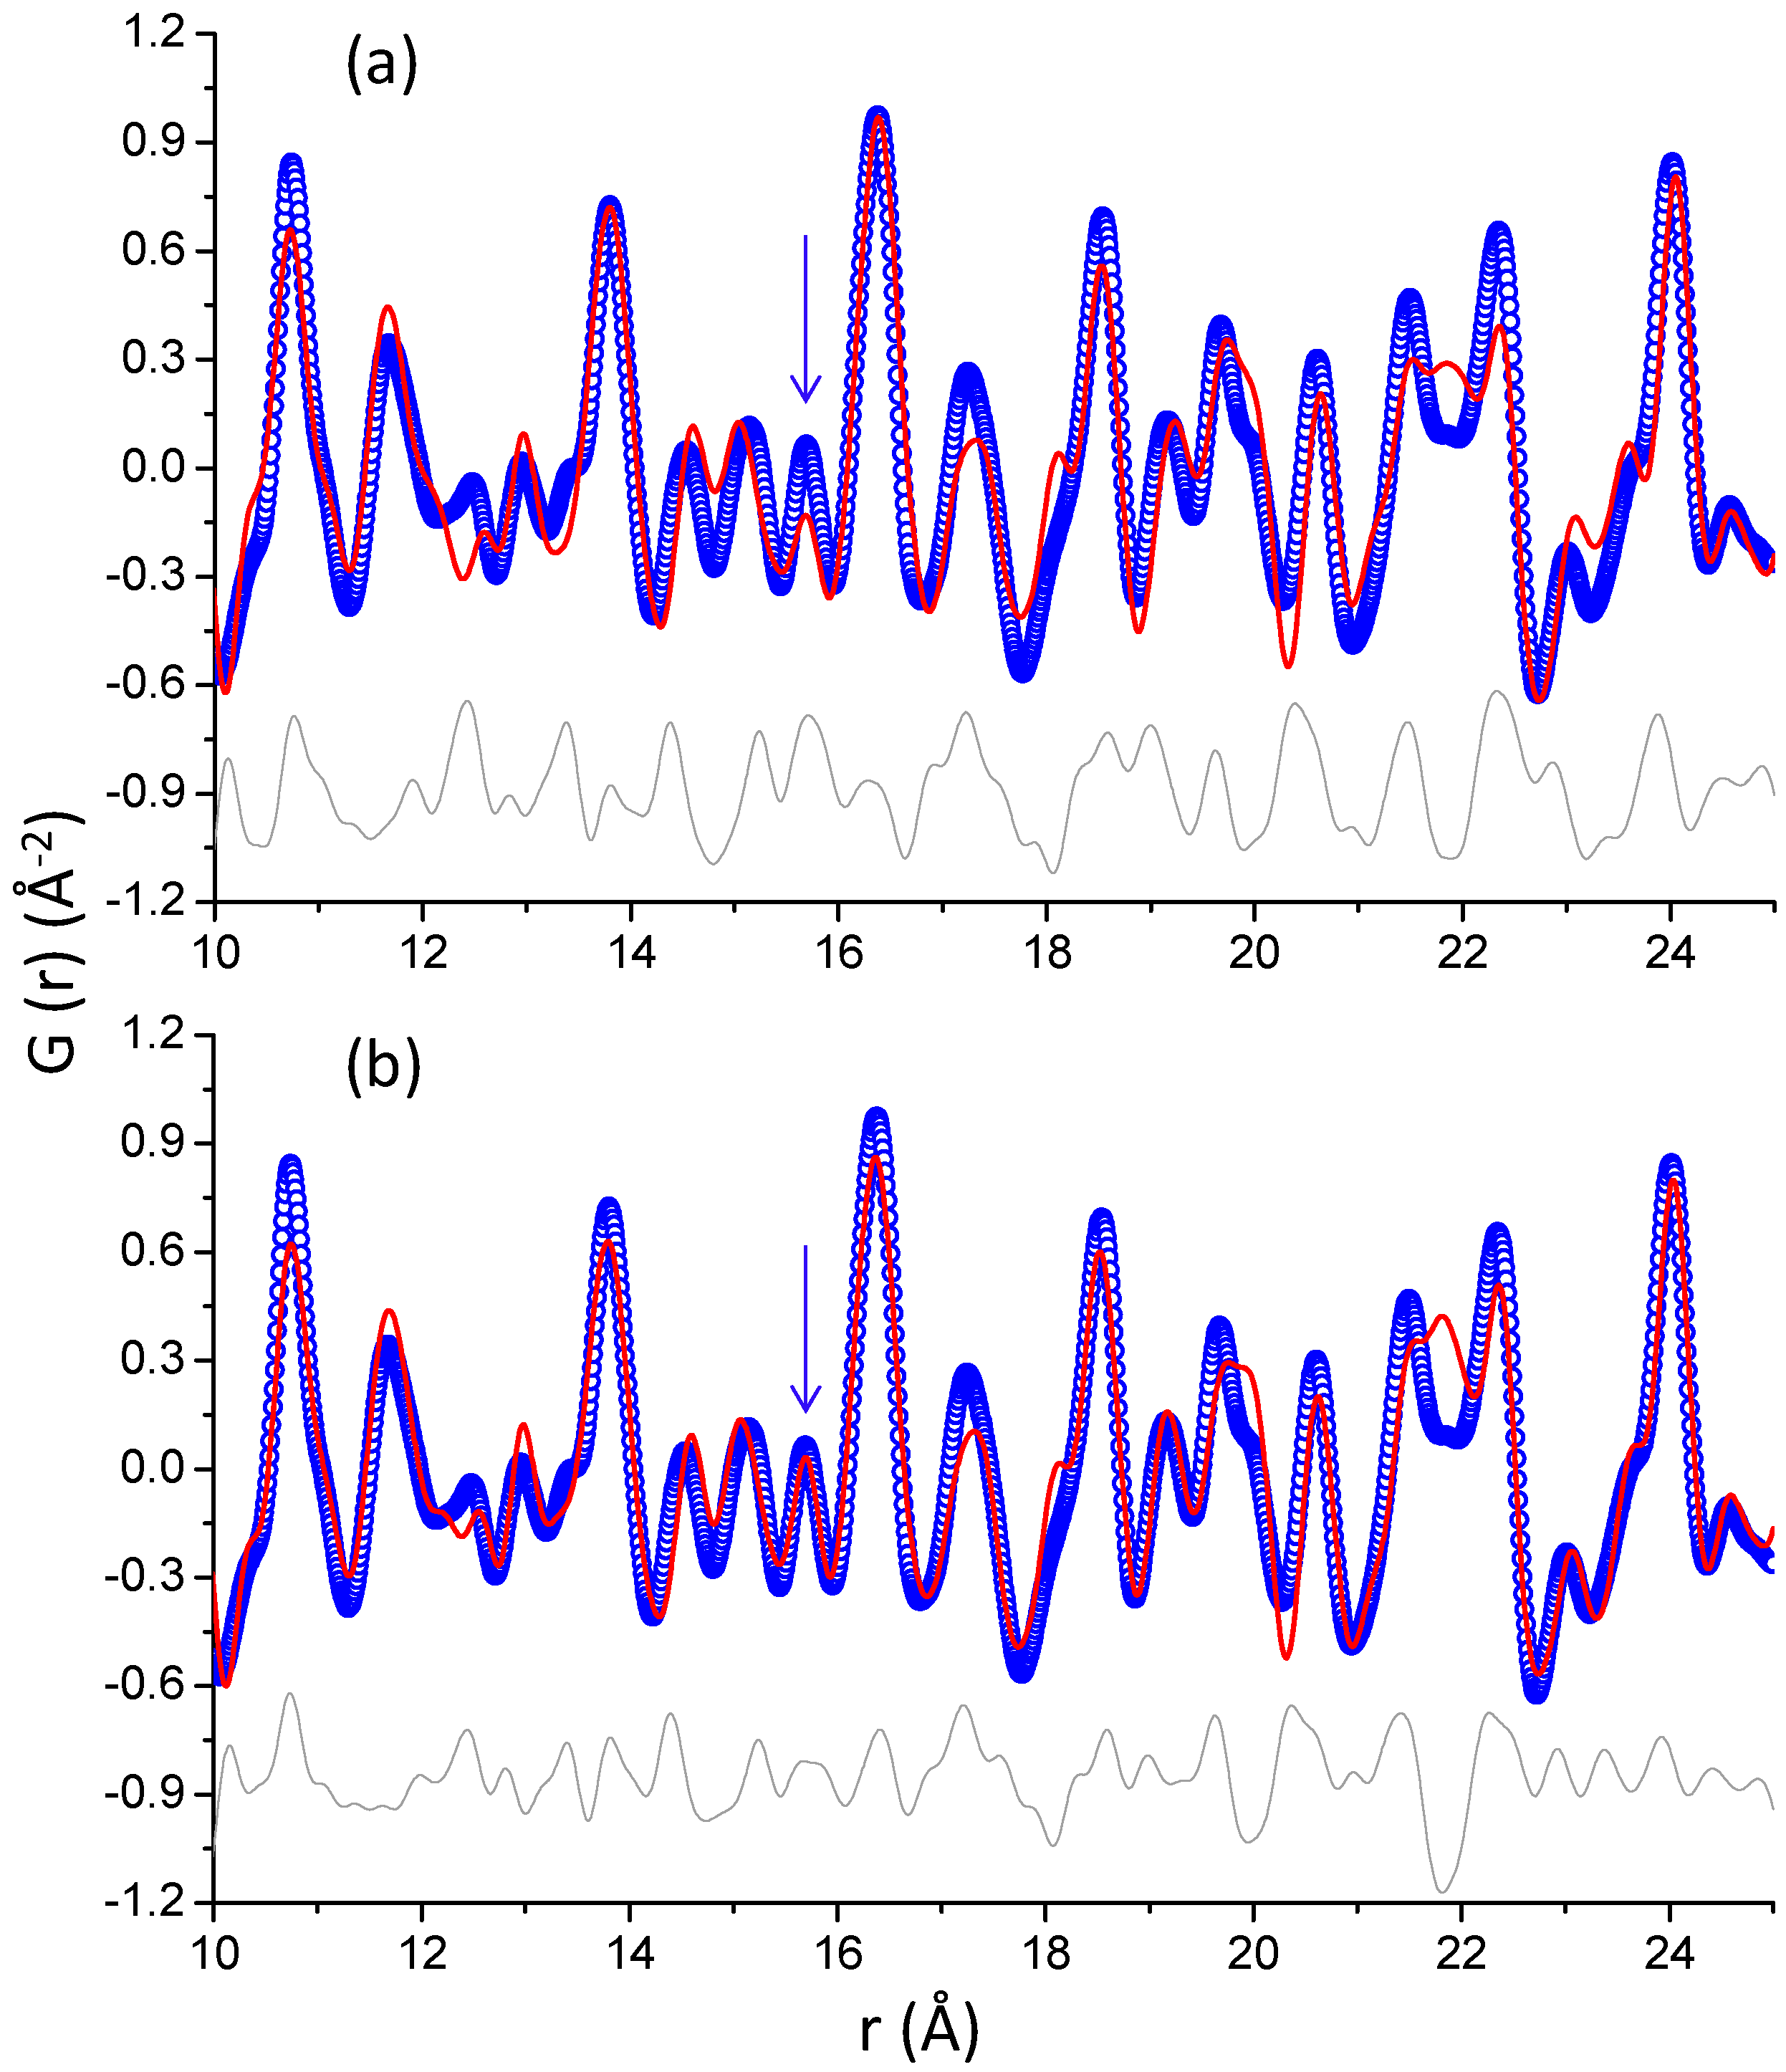
4.7. PDF Data Analysis

PDF experimental data were obtained using PDFgetX3 [45] with a Qmax = 21 Å−1. Structural and quantitative phase analysis information was obtained from the PDF data using the PDFgui software [46]. Final global optimized parameters were: scale factors, cell parameters, and ADPs. In some cases, atomic positional coordinates were also refined. Moreover, only for the low-r region fits, the delta2 parameter (low-r correlated motion peak sharpening factor) [47,48] was refined. The instrumental parameters were obtained by measuring a similar data set for crystalline nickel. Nickel PDF data analysis converged to Qdamp = 0.0026 Å−1 and Qbroad = 0.0069 Å−1.

Supplementary Materials

The following are available online at www.mdpi.com/2073-4352/7/10/317/s1, Table S1: Rietveld quantitative phase analysis results for the alite pastes after 34 hydration days, Table S2: Summary of the weight losses from the TGA study for the alite pastes, Table S3: Anisotropic atomic displacement parameters (ADPs) for portlandite in w/s = 0.80 paste obtained in the PDF analysis. Note that the parameters for the hydrogen were not refined, Table S4: Quantitative phase analysis results obtained by PDF using two crystal structures for the nanocrystalline C-S-H gel in the alite w/s = 0.46, 0.55, and 0.65 pastes. RW values are also included, Table S5: Refined unit cell parameters for portlandite and clinotobermorite T3_14sc in the alite w/s = 0.46, 0.55, and 0.65 pastes by PDF analysis, Table S6: LXRPD Rietveld quantitative phase analysis results for the calcium aluminate pastes, Table S7: Refined unit cell parameters and ADPs for hydrogarnet and gibbsite in the calcium aluminate pastes obtained by the PDF analysis, Figure S1: Particle size distribution of the raw materials measured by laser diffraction (a) Ca3SiO5, (b) CaAl2O4, and (c) Ca4Al6O12SO4, Figure S2: Thermogravimetric data for Ca3SiO5 pastes hydrated for 34 days at room temperature: (a) w/s = 0.46 sample; (b) w/s = 0.55 sample; (c) w/s = 0.65 sample; (d) w/s = 0.80 sample, Figure S3. Experimental (blue circles) and fitted (red solid line) PDF patterns for the as-received Ca3SiO5. Difference curve as grey line, Figure S4: Thermogravimetric data for CaAl2O4 pastes hydrated for 30 days: (a) w/s = 0.55 sample hydrated at 35 °C; (b) w/s = 1.20 sample hydrated at 35 °C; (c) w/s = 0.55 sample hydrated at 45 °C, Figure S5: Thermogravimetric data for (a) ye’elimite–gypsum paste hydrated with w/s = 1.2 for 21 days at room temperature and (b) ye’elimite–bassanite paste hydrated with w/s = 1.2 for 14 days at room temperature, Figure S6: Experimental (blue circles) and fitted (red solid line) PDF patterns for the ye’elimite–bassanite paste hydrated with w/s = 1.20 for 21 days at room temperature (a) high r-range: 30–50 Å, (b) low r-range: 1.6–35 Å, (c) enlarged view of: 1.6 to 10 Å. Difference curve as grey lines. Raw data file description is also reported as the raw PDF data have been deposited. Open access raw data: All of the total scattering raw data underlying this article, including the nickel and Ca3SiO5 data sets employed as standards and the empty capillary utilized for data processing, can be accessed on Zenodo at https://doi.org/10.5281/zenodo.890585, and used under the Creative Commons Attribution license.

Acknowledgments

This work has been supported by Spanish MINECO through BIA2014-57658-C2-2-R, which is co-funded by FEDER, BIA2014-57658-C2-1-R and I3 (IEDI-2016-0079) grants. We also thank CELLS-ALBA (Barcelona, Spain) for providing synchrotron beam time at BL04-MSPD beamline. Finally, we thank Prof. Simon Billinge, Long Yang and Monica Dapiaggi for their help with the PDF script and simulations for Ca(OH)2 scattering data.

Author Contributions

A.C. and M.A.G.A. designed the research; A.C., I.S., D.L.-Z. and J.D.Z.-G. carried out the sample preparation, O.V., J.D.Z.-G., M.G.D., D.L.-Z. and A.C. performed the experiments; A.C. and M.A.G.A. analyzed the data; A.C. and M.A.G.A. wrote the paper which was revised by all authors.

Conflicts of Interest

The authors declare no conflict of interest. The founding sponsors had no role in the design of the study; in the collection, analyses, or interpretation of data; in the writing of the manuscript, and in the decision to publish the results.

References

  1. Ludwig, H.M.; Zhang, W. Research review of cement clinker chemistry. Cem. Concr. Res. 2015, 78, 24–37. [Google Scholar] [CrossRef]
  2. Taylor, H.F.W. Cement Chemistry; Thomas Telford: London, UK, 1997; ISBN 978-0727725929. [Google Scholar]
  3. Scrivener, K.L.; Juilland, P.; Monteiro, P.J.M. Advances in understanding hydration of portland cement. Cem. Concr. Res. 2015, 78, 38–56. [Google Scholar] [CrossRef]
  4. Aranda, M.A.G.; De la Torre, A.G.; León-Reina, L. Rietveld quantitative phase analysis of OPC clinkers, cements and hydration products. Rev. Mineral. Geochem. 2012, 74, 169–209. [Google Scholar] [CrossRef]
  5. Thomas, J.J.; Jenning, H.M.; Allen, A.J. Relationships between composition and density of tobermorite, jennite, and nanoscale CaO−SiO2−H2O. J. Phys. Chem. C 2010, 114, 7594–7601. [Google Scholar] [CrossRef]
  6. Chen, J.J.; Sorelli, L.; Vandamme, M.; Ulm, F.J.; Chanvillard, G.J. A coupled nanoindentation/SEM-EDS study on low water/cement ratio portland cement paste: Evidence for C–S–H/Ca(OH)2 nanocomposites. Am. Cer. Soc. 2010, 93, 1484–1493. [Google Scholar] [CrossRef] [Green Version]
  7. Allen, A.J.; Thomas, J.J.; Jennings, H.M. Composition and density of nanoscale calcium-silicate-hydrate in cement. Nat. Mater. 2007, 6, 311–316. [Google Scholar] [CrossRef] [PubMed]
  8. Pustovgar, E.; Sangodkar, R.P.; Andreev, A.S.; Palacios, M.; Chmelka, B.F.; Flatt, R.J.; d’Espinose de Lacaillerie, J.-B. Understanding silicate hydration from quantitative analyses of hydrating tricalcium silicates. Nat. Commun. 2016, 10952, 1–9. [Google Scholar] [CrossRef] [PubMed]
  9. Richardson, I.G. Model structures for C-(A)-S-H(I). Acta Cryst. B 2014, 70, 903–923. [Google Scholar] [CrossRef] [PubMed]
  10. Palkovic, S.D.; Brommer, D.B.; Kupwade-Patil, K.; Masic, A.; Buehler, M.J.; Büyüköztürk, O. Roadmap across the mesoscale for durable and sustainable cement paste—A bioinspired approach. Constr. Build. Mater. 2016, 115, 13–31. [Google Scholar] [CrossRef]
  11. Papatzani, S.; Paine, K.; Calabria-Holley, J. A comprehensive review of the models on the nanostructure of calcium silicate hydrates. Constr. Build. Mater. 2015, 74, 219–234. [Google Scholar] [CrossRef]
  12. Dharmawardhana, C.C.; Misra, A.; Ching, W.-Y. Quantum mechanical metric for internal cohesion in cement crystals. Sci. Rep. 2014, 7332, 1–8. [Google Scholar] [CrossRef] [PubMed]
  13. Grangeon, S.; Fernandez-Martinez, A.; Baronnet, A.; Marty, N.; Poulain, A.; Elkaïm, E.; Roosz, C.; Gaboreau, S.; Henocq, P.; Claret, F. Quantitative X-ray pair distribution function analysis of nanocrystalline calcium silicate hydrates: A contribution to the understanding of cement chemistry. J. Appl. Cryst. 2017, 50, 1–8. [Google Scholar] [CrossRef] [PubMed]
  14. Muller, A.C.A.; Scrivener, K.L.; Gajewicz, A.M.; McDonald, P.J. Densification of C–S–H measured by 1H NMR relaxometry. J. Phys. Chem. C 2013, 117, 403–412. [Google Scholar] [CrossRef]
  15. Rejmak, P.; Dolado, J.S.; Stott, M.J.; Ayuela, A. 29Si chemical shift anisotropies in hydrated calcium silicates: A computational study. J. Phys. Chem. C 2013, 117, 8374–8380. [Google Scholar] [CrossRef]
  16. Thomas, J.J.; Chen, J.J.; Jennings, H.M.; Neumann, D.A. Ca−OH bonding in the C−S−H gel phase of tricalcium silicate and white Portland cement pastes measured by inelastic neutron scattering. Chem. Mater. 2003, 15, 3813–3817. [Google Scholar] [CrossRef]
  17. Gartner, E.; Maruyana, I.; Chen, J. A new model for the C-S-H phase formed during the hydration of Portland cements. Cem. Concr. Res. 2017, 97, 95–106. [Google Scholar] [CrossRef]
  18. Pöllmann, H. Calcium aluminate cements—Raw materials, differences, hydration and properties. Rev. Mineral. Geochem. 2012, 74, 1–82. [Google Scholar] [CrossRef]
  19. Aranda, M.A.G.; De la Torre, A.G. Sulfoaluminate cement. In Eco-Efficient Concrete; Pacheco-Torgal, F., Jalali, S., Labrincha, J., Eds.; Woodhead Publishing: Cambridge, UK, 2013; pp. 488–522. [Google Scholar]
  20. Cuesta, A.; Álvarez-Pinazo, G.; Sanfélix, S.G.; Peral, I.; Aranda, M.A.G.; De la Torre, A.G. Hydration mechanisms of two polymorphs of synthetic ye’elimite. Cem. Concr. Res. 2014, 63, 127–136. [Google Scholar] [CrossRef]
  21. Egami, T.; Billinge, S.J.L. Underneath the Bragg-Peaks: Structural Analysis of Complex Materials, 2nd ed.; Elsevier: Amsterdam, The Netherlands, 2012. [Google Scholar]
  22. Billinge, S.J.L.; Kanatzidis, M.G. Beyond crystallography: The study of disorder, nanocrystallinity and crystallographically challenged materials with pair distribution functions. Chem. Commun. 2004, 7, 749–760. [Google Scholar] [CrossRef] [PubMed]
  23. Proffen, T.; Page, K.L.; McLain, S.E.; Clausen, B.; Darling, T.W.; TenCate, J.A.; Lee, S.-Y.; Ustundag, E. Atomic pair distribution function analysis of materials containing crystalline and amorphous phases. Z. Kristallogr. 2005, 220, 1002–1008. [Google Scholar] [CrossRef]
  24. Davis, T.; Johnson, M.; Billinge, S.J.L. Towards phase quantification at the nanoscale using the total scattering pair distribution function (TSPDF) method: Recrystallization of cryomilled sulfamerazine. Cryst. Growth Des. 2013, 13, 4239–4244. [Google Scholar] [CrossRef]
  25. Aranda, M.A.G. Recent studies of cements and concretes by synchrotron radiation crystallographic and cognate methods. Crystallgr. Rev. 2016, 22, 150–196. [Google Scholar] [CrossRef]
  26. Meral, C.; Benmore, C.J.; Monteiro, P.J.M. The study of disorder and nanocrystallinity in C-S-H, supplementary cementitious materials and geopolymers using pair distribution function analysis. Cem. Concr. Res. 2011, 41, 696–710. [Google Scholar] [CrossRef]
  27. Soyer-Uzun, S.; Chae, S.R.; Benmore, C.J.; Wenk, H.-R.; Monteiro, P.J.M. Compositional evolution of calcium silicate hydrate (C-S-H) structures by total X-ray scattering. J. Am. Ceram. Soc. 2012, 95, 793–798. [Google Scholar] [CrossRef]
  28. Morandeau, A.E.; White, C.E. In situ X-ray pair distribution function analysis of accelerated carbonation of a synthetic calcium–silicate–hydrate gel. J. Mater. Chem. A 2015, 3, 8597–8605. [Google Scholar] [CrossRef]
  29. Skinner, L.B.; Chae, S.R.; Benmore, C.J.; Wenk, H.R.; Monteiro, P.J.M. Nanostructure of calcium silicate hydrates in cements. Phys. Rev. Lett. 2010, 104, 1–4. [Google Scholar] [CrossRef] [PubMed]
  30. White, C.E. Effects of temperature on the atomic structure of synthetic calcium-silicate-deuterate gels: A neutron pair distribution function investigation. Cem. Conc. Res. 2015, 79, 93–100. [Google Scholar] [CrossRef]
  31. White, C.E.; Daemen, L.L.; Monika, H.; Page, K. Intrinsic differences in atomic ordering of calcium (alumino)silicate hydrates in conventional and alkali-activated cements. Cem. Concr. Res. 2015, 67, 66–73. [Google Scholar] [CrossRef]
  32. Cuesta, A.; Ichikawa, R.U.; Londono-Zuluaga, D.; De la Torre, A.G.; Santacruz, I.; Turrillas, X.; Aranda, M.A.G. Aluminum hydroxide gel characterization within a calcium aluminate cement paste by combined pair distribution function and Rietveld analyses. Cem. Concr. Res. 2017, 96, 1–12. [Google Scholar] [CrossRef]
  33. Bergold, S.T.; Goetz-Neunhoeffer, F.; Neubauer, J. Mechanically activated alite: New insights into alite hydration. Cem. Concr. Res. 2015, 76, 202–211. [Google Scholar] [CrossRef]
  34. Masoero, E.; Thomas, J.J.; Jennings, H.M. A reaction one hypothesis for the effects of particle size and water-to-cement ratio on the early hydration kinetics of C3S. J. Am. Ceram. Soc. 2014, 97, 967–975. [Google Scholar] [CrossRef]
  35. De la Torre, A.G.; Bruque, S.; Campo, J.; Aranda, M.A.G. The superstructure of C3S from synchrotron and neutron powder diffraction and its role in quantitative phase analyses. Cem. Concr. Res. 2002, 32, 1347–1356. [Google Scholar] [CrossRef]
  36. Chaix-Pluchery, O.; Pannetier, J.; Bouillot, J.; Niepce, J.C. Structural prereactional transformations in Ca(OH)2. J. Solid State Chem. 1987, 67, 225–234. [Google Scholar] [CrossRef]
  37. Zhang, J.; Scherer, W. Comparison of methods for arresting hydration of cements. Cem. Concr. Res. 2011, 41, 1024–1036. [Google Scholar] [CrossRef]
  38. Cuesta, A.; De la Torre, A.G.; Santacruz, I.; Trtik, P.; da Silva, J.; Diaz, A.; Holler, M.; Aranda, M.A.G. Chemistry and mass density of aluminum hydroxide gel in eco-cements by ptychographic x-ray computed tomography. J. Phys. Chem. C. 2017, 121, 3044–3054. [Google Scholar] [CrossRef]
  39. Jennings, H.M. Refinements to colloid model of C-S-H in cement: CM-II. Cem. Concr. Res. 2008, 38, 275–289. [Google Scholar] [CrossRef]
  40. Cuesta, A.; De La Torre, A.G.; Ramirez-Losilla, E.; Peterson, V.K.; Rejmak, P.; Ayuela, A.; Frontera, C.; Aranda, M.A.G. Structure, atomistic simulations, and phase transition of stoichiometric yeelimite. Chem. Mater. 2013, 25, 1680–1687. [Google Scholar] [CrossRef]
  41. García-Mate, M.; De la Torre, A.G.; Leon-Reina, L.; Aranda, M.A.G.; Santacruz, I. Hydration studies of calcium sulfoaluminate cements blended with fly ash. Cem. Concr. Res. 2013, 54, 12–20. [Google Scholar] [CrossRef]
  42. Fauth, F.; Peral, I.; Popescu, C.; Knapp, M. The new material science powder diffraction beamline at ALBA synchrotron. Powder Diffr. 2013, 28, S360–S370. [Google Scholar] [CrossRef]
  43. Larson, A.C.; Von Dreele, R.B. General structure analysis system (GSAS). Los Alamos national laboratory report LAUR. 2000; 86–748. [Google Scholar]
  44. De la Torre, A.G.; Bruque, S.; Aranda, M.A.G. Rietveld quantitative amorphous content analysis. J. Appl. Crystallogr. 2001, 34, 196–202. [Google Scholar] [CrossRef]
  45. Juhàs, P.; Davis, T.; Farrow, C.L.; Billinge, S.J.L. PDFgetX3: A rapid and highly automatable program for processing powder diffraction data into total scattering pair distribution functions. J. Appl. Crystallogr. 2013, 46, 560–566. [Google Scholar] [CrossRef]
  46. Farrow, C.L.; Juhás, P.; Liu, J.; Bryndin, D.; Božin, E.S.; Bloch, J.; Proffen, T.; Billinge, S.J.L. PDFfit2 and PDFgui: Computer programs for studying nanostructure in crystals. J. Phys. Condens. Matter 2007, 19, 335219. [Google Scholar] [CrossRef] [PubMed]
  47. Jeong, I.-K.; Proffen, T.; Mohiuddin-Jacobs, F.; Billinge, S.J.L. Measuring correlated atomic motion using X-ray diffraction. J. Phys. Chem. A 1999, 103, 921–924. [Google Scholar] [CrossRef]
  48. Jeong, I.-K.; Heffner, R.H.; Graf, M.J.; Billinge, S.J.L. Lattice dynamics and correlated atomic motion from the atomic pair distribution function. Phys. Rev. B 2003, 67, 104301. [Google Scholar] [CrossRef]
Figure 1. Laboratory X-ray powder diffraction (LXRPD) Rietveld plot (CuKα1 radiation, λ = 1.54059 Å) with internal standard for the alite w/s = 0.80 paste hydrated for 34 days. The crystalline phases are portlandite (high content, ICSD #202220) and alite (ICSD #94742) and calcite (low contents, ICSD #80869). The main peaks are labelled as follows: portlandite (●), alite (▼) and added internal standard, α-Al2O3 (★, ICSD #73725).
Crystals 07 00317 g001
Figure 2. Experimental pair distribution function (PDF) patterns from 1.5 to 10 Å for alite, calcium aluminate, and ye’elimite pastes.
Crystals 07 00317 g002
Figure 3. Experimental (blue circles) and fitted (red solid line) PDF for Ca3SiO5 w/s = 0.80 paste in the 40 to 70 Å r-range. Difference curve is shown as a grey line.
Crystals 07 00317 g003
Figure 4. Experimental (blue circles) and fitted (red solid line) PDF patterns for Ca3SiO5 w/s = 0.80 paste in the 10–25 Å r-range. (a) Fit including only portlandite and alite phases, RW = 36.3% and (b) Fit including portlandite, alite, and clinotobermorite T3_14sc phases, RW = 28.5%. Difference curves are shown as grey lines.
Crystals 07 00317 g004
Figure 5. Experimental (blue circles) and fitted (red solid line) PDF patterns for Ca3SiO5 w/s = 0.80 paste in the 2–10 Å r-range. The difference curve is shown as a grey line. Simulated PDF curves for a single layer and a double layer of calcium hydroxide, portlandite, alite, and clinotobermorite T3_14sc are also included.
Crystals 07 00317 g005
Figure 6. Experimental (blue circles) and fitted (red solid line) PDF for the CaAl2O4 paste hydrated with w/s = 0.55 at 35 °C (a) from 65–80 Å; (b) from 30–70 Å; (c) from 1.4–30 Å and (d) from 1.4–10 Å represents a better visualization of the first interatomic distance peaks. Difference curves are shown as grey lines.
Crystals 07 00317 g006
Figure 7. Experimental (blue circles) and fitted (red solid line) PDF patterns for the ye’elimite with gypsum paste hydrated with w/s = 1.20 for 21 days at room temperature (a) high r-range: 30–50 Å, (b) low r-range: 1.6–35 Å, (c) enlarged view of: 1.6 to 10 Å. Difference curves are shown as grey lines.
Crystals 07 00317 g007
Figure 8. Selected region of the synchrotron X-ray powder diffraction (SXRPD) (λ = 0.41225 Å) Rietveld plots for (a) calcium aluminate paste hydrated with w/s = 0.55 for 30 days at 35 °C, and (b) ye’elimite–gypsum paste hydrated with w/s = 1.20 for 21 days at room temperature. The main peaks are labelled as follows: hydrogarnet (●), gibbsite (♦), and ettringite ().
Crystals 07 00317 g008
Table 1. Selected results for the synchrotron PDF analysis of the w/s = 0.80 alite paste in the 10–25 Å r-region, using different structural descriptions for the nanocrystalline C-S-H phase.
PhaseRW (%)Ca3SiO5 (wt%)CaCO3 (wt%)Cryst-Ca(OH)2 (wt%)C-S-H (wt%)
Jennite (t), ICSD #15141333.020.31.434.543.7
Tobermorite-14 (m), ICSD #15248932.920.91.535.542.2
Tobermorite-11 (o), ICSD #9294130.318.61.331.648.5
Tobermorite-11 (m), ICSD #8769030.517.61.229.851.4
Tobermorite-11 (o), ICSD #10040529.919.71.433.545.5
Clinotobermorite (m), ICSD #9003628.813.81.023.461.9
Clinotobermorite (t), ICSD #9003428.514.11.023.961.0
Clinotobermorite (m), T5_14sc*29.215.41.126.257.4
Clinotobermorite (m), T5_11sc*30.417.81.230.250.8
Clinotobermorite (m), T3_14sc*28.516.01.127.155.8
* Richardson, 2014 [9]; (m), (o) & (t) denotes monoclinic, orthorhombic and triclinic, respectively.
Table 2. Selected results for the synchrotron PDF analysis of the calcium aluminate pastes in the 1.5–70 Å r-region.
SampleRW (%)Hydrogarnet (wt%)Hemicarbonate (wt%)Al(OH)3 gel (wt%)Spdiameter (nm)
CA_055_35 °C17.545.62.951.56.2
CA_120_35 °C20.648.14.647.35.0
CA_055_45 °C20.248.72.448.96.6
Table 3. Selected results for the synchrotron PDF analysis of the ye’elimite pastes in the 1.5–35 Å r-region.
SampleRW (%)Ettringite (wt%)Al(OH)3 gel (wt%)Spdiameter (nm)
ye’elimite-gypsum paste27.561.338.72.8
ye’elimite-bassanite paste28.459.940.12.6

