
The New Method of XRD Measurement of the Degree of Disorder for Anode Coke Material

1
The Key Laboratory of Chemical Metallurgy Engineering, University of Science and Technology Liaoning, Anshan 114051, China
2
School of Materials Science and Engineering, Shanghai Institute of Technology, Shanghai 201418, China
*
Author to whom correspondence should be addressed.
Crystals 2017, 7(1), 5; https://doi.org/10.3390/cryst7010005
Submission received: 6 November 2016
/
Revised: 22 December 2016
/
Accepted: 24 December 2016
/
Published: 18 January 2017
Abstract
:Quantitative analysis by X-ray powder diffraction of two cokes (pitch coke and petroleum coke) shows that their crystal structure changed with increasing temperature. The crystal data processing of the crystallization degree of disorder is used with further improvement of the proposed microcrystalline-stacking fault calculation method. With this improvement it is now possible to obtain the degree of stacking disorder of two cokes applied as anode materials at different graphitization temperatures. Raman spectroscopy verified the accuracy of this method, which is more reliable than the crystal structure refinement using the d002 method. This paper provides the theoretical analysis and interpretation of the relationship between the microstructure model of the material and quantitative data, discharge capacity, and the first charge-discharge efficiency.

1. Introduction
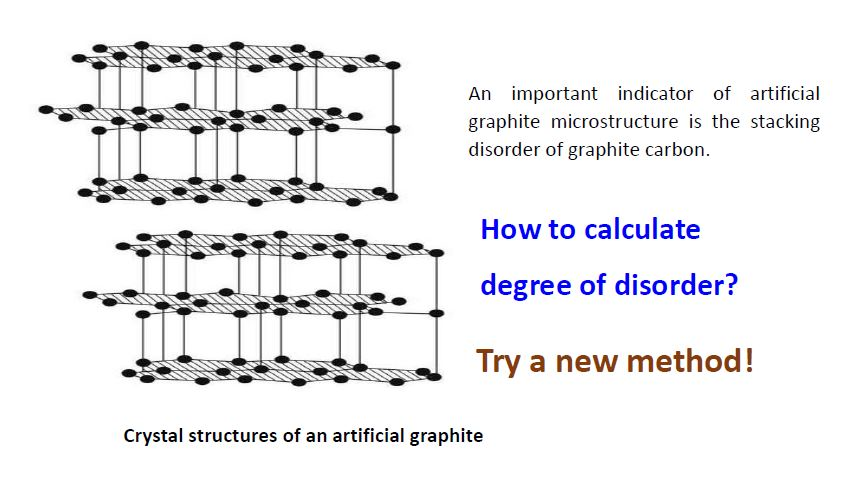
Graphite-2H [1] is a popular lithium-ion battery anode material, owing to its excellent electrochemical properties, such as charge and discharge capacity and first charge efficiency. According to materials science, the properties of materials are decided by their crystal microstructures. An important indicator of artificial graphite microstructure is the stacking disorder of graphite carbon atoms (P), which must be determined in material production units and battery production units.
There are many ways to characterize the degree of disorder of carbon anode materials, such as the whole powder pattern fitting method [2], d002 method [3], and the newer Langford method [4,5,6]. Shi et al. [2] proposed the “single” and “double” models, which rely on full spectrum fitting. The program calculates the degree of disorder of the carbon material, producing more reliable results. Unfortunately, the calculation is very complicated and requires a custom computer program that is not easily implemented in a production facility that requires immediate results. Based on the previous method, Michio Inagaki et al. [3] proposed that d002 is an important parameter to characterize the stacking disorder degree. The d002 calculated process is relatively simple, but its credibility is low, with only an auxiliary reference value. Li et al. [5] proposed an improved Langford method to calculate degree of disorder of graphitization materials. The method is easier than d002 method due to a simpler calculation procedure. However, meaningful quantitative results for graphite materials were only acquired using this method at high temperature (2800 °C). The study found that it is difficult to obtain reliable results for graphite in coke anode materials over a wider temperature range. Graphitization under different temperature is very important to research for the mechanism and properties of high performance carbon materials. Therefore, we believe that the principle of the method is justifiably correct, but it is necessary to improve the method for a wider range of materials and for different graphite preparation processes.
In this paper, the method is improved and the results of this improved method can be used to adjust the carbon anode materials processing parameters, which are needed to achieve higher performance. This paper reports the results of quantitative X-ray diffraction (XRD) analyses. This study aims to determine the degrees of microcrystalline structure disorder of petroleum coke and pitch coke at the graphitization temperature range of 1800–2800 °C.
Langford used the current method to calculate the stacking degree of disorder of the carbon anode materials, but was unable to obtain meaningful results. To obtain reasonable results, the Langford method needs to be improved. In order to determine the appropriate improvement method, the characterization of the anode materials was compared with Raman spectra and the d002 methods. The results show that the improved Langford method is consistent with the calculated results of Raman spectroscopy and the d002 methods qualitatively, but more reliable and accurate than the latter two. Changes in electrochemical properties verify the accuracy of the proposed method.
2. Experimental
2.1. Sample Preparation
The samples selected for investigation are petroleum coke (PC) and pitch coke (TC). The samples were heat-treated from 1800 °C to 2800 °C for 1 h in pure Ar flow. The experimental scheme and respective sample numbers are shown in Table 1.
2.2. Characterization
2.2.1. XRD Technique
X-ray powder diffraction analysis was performed using Rigaku Dmax2200PC diffractometer (Rigaku Corporation, Tokyo, Japan) and Cu Kα-radiation. The X-ray intensity was measured in the range of 5° ≤ 2θ ≤ 90° with a scan speed of 2°·min−1. The peak position of the 002 coke peak was measured. Using Bragg’s law, the interlayer d-spacing was culated. The improved Langford method was used to calculate the stacking disorder degree, P.
2.2.2. Raman Technique
The wavelength of the laser was 514.5 nm. The detection range of wave number is 500–3000 cm−1. The full widths were measured at the half maxima of the peak D and peak G to give a quantitative analysis of the microstructure. The intensity ratio of the D and G peak was measured to indirectly show the graphitization degree.
2.2.3. Electrochemical Measurement
The electrochemical performance test used multi-channel Aibin half-cell test systems (Arbin Instruments, College Station, TX, USA). It tests discharge capacity and the first charge-discharge efficiency, which measures the electrochemical properties of anode material at different temperatures.
2.3. Review of the Stacking Degree Disorder of 2H-Graphite Method Proposed by Li et al.
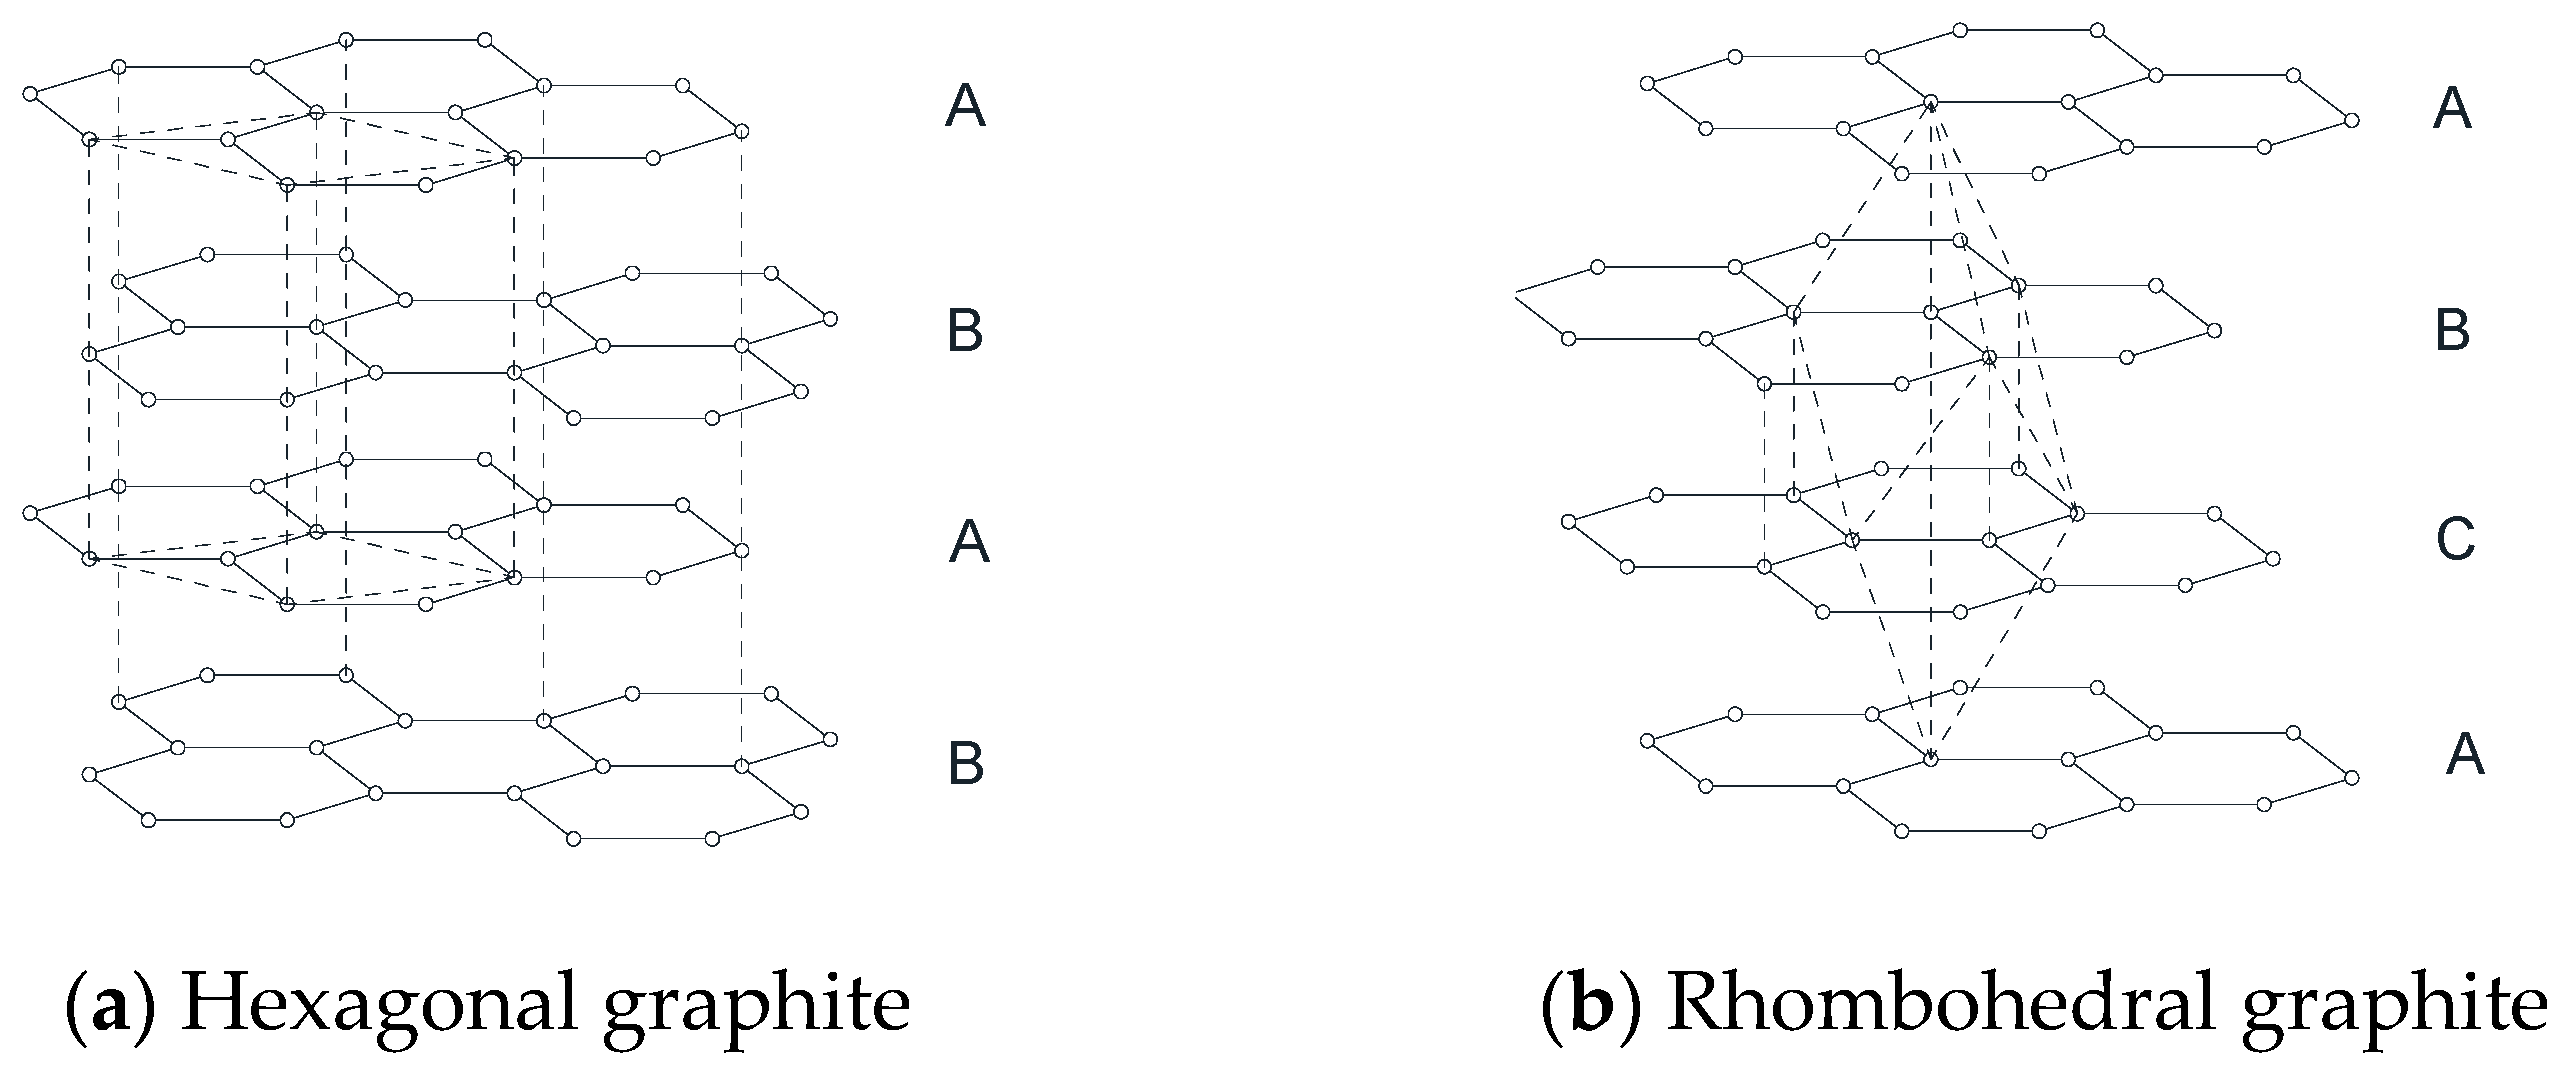
To illustrate our calculation method, a brief review of the method of calculation by Li et al. is provided. Hexagonal grids of graphite are defined by ABCABC... or ABAB... stacking rules. The former is the 2H-graphite hexagonal structure and part of the P63/mmc (No. 194) space group, the latter is 3R-graphite diamond or rhombohedral structure and is part of the R3 (No. 146) space group [7]. Structure models are shown in Figure 1a,b.
If stacking webs have no regularity (i.e., neither ABAB... nor ABCABC..., which are periodically arranged parallel stacking modes) then this is considered a stacking fault. The samples were heat-treated from 1800 °C to 2800 °C. 2H-graphite still has non-ideal ABAB.... stacking, a stacking fault. The stacking fault will result in XRD diffraction line broadening, an effect known as stacking fault broadening.
The grain size also affects the diffraction line width, called the microcrystalline width. Thus, the relationship among Formula bus width, i.e., the Full Width at Half Maximum (FWHM) β, microcrystalline broadening, βC and layer fault broadening, βP, can be expressed in Equation (1) [5]:
β = βc + βp
For a close-packed hexagonal crystal structure, assuming that structures in the samples are nearly equiaxed crystal, we can use the following Equations:
where c is the lattice constant of the C-axis direction, and фz is the angle between the diffraction surface and hexagonal base surface (001). Li et al. [5] places the Scherrer formula and Equation (3) into Equation (2) and creates the following equation based on FWHM, β, and the diffraction angle, θ, which meets the conditions of the calculation of the diffraction lines of 2H-graphite [5]:
where P is the degree of disorder, λ is wave length of the X-ray, is the average diameter of the crystallite, and βhkl and θhkl are the FWHM and Bragg angle of the hkl plane, respectively.
β = βc + Mcosфz
h − k = 3n or hk0 M = 0
h – k = 3n ± 1, l even M = 3P/(2c)
h – k = 3n ± 1, l odd M = P/(2c)
h – k = 3n ± 1, l even M = 3P/(2c)
h – k = 3n ± 1, l odd M = P/(2c)
In 2H-graphite, h − k = 3n ± 1; when l = odd, 101 peak appears, and when l = even, 102 and 022 (or 202) peaks do not appear because they are extinct or too weak. In this case, Li et al. [5] further assumed the shape to be a polyhedral crystallite or near equiaxed. The grain size, D002, D100, and D004 of 002, 100, and 004 planes normal are substantially equal, and as such the following equation can be calculated as an average particle size:
The calculations proposed by Li et al. [5] are successful under their experiment conditions, however, our experiment conditions are different (e.g., our temperature range is from 1800 °C to 2800 °C, while Li’s temperature is consistent 2800 °C). We do not make sure whether Li’s method is suitable for calculating the disorder degree of anode material under our experiment conditions, so we will do something for calculations of anode material by Li’ method; if necessary, the method would be improved.
3. Results and Discussion
3.1. XRD Spectra and Data Analysis of Two Kinds of Graphitized Coke
XRD results of petroleum coke and pitch coke anode materials at different heat treatment temperatures are shown in Figure 2. XRD analysis datum fitting microcrystalline structure calculations are provided in Table 2. Figure 2 shows that, after high-temperature treatment, 2θ angles of (002) peak petroleum coke and pitch coke move to the right, two cokes at 2200 °C both appear, namely the (101) peak and (112) peak of 2H-graphite, which can be seen from Table 2. The value of d002 gradually approaches the theoretical value of standard graphite (3.354 Å) with increasing temperature, but the minimum value of d remains 3.377 Å. It is therefore difficult to achieve a completely ordered graphite structure in either of the cokes.
Three kinds of stacking disorder degrees can be seen in Table 3 below, P1, P2, and Pd002. Pd002 is obtained by d002, P1 is calculated by D1(Li’s method [4,5,6]), and P2 is obtained by D112 (our method). One might see that some of the P1 values exceed 100%, which should not happen because P1 is the ratio. Therefore, the results are hard to be accepted (i.e., Li’s method [5] might be not suitable for our condition).
3.2. Improved Calculation Method
In order to provide more meaningful experimental data, the Li et al. method [5] needs to be re-evaluated. A detailed analysis is as follows:
We believe that the formula which describes equiaxed crystals, Equation (5), needs to be amended. The formula uses (002) and (004) crystal planes to calculate normal direction grain size. However, the two planes belong to the same families of planes. They are linearly dependent in mathematics with both expressing the grain size of c-axis direction. In Equation (5), although the (100) crystal plane is orthogonal to the (002) crystal plane, there is no data for the third independent crystal plane, so cannot accurately express the grain size of polyhedron. Therefore, the formula needs to be amended. Since graphite is typically anisotropic in nature, the orientations of the (002) and (100) planes vary widely. It is challenging to express graphite grain size using the average value of their crystal orientation. This paper shows that a different set of crystal planes could be a more direct representation of graphite grain size. The crystal face in 2H graphite is the (112) surface, and in 3R graphite it is the (113) surface.
From Equation (3), the half width of the crystal surface is not subject to the influence of the stacking fault (it satisfies h − k = 0). In addition, this crystal surface is neither parallel to the a-axis nor parallel to the crystal plane, c-axis. The grain size of the graphite crystallites may represent the actual average grain size. This paper uses the designation.
The geometric arrangement of graphite planes can be described as follows: in 2H graphite, the structure of the arrangement shown in Figure 3, the (112) plane, can be expressed as a triangle. The sizes of the three sides are nearly equal at approximately 0.4159, 0.4263, and 0.4263 nm, respectively. In 3R graphite, the planes do not change, but their index changes to (113), and the diffraction line is still present. An important improvement of the Li et al. method [5] is the fact that Equation (6) replaces Equation (5).
In this paper is placed into Equation (4) which when calculated, as seen in Table 2, the degree of stacking disorder in the sample decreases with increasing temperature. At 2800 °C, the disorder of two cokes are 19.59% and 18.26%, respectively, in line with the temperature gradient that improves the degree of order of the coke anode material. This gradual increase of the degree of graphitization is the actual law resulting in absurd results greater than 100%.
Based on the stacking degree of disorder (P2, in Table 3), the changing amounts of microcrystalline structure are different for pitch coke and petroleum coke at 2600 °C and 2800 °C, respectively. The degree of disorder for petroleum coke decreased by 3.11%, and pitch coke decreased only by 1.08%, however, the degree of disorder of petroleum coke obtained by the d002 method is insignificant, only 0.45%, while the degree of disorder of pitch coke is reduced by 1.68%.
The stacking disorder (P2) is shown in Table 3. When the stacking disorder was calculated, the (112) peak of petroleum coke appeared at a temperature of 2200 °C. The (112) peak of pitch coke appeared at a temperature of 2000 °C. It can be seen that different samples have different lattice transformation critical points. These points are an important result of this paper.
The above conclusion is supported by high-resolution transmission electron microscopy (TEM) experiments. Figure 4a–c show the petroleum coke structure at 2000 °C, 2200 °C, and 2800 °C, respectively. At 2000 °C graphite sheets are arranged disorderly and crosslinked to each other. At 2200 °C, the graphite sheet stacking appears partially ordered, but not very clear with some disorderly structures remaining. At 2800 °C, graphite sheets appear to be orderly and distinct. This strongly supports the XRD results.
3.3. Raman Spectral Data Analysis in Two Kinds of Cokes after Graphitization
Figure 5a,b represent Raman spectra of petroleum coke and pitch coke, respectively, acquired at different temperatures. It can be seen from Figure 5 that the D peak height decreases and G peak increases in the two materials with increasing temperature, which may be due to the structural defects reducing and the increase of sp2 hybridized bonds.
The peak area ratio of D and G, R (R = ID/IG) can estimate the degree of graphitization. The smaller the R value, the higher the degree of graphitization [8,9,10]. Table 4 shows that with the increasing temperature from 1800 °C to 2800 °C, the R value of petroleum coke decreases from 27.78% to 10.33%, while the R value of pitch coke decreases from 26.61% to 9.97%.
However, the R value can only characterize the qualitative change of the degree of graphitization, so Shi [11] proposed the degree of disorder PR (PR = ID/(ID + IG)) to determine its crystal structure. As can be seen from Table 3, the degree of disorder of petroleum coke, PR, dropped from 21.76% to 9.36% with increasing temperature, and the degree of disorder of pitch coke, PR, dropped from 21.01% to 9.07%.
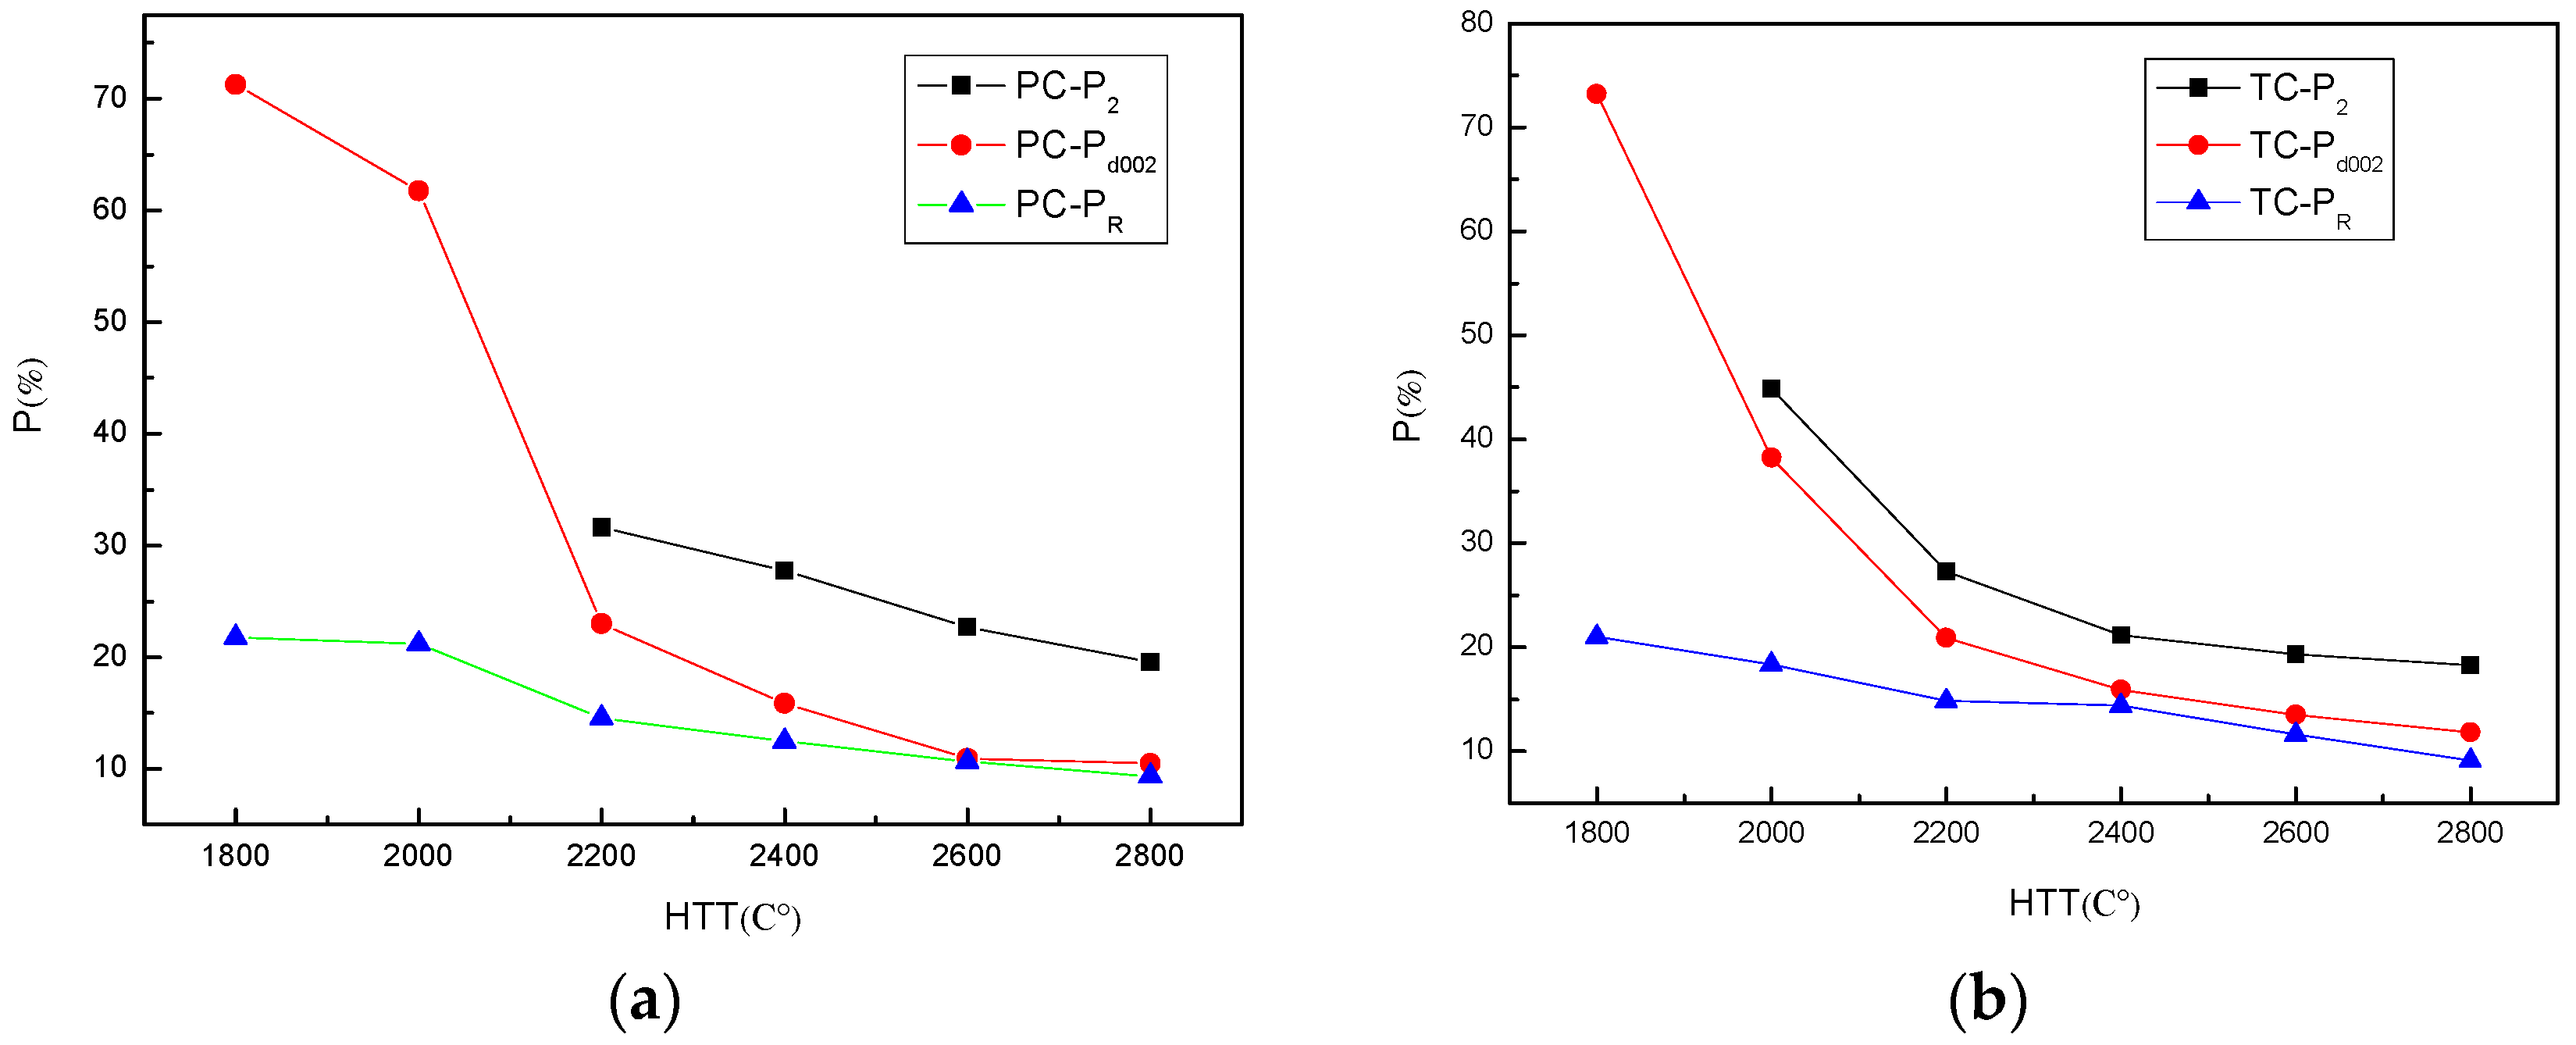
Figure 6 is a graph of the three methods used to calculate the degree of disorder at different heat treatment temperatures. It shows that the degrees of disorder, obtained from the three methods, are consistent with increasing graphitization temperature. However, Raman spectra showed the stretching vibration of sp2 hybrid bond defects within the carbon lattice plane and degree of disorder of d002 method is characterized by a (002) arrangement. Therefore, they only represent a single plane and a single direction disorder, respectively, not the whole crystal arrangement of them. On the other hand, the parameter D112 is just a measure of the stack faults which represents the disorder of the crystal stack. That is why their disordered values are less than the present value of the degree of disorder obtained by our improved methods.
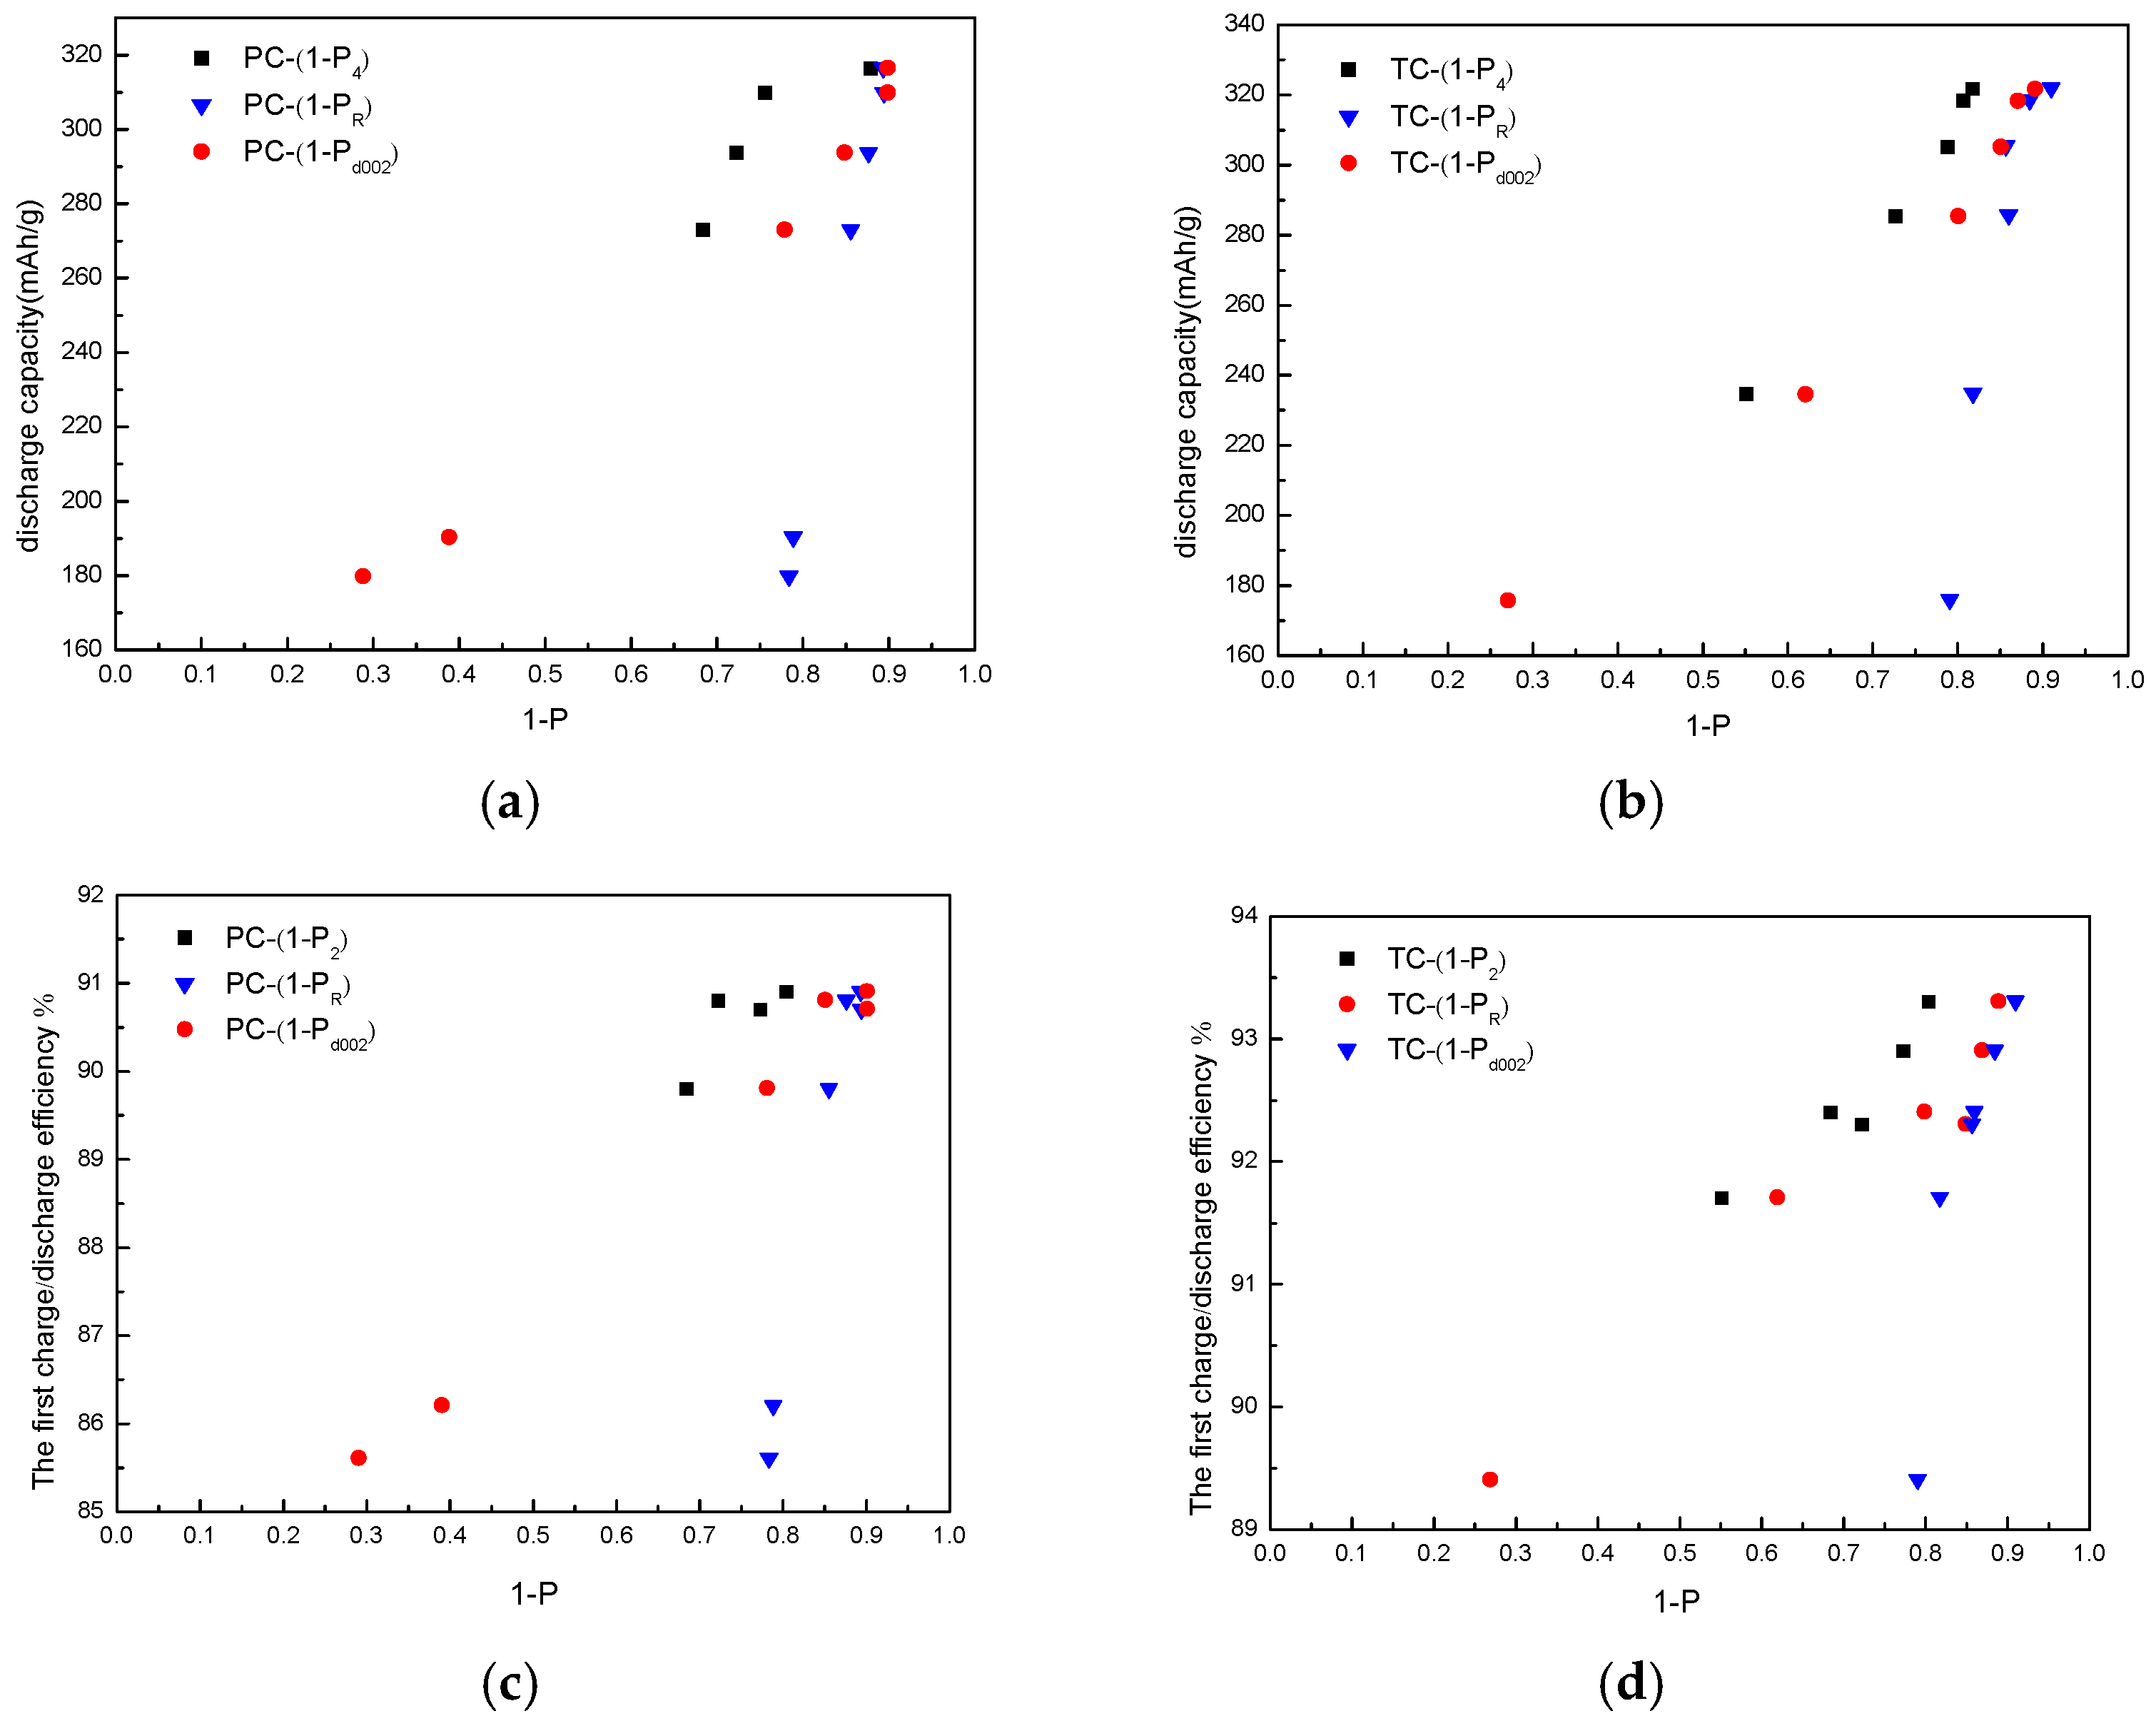
Figure 7 shows the relationships between the degree of graphitization of petroleum coke and pitch coke and electrochemical performances. It is evident from Table 2, Table 3 and Table 4 and Figure 7 that the degree of graphitization (1-P) and first charge-discharge efficiency are directly related. It also proves that the reduction of the degree of disorder (i.e., the increase degree of graphitization) is good for insertion or deinsertion of lithium ions in the graphite intercalation [12] and decreasing the irreversible capacity of the carbon anode [13].
The degrees of disorder and lithium performances of petroleum coke and pitch coke at different temperatures are shown in Table 5 and the charge-discharge capacity graph of lithium battery can be referred to in Figure S1 of the supplementary data. It can be seen from Table 5 that with an increase in temperature, the degree of disorder using different characterization methods showed a decreasing trend. The degree of disorder determined at 2600 °C by Langford and used by Li et al. showed that P1 is still greater than 100%. At temperatures above 2800 °C, the treatment, P1, is still not less than 60%. Microcrystalline structures cannot characterize the degree of disorder in actual experimental samples.
4. Conclusions
(1). This paper improves the method for calculating stack faulting of graphite by XRD. It provides an improved formula, which was used to calculate the degree of disorder of two cokes and has a wide processing temperature range. The two kinds of anode materials have different structure transition temperatures obtained by the improved method. The transition temperatures of pitch coke and petroleum coke are 2000 °C and 2200 °C, respectively.
(2). Qualitative TEM and Raman spectroscopic results support the layer fault calculation for anode materials.
(3). XRD analysis provided a complete calculation of the degree of disorder for the carbon anode materials of lithium. It proposed a stacking model and data processing method, which is based on using (112) planes to calculate the degree of stacking disorder. The analytical method to calculate the degree of disorder of 2H-graphite correlated well with electrochemical properties and supported the results proposed by this paper.
(4). The proposed method for calculation of stacking disorder degree of hexagonal graphite can provide credible results when credible FWHM data of (112) crystal plane and other parameters are obtained.
Supplementary Materials
The following are available online at www.mdpi.com/2073-4352/7/1/5/s1, Figure S1: The parameters and the results of calculations, Table S1: 1st charge-discharge voltage vs. specific capacity profile for each category.
Acknowledgments
The support of The National Natural Science Foundation of China (project U1361212) is greatly acknowledgement.
Author Contributions
Zhou Zhang and Qi Wang conceived and designed the experiments; Zhuo Zhang performed the experiments; Zhuo Zhang and Qi Wang analyzed the data; Zhuo Zhang contributed materials; Zhuo Zhang wrote the paper.
Conflicts of Interest
The authors declare no conflict of interest.
References
- Franklin, E.R. The structure of graphitic carbons. Acta Crystallogr. 1951, 4, 253–261. [Google Scholar] [CrossRef]
- Shi, H.; Reimers, J.N.; Dahn, J.R. Structure-refinement program for disorderd carbon. J. Appl. Cryst. 1993, 26, 827–836. [Google Scholar] [CrossRef]
- Inagaki, M.; Shiraishi, M. The evaluation of graphitization degree. Carbon Tech. 1951, 5, 165–175. [Google Scholar]
- Yang, C.Z.; Jiang, C.H. Line profile analysis and microstructure characterization of diffraction line broaden. PTCA Part A Phys. Test 2014, 50, 658–667. [Google Scholar]
- Li, H.; Yang, C.Z.; Liu, F. Novel method for determining stacking disorder degree in hexagonal graphite by X-ray diffraction. Sci. China Chem. 2009, 52, 174–180. [Google Scholar] [CrossRef]
- Li, H.; Yang, C.Z.; Liu, F. Determining graphitization and disordered degrees in 2H-Graphite by X-Ray diffraction methods. J. Test Meas. Technol. 2009, 23, 161–167. [Google Scholar]
- Langford, J.I.; Bouitif, A. The use of pattern decomposition to study the combined X-ray diffraction effects of crystallite size and stacking faults in ex-oxalate zinc oxide. J. Appl. Crystallogr. 1993, 26, 22–33. [Google Scholar] [CrossRef]
- Inagaki, M.; Feiyu, K. Carbon Materials Science and Engineering: From Fundamentals to Applications; Tsinghua University Press: Beijing, China, 2006. [Google Scholar]
- Wang, H.J.; Wang, H.F. The effect of graphitization temperature on the microstructure and mechanical properties of carbon fibers. New Carbon Mater. 2005, 20, 158–163. [Google Scholar]
- Zerda, W.T.; Xu, W. High pressure Raman and neutron scattering study on structure of carbon black particles. Carbon 2000, 38, 355–361. [Google Scholar] [CrossRef]
- Yang, S. Studies on the Microstructure and Properties of Carbon Fibers by Raman Spectroscopy. Master’s Thesis, Donghua University, Shanghai, China, 2010; pp. 29–36. [Google Scholar]
- Niu, P.X.; Wang, Y.L.; Zhan, L. Electrochemical Performance of Needle Coke and Pitch Coke Used as Anode Material for Li-ion Battery. J. Mater. Sci. Eng. 2011, 29, 204–209. [Google Scholar]
- Zhang, B.; Guo, H.; Li, X.; Wang, Z.; Peng, W. Mechanism for effects of structure and properties of carbon on its electrochemical characteristics as anode of lithium ion battery. J. Cent. South Univ. (Sci. Technol.) 2007, 38, 454–460. [Google Scholar]
Figure 1.
Crystal structures for two modifications of graphite. (a) Hexagonal graphite; (b) Rhombohedral graphite.
Figure 1.
Crystal structures for two modifications of graphite. (a) Hexagonal graphite; (b) Rhombohedral graphite.

Figure 2.
XRD diffraction patterns of two kinds of coke anode materials under different temperatures. (a) XRD diffraction patterns of petroleum coke under different temperatures; (b) XRD diffraction patterns of pitch coke at different temperatures.
Figure 2.
XRD diffraction patterns of two kinds of coke anode materials under different temperatures. (a) XRD diffraction patterns of petroleum coke under different temperatures; (b) XRD diffraction patterns of pitch coke at different temperatures.
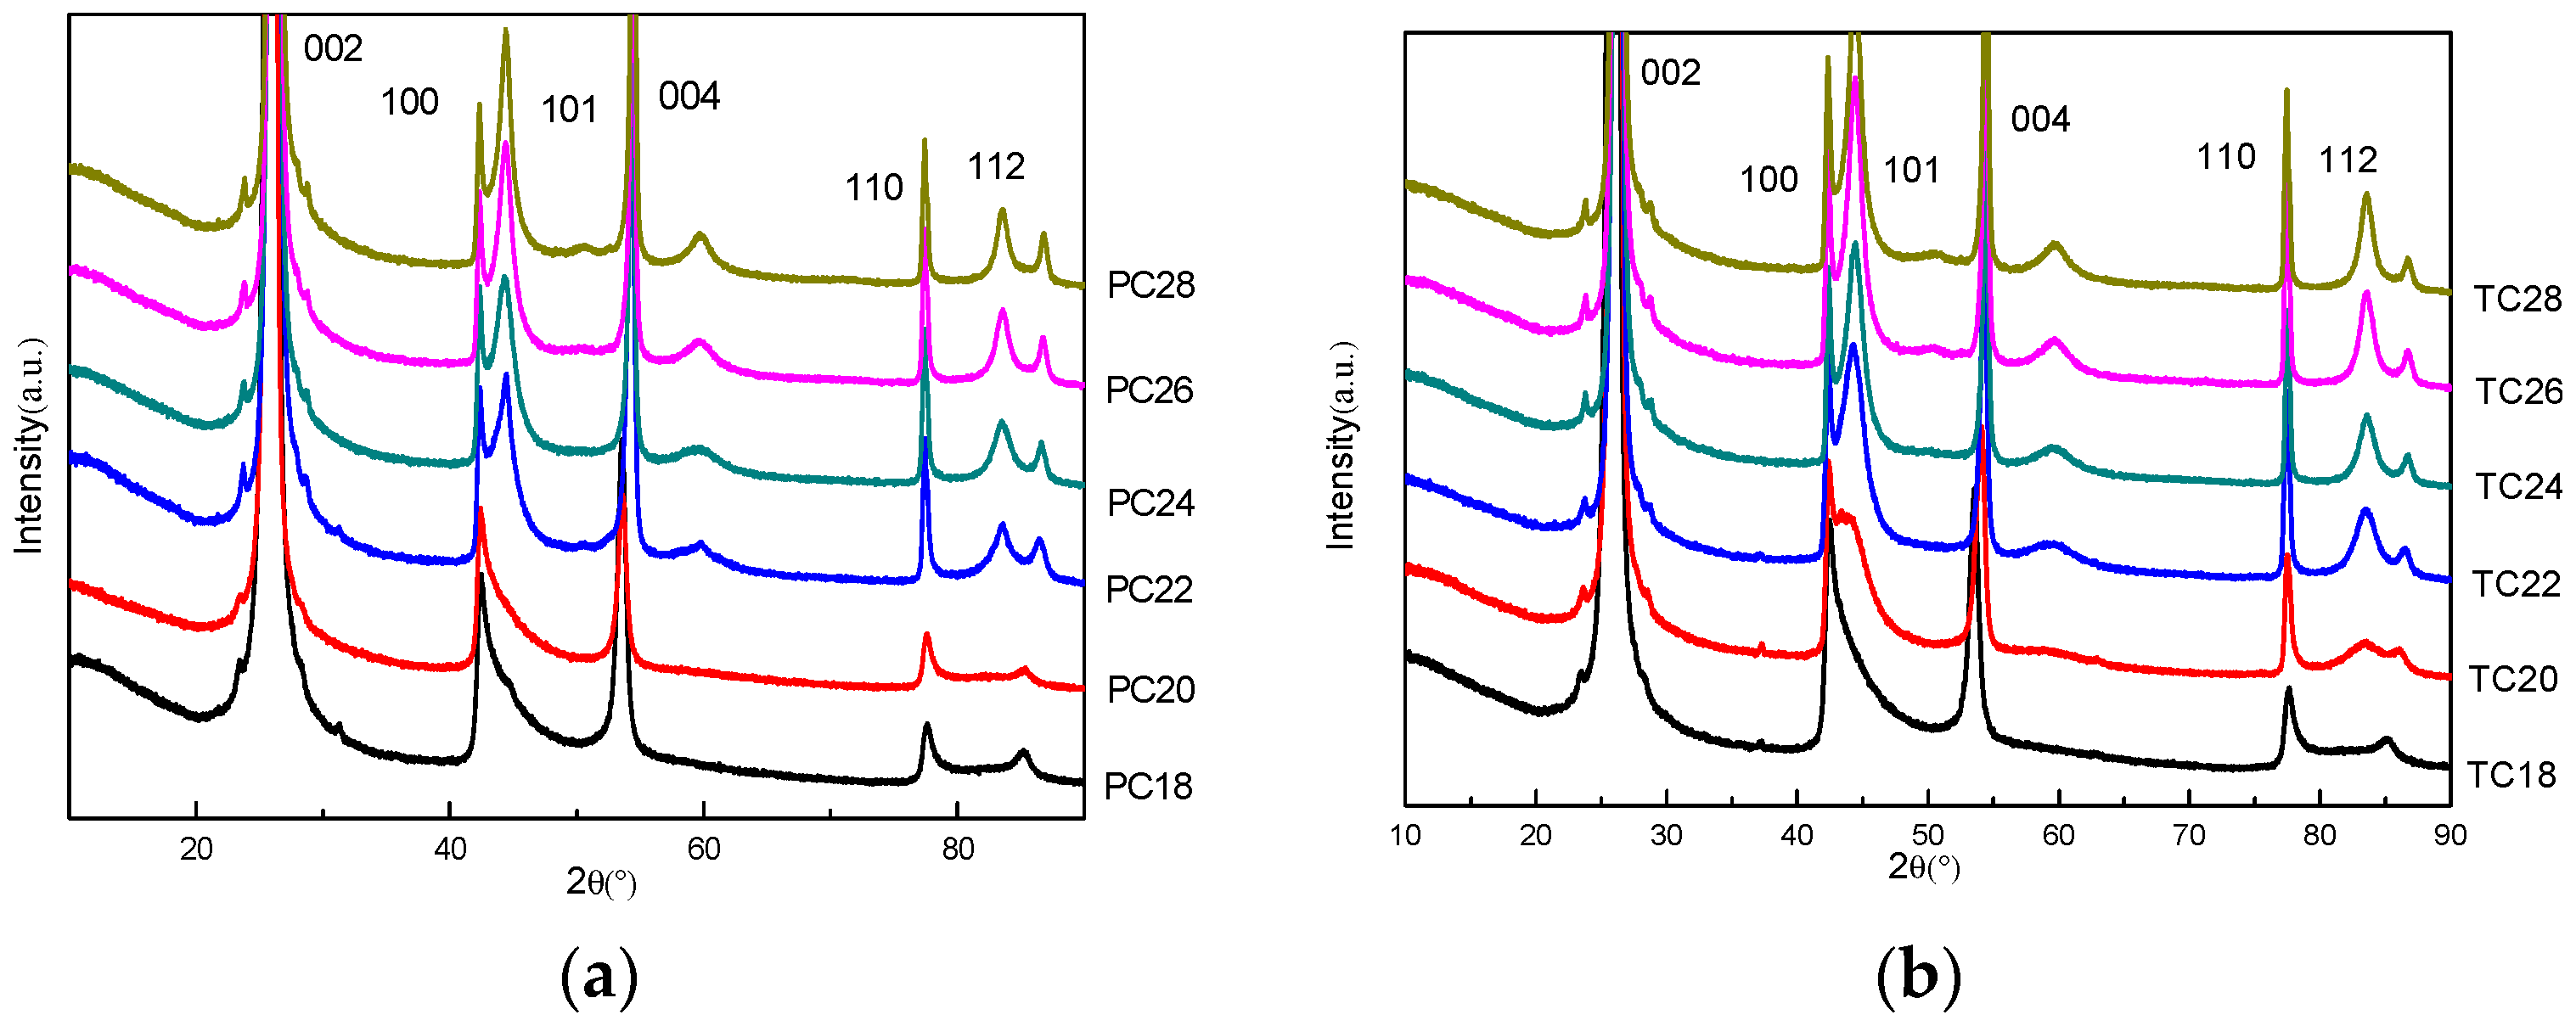
Figure 3.
Graphite lattice arrangement picture.
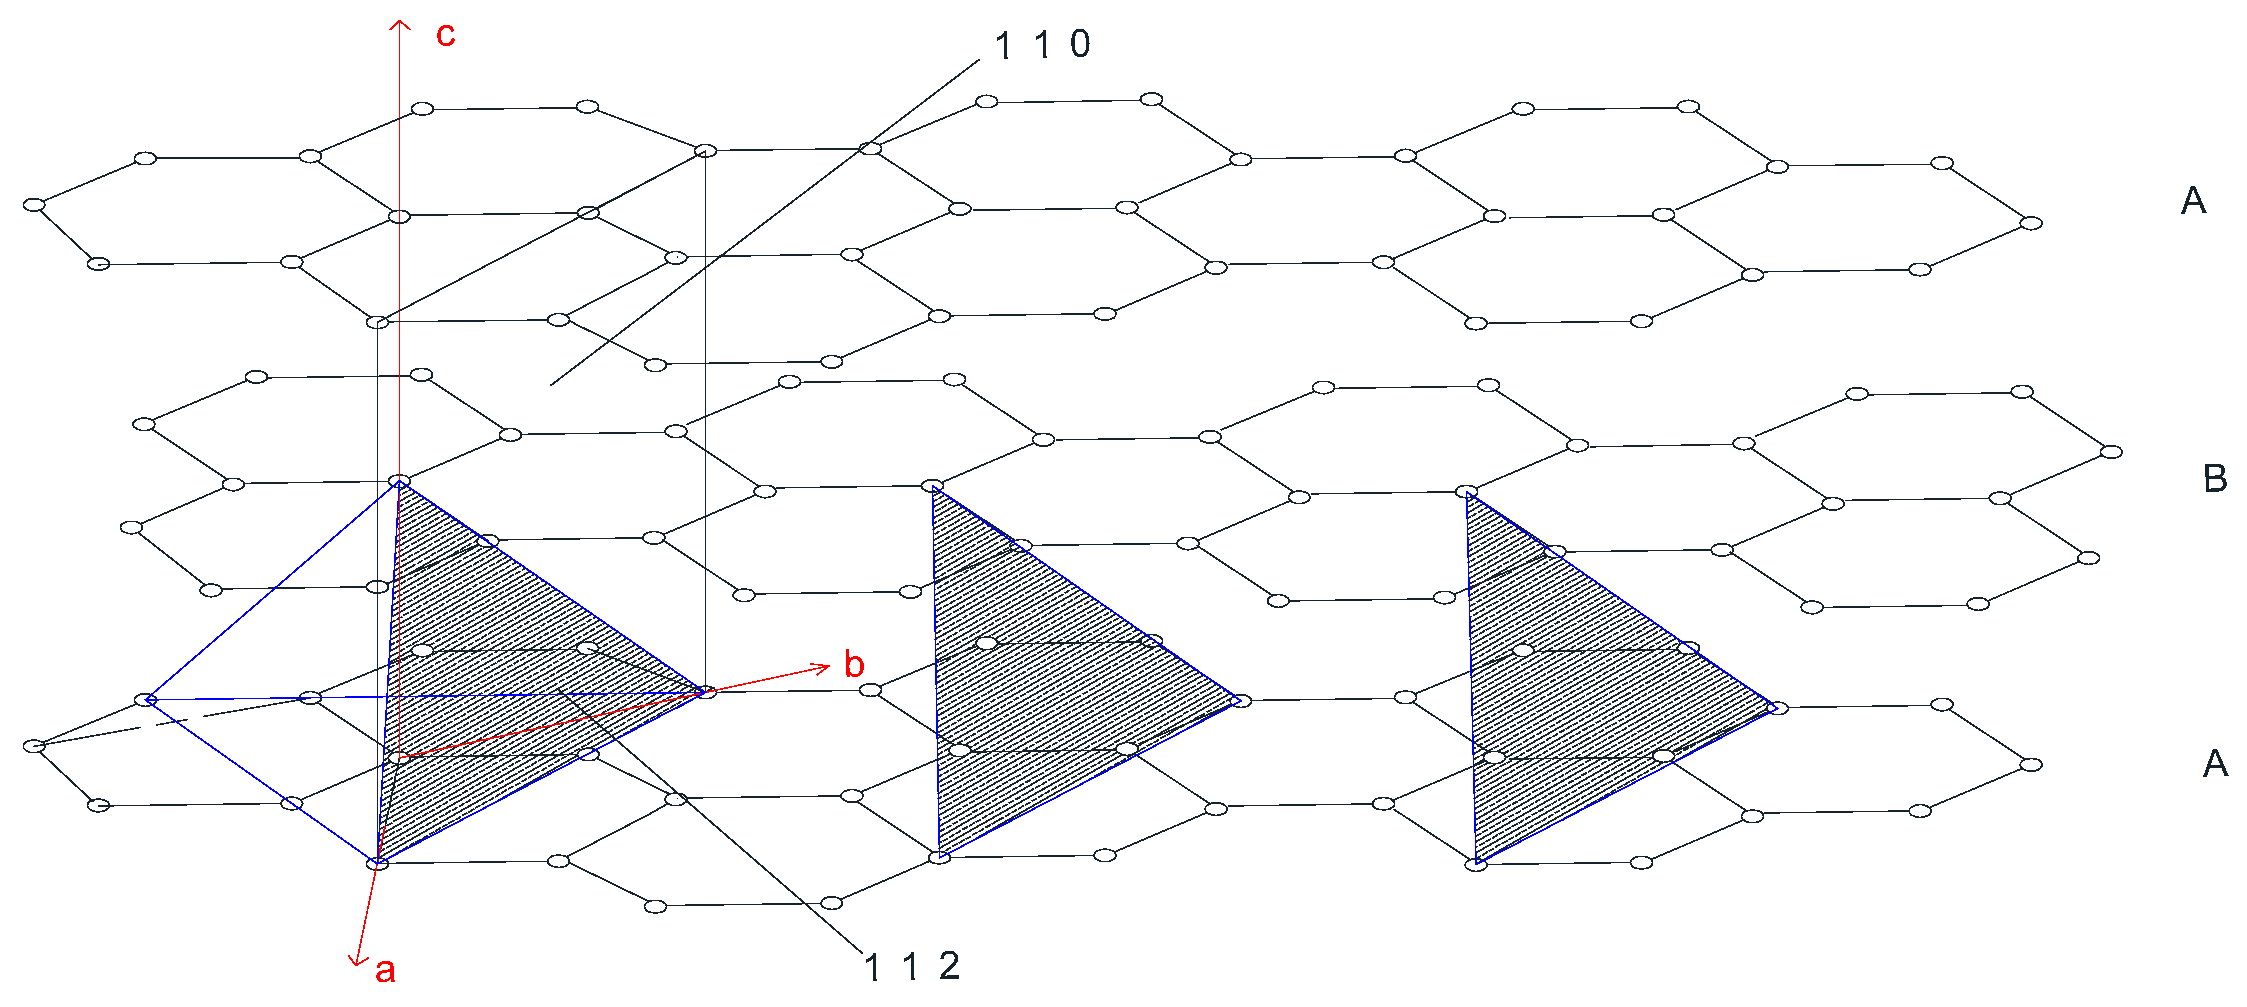
Figure 4.
Transmission electron microscopy (TEM) microstructure analysis of petroleum coke under different temperatures. (a) TEM image of PC20; (b) TEM image of PC22; (c) TEM image of PC28.
Figure 4.
Transmission electron microscopy (TEM) microstructure analysis of petroleum coke under different temperatures. (a) TEM image of PC20; (b) TEM image of PC22; (c) TEM image of PC28.
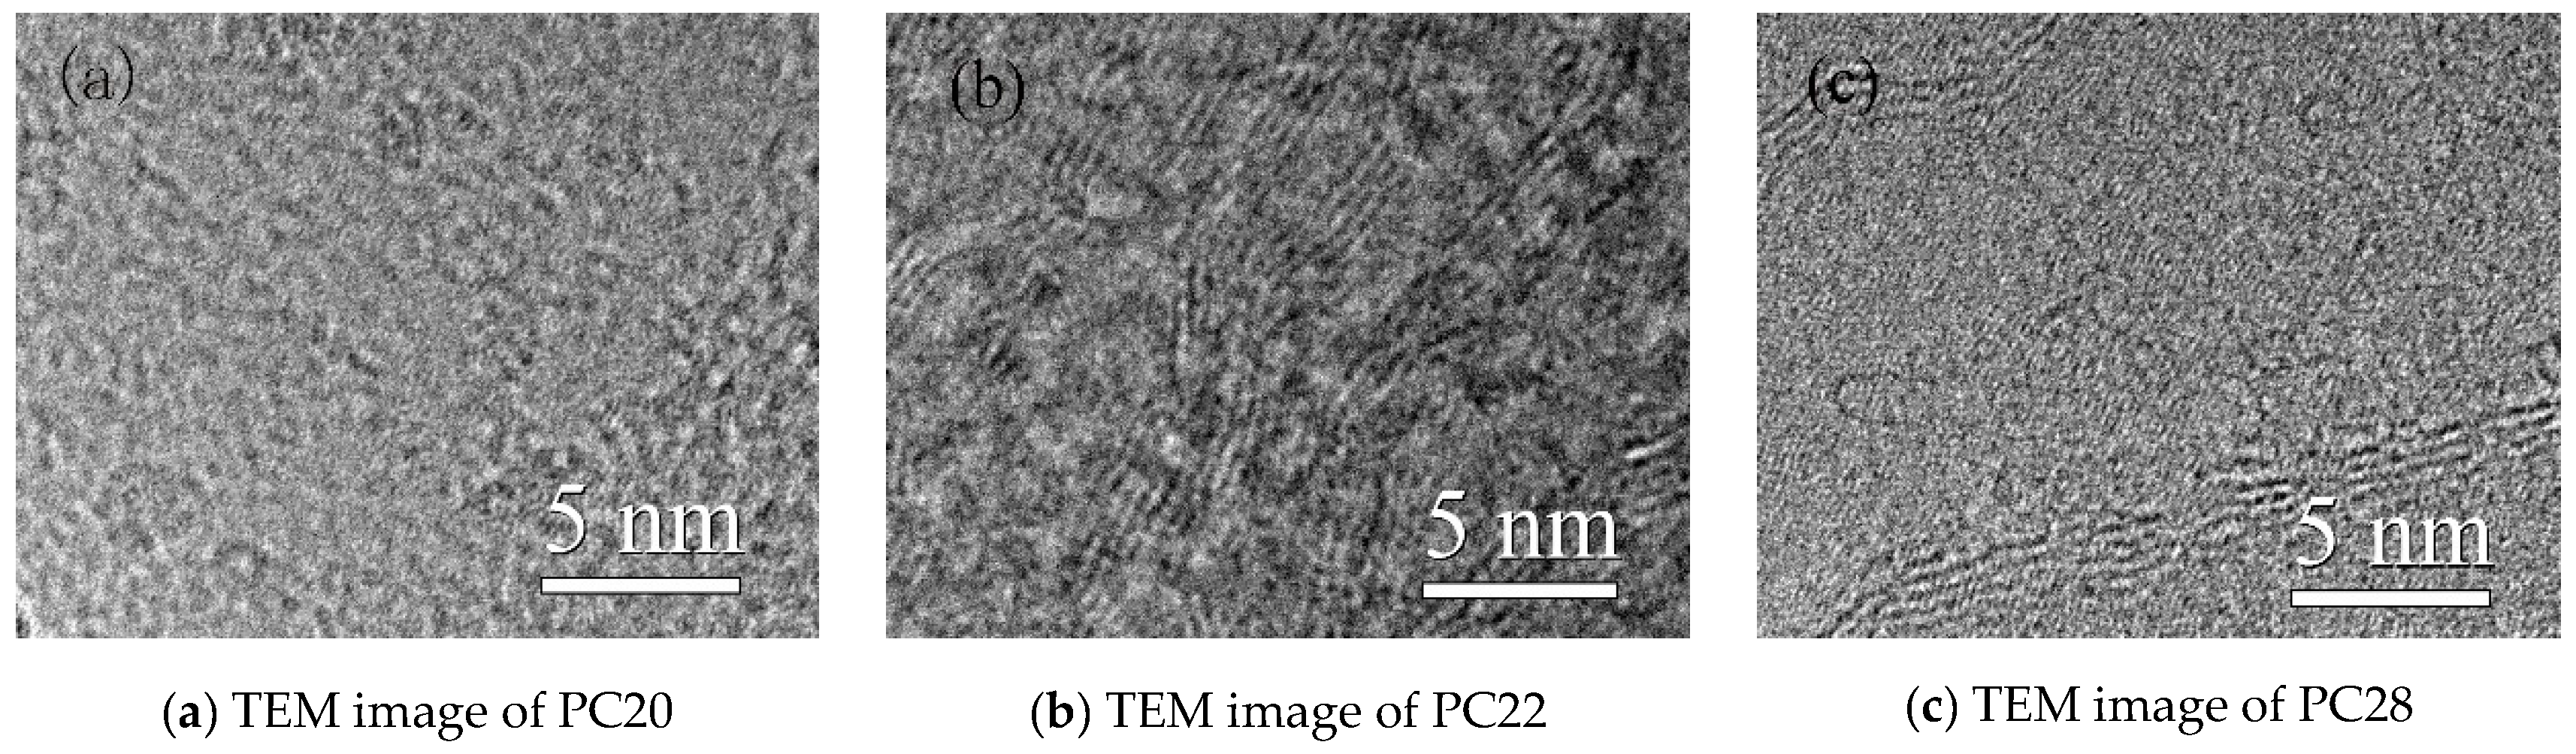
Figure 5.
Raman spectra of two kinds of coke anode materials at different temperatures. (a) Raman spectra of petroleum coke at different temperatures; (b) Raman spectra of pitch coke at different temperatures.
Figure 5.
Raman spectra of two kinds of coke anode materials at different temperatures. (a) Raman spectra of petroleum coke at different temperatures; (b) Raman spectra of pitch coke at different temperatures.
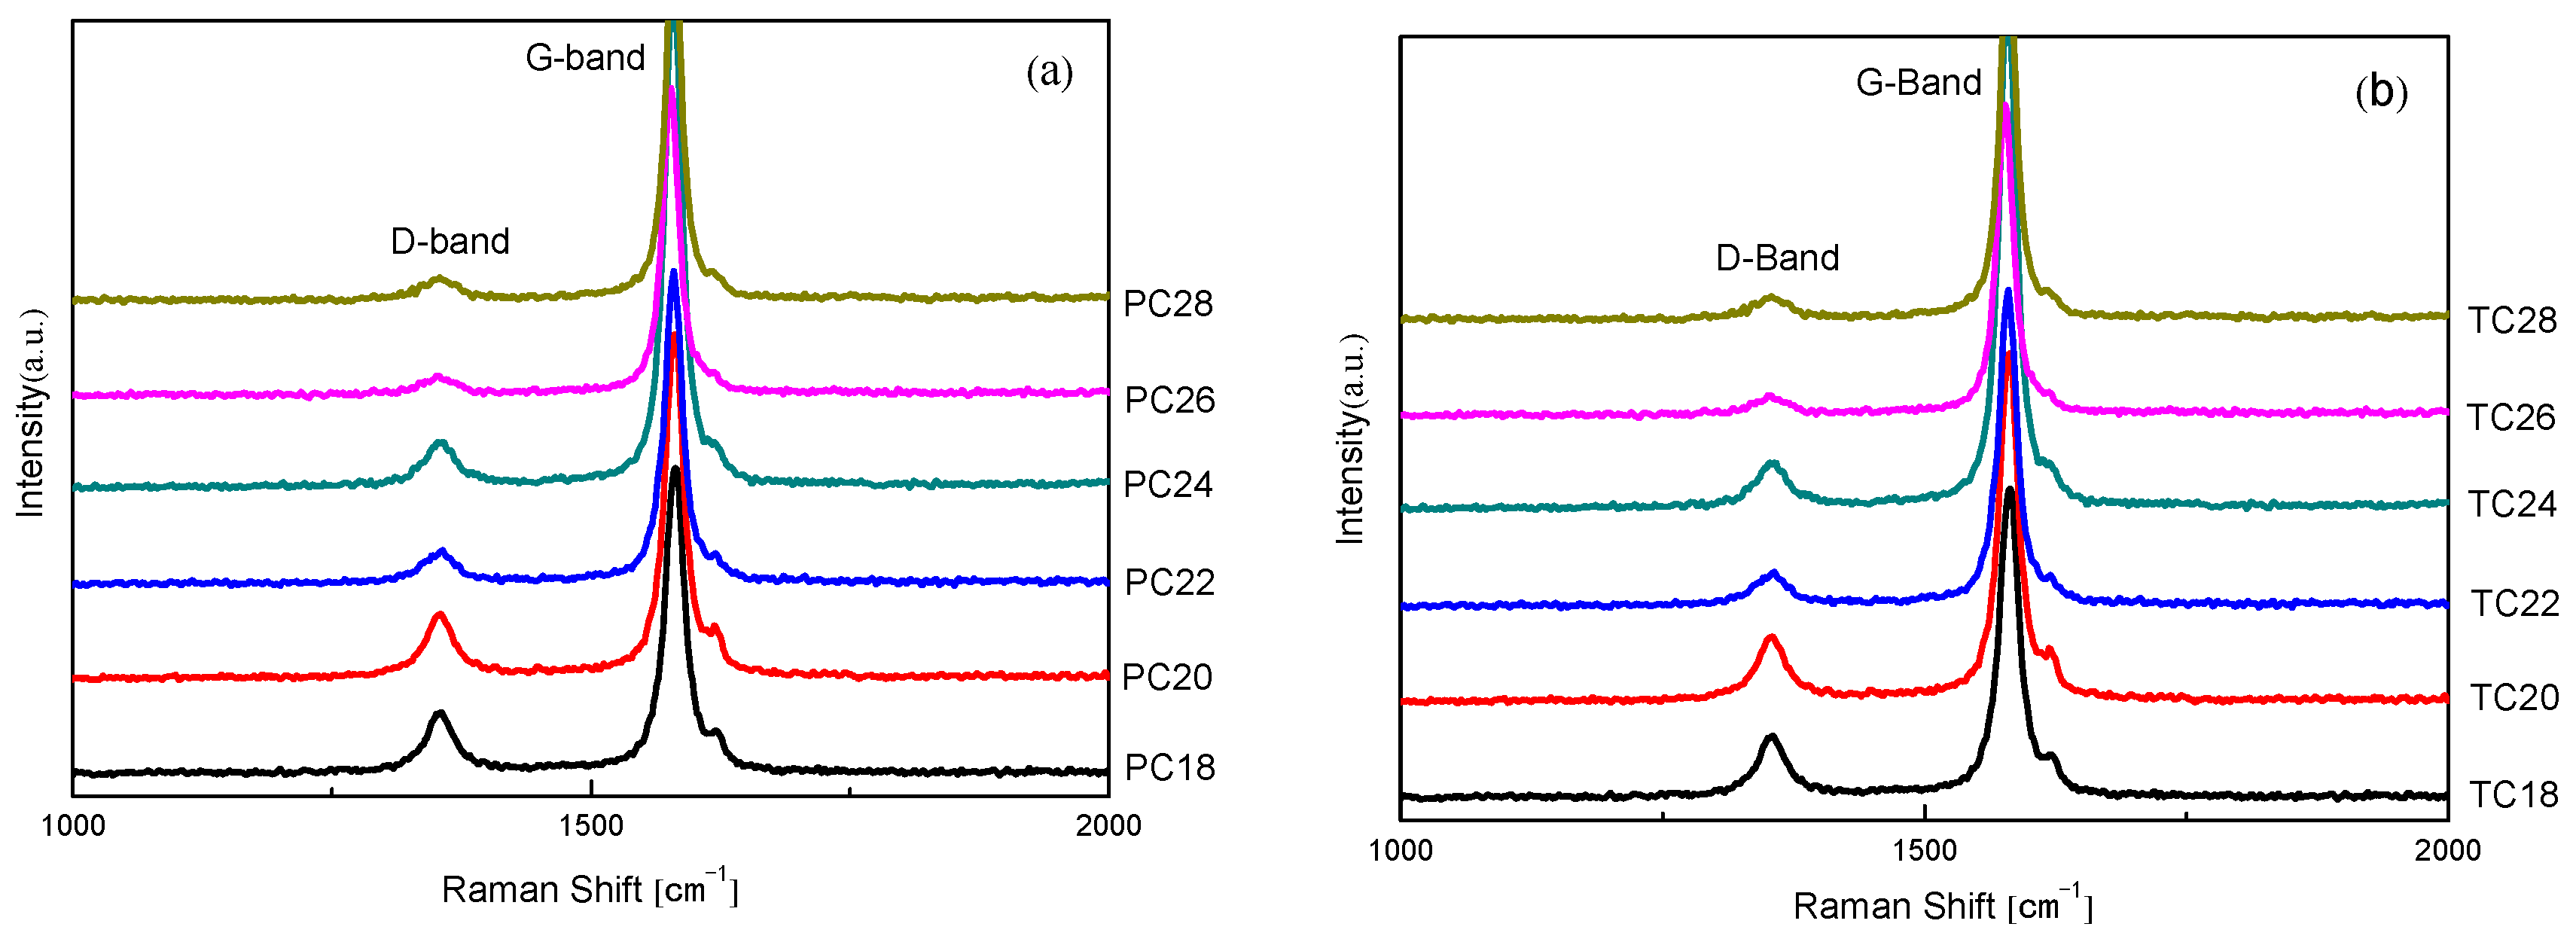
Figure 6.
The relationship between the degree of disorder results of three methods and the heat treatment temperature graph. (a) The relationship between disordering degree of petroleum coke and heat treatment temperature; (b) The relationship between disordering degree of pitch coke and heat treatment temperature.

Figure 7.
The relationships between graphitization degree and electrochemical properties of petroleum coke and pitch coke. (a) Plots of graphitization degree versus the discharge capacity for petroleum coke; (b) Plots of graphitization degree versus the discharge capacity for pitch coke; (c) Plots of graphitization degree versus the first charge/discharge efficiency for petroleum coke; (d) Plots of graphitization degree versus the first charge/discharge efficiency for pitch coke.

| Raw Material | 1800 °C | 2000 °C | 2200 °C | 2400 °C | 2600 °C | 2800 °C | |
|---|---|---|---|---|---|---|---|
| Sample Numbers | Petroleum coke | PC18 | PC20 | PC22 | PC24 | PC26 | PC28 |
| pitch coke | TC18 | TC20 | TC22 | TC24 | TC26 | TC28 |
Table 2.
Microcrystalline structure analysis of two kinds of coke anode materials at different temperatures.
| Categories | 2θ002 (°) | 2θ101 (°) | d002 (Å) | D002 (nm) | D100 (nm) | D004 (nm) | D112 (nm) |
|---|---|---|---|---|---|---|---|
| PC18 | 25.947 | 3.433 | 24.598 | 10.391 | 13.775 | ||
| PC20 | 25.934 | 3.432 | 25.371 | 10.944 | 14.108 | ||
| PC22 | 26.282 | 44.276 | 3.388 | 33.923 | 20.909 | 18.910 | 8.647 |
| PC24 | 26.328 | 44.212 | 3.382 | 37.209 | 21.386 | 25.026 | 8.788 |
| PC26 | 26.357 | 44.301 | 3.378 | 36.538 | 25.846 | 28.599 | 10.325 |
| PC28 | 26.378 | 44.337 | 3.376 | 39.391 | 26.748 | 29.364 | 12.479 |
| TC18 | 25.928 | 3.434 | 21.697 | 3.864 | 13.721 | ||
| TC20 | 26.171 | 44.031 | 3.402 | 24.772 | 2.838 | 18.130 | 2.254 |
| TC22 | 26.298 | 44.212 | 3.386 | 28.441 | 15.789 | 20.799 | 6.151 |
| TC24 | 26.354 | 44.287 | 3.379 | 29.373 | 22.305 | 23.025 | 8.339 |
| TC26 | 26.370 | 44.288 | 3.377 | 28.851 | 21.731 | 24.363 | 9.802 |
| TC28 | 26.366 | 44.306 | 3.377 | 30.716 | 28.482 | 26.322 | 10.812 |
| Categories | P1 (%) | P2 (%) | Pd002 (%) | Categories | P1 (%) | P2 (%) | Pd002 (%) |
|---|---|---|---|---|---|---|---|
| PC18 | - | - | 71.27 | TC18 | - | - | 73.23 |
| PC20 | - | - | 61.74 | TC20 | 309.85 | 44.88 | 38.22 |
| PC22 | 102.22 | 31.61 | 22.99 | TC22 | 157.74 | 27.28 | 20.92 |
| PC24 | 115.22 | 27.76 | 15.86 | TC24 | 118.02 | 21.17 | 15.92 |
| PC26 | 76.58 | 22.70 | 10.95 | TC26 | 80.21 | 19.32 | 13.49 |
| PC28 | 60.41 | 19.59 | 10.50 | TC28 | 67.50 | 18.26 | 11.81 |
| Categories | ID | IG | R (%) | PR (%) | Categories | ID | IG | R (%) | PR (%) |
|---|---|---|---|---|---|---|---|---|---|
| PC18 | 36996.633 | 132947.533 | 27.78 | 21.76 | TC18 | 14633.458 | 54986.276 | 26.61 | 21.01 |
| PC20 | 11402.538 | 42307.602 | 26.95 | 21.22 | TC20 | 11162.159 | 49591.129 | 22.50 | 18.37 |
| PC22 | 6191.185 | 36309.367 | 17.05 | 14.56 | TC22 | 5100.839 | 29241.519 | 17.43 | 14.85 |
| PC24 | 8125.216 | 57023.172 | 14.24 | 12.47 | TC24 | 6090.779 | 36191.928 | 16.82 | 14.40 |
| PC26 | 4499.386 | 37766.283 | 11.91 | 10.64 | TC26 | 2294.976 | 17445.023 | 13.15 | 11.62 |
| PC28 | 2483.245 | 24031.675 | 10.33 | 9.36 | TC28 | 4954.759 | 49667.213 | 9.97 | 9.07 |
Table 5.
The degree of disorder and lithium performance of petroleum coke and pitch coke at different heat treatment temperatures.
| Categories | PR (%) | Pd002 (%) | P1 (%) | P2 (%) | Charge/Discharge Capacity (mAh/g) | The First Charge-Discharge Efficiency (%) |
|---|---|---|---|---|---|---|
| PC18 | 21.76 | 71.27 | - | - | 179.8/210.0 | 85.6 |
| PC20 | 21.22 | 61.74 | - | - | 190.3/220.8 | 86.2 |
| PC22 | 14.56 | 22.99 | 102.22 | 31.61 | 272.9/303.9 | 89.8 |
| PC24 | 12.47 | 15.86 | 115.22 | 27.76 | 293.6/323.3 | 90.8 |
| PC26 | 10.64 | 10.95 | 76.58 | 22.70 | 309.8/341.6 | 90.7 |
| PC28 | 9.36 | 10.5 | 60.41 | 19.59 | 316.4/348.1 | 90.9 |
| TC18 | 21.01 | 73.23 | - | - | 175.8/196.6 | 89.4 |
| TC20 | 18.37 | 38.22 | - | 44.88 | 234.6/255.8 | 91.7 |
| TC22 | 14.85 | 20.92 | 157.74 | 27.28 | 285.4/308.9 | 92.4 |
| TC24 | 14.4 | 15.92 | 118.02 | 21.17 | 305.1/330.6 | 92.3 |
| TC26 | 11.62 | 13.49 | 80.21 | 19.32 | 318.3/342.6 | 92.9 |
| TC28 | 9.07 | 11.81 | 67.5 | 18.26 | 321.7/344.8 | 93.3 |
© 2017 by the authors; licensee MDPI, Basel, Switzerland. This article is an open access article distributed under the terms and conditions of the Creative Commons Attribution (CC-BY) license (http://creativecommons.org/licenses/by/4.0/).
Share and Cite
MDPI and ACS Style
Zhang, Z.; Wang, Q. The New Method of XRD Measurement of the Degree of Disorder for Anode Coke Material. Crystals 2017, 7, 5. https://doi.org/10.3390/cryst7010005
AMA Style
Zhang Z, Wang Q. The New Method of XRD Measurement of the Degree of Disorder for Anode Coke Material. Crystals. 2017; 7(1):5. https://doi.org/10.3390/cryst7010005
Chicago/Turabian StyleZhang, Zhuo, and Qi Wang. 2017. "The New Method of XRD Measurement of the Degree of Disorder for Anode Coke Material" Crystals 7, no. 1: 5. https://doi.org/10.3390/cryst7010005
Note that from the first issue of 2016, this journal uses article numbers instead of page numbers. See further details here.