Article

Crystal-Structure Analysis with Moments of the Density-of-States: Application to Intermetallic Topologically Close-Packed Phases

Atomistic Modelling and Simulation, ICAMS, Ruhr-Universität Bochum, 44801 Bochum, Germany
*
Author to whom correspondence should be addressed.
Crystals 2016, 6(2), 18; https://doi.org/10.3390/cryst6020018
Submission received: 5 November 2015 / Revised: 22 January 2016 / Accepted: 25 January 2016 / Published: 2 February 2016
(This article belongs to the Special Issue Intermetallics)

Abstract

:
The moments of the electronic density-of-states provide a robust and transparent means for the characterization of crystal structures. Using d-valent canonical tight-binding, we compute the moments of the crystal structures of topologically close-packed (TCP) phases as obtained from density-functional theory (DFT) calculations. We apply the moments to establish a measure for the difference between two crystal structures and to characterize volume changes and internal relaxations. The second moment provides access to volume variations of the unit cell and of the atomic coordination polyhedra. Higher moments reveal changes in the longer-ranged coordination shells due to internal relaxations. Normalization of the higher moments leads to constant (A15,C15) or very similar (χ, C14, C36, μ, and σ) higher moments of the DFT-relaxed TCP phases across the 4d and 5d transition-metal series. The identification and analysis of internal relaxations is demonstrated for atomic-size differences in the V-Ta system and for different magnetic orderings in the C14-Fe 2 Nb Laves phase.

1. Introduction

Many intermetallic compounds show the formation of topologically close-packed (TCP) phases. The dominant factors that govern their structural stability are the average number of valence electrons [1,2,3,4] and differences in atomic size [5,6]. This has been investigated in detail for the χ phase [7], the Laves phases [8,9,10], the A15 phase [11,12,13,14], and the σ phase [15]. The theoretical analysis of TCP phases is mostly based on density-functional theory (DFT) calculations [16,17,18,19,20,21,22,23,24,25] and approximate electronic structure methods [12,13,26,27,28,29].
The relaxations of unit cell and internal coordinates are implicitly included in the DFT calculations but are rarely characterized in detail. Existing approaches for the characterization of the atomic environment include curvilinear coordinates [30], simplex representations [31,32], symmetry functions [33], Coulomb-matrices [34], overlapping atomic functions [35], topological fingerprints [36], or Fourier series of atomic radial distribution functions [37]. A possible alternative to these purely geometrical measures are the moments [38] of the electronic density-of-states (DOS) that are well-known from recursion [39] and bond-order potentials (BOPs) [40,41,42,43,44]. For each atom in a crystal structure, the moments are determined by the set of self-returning paths of a given length. The information on the crystal structure is picked up by the paths in terms of chemical elements, bond distances and bond angles. In this manner, the moments subsume the detailed information of the positions and the local environment of the individual atoms. This has been used in the past to analyze trends of structural stability, see, e.g., [12,13,26,27,40,45,46].
Here, we use the moments to analyze the internal relaxations of the unit cells of TCP phases as obtained from DFT calculations and to establish a measure for the difference between two crystal structures. In Section 2, we outline the methodology and computational details. In Section 3, we perform a moments analysis of volume relaxations and internal relaxations due to band-filling variation across the TM series, due to atomic-size differences in V-Ta TCP phases and due to magnetic ordering in C14-Fe 2 Nb.

2. Methodology

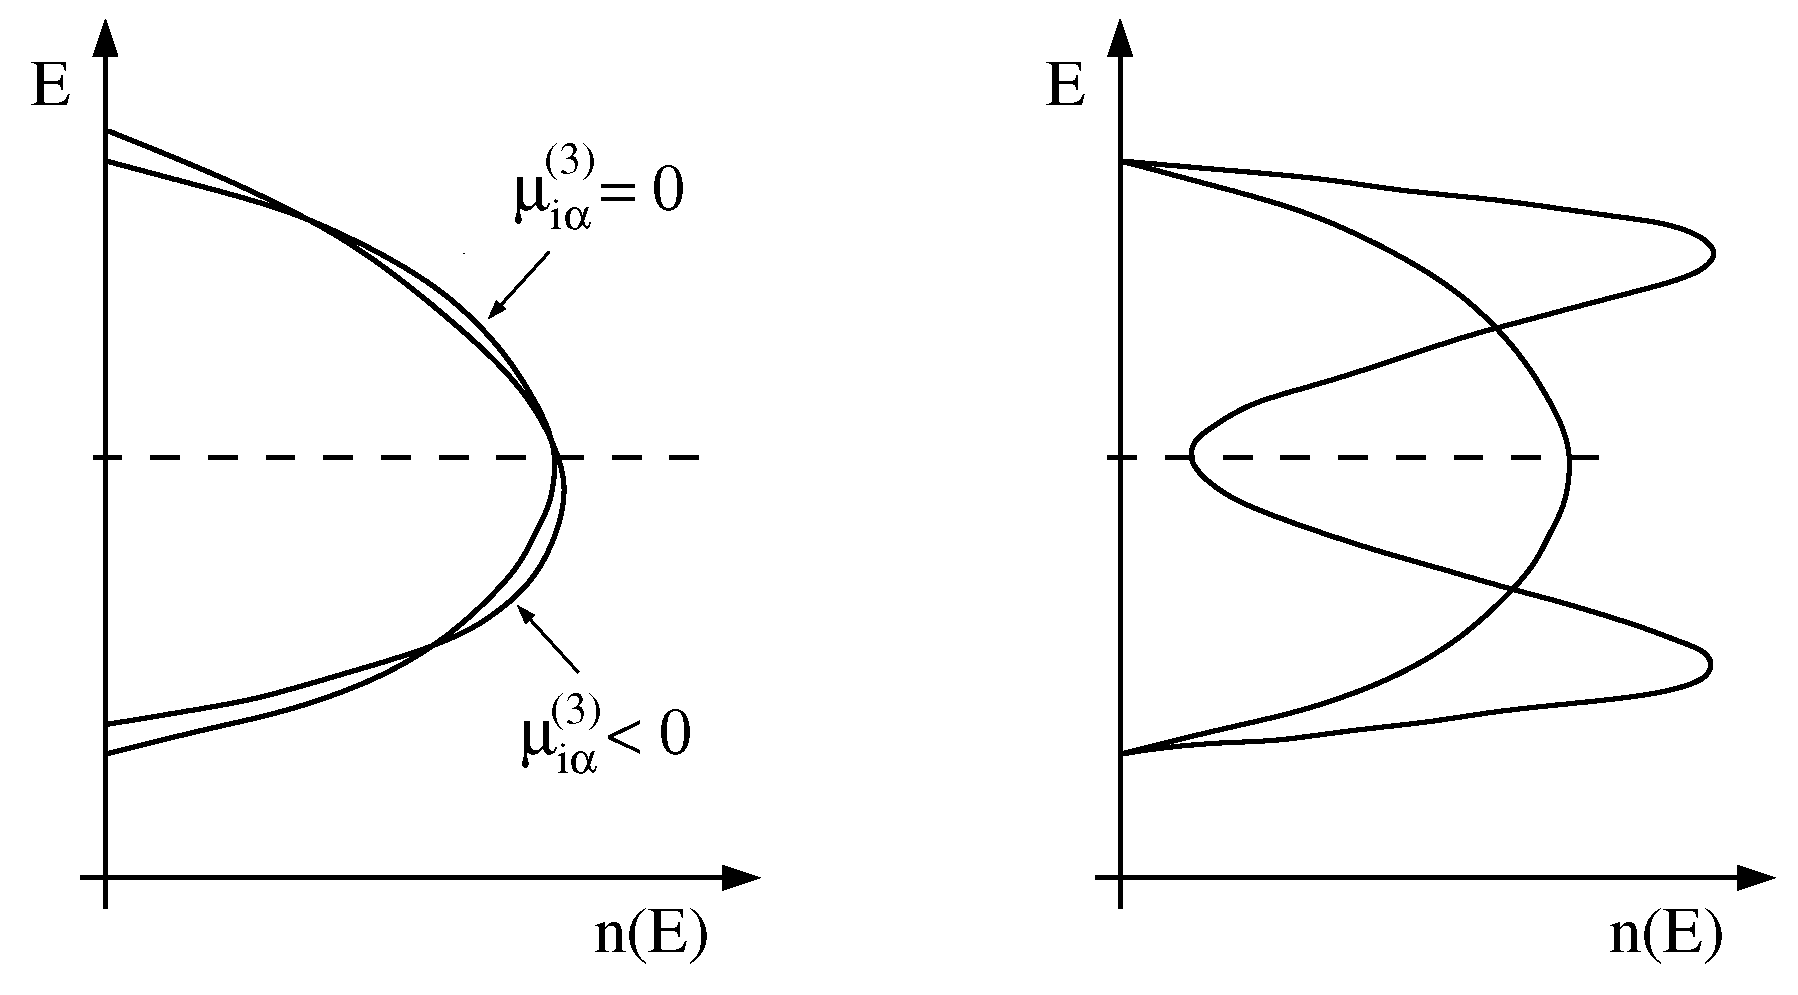
2.1. Moments of the Density-of-States

The n-th moment μ i α ( n ) of the electronic DOS n i α ( E ) of orbital α of atom i is given by
μ i α ( n ) = E n n i α ( E ) d E
The first few moments are often discussed as measures of specific properties of the distribution, i.e.,
(2) μ i α ( 0 ) = n i α ( E ) d E : norm , (3) μ i α ( 1 ) = E n i α ( E ) d E : center of gravity , (4) μ i α ( 2 ) = E 2 n i α ( E ) d E : associated to root mean square width , (5) μ i α ( 3 ) = E 3 n i α ( E ) d E : related to skewness , (6) μ i α ( 4 ) = E 4 n i α ( E ) d E : related to bimodality .
The moments are directly related to the crystal structure by the moments theorem [38]
μ i α ( n ) = i α | H ^ n | i α = j 1 β 1 . . . j n - 1 β n - 1 H i α j 1 β 1 H j 1 β 1 j 2 β 2 . . . H j n - 1 β n - 1 i α
with self-returning paths i α j 1 β 1 j 2 β 2 . . . j n - 1 β n - 1 i α from orbital α of atom i along orbitals β k of atoms j k ( k = 1 . . . n - 1 ), where the orbitals are orthogonal. Higher moments correspond to longer paths and thus to a more far-sighted sampling of the atomic environment. As different crystal structures have different sets of self-returning paths of a given length, the moments are sensitive to changes in the crystal structure. Each element of a self-returning path corresponds to a Hamiltonian matrix that carries information on atom i
H i α i α = i α | H ^ | i α
or on a pair of neighbouring atoms i and j
H i α j β = i α | H ^ | j β .
The second moment μ i α ( 2 ) is the lowest moment that contains information of the environment of an atom (the root mean square width of the DOS). It is computed from the distances to the nearest neighbors and is therefore a measure of the volume of the atom. The third moment gives rise to a skewed DOS as illustrated in Figure 1, left. The fourth moment characterizes the bimodal (in contrast to unimodal) shape of the DOS as shown in Figure 1, right.
Figure 1. The third and fourth moment gives rise to a skewing (left) and a bimodal shape (right) of the DOS.
Crystals 06 00018 g001
Knowledge of the moments allows for the construction of the electronic DOS that yields the bond energy by integration to the Fermi level as described in the framework of BOPs in various previous works [41,42,43,44]. This leads to close relations between the moments and the trends of structural stability with band filling, see e.g., [27,28,29,40,42,47,48].
For the transition-metal (TM) compounds considered in this work, we describe H i α j β in two-center approximation by d-valent canonical tight-binding (TB) [49] that provides a robust approximate description of d-d bonding across the TM series. This approach has been used before in the analysis of trends of TCP phase stability across the transition metal (TM) series [28,29]. The observations reported for TCP phases are equivalent to results using an alternative canonical TB model for d-d bonding [26,27]. Compounds with different bonding chemistry would require corresponding canonical TB models, e.g., for p-d bonding [48,50].

2.2. Computational Details

The moments analysis is performed for unit cells of TCP phases in 4d/5d unaries [29], in V-Ta [24], and in Fe-Nb [51] that were fully relaxed by density-functional theory (DFT) calculations. In all cases, we included all permutations of the occupations of Wyckoff positions with different elements. The polyhedra around the Wyckoff positions are Frank–Kasper polyhedra that are categorized according to the coordination number Z of the atom at the center of the polyhedron. The coordination polyhedra of the considered TCP phases are compiled in Table 1. Further crystallographic details may be found in [52].
Table 1. Frank–Kasper polyhedra with coordination numbers Z of the considered TCP phases, ordered by increasing average Z. The list indicates the multiplicity of the different Wyckoff positions with the same Z. The values in parentheses indicate coordination polyhedra that are not Frank–Kasper polyhedra.
StructurefccχC14C15C36μA15σbcc
Z12(1)122, 644, 6, 61, 622, 8-
Z13-(12)-------
Z14-----268, 8(1)
Z15-----2-4-
Z16-1, 4424, 42---
〈Z〉12.0013.1013.3313.3313.3313.3913.5013.5714.00
For each DFT-relaxed unit cell, the moments are computed with analytic BOP [42,44,53,54] as implemented in the BOPfox program package [55]. For the computation we choose E i α = H i α i α = 0 in order that the moments contain only geometric information as contained in the paths i α j 1 β 1 . In the context of a BOP or recursion calculation, this corresponds to a non-self-consistent calculation.
In order to achieve a consistent comparison of different crystal structures (of the same element) and different elements (with the same crystal structure), we make use of the structural energy difference theorem [40,56]. As discussed in detail in [29], this theorem states that the difference in binding energy between two equilibrium structures can be expressed to first order as
Δ U = [ Δ U b o n d ] Δ U r e p = 0
if the binding energy U is a sum of bond energy U b o n d and repulsive energy U r e p like in a tight-binding bond model [57]. Using the Wolfsberg–Helmholz assumption that the repulsive potential falls off with distance as the square of the bond integrals [40], the constraint Δ U r e p = 0 can be replaced by Δ μ ( 2 ) = 0 , see e.g., [29]. Such a constant value of the second moment, averaged over the atoms in the crystal structures, is enforced by scaling all moments through division by the average second moment. While originally developed for differences in energy, we employ this scaling in order to separate volume changes and internal relaxations.

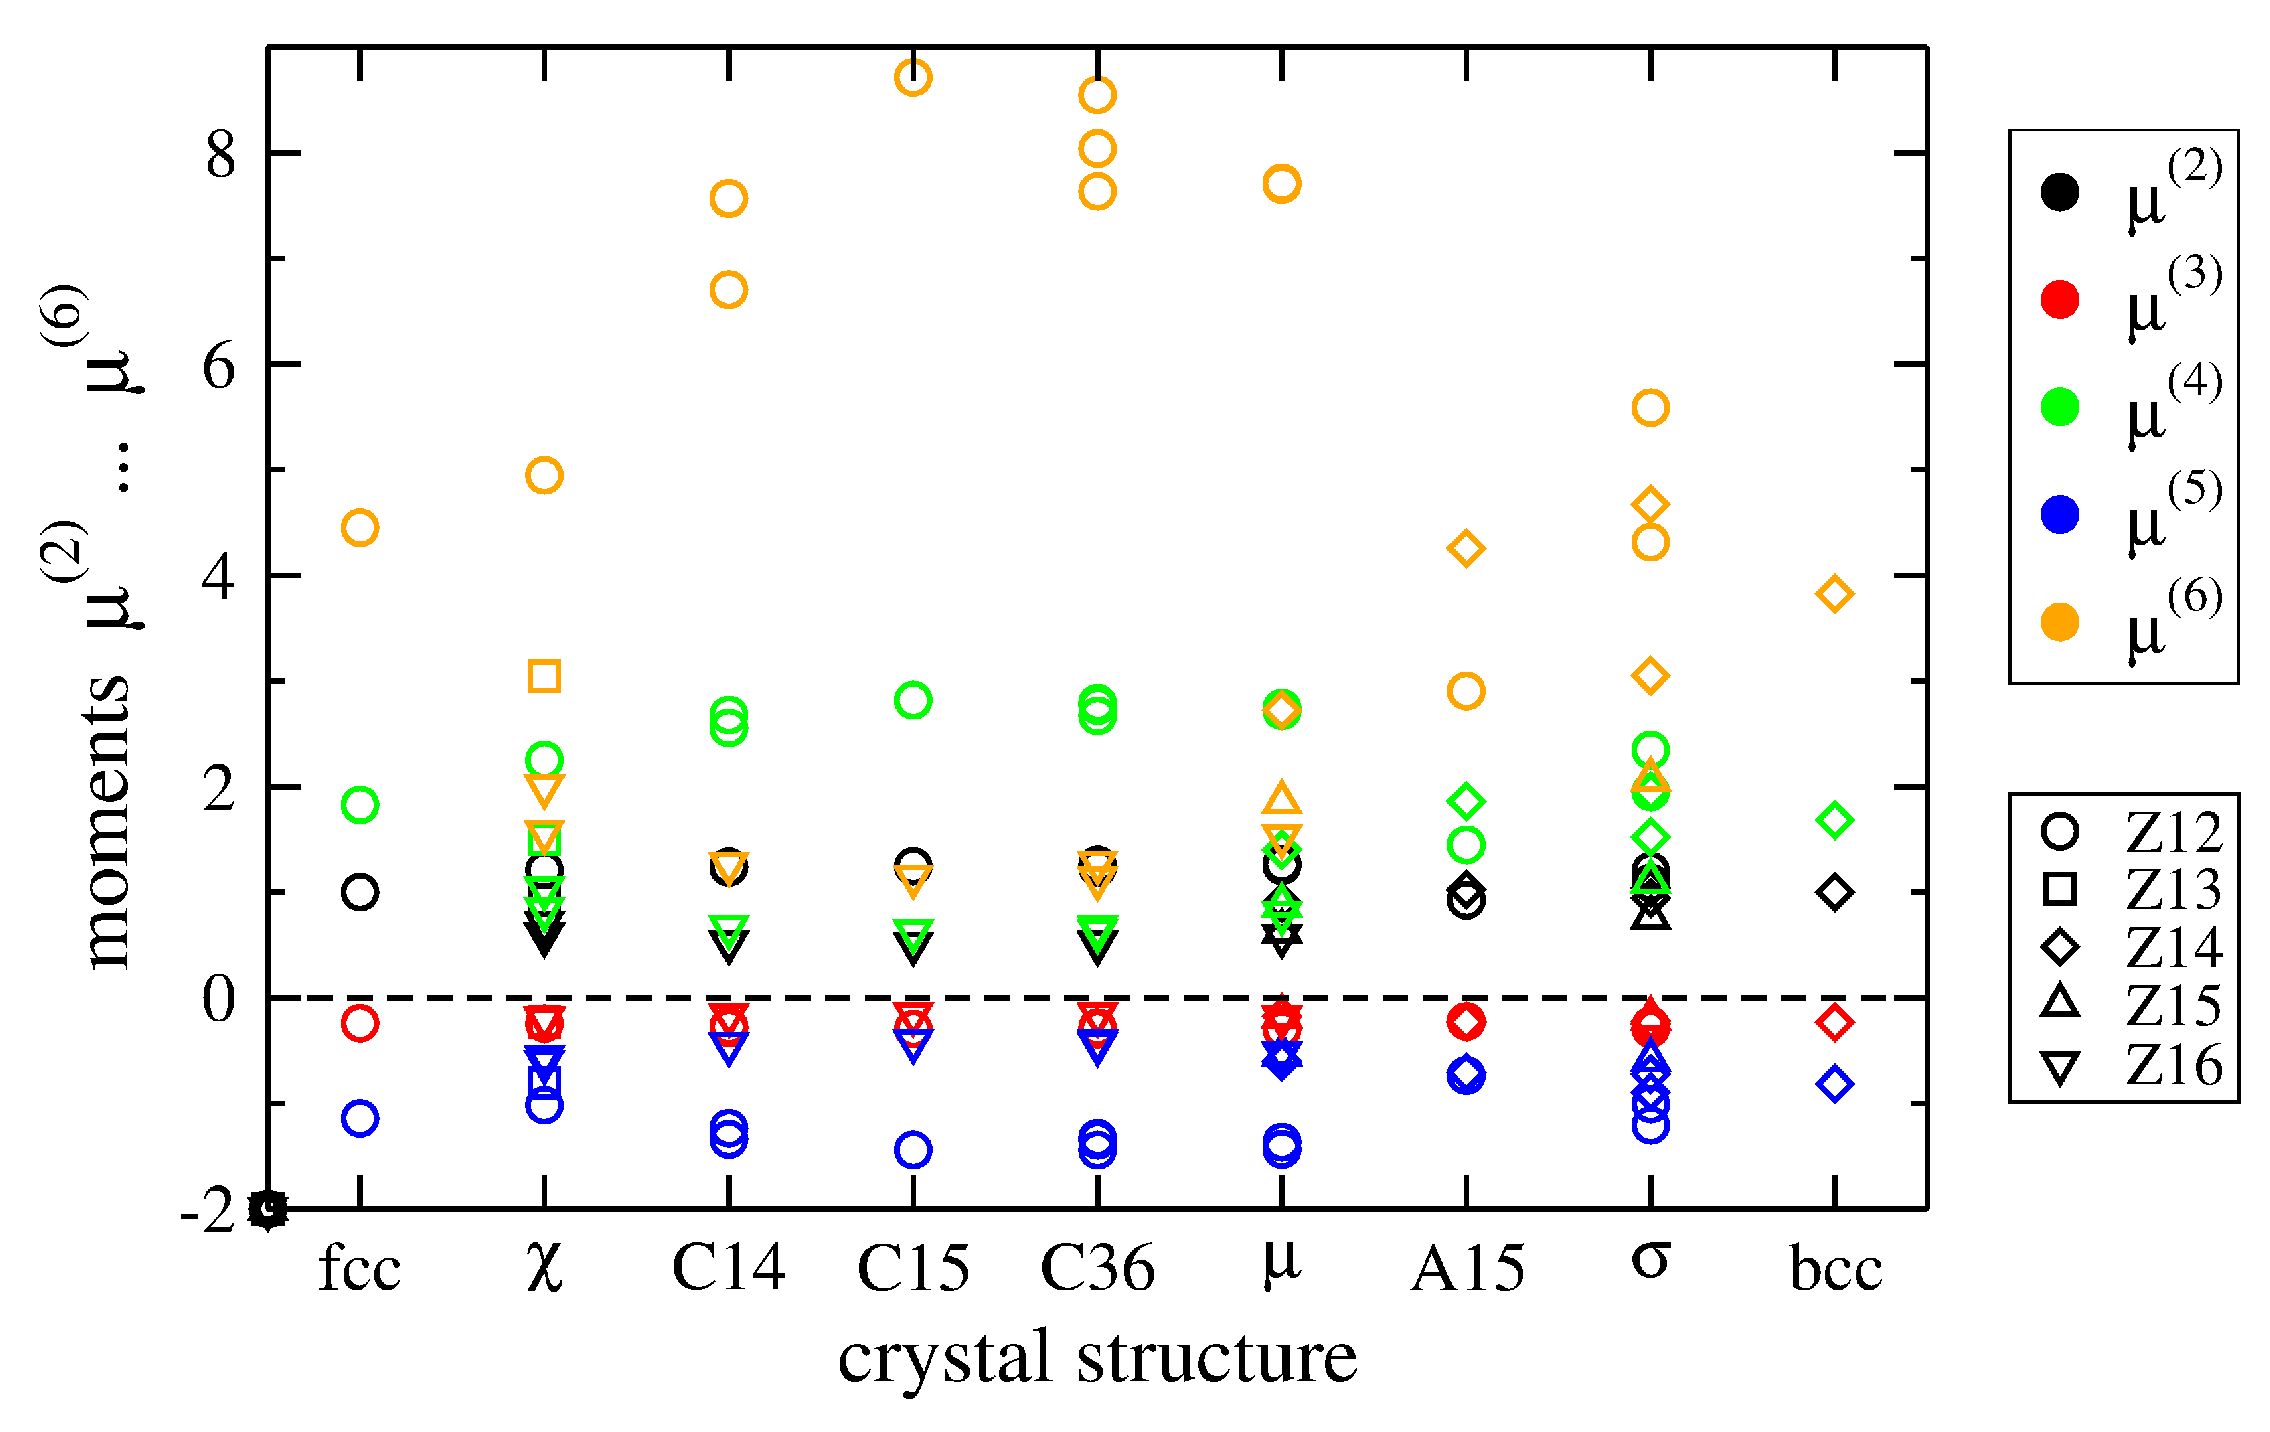
2.3. Moments of TCP Phases

In order to demonstrate that the moments provide a robust approach to analyze the crystal structure, we computed the moments of the DFT-relaxed unit cells of Ta in different TCP crystal structures [29] using a canonical d-valent TB model [49]. Other 4d/5d TM yield very similar results (see Section 3.1). In Figure 2 we compiled the second to sixth moments of fcc, bcc and the TCP phases χ, C14, C15, C36, μ, A15, and σ as obtained from the DFT-relaxed unit cells. Modifications of the atomic positions due to, e.g., magnetism (see Section 3.3) or spin-orbit coupling, are reflected in the moments.
Figure 2. Second to sixth moments (colors) computed with a canonical d-valent TB model for DFT-relaxed crystal structures of Ta. Several values of the same moment (symbols) reflect the different environments of different Wyckoff positions. (This color coding is used in all following figures.)
Crystals 06 00018 g002
The moments were scaled to exhibit a constant average second moment μ ( 2 ) = 1 for each TCP phase. The first moment takes a constant value of zero by construction and is therefore omitted in the plot. The results of fcc and bcc show a single value for each moment as only one Wyckoff position is present, see Table 1 for comparison. The TCP phases comprise several Wyckoff positions, therefore, for each n-th moment, several values are shown for one crystal structure, which reflects the different atomic environments of the different Wyckoff positions. This can be illustrated, e.g., by considering the Laves phases (C14, C15, C36) that exhibit only Z12 and Z16 polyhedra. The considerable volume difference of these polyhedra manifests itself as a pronounced difference of the respective second moments of the Laves phases in Figure 2. At higher moments, the C15 phase with two Wyckoff positions continues to show two distinct values, while the higher moments for C14 and C36 split further according to their three and five Wyckoff positions, respectively. The A15 phase, in contrast, shows very similar values of the second moment for both Wyckoff positions that correspond to Z12 and Z14 polyhedra of comparable size.
The moments provide access to a quantitative comparison of the crystal structure of TCP phases, e.g., by considering the set of n = 1 n max averaged moments of structure i as vector and evaluating the distance
Δ i j ( n max ) = n = 1 n max μ i ( n ) - μ j ( n ) n 2 n 2
of two TCP phases i and j in moments space. Here, we normalized the moments with n 2 n in order to balance their relative contribution to Δ i j ( n max ) . The values of Δ i j ( 6 ) obtained with the moments of Figure 2 are compiled in Table 2.
Table 2. Similarity matrix of TCP phases in terms of the distance in moments space Δ i j . The entries are ordered by increasing difference to bcc. The symmetric lower-left part is omitted for brevity. The grey scale reflects the numerical entries and is included to guide the eye.
Δ i j ( 6 ) · 100 bccχσA15fccμC14C36C15
bcc0.0000.2260.3040.3620.8851.3651.6191.9822.301
χ-0.0000.2200.3150.8081.3011.5501.9222.247
σ--0.0000.2900.6621.1241.3781.7472.069
A15---0.0000.8181.1611.4031.7692.091
fcc----0.0000.6550.8861.2361.546
μ-----0.0000.2570.6230.947
C14------0.0000.3750.702
C36-------0.0000.327
C15--------0.000
Ordering the columns of the similarity matrix (Table 2) by the structural difference to bcc, we observe a nearly perfect arrangement of increased structural difference with increased distance to the diagonal of the similarity matrix. The structural similarities are also in line with previously reported trends of energy differences in [29]. The two groups of TCP phases, (i) χ, σ, A15 that are mainly stabilized by band filling and (ii) μ, C14, C36, C15 that are stabilized significantly by atomic-size mismatch, show small values of Δ i j ( 6 ) for TCP phases of the same group and large values for TCP phases of different groups.

3. Moments Analysis of Volume Changes and Internal Relaxations

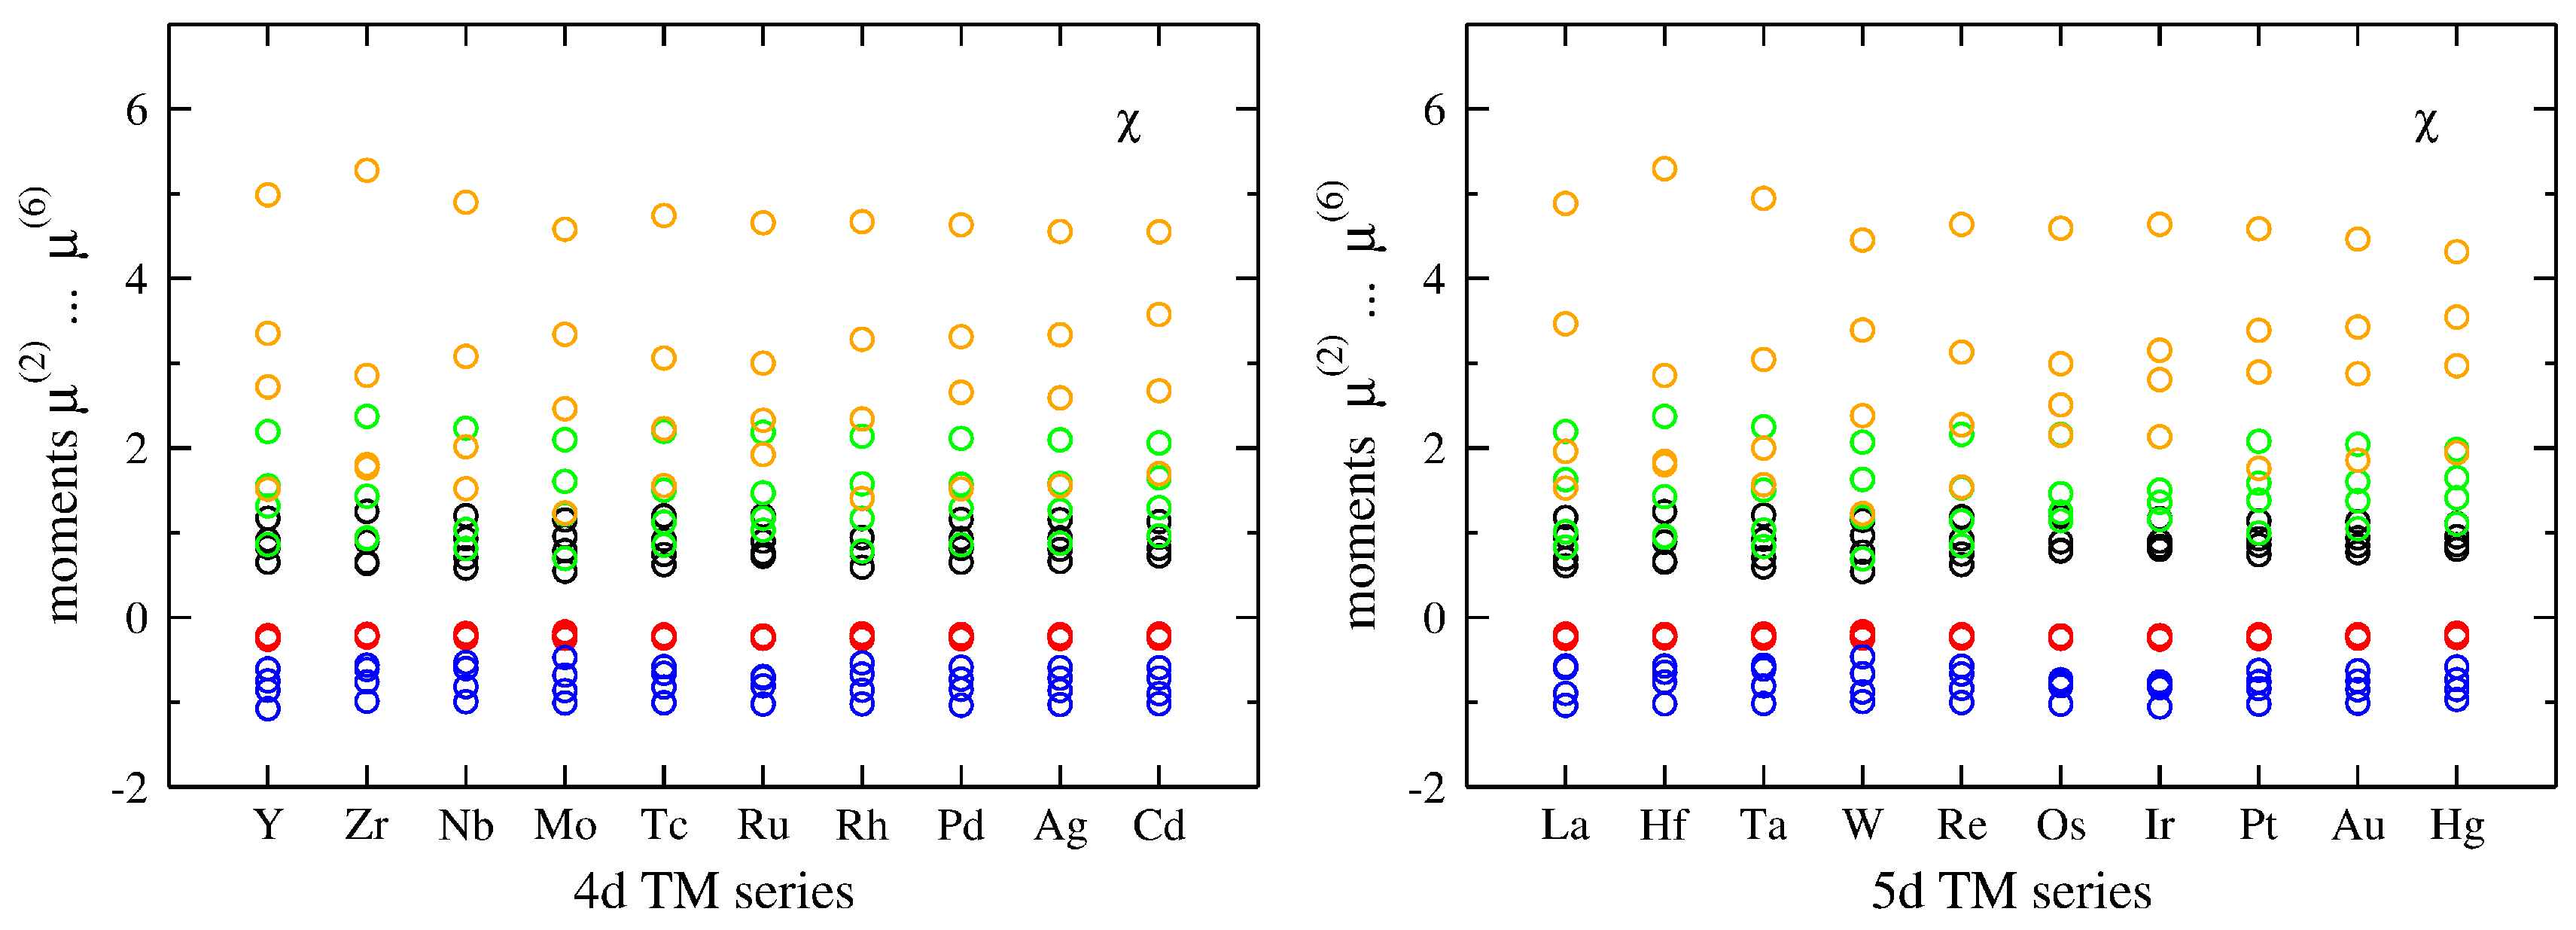
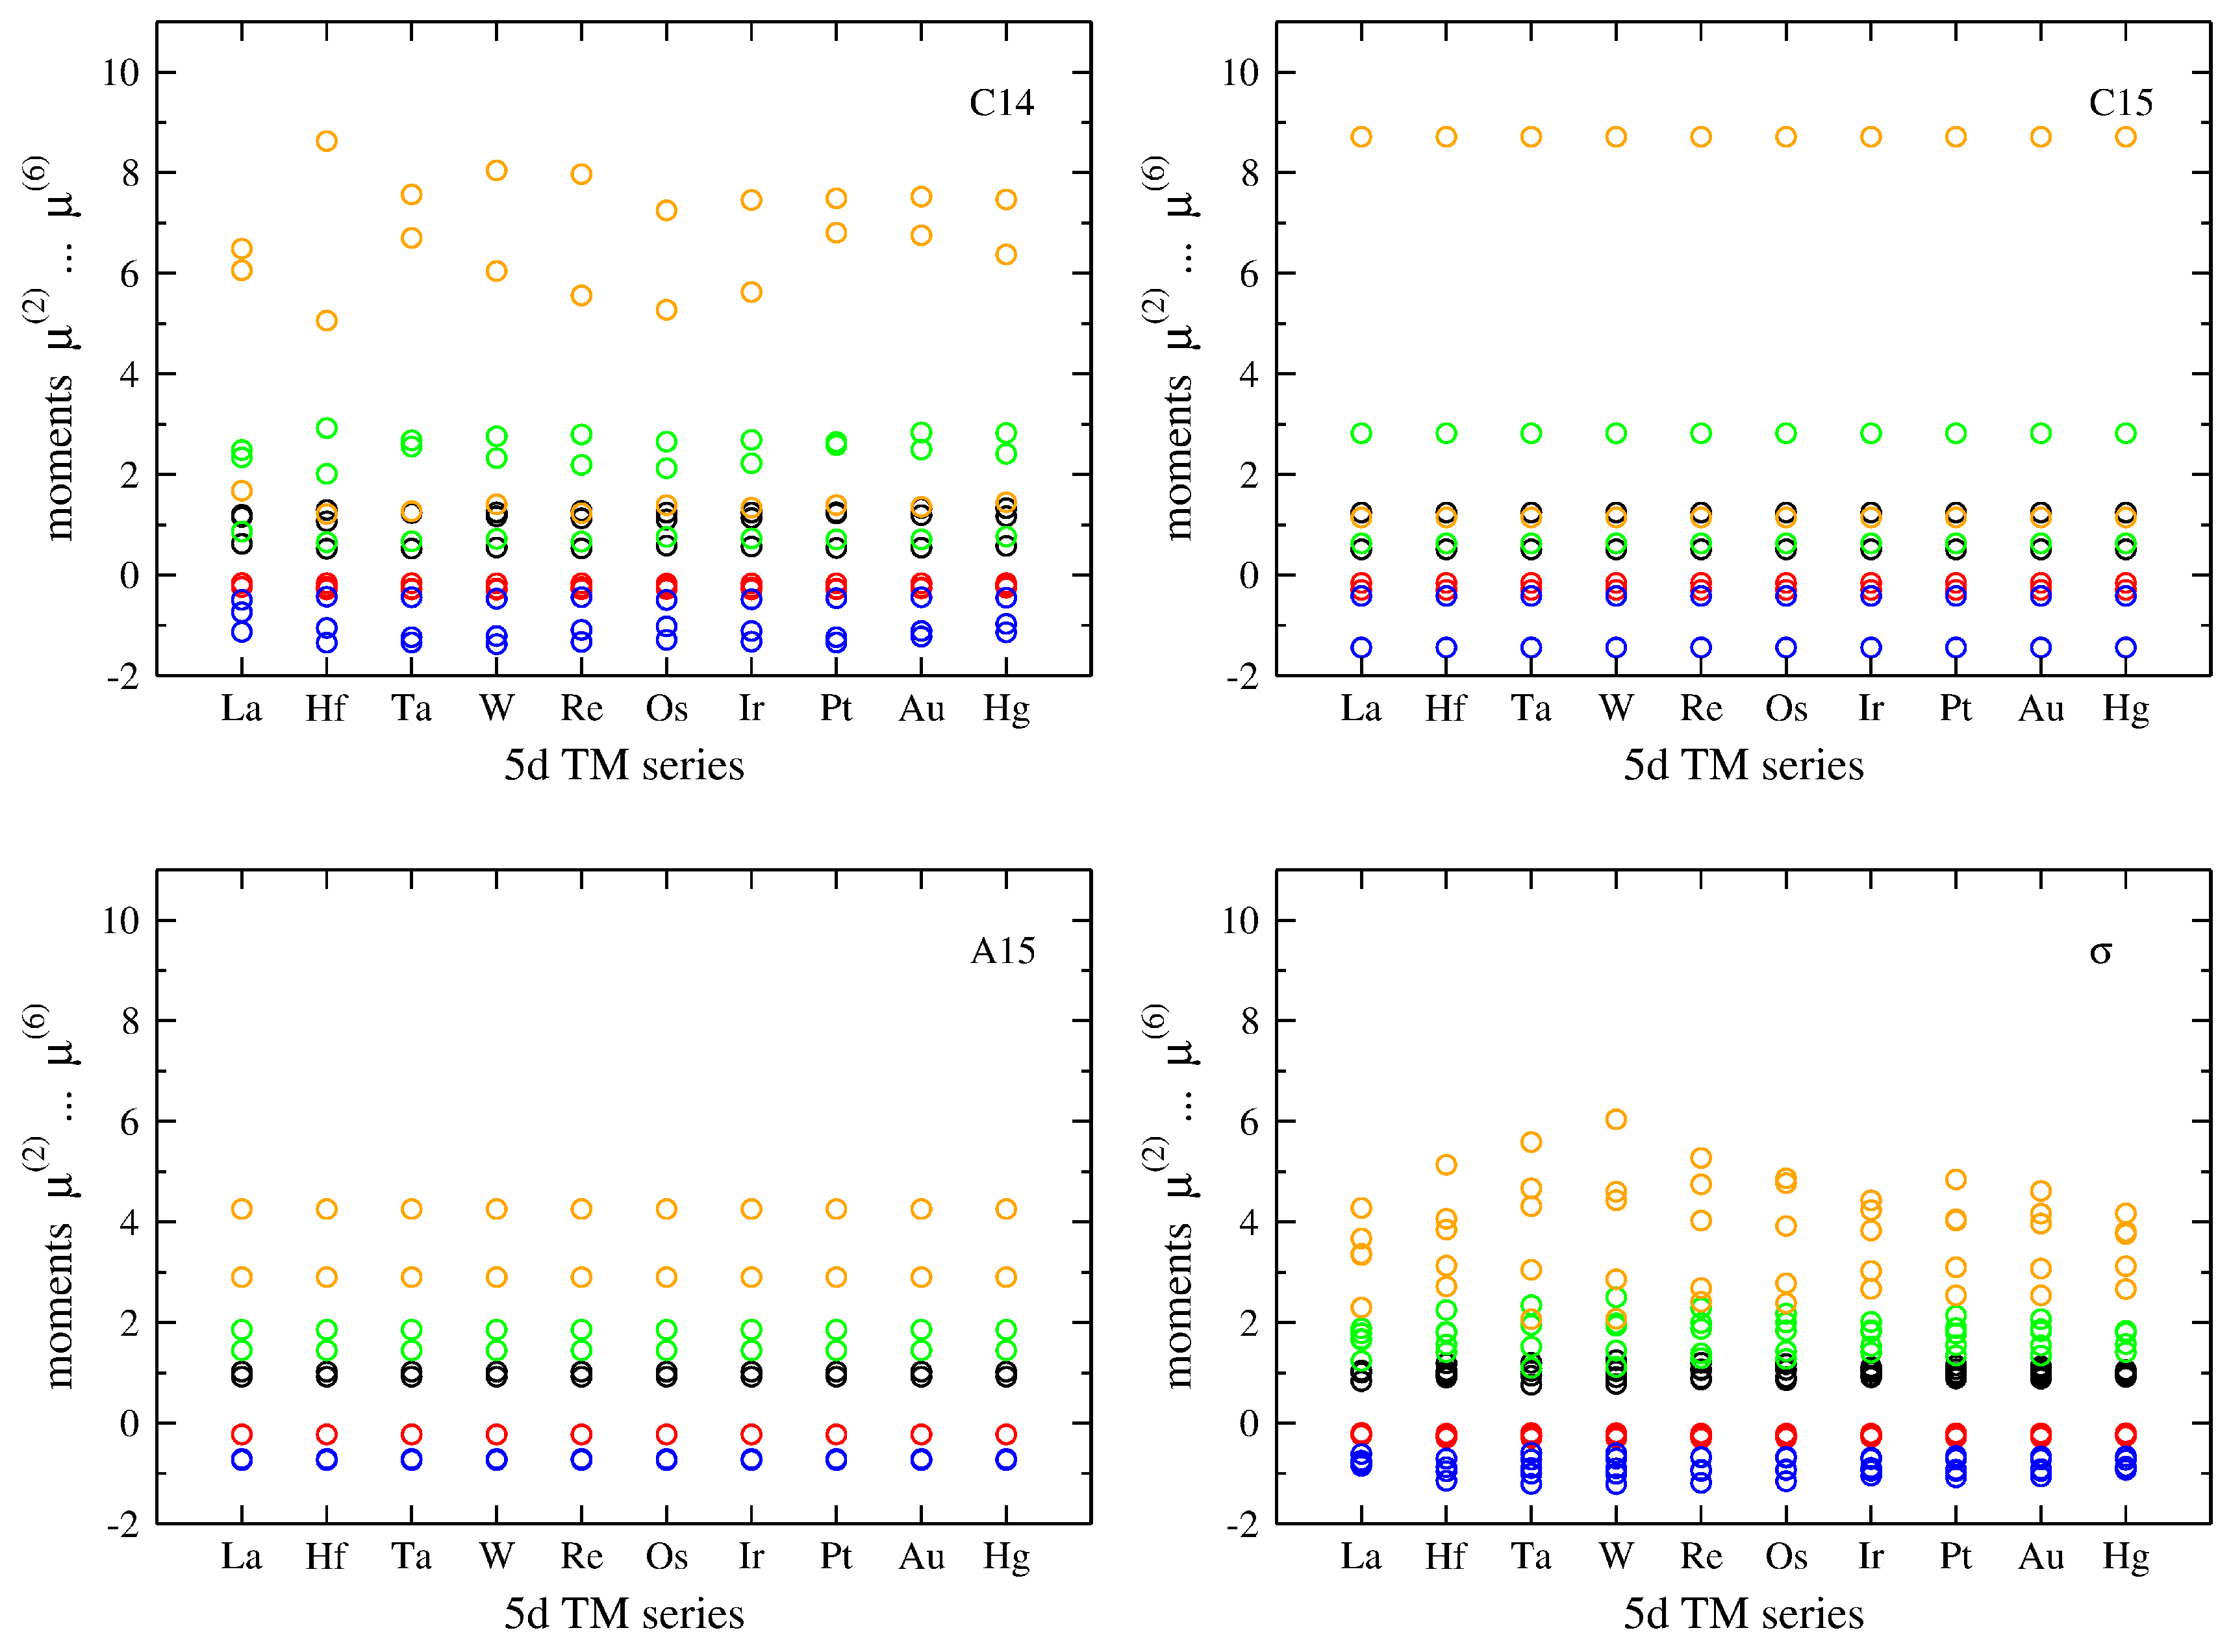
3.1. Influence of Band Filling across TM Series

The robustness of the moments can be verified by comparing the results for the same TCP phase of different elements. To this end, we revisit DFT calculations of unary TCP phases across the TM series [29] and compute the moments of the unit cells as obtained from fully relaxed crystal structures. In Figure 3, we compiled the values of the second to sixth moment of the C14, C15, A15 and σ phases as examples.
The moments of the C15 and A15 phases are constant across the TM series due to the scaling (Section 2.2) and the absence of internal degrees of freedom. The C14 and σ phases, in contrast, show variations of the moments across the TM series due to the relaxation of the atoms inside the unit cells. However, the results shown in Figure 3 indicate that these changes are small as the lower moments remain fairly constant and only the fifth and sixth moment show a sizeable variation. These observations hold for the 4d TM series as illustrated by a comparison for the case of the χ phase in Figure 4.
Figure 3. Trend of second to sixth moments of unary C14 (top left), C15 (top right), A15 (bottom left) and σ (bottom right) phases across the 5d TM series. The values were computed from the DFT-relaxed unit cells and scaled such that μ ( 2 ) = 1 . (for color coding, see Figure 2.)
Crystals 06 00018 g003
Figure 4. Comparison of second to sixth moments of the χ phase across the 4d (left) and 5d (right) TM series using the DFT-relaxed unit cells with scaling such that μ ( 2 ) = 1 . (for color coding, see Figure 2.)
Crystals 06 00018 g004
The magnitude of variation of the moments across the TM series for the χ phase is similar to the findings for the C14 and σ phases (Figure 3). The differences between isovalent 4d and 5d TM elements (e.g., Nb and Ta) are small even for the higher moments. The 3d TM series is omitted in this comparison due to the influence of magnetism on the atomic relaxation (see also Section 3.3).

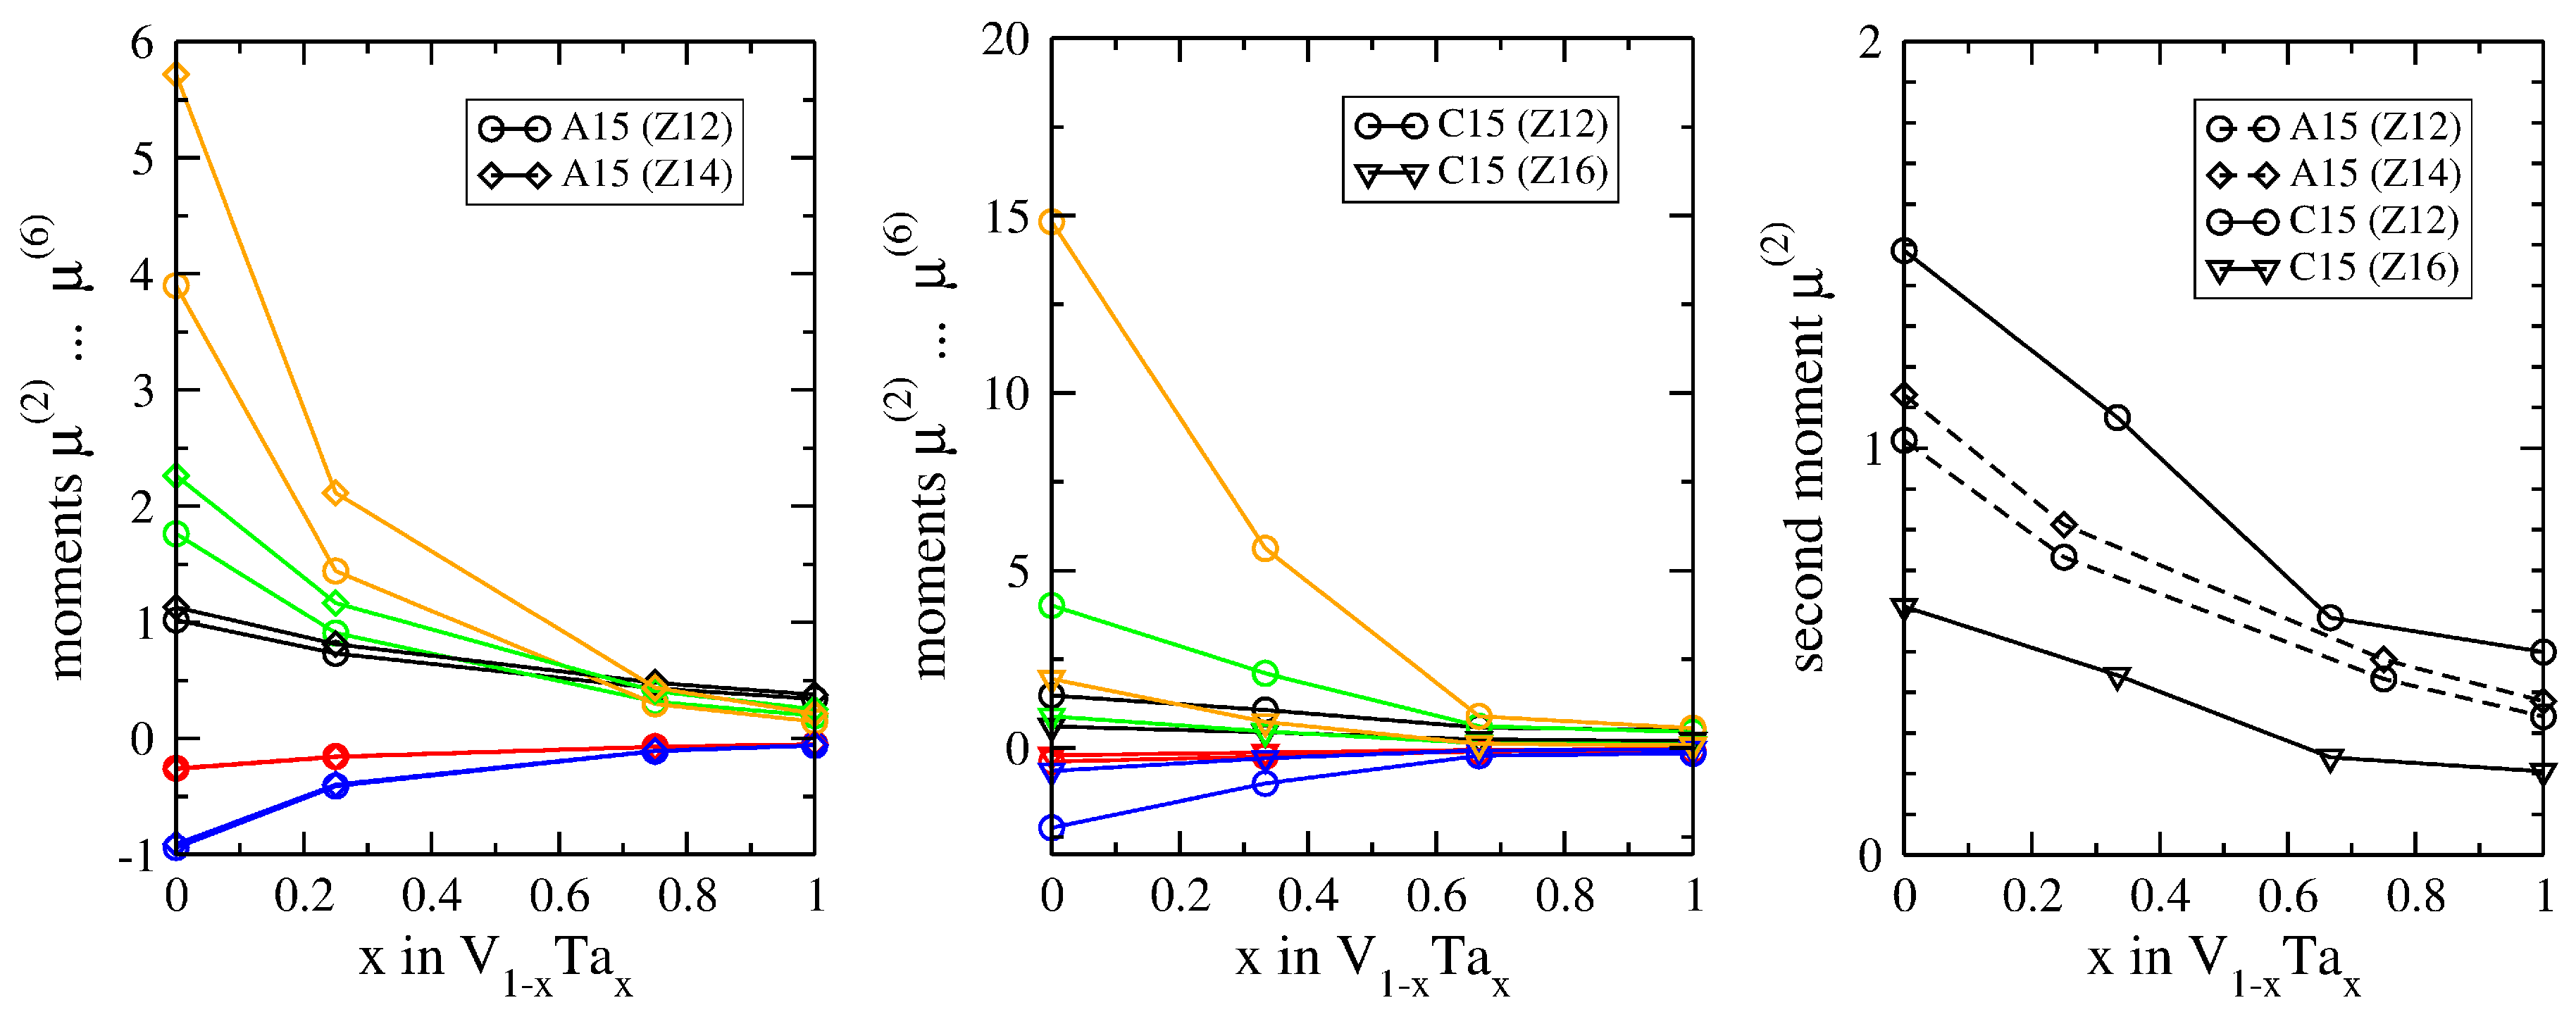
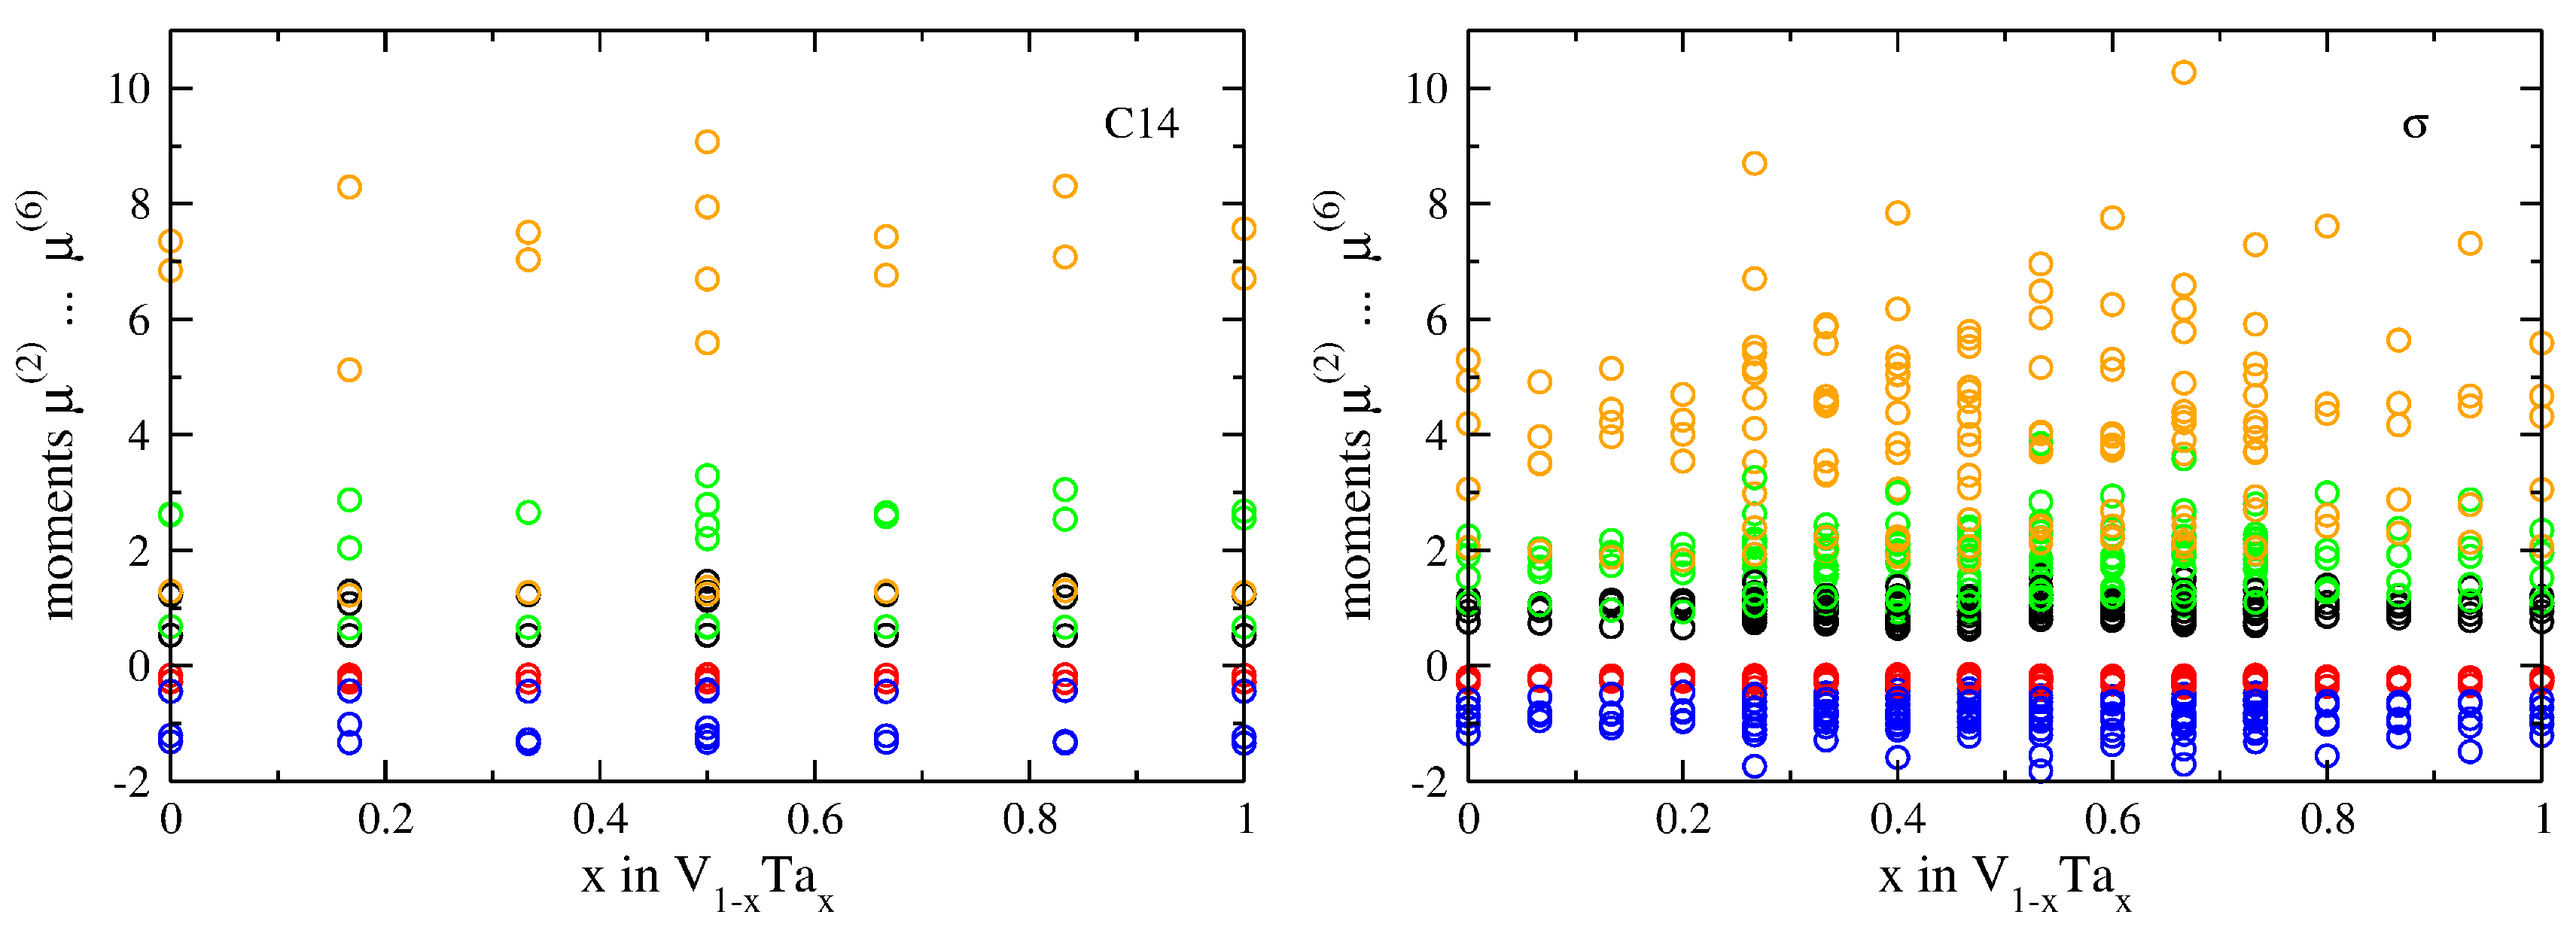
3.2. Atomic-Volume Differences in Compounds: V-Ta
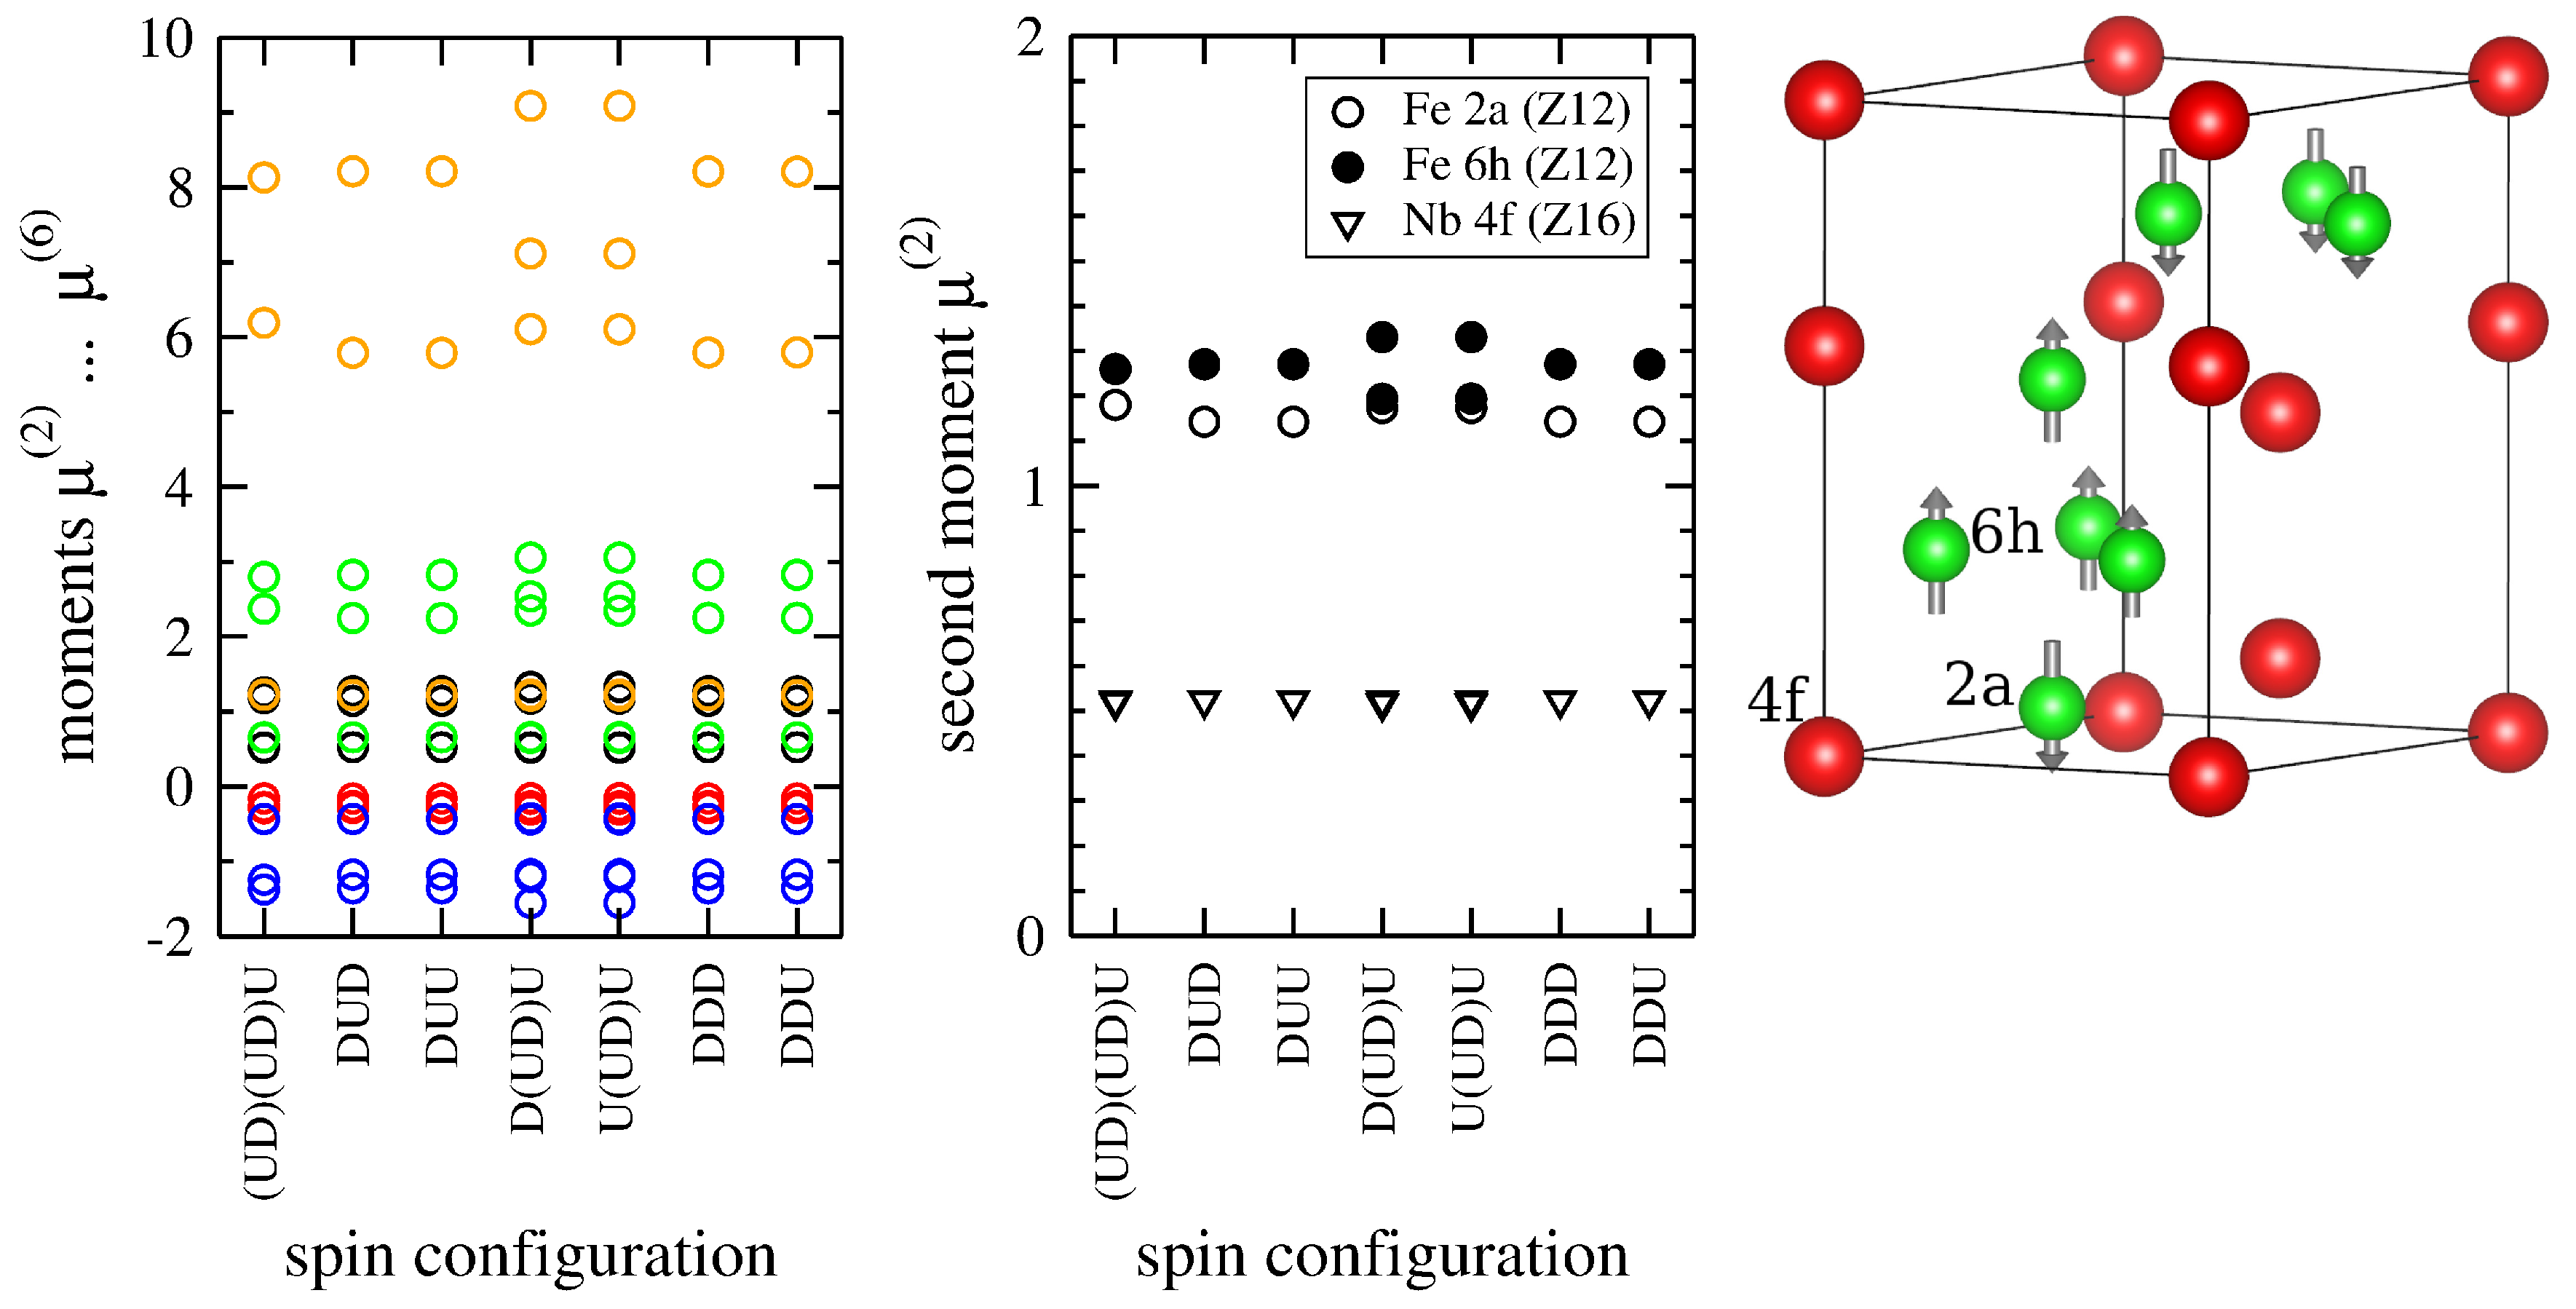
The structural stability of TCP phases is largely dominated by the average band-filling and by differences in the atomic volume of the constituent elements [6]. Compounds with small differences in atomic volume tend to form χ, A15, and σ phases. Sufficiently large differences in atomic volume of the constituent elements can stabilize Laves or μ phases as observed recently also for experimentally observed multicomponent TCP phase precipitates [58,59]. The associated changes in volume and internal relaxations can be assessed with moments.
In order to isolate the role of atomic-size differences from the role of band filling, we analyze the isovalent intermetallic compound V-Ta. The considerable difference of the atomic volume of V and Ta leads to a stabilization of V-Ta Laves and μ phases, in contrast, e.g., to the Nb-Ta system with negligible size difference [24]. We computed the moments for the unit cells of V-Ta TCP phases as obtained by full relaxation with DFT calculations [24]. We considered all occupations of Wyckoff positions with either atom in the primitive unit cells for the full range of attainable chemical composition. The influence of atomic-size differences is directly apparent from the moments computed for the original DFT unit cells, (i.e., without the scaling described in Section 2.2). In Figure 5, we compiled the moments of the DFT-relaxed, unscaled unit cells for the A15 and C15 phases of V-Ta.
Figure 5. Influence of considerable atomic-size difference on moments of DFT-relaxed unit cells of A15 (left) and C15 (middle). Variation of second moment for different Wyckoff positions in A15 and C15 (right). (for color coding, see Figure 2.)
Crystals 06 00018 g005
The set of discrete values of x is a direct consequence of occupying the sublattice that corresponds to one Wyckoff position with only one species of atoms at a time. As the A15 and C15 phases have no internal degrees of freedom, the variation of moments with x reflects the difference in atomic size of V and Ta. The increase of atomic size from V to Ta leads to a decrease of the second moment from x = 0 to x = 1 . The change in volume is smooth for A15, while the volume contraction of the thermodynamically stable V 2 Ta C15 phase is clearly visible as an increased second moment. The contraction is similar for the two Wyckoff positions of C15 due to the absence of internal degrees of freedom.
Internal relaxations become apparent in the moments computed after scaling the moments as described in Section 2.2. For the A15 and C15 phases, the scaling leads to constant second moments as observed for the band-filling variation (Figure 3). For TCP phases with internal degrees of freedom, however, the internal relaxations in the V-Ta compound lead to variations of the moments also for the scaled unit cells. This is shown exemplarily for the C14 and σ phases in Figure 6. More values than sublattices, e.g., C14 at x = 0 . 5 , arise if the same composition can be represented by different sublattice occupations. The similarity of the moments of C14 for x = 0 , 1 / 3 , 2 / 3 , and 1 indicates weak internal relaxations for both, the stable C14-V 2 Ta and the energetically unfavourable [24] C14-VTa 2 phase. These compositions correspond to occupations of both Z12 coordination polyhedra with the same atom type. Breaking this symmetry of the coordination polyhedra by occupying the two inequivalent Z12 sites differently ( x = 2 / 12 , 1 / 2 , 10 / 12 ), however, leads to considerable internal relaxations.
Figure 6. Variation of moments due to internal relaxation in the V-Ta compound system for the TCP phases C14 (left) and σ (right). The moments of the DFT-relaxed unit cells were scaled such that μ ( 2 ) = 1 . (for color coding, see Figure 2.)
Crystals 06 00018 g006

3.3. Influence of Magnetism: Fe 2 Nb-C14

As a further example of internal relaxations, we analyzed the C14-Fe 2 Nb phase. In particular, we considered the scaled unit cells obtained by DFT calculations for different spin configurations [51]. The computed moments, summarized in Figure 7, show only weak overall variations.
Figure 7. Variation of moments of C14-Fe 2 Nb (left) with spin configuration of the Wyckoff sites 2a, 6h and 4f (right), as well as site-resolved close-up on the second moment (middle). The ordering is according to structural stability [51] starting with the energetically most favorable configuration (UD)(UD)U that is also indicated in the crystal structure (right). (for color coding, see Figure 2.)
Crystals 06 00018 g007
The moments of the Nb atoms are nearly constant, showing that the coordination polyhedra around the Nb atoms remain intact. The configurations with ferromagnetic ordering (DDD) and with antiferromagnetic ordering of one sublattice (DUD, DUU, DDU) also show nearly identical second to sixth moments (Figure 7, left), i.e., nearly no difference in the internal degrees of freedom. Anti-ferromagnetic ordering within one sublattice in the case of D(UD)D and U(UD)U lifts the degeneracy of the higher moments. This can be traced back to a lift of degeneracy of the second moment of the Fe 6h site (cf. Figure 7, middle) indicating that the spin-flip gives rise to a volume change of the coordination polyhedra. For the thermodynamically most stable configuration with spin-flips on both Fe sublattices, (UD)(UD)U, the degeneracy of the Fe 2a and the 6h site is preserved. In this case, however, the crystallographically different Z12 polyhedra of the 2a and the 6h site approach a common average volume.

4. Conclusions

We analyzed the volume changes and internal relaxations of unary and binary TCP phases as obtained from DFT calculations. We used the moments of the density-of-states computed by analytic bond-order potentials on the basis of a d-valent canonical tight-binding model and a scaling that follows the structural energy difference theorem.
In particular, we used the moments as geometry characterization that is able to distinguish the crystal structure of the TCP phases χ, C14, C15, C36, μ, A15, and σ. The differences between moments serve as quantitative measures for the differences between two crystal structures. We demonstrated the robustness of the moments across the 4d and 5d TM series that take constant values for systems without internal degrees of freedom (fcc, C15, A15, bcc) and resolve internal relaxations otherwise (χ, C14, C36, μ, σ). We illustrated the ability of the moments characterization to easily identify site-specific volume changes for the case of volume contractions of the C15 phase in the V-Ta system. The moments give furthermore a direct means to identify the main sites of relaxation in the DFT-relaxed structures: Higher moments of the V-Ta system show that breaking the internal symmetry of Z12 polyhedra occupations in C14 leads to considerable internal relaxations. The moments of the Fe 2 Nb-C14 phase show that the energetically most favorable magnetic ordering is accompanied by a volume-equalization of the crystallographically different Z12 polyhedra.
In summary, we demonstrate that the moments provide a robust and transparent means for the characterization of crystal structures and local atomic configurations as well as volume changes and internal relaxations.

Acknowledgments

We acknowledge financial support by the German Research Foundation (DFG) through project C1 of the collaborative research center Sonderforschungsbereich/Transregio (SFB/TR) 103. Alvin Noe Ladines acknowledges the Philippine Department of Science and Technology Science Education Institute for support. Part of this work was carried out within the International Max-Planck Research School SurMat.

Author Contributions

Thomas Hammerschmidt and Ralf Drautz conceived the simulations; Thomas Hammerschmidt performed the moment calculations; Alvin Noe Ladines and Jörg Koßmann provided results of DFT calculations; all authors contributed to the analysis and writing.

Conflicts of Interest

The authors declare no conflict of interest.

References

  1. Rideout, S.P.; Manly, W.D.; Kamen, E.L.; Lement, B.S.; Beck, P.A. Intermediate phases in ternary alloy systems of transition elements. Trans. AIME 1951, 191, 872–876. [Google Scholar]
  2. Boesch, W.J.; Slaney, J.S. Preventing sigma phase embrittlement in Nickel base superalloys. Met. Prog. 1964, 86, 109–111. [Google Scholar]
  3. Morinaga, M.; Yukawa, M.; Adachi, H.; Ezaki, H. Superalloys 1984; Gell, M., Kortovich, C.S., Bricknell, R.H., Kent, W.B., Radavich, J.F., Eds.; The Metals, Minerals and Materials Society: Warrendale, PA, USA, 1984; p. 523. [Google Scholar]
  4. Watson, R.E.; Bennett, L.H. Transition-metal alloy formation. The occurence of topologically close packed phaeses—I. Acta Metall. 1984, 32, 477–489. [Google Scholar] [CrossRef]
  5. Laves, F.; Wallbaum, H.J. Über den Einfluß geometrischer Faktoren auf die stöchiometrische Formel metallischer Verbindungen, gezeigt an der Kristallstruktur des KNa2. Z. Anorg. Allg. Chem. 1942, 250, 110–120. [Google Scholar] [CrossRef]
  6. Seiser, B.; Drautz, R.; Pettifor, D.G. TCP phase predictions in Ni-based superalloys: Structure maps revisited. Acta Mater. 2011, 59, 749–763. [Google Scholar] [CrossRef]
  7. Joubert, J.M.; Phejar, M. Crystal chemistry and Calphad modeling of the χ phase. Prog. Mater. Sci. 2009, 54, 945–980. [Google Scholar] [CrossRef]
  8. Ohta, Y.; Pettifor, D.G. Size versus electronic factors in transition metal Laves phase stability. J. Phys. Condens. Matter 1990, 2. [Google Scholar] [CrossRef]
  9. Zhu, J.H.; Liu, C.T.; Pike, L.M.; Liaw, P.K. Enthalpies of formation of binary Laves phases. Intermetallics 2002, 10, 579–595. [Google Scholar] [CrossRef]
  10. Stein, F.; Palm, M.; Sauthoff, G. Structure and stability of Laves phases. Part I. Critical assessment of factors controlling Laves phase stability. Intermetallics 2004, 12, 713–720. [Google Scholar] [CrossRef]
  11. Hartsough, L.D. Stability of A15 type phases. J. Phys. Chem. Solids 1974, 35, 1691–1701. [Google Scholar] [CrossRef]
  12. Turchi, P.; Treglia, G.; Ducastelle, F. Electronic structure and phase stability of A15 transition metals and alloys. J. Phys. Met. Phys. 1983, 13. [Google Scholar] [CrossRef]
  13. Turchi, P.E.A.; Finel, A. Ordering phenomena in A15-based alloys. Phys. Rev. B 1992, 46. [Google Scholar] [CrossRef]
  14. Moriarty, J.A. Angular forces and melting in bcc transition metals: A case study of molybdenum. Phys. Rev. B 1994, 49. [Google Scholar] [CrossRef]
  15. Joubert, J.M. Crystal chemistry and Calphad modeling of the σ phase. Prog. Mater. Sci. 2008, 53, 528–583. [Google Scholar] [CrossRef]
  16. Berne, C.; Pasturel, A.; Sluiter, M.; Vinet, B. Ab Initio Study of Metastability in Refractory Metal Based Systems. Phys. Rev. Lett. 1999, 83, 1621–1623. [Google Scholar] [CrossRef]
  17. Berne, C.; Sluiter, M.; Kawazoe, Y.; Hansen, T.; Pasturel, A. Site occupancy in the Re-W sigma phase. Phys. Rev. B 2001, 64, 144103. [Google Scholar] [CrossRef]
  18. Berne, C.; Sluiter, M.; Pasturel, A. Theoretical approach of phase selection in refractory metals and alloys. J. Alloys Comp. 2002, 334, 27–33. [Google Scholar] [CrossRef]
  19. Sluiter, M.; Pasturel, A.; Kawazoe, Y. Site occupation in the Ni-Nb μ phase. Phys. Rev. B 2003, 67, 174203. [Google Scholar] [CrossRef]
  20. Sluiter, M.H.F.; Pasturel, A. Site occupation in the Cr-Ru and Cr-Os σ phase. Phys. Rev. B 2009, 80, 134122. [Google Scholar] [CrossRef]
  21. Crivello, J.C.; Joubert, J.M. First principles calculations of the σ and χ phases in the Mo-Re and W-Re systems. J. Phys. Condens. Matter 2010, 22, 035402. [Google Scholar] [CrossRef] [PubMed]
  22. Dubiel, S.M.; Cieslak, J.; Sturhahn, W.; Sternik, M.; Piekarz, P.; Stankov, S.; Parlinski, K. Vibrational properties of the α and σ Phase Fe-Cr Alloy. Phys. Rev. Lett. 2010, 104, 155503. [Google Scholar] [CrossRef] [PubMed]
  23. Pavlu, J.; Vrestal, J.; Sob, M. Ab initio study of formation energy and magnetism of sigma phase in Cr-Fe and Cr-Co system. Intermetallics 2010, 18, 212–220. [Google Scholar] [CrossRef]
  24. Hammerschmidt, T.; Bialon, A.; Pettifor, D.; Drautz, R. Topologically close-packed phases in binary transition-metal compounds: matching high-throughput ab initio calculations to an empirical structure map. New J. Phys. 2013, 15, 115016. [Google Scholar] [CrossRef]
  25. Palumbo, M.; Fries, S.; Hammerschmidt, T.; Abe, T.; Crivello, J.C.; Breidi, A.; Joubert, J.M.; Drautz, R. First-principles-based phase diagrams and thermodynamic properties of TCP phases in Re-X systems (X = Ta, V, W). Comput. Mater. Sci. 2014, 81, 433–445. [Google Scholar] [CrossRef]
  26. Ducastelle, F.; Cyrot-Lackmann, F. Moments developments and their application to the electronic charge distribution of d bands. J. Phys. Chem. Solids 1970, 31, 1295–1306. [Google Scholar] [CrossRef]
  27. Turchi, P.E.A. Interplay between local environment effect and electronic structure properties in close packed structures. Mater. Res. Soc. Symp. Proc. 1991, 206. [Google Scholar] [CrossRef]
  28. Hammerschmidt, T.; Seiser, B.; Drautz, R.; Pettifor, D.G. Modelling topologically close-packed phases in superalloys: Valence-dependent bond-order potentials based on ab-initio calculations. In Superalloys 2008; Reed, R.C., Green, K., Caron, P., Gabb, T., Fahrmann, M., Huron, E., Woodward, S., Eds.; The Metals, Minerals and Materials Society: Warrendale, PA, USA, 2008; p. 847. [Google Scholar]
  29. Seiser, B.; Hammerschmidt, T.; Kolmogorov, A.N.; Drautz, R.; Pettifor, D.G. Theory of structural trends within 4d and 5d transition metals topologically close-packed phases. Phys. Rev. B 2011, 83, 224116. [Google Scholar] [CrossRef]
  30. Németh, K.; Challacombe, M. Geometry optimization of crystals by the quasi-independent curvilinear coordinate approximation. J. Chem. Phys. 2005, 123, 194112. [Google Scholar] [CrossRef] [PubMed]
  31. Kuz’min, V.; Artemenko, A.; Muratov, E. Hierarchical QSAR technology based on the Simplex representation of molecular structure. J. Comput. Aided Mol. Des. 2008, 22, 403–421. [Google Scholar] [CrossRef] [PubMed]
  32. Isayev, O.; Fourches, D.; Muratov, E.; Oses, C.; Rasch, K.; Tropsha, A.; Curtarolo, S. Materials Cartography: Representing and Mining Materials Space Using Structural and Electronic Fingerprints. Chem. Mater. 2015, 27, 735–743. [Google Scholar] [CrossRef]
  33. Behler, J. Atom-centered symmetry functions for constructing high-dimensional neural network potentials. J. Chem. Phys. 2011, 134, 074106. [Google Scholar] [CrossRef]
  34. Rupp, M.; Tkatchenko, A.; Müller, K.R.; von Lilienfeld, O.A. Fast and accurate modeling of molecular atomization energies with machine learning. Phys. Rev. Lett. 2012, 108, 058301. [Google Scholar] [CrossRef] [PubMed]
  35. Bartók, A.; Kondor, R.; Csányi, G. On representing chemical environments. Phys. Rev. B 2013, 87, 184115. [Google Scholar] [CrossRef]
  36. Schablitzki, T.; Rogal, J.; Drautz, R. Topological fingerprints for intermetallic compounds for the automated classification of atomistic simulation data. Model. Simul. Mater. Sci. Eng. 2013, 21, 075008. [Google Scholar] [CrossRef]
  37. Von Lilienfeld, O.; Ramakrishnan, R.; Rupp, M.; Knoll, A. Fourier series of atomic radial distribution functions: A molecular fingerprint for machine learning models of quantum chemical properties. J. Quantum Chem. 2015, 115. [Google Scholar] [CrossRef]
  38. Cyrot-Lackmann, F. On the electronic structure of liquid transition metals. Adv. Phys. 1967, 16. [Google Scholar] [CrossRef]
  39. Haydock, R. Recursive solution of the Schrödinger equation. Comput. Phys. Commun. 1980, 20, 11–16. [Google Scholar] [CrossRef]
  40. Pettifor, D.G. Bonding and Structure of Molecules and Solids; Oxford Science Publications: New York, NY, USA, 1995. [Google Scholar]
  41. Horsfield, A.; Bratkovsky, A.M.; Fearn, M.; Pettifor, D.G.; Aoki, M. Bond-order potentials: Theory and implementation. Phys. Rev. B 1996, 53. [Google Scholar] [CrossRef]
  42. Drautz, R.; Pettifor, D.G. Valence-dependent analytic bond-order potential for transition metals. Phys. Rev. B 2006, 74, 174117. [Google Scholar] [CrossRef]
  43. Drautz, R.; Pettifor, D.G. Valence-dependent analytic bond-order potential for magnetic transition metals. Phys. Rev. B 2011, 84, 214114. [Google Scholar] [CrossRef]
  44. Drautz, R.; Hammerschmidt, T.; Cak, M.; Pettifor, D. Bond-Order Potentials: Derivation and parameterization for refractory elements. Model. Simul. Mater. Sci. Eng. 2015, 23, 074004. [Google Scholar] [CrossRef]
  45. Bieber, A.; Ducastelle, F.; Gautier, F.; Treglia, G.; Turchi, R. Electronic structure and relative stabilities of L12 and D022 ordered structures occuring in transition metal alloys. Solid State Commun. 1983, 45. [Google Scholar] [CrossRef]
  46. Bieber, A.; Gautier, F. Multiatom interactions, order and stability in binary transition metal alloys. Z. Phys. B Condens. Matter 1984, 57, 335–343. [Google Scholar] [CrossRef]
  47. Ducastelle, F.; Cyrot-Lackmann, F. Moments developments- II. Application to the crystalline structures and the stacking fault energies of transition metals. J. Phys. Chem. Solids 1971, 32, 285–301. [Google Scholar] [CrossRef]
  48. Chen, Y.; Kolmogorov, A.; Pettifor, D.; Shang, J.X.; Zhang, Y. Theoretical analysis of structural stability of TM5Si3 transition metal silicides. Phys. Rev. B 2010, 82, 184104. [Google Scholar] [CrossRef]
  49. Andersen, O.K.; Klose, W.; Nohl, H. Electronic structure of Chevrel-phase high-critical-field superconductors. Phys. Rev. B 1978, 17. [Google Scholar] [CrossRef]
  50. Pettifor, D.G.; Podloucky, R. The structures of binary compounds: II. Theory of the pd-bonded AB compounds. J. Phys. C Solid State Phys. 1986, 19. [Google Scholar] [CrossRef]
  51. Ladines, A.; Hammerschmidt, T.; Drautz, R. Structural stability of Fe-based topologically close-packed phases. Intermetallics 2015, 59, 59–67. [Google Scholar] [CrossRef]
  52. Sinha, A.K. Topologically close-packed structures of transition metal alloys. Prog. Mater. Sci. 1972, 15, 81–185. [Google Scholar] [CrossRef]
  53. Cak, M.; Hammerschmidt, T.; Drautz, R. Comparison of analytic and numerical bond-order potentials for W and Mo. J. Phys. Condens. Matter 2013, 26, 265002. [Google Scholar] [CrossRef] [PubMed]
  54. Ford, M.; Drautz, R.; Hammerschmidt, T.; Pettifor, D. Convergence of an analytic bond-order potential for collinear magnetism in Fe. Model. Simul. Mater. Sci. Eng. 2014, 22, 034005. [Google Scholar] [CrossRef]
  55. Hammerschmidt, T.; Seiser, B.; Ford, M.E.; Pettifor, D.G.; Drautz, R. BOPfox program for tight-binding and bond-order potential calculations. under preparation.
  56. Pettifor, D.G. The structures of binary compounds: I. Phenomenological structure maps. J. Phys. C 1986, 19. [Google Scholar] [CrossRef]
  57. Sutton, A.P.; Finnis, M.W.; Pettifor, D.G.; Ohta, Y. The tight-binding bond model. J. Phys. C 1988, 21. [Google Scholar] [CrossRef]
  58. Koßmann, J.; Zenk, C.; Lopez-Galilea, I.; Neumeier, S.; Kostka, A.; Huth, S.; Theisen, W.; Göken, M.; Drautz, R.; Hammerschmidt, T. Microsegregation and precipitates of an as-cast Co-based superalloy—microstructural characterization and phase stability modelling. J. Mater. Sci. 2015, 50, 6329–6638. [Google Scholar] [CrossRef]
  59. Lopez-Galilea, I.; Koßmann, J.; Kostka, A.; Drautz, R.; Roncery, L.M.; Hammerschmidt, T.; Huth, S.; Theisen, W. The thermal stability of topologically close-packed phases in the single-crystal Ni-base superalloy ERBO/1. J. Mater. Sci. 2016, 51, 2653–2664. [Google Scholar] [CrossRef]

