Article

Two Closely Related Organic Charge-Transfer Complexes Based on Tetrathiafulvalene and 9H-fluorenone Derivatives. Competition between Hydrogen Bonding and Stacking Interactions

by
Amparo Salmerón-Valverde
1 and
Sylvain Bernès
2,*
1
Centro de Química del Instituto de Ciencias, Benemérita Universidad Autónoma de Puebla, Ciudad Universitaria, San Manuel, Puebla, Pue., CP 72570, Mexico
2
Instituto de Física, Benemérita Universidad Autónoma de Puebla, Av. San Claudio y 18 Sur, Puebla, Pue., CP 72570, Mexico
*
Author to whom correspondence should be addressed.
Crystals 2015, 5(3), 283-293; https://doi.org/10.3390/cryst5030283
Submission received: 6 March 2015 / Revised: 4 June 2015 / Accepted: 12 June 2015 / Published: 25 June 2015

Abstract

:
Two 1:1 charge-transfer organic complexes were formed using tetrathiafulvalene as a donor and a 9H-fluorenone derivative as acceptor: 4,5,7-trinitro-9H-fluoren-9-one-2-carboxylic acid (complex 1) or 4,5,7-trinitro-9H-fluoren-9-one-2-carboxylic acid methyl ester (complex 2). Both systems crystallize with alternated donor and acceptor stacks. However, the crystal structure of 1 is influenced by classical hydrogen bonds involving carboxylic acid groups, which force to arrange acceptors as centrosymmetric dimers in the crystal, via R 2 2 (8) ring motifs, while such a restriction is no longer present in the case of 2, affording thus a different crystal structure. This main difference is reflected in stacking interactions, and, in turn, in the degree of charge transfer observed in the complexes. The degree of charge transfer, estimated using Raman spectroscopy, is δ1 = 0.07 for 1 and δ2 = 0.14 for 2. It thus seems that, at least for the studied complexes, hydrogen bonding is an unfavorable factor for charge transfer.

Graphical Abstract

1. Introduction

Tetrathiafulvalene (systematic name: 2,2′-bis(1,3-dithiolylidene); universally abbreviated TTF), is a small, highly symmetric organic molecule, which has been the center of an impressive chemical success-story. In a review article published ten years ago, the authors mentioned that “by now, over 10 thousand papers reporting the synthesis, properties, and application of TTF derivatives, its complexes, and ion radical salts have appeared” [1]. Most of the research carried out around TTF is oriented towards the properties of the resulting materials, with the hope to obtain organic compounds with metallic properties. This long-standing goal, claimed one century ago [2], has been, at least in part, realized thanks to TTF. A representative class of these materials is formed by the Bechgaard salts, studied in Orsay in the 80’s decade [3,4], which exhibit a metallic behavior and are low-Tc superconductors.
A common concern regarding the characterization of these materials is to estimate if some charge-transfer (CT) occurs between the components, and if so, to estimate the degree of charge transfer, δ, that means to differentiate for instance DA from Dδ+Aδ−, where D is a donor and A an acceptor component. Our small contribution in this field is to assess how accurate is δ as measured through vibrational spectroscopy, in the case of closely related complexes. This technique, popularized by Chappell et al. [5], has the advantage to be very accessible, providing that vibrational frequencies of IR or Raman active modes sensible to charge-transfer are available for both neutral and fully oxidized (resp. reduced) donor (resp. acceptor) molecules. In that case, 0 < δ < 1, and δ may be computed through:
δ =   2 ( Δ ν / ν 0 ) 1 ( ν 1 / ν 0 ) 2
where v0 and v1 are the vibrational frequencies for neutral (δ = 0) and ionized (δ = 1) component, respectively, and ∆v is the shift observed for the same vibrational mode in the CT complex with respect to the neutral component. The formula may be applied indistinctively to a vibration of the donor or the acceptor, since the CT complex Dδ+Aδ− is neutral. Although no far-reaching conclusions should be expected from this single parameter, it has been shown that δ is strongly related to the conductivity of the CT material: within the 0.4 < δ < 0.7 window, materials are promising candidates for organic metals [6]. If v1 is not available, for instance because no chemically stable ionic complex with δ = 1 can be synthesized, vibrational spectroscopy is still of interest, because closely related complexes may be compared. The more a vibrational mode is shifted with respect to v0, the more δ parameter should be close to 1. A trivial case is that with ∆v = 0, corresponding to δ = 0.
In a previous study, we reported on the crystal structures of polymorphic forms of a 1:1 DA complex between TTF and a 9-(dicyanomethylidene)fluorene derivative. Estimation of δ was based on the b2u stretching mode of the C≡N groups of the acceptor molecule [7]. We also estimated δ for two P 1 ¯ polymorphs of a A2D3 complex, with 2,4,7-trinitro-9H-fluorenone as acceptor, using the carbonyl group of the fluorenone as a δ-probe in IR spectroscopy [8].
The present work deals with two closely related 1:1 complexes between TTF and other 9H-fluorenone derivatives, namely 4,5,7-trinitro-9H-fluoren-9-one-2-carboxylic acid (abbreviated C2TNF hereafter) and 4,5,7-trinitro-9H-fluoren-9-one-2-carboxylic acid methyl ester (abbreviated MeC2TNF hereafter). The single difference in the acceptor moiety in complexes 1 and 2 results from the esterification of a carboxylic acid functionality in 1 to form a methyl ester in 2 (see Scheme 1). However, this minute chemical modification in the acceptor component of the complex is expected to produce dramatic consequences on the crystal structure stabilized in the solid state, since the carboxylic acid functionality is known as one of the best hydrogen bonds nodes, while the methyl ester group is rather a poor node. The present work was thus motivated by the hope to modulate δ via a competition between hydrogen bonding and stacking interactions in the complexes, providing that δ modulation can be detected by spectroscopy.
Scheme 1. Complexes 1 and 2 characterized by X-ray diffraction and vibrational spectroscopy.
Crystals 05 00283 g005

2. Results and Discussion
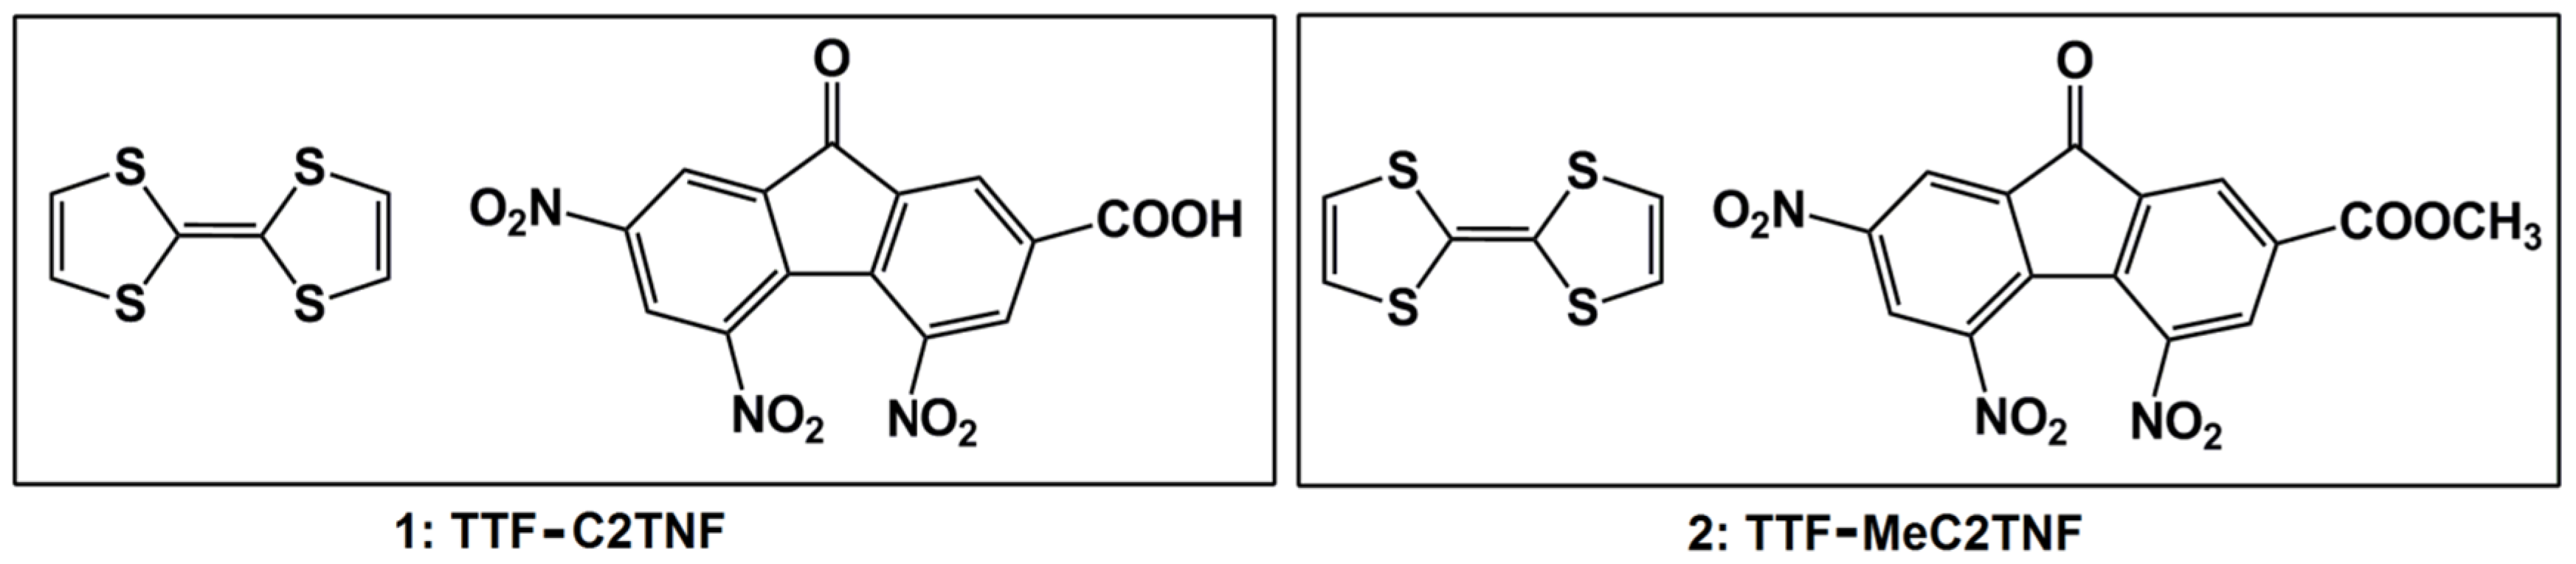
2.1. TTF-C2TNF (1)

Complex 1 crystallizes in space group P21/n, with the asymmetric unit containing one TTF and one C2TNF molecule, each placed in general position (Figure 1a). The TTF molecule has a bent shape [angle between five-membered rings: 10.35(18)°] and a long central C=C bond length: 1.353(5) Å versus 1.337(4) Å for neutral TTF [9,10]. These features are characteristic of the radical cation TTFδ+. The fluorene nucleus in the acceptor is also twisted (calculated r.m.s. deviation for the 13-membered ring: 0.080 Å), although the main reason for such a distortion is known to be due to the overcrowding between nitro groups at C4 and C5. The observed distortion of the acceptor in 1 is, for example, similar to that observed in free 2,4,5,7-tetranitro-9-fluorenone [11,12]. Similarly to other reported systems [7,8,13], the crystal structure is a quasi-1D arrangement of DA complexes with donor D and acceptor A moieties alternating in the stacks. Molecules are stacked along [100], and the D···A separations along the stack are 3.72 and 5.09 Å (Figure 1b). The long separation of ca. 5 Å avoids direct interactions between π orbitals for D and A components in the solid. Moreover, a tilt of 6.07(8)° between D and A aromatic core mean-planes in the asymmetric unit neither helps to the charge transfer along the 1D stack. From these figures, it is anticipated that compound 1 should be close to its neutral state.
On the other hand, the carboxylic acid functionality in C2TNF introduces a strong potential to form hydrogen bonds in the crystal. The propensity of this group to generate R 2 2 (8) ring motifs [14,15] has been recognized since a long time, and indeed, it appears with a frequency of about 24% for the X-ray structures deposited in the CSD which bear a COOH fragment [16]. For 1, C2TNF molecules form centrosymmetric dimers and the hydrogen bonds may be considered as strong: the O12–H12···O13i angle is 169.7°, and the H12···O13i distance is 1.76 Å (symmetry code i: 1−x, 1−y, −z), resulting in a O12…O13 separation of 2.651(4) Å. This significant intermolecular contact connects the 1D stacks in the crystal, resulting in a quasi-2D supramolecular framework (see Figure 1). This inter-stack contact, reminiscent of that described in the quasi-2D segregated system TTF-TCNQ [17], should compete with π–π interactions along a stack of DA complexes, and is thus expected to be a significant parameter for the charge transfer between D and A components.
Figure 1. (a) ORTEP-like view of the asymmetric unit in 1, with 30% displacement ellipsoids for non-H atoms; (b) Part of the packing structure of 1, showing separations between TTF and C2TNF in one stack. The R 2 2 (8) motif connects two C2TNF molecules in two neighboring stacks. All H atoms have been omitted, except hydroxyl H atoms (H12) involved in the R motif.
Crystals 05 00283 g001

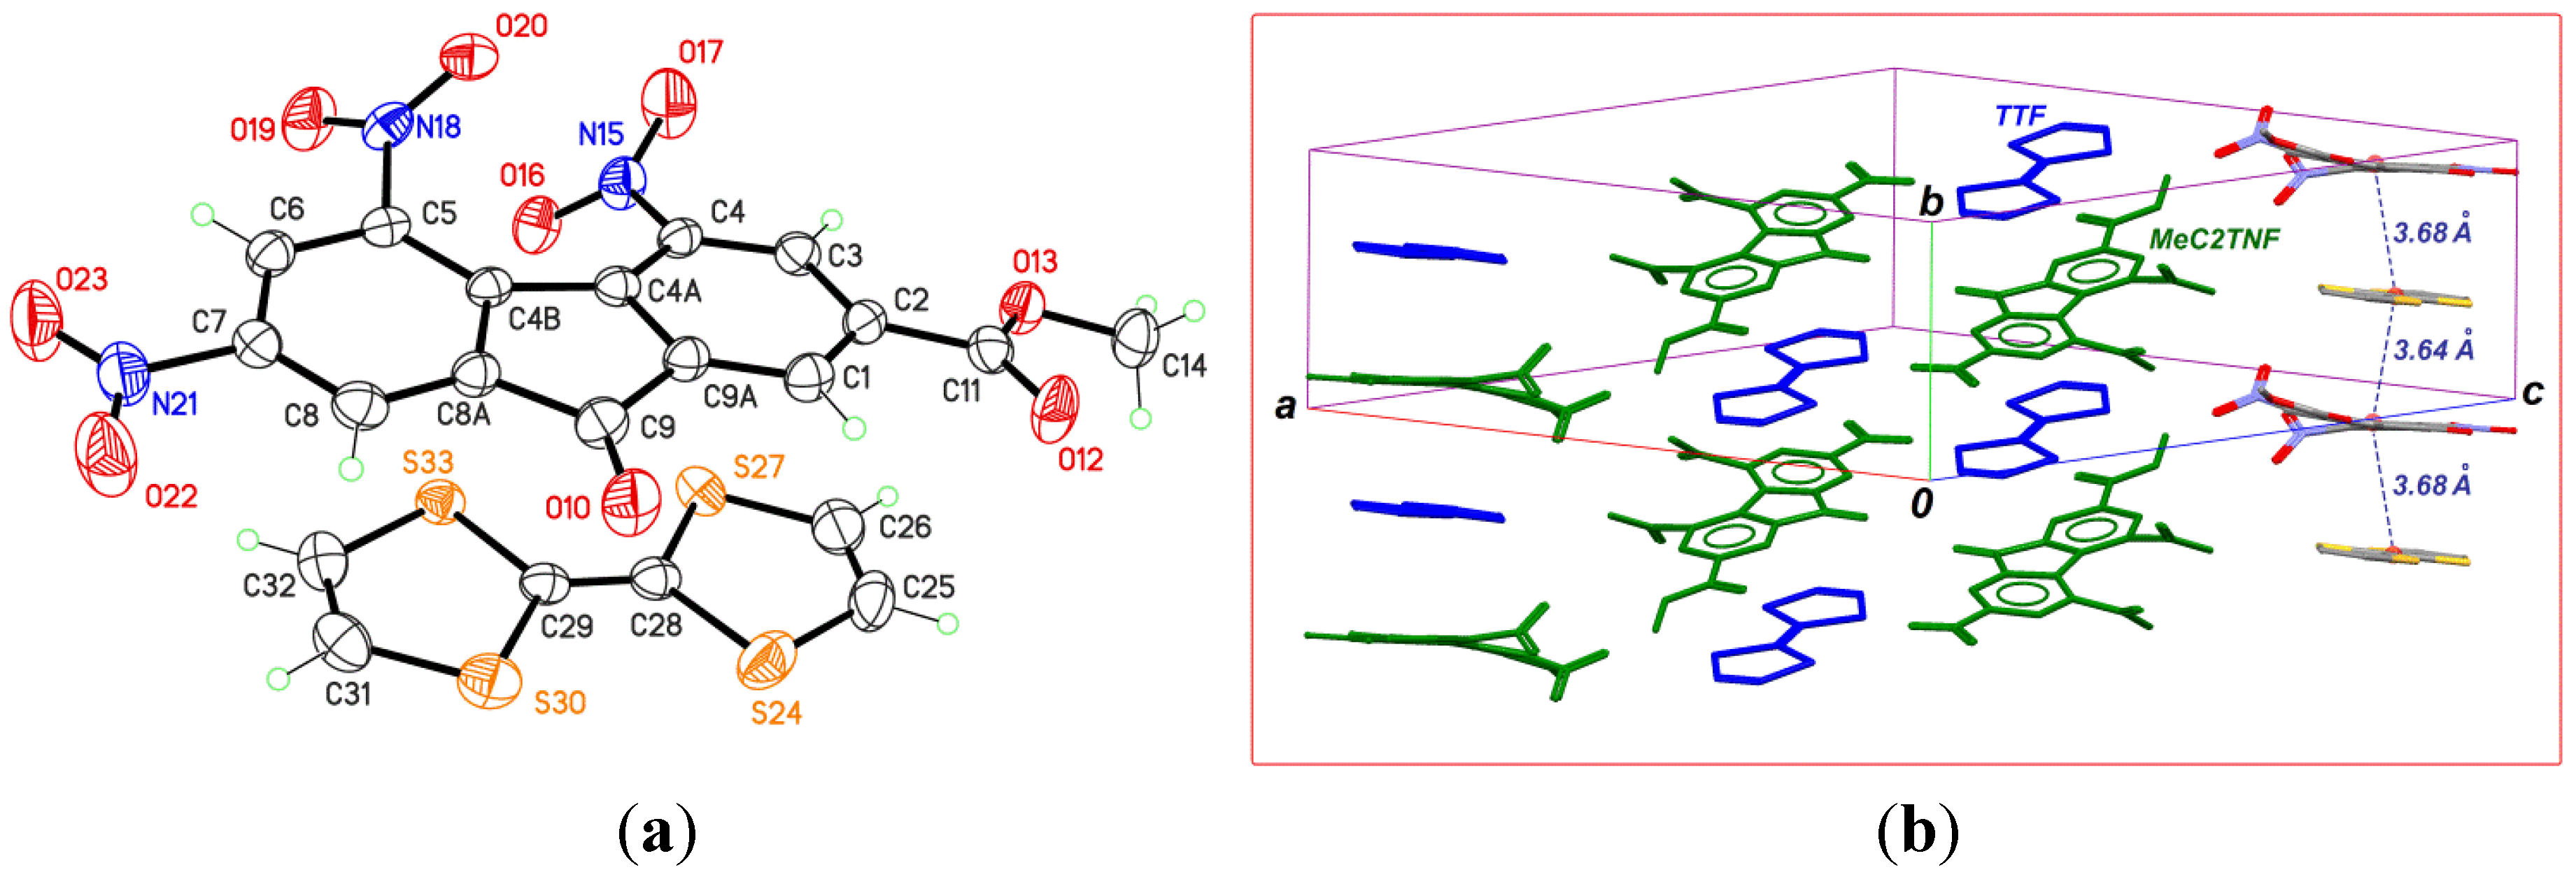
2.2. TTF-MeC2TNF (2)

The DA complex based on MeC2TNF, 2, also crystallizes in space group P21/n, although cell dimensions are very different from those of 1 (Table 1). The asymmetric unit (Figure 2a) contains a quite planar TTF molecule: the dihedral angle between the five-membered rings is limited to 1.70(8)°. However, the central double bond C28=C29, with a bond length of 1.342(4) Å, is not inconsistent with a partially oxidized TTF, although the observed difference with 1 falls within experimental errors.
Figure 2. (a) ORTEP-like view of the asymmetric unit in 2, with 30% displacement ellipsoids for non-H atoms; (b) Part of the packing structure of 2, showing separations between TTF and MeC2TNF in one stack. All H atoms have been omitted.
Crystals 05 00283 g002
The twisted conformation of MeC2TNF is very similar to that of C2TNF in complex 1, as reflected, for example, in the r.m.s. deviation for the fluorene mean-plane, 0.062 Å. The main difference between compounds 1 and 2 should thus be sought in the packing structure (Figure 2b).
The crystal structure of 2 is essentially 1D, with stacks of DA complexes oriented in the [010] direction. Along a stack, separations between TTF and MeC2TNF are 3.64 and 3.68 Å, significantly shorter than in 1. The more efficient π–π interactions between aromatic parts in the solid are also reflected in the tilt angle between TTF and MeC2TNF in the asymmetric unit, 3.19(4)° versus 6.07(8)° for 1. Finally, the methyl ester group in the acceptor component precludes any inter-stack interactions. In contrast to complex 1, a true 1D or quasi-1D crystal structure is formed for 2. As a consequence, a significant δ parameter may be expected for 2.

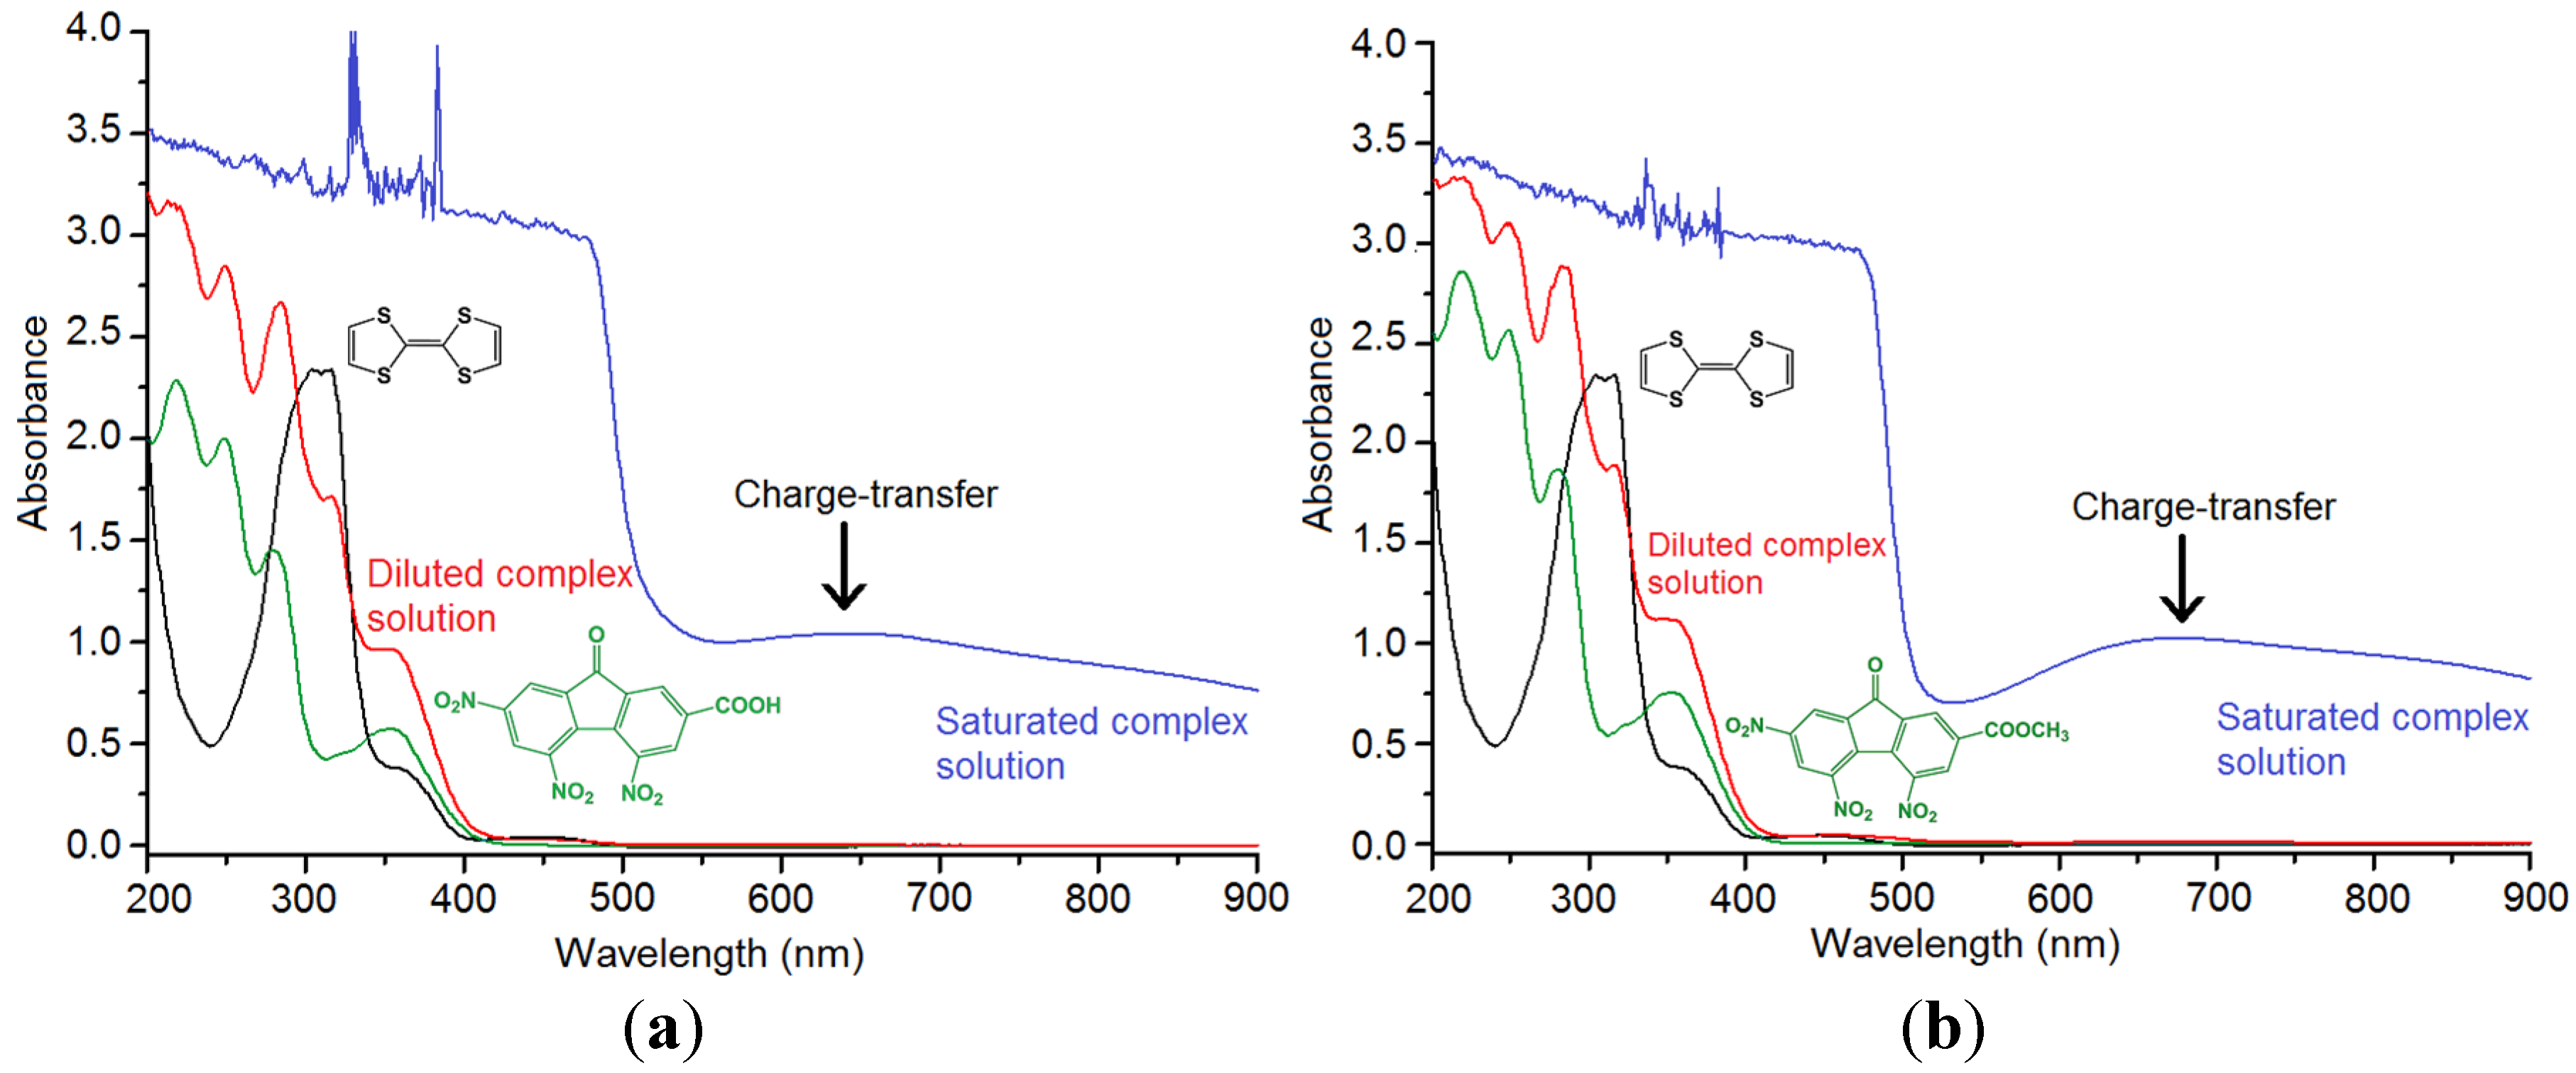
2.3. Vibrational Spectroscopy and Estimation of the Degree of Charge Transfer in 1 and 2

As mentioned above, a δ ≠ 0 parameter is expected for both complexes, and the crystal structures point towards a more favorable transfer for complex 2: δ2 > δ1. These predictions have been checked by means of IR and Raman spectroscopy. In complex 1, the vibration of the carbonyl at C9 in the acceptor is found at 1724 cm−1, representing a shift ∆v = 18 cm−1 with respect to the free neutral acceptor (v0 = 1742 cm−1). In the case of complex 2, the same vibration is found at 1716 cm−1, while the neutral acceptor gives v0 = 1729 cm−1. The band shift is then ∆v = 13 cm−1. Unfortunately, ionic complexes, like Na+C2TNF and Na+MeC2TNF could not be prepared. Parameters v1 for the Chappell’s formula are then unknown for 1 and 2, and accurate values for δ1 and δ2 cannot be determined on the basis of IR spectra. However, this spectroscopy shows, at least, that a charge transfer is at work in the solids. This fact is remarkably confirmed by a study in solution (Figure 3).
Figure 3. Electronic spectra for TTF, C2TNF, MeC2TNF, complex TTF-C2TNF, 1 (a), and complex TTF-MeC2TNF, 2 (b). Compounds are dissolved in CH3CN, and in the case of complexes, diluted (red spectra) and saturated (blue spectra) solutions are used. Black and green spectra are for neutral donor and acceptor components, respectively.
Crystals 05 00283 g003
Both TTF and acceptors C2TNF and MeC2TNF are transparent in the visible region of the electronic spectra (λ > 500 nm). However, acetonitrile solutions of complexes close to saturation display a very broad band in the visible region, with a maximum at λmax = 644 nm for 1 and λmax = 677 nm for 2 (see Figure 3). These bands have a characteristic shape, and may be assigned to a charge transfer in dimers or oligomers present in solution, which are the precursors required for nucleation.
The estimation of δ in the solid state was eventually obtained using Raman spectra. The most useful vibration with that spectroscopy is the Raman-active symmetric (Ag) stretching mode for the central C=C double bond in TTF, known as v3 [18,19], which is δ-sensitive, intense, and not overlapped by active vibrations of acceptors C2TNF and MeC2TNF. This mode gives a Raman shift at 1515 cm−1 for neutral TTF, while for complexes 1 and 2, the band is displaced at 1508 and 1502 cm−1, respectively (Figure 4). On the other hand, this band shifts to 1416 cm−1 in the ionic complex (TTF)2FeCl4 in which TTF is assumed to be fully oxidized to TTF+ [20]. Using these data, the Chappell’s formula given in introduction allows us to calculate δ1 and δ2 for complexes 1 and 2:
TTF-C2TNF (1): δ1 = 0.07 electron
TTF-MeC2TNF (2): δ2 = 0.14 electron
The relation δ21 ≈ 2 is in line with solid state structures, for instance regarding D···A separations observed in the crystal structures. However, this result is not in agreement with IR spectroscopy. Since δ is proportional to ∆v regardless of the vibrational spectroscopy (IR versus Raman) and the vibration mode used for the evaluation of δ, the larger the shift for a given vibration, the larger should be the charge transfer. However, ∆v is larger for 1 than 2 in IR: 18 and 13 cm−1, respectively, for the carbonyl vibration. This discrepancy is perhaps a consequence of the low symmetry of acceptors: the charge transfer is probably not localized over the carbonyl C=O group. The situation is different for the donor TTF, which approximates D2h point symmetry, in such a way that the central exocyclic double bond should be directly related to the charge transfer in the solid.
Figure 4. Raman spectra in the 1300–1600 cm−1 range for neutral TTF and CT complexes 1 and 2.
Crystals 05 00283 g004
The difficulty involved in using IR and Raman data for the estimation of δ in weak CT complexes like 1 and 2, is similar to some issues faced with structure-CT correlations based on XRD data. Because of the large uncertainties affecting bond lengths involving light atoms, in the case of TTF-based organic complexes, only the C–S bonds may be useful for such a purpose. Attempts to correlate δ with average length of the four C–S bonds connected by the exocyclic double bond in TTF were successful for complexes with 0.5 < δ ≤ 2 [21]. Established correlations are however less reliable as the complexes approach the neutral boundary, and confident predictions for compounds with similarly low δ values are probably unrealistic.
However, relying on the δ values extracted from Raman spectra, it becomes clear that hydrogen bonding competes with stacking interactions for the charge transfer. Considering the –COOH group as an electron withdrawing group slightly more efficient than the corresponding methyl ester –COOMe, one should expect C2TNF to have a higher electronic affinity than MeC2TNF, which, in turn, should be favorable for the charge transfer in 1. However, hydrogen bonds formed in the crystal by C2TNF disorganize the stack layout, which results in large D···A separations. Once hydrogen bonds are no longer active in complex 2, stacking efficiency is restored, which is reflected in a higher charge transfer parameter δ. Indeed, charge transfer in 2 is almost as efficient as in the complex based on TTF and 2,4,5,7-tetranitro-9-fluorenone, an acceptor supporting four strongly withdrawing substituents. With this acceptor, Raman data afford δ = 0.16 [22].
On the other hand the weak CT estimated for 1 and 2 is coherent with a rough estimation of the electronic affinity of the acceptor molecules. The half-wave reduction potential has been reported for 2,5,7-trinitro-9-fluorenone-4-carboxylic acid, an isomer of substitution of C2TNF [23]: E1/2 = −0.34 V. With such a potential, these molecules are not expected to behave as metals when complexed with TTF [24].

3. Experimental Section

Synthesis of the complexes. Acceptor C2TNF (4,5,7-trinitro-9H-fluoren-9-one-2-carboxylic acid) was prepared by nitration of commercially available 9H-fluorenone-2-carboxylic acid, using fuming HNO3/H2SO4, following a procedure of the literature [25]. m.p. 547-553 K. Esterification of C2TNF with refluxing MeOH-H2SO4 afforded MeC2TNF (4,5,7-trinitro-9H-fluoren-9-one-2-carboxylic acid methyl ester), m.p. 469-470 K [25].
Complex TTF-C2TNF (1) was obtained by mixing solutions of TTF (7 mg, 0.034 mmol in 1.5 mL of CH3CN) and C2TNF (12.3 mg, 0.034 mmol in 2.8 mL of CH3CN), at room temperature. The yellow solution turned deep green. The mixture was transferred in a test tube, and the solvent slowly evaporated in the dark, over a period of 4 days. After complete evaporation, green crystals were collected. Estimated yield: 95%; m.p. 477-479 K. Anal. Found: C 42.49, H 1.50, N 7.35, S 22.54%; calcd. for C20H9N3O9S4: C 42.62, H 1.61, N 7.46, S 22.76%.
Complex TTF-MeC2TNF (2) was obtained following the same procedure, with a near-quantitative yield. m.p. 443 K. Anal. Found: C 43.68, H 2.14, N 7.03, S 21.86%; calcd. for C21H11N3O9S4: C 43.67, H 1.92, N 7.28, S 22.21%.
X-ray diffraction. Data for complexes 1 and 2 were collected at room temperature on a Bruker P4 diffractometer [26] using the Mo-Kα radiation (Table 1). Raw data were corrected for absorption effects [27] and the structures refined with the SHELX-2014 programs [28]. All C-bonded H atoms were placed in calculated positions and refined as riding to their carrier atoms, with C–H bond lengths fixed to 0.93 Å (aromatic CH) or 0.96 Å (methyl group in 2). Acid H atom in 1 (H12) was first detected in a difference map and refined freely, but its position was fixed (O–H = 0.90 Å) in the last cycles. Isotropic displacement parameters for all H atoms were calculated as Uiso(H) = xUeq(carrier atom) where x = 1.2 for aromatic CH groups and x = 1.5 for the methyl group in 2 and H12 in 1. A CIF file including structure factors is available as a supplementary file.
Analysis and spectroscopy. Elemental analyses were carried out by Desert Analytics (Tucson, AZ, USA). Melting points were measured with a Fisher-Johns apparatus. FT-IR spectra were measured on KBr pellets using a Nicolet Magna 750 spectrophotometer (Bruker Optics, Milton, Canada). FT-Raman spectra were measured on KBr pellets, with a Perkin-Elmer System 2000 spectrophotometer equipped with a Nd:YAG laser operated at λ = 1064 nm the 25–100 mW range. Electronic spectra were measured on a Perkin-Elmer Lambda 20 spectrophotometer, in the 200–900 nm range, using solid samples dissolved in HPLC-grade acetonitrile and 1.4 mL quartz cells.
Table 1. Crystal data for complexes 1 and 2.
Compound12
CCDC depositionCCDC-1049471CCDC-1049472
Empirical formulaC20H9N3O9S4C21H11N3O9S4
Formula weight563.54577.57
Color, habitDark green, irregularDark brown, plate
Crystal size [mm]0.60 × 0.40 × 0.080.60 × 0.32 × 0.04
Space groupP21/nP21/n
a [Å]8.0275(10)19.078(5)
b [Å]7.8676(13)7.2068(14)
c [Å]34.961(5)19.443(4)
β [°]90.106(9)117.833(12)
V3)2208.0(5)2364.0(9)
Z44
ρcalcd. [g·cm−3]1.6951.623
μ [mm−1]0.4920.462
2θ range [°]4–504–50
Reflections collected55295681
Independent reflections (Rint)3897 (0.026)4165 (0.033)
Transmission factors [min., max.]0.475–0.5140.656–0.703
Final R indices [I ≥ 2σ(I)] R1, wR20.049, 0.1200.048, 0.097
Final R indices (all data) R1, wR20.087, 0.1460.106, 0.116
Goodness-of-fit on F21.0371.002
Data/restraints/parameters3897/0/3264165/0/336
Largest difference peak/hole [e Å−3]0.61, −0.380.23, −0.24

4. Conclusions

Both organic complexes are characterized by CT parameters δ, 0.07 and 0.14, far from the 0.4–0.7 window in which metallic conductors are generally found [6], and are then very probably semiconductor materials or insulators. From this point of view, they are of little interest. However, our study shows that while designing acceptors for the construction of new TTF-based CT complexes, it is worth to consider not only the introduction of electron withdrawing groups on the aromatic core of the acceptor, but also to consider potential unfavorable factors induced by these groups. Some factors are obvious, like the steric requirement of bulky substituents, which will separate D and A moieties in the solid, but other are less obvious. In the case of complex 1, it seems that the ability of the –COOH group to form R(8) rings in the solid state is adversely affecting the charge transfer, affording a complex close to the neutral state. Obviously, these findings are not intended to be generalized to any CT complex. The competition between intramolecular effects, particularly the π electronic distribution in the acceptor (balanced by the activity of electron withdrawing groups) and intermolecular effects like non-covalent forces, which influence the crystal structure, is difficult to rationalize. Regarding hydrogen bonding, it is well documented that, under favorable circumstances, such bonds are able to cooperate with CT interactions, to modulate the transport properties in the material [29]. The deliberate choice of engaging A and D precursors functionalized by strong hydrogen bond donor/acceptor groups remains a viable strategy in the field of organic conductors [30], and has indeed produced outstanding results [31,32]. Finally, even for complexes close to the neutral state, the spectroscopic determination of δ seems to afford reliable data.

Acknowledgments

Thanks are given to the Consejo Superior de Investigaciones Científicas (CSIC) of Spain for the award of a license for the use of the Cambridge crystallographic database (CSD) until 2012.

Author Contributions

Amparo Salmerón-Valverde: design of experiments; synthesis and crystallization of 1 and 2; FTIR, Raman, and electronic spectroscopy. Sylvain Bernès: X-ray crystallography; preparation of the first draft of the publication. Both authors contributed to the final version of the publication.

Supplementary Information

Supplementary materials can be accessed at: https://www.mdpi.com/2073-4352/5/3/0283/s1.

Conflicts of Interest

The authors declare no conflict of interest.

References

  1. Bendikov, M.; Wudl, F.; Perepichka, D.F. Tetrathiafulvalenes, Oligoacenenes, and Their Buckminsterfullerene Derivatives: The Brick and Mortar of Organic Electronics. Chem. Rev. 2004, 104, 4891–4945. [Google Scholar] [CrossRef] [PubMed]
  2. McCoy, H.N.; Moore, W.C. Organic amalgams: Substances with metallic properties composed in part of non-metallic elements. J. Am. Chem. Soc. 1911, 33, 273–292. [Google Scholar] [CrossRef]
  3. Bechgaard, K.; Carneiro, K.; Rasmussen, F.B.; Olsen, M.; Rindorf, G.; Jacobsen, C.S.; Pedersen, H.J.; Scott, J.C. Superconductivity in an organic solid. Synthesis, structure, and conductivity of bis(tetramethyltetraselenafulvalenium) perchlorate, (TMTSF)2ClO4. J. Am. Chem. Soc. 1981, 103, 2440–2442. [Google Scholar] [CrossRef]
  4. Pouget, J.P. Structural aspects of the Bechgaard and Fabre salts: An update. Crystals 2012, 2, 466–520. [Google Scholar] [CrossRef]
  5. Chappell, J.S.; Bloch, A.N.; Bryden, W.A.; Maxfield, M.; Poehler, T.O.; Cowan, D.O. Degree of charge transfer in organic conductors by infrared absorption spectroscopy. J. Am. Chem. Soc. 1981, 103, 2442–2443. [Google Scholar] [CrossRef]
  6. Wheland, R.C.; Gillson, J.L. Synthesis of electrically conductive organic solids. J. Am. Chem. Soc. 1976, 98, 3916–3925. [Google Scholar] [CrossRef]
  7. Salmerón-Valverde, A.; Bernès, S.; Robles-Martínez, J.G. Structure and degree of charge transfer of two polymorphs of a 1:1 molecular complex: [2,2′-bis-1,3-dithiole][9-dicyanomethylene-4,5,7-trinitrofluorene-2-carboxylic acid methyl ester] (TTF-MeDC2TNF). Acta Crystallogr. 2003, B59, 505–511. [Google Scholar] [CrossRef]
  8. Salmerón-Valverde, A.; Bernès, S. Caractérisation structurale et étude spectroscopique du transfert de charge pour deux phases polymorphes du complexe (TTF)3(TNF)2, avec TTF = tétrathiofulvalène et TNF = 2,4,7-trinitro-9-fluorénone. C. R. Chim. 2005, 8, 1017–1023. (In French) [Google Scholar] [CrossRef]
  9. Ellern, A.; Bernstein, J.; Becker, J.Y.; Zamir, Sh.; Shahal, L.; Cohen, S. A New Polymorphic Modification of Tetrathiafulvalene. Crystal Structure, Lattice Energy and Intermolecular Interactions. Chem. Mater. 1994, 6, 1378–1385. [Google Scholar] [CrossRef]
  10. Batsanov, A.S. Tetrathiafulvalene revisited. Acta Crystallogr. 2006, C62, o501–o504. [Google Scholar]
  11. Chetkina, L.A.; Semidetko, O.V.; Belsky, V.K.; Sobolev, A.N.; Andrievsky, A.M. Structure of 2,4,5,7-tetranitro-9-fluorenone. Acta Crystallogr. 1987, C43, 931–933. [Google Scholar] [CrossRef]
  12. Baughman, R.G. The structure of 2,4,5,7-tetranitro-9-fluorenone. Acta Crystallogr. 1987, C43, 933–936. [Google Scholar] [CrossRef]
  13. Reinheimer, E.W.; Galán-Mascarós, J.R.; Dunbar, K.R. Synthesis and structure of charge transfer salts of tetrathiafulvalene (TTF) and tetramethyl-TTF with 2,4,7-trinitro and 2,4,5,7-tetranitro-9-fluorenone. Synth. Met. 2009, 159, 45–51. [Google Scholar] [CrossRef]
  14. Etter, M.C. Encoding and decoding hydrogen-bond patterns of organic compounds. Acc. Chem. Res. 1990, 23, 120–126. [Google Scholar] [CrossRef]
  15. Galek, P.T.A.; Fábián, L.; Motherwell, W.D.S.; Allen, F.H.; Feeder, N. Knowledge-based model of hydrogen-bonding propensity in organic crystals. Acta Crystallogr. 2007, B63, 768–782. [Google Scholar] [CrossRef] [PubMed]
  16. Bruno, I.J.; Cole, J.C.; Kessler, M.; Luo, J.; Motherwell, W.D.S.; Purkis, L.H.; Smith, B.R.; Taylor, R.; Cooper, R.I.; Harris, S.E.; et al. Retrieval of Crystallographically-Derived Molecular Geometry Information. J. Chem. Inf. Comput. Sci. 2004, 44, 2133–2144. [Google Scholar] [CrossRef] [PubMed]
  17. Jérome, D. Organic Conductors: From Charge Density Wave TTF−TCNQ to Superconducting (TMTSF)2PF6. Chem. Rev. 2004, 104, 5565–5592. [Google Scholar] [CrossRef] [PubMed]
  18. Eldridge, J.E.; Wang, H.H.; Kini, A.M.; Schlueter, J.A. Assignment of the Raman spectra of some deuterated-BEDT-TTF superconductors. Spectrochim. Acta A Mol. Biomol. Spectrosc. 2002, 58, 2237–2243. [Google Scholar] [CrossRef]
  19. Yakushi, K. Infrared and Raman Studies of Charge Ordering in Organic Conductors, BEDT-TTF Salts with Quarter-Filled Bands. Crystals 2012, 2, 1291–1346. [Google Scholar] [CrossRef]
  20. Van Duyne, R.P.; Cape, T.W.; Suchanski, M.R.; Siedle, A.R. Determination of the extent of charge transfer in partially oxidized derivatives of tetrathiafulvalene and tetracyanoquinodimethan by resonance Raman spectroscopy. J. Phys. Chem. 1986, 90, 739–743. [Google Scholar] [CrossRef]
  21. Clemente, D.A.; Marzotto, A. Structure of two polymorphs of the TTF-TCNE charge-transfer complex and the degree of ionicity. J. Mater. Chem. 1996, 6, 941–946. [Google Scholar] [CrossRef]
  22. Salmerón-Valverde, A. Síntesis y estudio del grado de transferencia de carga de complejos moleculares de tetratiafulvaleno (TTF) con derivados de fluoreno. Ph.D. Thesis, Universidad Autónoma de Puebla, 2008. [Google Scholar]
  23. Loufty, R.O.; Hsiao, C.K.; Ong, B.S.; Keoshkerian, B. Electrochemical evaluation of electron acceptor materials. Can. J. Chem. 1984, 62, 1877–1885. [Google Scholar]
  24. Wheland, R.C. Correlation of Electrical Conductivity in Charge-Transfer Complexes with Redox Potentials, Steric Factors, and Heavy Atom Effects. J. Am. Chem. Soc. 1976, 98, 3926–3930. [Google Scholar] [CrossRef]
  25. Sulzberg, T.; Cotter, R.J. Electron acceptors derived from fluorenecarboxylic acids and their charge-transfer complexes. J. Org. Chem. 1970, 35, 2762–2769. [Google Scholar] [CrossRef]
  26. Siemens. XSCANS; Siemens Analytical X-ray Instruments Inc.: Madison, WI, USA, 1996. [Google Scholar]
  27. North, A.C.T.; Phillips, D.C.; Mathews, F.S. A semi-empirical method of absorption correction. Acta Crystallogr. 1968, A24, 351–359. [Google Scholar] [CrossRef]
  28. Sheldrick, G.M. Crystal structure refinement with SHELXL. Acta Crystallogr. 2015, C71, 3–8. [Google Scholar]
  29. Morita, Y.; Murata, T.; Nakasuji, K. Cooperation of Hydrogen-Bond and Charge-Transfer Interactions in Molecular Complexes in the Solid State. Bull. Chem. Soc. Jpn. 2013, 86, 183–197. [Google Scholar] [CrossRef]
  30. Fourmigué, M.; Batail, P. Activation of Hydrogen- and Halogen-Bonding Interactions in Tetrathiafulvalene-Based Crystalline Molecular Conductors. Chem. Rev. 2004, 104, 5379–5418. [Google Scholar] [CrossRef] [PubMed]
  31. El-Ghayoury, A.; Mézière, C.; Simonov, S.; Zorina, L.; Cobián, M.; Canadell, E.; Rovira, C.; Náfrádi, B.; Sipos, B.; Forró, L.; et al. A Neutral Zwitterionic Molecular Solid. Chem. Eur. J. 2010, 16, 14051–14059. [Google Scholar] [CrossRef] [PubMed] [Green Version]
  32. Isono, T.; Kamo, H.; Ueda, A.; Takahashi, K.; Nakao, A.; Kumai, R.; Nakao, H.; Kobayashi, K.; Murakami, Y.; Mori, H. Hydrogen bond-promoted metallic state in a purely organic single-component conductor under pressure. Nat. Commun. 2013, 4. [Google Scholar] [CrossRef] [PubMed]

