Article

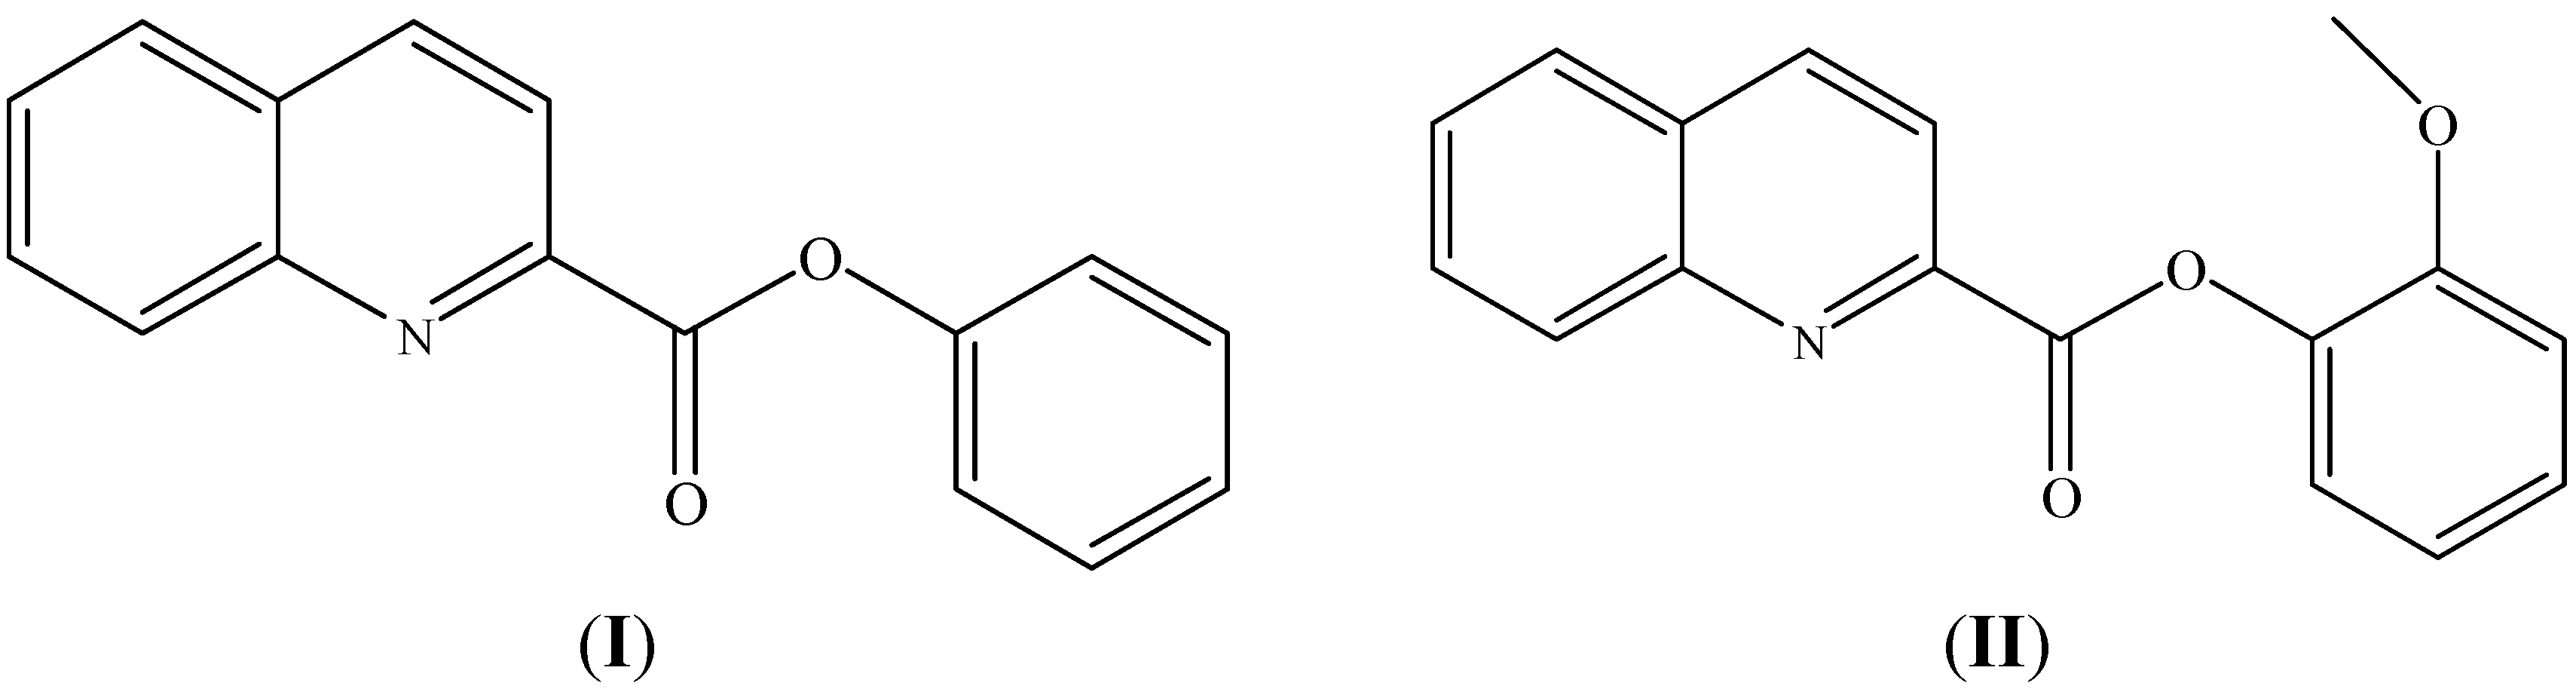
Synthesis, Crystal and Molecular Structure Studies and DFT Calculations of Phenyl Quinoline-2-Carboxylate and 2-Methoxyphenyl Quinoline-2-Carboxylate; Two New Quinoline-2 Carboxylic Derivatives

by
Edakot Fazal
1,
Jerry P. Jasinski
2,*,
Brian J. Anderson
2,
Manpreet Kaur
3,
Subban Nagarajan
4 and
Belgur Satyanarayana Sudha
1
1
Department of Chemistry, Yuvarajaʼs College, University of Mysore, Mysore-570 005, India
2
Department of Chemistry, Keene State College, 229 Main Street, Keene, NH 03435-2001, USA
3
Department of Studies in Chemistry, University of Mysore, Manasagangotri, Mysore 570 006, India
4
Spice and Flavor Science Department, CSIR-Central Food Technological Research institute, Mysore 570005, India
*
Author to whom correspondence should be addressed.
Crystals 2015, 5(1), 100-115; https://doi.org/10.3390/cryst5010100
Submission received: 15 December 2014 / Revised: 8 January 2015 / Accepted: 12 January 2015 / Published: 12 February 2015

Abstract

:
The crystal and molecular structures of the title compounds, phenyl quinoline-2-carboxylate and 2-methoxyphenyl quinoline-2-carboxylate, two new derivatives of quinolone-2-carboxylic acid, are reported and confirmed by single crystal X-ray diffraction and spectroscopic data. Compound (I), C16H11NO2, crystallizes in the monoclinic space group P21/c, with 8 molecules in the unit cell. The unit cell parameters are a = 14.7910(3) Å; b = 5.76446(12) Å; c = 28.4012(6) Å; β = 99.043(2)°; V = 2391.45(9) Å3. Compound (II), C17H13NO5, crystallizes in the monoclinic space group P21/n with 4 molecules in the unit cell. The unit cell parameters are a = 9.6095(3) Å; b = 10.8040(3) Å; c = 13.2427(4) Å; β = 102.012(3)°; V = 1344.76(7) Å3. Density functional theory (DFT) geometry optimized molecular orbital calculations were performed and frontier molecular orbitals of each compound are displayed. Correlation between the calculated molecular orbital energies (eV) for the surfaces of the frontier molecular orbitals to the electronic excitation transitions from the absorption spectra of each compound has been proposed. Additionally, similar correlations observed among six closely related compounds examining small structural differences to their frontier molecular orbital surfaces and from their DFT molecular orbital energies, provide further support for the suggested assignments of the title compounds.

1. Introduction

Quinoline-2 carboxylic acid derivatives are a class of important materials as anti-tuberculosis agents, as fluorescent reagents, hydrophobic field-detection reagents, visualization reagents, fluorescent labelled peptide probes and as anti-hyperglycemics. Quinoline derivatives represent a major class of heterocycles and are found in natural products [1,2], numerous commercial products, including fragrances, dyes [3] and biologically active compounds [4,5]. Quinoline alkaloids such as quinine, chloroquin, mefloquine and amodiaquine are used as efficient drugs for the treatment of malaria [6]. Quinoline as a privileged scaffold in cancer drug discovery is also published [7]. The crystal structures of 4-methylphenyl quinoline-2-carboxylate [8], 4-chloro-3-methylphenyl quinoline-2-carboxylate [9], 4-chlorophenyl quinoline-2-carboxylate [10], 3,4-dimethylphenyl quinoline-2-carboxylate [11], 2-isopropyl-5-methylcyclohexyl quinoline-2-carboxylate [12], 2,5-dimethylphenyl quinoline-2-carboxylate [13] and the synthesis and theoretical studies of four Schiff bases derived from 4-hydrazinyl-8-(trifluoromethyl) quinoline [14] have been reported. In view of the importance of quinolines, we report here the synthesis, crystal structures and theoretical calculations for two new derivatives of quinoline-2 carboxylic acid, namely, phenyl quinoline-2-carboxylate (I) and 2-methoxyphenyl quinoline-2-carboxylate (II) (Figure 1) supported by density functional theory (DFT) calculations correlating the calculated molecular orbital energies (eV) for the surfaces of the frontier molecular orbitals to the electronic excitation transitions from the absorption spectra of each compound.
Figure 1. The molecular structures of C16H11NO2 (I) and C17H13NO3 (II).
Crystals 05 00100 g001

2. Results and Discussion

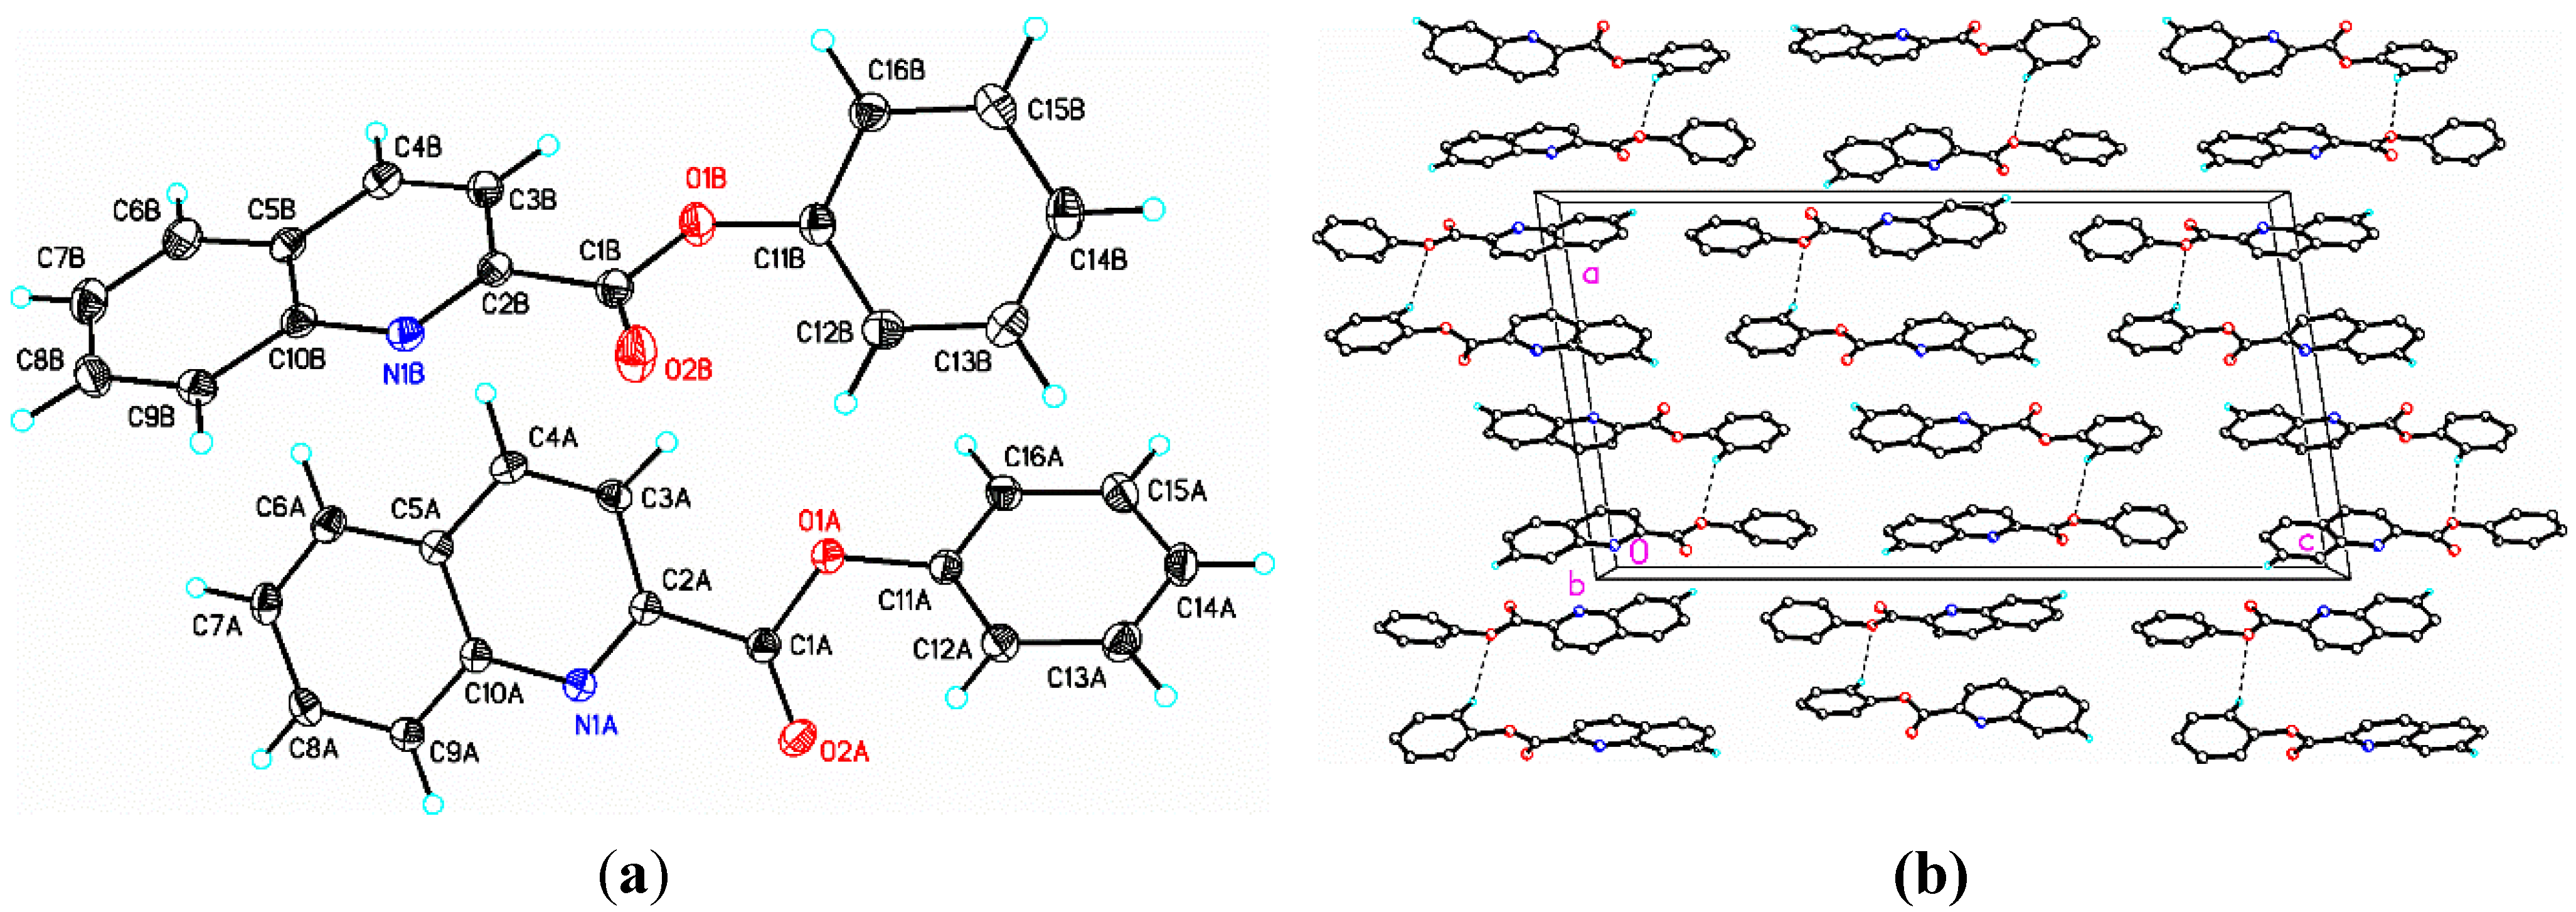
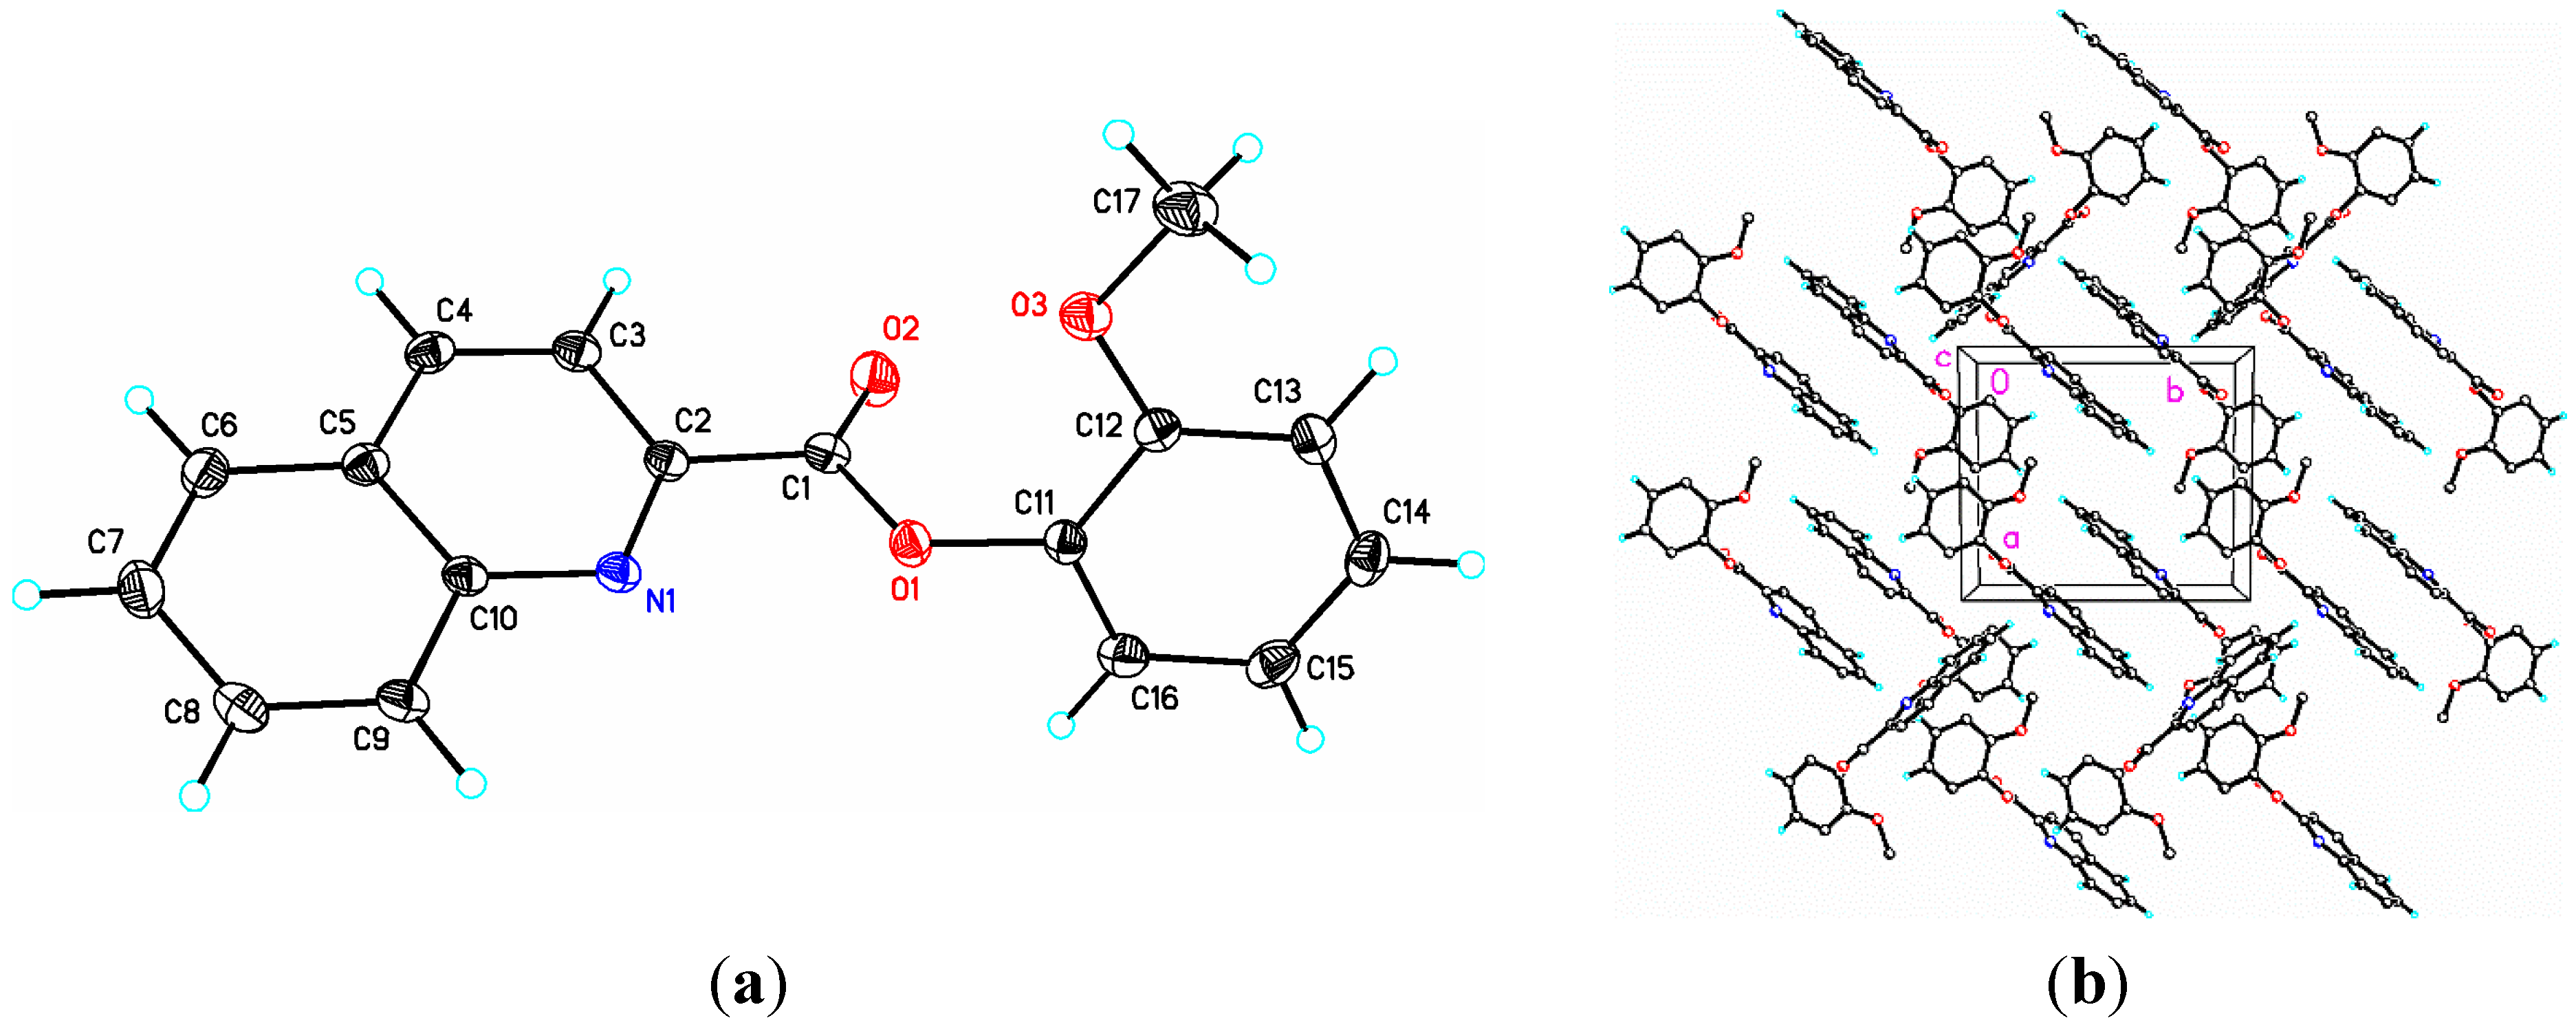
2.1. Structural Study of (I): Phenyl Quinoline-2-Carboxylate

The asymmetric unit of In (I), C16H11NO2, contains two molecules. Bond lengths are in normal ranges [15] (Table 1). The dihedral angle between the mean planes of the quinoline and phenyl rings is 55.3(9)° in molecule A and 56.4(9)° in molecule B (Figure 2a). The carboxylate group is twisted by 3.8(2)° (A) and 3.5(3)° (B), respectively from the mean plane of the quinoline group. A weak C12B---H12B O1A intermolecular interaction is observed between a carboxyl oxygen atom and a phenyl hydrogen atom from nearby molecules within the asymmetric unit forming dimers stacked along the a axis of the unit cell (Figure 2b). No classical hydrogen bonds were observed. Additional weak C---H O intermolecular interactions and π–π stacking interactions between the two rings of the quinoline group and carboxyl oxygen atoms of nearby molecules are also observed (Table 2).
Figure 2. (a) Molecular structure of C16H11NO2 (I), showing the atom numbering scheme with 30% probability ellipsoids; (b) Packing diagram for (I) viewed along the b axis. H atoms not involved in hydrogen bonding have been removed for clarity.
Crystals 05 00100 g002
Table 1. Selected crystal and DFT* bond lengths (Å), bond angles (°), and torsion angles (°) for (I), C16H11NO2.
Atoms(I) Distance(I)DFT(I)Atoms(I)Distance(I)DFT(I)
O1A–C1A 1.354(3)*1.373O2A–C1A1.192(3)*1.204
O1A–C11A1.408(2)*1.397N1A–C2A1.313(3)*1.321
N1A–C10A1.369(3)*1.359C1A–C2A1.510(3)*1.509
C2A–C3A1.416(3)*1.422C3A–C4A1.362(3)*1.374
C6A–C7A1.361(3)*1.377C8A–C9A1.373(3)*1.375
C9A–C10A1.414(3)*1.422C12A–C13A1.384(3)*1.395
C14A–C15A1.390(3)*1.396O1B–C1B1.354(3)*1.397
O2B–C1B1.197(3)*1.204O1B–C11B1.410(2)*1.397
N1B–C2B1.316(3)*1.321N1B–C10B1.369(3)*1.359
C13B–C14B1.387(4)*1.396C15B–C16B 1.389(3)*1.395
Atoms(I)Angles(I)DFT(I)Atoms(I)Angles(I)DFT(I)
C1A–O1A–C11A120.80(16)*121.01C2A–N1A–C10A117.27(18)*118.24
O1A–C1A–O2A124.48(19)*124.54O1A–C1A–C2A109.42(17)*110.02
O2A–C1A–C2A126.08(19)*126.44N1A–C2A–C1A114.84(18)*114.75
N1A–C2A–C3A124.48(18)*123.74C3A–C2A–C1A120.65(18)*121.51
C4A–C3A–C2A118.52(19)*118.54C3A–C4A–C5A119.70(19)*119.76
C4A–C5A–C6A123.30(19)*123.68C7A–C6A–C5A120.2(2)*120.30
C9A–C8A–C7A120.9(3)*120.57N1A–C10A–C5A122.32(18)*122.55
N1A–C10A–C9A118.32(19)*118.31C9A–C10A–C5A119.36(18)*119.14
C12A–C11A–O1A122.01(19)*122.70C12A–C11A–C16A122.26(19)*121.25
C16A–C11A–O1A115.47(18)*115.93C11A)–12A–C13A 118.5(3)*118.65
C16A–C15A–C14A120.3(2)*120.16C1B–O1B–C11B 119.21(16)*121.01
C2B–N1B–C10B117.52(18)*118.24O2B–C1B–O1B124.19(19)*125.44
O1B–C1B–C2B109.75(79)*110.02O2B–C1B–C2B126.05192)*126.44
N1B–C2B–C1B114.12(18)*114.75N1B–C2B–C3B 124.43(19)*123.74
C8B–C9B–C10B 120.1(2)*120.26N1B–C10B–C5B 121.97(19)*122.55
N1B–C10B–C9B 118.69(19)*118.31C12B–C11B–O1B120.97(19)*122.70
Atoms(I)Torsion(I)DFT(I)Atoms(I)Torsion(I)DFT(I)
O1A–C1A–C2A–N1A175.65(17)*178.71O1A–C1A–C2A–C3A−2.9(3)*−1.51
O2A–C1A–C2A–N1A−2.8(3)*1.07O2A–C1A–C2A–C3A178.7(2)*178.71
O1A–C11A–C12A–C13A−174.10(19)*−176.19O1A–C11A–C16A–C15A175.39(18)*176.26
N1A–C2A–C3A–C4A0.8(3)*0.11C1A–O2A–C11A–C12A−57.0(3)*−47.75
C1A–O2A–C11A–C16A128.7(2)*136.27C2A–N1A–C10A–C9A178.75(17)*179.87
C4A–C5A–C10A–N1A0.6(3)*0.03C10A–N1A–C2A–C1A−178.67(16)*−170.93
O1B–C1B–C2B–N1B175.70(17)*178.71O1B–C1B–C2B–C3B−4.5(3)*−1.51
O2B–C1B–C2B–N1B−4.1(3)*−1.07O2B–C1B–C2B–C3B175.7(2)*178.71
O1B–C11B–C12B–C13B175.20(18)*176.19O1B–C11B–C16B–C15B−176.16(18)*−176.19
C4B–C5B–C10B–N1B−2.4(3)*−0.03C10B–N1B–C2B–C3B1.5(3)*0.15
Table 2. Weak Intermolecular Interactions for (I) C16H11NO2, (Å and °).
D---Hd(D---H)d(H…A)d(D…A)<(DHA)
C8A---H8A…O2A #10.952.643.418(3)139.6
C8B---H8B…O2B #20.952.953.38132)141.5
C12B---H12B…O1A0.952.693.498(3)143.5
Cg1---Cg1 #33.8913(11)
Cg1---Cg2 #33.7842(12)
Cg5---Cg5 #43.8576(11)
Cg5---Cg6 #43.9654(12)
Notes: Symmetry transformations used to generate equivalent atoms: #1 2 − x, 2 − y,1 − z; #2 1 – x, 1 – y, 1 – z; #3 2 – x, 1 – y, 1 – z; #4 1 – x, −y, 1 – z; Cg1 = N1A/C2A/C3A/C4A/C5A/C10A; Cg2 = C5A–C10A; Cg5 = N1B/C2B/C3B/C4B/C5B/C10B; Cg6 = C5B–C10B.
After a DFT geometry optimization calculation for (I), the dihedral angle between the mean planes of the quinoline and phenyl rings becomes 46.9(1)°, a decrease of 8.4(8)° in molecule A or 9.5(8)° in molecule B (Figure 2a). The mean plane of the carboxylate group (O2/C1/O1/C2) is twisted by 1.3(4)°, from that of the quinoline group, an increase of 3.8(2)° in molecule A or 3.5(3)° in molecule B, respectively. These changes as well as changes in the C11/O2/C1/O1 torsion angle from −3.2(2)° to 0.2(1)° in molecule A or from −2.9(3)° to 0.2(1)° in molecule B after the geometry optimization DFT calculation suggests that while the observed C---H…O and π–π weak intermolecular interactions (Table 2) may influence somewhat the packing arrangement, only a high ΔEconfig value representing energy differences between the optimized and experimental electronic transitions would be indicative of a significant departure from the ideal molecular conformation in the gas phase and, therefore, influence the crystal packing.

2.2. Structural Study of (II): 2-Methoxyphenyl Quinoline-2-Carboxylate

In (II), C17H13NO3, the dihedral angle between the mean planes of the quinoline and phenyl rings is 67.4(6)° in the molecule (Figure 3a). The carboxylate group is twisted by 79.5(0)° from the mean plane of the phenyl group. Bond lengths are in normal ranges [15] (Table 3). A weak C9---H9…O2 intermolecular interaction and weak π–π stacking interactions (Figure 3b) between the two rings of the quinoline groups of nearby molecules are also observed (Table 4). No classical hydrogen bonds were observed.
After a DFT geometry optimization calculation he dihedral angle between the mean planes of the quinoline and 2-methoxyphenyl rings becomes 72.2(8)°, an increase of 4.8(2)° (Figure 3a). The mean plane of the carboxylate group (O2/C1/O1/C2) is twisted by 0.3(1)o, from that of the quinoline group, a decrease of 13.3(5)°. These changes as well as changes in the C11/O1/C1/O2 torsion angle from 1.7(3)° to 4.0(8)° after the geometry optimization DFT calculation suggests that while the observed C---H…O and π–π weak intermolecular interactions (Table 4) influence somewhat the packing arrangement, only a high ΔEconfig value representing energy differences between the optimized and experimental electronic transitions would be indicative of a significant departure from the ideal molecular conformation in the gas phase and, therefore, influence the crystal packing.
Figure 3. (a) Molecular structure of C17H13NO3, (II), showing the atom numbering scheme with 30% probability ellipsoids; (b) Packing diagram for (II) viewed along the c axis. H atoms not involved in hydrogen bonding have been removed for clarity.
Crystals 05 00100 g003
Table 3. Selected crystal and DFT* bond lengths (Å), bond angles (°), and torsion angles (°) for (II), C17H13NO3.
Atoms(II) Distance(II)DFT(II)Atoms(II)Distance(II)DFT(II)
O2–C11.1997(16)*1.210O1–C11.3494(15)*1.358
O1–C111.4062(15)*1.358O3–C121.3626(16)*1.360
O3–C171.4283(17)*1.419N1–C2 1.3183(16)*1.320
N1–C101.3668(16)*1.361C1–C2 1.5021(18)*1.504
C2–C31.4131(18)*1.421C3–C41.3596(19)*1.373
C4–C51.4140(19)*1.418C5–C61.4178(19)*1.419
C5–C101.4194(18)*1.433C6–C71.363(2)*1.377
C7–C81.412(2) *1.419C8–C91.3660(2)*1.376
C9–C101.4197(18) *1.422C11–C121.3950(18)*1.407
C11–C161.3757(19)*1.366C12–C131.3930(18)*1.398
C13–C141.387(2)*1.399C14–C151.379(2)*1.392
Atoms(II)Angles(II)DFT(2)Atoms(II)Angles(II)DFT(II)
C1–O1–C11117.72(10)*117.76C2–N1–C10 117.26(11)*117.91
O1–C1–O2124.39(12)*124.52O1–C1–C2111.51(10)*112.25
O2–C1–C2124.39(12)*123.22N1–C2–C1117.83(11)*118.95
N1–C2–C3124.33(12)*124.10C3–C2–C1117.82(11)*116.95
C4–C3–C2118.66(12)*118.54C4–C5–C6123.26(12)*123.56
C4–C5–C10117.54(12)*117.30C6–C5–C1119.18(12)*119.14
C8–C9–C10120.29(12)*120.36N1–C10–C5122.69(11)*122.58
N1–C10–C9118.33(11)*118.31C12–C11–O1119.51(11)*119.76
C16–C11–O1118.66(12)*118.90C2–N1–C10117.26(11)*117.91
Atoms(II)Torsion(II)DFT(II)Atoms(II)Torsion(II)DFT(II)
O1–C1–C2–N1−13.46(16)*−0.14O1–C1–C2–C3164.87(11)*179.72
O2–C1–C2–N1167.42(13)*179.29O2–C1–C2–C3−14.25(19)*−0.56
O2–C1–O1–C111.74(19)*4.08O1–C11–C16–C15−173.64(12)*−176.06
N1–C2–C3–C40.5(2)*0.15C1–O1–C11–C12−104.49(14)*−72.68
C1–O1–C11–C16−104.49(14)*−111.70C2–N1–C10–C50.68(17)*0.07
C2–N1–C10–C9−177.81(11)*−180C4–C5–C10–N10.30(18)*0.11
C11–O1–C1–O21.74(19)*4.08C11–O1–C1–C21.74(19)*176.78
Table 4. Weak Intermolecular Interactions for (II) C17H13NO3, (Å and °).
D---Hd(D---H)d(H…A)d(D…A)<(DHA)
C9---H9…O2 #10.952.613.4207(16)143.8
Cg1---Cg1 #23.7719(7)
Cg1---Cg2 #23.6878(8)
Notes: Symmetry transformations used to generate equivalent atoms: #1x, −1/2 + y, −1/2 – z; #2x, 1 – y, 1 – z; Cg1 = N1/C2/C3/C4/C5/C10; Cg2 = C5–C10.

2.3. Computational Details

A density functional theory (DFT) molecular orbital calculation (WebMoPro) [16] with the GAUSSIAN-03 program package [17] employing the B3LYP (Becke three parameter Lee–Yang–Parr) exchange correlation functional, which combines the hybrid exchange functional of Becke [18,19] with the gradient correlation functional of Lee, Yang and Parr [19] and the 6–31 G(d) basis set [20] was performed on each of the two molecules (I and II) studied. No solvent corrections were made with these calculations. Starting geometries were taken from X-ray refinement data. The optimized results in the free molecule or gas phase state are, therefore, compared to those in the crystalline state. Experimentally determined oscillator strengths (f) were determined by use of the equation relating them to the molar decadic absorption coefficient (e) (f = 4.32 × 10⁻⁹emax·Δx1/2) [21,22]. The molar decadic absorption coefficient measures the intensity of the optical absorption at a given wavelength. Deconvolution of the spectra to obtain the emax and Δx1/2 values was carried out by the IGOR program [23]. Discrepancies between the experimental and calculated band centers and band intensities exist. However, this does not prohibit us from making informed decisions on the observations since it is generally known that DFT often underestimates HOMO–LUMO gaps, thereby having a tendency to give excitations far too low in energy. All calculations were performed on a workstation PC using default convergence criteria.

2.4. Theoretical Density Functional Theory (DFT) Calculations for (I) and (II)

From a DFT molecular orbital calculation for each molecule (I) and (II), surface plots for the two highest occupied molecular orbital (HOMO and HOMO−1) and four lowest unoccupied molecular orbitals (LUMO, LUMO+1, LUMO+2, LUMO+3) are displayed to provide visual evidence of the molecular orbitals involved in the spectroscopic electronic energy transitions examined. Based on correlation of the energies of these HOMO–LUMO frontier surfaces to the UV-Vis absorption spectra (Table 5), electronic excitation transition predications are suggested.
Table 5. Experimental and Calculated Energy of Molecular Orbitals of (I) and Associated Transitions.
λmax (nm/eV)Experimental (MO Contributions)f*λmax (nm/eV)Calculated (MO Contributions)
322/3.85HOMO→LUMO0.87267/4.64HOMO→LUMO
322/3.85HOMO−1→LUMO0.87261/4.75HOMO−1→LUMO
322/3.85HOMO→LUMO+10.87224/5.54HOMO→LUMO+1
322/3.85HOMO−1→LUMO+10.87219/5.66HOMO−1→LUMO+1
322/3.85HOMO→LUMO+20.87193/6.42HOMO→LUMO+2
322/3.85HOMO→LUMO+30.87190/6.53HOMO−1→LUMO+2
322/3.85HOMO−1→LUMO+20.87189/6.56HOMO→LUMO+3
Notes: f*, f = 4.32 × 10⁻⁹εmax·Δω1/2 Frontier molecular orbitals from output in B3LYP G(d) calculation.

2.5. DFT Frontier Molecular Orbitals for (I)

Calculated molecular orbital energies (eV) for the surfaces of the frontier molecular orbitals for (I) are shown in Figure 4a and Table 5. In HOMO−1 and HOMO, electronic clouds are distributed primarily on the phenyl and quinoline groups, respectively. In LUMO, LUMO+1, electronic clouds are delocalized primarily on the quinoline ring while In LUMO+2 and LUMO+3 electron clouds are delocalized on the phenyl ring. The observed experimental absorption spectrum shows one intense band envelope at λmax = 322 nm. Electronic transitions are generally paired between the various molecular orbitals of the ground and excited states corresponding to this single band envelope as indicated in Table 5. Therefore, the absorption band envelope at 322 nm is assigned to overlapping contributions from each of HOMO→LOMO, HOMO−1→LUMO, HOMO→LOMO+1, HOMO−1→LUMO+1, HOMO→LUMO+2, HOMO−1→LUMO+2 and HOMO→LUMO+3, respectively. The energy differences (ΔEconfig) between the optimized and experimental electronic transitions for (I) are 0.79, 0.90, 1.69, 1.81, 2.57, 2.86 and 2.71 eV, respectively, that are associated with the broad band envelope at 322 nm. However, this comparison while suggestive of some interaction, is inconclusive in relation to an extension of their effects on crystal packing.
Figure 4. Calculated frontier molecular orbitals for (I) and (II). (a) C16H11NO2 (I); (b) C17H13NO3 (II).
Crystals 05 00100 g004

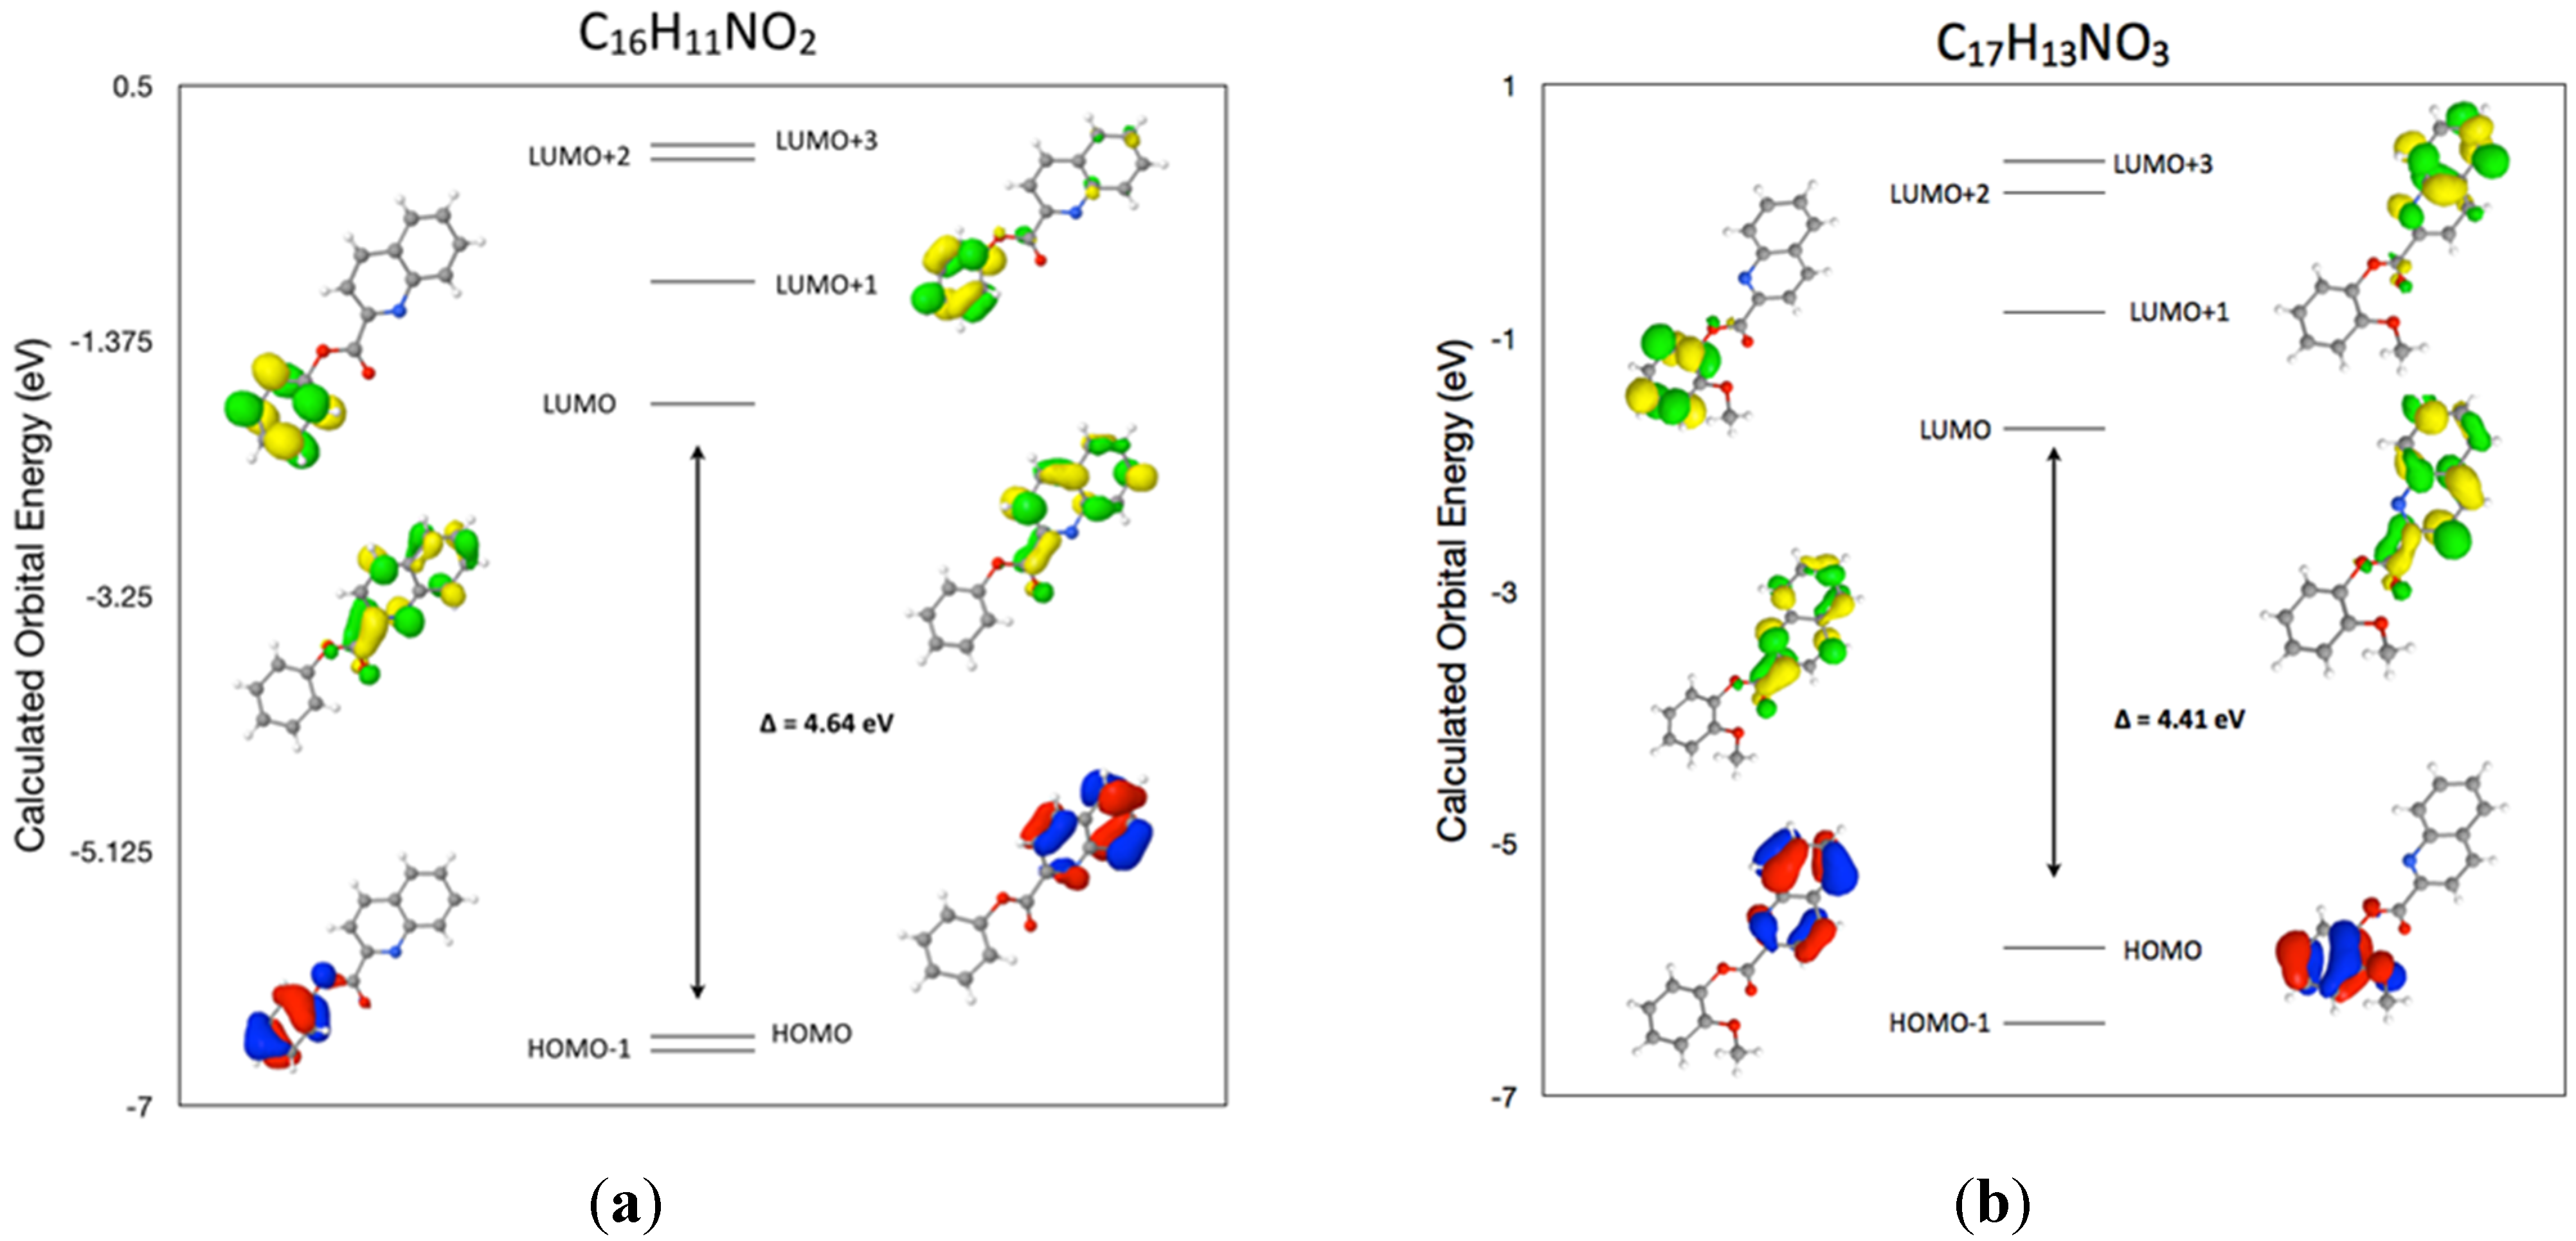
2.6. DFT Frontier Molecular Orbitals for (II)

Calculated molecular orbital energies (eV) for the surfaces of the frontier molecular orbitals for (II) are shown in Figure 4b and Table 6. In HOMO−1 and HOMO, electronic clouds are distributed primarily on the quinoline and methoxyphenyl groups, respectively. In LUMO, LUMO+1 and LUMO+3 electronic clouds are delocalized primarily on the quinoline ring while in LUMO+2 electron clouds are delocalized on the 2-methoxyphenyl ring. The observed experimental absorption spectrum shows one intense band envelope at λmax = 254 nm and a second less intense band envelope at 319 nm. Electronic transitions are generally paired between the various molecular orbitals of the ground and excited states corresponding to these two band envelopes as indicated in Table 6. Therefore, the absorption band envelope at 254 nm is assigned to overlapping contributions from each of HOMO→LOMO, HOMO−1→LUMO and HOMO→LOMO+1 while the band envelope at 319 nm is assigned to HOMO−1→LUMO+1, HOMO→LUMO+2, HOMO−1→LUMO+2 and HOMO→LUMO+3, respectively. The energy differences (ΔEconfig) between the optimized and experimental electronic transitions for (II) are 0.23, 0.83 and 1.16 eV for the band envelope at 319 nm and 0.76, 1.11, 1.35 and 1.68 eV associated with the band envelope at 254 nm, respectively. As with (I), this comparison while suggestive of some interaction, it is also inconclusive in relation to an extension of their effects on crystal packing.
Table 6. Experimental and calculated energy of molecular orbitals of (II) and associated transitions.
λmax (nm/eV)Experimental (MO Contributions)f*λmax (nm/eV)Calculated (MO Contributions)
319/3.88HOMO→LUMO1.97302/4.11HOMO→LUMO
319/3.88HOMO−1→LUMO1.97263/4.71HOMO−1→LUMO
319/3.88HOMO→LUMO+11.97246/5.04HOMO→LUMO+1
254/4.88HOMO−1→LUMO+10.72220/5.64HOMO−1→LUMO+1
254/4.88HOMO→LUMO+20.72207/5.99HOMO→LUMO+2
254/4.88HOMO→LUMO+30.72199/6.23HOMO→LUMO+3
254/4.88HOMO−1→LUMO+20.72189/6.56HOMO−1→LUMO+2
Notes: f*, f = 4.32 × 10⁻⁹εmax·Δω1/2 Frontier molecular orbitals from output in B3LYP G(d) calculation.

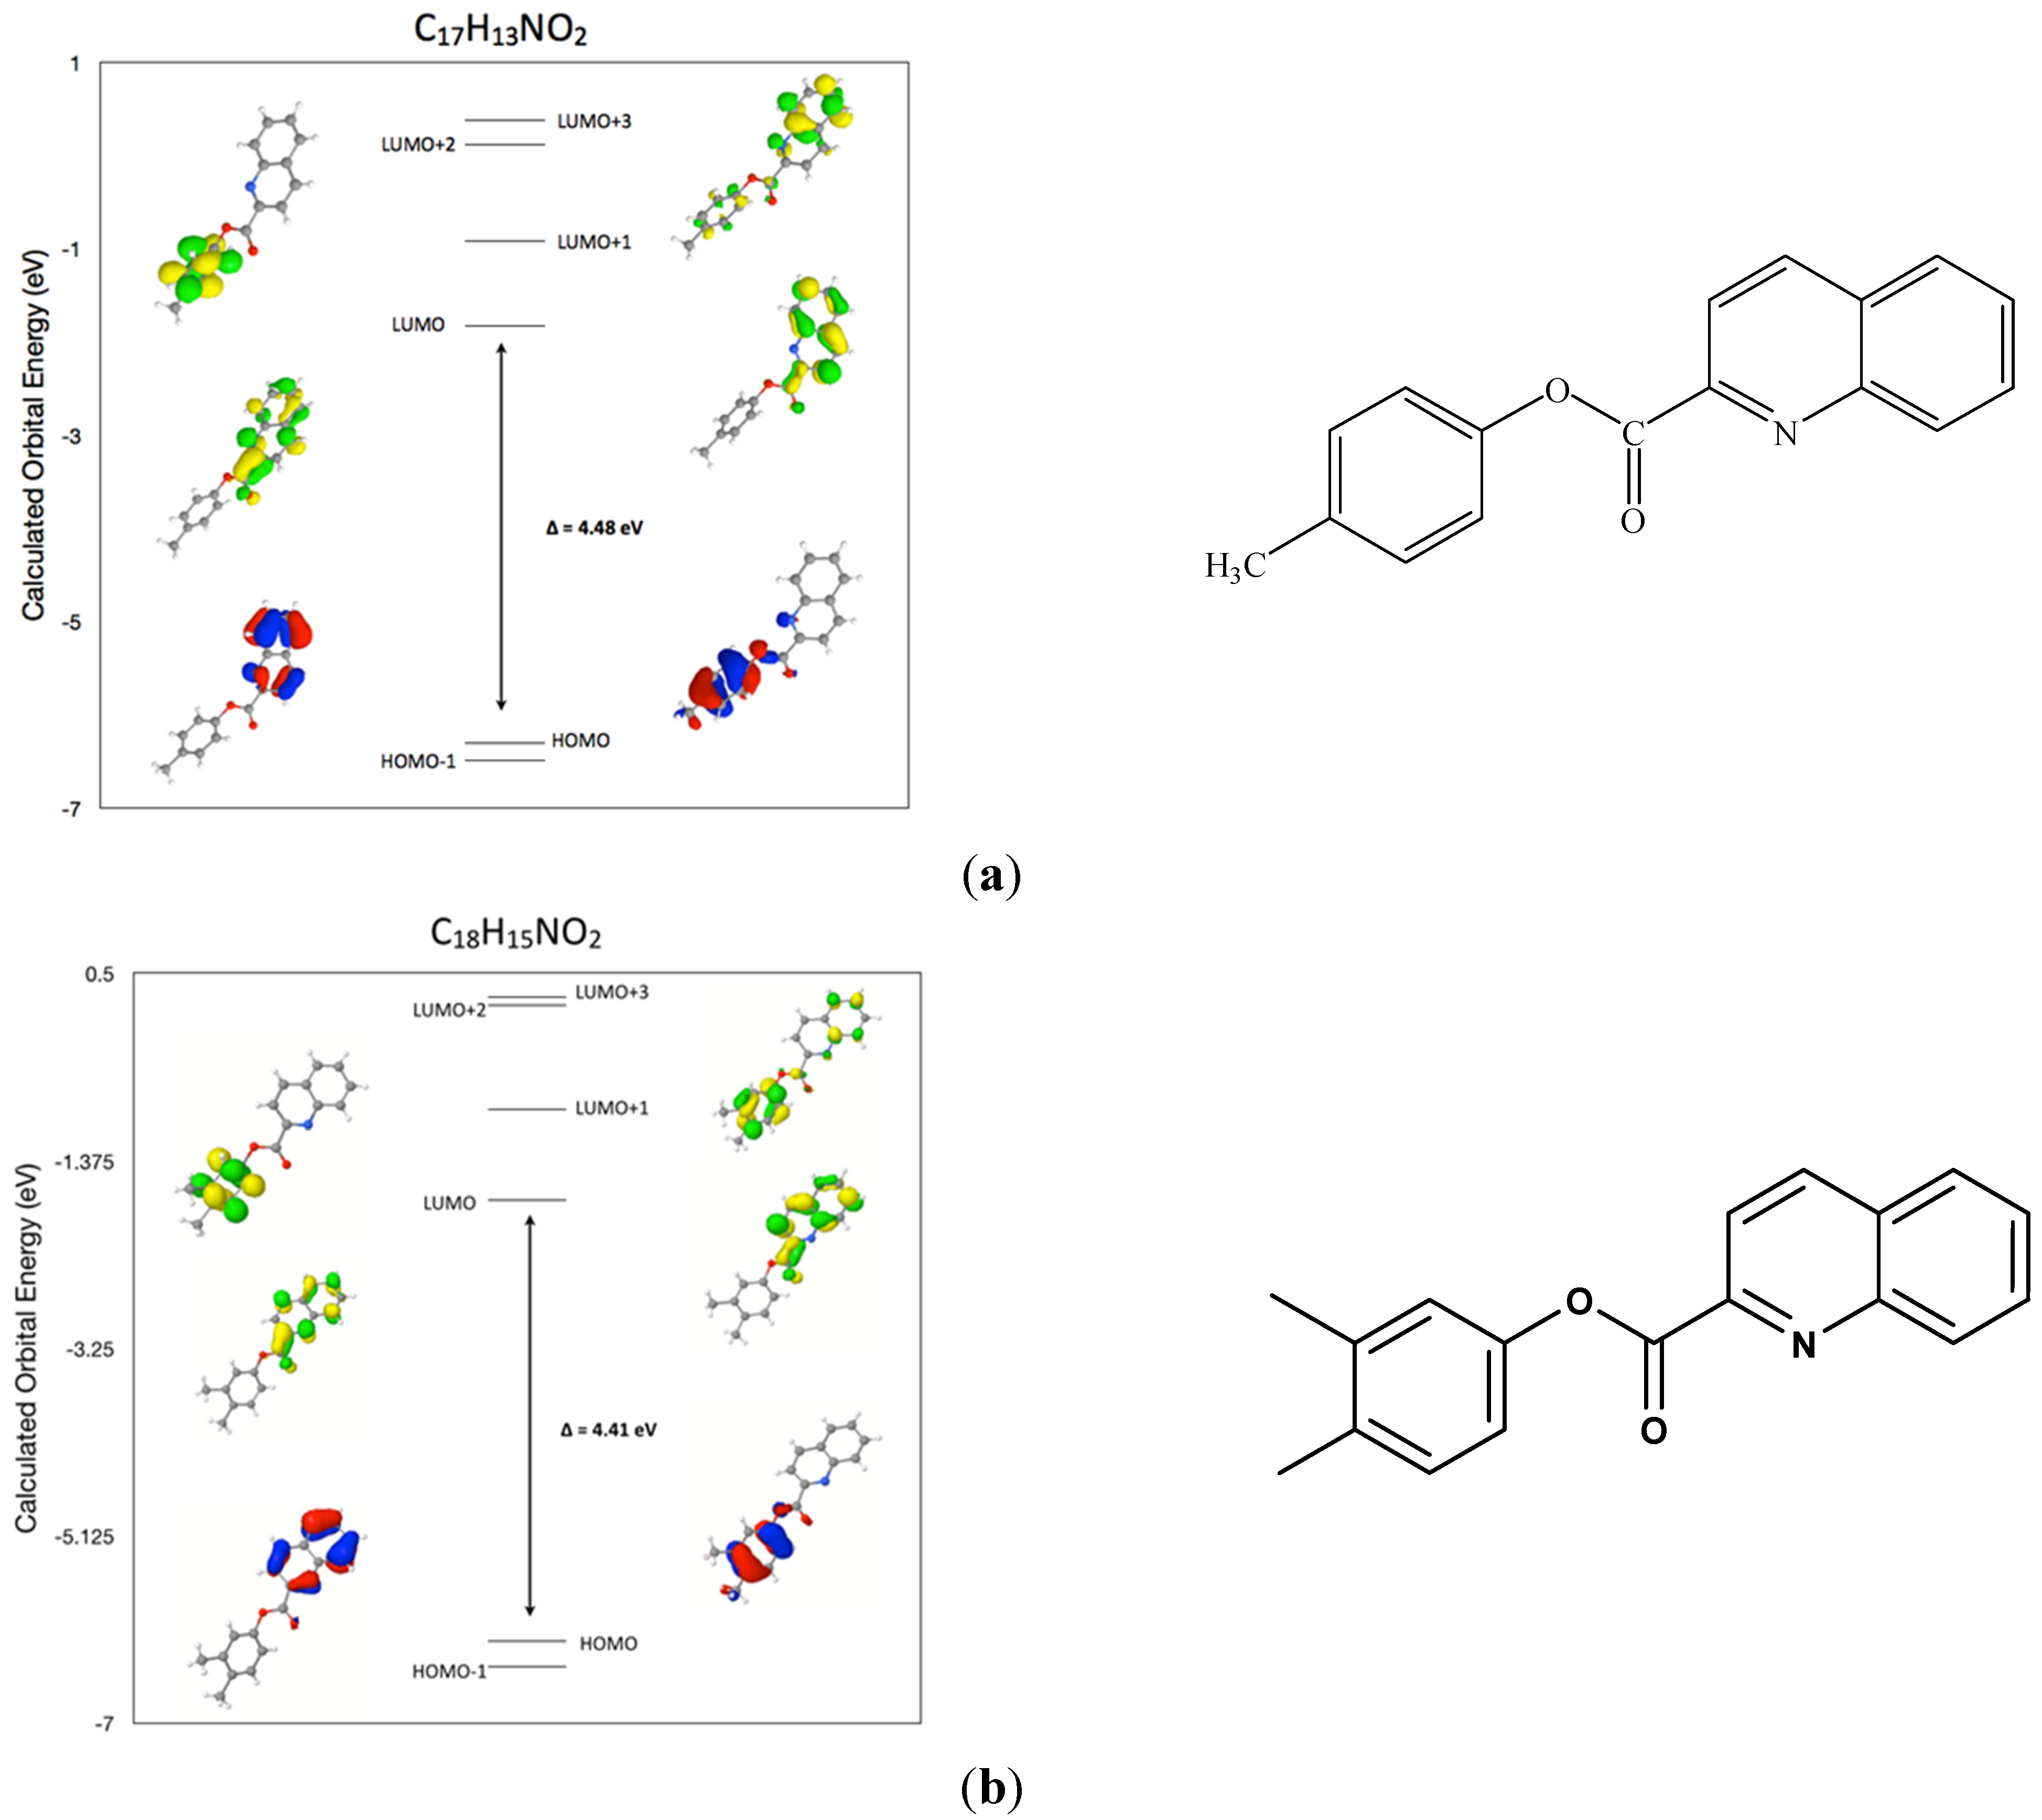
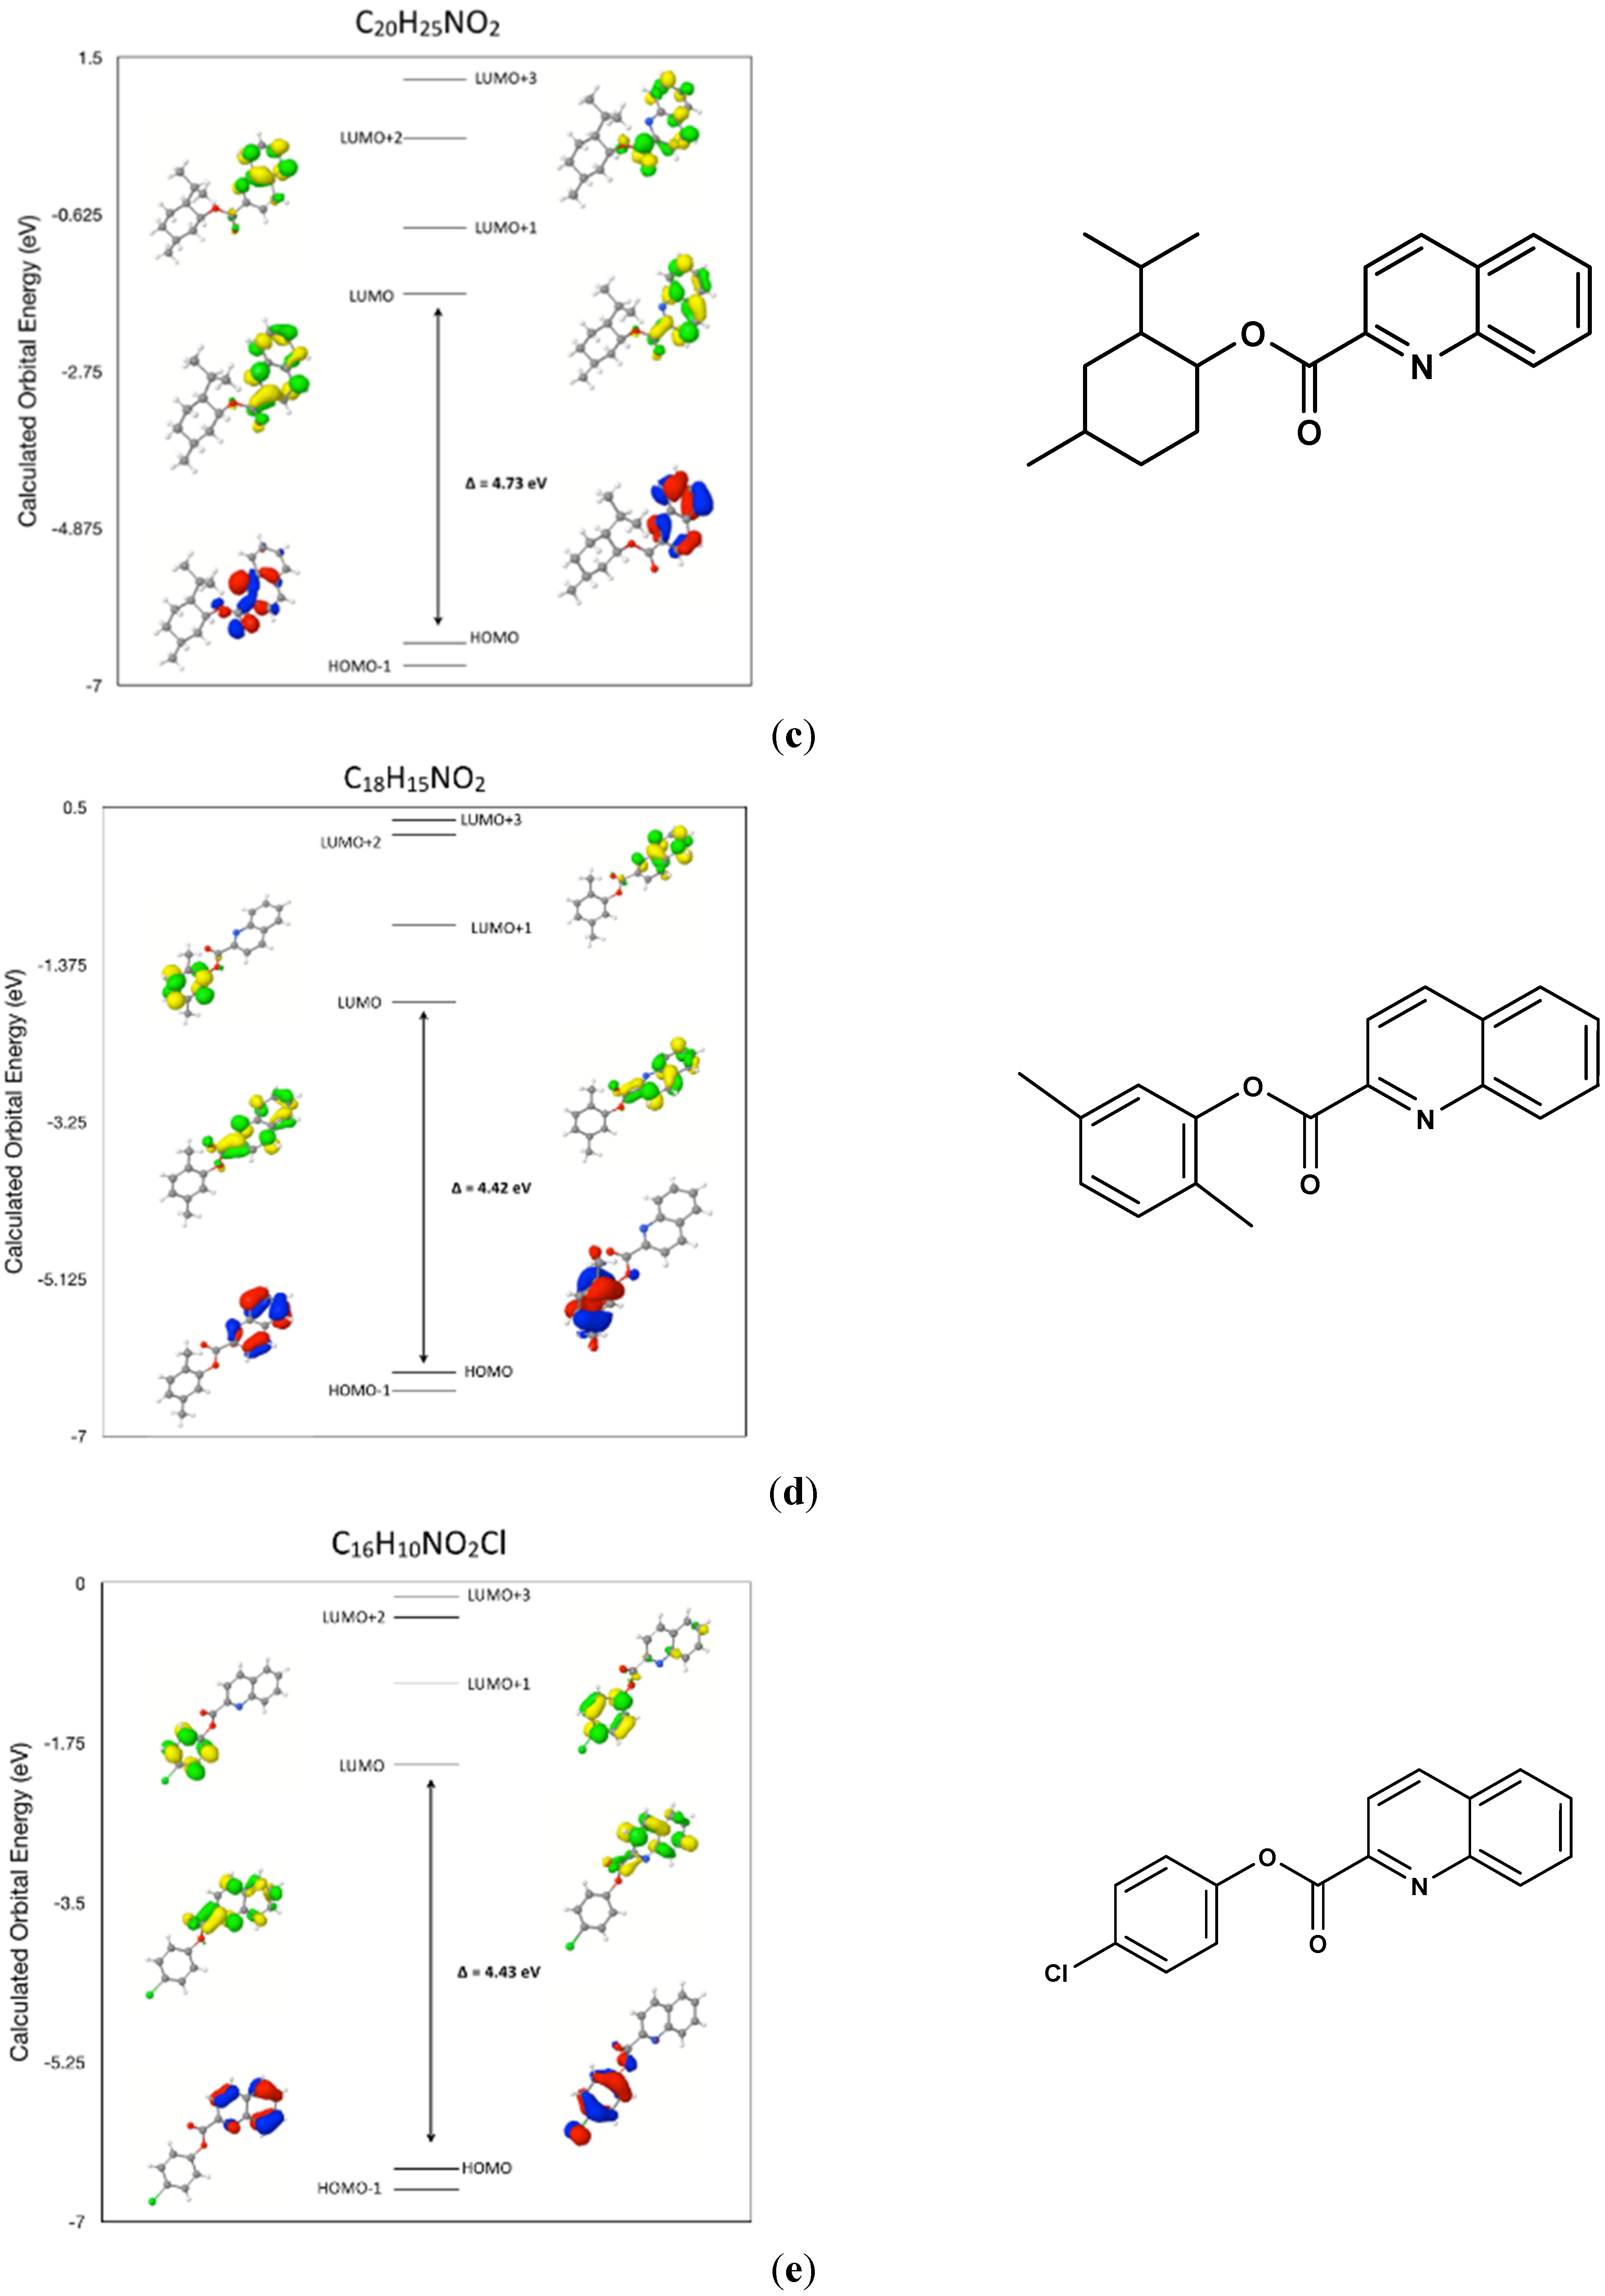
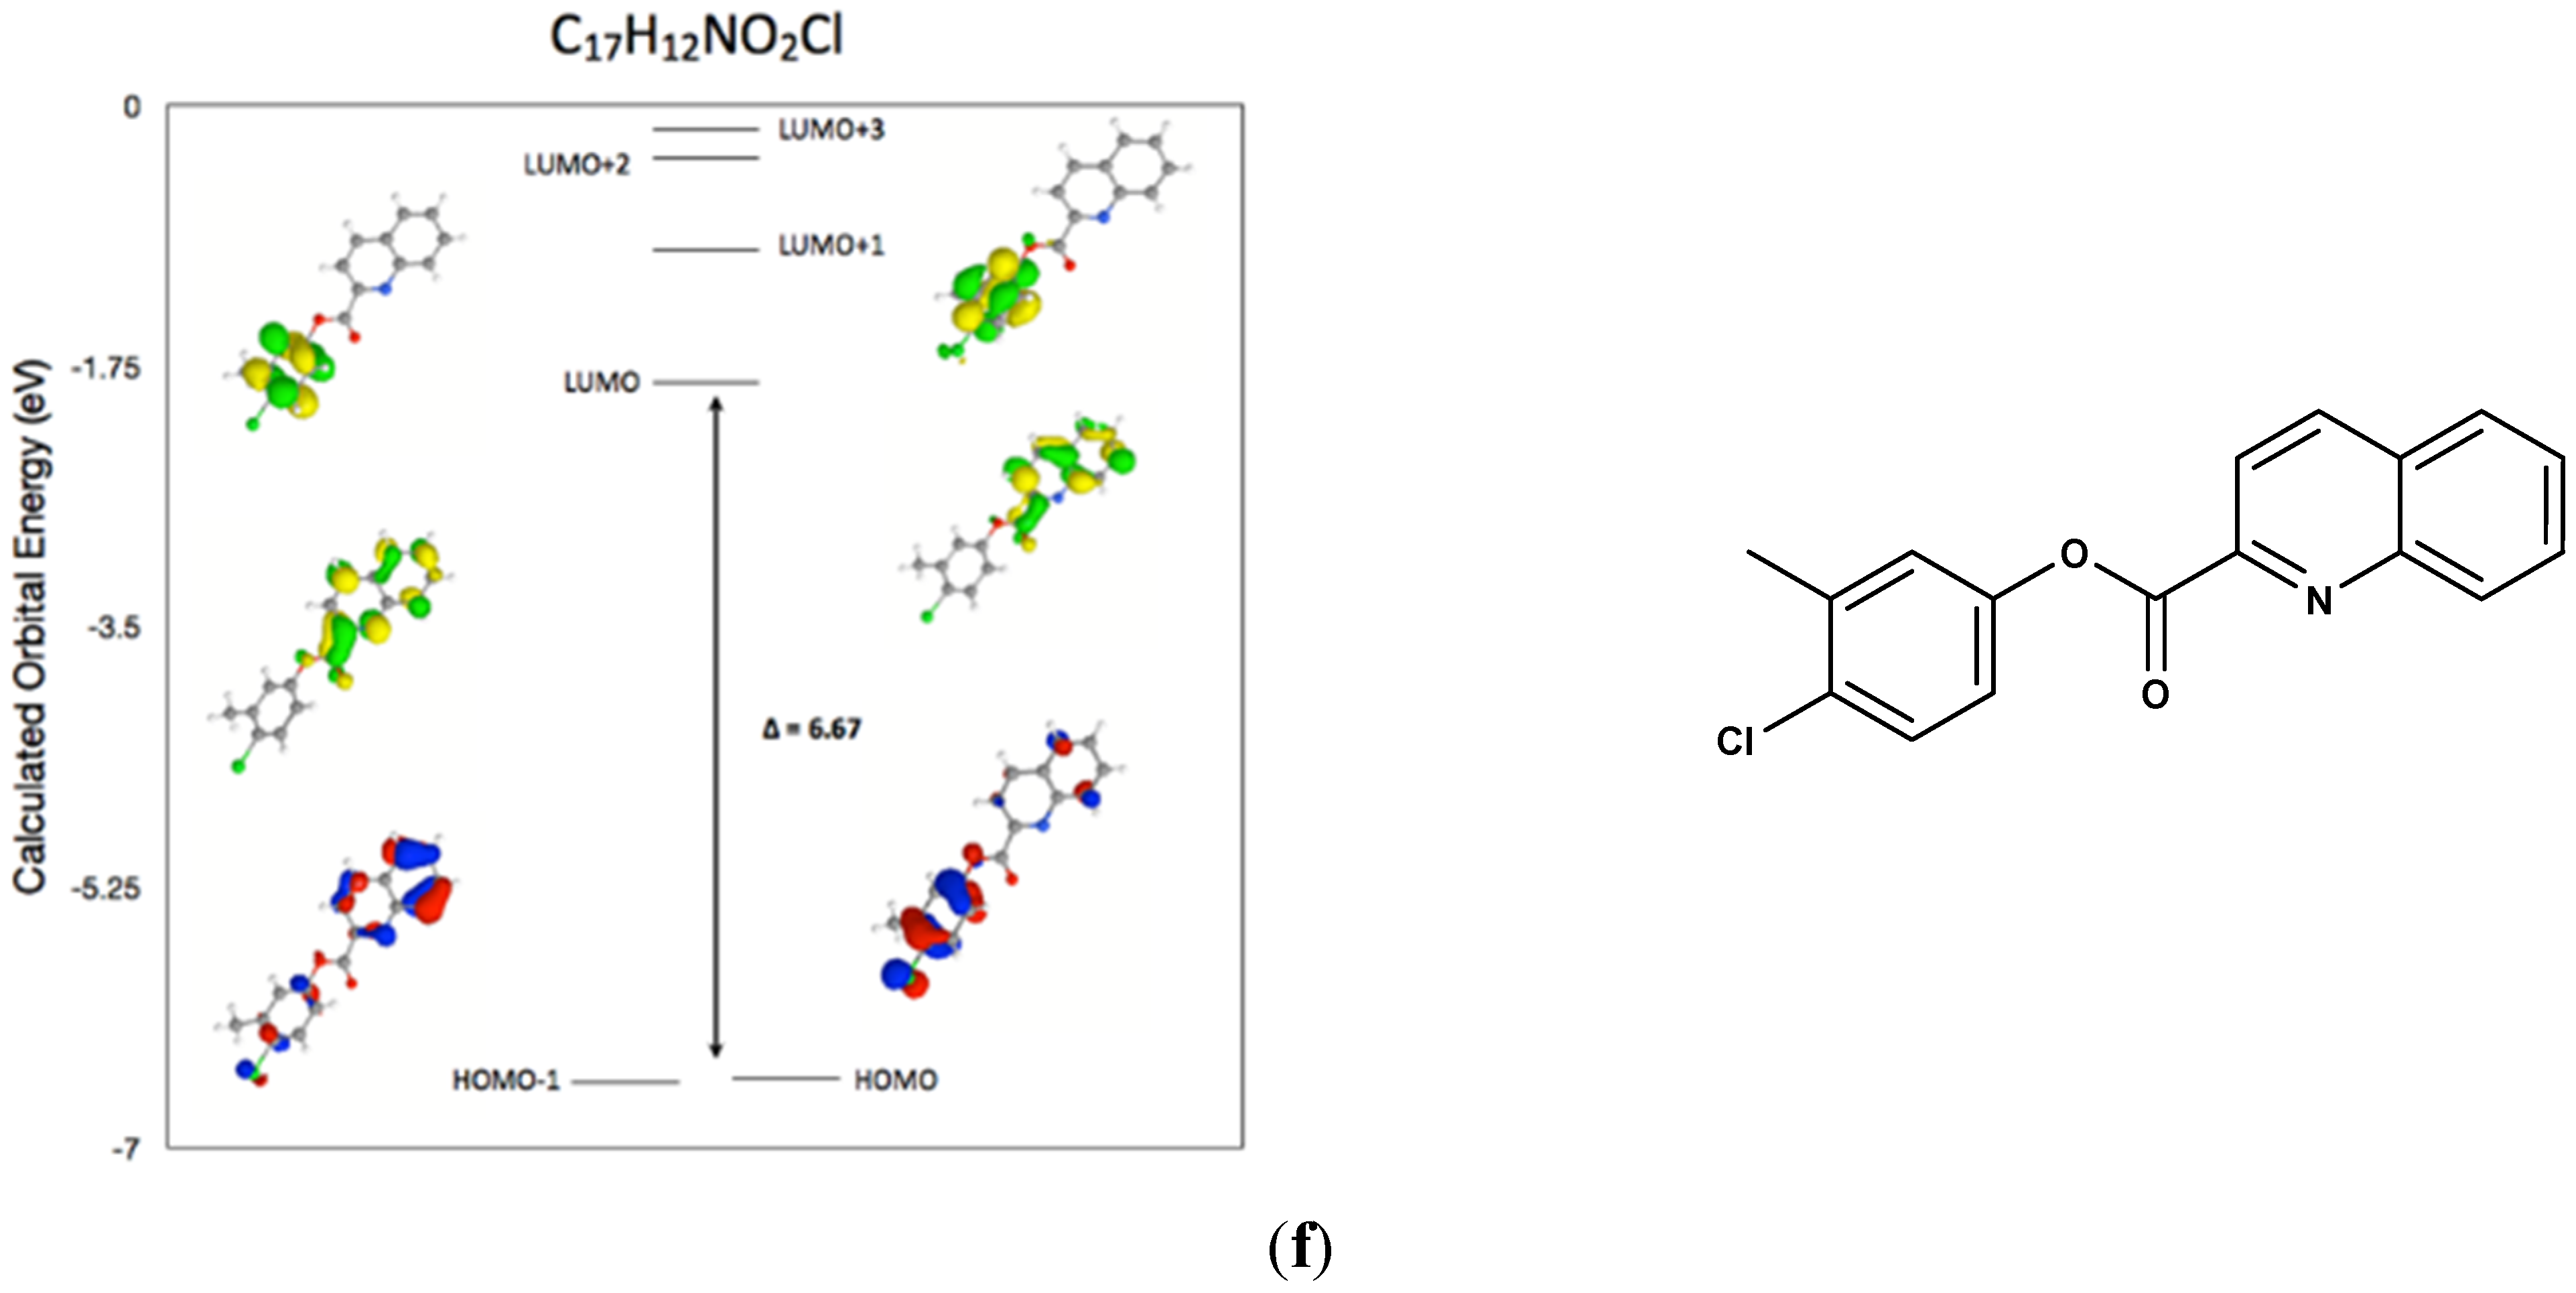
2.7. Comparison of the Frontier Molecular Orbitals from Six Related Quinoline-2-Carboxylate Derivatives to the Title Compounds

A display of the DFT frontier molecular orbitals from six similar and related quinoline-2-carboxylate derivatives previously published in this laboratory is shown in Figure 5a–f.
Figure 5. Calculated frontier molecular orbitals for compounds IIIVIII. (a) calculated frontier molecular orbitals for C17H13NO2 (III) (Reprinted with permission from [8], Copyright 2012 Acta Crystallographica Section E); (b) calculated frontier molecular orbitals for C18H15NO2 (IV) (Reprinted with permission from [11]. Copyright 2014 Acta Crystallographica Section E); (c) calculated frontier molecular orbitals for C20H25NO2 (V) (Reprinted with permission from [12], Copyright 2014 Acta Crystallographica Section E); (d) calculated frontier molecular orbitals for C18H15NO2 (VI) (Reprinted with permission from [13], Copyright 2013 Acta Crystallographica Section E); (e) calculated frontier molecular orbitals for C16H10NO2Cl (VII) (Reprinted with permission from [10], Copyright 2013 Acta Crystallographica Section E); (f) calculated frontier molecular orbitals for C17H12NO2Cl (VIII) (Reprinted with permission from [9]. Copyright 2013 Acta Crystallographica Section E).
Crystals 05 00100 g005aCrystals 05 00100 g005bCrystals 05 00100 g005c
The absorption spectra for each of the six molecules shown above display two intense absorption maxima with λmax between 251–253 nm and 316–320 nm indicating slight shifts in band maxima being related most likely to the various substituted groups on the phenyl moiety. The oscillator strengths of each of these two band envelopes in (IIIVIII) are also in similar ranges as recorded for molecules (I) and (II) (see Table S1–S6 for DFT HOMO–LUMO assignments of molecules IIIVIII). From the DFT calculated frontier surface molecular orbitals for compounds (IIIVIII) in Figure 5, it is therefore suggested that each of these molecules can be assigned to similar transitions within the band envelopes as described for molecules (I) and (II) providing further support for these collective HOMO–LUMO assignments in the title molecules.

3. Experimental Section

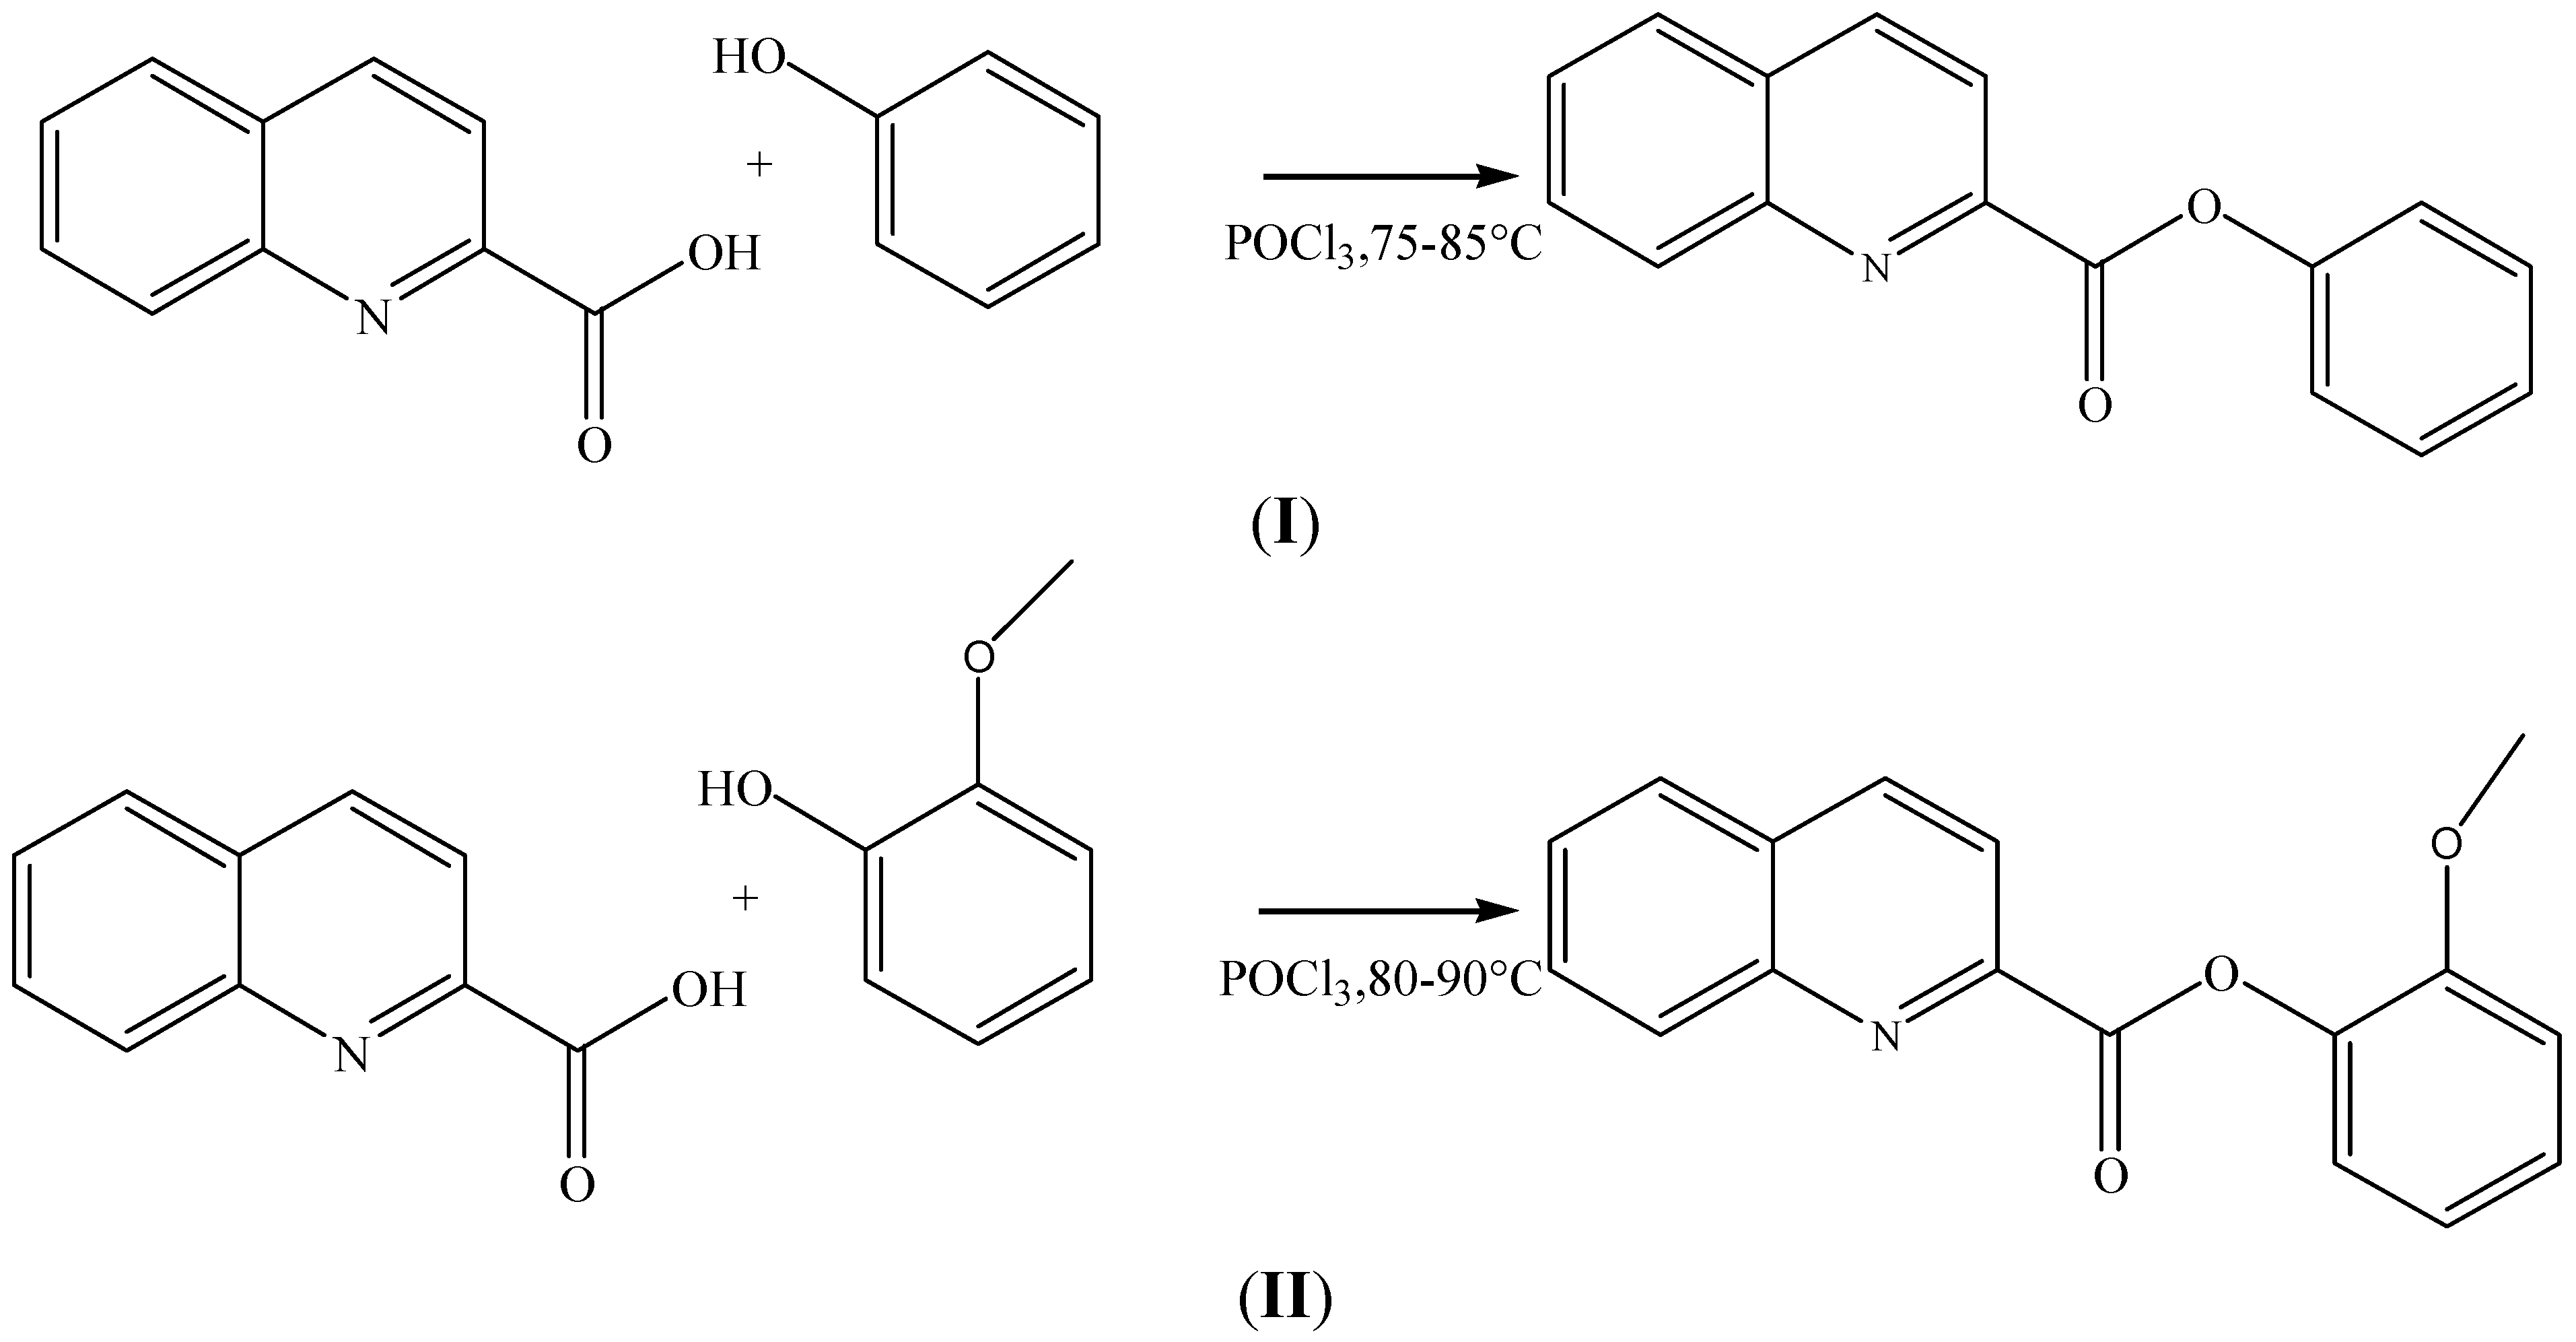
3.1. Synthesis of Phenyl Quinoline-2-Carboxylate and 2-Methoxyphenyl Quinoline-2-Carboxylate

The two quinoline-2-carboxylates (I) and (II) were prepared by the following method (Scheme 1). To a mixture of quinaldic acid (1.73 g, 10 mmole) and o-methoxyphenol (1.24 g, 10 mmole) (I) or phenol (0.9 g, 10 mmole) (II) in a round-bottomed flask fitted with a reflux condenser and a drying tube, (0.150 g, 10 mmole) of phosphorous oxychloride was added. The mixture was heated with occasional swirling maintaining the temperature at 348–353 K. At the end of eight hours (I) or six hours (II) the reaction mixture was poured into a solution of 2 g of sodium bicarbonate in 25 mL of water. The precipitated esters were collected on a filter and washed with water. The yield of crude, air dried 2-methoxyphenyl quinoline-2-carboxylate (I) was (80%–90%) and air dried phenyl quinoline-2-carboxylate (II) was (55%–60%). X-ray quality crystals of both (I) and (II) were obtained by recrystallization from absolute ethanol.
Scheme 1. The synthesis of C16H11NO2 (I) and C17H13NO3 (II).
Crystals 05 00100 g006
The melting points were determined on SELACO melting point in open capillary tubes and are uncorrected. Reactions were monitored by Thin-layer chromatography (TLC) using pre-coated sheets of silica gel G/UV-254 of 0.25 mm thickness (Merck 60F254) using UV light for visualization. All the solvents and reagents used for the synthesis were of analytical grade and procured from Sigma Chemical Co. (St. Louis, MO, USA). NMR spectra (1H and 13C) for the compound was recorded on a 500 MHz NMR Spectrometer (Bruker advance, Reinstetten, Germany) using deuteriated DMSO as the solvent. The chemical shift values (ppm) and coupling constants (J) are given in δ and Hz respectively. Mass spectral analysis was carried out in the ESI positive mode using HRMS mass spectrometer (Waters Q-Tof Utima, Manchester, UK). OD of the samples was measured using UV/Vis spectrometer, UV-1800 Shimadzu, Tokyo, Japan.
Phenyl quinoline-2-carboxylate (I): C16H11NO2; 363 K; 1HNMR (500 MHz, DMSO) δ 8.6 (1H, d, J = 8.5 Hz), 8.35(1H, d, J = 8.5 Hz), 8.30(1 H, d, J = 8.5 Hz), 8.09(1H, d, J = 8.15 Hz),7.92(1H, dd, J1 = 8.38 Hz, J2 = 6.91 Hz, J3 = 1.3 Hz), 7.79 (1H, ddd, J1 = 8.10 Hz, J2 = 6.91 Hz, J3 = 1 Hz), 7.52 (1H, t, J = 7.65 Hz, 8.26 Hz). 13CNMR (125 MHz, DMSO) δ = 46.768, 47.449, 47.789, 120.586, 121.037, 125.646, 127.405, 128.602, 129.457, 130.361, 137.824, 146.798, 146.989, 150.801, 163.314. IR (KBr, νmax/cm−1) 3054, 1757, 1588, 1485, 1456, 1196, 1132, 1094. HRMS: Mass (ESI): [M + 1] for C16H11NO2, Calculated: 249.08; Found: 249.75.
2-Methoxyphenyl quinoline-2-carboxylate (II): C17H13NO3; 395 K; 1HNMR (500 MHz, DMSO) δ = 8.65 (1H, d, J = 8.7 Hz), 8.36 (1H, d, J = 8.5 Hz), 8.32(1H, d, J = 8.5 Hz), 8.13(1H, d, J = 8.21 Hz), 7.95(1H, ddd, J1 = 8.2 Hz, J2 = 6.78 Hz, J3 = 1 Hz), 7.82 (1H, t, J = 7.82 Hz, 7.23 Hz), 7.37(1 H, dt, J1 = 8.3 Hz, J2 = 1.31 Hz), 7.31 (1H, dd, J1 = 7.8 Hz, J2 = 1.37 Hz), 7.10 (1H, dt, J1 = 7.55 Hz, J2 = 1.04 Hz), 3.88 (3H, s). 13CNMR (125 MHz, DMSO) δ = 56.264, 113.739, 121.692, 122.071, 123.543, 128.287, 128.871, 130.018, 130.527, 130.700, 131.773, 139.134, 141.003, 147.994, 148.371, 152.303, 164.134. IR (KBr, νmax/cm−1) 3055.1, 3009.7, 2926, 2835, 1736, 1606,1501,1463,1440, 1262, 1198, 1169, 1120, 1084, 1045, 842,777, 754. HRMS: Mass (ESI): [M + 1] for C17H13NO3, Calculated: 279.09; Found: 279.78.

3.2. Data Collection and Refinement

Crystallographic data for both (I) and (II) were collected with an Agilent Gemini R EOS CCD area detector using CrysAlisPro software [24] and graphite-monochromated Cu-Kα λ = 1.54178 Å) radiation at 173(2) K. Using Olex2 [25], the structures were solved by Superflip [26] using Charge Flipping and all of the non-hydrogen atoms were refined anisotropically by full-matrix least-squares on F2 using SHELX2014 [27]. In [I & II] the hydrogen atoms were placed in their calculated positions and included in the refinement using the riding model with C–H lengths of 0.95 Å (CH), 0.99 Å (CH2) or 0.98 Å (CH3). The isotropic displacement parameters for these atoms were set to 1.2 (CH, CH2), or 1.5 (CH3), times Ueq of the parent atom. Idealized Me groups were refined as rotating groups in (II) [C17(H17A,H17B,H17C)]. An absorption correction was performed on each structure using CrysAlis RED [24] and both structures were checked using PLATON [28].
Crystal data for (I): yellow needle, 0.14 × 0.12 × 0.06 mm, C16H11NO2, Mr = 249.08, monoclinic P21/c, a = 14.7910(3) Å; b = 5.76446(12) Å; c = 28.4012(6) Å; β = 99.043(2)° and V = 2391.45(9) Å3; Z = 8, F(000) = 695, T = 123(2) K, ρcalc = 1.258 g·cm−3, μ = 0.652 mm−1, 13890 reflections measured (−18 ≤ h ≤ 14, −6 ≤ k ≤ 6, −34 ≤ l ≤ 34; 3.15 ≤ θ ≤ 71.46°), Rint = 0.0373, 4561 merged reflections, GOF = 1.080, R(F) [I ≥ 2σ (I)] = 0.0630, wR(F2) = 0.1857, w = 1/σ2(Fo2) + 0.0541P2], where P = (Fo2 + 2Fc2)/3, min./max. ∆ρ = −0.30, +0.31 e Å−3. The quoted wR(F2) values are for all data or give the applied sigma limit for observed data. Cambridge Database deposition number: CSD-1039091.
Crystal data for (II): colorless needle, 0.22 × 0.18 × 0.08 mm, C17H13NO3, Mr = 279.09, monoclinic P21/n, a = 9.6095(3) Å; b = 10.8040(3) Å; c = 13.2427(4) Å; β = 102.012(3)°; and V = 1344.76(7) Å3; Z = 4, F(000) = 597, T = 173(2) K, ρcalc = 1.343 g·cm−3, μ = 0.696 mm−1, 8310 reflections measured (−11 ≤ h ≤ 11, −9 ≤ k ≤ 13, −15 ≤ l ≤ 16; 5.21 ≤ θ ≤ 71.29), Rint = 0.0326, 2582 merged reflections, GOF = 0.973, R(F) [I ≥ 2σ (I)] = 0.0383, wR(F2) = 0.0979, w = 1/σ2(Fo2) + 0.0541P2], where P = (Fo2 + 2Fc2)/3, min./max. ∆ρ = −0.18, +0.26e Å−3. The quoted wR(F2) values are for all data or give the applied sigma limit for observed data. Cambridge Database deposition number: CSD-1039092.

4. Conclusions

The crystal and molecular structure of two new derivatives of quinolone-2-carboxylic acid have been determined along with the frontier molecular orbitals of each compound displayed through density function theory (DFT-B3LYP 6-31G(d)), geometry optimization and molecular orbital calculations. Correlation between the calculated molecular orbital energies (eV) for the surfaces of the frontier molecular orbitals to the electronic excitation transitions from the absorption spectrum of each compound has been determined. In each compound, the DFT molecular orbital calculation, supported by a geometry optimization calculation confirmed that the excitation energies of the surfaces of the frontier molecular orbitals from the HOMO−1 and HOMO to LUMO, LUMO+1, LUMO+2 and LUMO+3 electronic excitations closely match the λmax values of the absorption spectra in overlapping contributions from three to five of these excitations within each band envelope. In the crystal structures of both (I) and (II) no classical hydrogen bonds were observed. In (I) weak C---H…O intermolecular interactions and π–π stacking interactions between the two rings of the quinoline group and carboxyl oxygen atoms of nearby molecules are present, while in (II), weak C---H…O and π–π stacking interactions between the two rings of the quinoline groups of nearby molecules are observed. While the energy differences (ΔEconfig) between the optimized and experimental electronic transitions for (I) and (II) associated with the band envelopes for each structure are suggestive of some interaction, it is inconclusive in relation to an extension of their effects on crystal packing.

Acknowledgments

Edakot Fazal thanks the Central Food Technological Research Institute, Mysore and Yuvarajaʼs College, University of Mysore for providing research facilities. Edakot Fazal is grateful to Javagal Rangaswamy Manjunatha, Spice and Flavor Science Department, Council of Scientific and Industrial Research-Central Food Technological Research Institute for Nuclear Magnetic Resonance spectra. Jerry P. Jasinski acknowledges the NSF–MRI program (Grant No. CHE-1039027) for funds to purchase the X-ray diffractometer.

Author Contributions

Edakot Fazal designed the experiments and synthesized the compounds; Jerry P. Jasinski performed the DFT calculations and wrote the paper; Brian J. Anderson collected X-ray data for the compounds; Manpreet Kaur solved the X-ray structures and interpreted the crystallographic results; Subban Nagarajan contributed reagents/materials/analysis tools for the project and Belgur Satyanarayana Sudha analyzed and interpreted the NMR, Mass Spec and IR data.

Conflicts of Interest

The authors declare no conflict of interest.

References

  1. Morimoto, Y.; Matsuda, F.; Shirahama, H. Total Synthesis of (±)-Virantmycin and Determination of Its Stereochemistry. Synlett 1991, 3, 202–203. [Google Scholar] [CrossRef]
  2. Michael, J.P. Quinoline, Quinazoline and Acridone Alkaloids. Nat. Prod. Rep. 2008, 25, 166–187. [Google Scholar] [CrossRef] [PubMed]
  3. Padwa, A.; Brodney, M.A.; Liu, B.; Satake, K.; Wu, T. Cycloaddition Approach toward the Synthesis of Substituted Indolines and Tetrahydroquinolines. J. Org. Chem. 1999, 64, 3595–3607. [Google Scholar] [CrossRef] [PubMed]
  4. Markees, D.G.; Dewey, V.C.; Kidder, G.W. Antiprotozoal 4-aryloxy-2-aminoquinolines and related compounds. J. Med. Chem. 1970, 13, 324–326. [Google Scholar] [CrossRef] [PubMed]
  5. Campbell, S.F.; Hardstone, J.D.; Palmer, M.J. 2,4-Diamino-6,7-Dimethoxyquinoline Derivatives as α1-Adrinoceptor Antagonists and Antihypertensive Agents. J. Med. Chem. 1988, 31, 1031–1035. [Google Scholar] [CrossRef] [PubMed]
  6. Musiol, R.; Magdziarz, T.; Kurczyk, A. Quinoline Scaffold as a Privileged Substructure in Antimicrobial Drugs. In Science against Microbial Pathogens: Communicating Current Research and Technological Advances; Formatex Research Center: Badajoz, Spain, 2011. [Google Scholar]
  7. Solomon, V.R.; Lee, H. Quinoline as a Privileged Scaffold in Cancer Drug Discovery. Curr. Med. Chem. 2011, 18, 1488–1508. [Google Scholar] [CrossRef] [PubMed]
  8. Fazal, E.; Jasinski, J.P.; Krauss, S.T.; Sudha, B.S.; Yathirajan, H.S. 4-Methylphenyl quinoline-2-carboxylate. Acta Cryst. 2012, E68, o3231–o3232. [Google Scholar]
  9. Fazal, E.; Kaur, M.; Sudha, B.S.; Nagarajan, S.; Jasinski, J.P. 4-Chloro-3-methylphenyl quinoline-2-carboxylate. Acta Cryst. 2013, E69, o1842–o1843. [Google Scholar]
  10. Fazal, E.; Kaur, M.; Sudha, B.S.; Nagarajan, S.; Jasinski, J.P. 4-Chlorophenyl quinoline-2-carboxylate. Acta Cryst. 2013, E69. [Google Scholar] [CrossRef]
  11. Fazal, E.; Kaur, M.; Sudha, B.S.; Nagarajan, S.; Jasinski, J.P. 3,4-Dimethylphenyl quinoline-2-carboxylate. Acta Cryst. 2014, E69, o1853–o1854. [Google Scholar]
  12. Fazal, E.; Kaur, M.; Sudha, B.S.; Nagarajan, S.; Jasinski, J.P. 2,5-Dimethylphenyl quinoline-2-carboxylate. Acta Cryst. 2014, E70. [Google Scholar] [CrossRef]
  13. Fazal, E.; Jasinski, J.P.; Anderson, B.J.; Sudha, B.S.; Nagarajan, S. 2-Isopropyl-5-methylcyclohexyl quinoline-2-carboxylate. Acta Cryst. E 2013, 70, o35–o36. [Google Scholar] [CrossRef]
  14. Jasinski, J.P.; Butcher, R.J.; Mayekar, A.N.; Yathirajan, H.S.; Narayana, B.; Sarojini, B.K. Synthesis, Crystal Structures and Theoretical Studies of Four Schiff Bases Derived from 4-Hydrazinyl-8-(trifluoromethyl) quinoline. J. Mol. Struct. 2010, 980, 172–181. [Google Scholar] [CrossRef]
  15. Allen, F.H.; Kennard, O.; Watson, D.G.; Brammer, L.; Orpen, A.G.; Taylor, R. Tables of Bond Lengths Determined by X-ray and Neutron Diffraction. Part I. Bond Lengths in Organic Compounds. J. Chem. Soc. Perkin Trans. 1987, 2, S1–S19. [Google Scholar] [CrossRef]
  16. Schmidt, J.R.; Polik, W.F. WebMO Pro Homepage, version 8.0.01e. Available online: http://www.webmo.net (accessed on 6 December 2014).
  17. Frisch, M.J. Gaussian 03; Revision C01; Wallingford: New Haven, CT, USA, 2004. [Google Scholar]
  18. Becke, A.D. Density-Functional Exchange-Energy Approximation with Correct Asymptotic-Behavior. Phys. Rev. A 1988, 38, 3098–3100. [Google Scholar] [CrossRef] [PubMed]
  19. Lee, C.; Yang, W.; Parr, R.G. Development of the Colle-Salvetti Correlation-Energy Formula into a Functional of the Electron Density. Phys. Rev. B Condens. Matter 1988, 37, 785–789. [Google Scholar] [CrossRef] [PubMed]
  20. Hehre, W.J.; Random, L.; Schleyer, P.R.; Pople, J.A. Ab initio Molecular Orbital Theory; Wiley: New York, NY, USA, 1986. [Google Scholar]
  21. Georgakopoulous, S.; Grondelle, R.V.; Zwan, G.V.D. Circular Dichroism of Carotenoides in Bacterial Light-harvesting Complexes: Experimental and Modeling. J. Biophys. 2005, 87, 3010–3022. [Google Scholar] [CrossRef]
  22. Guzin, A. Derivative Spectrophotometric Determination of Caffeine in Some Beverages. Turk J. Chem. 2002, 26, 295–302. [Google Scholar]
  23. IGOR Pro (1988–2009), WaveMetrics. Available online: www.wavemetrics.com (accessed on 21 January 2015).
  24. Oxford Diffraction. CrysAlis PRO and CrysAlis RED; Oxford Diffraction Ltd.: Abingdon, UK, 2010. [Google Scholar]
  25. Dolomanov, O.V.; Bourhis, L.J.; Gildea, R.J.; Howard, J.A.K.; Puschmann, H. Smtbx. cif: A Comprehensive CIF Toolbox. J. Appl. Cryst. 2009, 42, 339–341. [Google Scholar] [CrossRef]
  26. Palatinus, L.; Chapuis, G. SUPERFLIP—A Computer Program for the Solution of Crystal Structures by Charge Flipping in Arbitrary Dimensions. J. Appl. Cryst. 2007, 40, 786–790. [Google Scholar] [CrossRef]
  27. Sheldrick, G.M. Crystal Structure Refinement with SHELXL. Acta Cryst. C 2015, 71, 3–8. [Google Scholar] [CrossRef]
  28. Spek, A.L. PLATON-A Multipurpose Crystallographic Tool; Ultrecht University: Ultrecht, The Netherlands, 2001. [Google Scholar]

