Growth Mechanisms of CdS Nanocrystals in Aqueous Media

Department of Chemistry, Center of Excellence for Nanostructured and Innovative Materials (CEMIN), University of Perugia, Via Elce di Sotto 8, 06123 Perugia, Italy
*
Author to whom correspondence should be addressed.
†
Present address: European Laboratory for Non Linear Spectroscopy (LENS), University of Florence, via Nello Carrara 1, 50019 Sesto Fiorentino, Firenze, Italy.
Crystals 2012, 2(2), 618-626; https://doi.org/10.3390/cryst2020618
Submission received: 7 December 2011
/
Revised: 16 May 2012
/
Accepted: 23 May 2012
/
Published: 6 June 2012
(This article belongs to the Special Issue Semiconductor Nanocrystals)
Abstract
:CdS nanocrystals were prepared in water-in-oil microemulsions. The nanocrystal properties, absorption and luminescence spectra and size distributions, were monitored at different times after mixing the microemulsions of the two precursors to obtain information on their growth mechanism. In particular, CdS nanocrystals were prepared using water-in-heptane or water-in-nonane microemulsions. The results obtained from the investigation of nanocrystals prepared using heptane as the organic phase, confirmed that nanocrystal nucleation is fast while their growth is determined by droplet exchange content rate. Size distribution histograms obtained from the sample at early time points after mixing presented a bimodal population having average sizes of 3.0 ± 0.1 and 5.8 ± 0.1 nm, thus indicating that surface process controls the nanocrystal growth. With longer reaction times the occurrence of water droplet coalescence is likely responsible for the formation of nanocrystal agglomerates. Using a water-in-nonane microemulsion, the droplet exchange rate can be modified, thus leading to smaller CdS nanocrystals. However, the development of structural defects cannot be excluded, as evidenced by the luminescence spectra of the suspension. In general, aging of the nanocrystal in the pristine microemulsion resulted in the development of cubic semiconductor nanostructures.
1. Introduction
Colloidal semiconductor nanocrystals (or quantum dots, QDs) have attracted prominent attention in the last three decades since their physical and chemical properties, which can be tuned in size and morphology by controlling the synthesis, differ from those of their corresponding bulk materials [1]. These properties render semiconductor nanocrystals suitable for numerous applications such as solar cell materials [2], optical sensors, [3] and bio-imaging [4]. Particularly interesting for biomedical applications, are the nanocrystals prepared in aqueous media [5,6,7].
The success of the preparation methods and thus the achievement of the designed properties, rely on the ability to prevent new nucleation events immediately after the crystal growth has begun and to control the growth process. It has been demonstrated that semiconductor nanocrystals prepared by thermolysis of the precursors in highly coordinating solvents (trioctylphosphine oxide and/or trioctylphosphine) undergo a size distribution focusing process upon slowing the growth and making the growth diffusion controlled [8]. Various methods have been used to control the semiconductor nanocrystal growth in water such as using specific capping agents such as thioglycerol [5,6], alcohols [9] and surfactants [10]. Furthermore, the compartmentalization afforded by the aqueous domains of a water-in-oil microemulsion has shown to be effective [11,12].
It has been recently reported that the degree of crystallinity and the nanocrystal surface properties and, hence, their luminescence behavior are strongly affected by the reagent nature [13,14] and by the growth mechanism [5]. Indeed, it has been shown that CdS in water can grow via a diffusion controlled mechanism leading to a narrower size distribution when working with a large excess of capping agent compared to the precursor concentrations.
The synthetic procedures were most of the times optimized in terms of medium nature and reactant concentrations and temperature, but not enough attention has been paid to control the reaction time and the effects of its prolongation on the nanocrystals’ dimensions and structural properties. The effects of reaction time on the colloid properties can give valuable information about the growth mechanism under different conditions.
It has been demonstrated that water-in-oil microemulsion based synthetic procedures are particularly efficient in promoting a fast nanoparticle nucleation since it is determined by the rate constant with which droplets exchange their content (106–108 M−1 s−1) [12].
In the present work, CdS nanocrystals have been prepared in aqueous media by use of a water-in-oil microemulsion mixing method in order to investigate the effect of reaction time on nanocrystal properties and to obtain information on their growth mechanism. In particular, heptane or nonane was used as the organic phase of the microemulsions with the aim to investigate the effects of microemulsion dynamics and/or stability on the nanocrystal properties. Heptane is a solvent widely used in the literature for AOT-microemulsions while nonane was chosen because it has a higher boiling point and density compared to heptane.
2. Results and Discussion
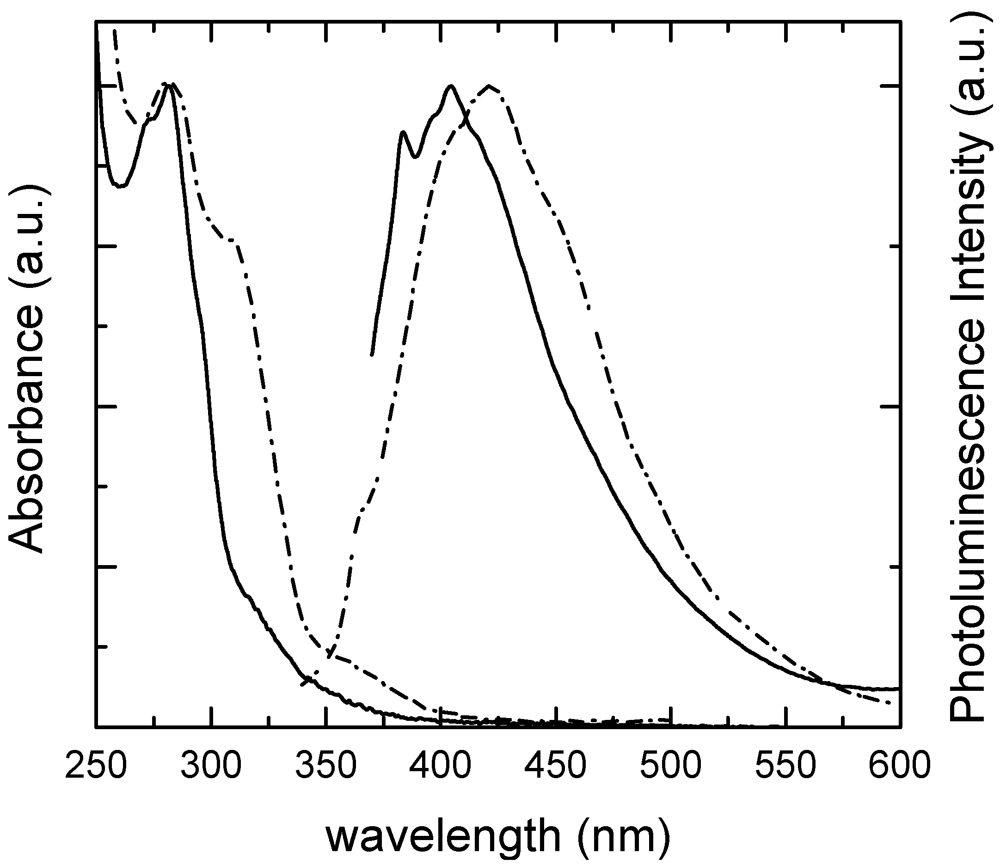
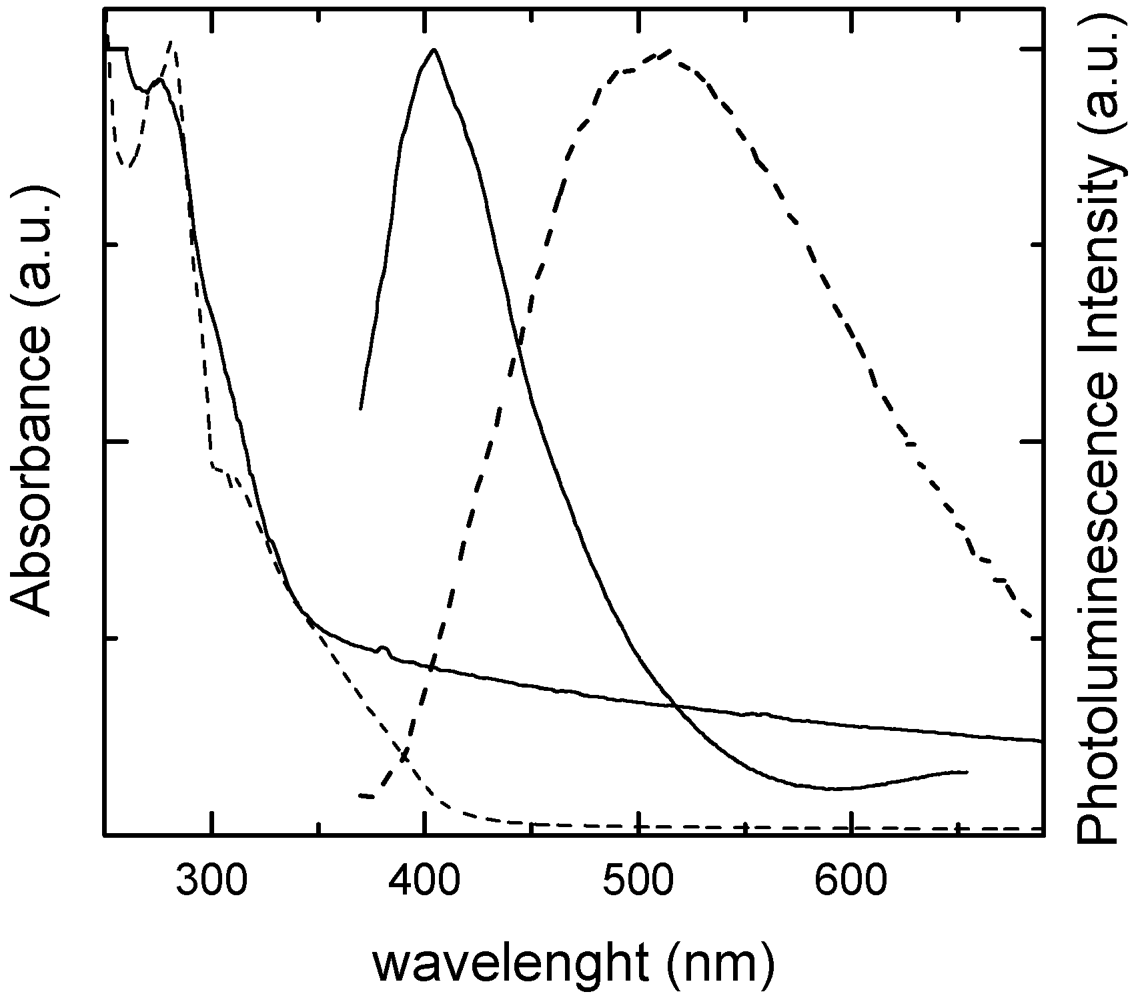
The water-in-oil microemulsion based methods for the preparation of nanocrystals have been shown to be very efficient in the nucleation step since they allow supersaturation conditions to easily be reached. Indeed upon mixing the two microemulsions, each solubilizing one of the two precursors (Cd2+ and S2−) in the water pockets, the suspensions turned a yellowish color which became stable and persisted after a few minutes. Figure 1 presents the absorption and luminescence spectra of the suspension obtained in heptane by aging the mixed microemulsions for 10’ and 60’. The spectra confirm that the formation of the nanocrystals occurred, in agreement with literature data [10,12]. In particular, the spectrum of the sample obtained 10’ after the mixing presented the main maximum at 285 nm and a pronounced shoulder at 330 nm, while the luminescence spectrum is centered at 400 nm; with an increase in the reaction time the absorption spectrum became broader and a red-shift of 20 nm of the luminescence spectrum was observed. The spectral shifts occur together with a decrease of the absolute luminescence quantum efficiency, which goes from 0.023 to 0.010 on increasing the reaction time from 10 to 60’. This data suggests that a prolongation of the reaction time leads to a modification of the nanocrystal populations.
Figure 1.
Absorption (left) and luminescence (right, λexc = 300 nm) normalized spectra of CdS nanocrystals in heptane microemulsions recorded 10’ (solid line) and 60’ (dashed line) after the mixing.
Figure 1.
Absorption (left) and luminescence (right, λexc = 300 nm) normalized spectra of CdS nanocrystals in heptane microemulsions recorded 10’ (solid line) and 60’ (dashed line) after the mixing.

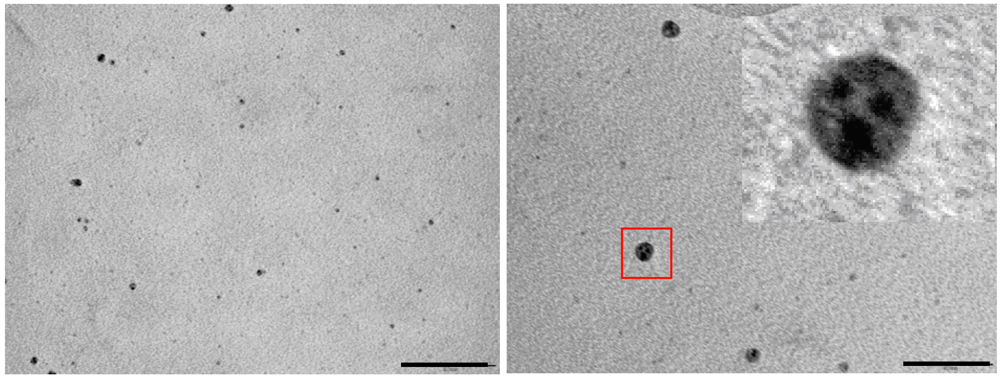
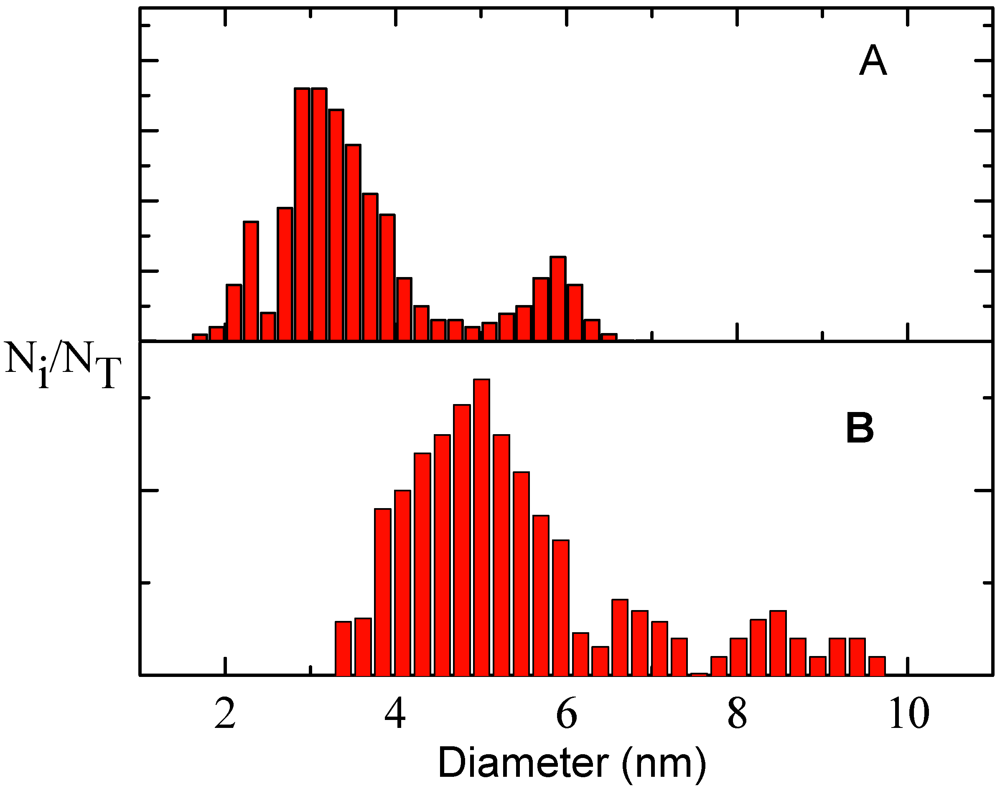
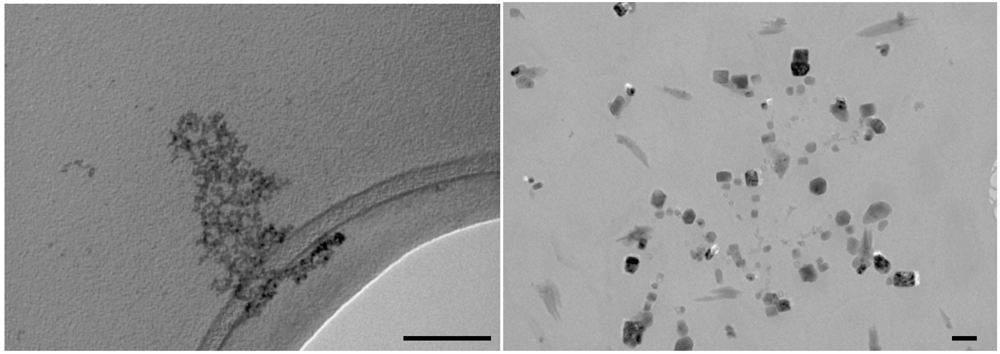
The size distribution in the samples was monitored by TEM measurements. In Figure 2, TEM images recorded on samples taken at early reaction times (10’) and after 60’ from the mixing are reported, which confirm the formation of spherical nanocrystals, whose size dispersion was analyzed by building up diameter distribution histograms (Figure 3). After 10’ of precursor reaction, the sample presented two populations, having average sizes of 3.0 ± 0.1 and 5.8 ± 0.1 nm; while for the sample obtained after longer reaction times, the size distribution appeared more complex and showed a major population with a mean diameter of 5.0 ± 0.1 nm and several minor populations with higher mean diameters. This behaviour can be explained considering that the nanocrystal growth is controlled by surface processes, most likely because after the fast nucleation, microemulsion dynamics assist the exchange of stable nuclei which might form stable agglomerates in the water pool. Actually, a careful analysis of TEM images recorded on the samples where the particle formation reaction lasted for 60’, shows that in each particle the contrast distribution is not homogeneous; indeed each particle consists of different dark spots, such that the particles are constituted by multiple nanocrystals supporting the hypothesis of droplet coalescence. The difficulties to control the growth process led to the development of defects in the crystal structures as shown by the red-shift of the emission spectrum, generally assigned to the contribution of trap states. These data indicate that at longer reaction times the nanocrystal size broadens, likely due to droplet coalescence although the microemulsion composition (W = [H2O]/[AOT] = 4.3) is in a regime where the nanocrystal size is determined by water droplet dimension, which is the case at early reaction stages [15].
Figure 2.
TEM images of CdS nanocrystals in heptane microemulsions recorded after 10’ (left panel) and 60’ (right panel) from the mixing; scale bar represents 100 nm. Inset: zoomed image of the particle within the red square.
Figure 2.
TEM images of CdS nanocrystals in heptane microemulsions recorded after 10’ (left panel) and 60’ (right panel) from the mixing; scale bar represents 100 nm. Inset: zoomed image of the particle within the red square.
Figure 3.
Size distribution histograms of CdS nanocrystals in heptane microemulsions obtained from TEM images of samples analyzed after 10’ (A) and 60’ (B) from the mixing.
Figure 3.
Size distribution histograms of CdS nanocrystals in heptane microemulsions obtained from TEM images of samples analyzed after 10’ (A) and 60’ (B) from the mixing.
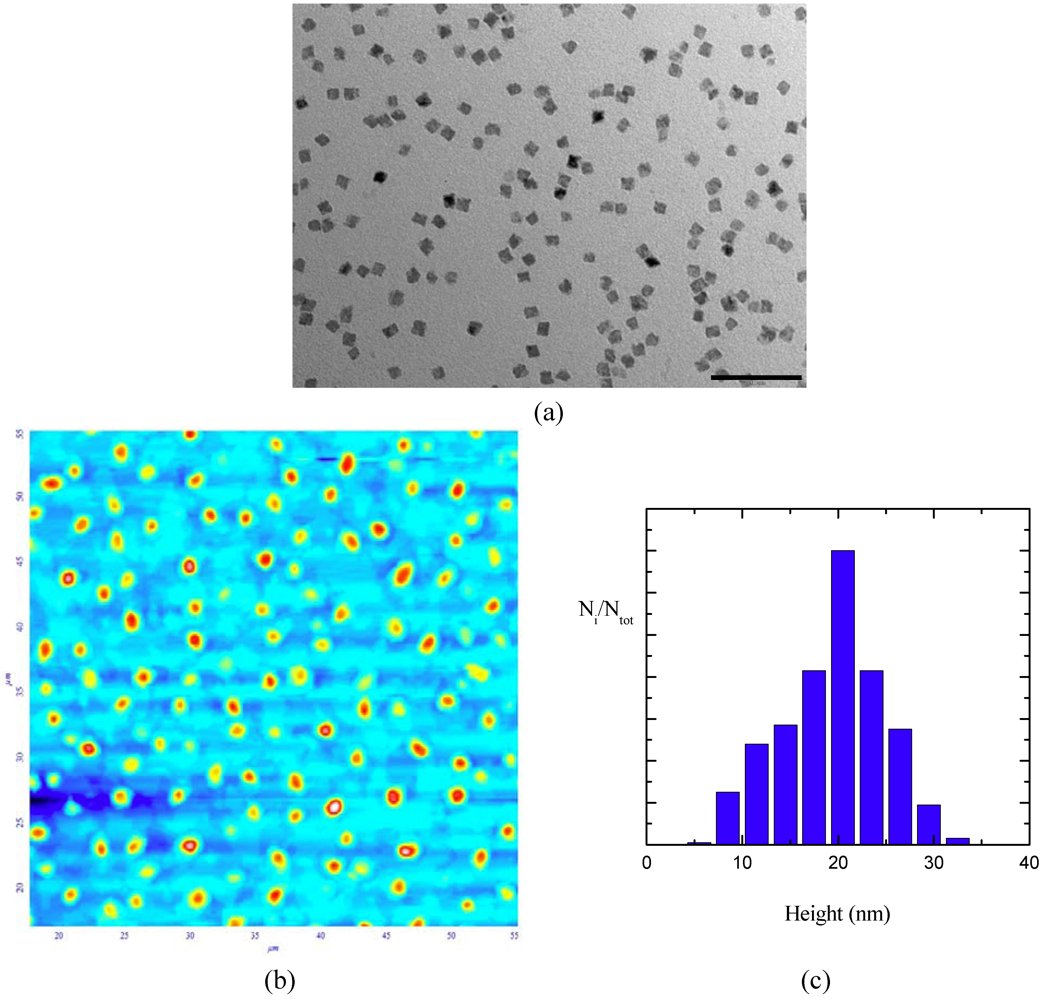
The dimension evolution is further enhanced when nanocrystals in the microemulsion underwent a reflux procedure to remove the water from the pools. The TEM images recorded on the sample put through the reflux treatment (Figure 4) showed nanocrystals with a square shape and sharp edges with a length centered at 10 nm. Atomic force microscopy measurements (Figure 4) allowed topographic information on the crystal morphology to be obtained and for it to be concluded that the sample was characterized by 3-D nanocrystals with a height distribution with the highest frequency at 21 nm; AFM dimensions are larger that those determined by TEM images for the AOT contribution in the topography image, since a standing configuration of nanocrystals is unprobable.
Figure 4.
TEM image (panel a, scale bar equals 100 nm) and AFM image (panel b, scan area 55 × 55 µm2) together with height distribution diagram (c) of CdS nanocrystals in heptane recorded after reflux treatments.
Figure 4.
TEM image (panel a, scale bar equals 100 nm) and AFM image (panel b, scan area 55 × 55 µm2) together with height distribution diagram (c) of CdS nanocrystals in heptane recorded after reflux treatments.
In order to check the effects of the phase on the microemulsion dynamics and/or stability and hence on the nanocrystal growth process, CdS nanocrystals were prepared in water-in-nonane microemulsions, using the same amounts of solvents and AOT as used for the heptane microemulsions.
Nonane was chosen since it has a higher boiling point (151 °C) and density (0.718 g/cm3) compared to heptane (98 °C and 0.68 g/cm3), thus reducing the rate of diffusion processes and making changes in the microemulsion composition during synthesis negligible. The nanocrystals prepared in nonane microemulsions and analyzed 10’ after reactant mixing presented a structureless absorption spectrum and a luminescence spectrum centered at 400 nm (Figure 5) from which a luminescence efficiency of 0.020 has been determined. With longer reaction times the absorption spectrum showed a shoulder at 310 nm while bigger changes were observed in the luminescence properties. Indeed, the emission spectrum broadened and shifted to the red (maximum at 500 nm). The prolongation of reaction times also induced a decrease in luminescence efficiency since a value of 0.005 was measured. These observations suggest that after 60’ reaction time, different CdS nanocrystal populations are actually contributing to the optical properties of the suspension. TEM images recorded at early stages of the reaction process (Figure 6, left panel) showed that very small nanocrystals are formed in these conditions. Due to the resolution limits of the instrumentation at disposal, no size distribution analysis could be carried out; however an average diameter of 2.5 nm could be estimated for the nanocrystals obtained in these experimental conditions. This information indicates that in nonane the rate of the nucleation process is decreased compared to hexane, likely reducing the droplet exchange rate, but this achievement is counterbalanced by a lower control in defect development. Furthermore, by prolonging the reaction time in nonane microemulsion up to 60’ after mixing, an evident change in nanocrystal morphology was observed (Figure 6, right panel) since again CdS nanocrystals with square shapes were observed. These observations lead to the hypothesis that in nonane microemulsions the droplet coalescence is even more efficient than in the heptane system.
Figure 5.
Absorption (left) and luminescence (right, λexc = 300 nm) normalized spectra of CdS nanocrystals in nonane microemulsions recorded after 10’ (solid line) and 60’(dashed line) from the mixing.
Figure 5.
Absorption (left) and luminescence (right, λexc = 300 nm) normalized spectra of CdS nanocrystals in nonane microemulsions recorded after 10’ (solid line) and 60’(dashed line) from the mixing.

Figure 6.
TEM images of CdS nanocrystals in nonane microemulsion recorded after 10’ (left panel) and 60’ (right panel) from the mixing; scale bars represent 100 nm.
Figure 6.
TEM images of CdS nanocrystals in nonane microemulsion recorded after 10’ (left panel) and 60’ (right panel) from the mixing; scale bars represent 100 nm.
The obtained results can give valuable information to tune the size and shape of semiconductor nanocrystals in aqueous environments and without the use of highly coordinating ligands which can be difficult to handle when further surface processing is necessary.
3. Experimental Section
3.1. Materials
n-Heptane, n-Nonane, AOT-Dioctyl sulfosuccinate sodium salt, Cd(NO3)2∙4H2O, Na2S∙9H2O were purchased by Sigma-Aldrich. MilliQ water was freshly prepared in house.
3.2. Synthesis of CdS Nanocrystals
Two microemulsions were prepared from a mixture of 1.28 g AOT, 50 mL n-Heptane, 125 µL milliQ H2O under vigorous stirring for about 30 minutes until the solution became clear.
In one microemulsion, 100 µL of a Cd(NO3)2∙4H2O (0.6 M) solution was added under vigorous stirring. The same preparation was carried out to obtain Na2S (0.6 M) in the second microemulsion. In these conditions, the microemulsions were characterized by a water content (W = [H2O]/[AOT]) value of 4.3. Subsequently, in a two-neck flask 25 mL of Cd2+ microemulsion and 25 mL of S2− microemulsion were added; the resulting mixture was stirred under nitrogen for up to 60’ at room temperature. Later this final microemulsion was put through a reflux treatment under stirring and flow of nitrogen for 45 minutes to remove the water avoiding a continuous QDs’ growth.
3.3. Optical Characterization
UV-VIS absorption spectra were recorded with a Perkin-ElmerLambda 800 spectrophotometer on air-equilibrated solutions. Corrected photoluminescence (PL) spectra were acquired with a Fluorolog-2 (Spex, F112AI) spectrofluorimeter.
3.4. Morphological Characterization
A Philips model 208 transmission electron microscope (operating at 80 kV of beam acceleration) was used to image the nanocrystals and analyze their size distribution. The size distributions were obtained by analyzing 100–150 nanocrystals in each sample; the data were used to build up histograms in terms of frequency of a dimension (Ni) compared to the total number of particles (NT), which were analyzed by a Gaussian function. The fitting parameters (peak position and width) are reported together with their statistical errors.
4. Conclusions
CdS nanocrystals were prepared in water-in-oil microemulsions to monitor the effects of suspension aging on the nanocrystal properties in order to obtain information about their growth mechanism. In particular, the absorption and luminescence spectra and size distributions of the CdS nanocrystals were monitored at different times after mixing the microemulsions of the two precursors. Size distribution histograms obtained from samples taken at early times after mixing presented two populations with diameter of 3.0 ± 0.1 and 5.8 ± 0.1 nm, thus indicating that once the droplets exchange their content and allow nanocrystal growth, the latter is controlled surface processes which tends to disperse the populations. The growth process leads to the development of structural defects in the nanocrystal, which affect their optical/electronic properties. In particular, rather low luminescence quantum efficiencies were measured for the sample at early reaction stages (about 2%), which unfortunately decreased with the growth process. With longer reaction times the formation of nanocrystal agglomerates was observed in TEM images supporting the hypothesis that water droplet coalescence occurred and altered the nanocrystal growth. Using a water-in-nonane microemulsion, smaller CdS nanocrystals with an average diameter of 2.5 nm could be obtained likely because the droplet exchange rate is reduced, although the luminescence spectra suggests that the nanocrystals developed structural defects, which contribute to the emission at longer wavelength. In general, aging of the nanocrystal resulted in the development of cubic nanostructures. The interactions that drive the formation of non-spherical nanocrystals are currently under deeper investigation, the hypothesis can be raised that it is related to the specific interactions between the nanocrystal surface and the AOT molecules. However the results indicate that these procedures could be used to tune the shape of semiconductor nanocrystals.
Acknowledgments
Authors thank the Minister for the University and Scientific Research (MIUR, Rome) and the University of Perugia for the financial support.
References
- Murray, C.B.; Norris, D.J.; Bawendi, M.G. Synthesis and characterization of nearly monodisperse CdE (E = sulfur, selenium, tellurium) semiconductor nanocrystallites. J. Am. Chem. Soc. 1993, 115, 8706–8715. [Google Scholar]
- Kongkanand, A.; Tvrdy, K.; Takechi, K.; Kuno, M.; Kamat, P.V. Quantum Dot Solar Cells. Tuning Photoresponse through Size and Shape Control of CdSe-TiO2 Architecture. J. Am. Chem. Soc. 2008, 130, 4007–4015. [Google Scholar]
- Bruchez, M., Jr.; Moronne, M.; Gin, P.; Weiss, S.; Alivisatos, A.P. Semiconductor Nanocrystals as Fluorescent Biological Labels. Science 1998, 281, 2013–2015. [Google Scholar] [CrossRef]
- Larson, D.R.; Zipfel, W.R.; Williams, R.M.; Clark, S.W.; Bruchez, M.P.; Wise, F.W.; Webb, W.W. Water-Soluble Quantum Dots for Multiphoton Fluorescence Imaging in Vivo. Science 2003, 300, 1434–1436. [Google Scholar]
- Amelia, M.; Flamini, R.; Latterini, L. Recovery of CdS Nanocrystal Defects through Conjugation with Proteins. Langmuir 2010, 26, 10129–10134. [Google Scholar] [CrossRef]
- Zhang, Z.H.; Chin, W.S.; Vittal, J.J. Water-Soluble CdS Quantum Dots Prepared from a Refluxing Single Precursor in Aqueous Solution. J. Phys. Chem. B 2004, 108, 18569–18574. [Google Scholar] [CrossRef]
- Gaponik, N.; Talapin, D.V.; Rogach, A.L.; Hoppe, K.; Shevchenko, E.V.; Kornowski, A.; Eychmüller, A.; Weller, H. Efficient Phase Transfer of Luminescent Thiol-Capped Nanocrystals: From Water to Nonpolar Organic Solvents. NanoLett. 2002, 2, 803–806, and reference therein.. [Google Scholar] [CrossRef]
- Peng, J.; Wickham, J.; Alivisatos, A.P. Kinetics of II-VI and III-V colloidal Semiconductor nanocrystals growth: “focusing” of size distribution. J. Am. Chem. Soc. 1998, 120, 5343–5344. [Google Scholar] [CrossRef]
- Chestnoy, N.; Harris, T.D.; Hull, R.; Brus, L.E. Luminescence and Photophysics of CdS Semiconductor Clusters: The Nature of the Emitting Electronic State. J. Phys. Chem. 1986, 90, 3393–3399. [Google Scholar] [CrossRef]
- Simmons, B.A.; Li, S.; John, V.T.; McPherson, G.L.; Bose, A.; Zhou, W.; He, J. Morphology of CdS Nanocrystals Synthesized in a Mixed Surfactant System. NanoLett. 2002, 2, 263–268. [Google Scholar] [CrossRef]
- Ganguli, A.K.; Ganguly, A.; Vaidya, S. Microemulsion-based synthesis of nanocrystalline materials. Chem. Soc. Rev. 2010, 39, 474–485. [Google Scholar] [CrossRef]
- Towey, T.F.; Khan-Lodhi, A.; Robinson, B.H. Kinetic and mechanism of formation of quantum-sized cadmium sulphide nanoparticle in water-aereosol-OT-oil microemulsions. J. Chem. Faraday Trans. 1990, 86, 3757–3762. [Google Scholar] [CrossRef]
- van Embden, J.; Jasieniak, J.; Mulvaney, P. Mapping the Optical Properties of CdSe/CdS Heterostructure Nanocrystals: The Effects of Core Size and Shell Thickness. J. Am. Chem. Soc. 2009, 131, 14299–14309. [Google Scholar] [CrossRef]
- Cao, H.; Wang, G.; Zhang, S.; Zhang, X.; Rabinovich, D. Growth and Optical Properties of Wurtzite-Type CdS Nanocrystals. Inorg. Chem. 2006, 45, 5103–5108. [Google Scholar]
- Petit, C.; Lixon, P.; Pileni, M.P. Synthesis of Cadmium Sulfide in Situ in Reverse Micelles. 2. Influence of the Interface on the Growth of Particles. J. Phys. Chem. 1990, 94, 1598–1603. [Google Scholar]
© 2012 by the authors; licensee MDPI, Basel, Switzerland. This article is an open-access article distributed under the terms and conditions of the Creative Commons Attribution license (http://creativecommons.org/licenses/by/3.0/).
Share and Cite
MDPI and ACS Style
Latterini, L.; Iagatti, A. Growth Mechanisms of CdS Nanocrystals in Aqueous Media. Crystals 2012, 2, 618-626. https://doi.org/10.3390/cryst2020618
AMA Style
Latterini L, Iagatti A. Growth Mechanisms of CdS Nanocrystals in Aqueous Media. Crystals. 2012; 2(2):618-626. https://doi.org/10.3390/cryst2020618
Chicago/Turabian StyleLatterini, Loredana, and Alessandro Iagatti. 2012. "Growth Mechanisms of CdS Nanocrystals in Aqueous Media" Crystals 2, no. 2: 618-626. https://doi.org/10.3390/cryst2020618