Differential Scanning Calorimetry (DSC) and Synchrotron X-ray Diffraction Study of Unmilled and Milled LiBH4: A Partial Release of Hydrogen at Moderate Temperatures


Abstract
:1. Introduction
2. Experimental Method
- Wide temperature range: upon heating from 100 to 500 K, with 60 K per hour rate;
- Fine temperature sampling: upon heating from 368 to 398 K, followed by cooling in the same temperature range with a rate of 10 K per hour; the same heating/cooling cycle was then repeated on the same sample spot, but with a rate of 100 K per hour.
- Under 2 bar of H2: first upon heating from 297 to 400 K with a rate of 40 K per hour and then on cooling from 400K to 350 K with a rate of 100 K per hour;
- Under 40 bar of H2: upon heating from 350 to 395 K, with a rate of 20 K per hour.
3. Results and Discussion
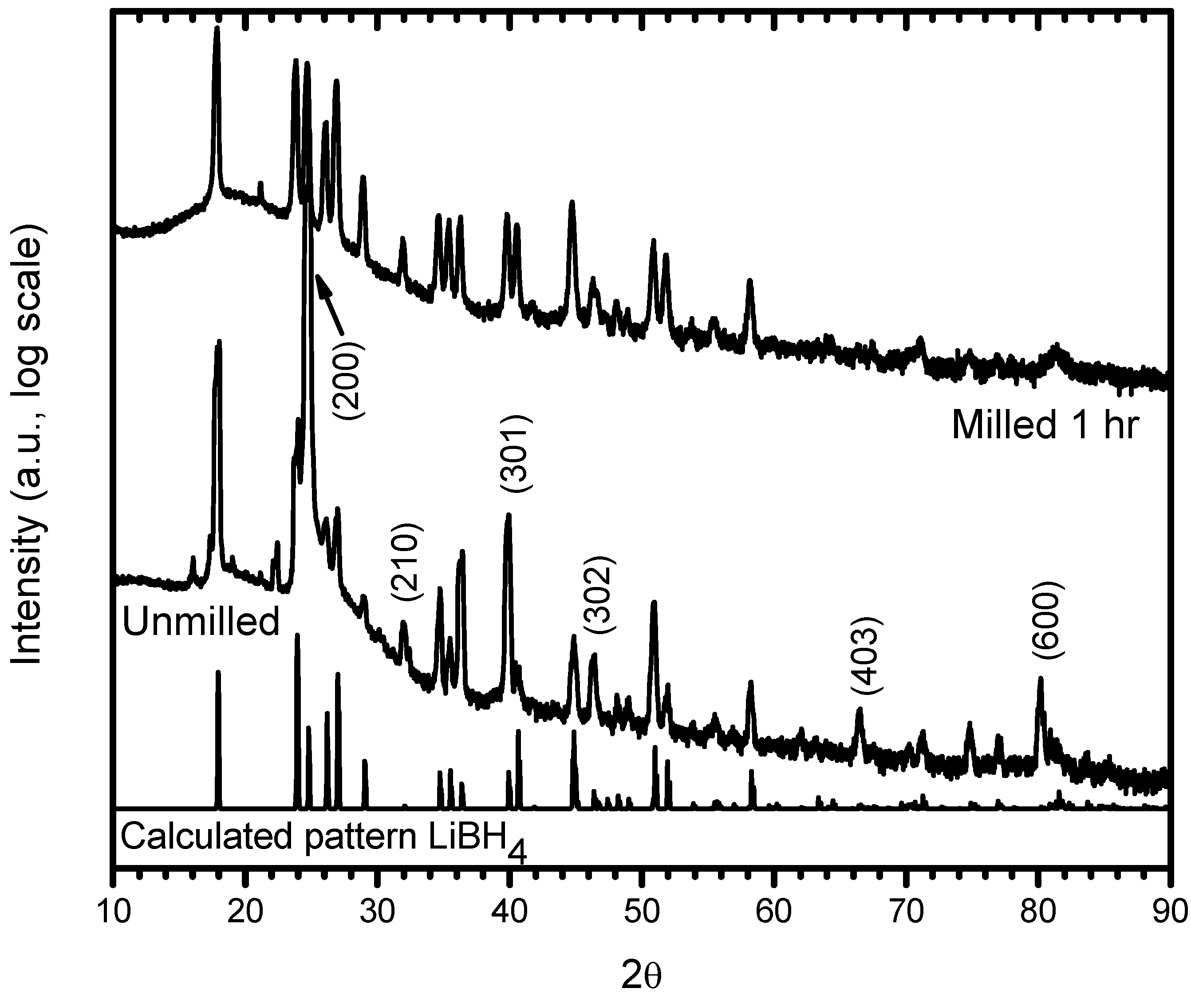
3.1. Structural Characterization
3.2. Phases Transformations in Unmilled LiBH4


| First heating | First cooling | Second heating | ||||
| DSC atmosphere | First endotherm | Exotherm | Phase transition | Phase transition | Exotherm | Phase transition |
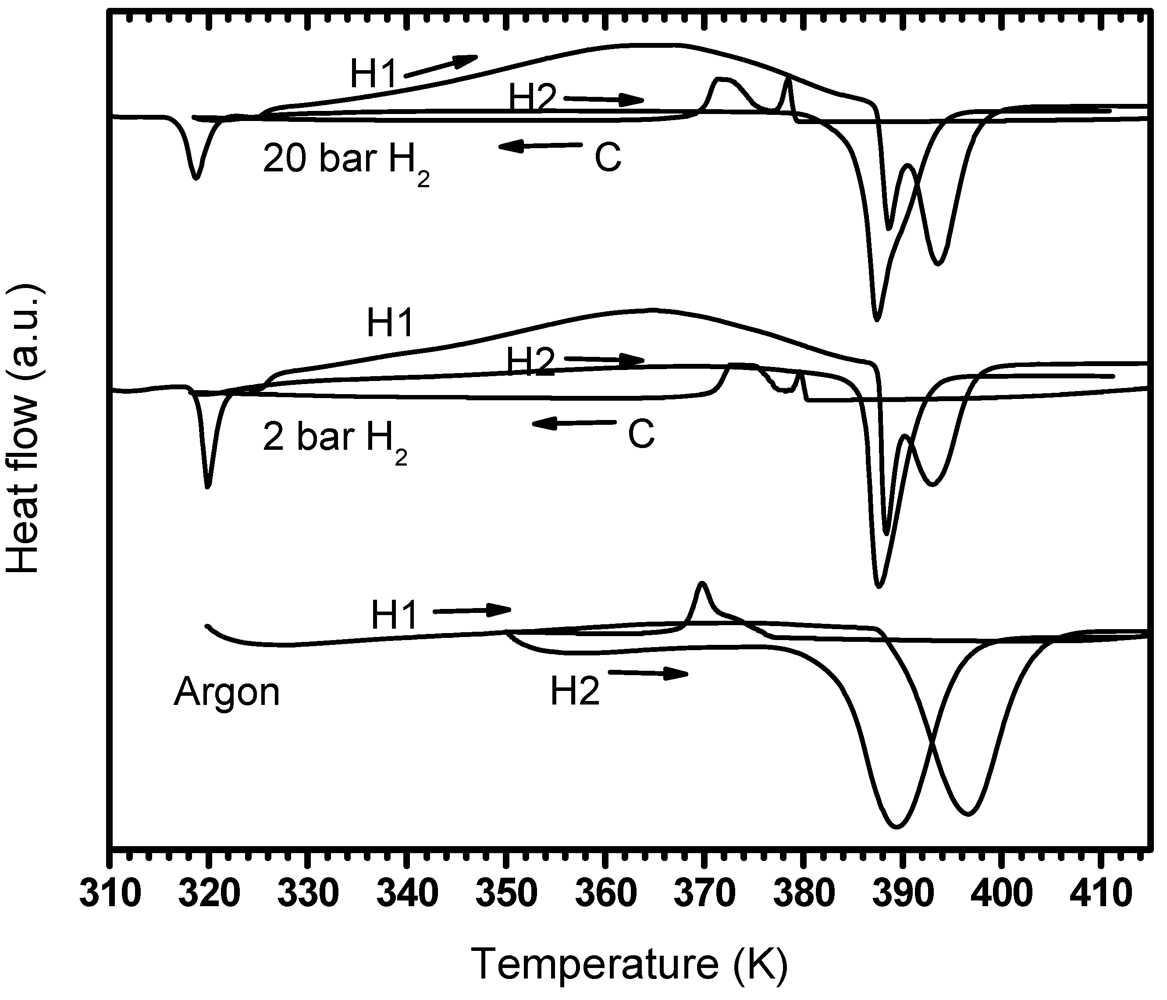
| Argon | -- | 368.3 | 390.6 | 380.4 | -- | 390.3 |
| 2 bar Hydrogen | 320.6 | 367.7 | 388.1 | 381.0 | 368.9 | 387.6 |
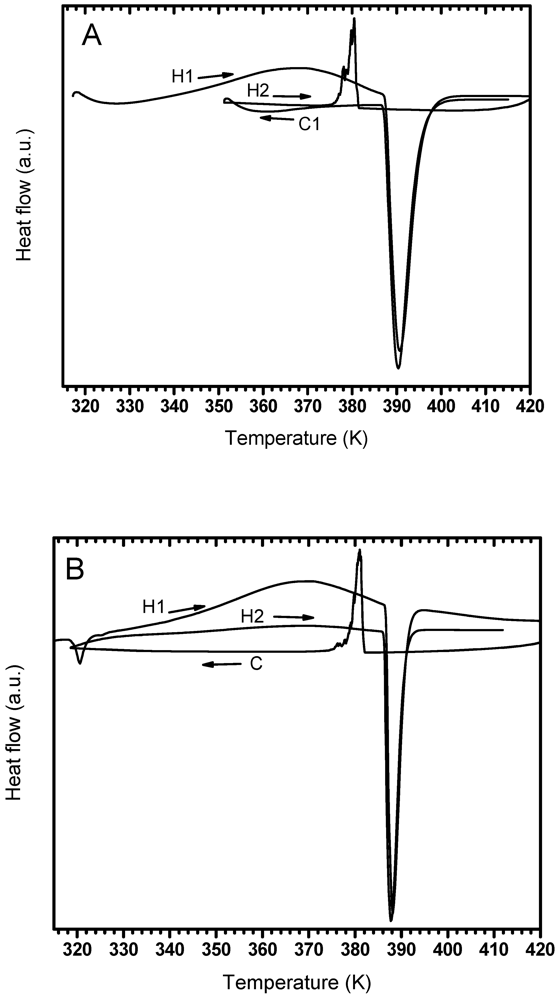
3.3. Investigation of the Exotherm
3.3.1. Effect of PDSC Atmosphere
3.3.2. Effect of Settling Time
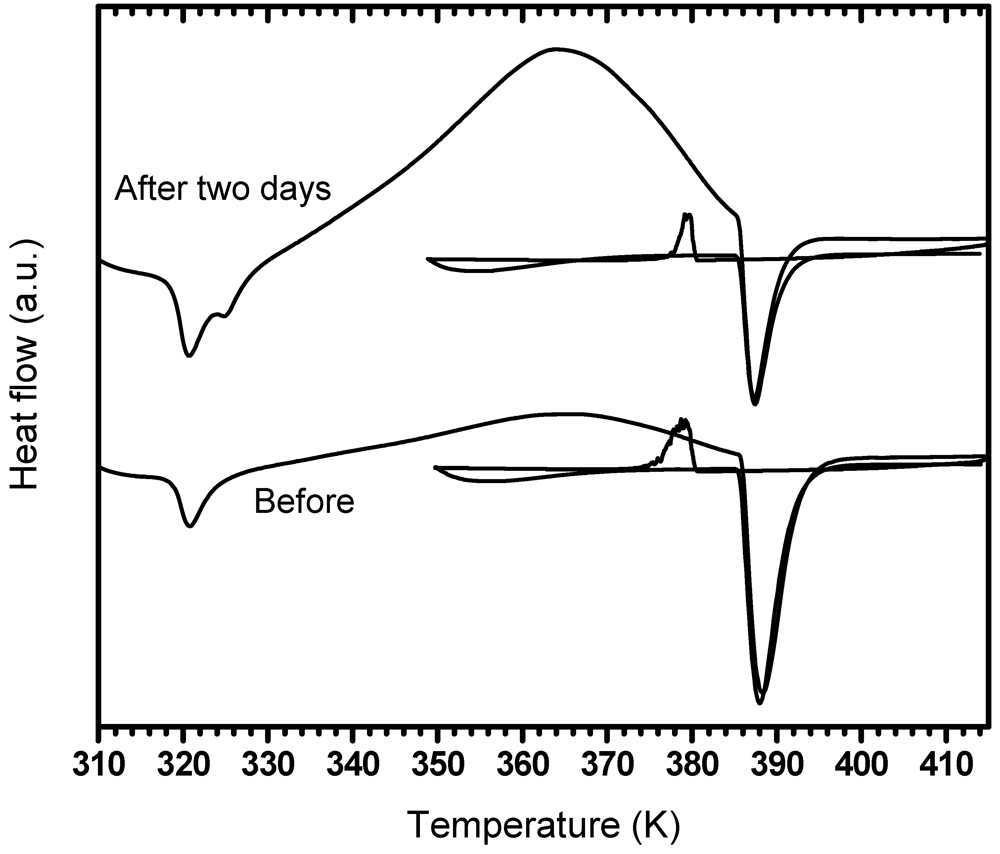
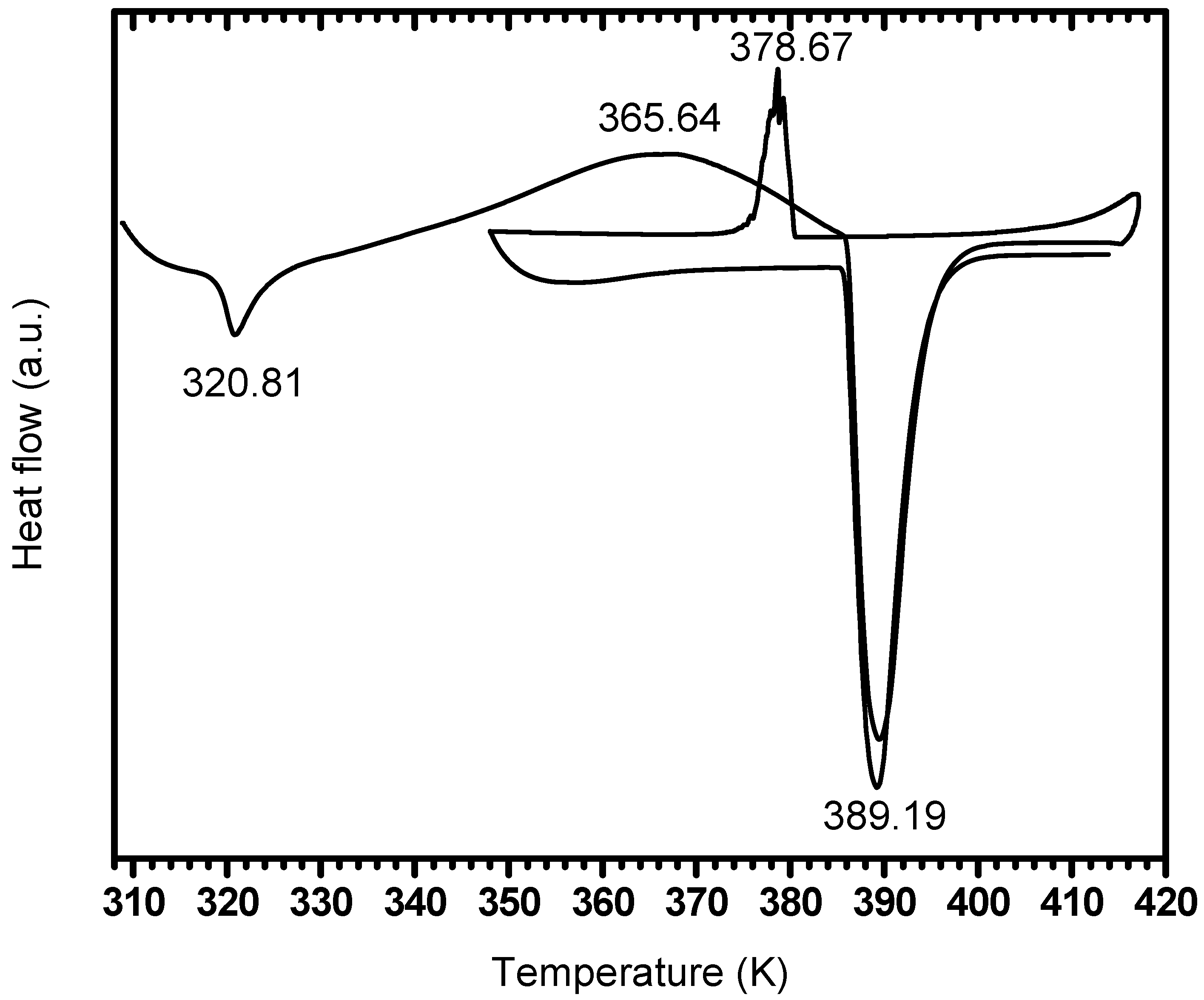
3.3.3. Effect of Exposure to Dry Air
| First heating | First cooling | Second heating | ||||
| Sample | First endotherm | Exotherm | Phase transition | Phase transition | Exotherm | Phase transition |
| Before air exposure | 319.6 | 362.6 | 385.9 | 378.8 | 364.4 | 386.1 |
| After two days air exposure | 320.8 | 365.0 | 389.4 | 378.6 | -- | 389.1 |

3.4. Effect of Milling
3.4.1. PDSC Curves
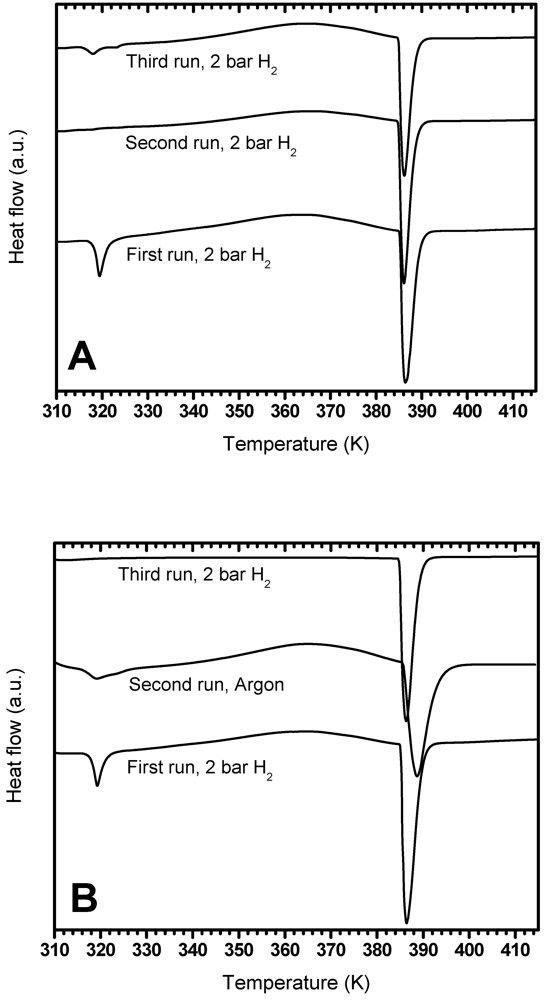
3.4.1.1. PDSC Performed under Argon Atmosphere
3.4.1.2. PDSC Performed under Hydrogen Atmosphere (2 and 20 bar)
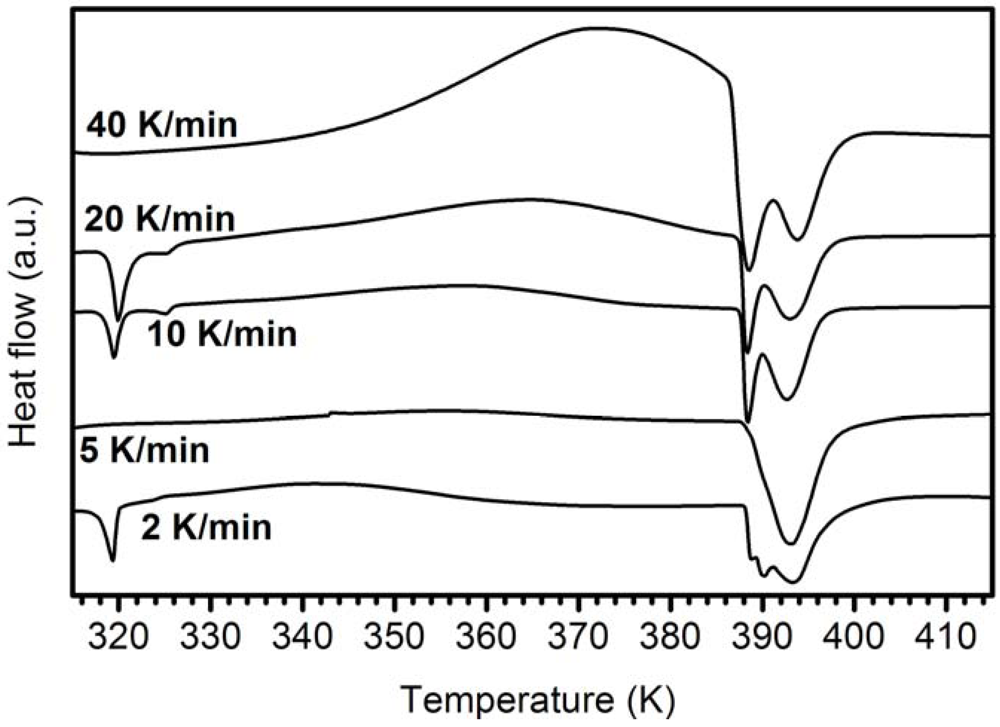
3.4.2. Activation Energy of the Exothermic Peak
| Sample/Atmosphere | argon | 2 bar hydrogen |
|---|---|---|
| Unmilled | 79 ± 6 | 102 ± 2 |
| Milled | 95 ± 8 | 100 ± 12 |
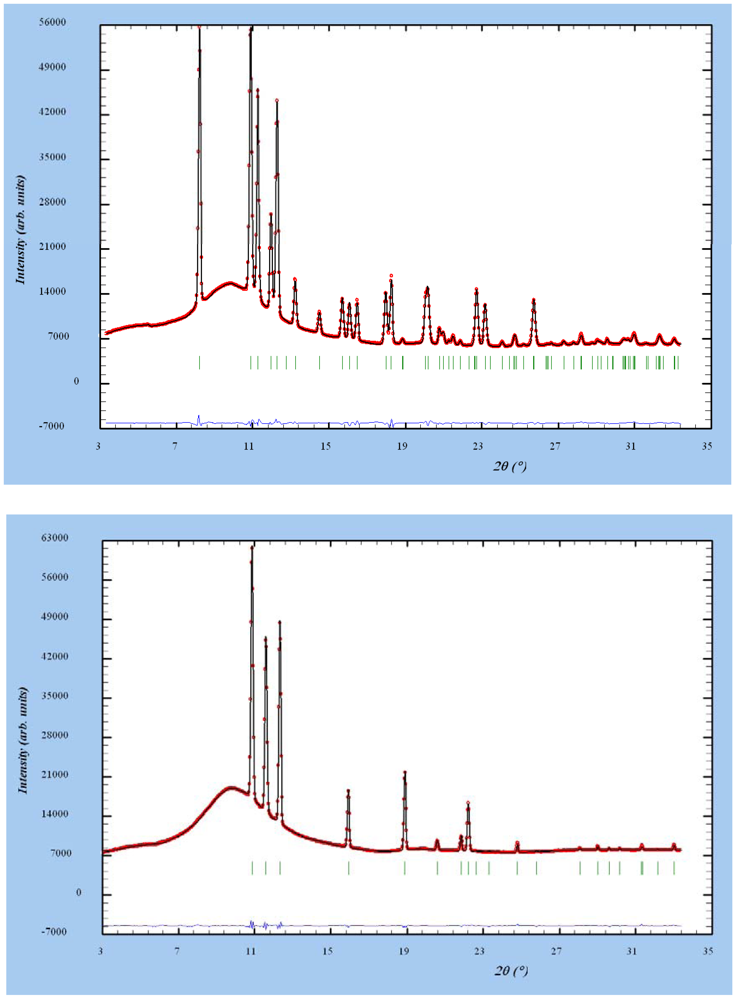
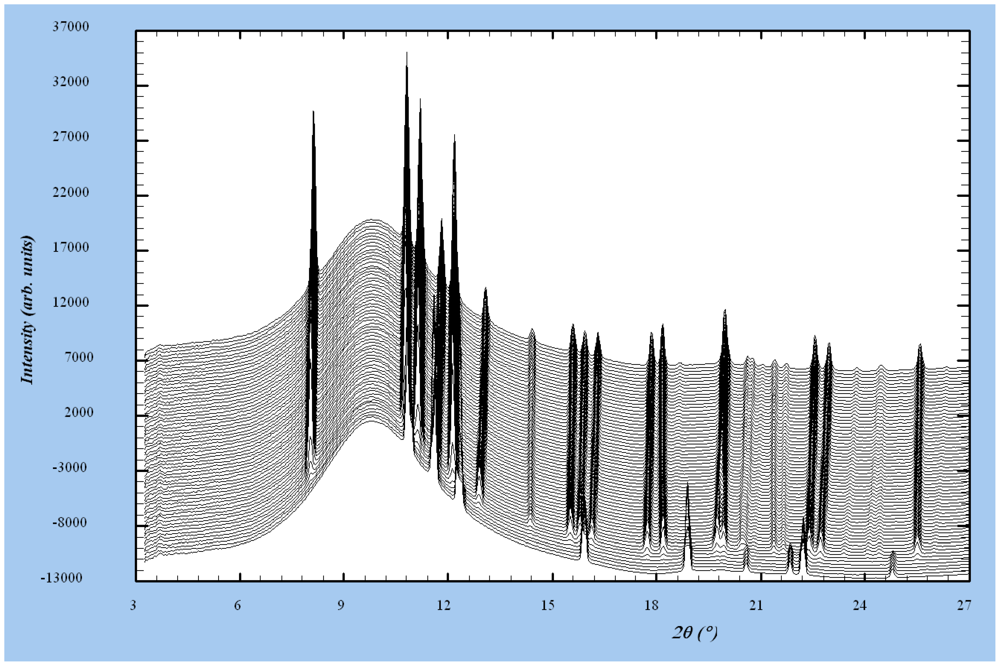
3.5. In-situ Synchrotron X-ray Diffraction Study


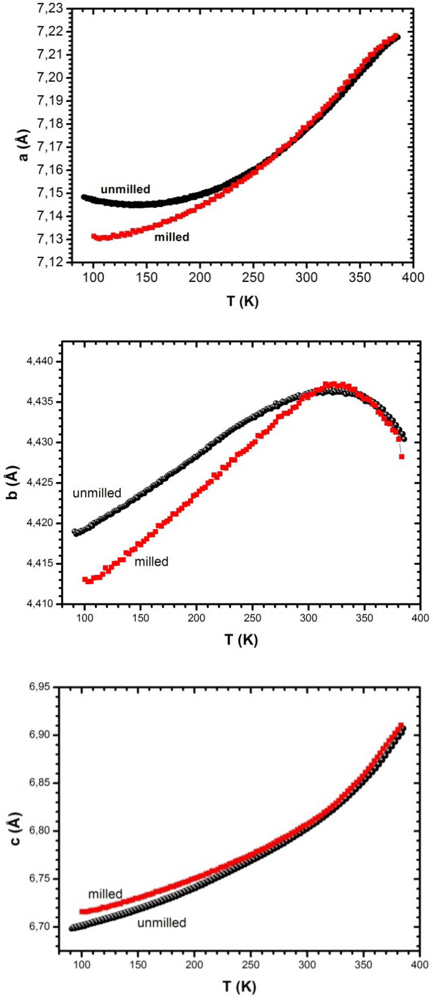
3.5.1. Temperature Variation of Lattice Parameters: Effect of Milling

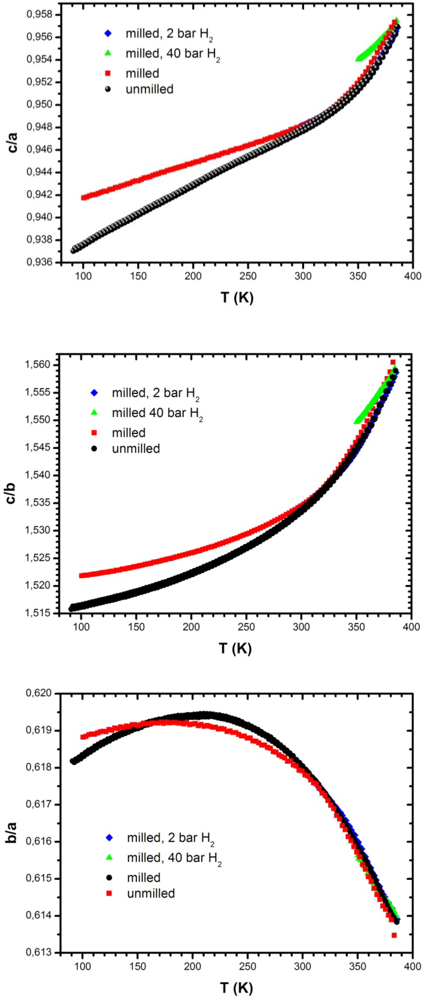
3.5.2. Temperature Variation of Lattice Parameters: Effect of Hydrogen Atmosphere and of a Hydrostatic Pressure

4. Conclusion
Acknowledgements
References
- Züttel, A.; Rentsch, S.; Wenger, P.; Sudan, P.; Mauron, P.; Emmenegger, C. Hydrogen storage properties of LiBH4. J. Alloys Compounds 2003, 356-357, 515–520. [Google Scholar] [CrossRef]
- Friedrichs, O.; Kim, J.W.; Remhof, A.; Buchter, F.; Borgschulte, A.; Wallacher, D.; Cho, Y.W.; Fichtner, M.; Oh, K.H.; Züttel, A. The effect of Al on the hydrogen sorption mechanism of LiBH4. Phys. Chem. Chem. Phys. 2009, 11, 1515–1520. [Google Scholar]
- Mauron, P.; Buchter, F.; Friedrichs, O.; Remhof, A.; Bielmann, M.; Zwicky, C.N.; Zuttel, A. Stability and Reversibility of LiBH4. J. Phys. Chem. B 2008, 112, 906–910. [Google Scholar]
- Orimo, S.; Nakamori, Y.; Kitahara, G.; Miwa, K.; Ohba, N.; Towata, S.; Züttel, A. Dehydriding and rehydriding reactions of LiBH4. J. Alloys Compounds 2005, 404-406, 427–430. [Google Scholar] [CrossRef]
- Friedrichs, O.; Buchter, F.; Borgschulte, A.; Remhof, A.; Zwicky, C.N.; Mauron, P.; Bielmann, M.; Züttel, A. Direct synthesis of Li[BH4] and Li[BD4] from the elements. Acta Mater. 2008, 56, 949–954. [Google Scholar] [CrossRef]
- Vajo, J.J.; Skeith, S.L.; Mertens, F. Reversible Storage of Hydrogen in Destabilized LiBH4. J. Phys. Chem. B 2005, 109, 3719–3722. [Google Scholar]
- Barkhordarian, G.; Klassen, T.; Dornheim, M.; Bormann, R. Unexpected kinetic effect of MgB2 in reactive hydride composites containing complex borohydrides. J. Alloys Compounds 2007, 440, L18–L21. [Google Scholar] [CrossRef]
- Yang, J.; Sudik, A.; Wolverton, C. Destabilizing LiBH4 with a Metal (M = Mg, Al, Ti, V, Cr, or Sc) or Metal Hydride (MH2 = MgH2, TiH2, or CaH2). J. Phys. Chem. C 2007, 111, 19134–19140. [Google Scholar] [CrossRef]
- Alapati, S.V.; Johnson, J.K.; Sholl, D.S. Large-Scale Screening of Metal Hydride Mixtures for High-Capacity Hydrogen Storage from First-Principles Calculations. J. Phys. Chem. C 2008, 112, 5258–5262. [Google Scholar]
- Bösenberg, U.; Doppiu, S.; Mosegaard, L.; Barkhordarian, G.; Eigen, N.; Borgschulte, A.; Jensen, T.R.; Cerenius, Y.; Gutfleisch, O.; Klassen, T.; et al. Hydrogen sorption properties of MgH2-LiBH4 composites. Acta Mater. 2007, 55, 3951–3958. [Google Scholar]
- Soulié, J.-P.; Renaudin, G.; Cerny, R.; Yvon, K. Lithium boro-hydride LiBH4 I. Crystal structure. J. Alloys Compounds 2002, 346, 200–205. [Google Scholar] [CrossRef]
- Hartman, M.R.; Rush, J.J.; Udovic, T.J.; Bowman, J.R.C.; Hwang, S.-J. Structure and vibrational dynamics of isotopically labeled lithium borohydride using neutron diffraction and spectroscopy. J. Solid State Chem. 2007, 180, 1298–1305. [Google Scholar] [CrossRef]
- Filinchuk, Y.; Chernysov, D.; Nevidomskyy, A.; Dimitriev, V. High-Pressure Polymorphism as a step toward destabilization of LiBH4. Angew. Chem. Int. Ed. 2008, 47, 529–532. [Google Scholar] [CrossRef]
- Filinchuk, Y.; Chernysov, D.; Cerny, R. Lightest Borohydride Probed by Synchrotron X-ray Diffraction: Experiment Calls for a New Theoretical Revision. J. Phys. Chem. C 2008, 112, 10579–10584. [Google Scholar]
- Hagemann, H.; Filinchuk, Y.; Chernyshov, D.; van Beek, W. Lattice anharmonicity and structural evolution of LiBH4: an insight from Raman and X-ray diffraction experiments. Phase Transit. 2009, 82, 344–355. [Google Scholar] [CrossRef]
- Mosegaard, L.; Moller, B.; Jorgensen, J.-E.; Filinchuk, Y.; Cerenius, Y.; Hanson, J.C.; Dimasi, E.; Besenbacher, F.; Jensen, T.R. Reactivity of LiBH4: In Situ Synchrotron Radiation Powder X-ray Diffraction Study. J. Phys. Chem. C 2008, 112, 1299–1303. [Google Scholar]
- Yvon, K. Hydrogen in novel solid-state metal hydrides. Z. Kristallogr. 2003, 218, 108–116. [Google Scholar] [CrossRef]
- Mosegaard, L.; Moller, B.; Jorgensen, J.-E.; Bösenberg, U.; Dornheim, M.; Hanson, J.C.; Cerenius, Y.; Walker, G.; Jakobsen, H.J.; Besenbacher, F.; et al. Intermediate phases abserved during decomposition of LiBH4. J. Alloys Compounds 2007, 446-447, 301–305. [Google Scholar]
- Harvey, K.B.; McQuaker, N.R. Low Temperature Infrared and Raman Spectra of Lithium Borohydride. Can. J. Chem. 1971, 49, 3282–3286. [Google Scholar] [CrossRef]
- Gomes, S.; Hagemann, H.; Yvon, K. Lithium boro-hydride LiBH4 II. Raman spectroscopy. J. Alloys Compounds 2002, 346, 206–210. [Google Scholar] [CrossRef]
- Hagemann, H.; Gomes, S.; Renaudin, G.; Yvon, K. Raman studies of reorientation motions of [BH4]− anionsin alkali borohydrides. J. Alloys Compounds 2004, 363, 126–129. [Google Scholar]
- Racu, A.-M.; Schoenes, J.; Lodziana, Z.; Borgschulte, A.; Zűttel, A. High-Resolution Raman Spectroscopy Study of Phonon Modes in LiBH4 and LiBD4. J. Phys. Chem. A 2008, 112, 9716–9722. [Google Scholar]
- Talyzin, A.V.; Andersson, O.; Sundqvist, B.; Kurnosov, A.; Dubrovinsky, L. High-pressure phase transition in LiBH4. J. Solid State Chem. 2007, 180, 510–517. [Google Scholar] [CrossRef]
- Corey, R.L.; Shane, D.T.; Bowman, R.C.; Conradi, M.S. Atomic Motions in LiBH4 by NMR. J. Phys. Chem. C 2008, 112, 18706–18710. [Google Scholar]
- Skripov, A.V.; Soloninin, A.V.; Filinchuk, Y.; Chernyshov, D. Nuclear Magnetic Resonance Study of the Rotational Motion and the Phase Transition in LiBH4. J. Phys. Chem. C 2008, 112, 18701–18705. [Google Scholar]
- Stasinevich, D.S.; Egorenko, G.A. Thermographic Investigation of Alkali Metal and Magnesium Tetrahydroborates and Pressures up to 10 atm. Russ. J. Inorg. Chem. 1968, 13, 341–343. [Google Scholar]
- Orimo, S.; Nakamori, Y.; Zuttel, A. Material properties of MBH4 (M = Li, Na, and K). Mater. Sci. Eng. B 2004, 108, 51–53. [Google Scholar] [CrossRef]
- Fedneva, E.M.; Alpatova, V.I.; Mikheeva, V.I. Thermal stability of lithium tetrahydroborate. Russ. J. Inorg. Chem. 1964, 9, 826–827. [Google Scholar]
- Llewellyn, P.L.; Horcajada, P.; Maurin, G.; Devic, T.; Rosenbach, N.; Bourrelly, S.; Serre, C.; Vincent, D.; Loera-Serna, S.; Filinchuk, Y.; et al. Complex Adsorption of Short Linear Alkanes in the Flexible Metal-Organic-Framework MIL-53(Fe). J. Am. Chem. Soc. 2009, 131, 13002–13008. [Google Scholar]
- Hammersley, A.P.; Svensson, S.O.; Hanfland, M.; Fitch, A.N.; Häusermann, D. Two-dimensional detector software: From real detector to idealised image or two-theta scan. High Pressure Res. 1996, 14, 235–248. [Google Scholar] [CrossRef]
- Vogel, S.; Ehm, L.; Knorr, K.; Braun, G. Automated processing of 2D powder data. Adv. X-ray Anal. 2002, 45, 31–33. [Google Scholar]
- Rodriguez-Carvajal, J. Recent advances in magnetic structure determination by neutron powder diffraction. Physica B 1993, 192, 55–69. [Google Scholar] [CrossRef]
- Kato, S.; Bielmann, M.; Borgschulte, A.; Zakaznova-Herzog, V.; Remhof, A.; Orimo, S.-i.; Zuttel, A. Effect of the surface oxidation of LiBH4 on the hydrogen desorption mechanism. Phys. Chem. Chem. Phys. 2010, 12, 10950–10955. [Google Scholar]
- Cahen, S.; Eymery, J.B.; Janot, R.; Tarascon, J.M. Improvement of the LiBH4 hydrogen desorption by inclusion into mesoporous carbons. J. Power Sources 2009, 189, 902–908. [Google Scholar] [CrossRef]
- Dmitriev, V.; Filinchuk, Y.; Chernyshov, D.; Talyzin, A.V.; ilewski, A.; Andersson, O.; Sundqvist, B.; Kurnosov, A. Pressure-temperature phase diagram of LiBH4: Synchrotron x-ray diffraction experiments and theoretical analysis. Phys. Rev. B 2008, 77, 174112. [Google Scholar]
© 2012 by the authors; licensee MDPI, Basel, Switzerland. This article is an open-access article distributed under the terms and conditions of the Creative Commons Attribution license (http://creativecommons.org/licenses/by/3.0/).
Share and Cite
Lang, J.; Gerhauser, A.; Filinchuk, Y.; Klassen, T.; Huot, J. Differential Scanning Calorimetry (DSC) and Synchrotron X-ray Diffraction Study of Unmilled and Milled LiBH4: A Partial Release of Hydrogen at Moderate Temperatures. Crystals 2012, 2, 1-21. https://doi.org/10.3390/cryst2010001
Lang J, Gerhauser A, Filinchuk Y, Klassen T, Huot J. Differential Scanning Calorimetry (DSC) and Synchrotron X-ray Diffraction Study of Unmilled and Milled LiBH4: A Partial Release of Hydrogen at Moderate Temperatures. Crystals. 2012; 2(1):1-21. https://doi.org/10.3390/cryst2010001
Chicago/Turabian StyleLang, J., A. Gerhauser, Y. Filinchuk, T. Klassen, and J. Huot. 2012. "Differential Scanning Calorimetry (DSC) and Synchrotron X-ray Diffraction Study of Unmilled and Milled LiBH4: A Partial Release of Hydrogen at Moderate Temperatures" Crystals 2, no. 1: 1-21. https://doi.org/10.3390/cryst2010001