2.1. Performance Tests
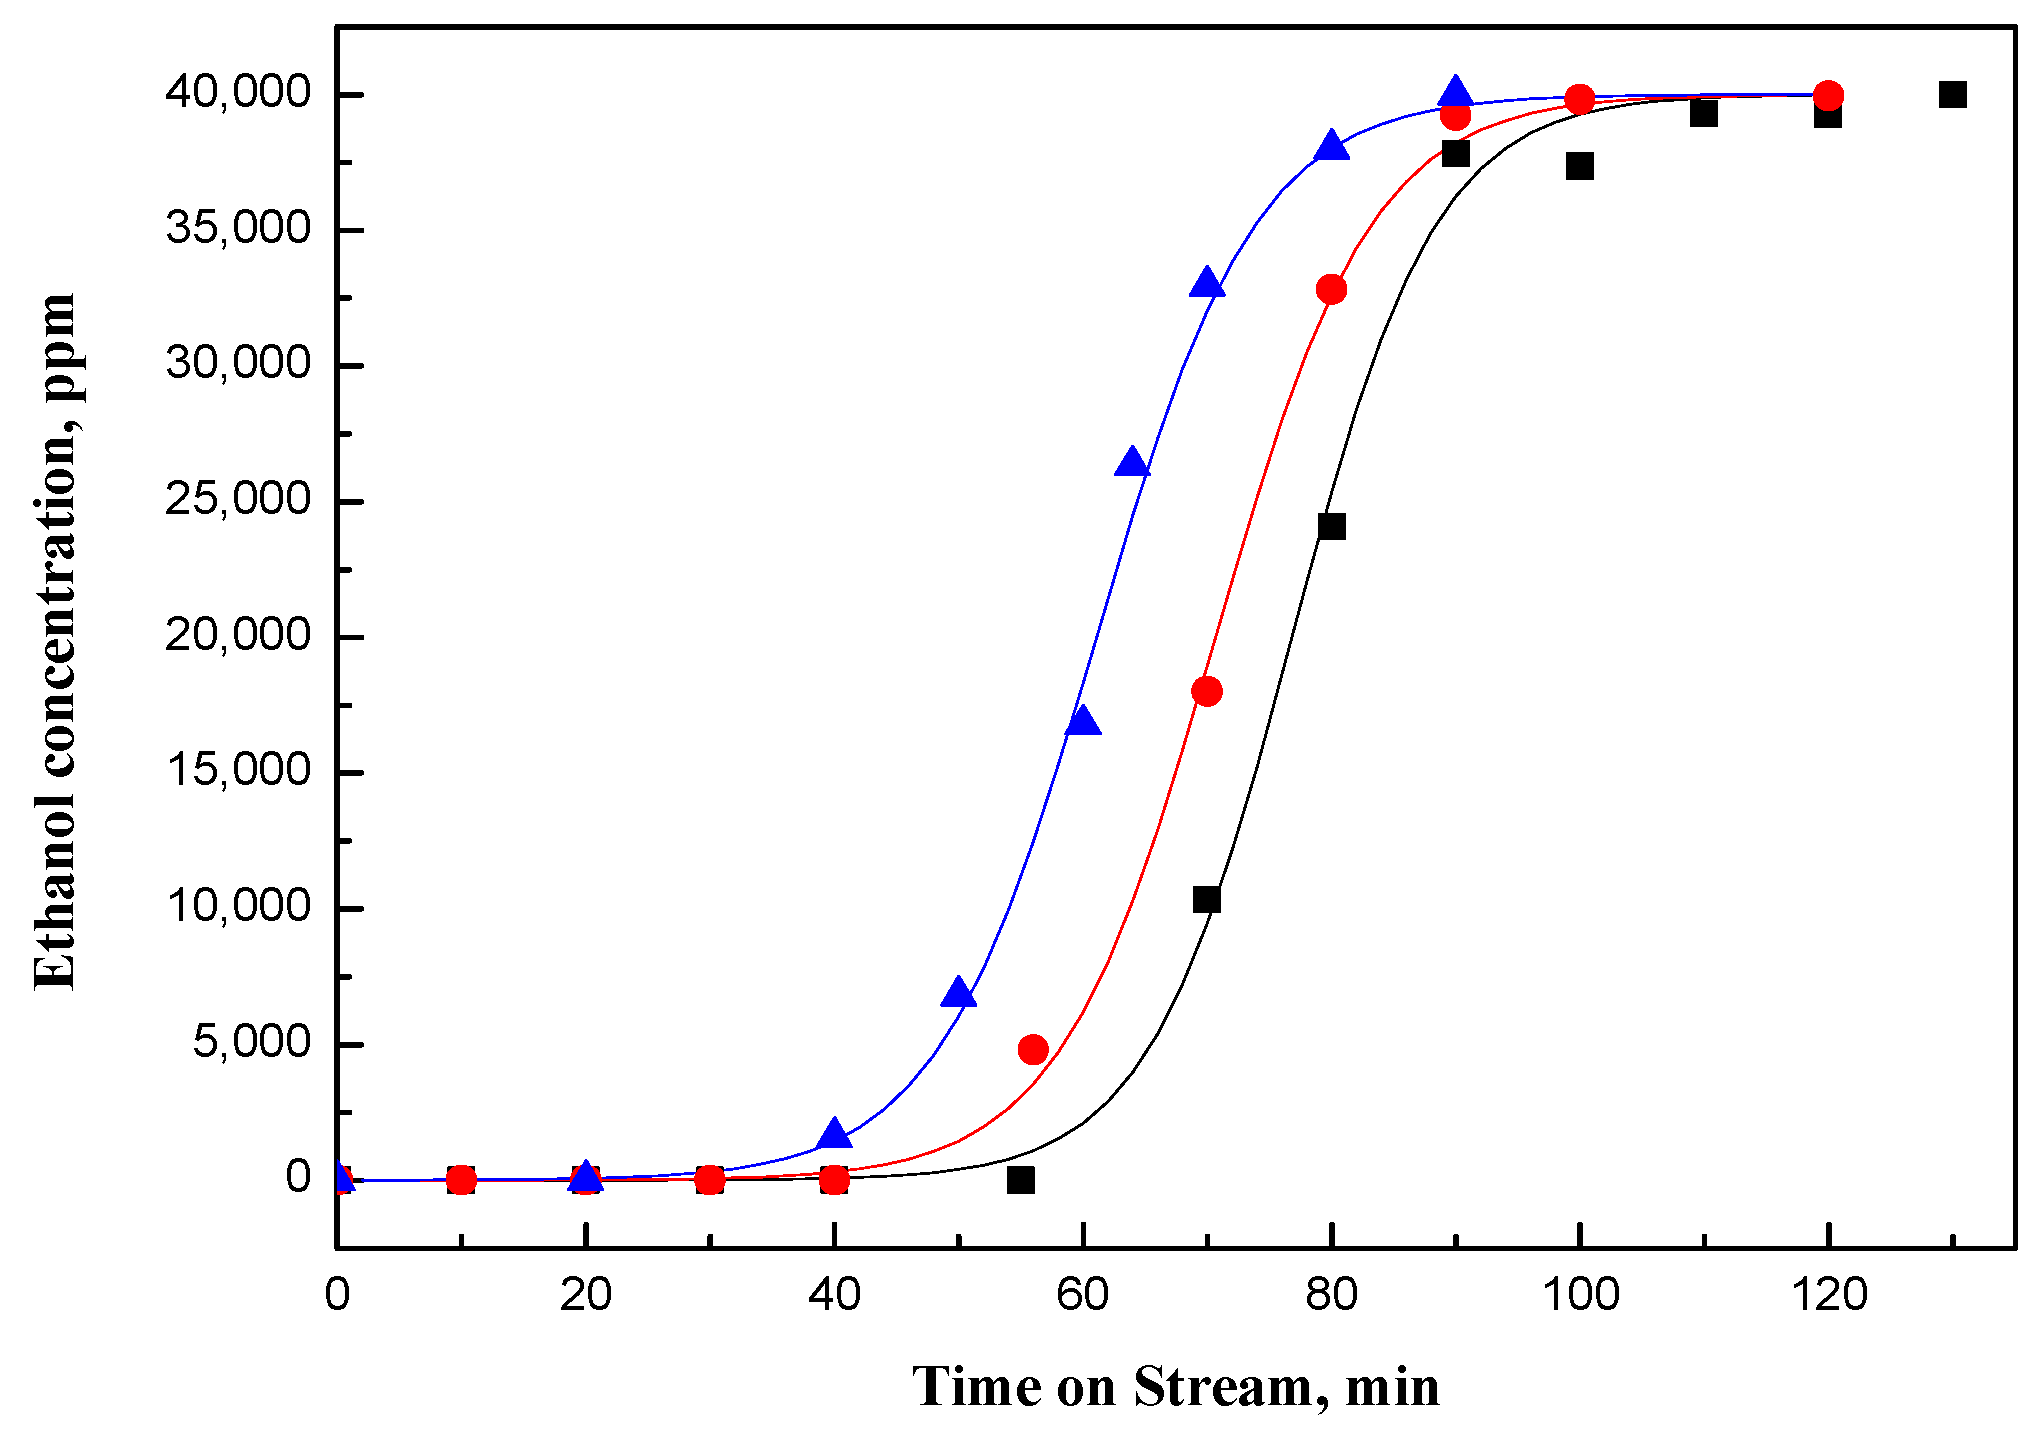
The dynamics of fixed-bed adsorption (breakthrough curve) for the fresh and air-regenerated NaY-SiO
2 and Pt/NaY-SiO
2 are shown in
Figure 1 and
Figure 2, respectively. The stoichiometric dynamic adsorption capacity was calculated by integrating the area above the whole breakthrough curve. The results indicated that the adsorption capacity of NaY-SiO
2 was decreased 8 and 21% after the 300 °C regeneration at high (
vs = 13.2 cm/min) and low flow rates (
vs = 5.3 cm/min), respectively; the samples were noted as NaYR
(HF) and NaYR
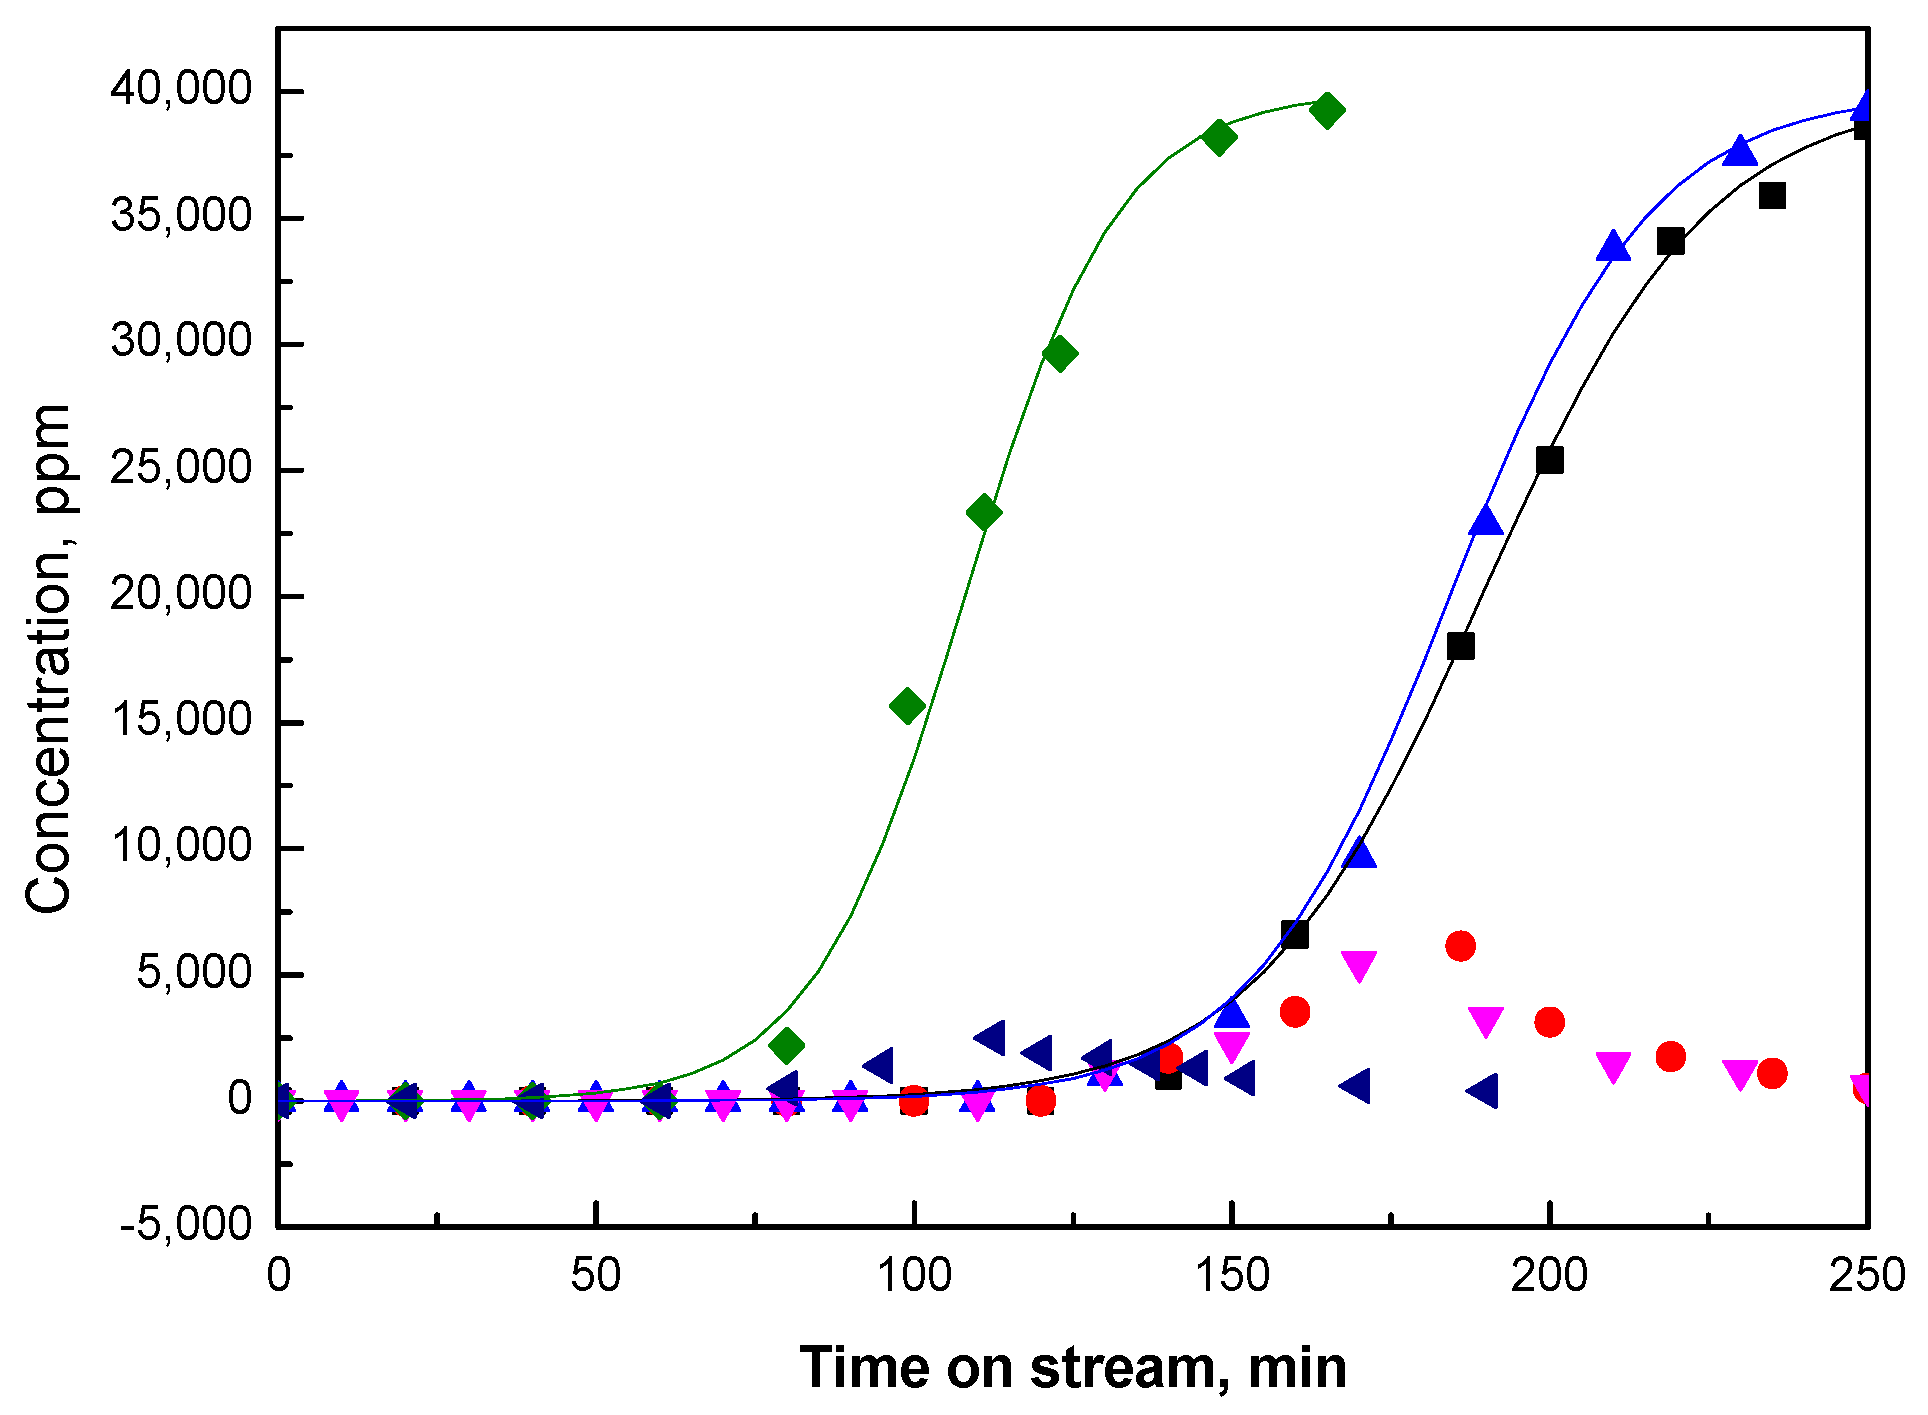
(LF), respectively, for high and low flow rates. The adsorption capacity was only decreased 2.5% for Pt/NaY-SiO
2 regenerated at high flow rate (PtR
(HF)), whereas it was 43% at low flow rate (PtR
(RF)).
As shown in
Figure 1, only ethanol was detected for NaY-SiO
2. In contrast, for Pt/NaY-SiO
2, both ethanol and a small amount of acetaldehyde were detected at the end of the adsorption cycle (
Figure 2). Acetaldehyde is formed from the oxidative dehydrogenation of ethanol catalyzed by Pt clusters. Much lower acetaldehyde formation was detected for PtR
(LF), as opposed to that for PtR
(HF) and for fresh Pt/NaY-SiO
2, suggesting loss of Pt activity in low-flow-rate air regeneration.
During the performance tests, the adsorption/reaction zone moves through the adsorber bed; adsorbent is saturated behind the adsorption/reaction zone and is free of adsorbate in front of the zone. The length of the adsorption/reaction (A/R) zone is a function of the mass transfer rate of the ethanol adsorbate from the gas stream to the active sites of the catalytic adsorbent and is represented by the steepness of breakthrough curve. In cases where the mass-transfer rate is decreased, the adsorption/reaction zone broadens and the breakthrough curve becomes less steep. As shown in
Figure 1 and
Figure 2, the breakthrough curve for Pt/NaY-SiO
2 is not as steep as that for NaY-SiO
2, indicating that other steps were involved besides ethanol adsorption when Pt is present. Reported in our previous paper, ethanol could be adsorbed on Pt clusters first, catalytically dissociated to ethoxide, and then diffused the adsorbed ethanol and/or ethoxide to the adsorption sites of NaY [
14]. Since all these steps take time, the mass transfer rate for Pt/NaY-SiO
2 is thus lower than that for NaY-SiO
2.
As shown in
Figure 2, the adsorption capacity and mass transfer rate of PtR
(HF) are close to those of the fresh Pt/NaY-SiO
2, while the adsorption capacity of PtR
(LF) is lower but the mass transfer rate is slightly higher (
Figure 2). The results are consistent with the loss of Pt activity for PtR
(LF) suggested by the decrease of acetaldehyde formed in the catalytic adsorption process.
2.2. Model for Breakthrough Curve
In order to assess the effects of air flow rate on the efficiency of regeneration quantitatively, a model for breakthrough curves was proposed. The differential material balance for a fixed adsorption bed is formulated as:
In Equation (1),
Dl (cm
2·s
−1) is axial dispersion coefficient;
ε is bed void fraction;
c (mg/cm
3) is gas phase adsorbate concentration in bulk flow;
z (cm) is axial distance;
u (=
vs/ε, cm/s) is interstitial velocity;
t (min) is elapsed time;
ρp (g/cm
3) is apparent adsorbent density, and
q (mg adsorbate/g adsorbent) is the adsorption capacity per unit mass of adsorbent [
17,
18].
In addition, the rate of mass transfer across the pellet (d
q/dt) is equal to ethanol adsorbed on the catalytic adsorbents and is formulated by an empirical equation, ∂
q/∂t =
ηkaC(
q0 −
q); where
C is ethanol concentration in gas phase,
q is adsorption capacity,
q0 is stoichiometric adsorption capacity,
ka is adsorption constant, and
η is a ratio of adsorption rates with component transfer resistance to adsorption rate without resistance [
14].
Since the characteristic time, t, for adsorbate moving from the bed inlet to the outlet is much longer than the residence time of the transporting gas stream,
L/
u (
L: length of adsorption bed), pseudo-steady-state approximation, ∂C/∂t = 0, was assumed for Equation (1). Because
L/
dp in this study is about 50, the axial dispersion term of Equation (1) is set at zero. After neglecting the unsteady and axial dispersion terms, Equation (1) can then be directly integrated [
19]. The analytical solution is given as:
Since the exponential terms in Equation (3) are much greater than (1), the equation can be further simplified as:
The stoichiometric adsorption capacity (q0) was used to evaluate the efficacy of regeneration, while η was used to characterize diffusion limitation. Since Ka is a constant, lumped ηKa can thus be used to evaluate the relative component transfer resistance before and after regeneration, although we were unable to decouple η and Ka.
The parameters in Equation (4) were estimated by fitting the breakthrough curves with least-squares method, and the results are summarized in
Table 1.
2.3. Regeneration Tests
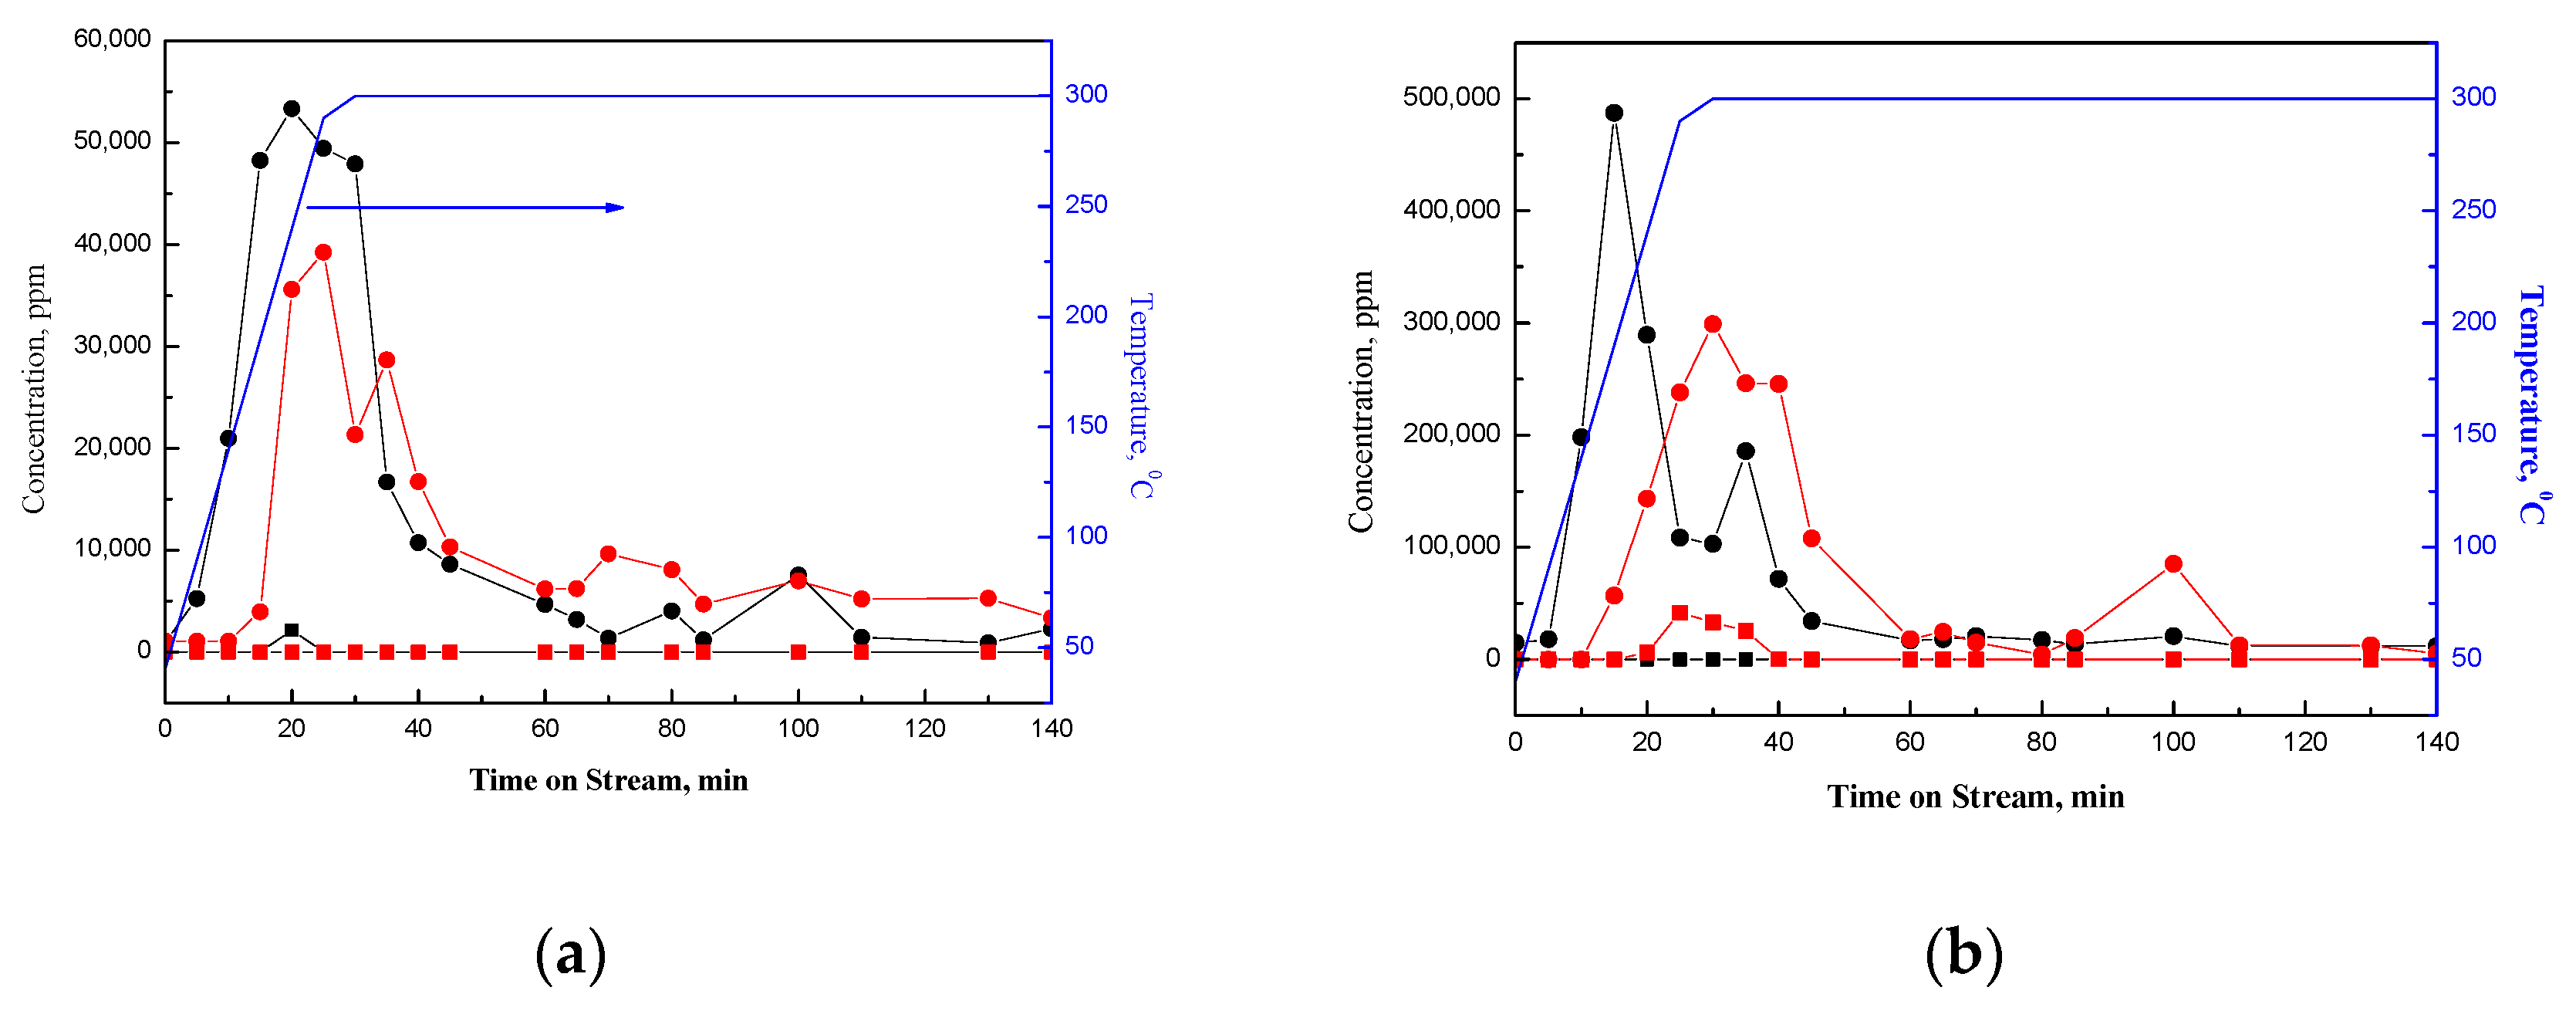
As shown in
Figure 3a,b, Pt catalytically oxidizes the surface species on NaY-SiO
2; hence, the total amount of CO
2 evolved from Pt/NaY-SiO
2 is about 6 times that from NaY-SiO
2 for both high and low air flow rate (
Table 2). There are two peaks appearing in the CO
2 evolved spectra of PtR
(HF) and PtR
(LF). The results suggest at least two different kinds of species on Pt/NaY-SiO
2. The peak appearing at low temperature (about 150 °C for PtR
(HF)) could be attributed to the oxidation of ethanol and acetaldehyde, while that at high temperature (300 °C) could be the characteristic peak of the combustion of carbon residue, which were formed from the oligomerization of ethanol-derivative species, such as ethylene and crotonaldehyde, conversion of acetone to mesityl oxide, and hydrocarbon decomposition [
20,
21]. Ethylene could be formed from dehydration of ethanol catalyzed by BrØnsted acid sites inside NaY and/or the decomposition of diethylether (DEE) [
22]. Crotonaldehyde could be formed from aldol condensation of two molecules of acetaldehyde, which was formed from the dehydrogenation of ethanol. Acetone could be produced through aldol condensation of acetate, which could be formed by the oxidation of acetaldehyde [
20]. In our previous study, characteristic peaks of ethoxides species have been detected by IR and EXAFS further suggested the coordination of ethoxide with Pt clusters via bridging hydrogen of ethanol (Pt
HOC
2H
5) [
14]. Inferred from the paper reported by Ferencz et al., carbon was suggested to be formed from the decomposition of Pt–bound CH
3 species, presumably, through acetaldehyde and acetyl species [
20].
The oxidation of ethanol in regeneration was strongly influenced by air flow rate. As shown in
Figure 3b, the peak characterizing the oxidation of ethanol is shifted from 150 °C to about 290 °C and the total amount of CO
2 decreased by about 60% when superficial velocity was decreased from 13.2 to 5.3 cm/min (
Table 2). In addition, a significant number of partial oxidation species, CO, were also formed at a low flow rate besides CO
2; in contrast, only trace amounts of CO were detected at a high flow rate (
Figure 3b).
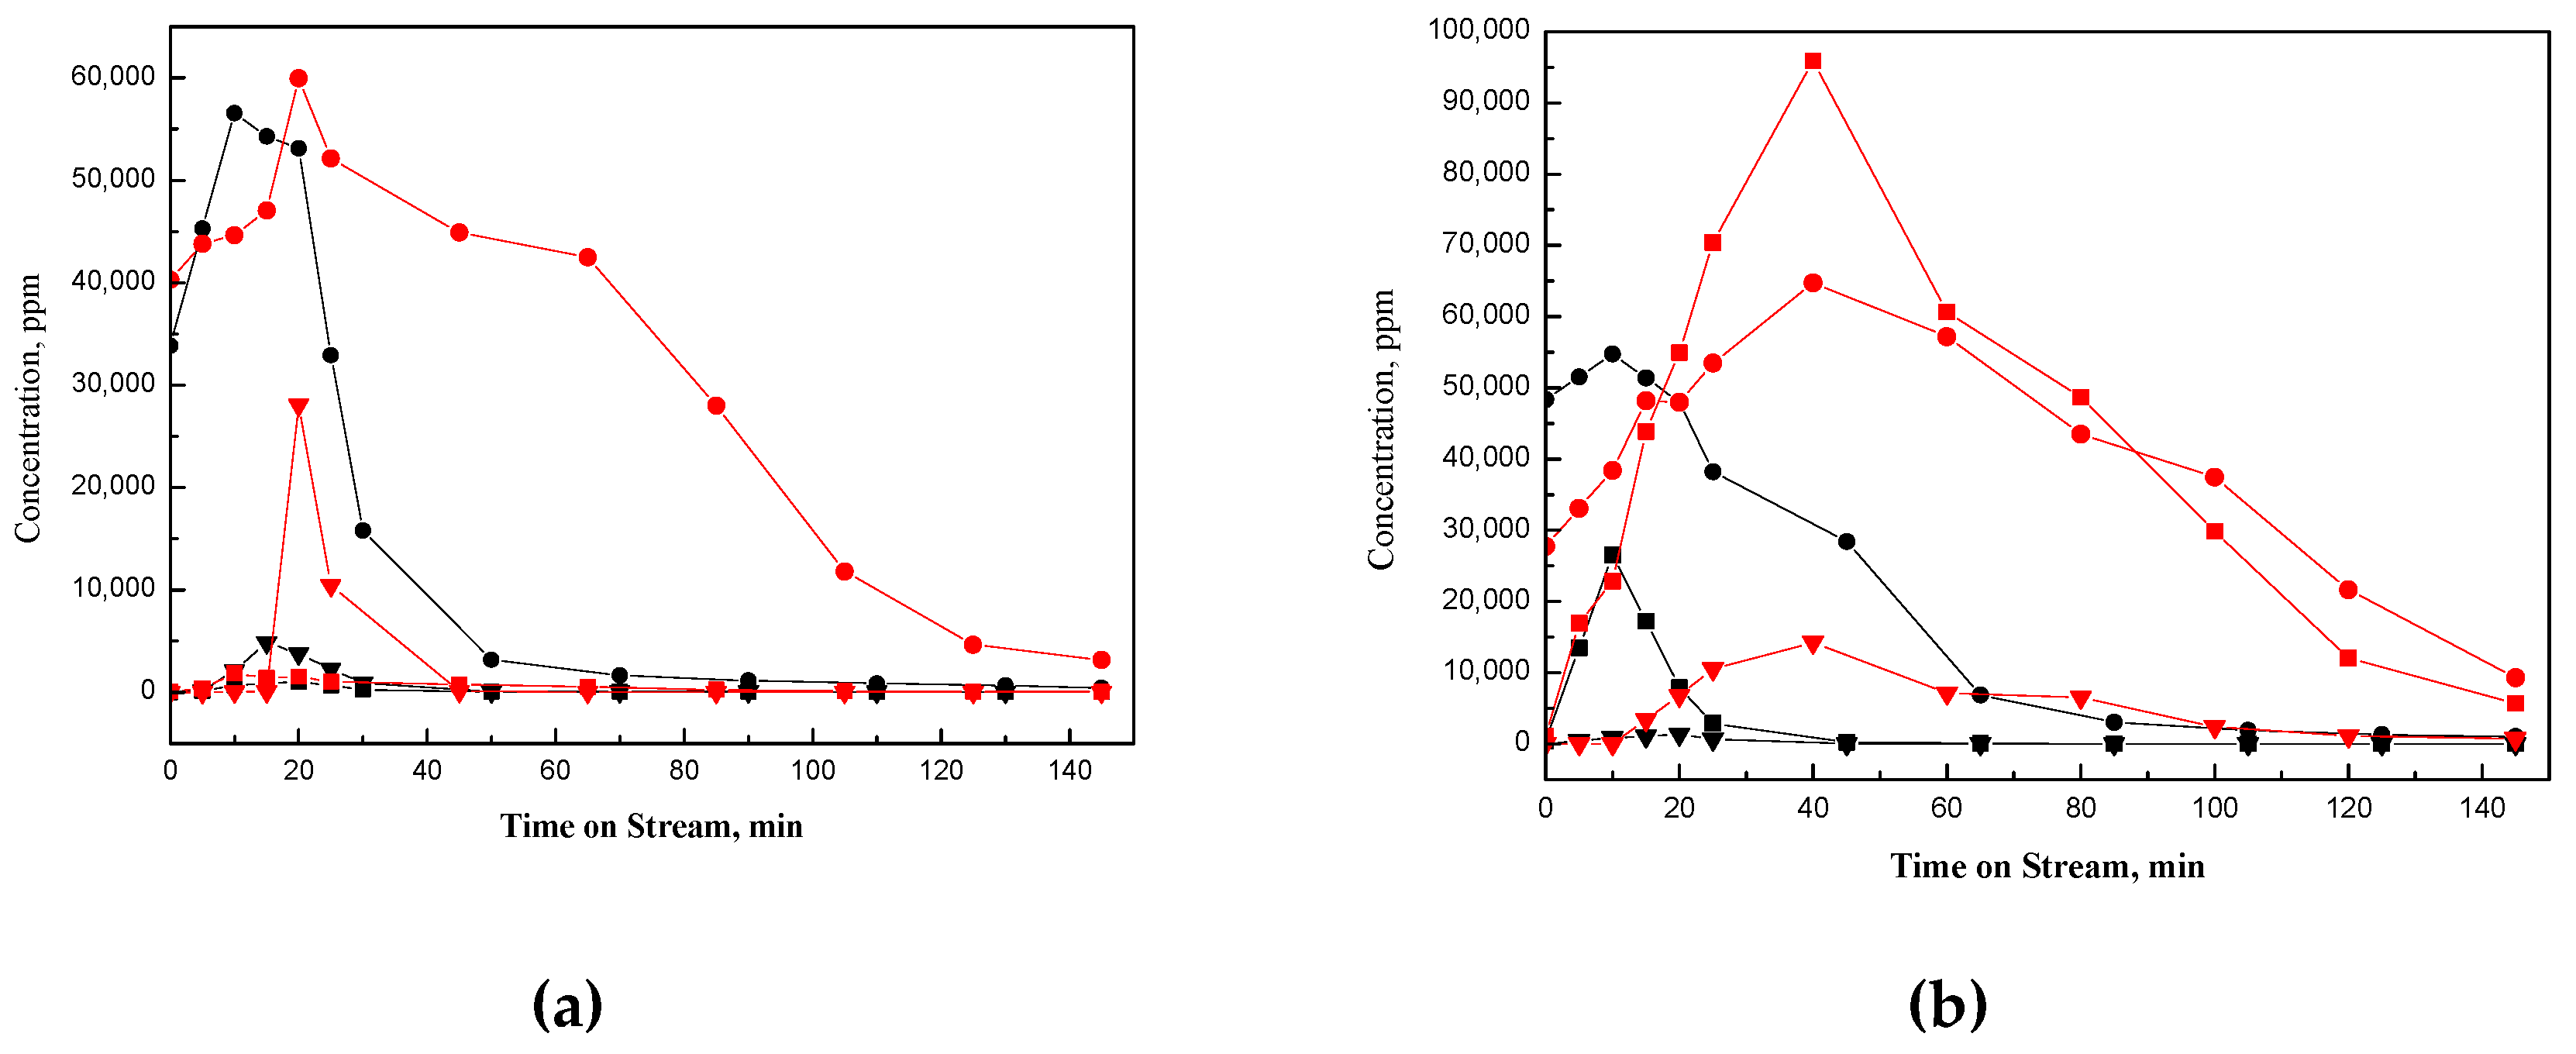
Concomitant with the oxidation of the adsorbed ethanol, ethanol and ethanol-derivative species were desorbed from Pt/NaY-SiO
2 and NaY-SiO
2. The main ethanol-derivative species for Pt/NaY-SiO
2 is acetaldehyde, and that for NaY-SiO
2 is diethylether (DEE). In our previous paper [
9], protonated ethanol (C
2H
5OH
2δ+) was detected in FT-IR spectroscopy characterizing ethanol adsorbed on NaY-SiO
2 at room temperature. Inferring from the literature that the protonated ethanol is more susceptible to elimination or substitution reaction [
22], we suggested that DEE could be catalytically formed from the reaction of the protonated ethanol on NaY with undissociated ethanol during air regeneration. Ethylene could thus be produced by ethanol dehydration and/or DEE cracking. However, this could be due to quick oligomerization and/or strong adsorption, no significant amount of ethylene was detected in the effluent gas.
Based on the carbon balance calculated from the breakthrough curve (
Figure 1) and profiles of evolved species (
Figure 3a and
Figure 4a), about 22 and 38% of ethanol-derivative species (
Table 2) were estimated to be deposited on NaY-SiO
2 after air regeneration at high and low flow rates, respectively. These strongly adsorbed carbon residues are defined as coke. The paraffinic coke could be formed from the ethylene oligomerization and aromatics from cyclization followed by hydrogen transfer reactions [
21,
23].
Total oxidation, partial oxidation, dehydration, and desorption of the adsorbed ethanol are the competitive processes occurring in air regeneration. The addition of Pt to NaY-SiO
2 increases the oxidation rate and thus decreases the amount of ethanol desorption (
Figure 4a,b). In addition, instead of DEE formed on NaY-SiO
2, acetaldehyde was formed from the dehydrogenation of Pt–associated ethoxy-group; as shown in
Figure 4b, only trace DEE was detected in high flow rate regeneration. However, this could be due to insufficient air supply for oxidative dehydrogenation reaction; small amounts of DEE were also detected in low flow rate regeneration of Pt/NaY-SiO
2.
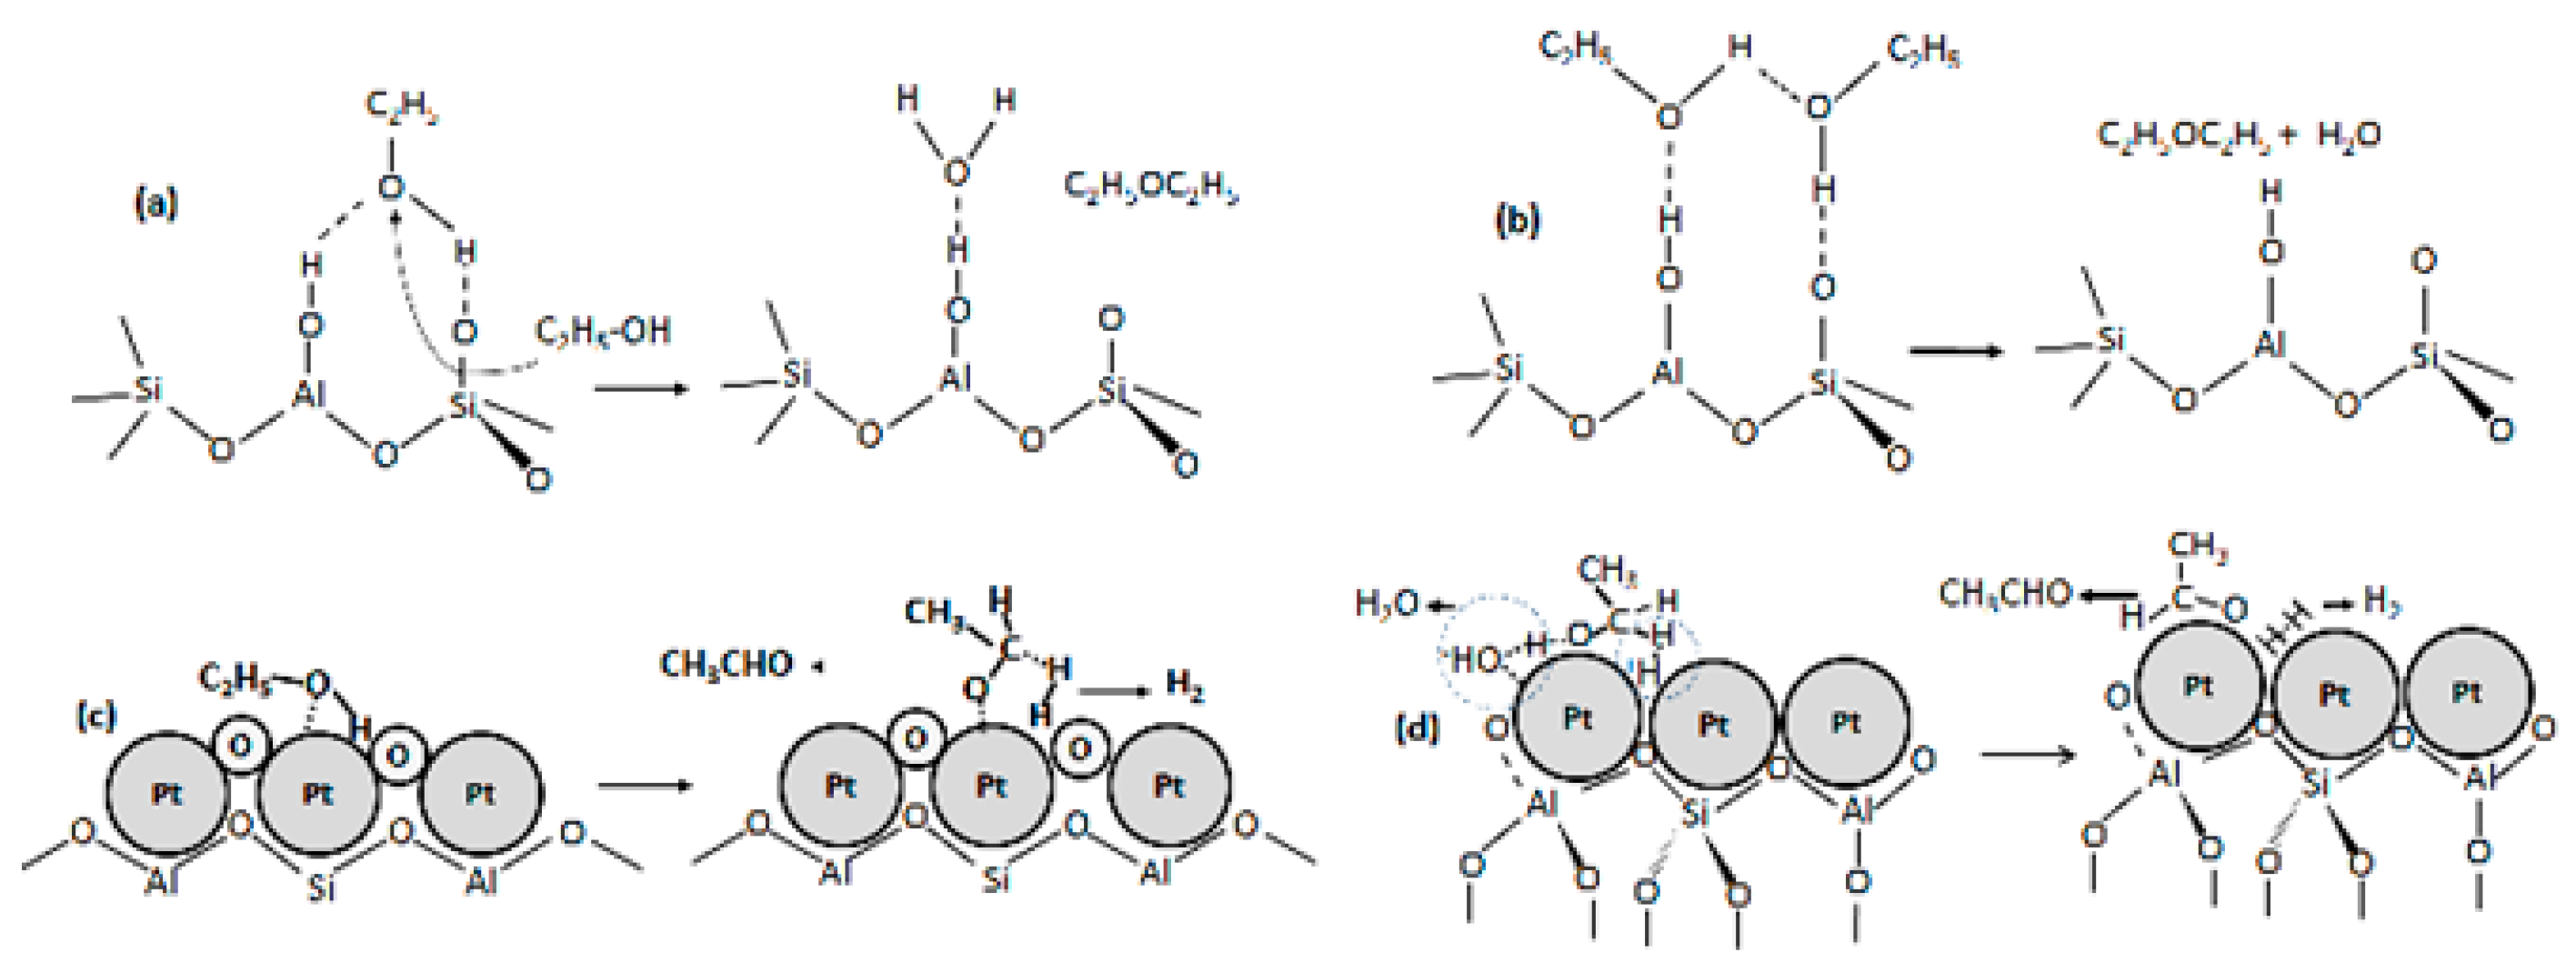
For pure NaY-SiO
2, ethanol is adsorbed on the BrØnsted acid site to form a hydrogen-bonded ethanol monomer (C
2H
5OH
2δ+). This hydrogen-bonded monomer then reacts with an oncoming ethanol to form DEE directly (
Figure 5a). The monomer intermediate could also adsorb the oncoming ethanol to form ethanol dimer, which indirectly produces DEE by elimination of water molecule (
Figure 5b) [
22].
Oxidative dehydrogenation of ethanol to acetaldehyde via ethoxy species may require the oxide surface to acquire a negative charge or hydroxyl group to abstract hydrogen from ethanol. For Pt/NaY-SiO
2 regenerated at high flow rate with sufficient oxygen, surface platinum-oxide was detected by EXAFS (
Section 2.5). The oxide with negative charge facilitates the adsorption of ethanol, which dissociates heterolytically to yield an ethoxide bound to Pt and a proton bond to oxide (
Figure 5c). The surface Pt–bound ethoxide intermediate then was dehydrogenated to acetaldehyde [
24,
25]. In contrast, for regeneration at low flow rate, no significant surface platinum-oxide species have been detected by EXAFS (
Section 2.5). In this case, Pt clusters could be oxidized to form transient surface Pt–O, which catalytically dehydrogenate ethanol to form acetaldehyde. This transient Pt–O was quickly reduced by H
2 and/or CO in insufficient oxygen conditions, so that no Pt–O could be observed using EXAFS. The acetaldehyde could also be formed via the abstraction of hydrogen from Pt bound ethanol, Pt
HOC
2H
5, to form ethoxide intermediate, followed by abstraction of hydride from the ethoxide intermediate. The hydride was associated with surface proton to form hydrogen molecules (
Figure 5d) [
26].
In the presence of platinum, the affinity of ethanol to Pt–O may be higher than that to NaY, resulting in a shift of reaction toward oxidative dehydrogenation. However, when oxygen supply is insufficient, some of ethanol was adsorbed on NaY and dehydrated to produce DEE.
2.4. Characterization of Surface Species on NaY-SiO2 and Pt/NaY-SiO2 by FT-IR
There is residual coke deposited on the regenerated NaY-SiO
2, as shown by the IR spectra (
Figure 5a), consistent with lower adsorption capacity of the regenerated
NaY-SiO2.
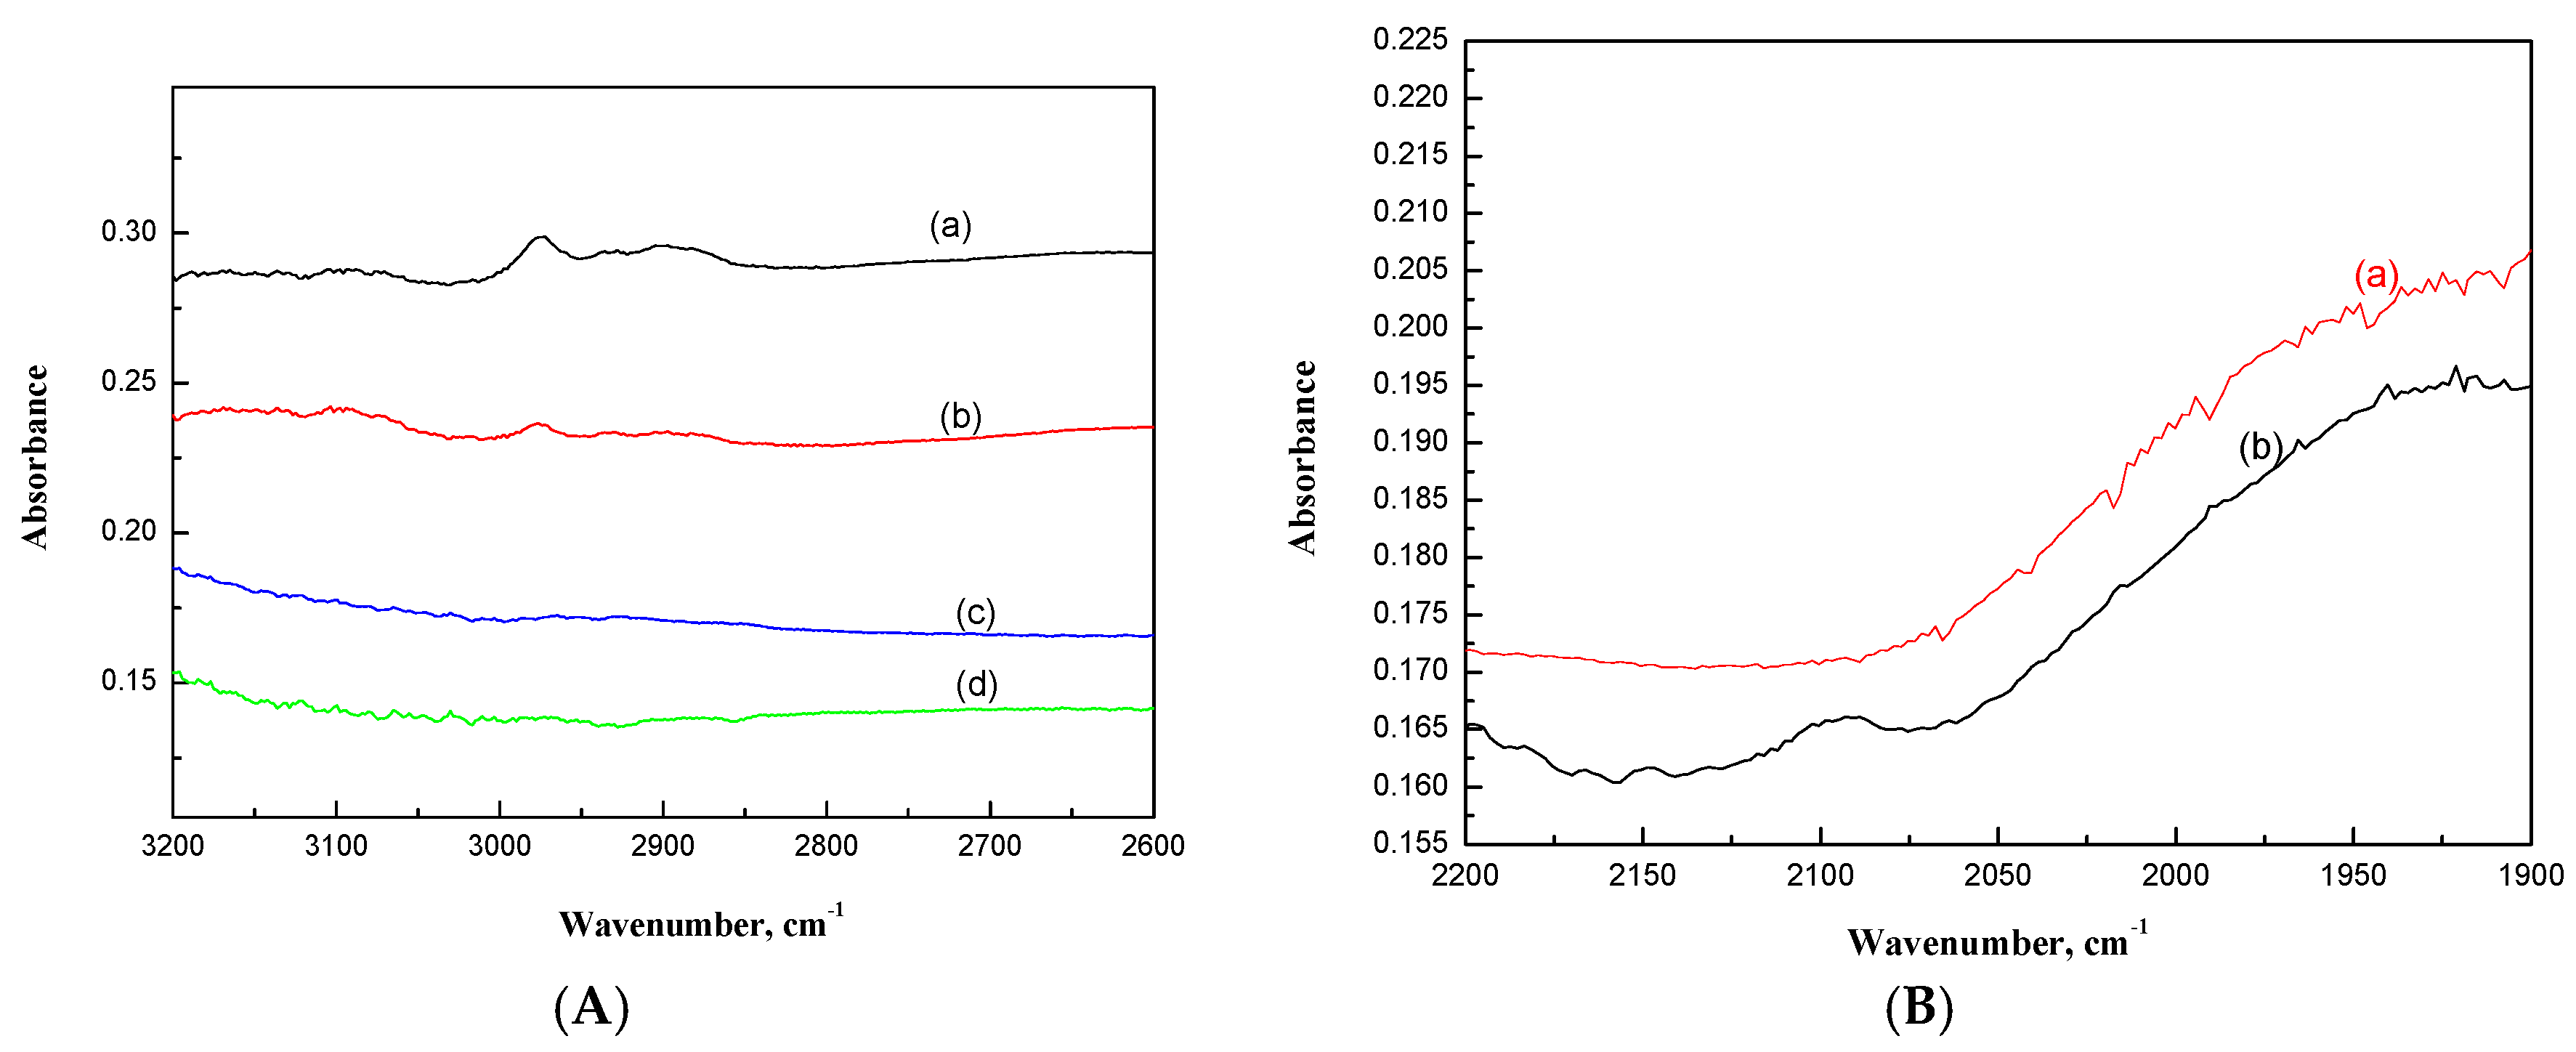
The presence of absorption bands in the CH stretching region of paraffinic groups (3000–2800 cm
−1) after in situ air treatment of EtOH–laden NaY-SiO
2 (
Figure 6A) indicated the formation of coke on NaYR
(HF) and NaYR
(LF) [
27]. In contrast, no absorption bands in this region being observed for Pt/NaY-SiO
2 suggests the roles of Pt in inhibiting coke formed on Pt/NaY-SiO
2 during regeneration. Since dehydration reactions and combustion (oxidation) reaction are competitive reactions in air regeneration, combustion of ethanol catalyzed by Pt minimizes the formation of coke precursors together with oligomerization reactions. In addition, facilitated by exothermic heat associated with the ethanol combustion, coke formed on NaY-SiO
2 can be catalytically oxidized to CO
2 quickly.
There were no aromatic-coke characteristic absorption bands in the range between 3000 and 3200 cm
−1 observed, suggesting that cokes formed on NaY-SiO
2 are mostly paraffinic (
Figure 6A) [
27]. The absorption bands at 2974 cm
−1 and 2842 cm
−1 were assigned to asymmetric stretching (ν
sym) and symmetric vibration (ν
asym), respectively, for CH
3, and the absorption bands at 2930 cm
−1 (ν
sym) and 2894 cm
−1 (ν
sym) were assigned to ν
sym and ν
asym, respectively, for CH
2. As shown in
Figure 5a, band intensities in the CH stretching region (3000–2800 cm
−1) decreased with increasing air flow rate, whereas the relative intensity between CH
3 and CH
2 (I
CH3/I
CH2) did not vary significantly. Since I
CH3/I
CH2 is an indication on the chain length of the carbonaceous species, the results suggested that increasing air flow rate in regeneration reduces carbonaceous species formation due to the increase of thermal combustion reaction (
Table 2) but does not affect chain propagation reaction.
Regeneration of Pt/NaY-SiO
2 showed the formation of CO in addition to CO
2 at low flow rate, while only trace CO was observed at high flow rate (
Figure 6B). As expected, no characteristic peaks in the region of carbonyl stretching (υ
CO) were observed for PtR
(HF) (
Figure 6B). In contrast, the υ
CO characteristic peak at 2085 with a shoulder at 2100 cm
−1 was observed for PtR
(LF) (
Figure 6B). CO molecules have a stretching frequency of 2143 cm
−1. The shift of the peak to a lower frequency for PtR
(LF) suggests the adsorption of CO on Pt clusters. When CO is adsorbed on Pt clusters, electron back-donation transfer occurs from the d-orbital of Pt to anti-bonding 2
π* orbital of the linearly coordinated CO molecule leading to a decrease of carbon-oxygen bond order together with υ
CO frequency [
28].
The band peaking at 2085 cm
−1 is the same as that for CO adsorbed on Pt/NaY at room temperature reported in the literature [
29]. The shift of the CO absorption bands to higher frequencies for the shoulder (2100 cm
−1) may be due to the interaction of foreign gases, O
2, with the chemisorbed CO. This effect was attributed to a decrease of the electron density at the Pt surface, which decreased the back-donation from the metal to the CO π* orbital, and thus increased the υ
CO frequency [
30].
2.5. Effects of Air Flow Rate on the Structure of Pt/NaY-SiO2
Even though the regeneration temperature (300 °C) is far lower than the zeolite damage temperature (600 °C) [
31], the NaY framework might be destroyed due to hot spot and water formed in the combustion reaction. Hence, XRPD was used to examine any thermal destruction of NaY in air regeneration.
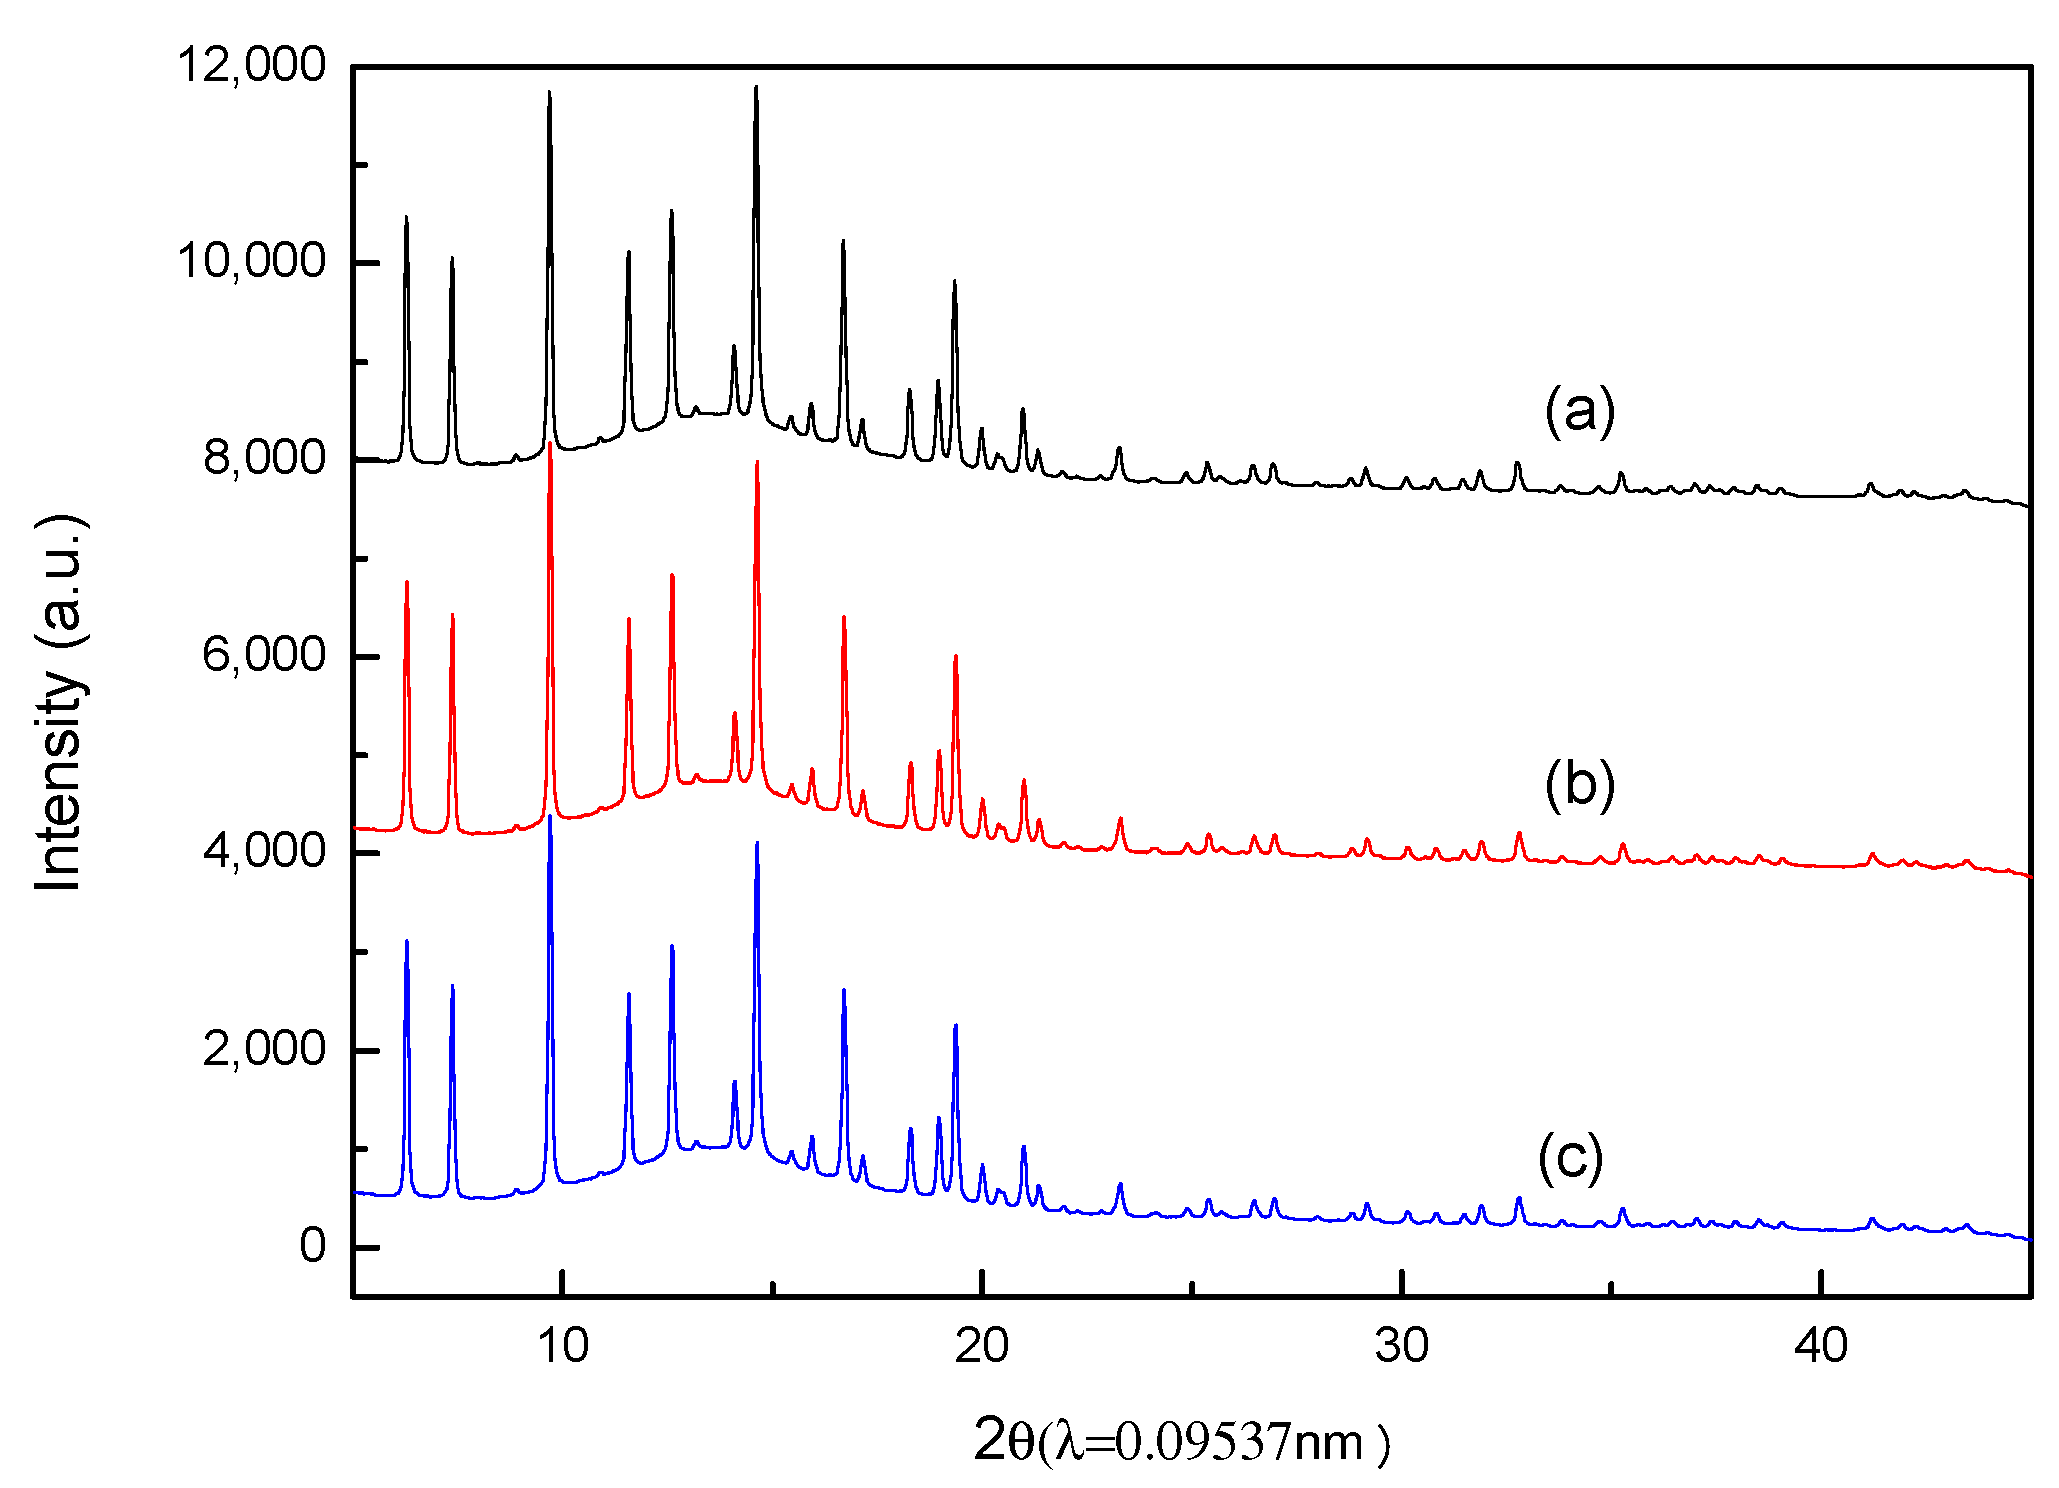
The comparison of synchrotron XRPD patterns for fresh Pt/NaY-SiO
2, PtR
(HF), and PtR
(LF) are shown in
Figure 7. Since there are no significant differences in XRPD patterns between fresh Pt/NaY-SiO
2, PtR
(HF), and PtR
(LF), the results indicate that NaY structure was intact after regeneration; in other words, regeneration flow rate has no effects on zeolite frameworks. Lower adsorption capacity for PtR
(LF) should be attributed to other factors and Pt-morphology change was expected to be the most possible one. Since the Pt crystal size is too small to be characterized by synchrotron XRPD, the morphology of Pt clusters, as well as Pt–support interactions, were then characterized by EXAFS.
As shown in
Figure 8, the
k3-weighted Pt–Pt phase- and amplitude-corrected Fourier transforms show peaks appearing at 2.7, 3.9, 4.7, and 5.7Å, consistent with the metal-metal distance of bulk Pt clusters;
k3-weighted Fourier transform minimizes low-Z (Z is atomic number) contributions, such as Pt–O; hence, the appearance of Pt–Pt characteristic peaks was not influenced by these contributions [
16].
The Pt–Pt characteristic peak intensities for fresh Pt/NaY-SiO
2 are lower than those for PtR
(LF), while they are slightly higher than PtR
(HF). Since the amplitude of the Fourier transformed EXAFS function reflects the metal particle size [
16,
32], the higher amplitude intensity for PtR
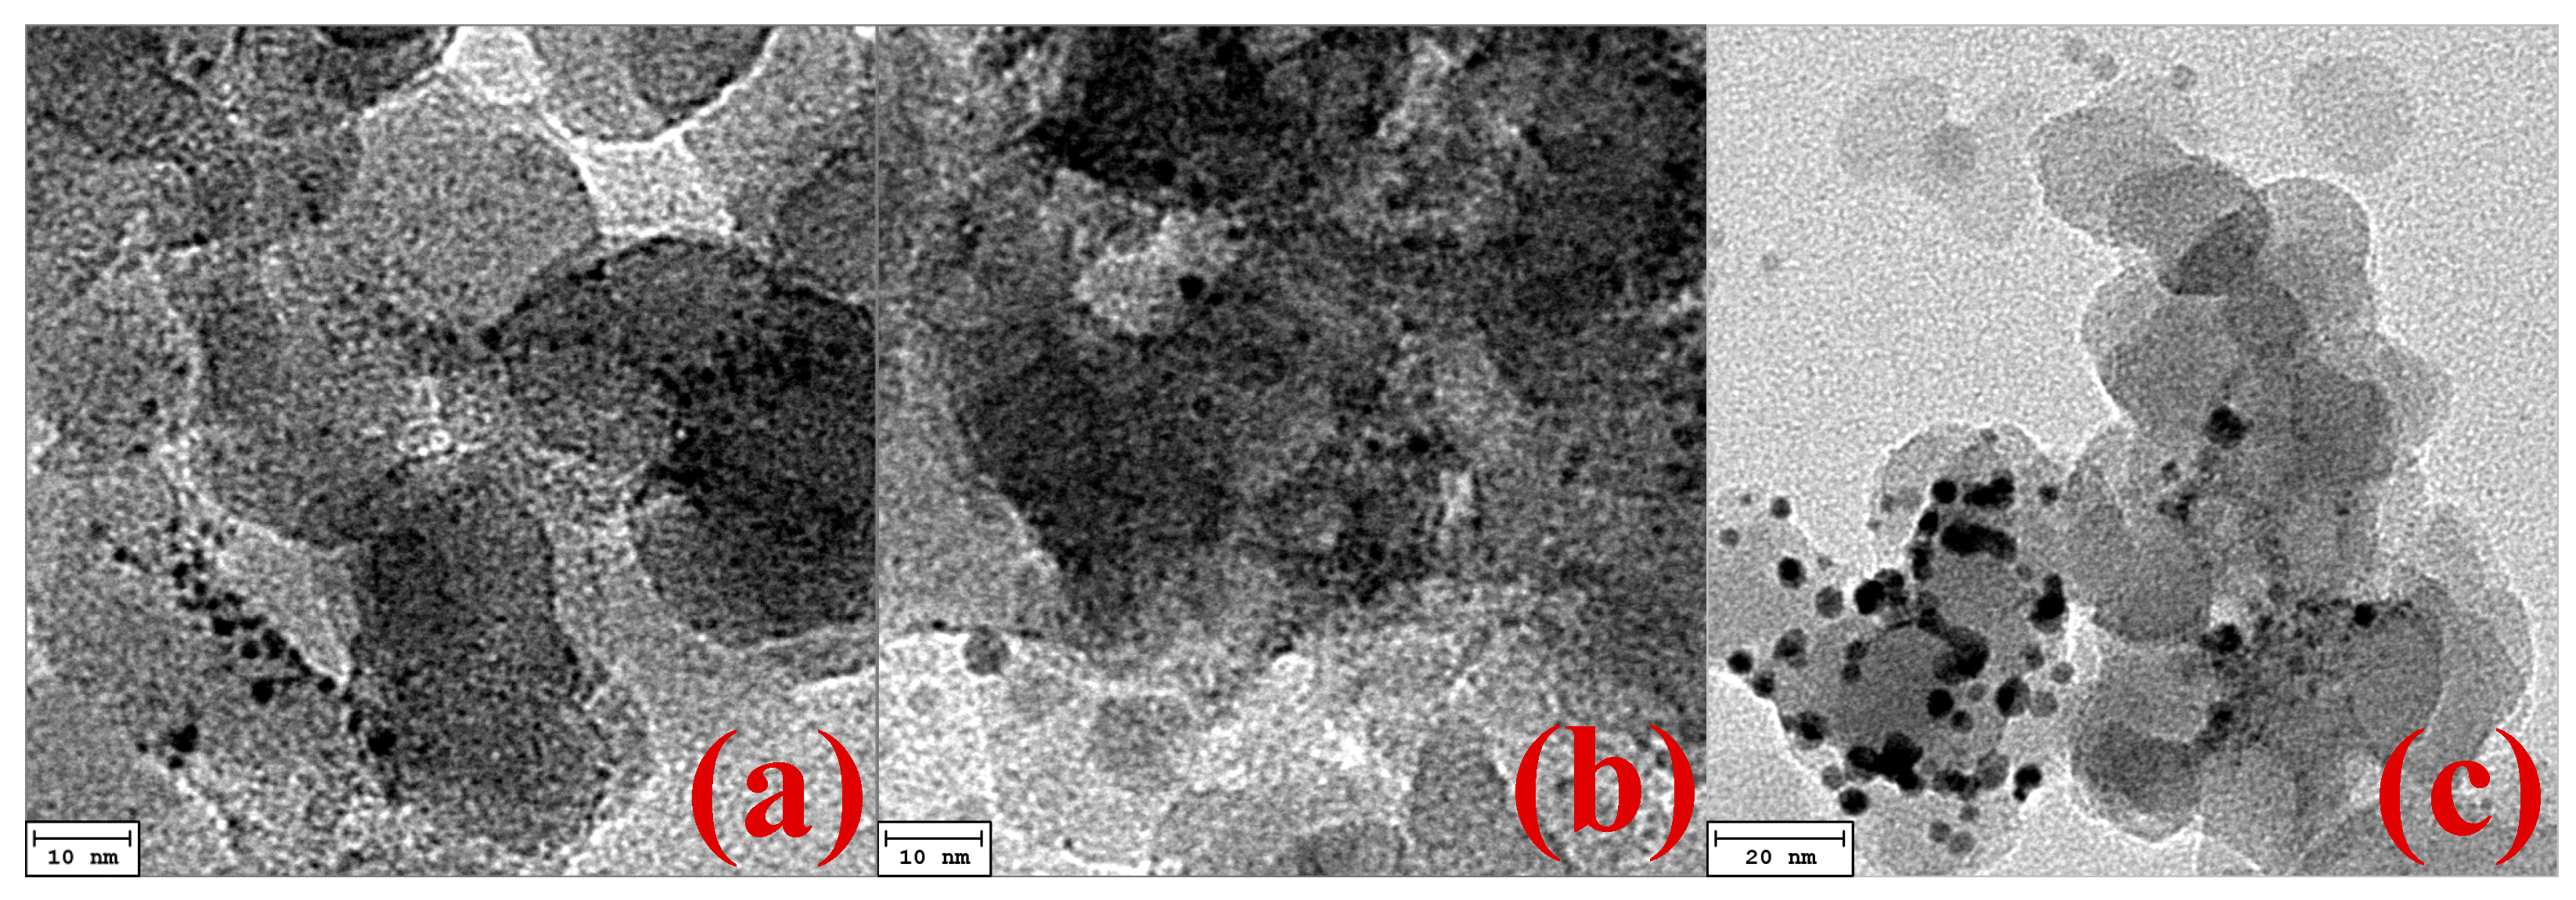
(LF) suggests Pt sintering at low flow-rate regeneration. The results were confirmed by TEM images; as show in
Figure 9a,c, the comparison of TEM images between Pt/NaY-SiO
2 and PtR
(LF) clearly shows that the average Pt particle size of PtR
(LF) is much bigger than that of Pt/NaY-SiO
2. In contrast, TEM images of Pt/NaY-SiO
2 and PtR
(HF) were difficult to differentiate. The results suggested that the lower amplitude intensity of PtR
(HF) (
Figure 8) was attributable to the loss of Pt–Pt contribution caused by the formation of oxidic Pt species. With sufficient oxygen, surface Pt atoms could be oxidized concomitantly with the combustion reaction. The formation of oxidic Pt in high flow rate regeneration was confirmed by analyzing low-Z contributions of EXAFS.
A normal k2 (2.68 < k < 14.3 Å−1)-weighted Fourier transformation without correction was performed and the major contributions (Pt–Pt1st shell + Pt–O) were isolated by inverse Fourier transformation in the range 1.73 < r < 3.32 Å. With the difference technique, a Pt–Pt was calculated and then subtracted from the isolated data. A Pt–Pt contribution was calculated that agreed as well as possible with the experimental results in the high k range (7.0 < k < 14.0 Å−1); the low-Z contributions in this range are small. After the subtraction, the residual spectrum was expected to represent the contributions from Pt oxides and/or Pt–support interactions.
For the fresh Pt/NaY-SiO
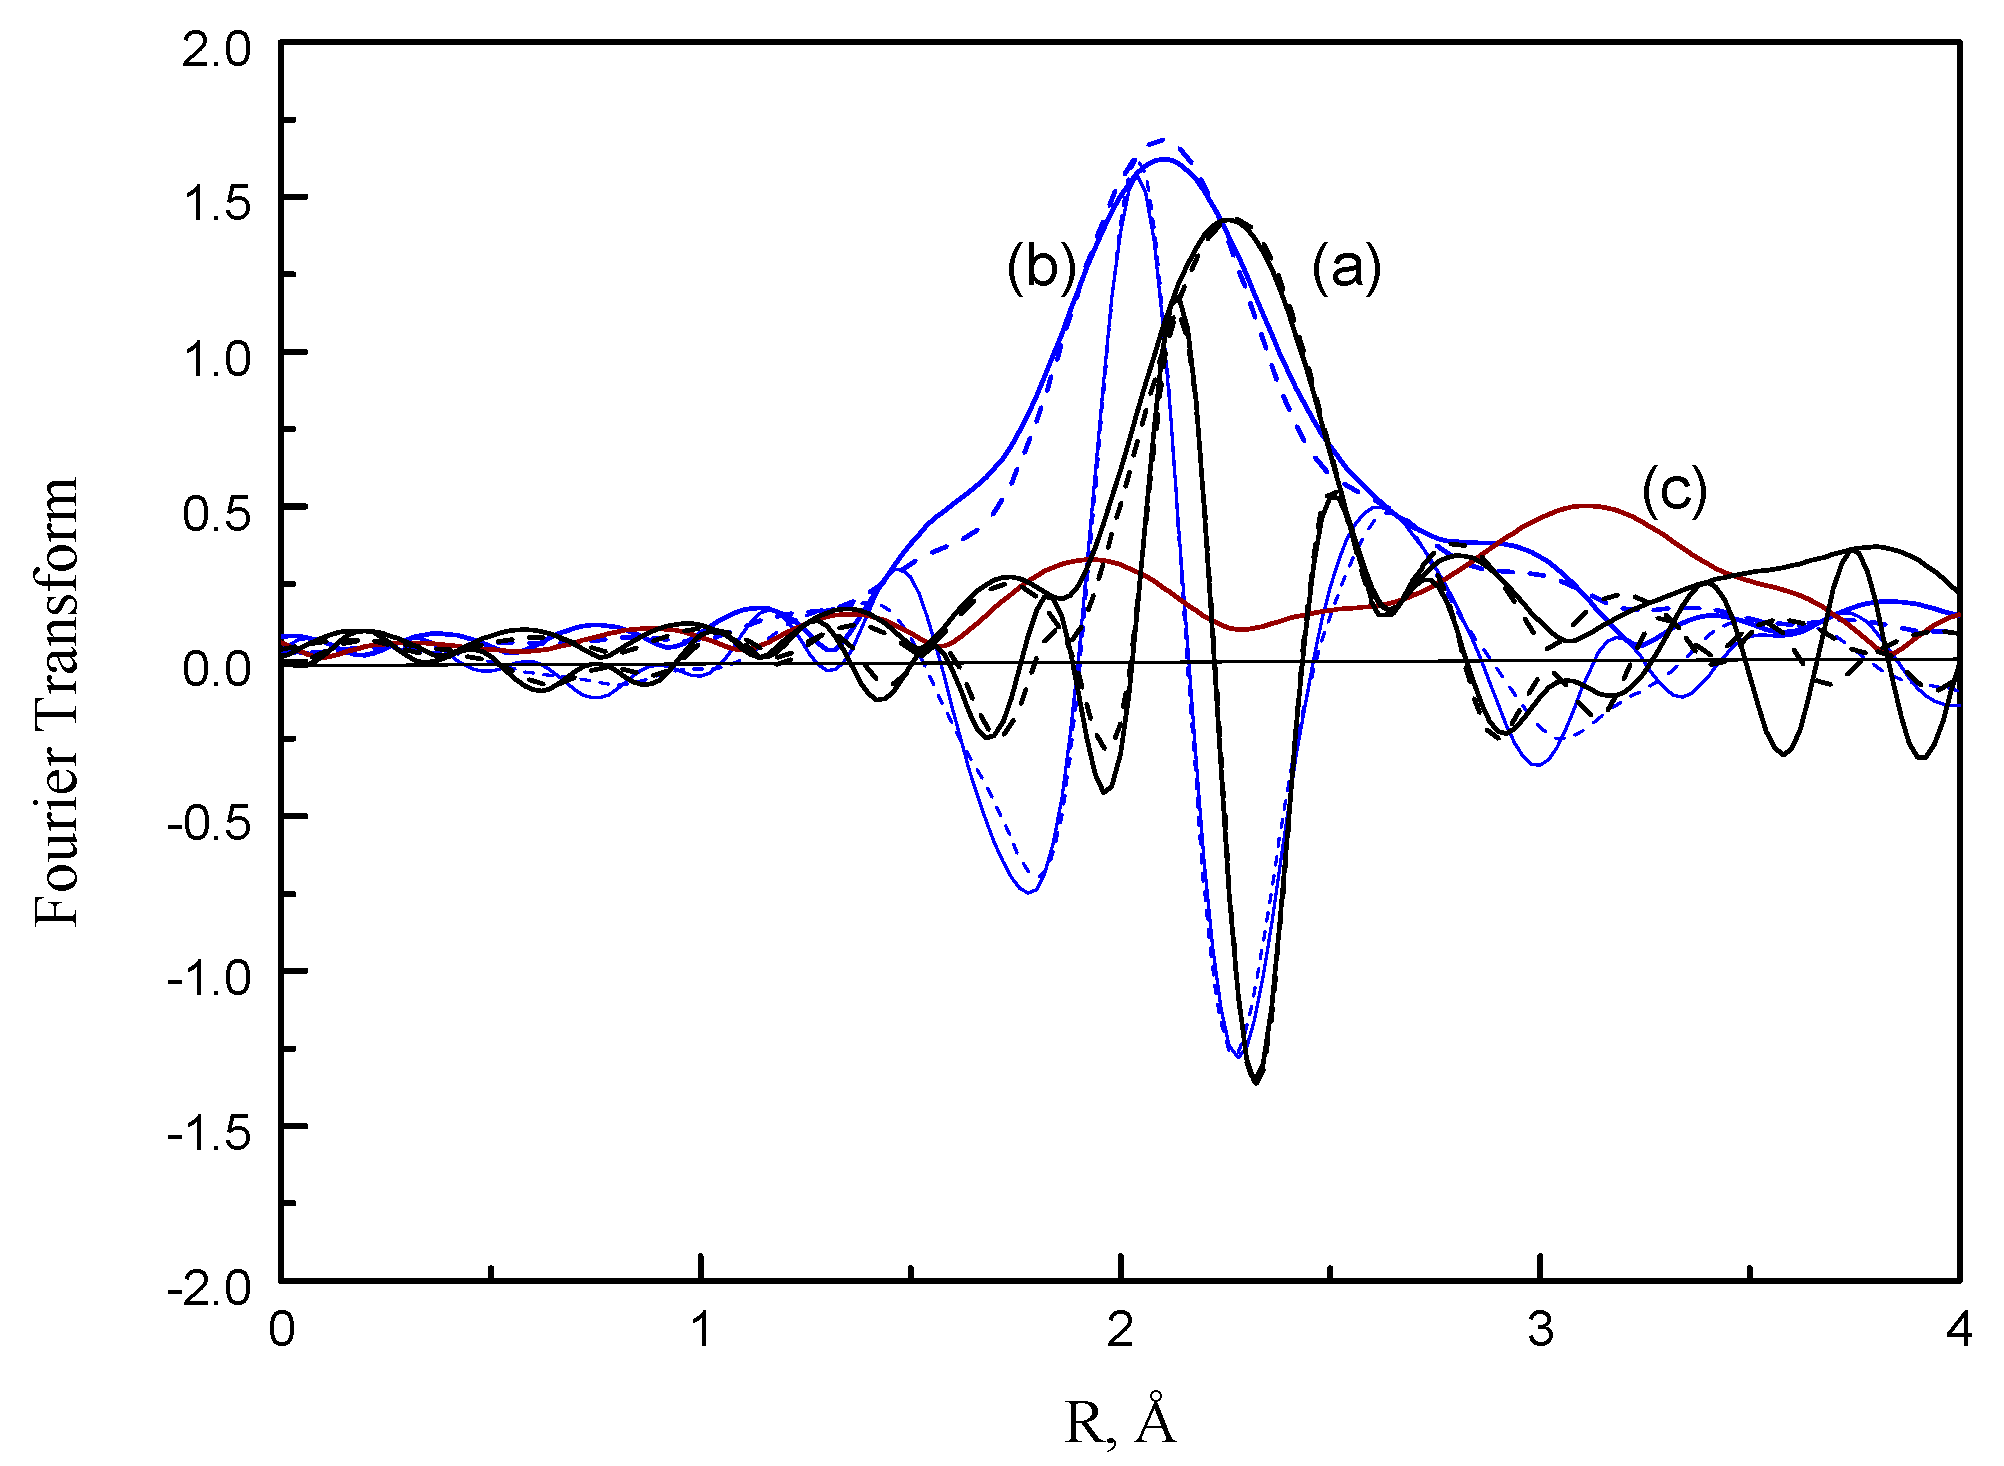
2, the imaginary of Pt–O phase-corrected Fourier transform of the residual spectra displayed a peak at 2.1–2.2 Å (
Figure 10). This peak was assigned to the interactions between platinum and zeolite oxygen [
33,
34]. In comparison with the residual spectrum of fresh Pt/NaY-SiO
2, a broad peak with shorter bond distance appears at 2.0–2.1 Å for PtR
(HF). The broad peak could be a lumped peak contributed by α–PtO
2 with a Pt–O bond distance of 2.05 Å [
35] and Pt–support interactions.
As opposed to the residual spectra of PtR(LF) and fresh Pt/NaY-SiO2, the intensity of the residual spectrum for PtR(LF) is much smaller, suggesting that oxidic Pt species formed on PtR(LF) are insignificant. In addition, because the Pt–O contribution for PtR(LF) is rather small and is greatly interfered with by noise, parameter estimation for this contribution was not attempted.
The structural parameters of fresh Pt/NaY-SiO
2 and PtR
(HF) were estimated by a nonlinear least-squares multiple-shell fitting routine [
36]. The structural parameters are listed in
Table 3 and the comparisons of experimental and calculated Pt–O are shown in
Figure 10.
After air regeneration at high flow rate, the average Pt–O bond distance decreased from 2.17 to 2.06 Å, the coordination number increased from 0.8 to 2.2, and the Pt–Pt coordination number decreased from 7.4 to 6.4 (
Table 3), confirming the oxidation of Pt clusters concomitant with the combustion of ethanol and its derivatives. In contrast, after regeneration at low flow rate, the Pt–Pt coordination number increased from 7.4 to 10.4. These results, combined with the increase of higher Pt–Pt shell intensity (
Figure 8), suggest the growth of Pt clusters with morphology resembling bulk Pt.
The average Pt particle size on NaY-SiO
2 determined by the use of first-shell Pt–Pt coordination number (CN
Pt–Pt) of EXAFS measurements [
37] is 1.3 and 3.3 nm, respectively, for fresh Pt/NaY-SiO
2 and PtR
(LF), while that determined from TEM images is about 1.5 and 3.8 nm, respectively (
Figure 9a,c). The larger Pt particle size determined by TEM could be because: (1) the coupling between CN and the relative Debye-Waller factor (Δσ) of EXAFS equation causes the inherent uncertainty of coordination numbers (CN) estimation; and (2) Pt clusters with sizes less than 1 nm are difficult to resolve by TEM [
38].
Oxidic Pt species were formed in Pt clusters during air regeneration with high flow rate. Because the formation of these oxidic species decreases Pt–Pt contributions, we are unable to estimate Pt particle size by the use of the correlation of CN
Pt–Pt with particle size reported in literature [
37]. However, it is shown in TEM images that the average Pt particle size of PtR
(HF) is close to that of fresh Pt/NaY-SiO
2 (
Figure 9a,b), suggesting that only few or no Pt clusters were aggregated in high flow regeneration.
2.6. Effects of Air Supply Rate on Regeneration Efficiency
For efficient and complete regeneration of the adsorbent, adequate supply of oxygen is necessary. Based on stoichiometry calculation, without desorption, it takes about 45.6 mmole O2 per 5 g of ethanol-laden Pt/NaY-SiO2 adsorbent. Besides total oxidation, partial oxidation, and ethanol desorption also took placed in air regeneration. In high flow rate regeneration, an air supply of 61.2 mmole is enough for ethanol total oxidation; notwithstanding sufficient oxygen supply, about one-third of ethanol was desorbed from Pt/NaY-SiO2, concomitant with total oxidation. However, in low flow rate regeneration, corresponding to low air supply (24.5 mmole) and low partial pressure of oxygen, more ethanol was desorbed, more acetaldehyde was produced, and some CO was also formed. The formation of CO greatly deteriorates regeneration efficiency.
The mechanism for the aggregation of Pt clusters remains to be elucidated. However, CO co-adsorbed on Pt clusters, besides O
2 in the regeneration at low flow rate, suggests a role of CO adsorption. When CO is adsorbed on less stable (smaller) Pt clusters, back-donation effects may lead to a decrease in Pt–support interactions. Consequently, the affinity of this mobile CO-adsorbed Pt species for more stable (larger) Pt clusters may be greater than that of the mobile Pt species to support. The decreased metal–support interactions lift migrating Pt clusters, causing them to float over the support [
39]. The enhancement of surface diffusivities due to floating of Pt clusters promotes the coalescence of Pt clusters. The CO-adsorption-assisted Ostwald ripening [
40] induces the change of Pt morphology, characterized by the coalescence of Pt clusters in 3-dimensional (
Figure 8).
In our previous paper, we reported that ethanol bonds to bulk fcc Pt clusters of Pt/NaY-SiO
2 through bridging hydrogen [
14]. Facilitated by the adsorption heat, some of the adsorbed ethanol molecules, Pt
HOC
2H
5, were converted to ethoxide and acetaldehyde in breakthrough performance tests. In comparison with ethanol, these ethanol-converted species could have higher affinity for NaY-SiO
2, and thus could spill over to displace sodium and acid site-bound water and leave the Pt clusters for further adsorption. This catalytic adsorption property of Pt leads to an increase of adsorption capacity. The aggregation of Pt clusters in the regeneration at low flow rate, however, deteriorates the catalytic adsorption function of Pt, leading to a decrease of adsorption capacity.


