Catalytic Ozonation by Iron Coated Pumice for the Degradation of Natural Organic Matters


Department of Environmental Engineering, Aksaray University, 68100 Aksaray, Turkey
*
Author to whom correspondence should be addressed.
Catalysts 2018, 8(5), 219; https://doi.org/10.3390/catal8050219
Submission received: 5 April 2018
/
Revised: 14 May 2018
/
Accepted: 15 May 2018
/
Published: 21 May 2018
Abstract
:The use of iron-coated pumice (ICP) in heterogeneous catalytic ozonation significantly enhanced the removal efficiency of natural organic matters (NOMs) in water, due to the synergistic effect of hybrid processes when compared to sole ozonation and adsorption. Multiple characterization analyses (BET, TEM, XRD, DLS, FT-IR, and pHPZC) were employed for a systematic investigation of the catalyst surface properties. This analysis indicated that the ICP crystal structure was α-FeOOH, the surface hydroxyl group of ICP was significantly increased after coating, the particle size of ICP was about 200–250 nm, the BET surface area of ICP was about 10.56 m2 g−1, the pHPZC value of ICP was about 7.13, and that enhancement by iron loading was observed in the FT-IR spectra. The contribution of surface adsorption, hydroxyl radicals, and sole ozonation to catalytic ozonation was determined as 21.29%, 66.22%, and 12.49%, respectively. The reaction kinetic analysis with tert-Butyl alcohol (TBA) was used as a radical scavenger, confirming that surface ferrous iron loading promoted the role of the hydroxyl radicals. The phosphate was used as an inorganic probe, and significantly inhibited the removal efficiency of catalytic NOM ozonation. This is an indication that the reactions which occur are more dominant in the solution phase.
1. Introduction
Much attention has been paid to the problems caused by NOM in aqueous environments, including: (i) the negative effect on water quality in terms of color, taste and odor, (ii) the increased coagulant and disinfectant dose requirements, which in turn result in increased sludge and potential harmful formation of disinfection by-products, (iii) the promoted biological growth in distribution systems, and (iv) the increased levels of complex heavy metals and adsorbed organic pollutants [1,2,3]. Conventional treatment processes are found to be inefficient in NOM removal in drinking water, so many methods have been developed in an attempt to enhance removal efficiency, such as ozonation and advanced oxidation processes (AOPs) [4,5]. In recent years, catalytic ozonation with heterogeneous catalysts has received much attention in the field of water treatment, because of its potentially significant effectiveness and minimal detrimental effect on water quality [6,7]. The heterogeneous system is advantageous over the homogeneous one, because (i) the solid catalyst can be easily separated from the treated water for reuse, (ii) it does not require secondary treatment as it leaves no residue in the treated water, and (iii) it is more tolerant towards extreme operating conditions [8]. Therefore, green catalyst investigations are still continuing, especially with regards to natural catalysts [9].
Catalysts used in ozonation mainly include carbon materials (activated carbon, graphene, carbon nanotube and etc.), metal oxides, metal oxides attached to supports, and natural minerals. Among these catalysts, metal-based catalysts (Ag, Al, Ti, Fe and etc.) have been studied in the catalytic ozonation process [10]. At present, α-FeOOH catalysts are receiving significant attention in catalytic ozonation, due to their advantages, such as, (i) they are abundant in nature and can be easily synthesized; (ii) they are almost non-toxic [11]; (iii) some Fe based catalysts possess special characteristics, for example, Fe3O4 has magnetic properties, and FeOOH has a high density of hydroxyl groups. Fe based catalysts like pumice show high catalytic activity in catalytic ozonation systems [6,12,13,14,15,16]. In addition, Fe-based catalysts have been widely used, and some researchers have reviewed their application in the catalytic field. Magario et al. [17] reviewed the removal of phenol derivatives and pigments using various Fe-based catalysts, focusing on the discussion of the mechanisms of radical generation. In recent years, Fe-based catalysts are widely used in catalytic ozonation system, and various mechanisms have been proposed.
In our previous study, ICP was used as a heterogeneous catalyst in AOPs (ICP/H2O2) for NOM removal in water, which resulted in the formation of strong oxidants, including OH•, which is shown to effectively oxidize NOM [18]. Therefore, based on the findings of our previous studies, it was selected again as the catalyst in this work because of its highly porous structures, availability, abundance, low cost, and excellent chemical and configurable properties, such as high mechanical strength and chemical stability. Humic acids (HA) were chosen as target organic compounds, which are among the most widely present NOM in virtually all drinking water sources, and pose a variety of problems in treatment operations and distribution systems. The following objectives were investigated: (i) the effect of ferrous iron loading on the structure and surface properties of the pumice, (ii) the catalyst efficiency on ozone decomposition, (iii) contributions of direct/indirect ozonation and surface adsorption to NOM degradation, (iv) to examine the synergistic effects of various ozone, pollutant, and catalyst dosages, and also of pH on heterogeneous catalytic ozonation, and (v) the identification of solution and interface reactions in NOM degradation.
2. Results and Discussion
2.1. Catalyst Characterization and Catalytic Effectiveness
Energy Dispersive X-Ray Analysis (EDAX) techniques of analysis were employed to investigate the coating procedure efficiency for iron ions on the pumice surface. The spectrum of eluted iron-coated pumice by using elemental microprobe analysis of EDAX is shown in Figure 1.
It is clearly shown that iron ion signals were increased from 0.57% to 4.80% as a result of the coating process.
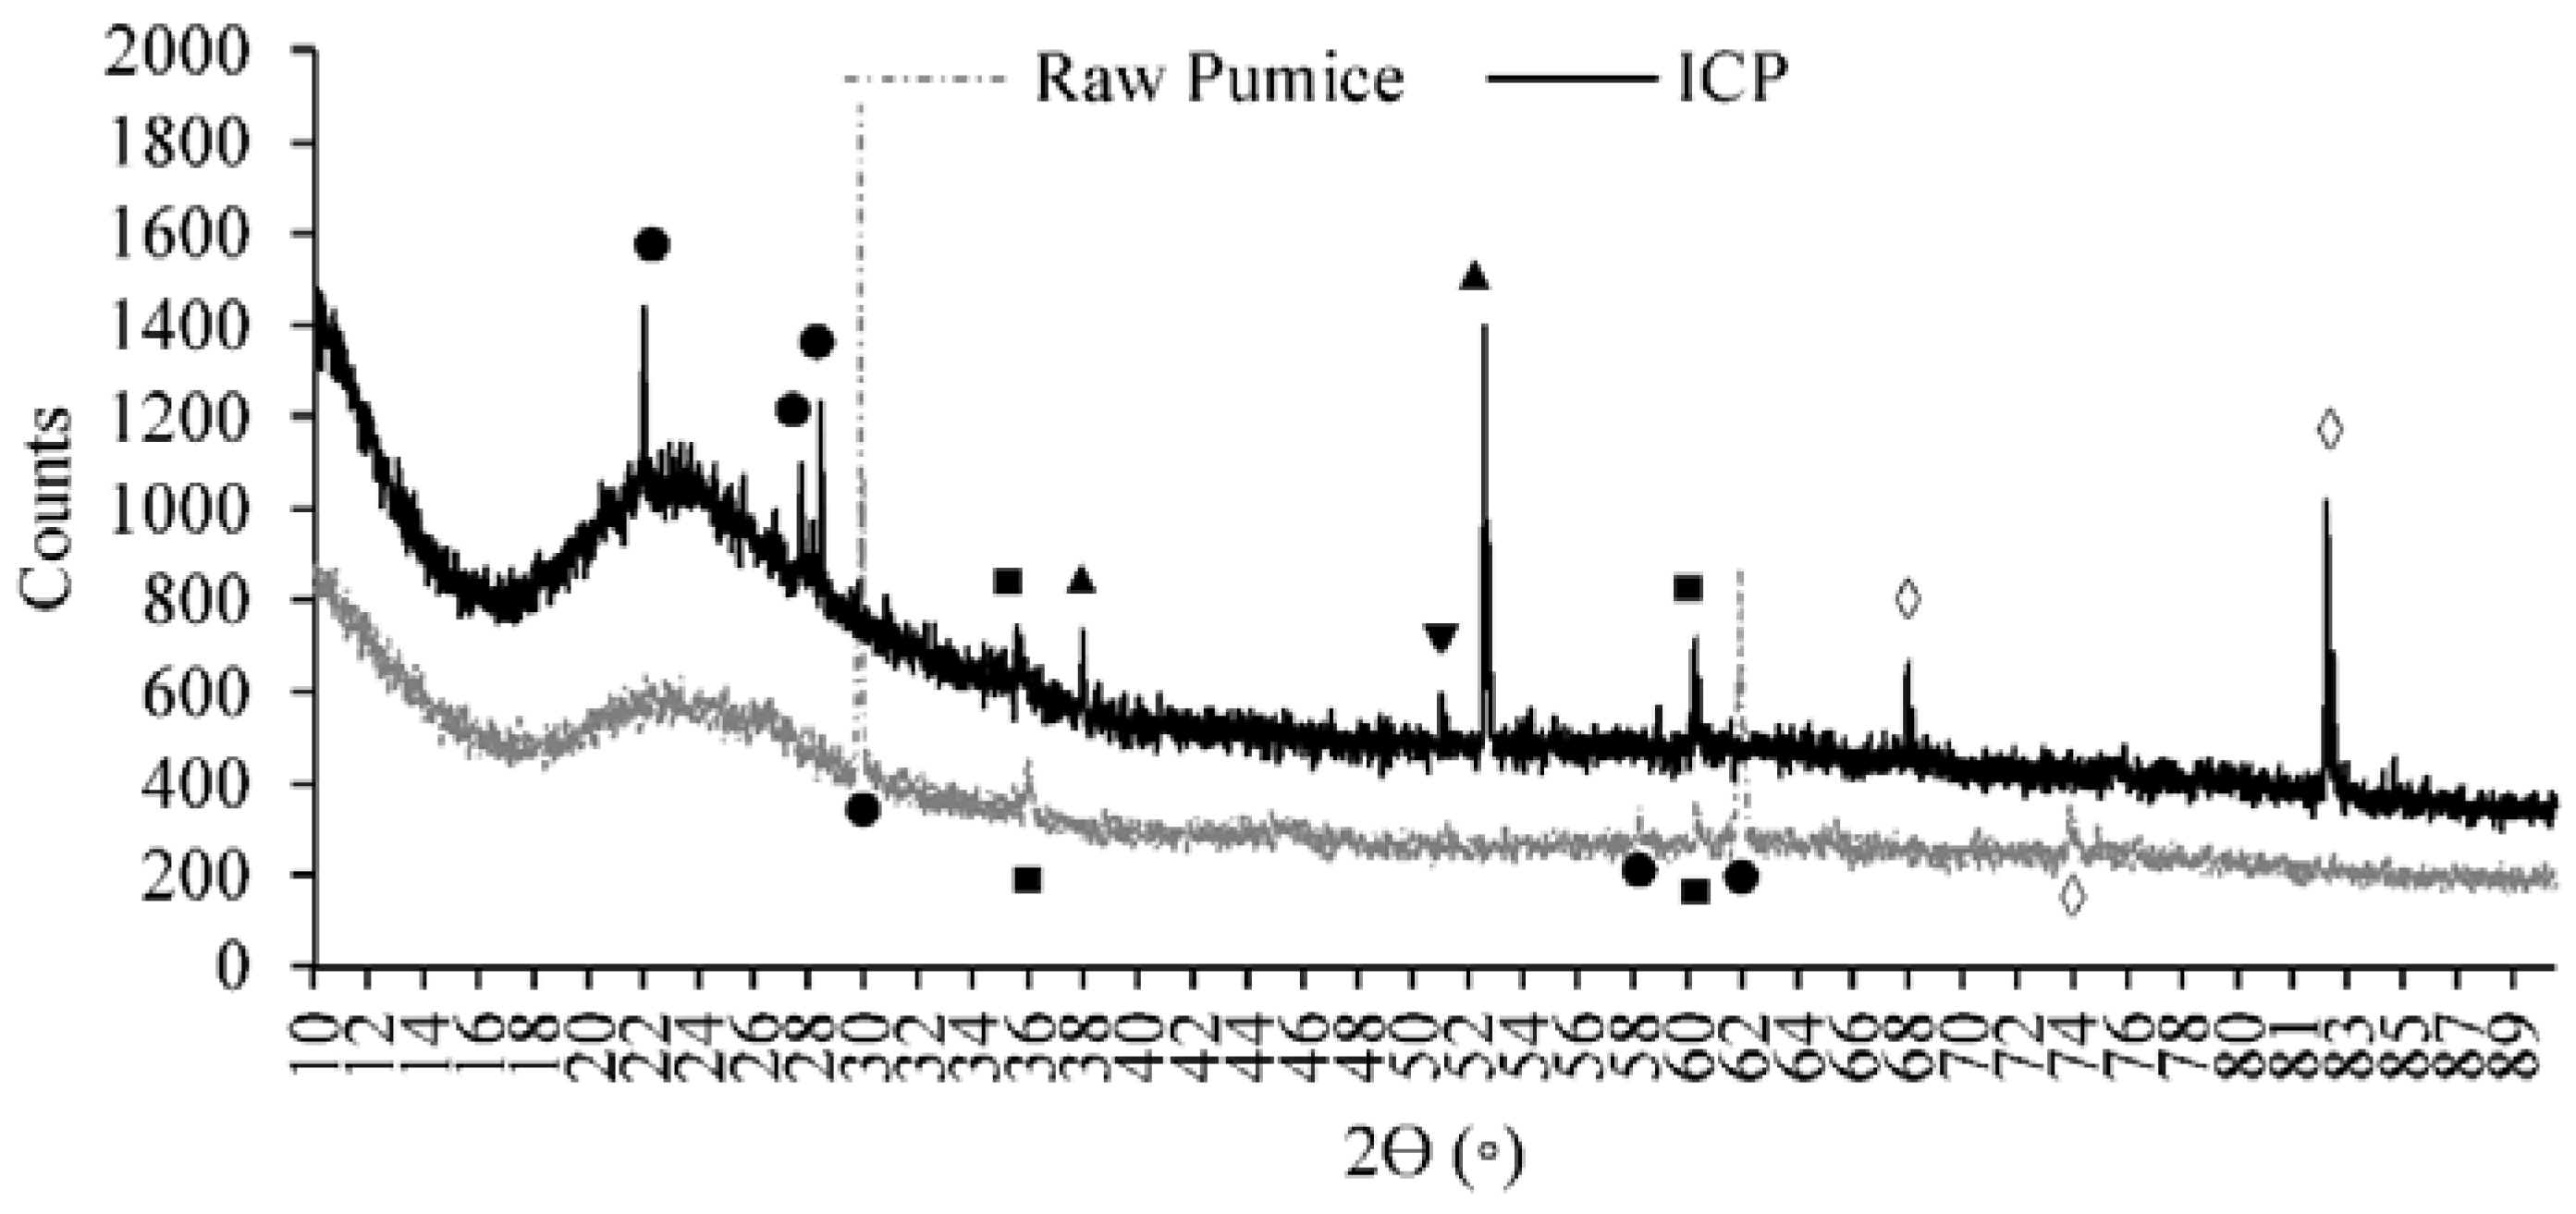
X-ray Diffraction (XRD) is the most commonly used analytical technique for determining the phase composition, grain size, and crystal structure of materials. According to the distribution of the pigments, the composition of the material can be qualitatively analyzed by comparing the powder diffraction. XRD analysis of the catalysts was carried out at room temperature within the Bragg angle range 10° ≤ 2θ ≤ 90° at a scan speed of 2° min−1 by an X-ray diffractometer, using Cu Kα-radiation (λ = 1.54060 Ǻ). The XRD diffractogram was evaluated according to the diffractometer-based DIFFRAC EVA software (V4 Flyer, Bruker AXS, Karlsruhe, Germany) and ICCD (International Center for Diffraction Data). The XRD diffractogram and ICCD obtained in the detection limits of the device are matched, and the XRD analysis results of the raw and iron-coated pumice are shown in Figure 2.
The result of analysis identifies that the major phases of pumice samples were albite, anorthite, and hematite. The iron-coated pumice catalyst showed different XRD patterns than those of raw pumice. The loading of Fe resulted in the growth of new crystalline α-FeOOH.
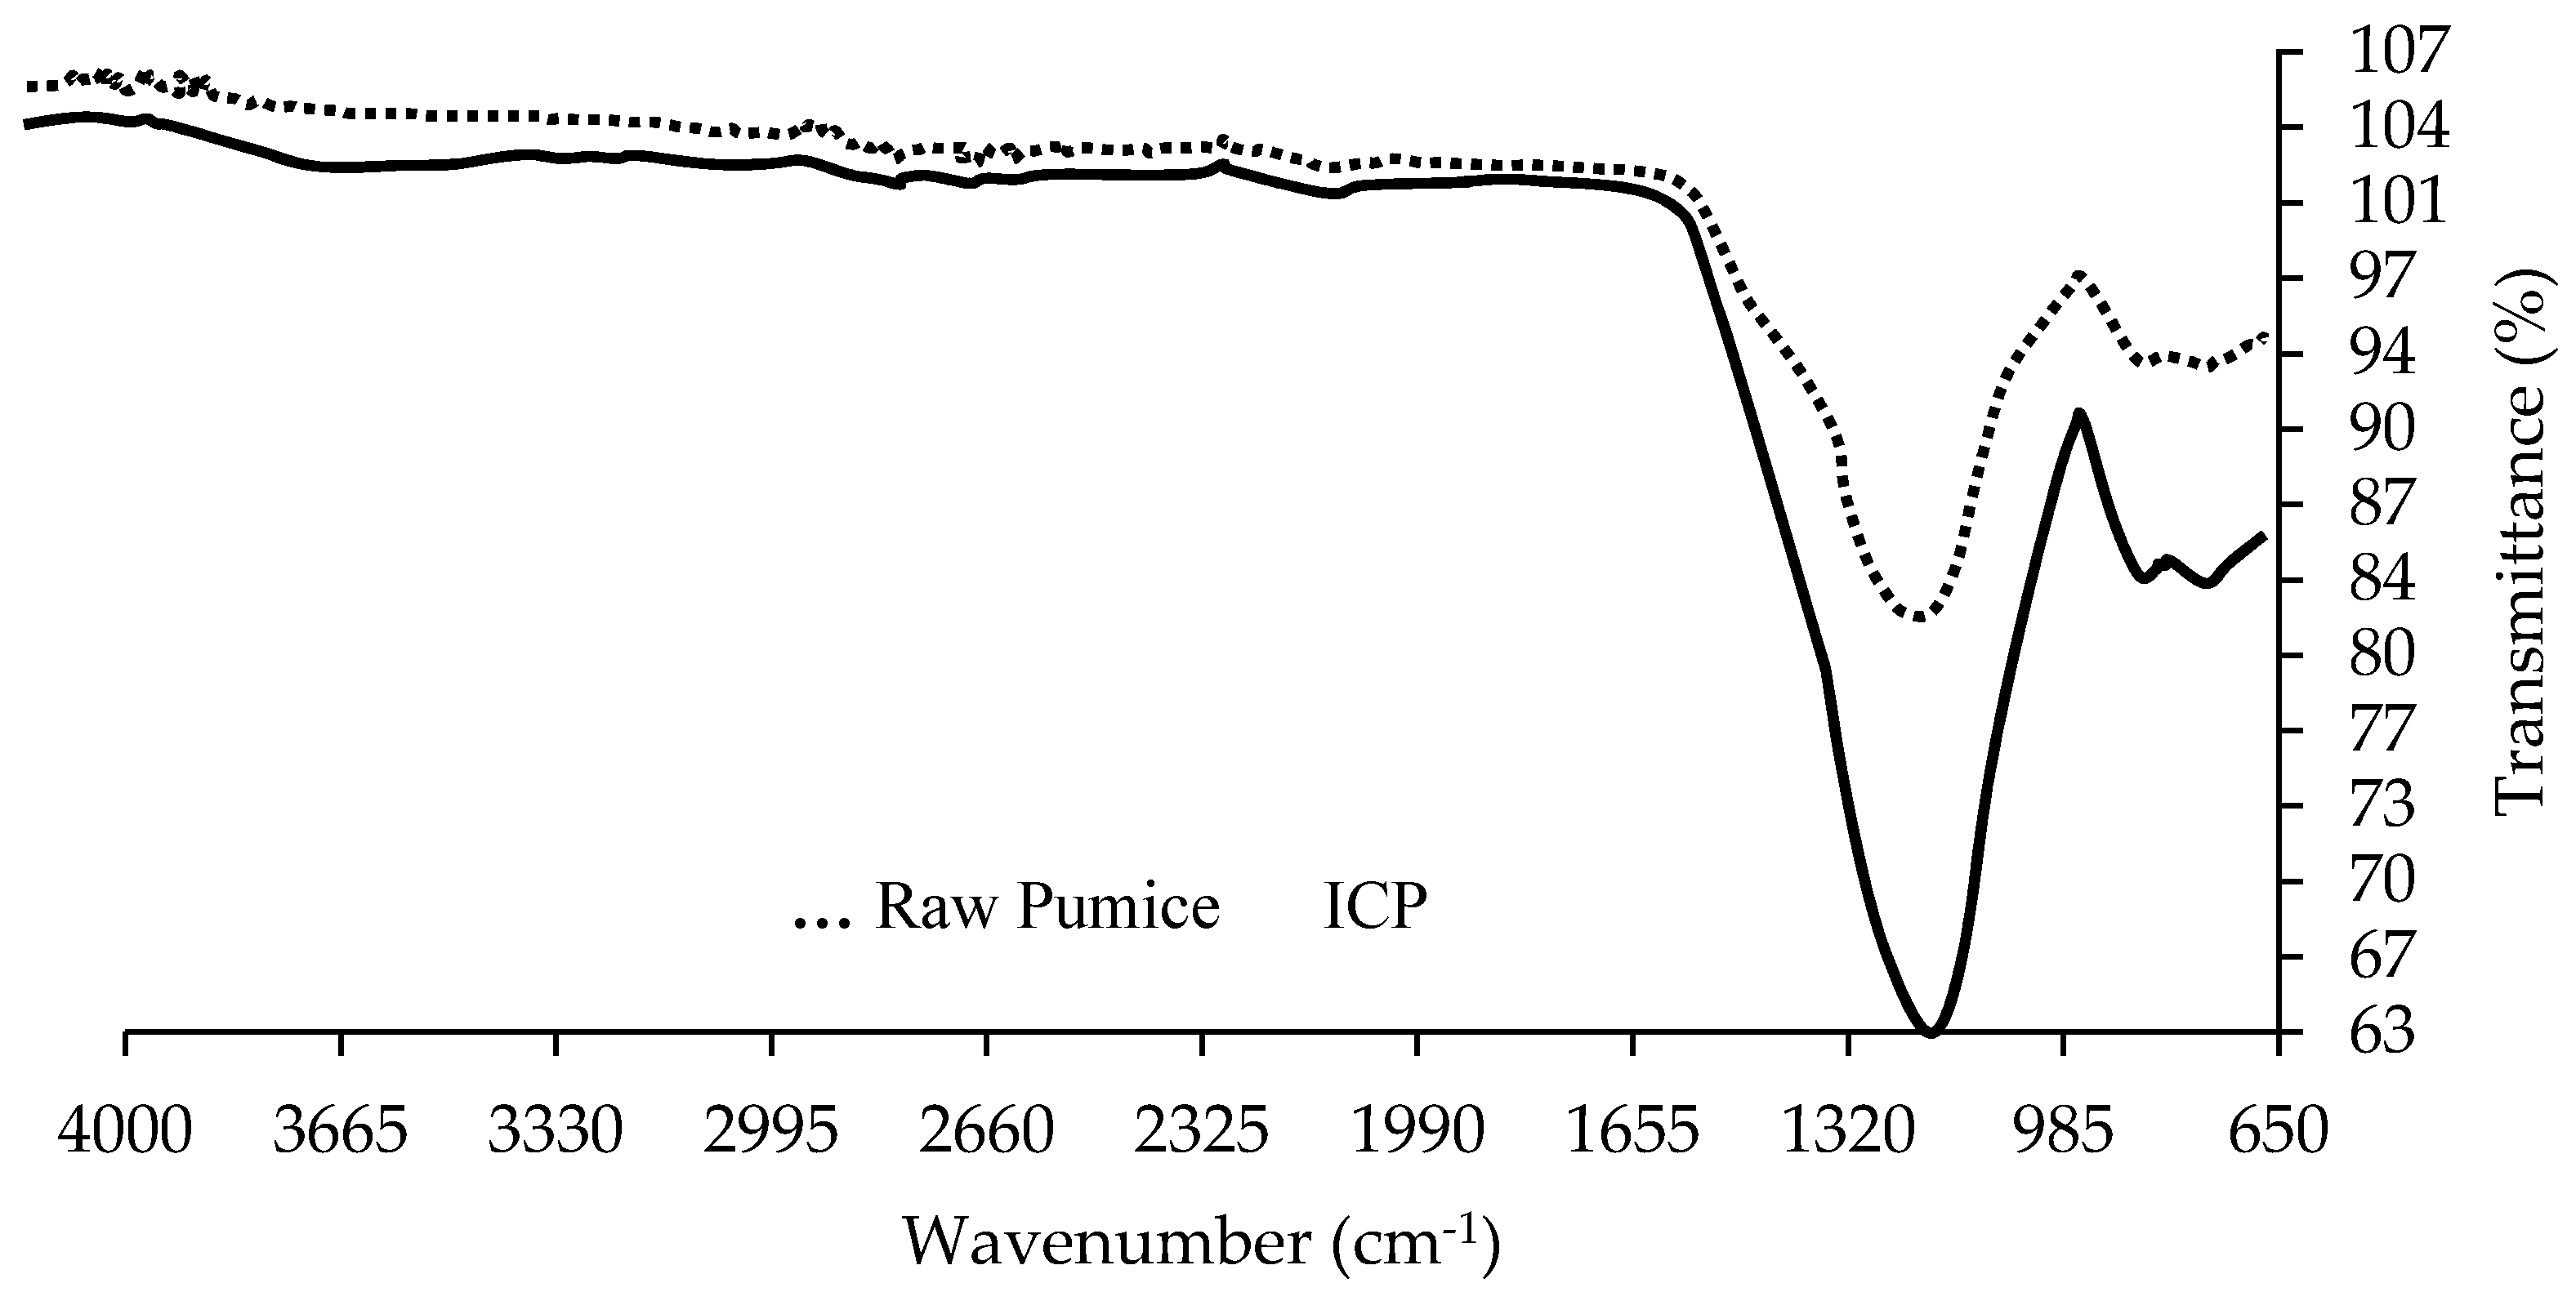
FTIR is a type of infrared spectroscopy, which is an important method for characterizing the surface properties of the catalyst. The content of each component of the catalysts can be determined by the concentration of the absorption peak. Figure 3 shows the surface structure of pumice and ICP.
In FT-IR spectra, a surface structure hydroxyl group of α-FeOOH peaks at 1629 cm−1 [19] can be observed. Furthermore, the peak at 1007 cm−1 represents the Si-O-Si and Si-O-Al bonds in the stretching mode. The peak at 779 cm−1 represents the bending vibration of Fe-OH, and stretching vibration Fe-O bonds [19].
Figure 4 shows the Transmission Electron Microscope (TEM) images of the raw and iron-coated pumice with different particle sizes. When different particle sizes of the raw and iron coated pumice samples surfaces were examined, it was observed that the coating process was efficient, and that the raw pumice surface morphology had changed. After the coating process, it was observed that the iron was retained in the micro, macro and mesopores of the raw pumice surface, and the surface area was increased. TEM analysis results are in line with the results of Brunauer-Emmett-Teller (BET) and Dynamic Light Scattering (DLS) analysis (Table 1).
BET analysis relates to particle size, shape, surface defect and pore structure. The specific surface area of the catalysts also affects the chemical and physical properties. Coating procedures affect the specific surface area. When the particle size decreases, the surface area, the surface adsorption capacity, and the catalytic ability increase.
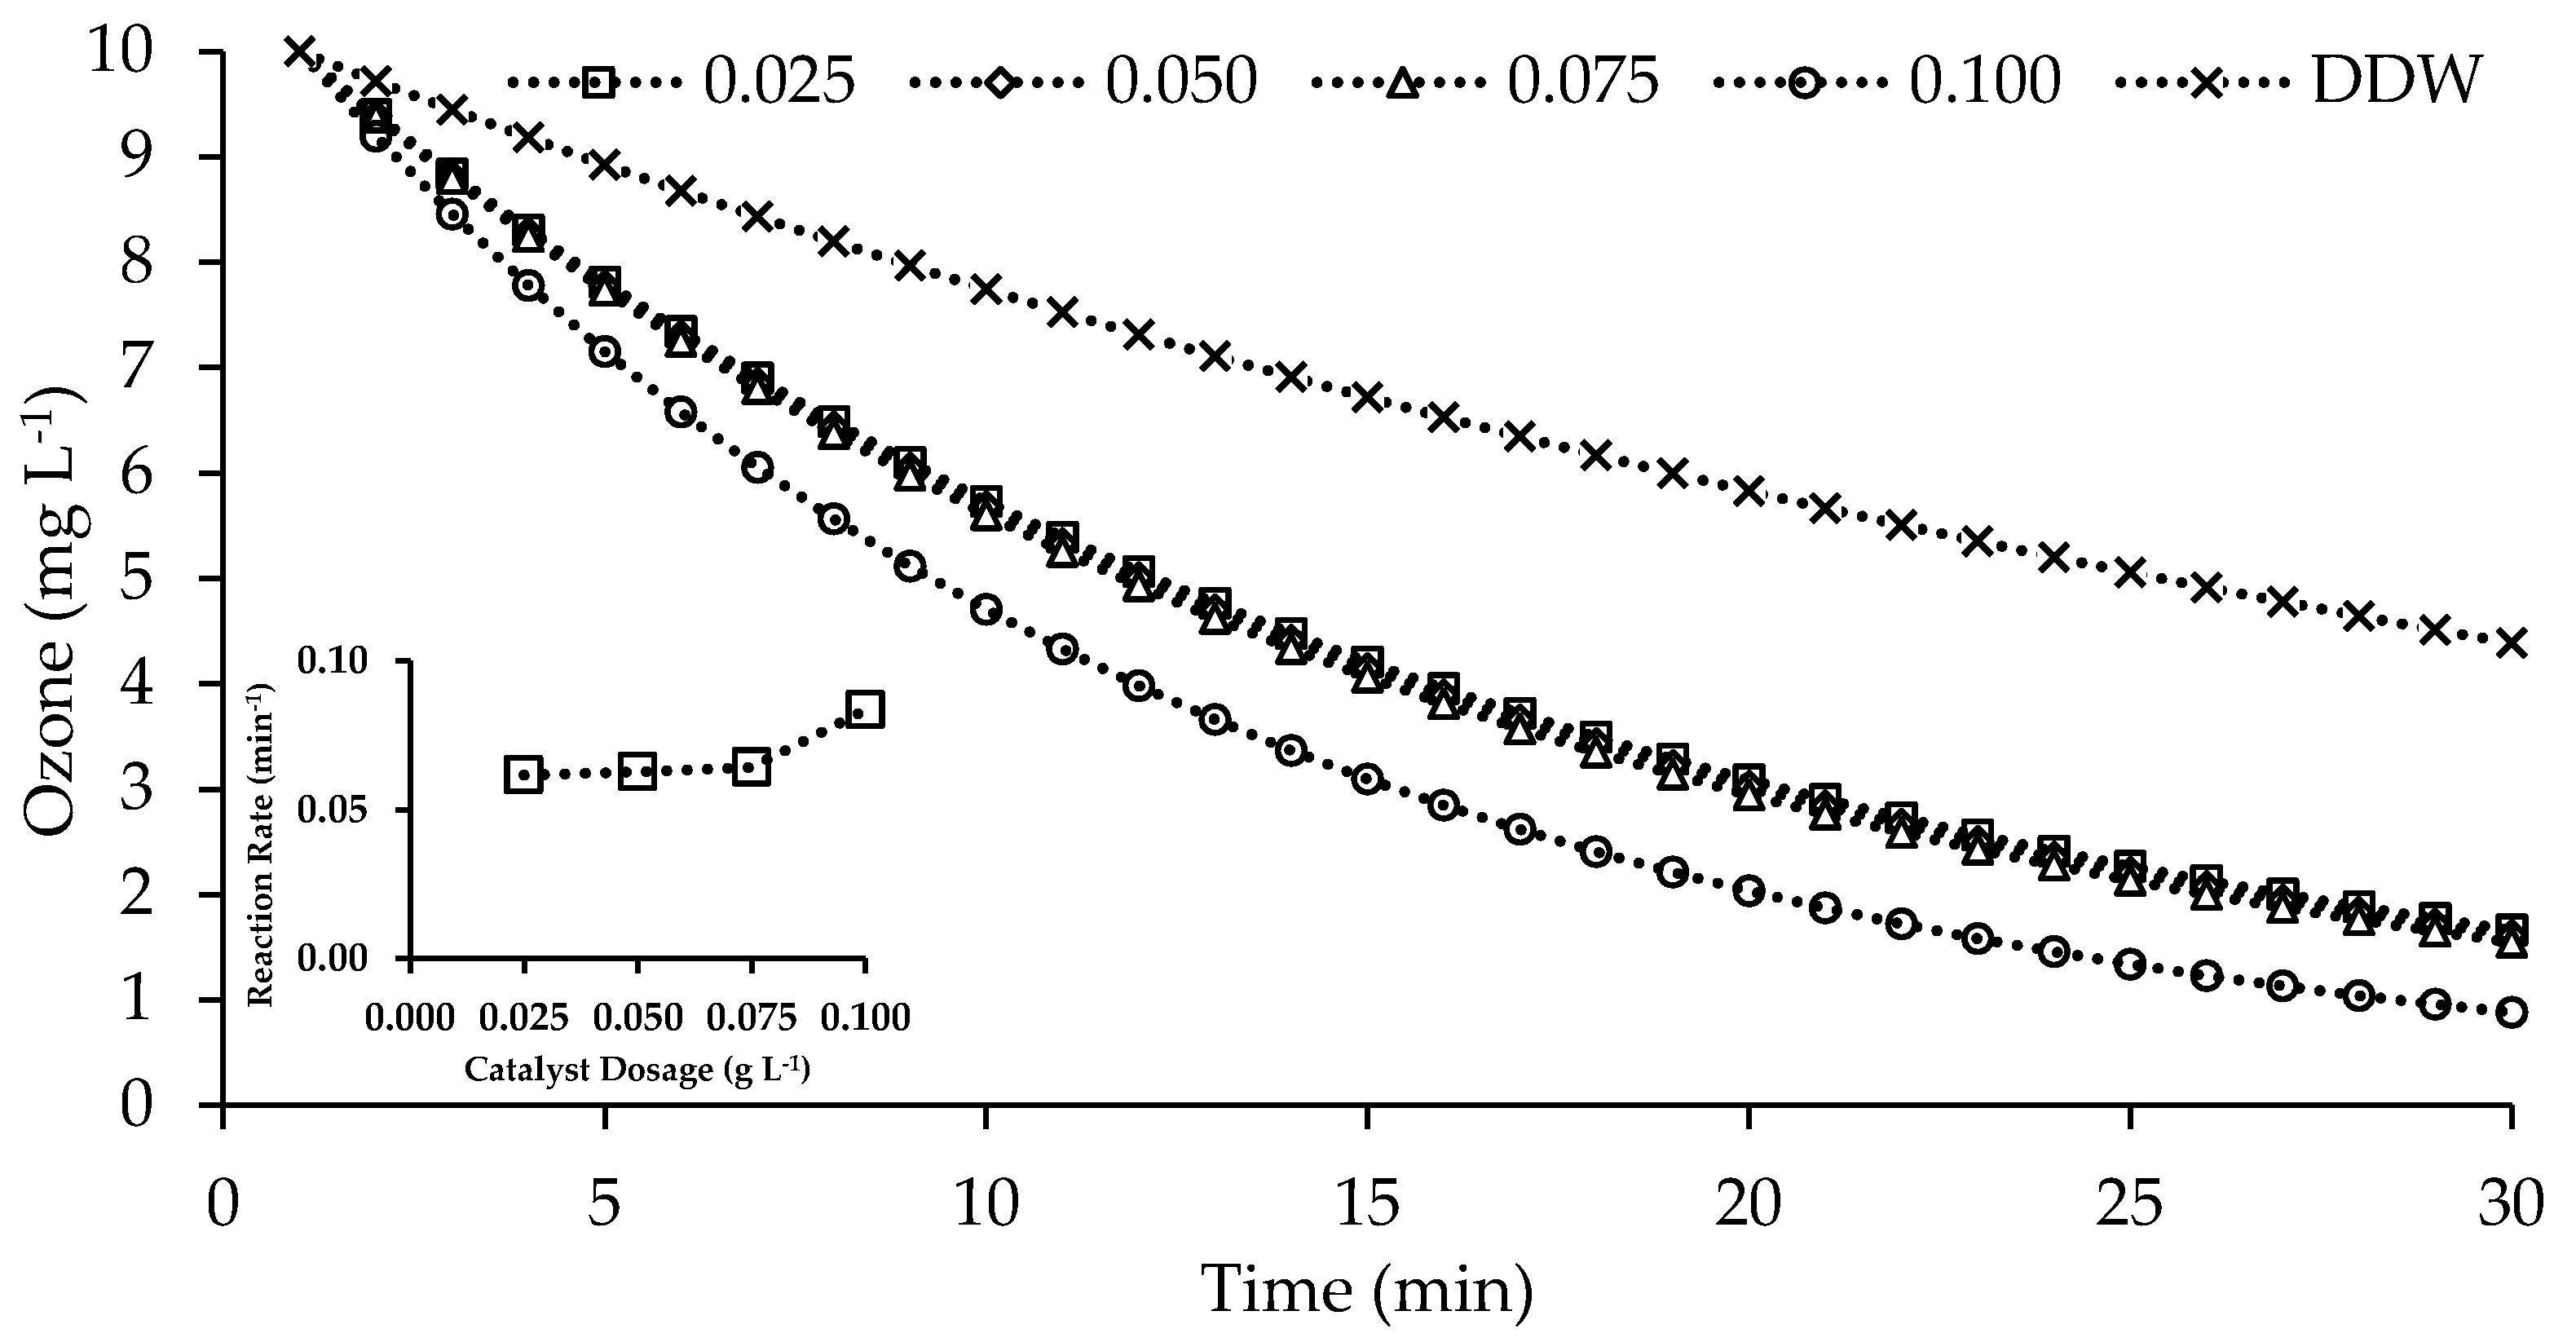
The decomposition of ozone in aqueous solution at pH 6.72, both with and without ICP, was investigated to determine the role of ICP in dissolved ozone decomposition. Figure 5 shows that the ozone decomposition in aqueous solution is greatly enhanced with ICP as opposed to an ozone only system at 30 min reaction time.
As shown in Figure 5, the ozone decomposition was best fitted to first-order kinetics both with and without a catalyst. The first-order decomposition of aqueous ozone was obviously enhanced in the presence of a catalyst, with its decomposition rate constant increasing 0.0284 min−1 to 0.0618–0.0837 min−1. It is thought that the radicals formed as a result of decomposition on the catalyst surface react with ozone and consume ozone.
2.2. Degradation of a NOM in the Different Processes
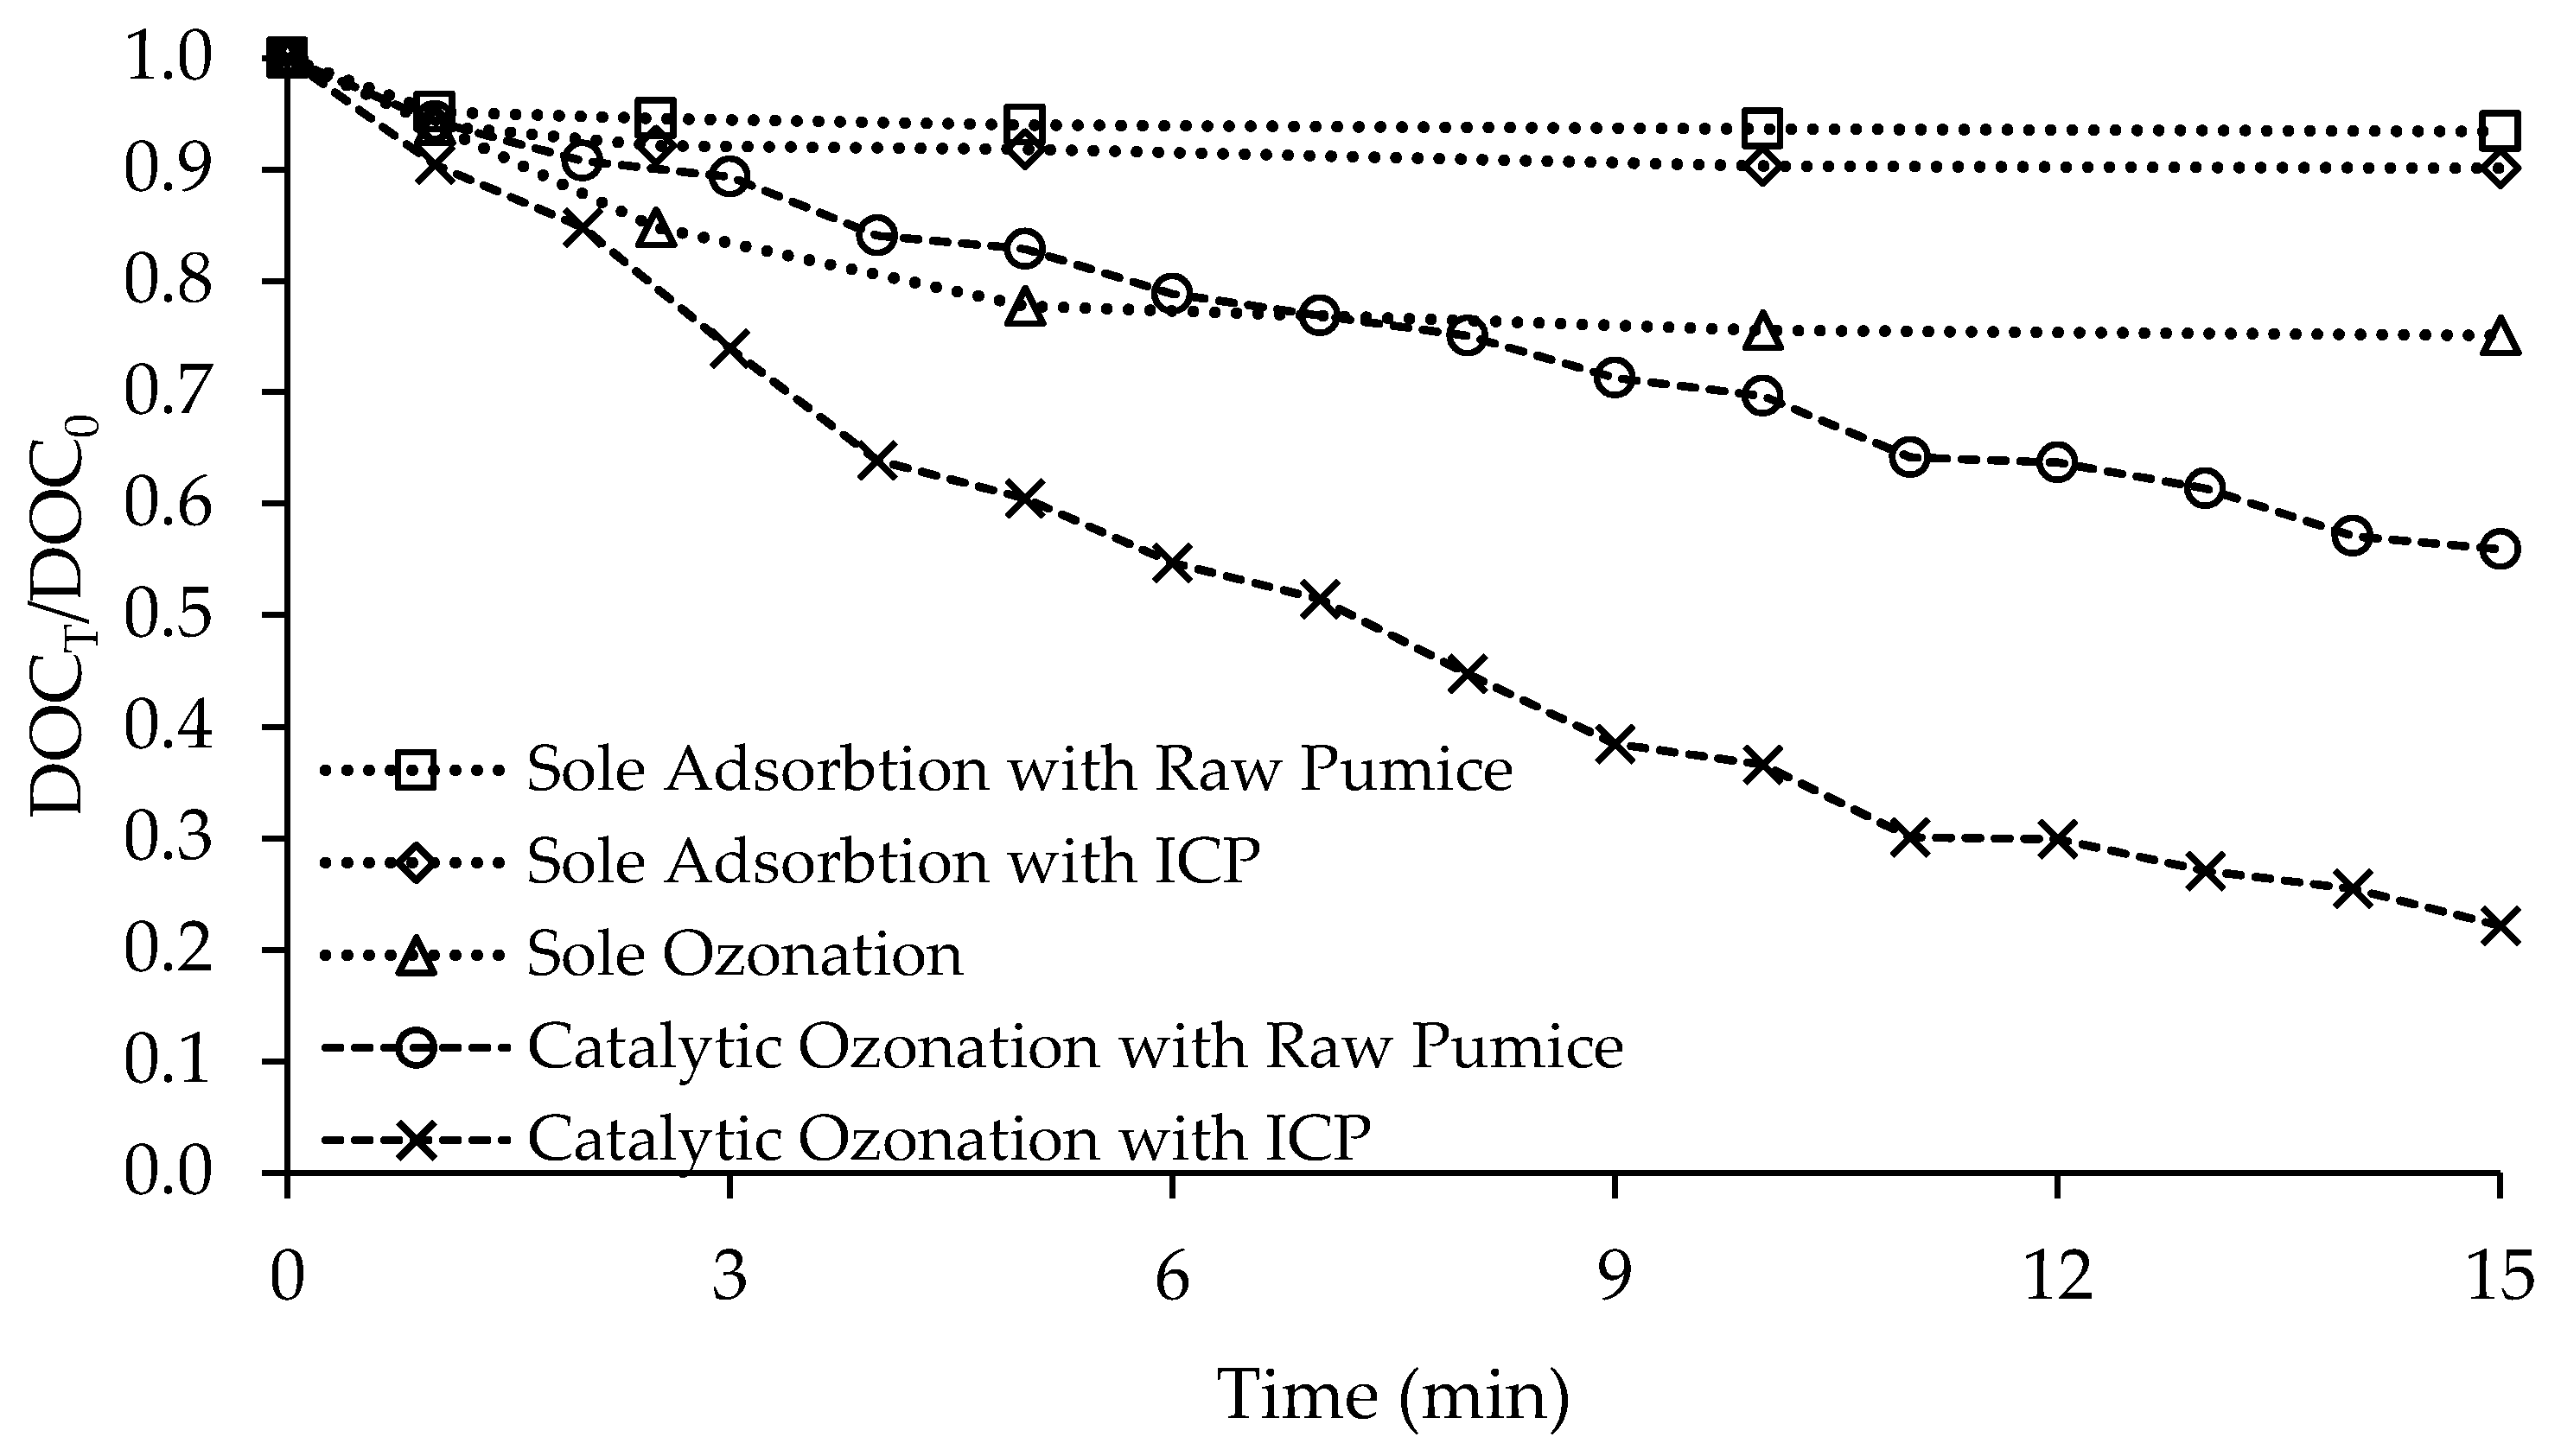
To assess the role of the catalyst over the catalytic ozonation pathway, the adsorption capacity of the catalyst and the molecular ozonation of the NOM were investigated. The sole adsorption and ozonation were evaluated under the optimal experimental conditions for catalytic ozonation. Figure 6 shows the degradation of HA through the application of sole adsorption, sole ozonation, and catalytic ozonation processes.
As shown in Figure 6, the lowest degradation of NOM occured in sole adsorption with raw pumice and iron coated pumice, resulting in the removals of 6.57% and 9.89% of the initial DOC after 15 min, respectively. DOC removal with sole ozonation was 24.87%. Also, a remarkable reduction of 44.16% and 77.86% DOC removals was observed in catalytic ozonation with raw pumice and ICP, respectively. This high percentage, together with the fact that the DOC removal in the ICP/O3 is still faster than that of sole-ozonation, suggests that the presence of ICP effectively increased the yield of radical OH•, and the high OH• dominates the improvement of NOM degradation. The experimental results suggest that the presence of the ICP catalyst has a synergistic effect with ozone for the degradation of NOM, as in other studies [20,21,22].
2.3. Influence of Variables on Catalytic Ozonation Efficiency
2.3.1. Catalyst Dosage
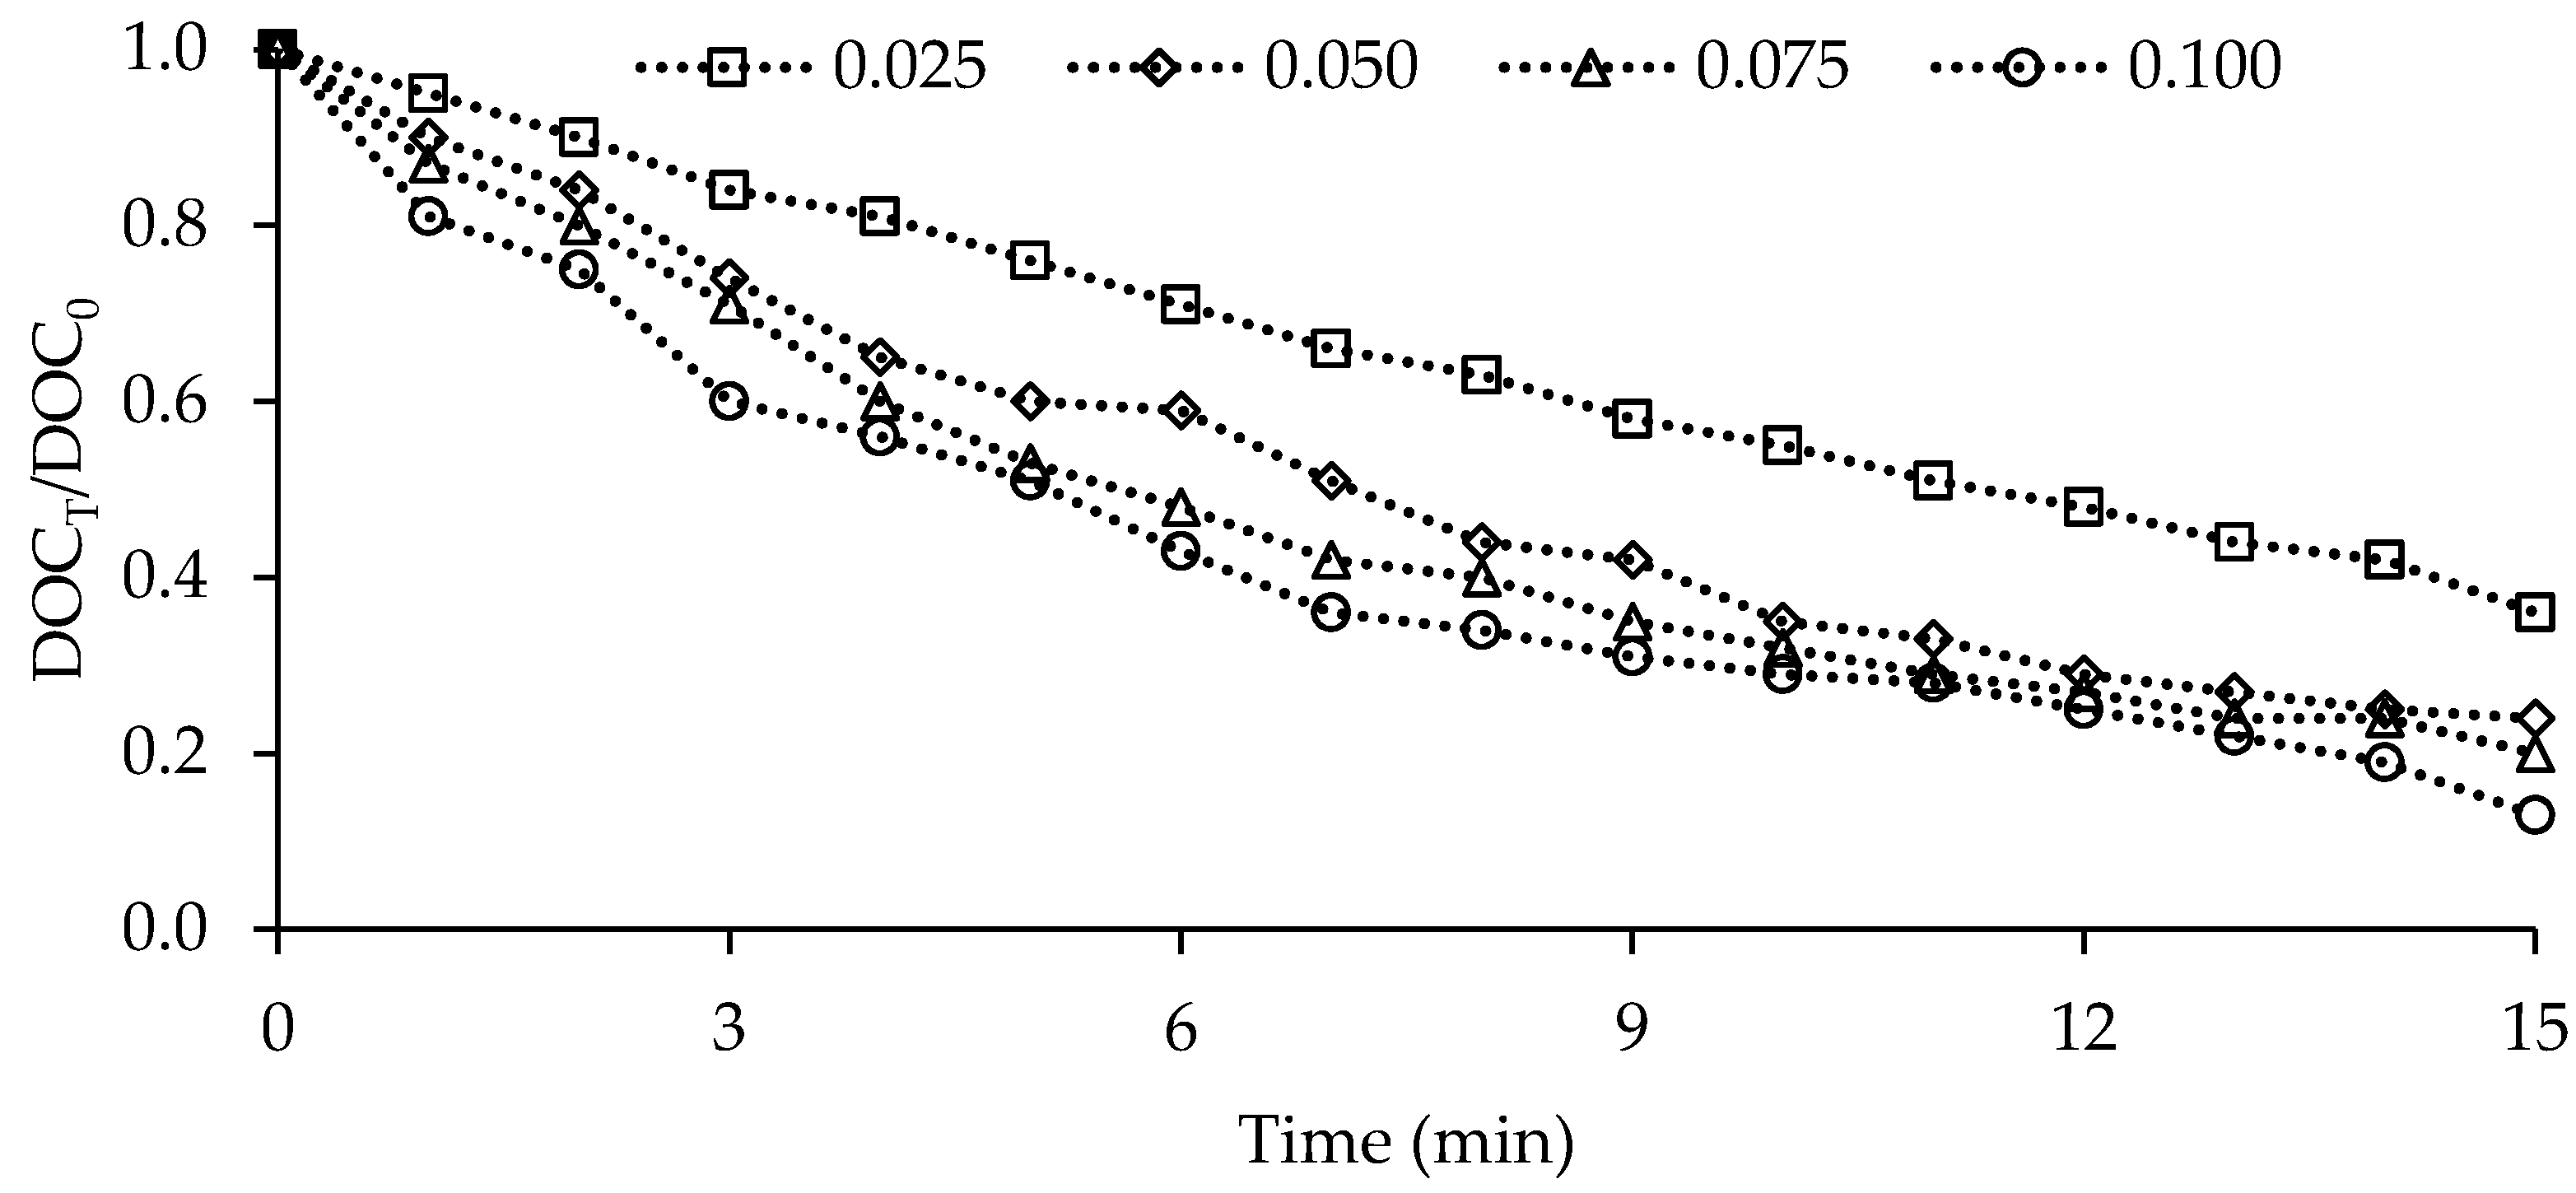
Catalyst concentration is a key factor in catalytic ozonation. Depending on the increase in the catalyst dosage, it can be said that ozone decomposes more rapidly, and therefore, that more radicals are formed (Figure 7).
The active surfaces where the ozone can decompose are increased, and these sites allow more radicals to be formed, and pollutants to be removed with the increase of the catalyst dosage.
Increased catalyst doses significantly contribute to the removal of pollutants. These results, reported by Lei Yuan et al. (2012), prove that an ICP catalyst can be used effectively in catalytic ozonation [7]. Given the reaction rate constant per unit catalyst dose, it was decided that a 0.050 g L−1 catalyst dose was optimal. In the aqueous environment, NOM degrades by singular and catalytic ozonation matches the pseudo-first-order kinetic model; this is due to overloading the catalyst or oxidant in the system [5,23,24] (shown as Equations (2) and (3) and the establishment of the above should be based on the assumption of overloaded oxidants and catalyst).
kO3 represents the reaction rate constant between molecular ozone and HA (min−1), kOH• represents the reaction rate constant between hydroxyl radical and HA (min−1), kads represents the adsorption reaction rate constant between the catalyst surface and HA (min−1), [O3] represents the dissolved ozone concentration (mol L−1), [OH•] represents the hydroxyl radical concentration (mol L−1), [Catalyst] represents the catalyst concentration (mol L−1), and t represent the reaction time.
2.3.2. Ozone Dosage
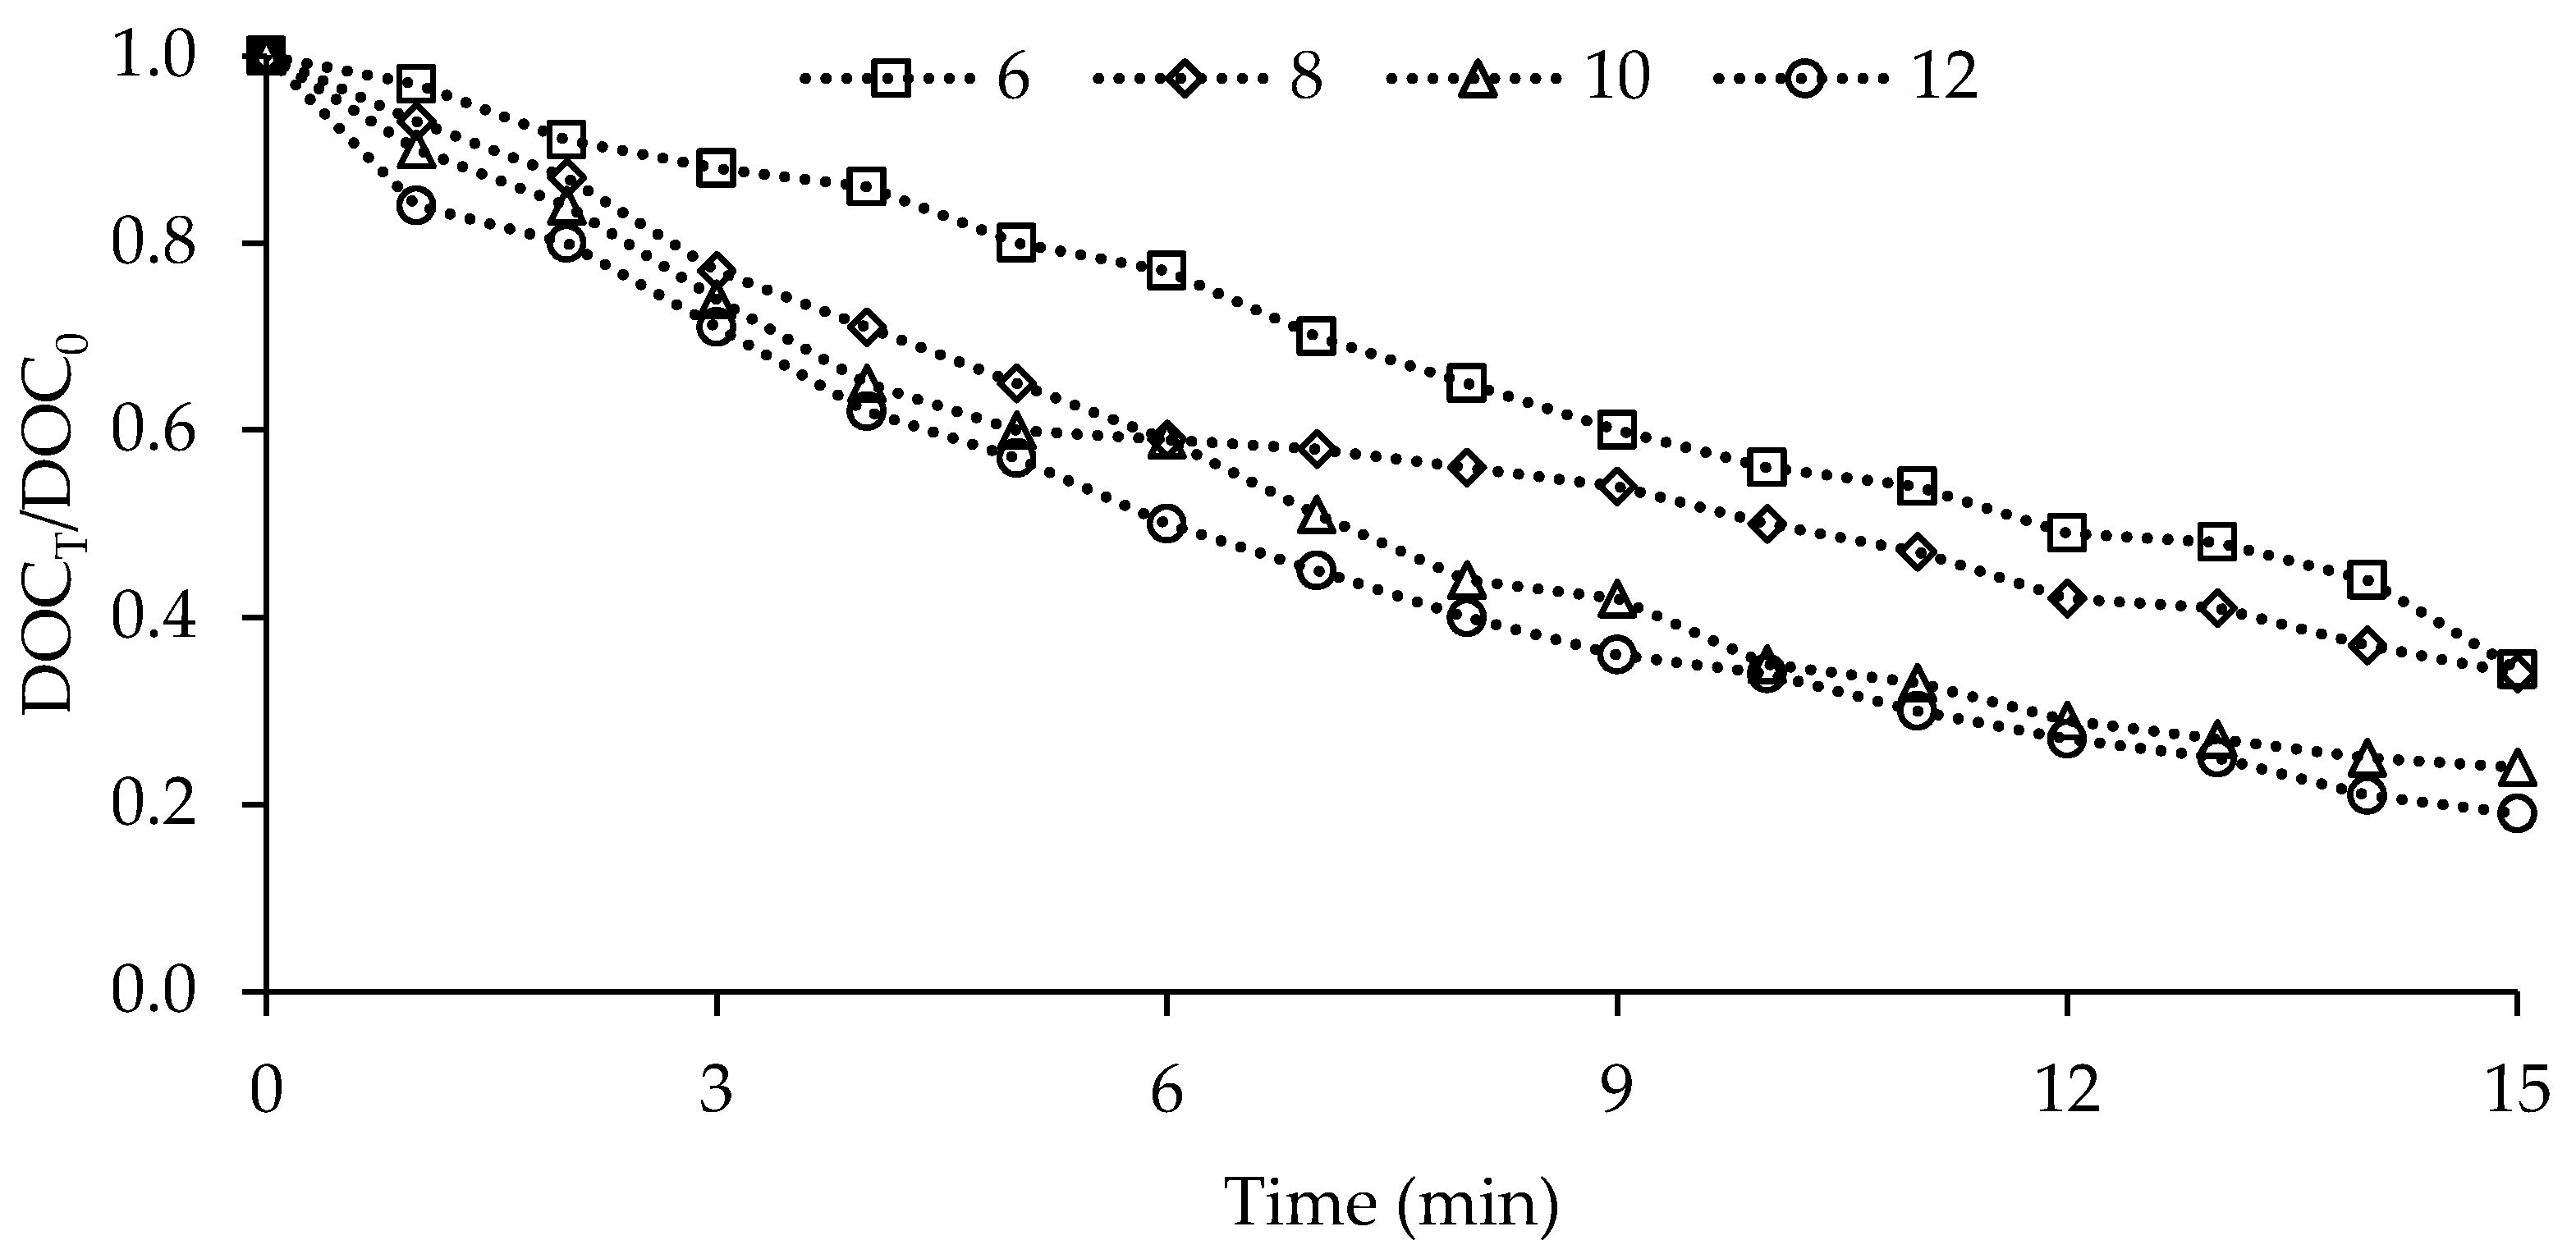
The heterogeneous catalytic ozonation of NOM in the aquatic environment is a reaction system containing the entire gas-liquid-solid phases. In this system, ozone concentration is an important factor affecting the degradation efficiency of NOM. In this title, the effect of starting ozone dosages of 6, 8, 10, and 12 mg L−1 on the catalytic ozonation process was analyzed. Figure 8 shows the change in DOC parameter, depending on the initial ozone dosage.
In some cases, it has been reported that the ozone dosage does not have much effect on removal efficiency. However, with the increase in ozone dosage, mineralization increases significantly. The catalyst surface has a limited effect in this study. Similar to this study, some studies in the literature have reported that oxidation or mineralization rates and activities are not significantly increased by increasing the initial ozone concentration in catalytic ozonation, since ozone concentration changes depending on the nature of the contaminant and the oxidation byproducts in the oxidation matrix [25]. Taking into account the ozone doses applied to the system, the amount of pollutant removed per unit ozone in the catalytic ozone is greater than that of the single ozone. Considering DOC removed per unit of ozone dosage, it was decided that an initial ozone dose of 10 mg L−1 was optimal.
The reaction rate constants of the hydroxyl radical and molecular ozone with HA are 0.0994 min−1 and 0.0422 min−1 respectively. This shows that HA reacts more slowly with molecular ozone.
2.3.3. HA Dosage
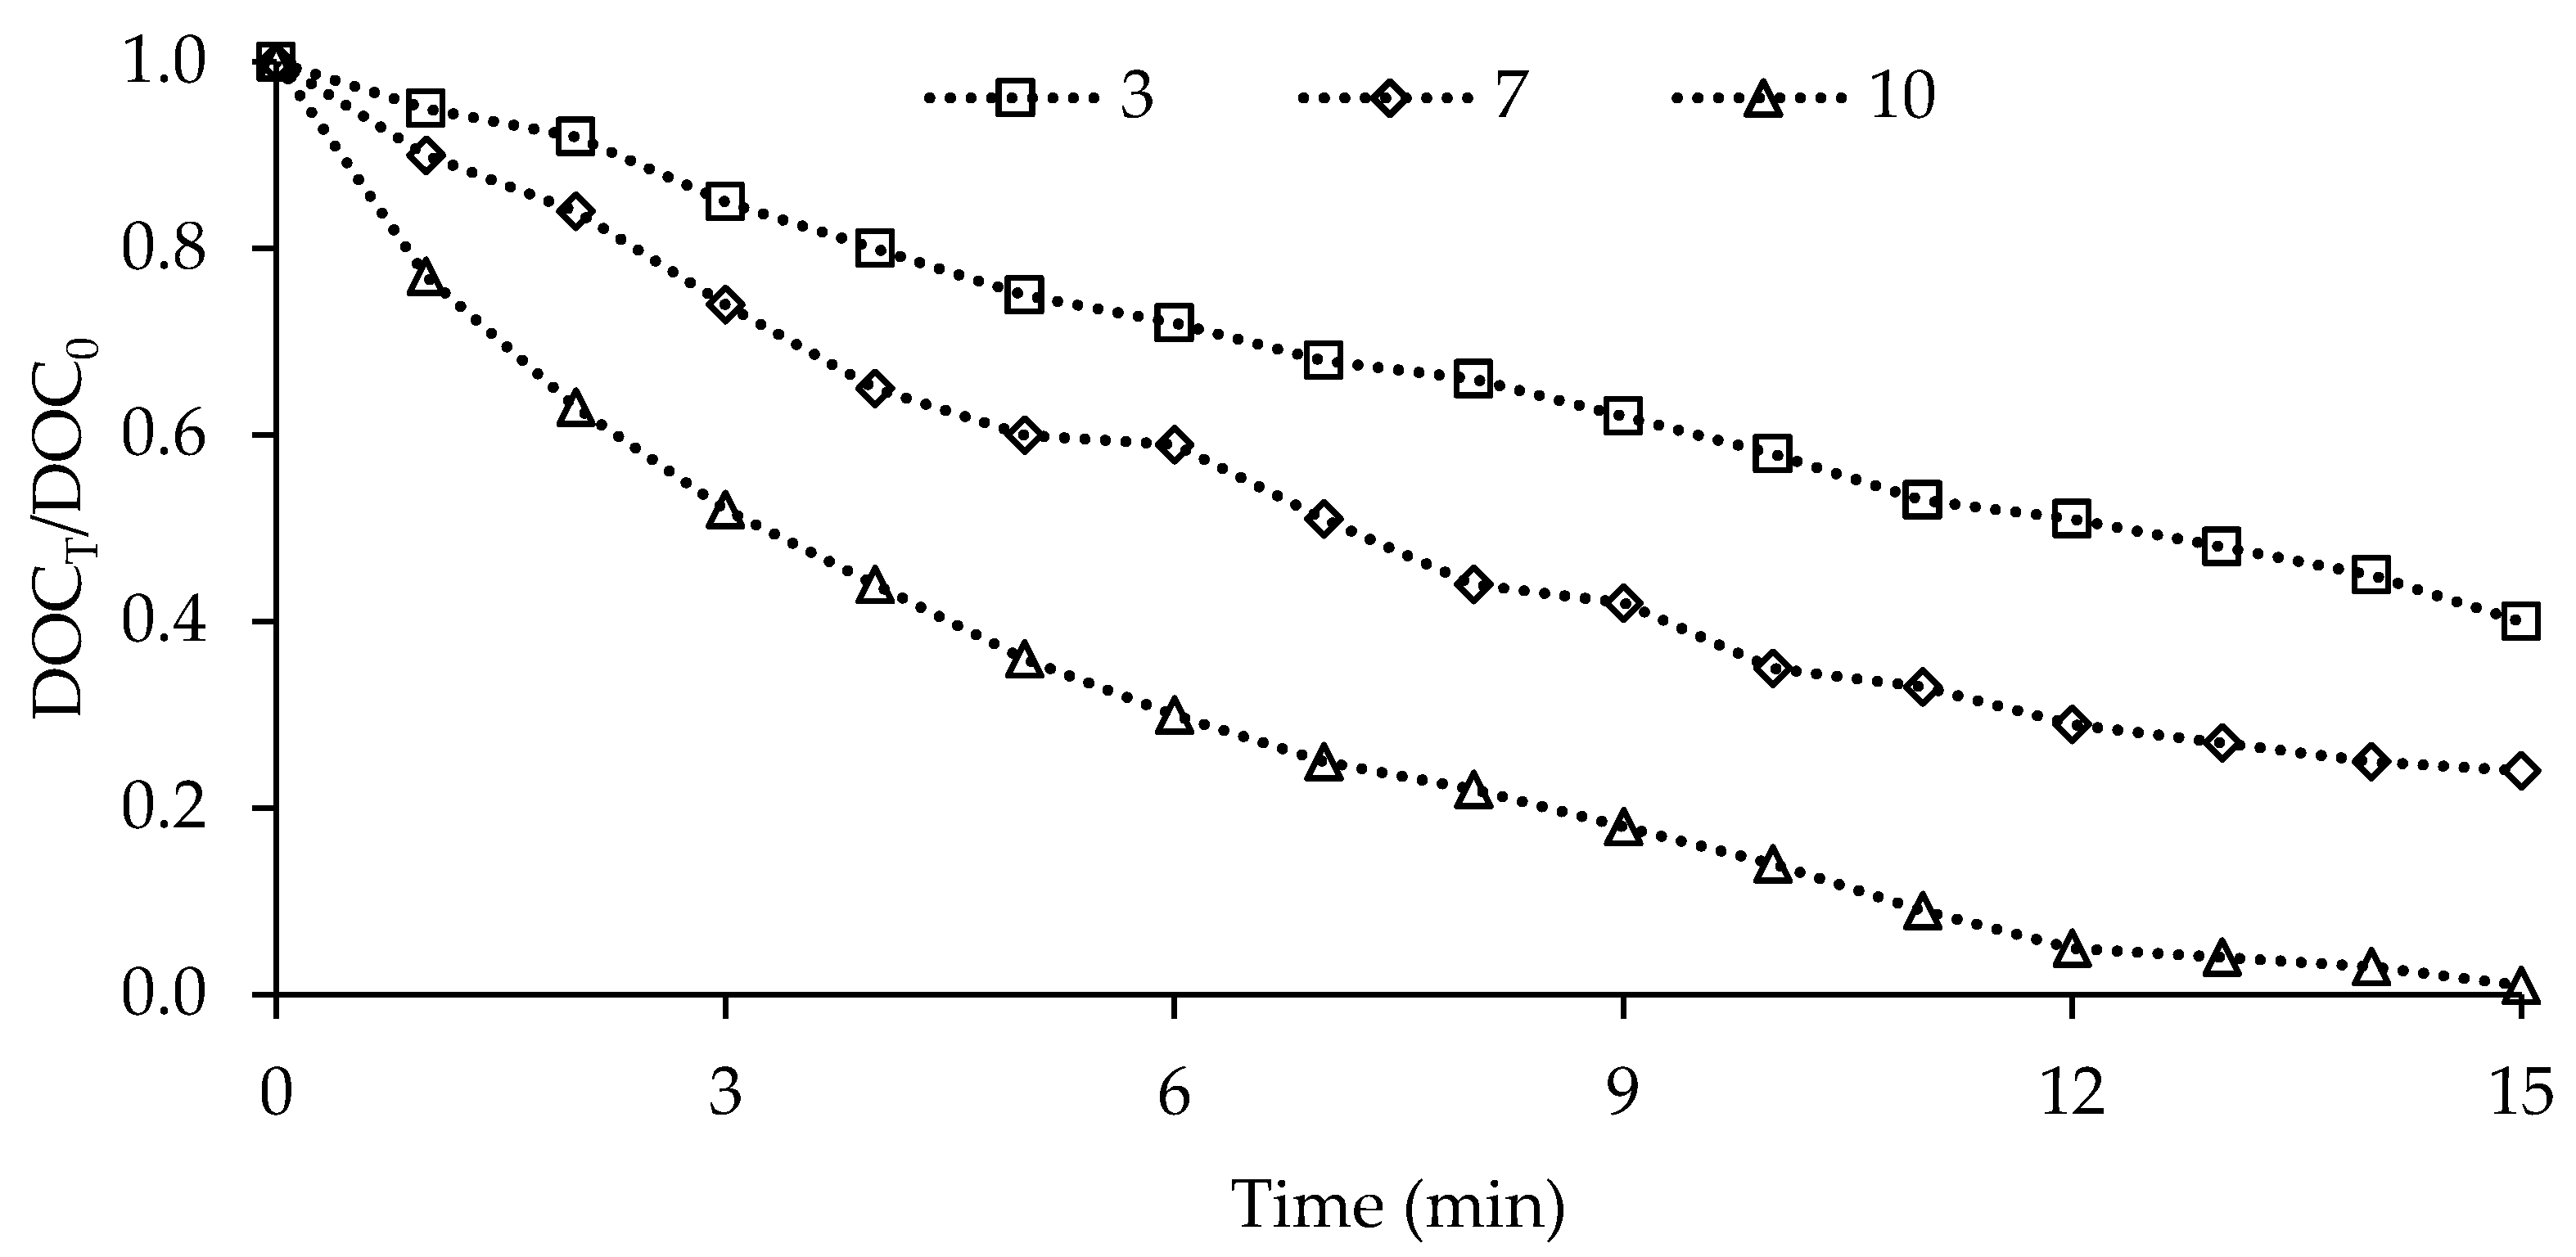
In the surface water sources, 40–50% of the organic matter consists of fulvic acid, and 5–10% of the humic acid. Variability and concentration according to the source of the organic matter fractions make it difficult to carry out their purification with a uniform process. Thus, the most important variables affecting the efficiency of catalytic ozonation processes are the concentration and characterization of the pollutant. In this title, the effect of different concentrations of HA at 0–20 mg L−1 in surface water sources on the catalytic ozonation process was investigated. The change in DOC, depending on the pollutant dose, is shown in Figure 9.
Mass transfer force is increased due to an increase in HA dosage, and therefore, the number of HA molecules adsorbed on the catalyst surface increases. Accordingly, an increase in initial HA concentration also improves remediation efficiency [4]. However, due to the fact that the active sites on the catalyst surface are filled after a while, this increase is restricted, and the removal reaches the equilibrium position. Taking into account the reaction rate constant per unit pollutant dose, it was decided that the initial pollutant dose of 10 mg L−1 was optimum. Reaction kinetics were examined using an experimental set data in which HA doses were examined for catalytic ozonation. Catalytic ozonation removal of many organic pollutants matches the Langmuir-Hinshelwood (L-H) kinetic [26,27]. The L-H model assumes that adsorption does not occur before reaching the saturation point. Assuming that the catalytic reactions take place at the surface of the catalyst, the concentration of the catalyst adsorbed on the catalyst surface affects the overall adsorption rate. The rate of catalytic degradation is explained by Equation (4).
r represents the reaction rate (mg L−1 min−1), C0 represents initial pollutant concentration (mg L−1), CT represents the concentration of the contaminant at a given time (mg L−1), k represents reaction rate constant (mg L−1 min−1), kads represents adsorption coefficient (L mg−1), and t represents time in the equation. In low concentrations of pollutants, the expression of cadence is neglected, and the reaction rate behaves like a first-degree model (Equations (5) and (6)).
According to Uyguner and Bekbolet (2005), when the HA concentration is below 20 mg L−1, it matches the first order kinetics [28]. The rate constant kobservation for the pseudo-first degree was obtained as a result of the first-degree linear regression analysis (Table 2).
As shown in Table 2, the kobservation rate constants increase with increasing HA constancy. These values are expected to reach equilibrium after a while, and it is predicted that larger values than the HA constriction reached the equilibrium will not need to be studied. In this study, it is appropriate to study the doses determined in the HA constellations of 2.5–20 mg L−1, since the rate constant of kobservation continues to increase.
When Equation (4) is rewritten;
In Equation (7), kads reflects the tendency of HA adsorption on the catalyst surface, and k is the reactivity value. To compute these coefficients, a C0−1 plot is plotted against r−1, the slope of the obtained slope is k−1, kads−1, and the cut point is k−1. These values are presented in Table 3.
The fact that the reactivity coefficient (k) is higher than the kads coefficient indicates that the catalytic ozonation is stronger than the adsorption.
2.3.4. pH
Although the pH value of the solution does not directly affect the OH- concentration, it affects the acid dissociation constant (pKa) and the catalyst surface [29]. The pH value has an extraordinary effect on ozone decomposition and catalytic ozonation process. The effect of the initial pH value on the DOC removal in the catalytic ozonation process is investigated in Figure 10.
At low pH values, HA contains weakly acidic functional groups. These groups (carboxyl and phenolic) are more adsorptive due to their non-ionized cavities [30,31]. Since HA is negatively charged due to the presence of carboxylic and phenolic groups, the surface of the ICP catalyst is positively charged at low pH values. The surface acidity of the catalyst is increased due to H+ adherence in the surface of the catalyst. Therefore, ion pairing occurs between the negatively charged HA and the positively charged weak acid on the catalyst surface. As the pH value increases, the ion pairing continues. However, a decrease in HA degradation is observed as the functional groups on HA are degraded at high pH values. When the pH of the solution is above the pH value of the catalyst, the entire catalyst surface has a negative charge, and a cation exchange reactions occur (Equation (9)). Below the pHPZC value, the catalyst surface is loaded positively, and anionic exchange reactions take place (Equation (8)). When the pH value of the solution is equal to pHPZC, electrostatic interaction occurs between the nano ICP catalyst and HA, and the adsorption increases up to the high pH values.
In acidic environment α-FeO-OH + H+ ↔ α-FeOH+ + H2O−
In alkaline environment α-FeO-OH + OH− ↔ α-FeO(OH)− + H2O
The catalyst used in this study is pHPZC value 7.13; above this value, adsorption becomes difficult due, to the increase of electrostatic iteration between HA and catalyst surface. Therefore, catalytic reactions are thought to take place at the solution catalyst interface.
2.3.5. Identification of Solution and Interface Reactions
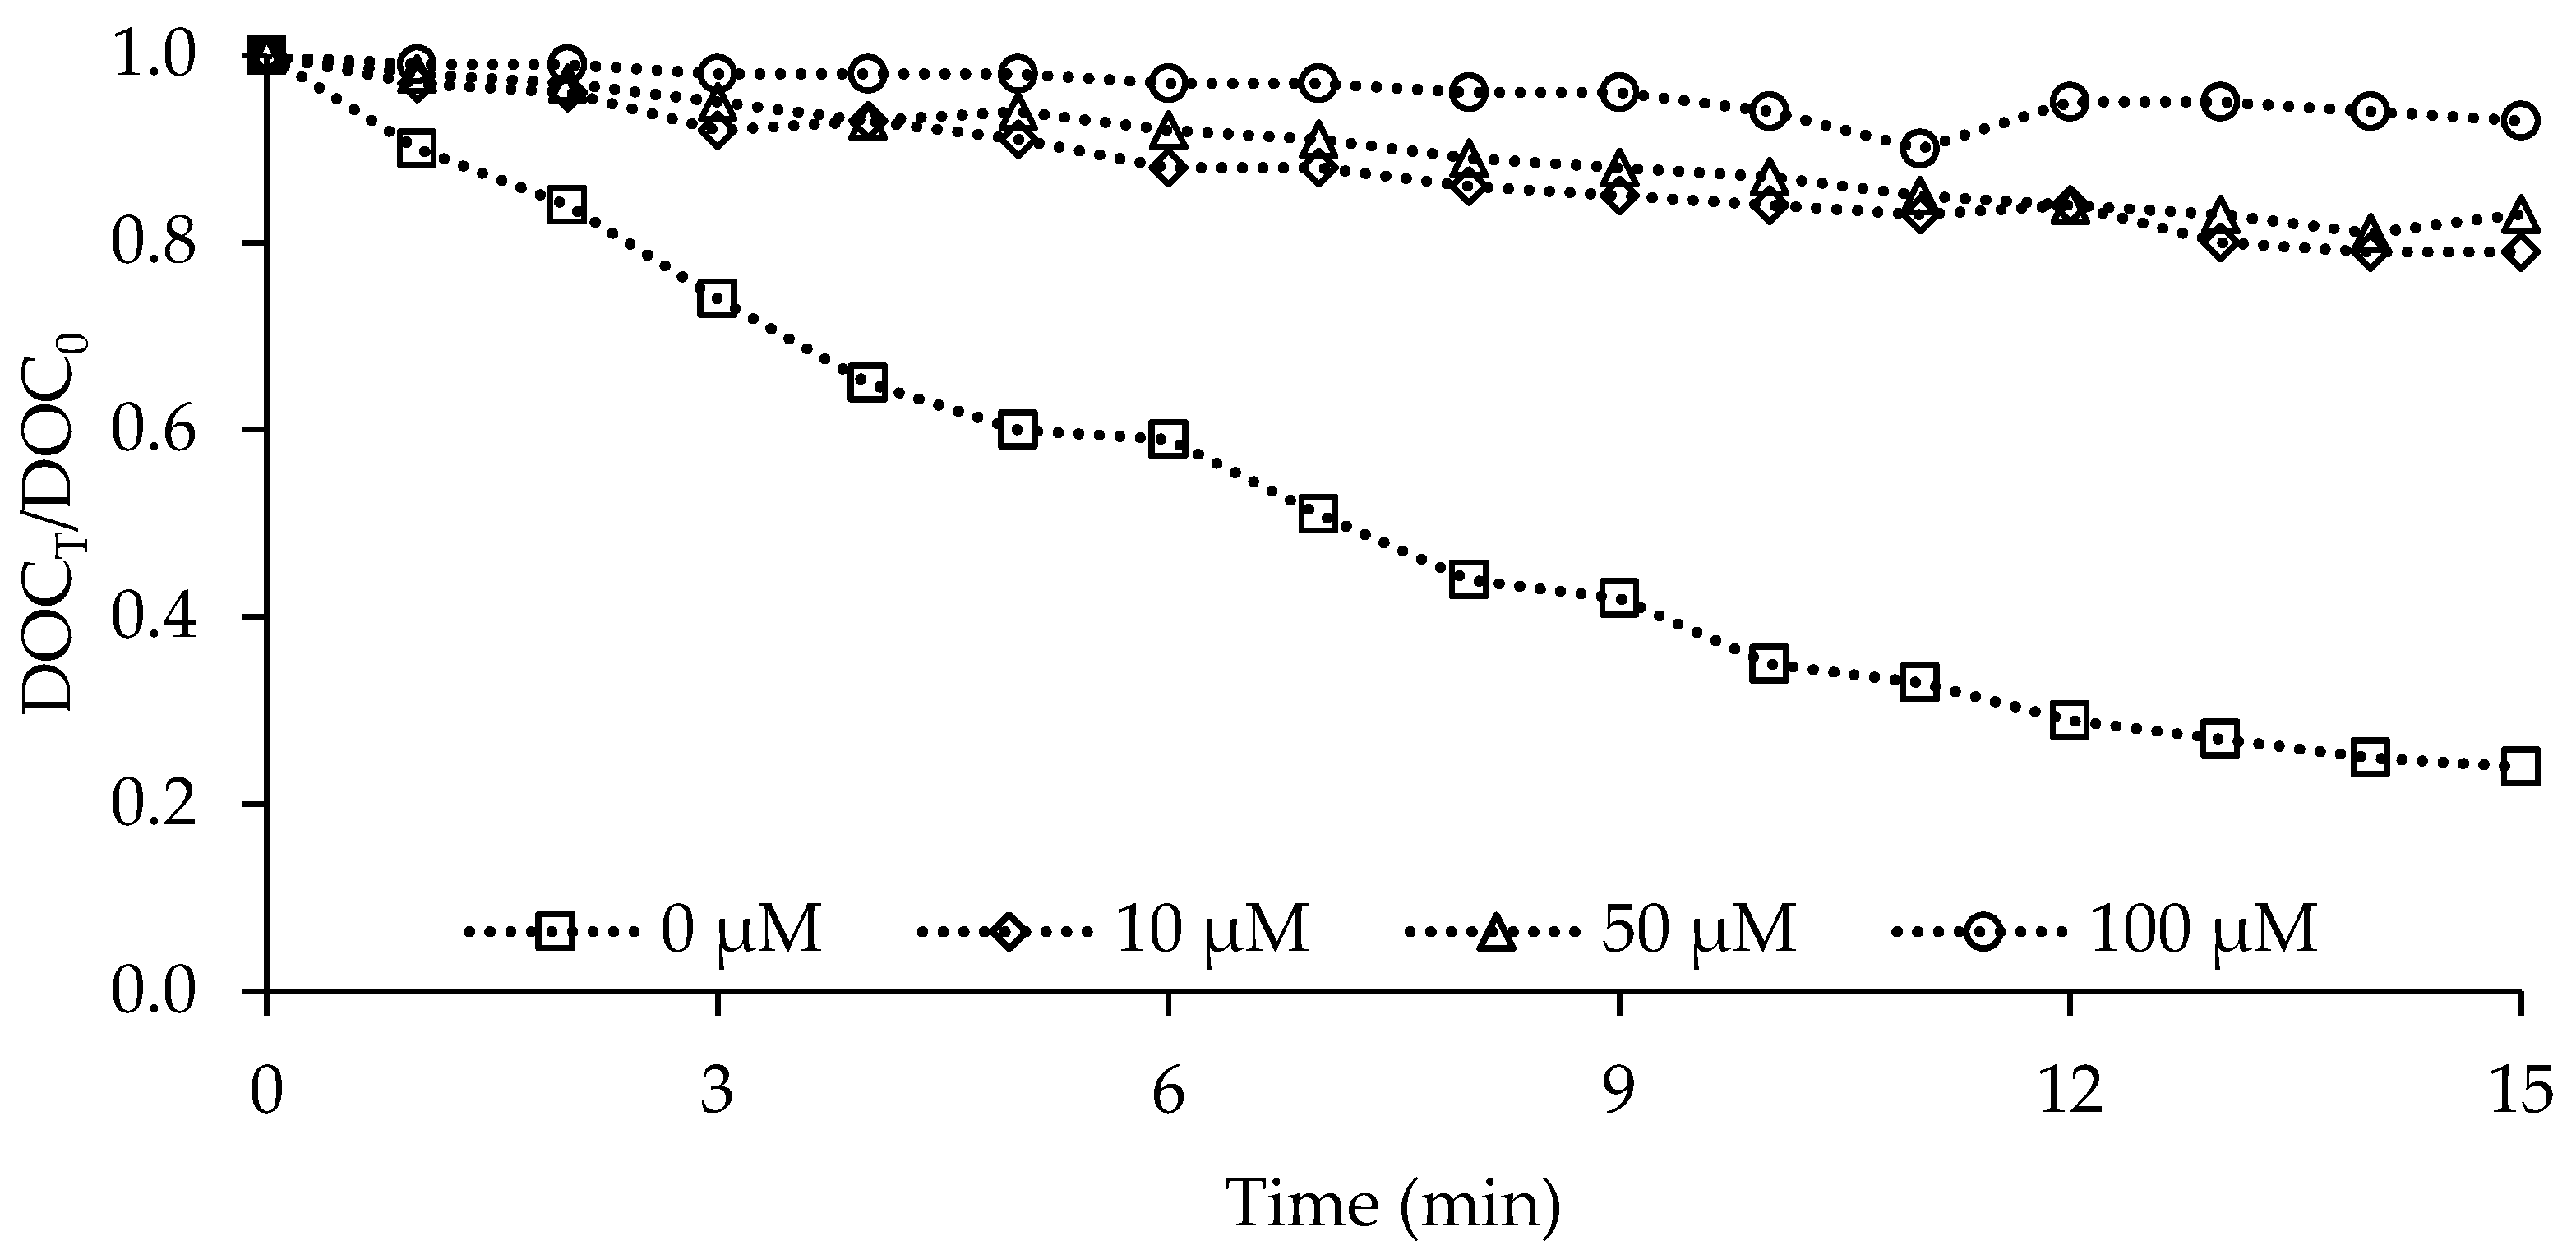
In this study, we have tried to clearly define the reaction kinetics and the reaction mechanism by examining the effect of the phosphate concentrations in the surface waters on the removal of HA. Phosphate is known as an inorganic reaction inhibitor in catalytic ozone [32]. Phosphate was used in this study to investigate the catalytic ozonation interfacial reaction due to the adsorption of hydroxyl groups on the catalyst surface. The effect of phosphates on catalytic ozonation is examined in Figure 11 and Figure 12.
The inhibitory effect of phosphates on catalytic ozone has been observed. Increase in initial phosphate concentration inhibits HA degradation. At all phosphate concentrations, this effect is highly visible. Phosphate can be adsorbed more in the pores formed as a result of coating the pumice catalyst with iron. As a result, it can be considered that the catalytic ozonation processes carried out with iron coated pomace samples are more influenced by phosphate.
In catalytic ozone, the interfacial reactions involving interfacial reaction and adsorption and the reactions in solution are expressed by Equation (10):
In Equation (10), ksolution and kinterface are pseudo first-degree rate constants in solution and interface. When the phosphate solution is added, the effect on the interface and solution is given in Equations (11) and (12).
In Equation (12), ksolution-phosphate and kinterface-phosphate are the first-degree rate constants of the phosphate inhibition reactions. Interfacial reactions do not occur when there is no catalyst in the environment, so the equation can be written as:
A good linear fit between kobservation-phosphate and phosphorus concentrations was observed (Figure 12).
According to the results of singular ozonation, the slope of the line gives the value of ksolution-phosphate, and the cutoff point gives the value of ksolution. According to the results of catalytic ozonation, the slope of the straight line gives the value of ksolution-phosphate + kinterface-phosphate, and the cut point gives the value of ksolution+kinterface. Based on these results, all reaction rate constants were calculated and listed in Table 4.
The ksolution-phosphate/kinterface-phosphate ratio indicates that phosphate is effective in solution or interface reactions. When this value is greater than 1, it is effective in the solution reaction, and when it is smaller than 1, it is effective in the interface reaction. Since the value is greater than 1, the surface does not react with the hydroxyl groups.
2.4. Influence of TBA Dosage on the Performance of Catalytic Ozonation
In ICP catalysis, NOM oxidation is increased due to some active species formed during catalytic ozonation. The prevalence of OH• formation, which leads to the development of catalytic ozonation, should be investigated. Thus, organic radical scavenger tert-butyl alcohol (TBA) was used to prove OH• formation in catalytic ozonation. The reaction rate constant with the hydroxyl radical of TBA is 6.0 × 10⁸ M−1 s−1 [33], while the molecular ozone has 3.0 × 10⁻³ M−1 s−1 [34,35]. In addition, TBA cannot be adsorbed on the catalyst surface due to its physical and chemical properties [36,37]. As shown in Figure 13, the presence of TBA in the same operating conditions inhibits NOM removal in the catalytic ozonation process, as it reduces the formation of OH • reacting with organic molecules.
The kinetic coefficients according to the presence of TBA were compared to determine the contribution of molecular ozone (ƒO3) and hydroxyl radicals (OH•) to NOM degradation. Considering the homogeneous reactions occurring in the liquid phase and the heterogeneous reactions on the catalyst surface in the catalytic systems, the HA degradation kinetics were found to be pseudo first degree.
In Equation (17), [Catalyst] represents catalyst dosage (g L−1), kobservation represents pseudo first-degree reaction rate constant (min−1), ko3 represents the rate constant of molecular ozone, kOH• represents the rate constant of hydroxyl radicals, kads represents the rate constant of adsorption to catalyst surface, kads-O3 represents the rate constant of the molecular ozone in the surface, and kads-OH• represents the rate constant of the hydroxyl radicals on the surface. The addition of TBA to the catalytic ozonation process terminates the reaction chain between HA and OH. The basic degradation of HA is due to the reaction of molecular ozone in the liquid phase and ozone adsorbed on the catalyst surface. The next reaction kinetics when TBA is added can be explained by Equation (18) [20,38]:
Depending on the HA depletion, the OH• fraction (ƒOH•) is calculated by Equation (20).
As seen in Figure 14, the OH• fraction (ƒOH•) varies from 66.2% to 84.5% depending on the TBA concentration. OH• proved to be the predominant species in catalytic ozonation.
As shown in Figure 15, different TBA doses showed the same inhibitory effect. As verified in many studies, all TBA doses used in this study consume OH• in the catalytic ozonation process [5]. TBA presence in singular ozonation processes inhibits performance by 13.0%. This negative effect is less than catalytic ozonation. In the catalytic ozonation, OH•s are responsible for HA degradation, and the inhibition effect is more pronounced in these processes than in the case of single ozonation. Equation (21) can be written assuming that almost all OH• is consumed in singular ozonation and catalytic ozonation.
In this study, adsorption kinetics were determined using the first order model. Therefore, in adsorption processes;
The contribution of direct (molecular ozonation)/indirect (OH•) oxidation and surface adsorption to NOM degradation can be explained by Equations (23)–(25).
Based on the above equation and the data of degradation and adsorption, ɳozone, ɳOH•, and ɳadsorption in singular and catalytic ozonation are calculated. (Table 5).
HA degradation is predominant in Phase 1 and the results in Table 5 were calculated based on the experimental data at the input phase. No pH adjustment was made while studying (pH = 6.86). Direct and indirect reaction mechanisms of this pH value are involved in all reactions, and direct oxidation provides a significant contribution to the individual ozone. Surface adsorption plays a specific role in the removal of model compounds by catalytic ozonation, which has not been observed in the results of many publications [39]. This additive from the adsorbs drops after the catalyst has been coated with any metal, since the adsorption is not the main step for catalytic ozonation studies of surfaces modified with catalysts, but is used only as a support surface for the development of reactions. In singular ozonation, the contribution of indirect oxidation to ozonation is reduced, and the main oxidation principle is molecular ozonation.
2.5. Stability of the Catalyst in the Catalytic Ozonation Process
The stability of the catalyst and the dissolved iron concentration in solution were tested by using 10 repetitions of the optimum dose of catalyst for NOM removal. After each catalytic ozonation process, the catalyst was removed from the aquatic environment by filtration, and washed with ultrapure water. The catalyst was used in the next catalytic ozonation experiment after drying at 50 °C. The effect of ICP catalyst stability on NOM removal efficiency in catalytic ozonation is shown in Table 6.
The results of the analysis show that the pumice activity and the dissolved iron amounts are stable. It is thought that a large part of the amount of iron passing through the solution is caused by the iron-coated pumice that is crushed into the mechanical mixer.
3. Materials and Methods
3.1. Materials and Reagents
As a target organic compound, HA solutions were prepared using HA sodium salt (H16752) purchased from Sigma Aldrich. Some physical properties of Aldrich HA have been stated elsewhere [40]. HA concentrations were determined by considering the available organic matter content in surface water, and were prepared by dissolving the powdered form of humics in a 0.1 N NaOH solution. The solutions were filtered through 0.45 μm pore size filter paper, and the filtrate was used in the experiments. The solution of HA (10 mg L−1) was characterized as 3.722 ± 0.281 mg L−1 of DOC.
Pumice stone was taken from the Hasan Mount region, located in the southeast of the Aksaray province, middle of Turkey. To enhance its catalytic activity, the natural pumice (NP) was coated with ferrous iron using reagent grade FeCl3⋅6H2O, employing the method reported by Lai et al. [41] and Lai and Chen [42], with some modifications. Detailed information on the employed coating procedures can be found in our previous publication [18]. Brunauer-Emmett-Teller (BET) surface area, Transmission Electron Microscopy (TEM), X-ray Diffraction (XRD), Fourier Transform Infrared (FT-IR) spectroscopy, Dynamic Light Scattering (DLS) and pHpzc analysis were carried out to investigate the surface properties of the catalyst, and the detailed information is given in Chapter 3.1.
Deionized and distilled water (≥18 MΩ cm, Milli-Q Water System, Millipore, Bedford, MA, USA) used for stock solution preparations and dilutions. Methyl tert-butyl ether (Sigma-Aldrich Co. LLC., Milan, Italy) was used in gas chromatography (GC) analyses. All of the other reagents, such as CH3CO2H, NaOH, and Na2S2O3 were of analytical grade or higher, and were used without further purification.
3.2. Experimental Procedure
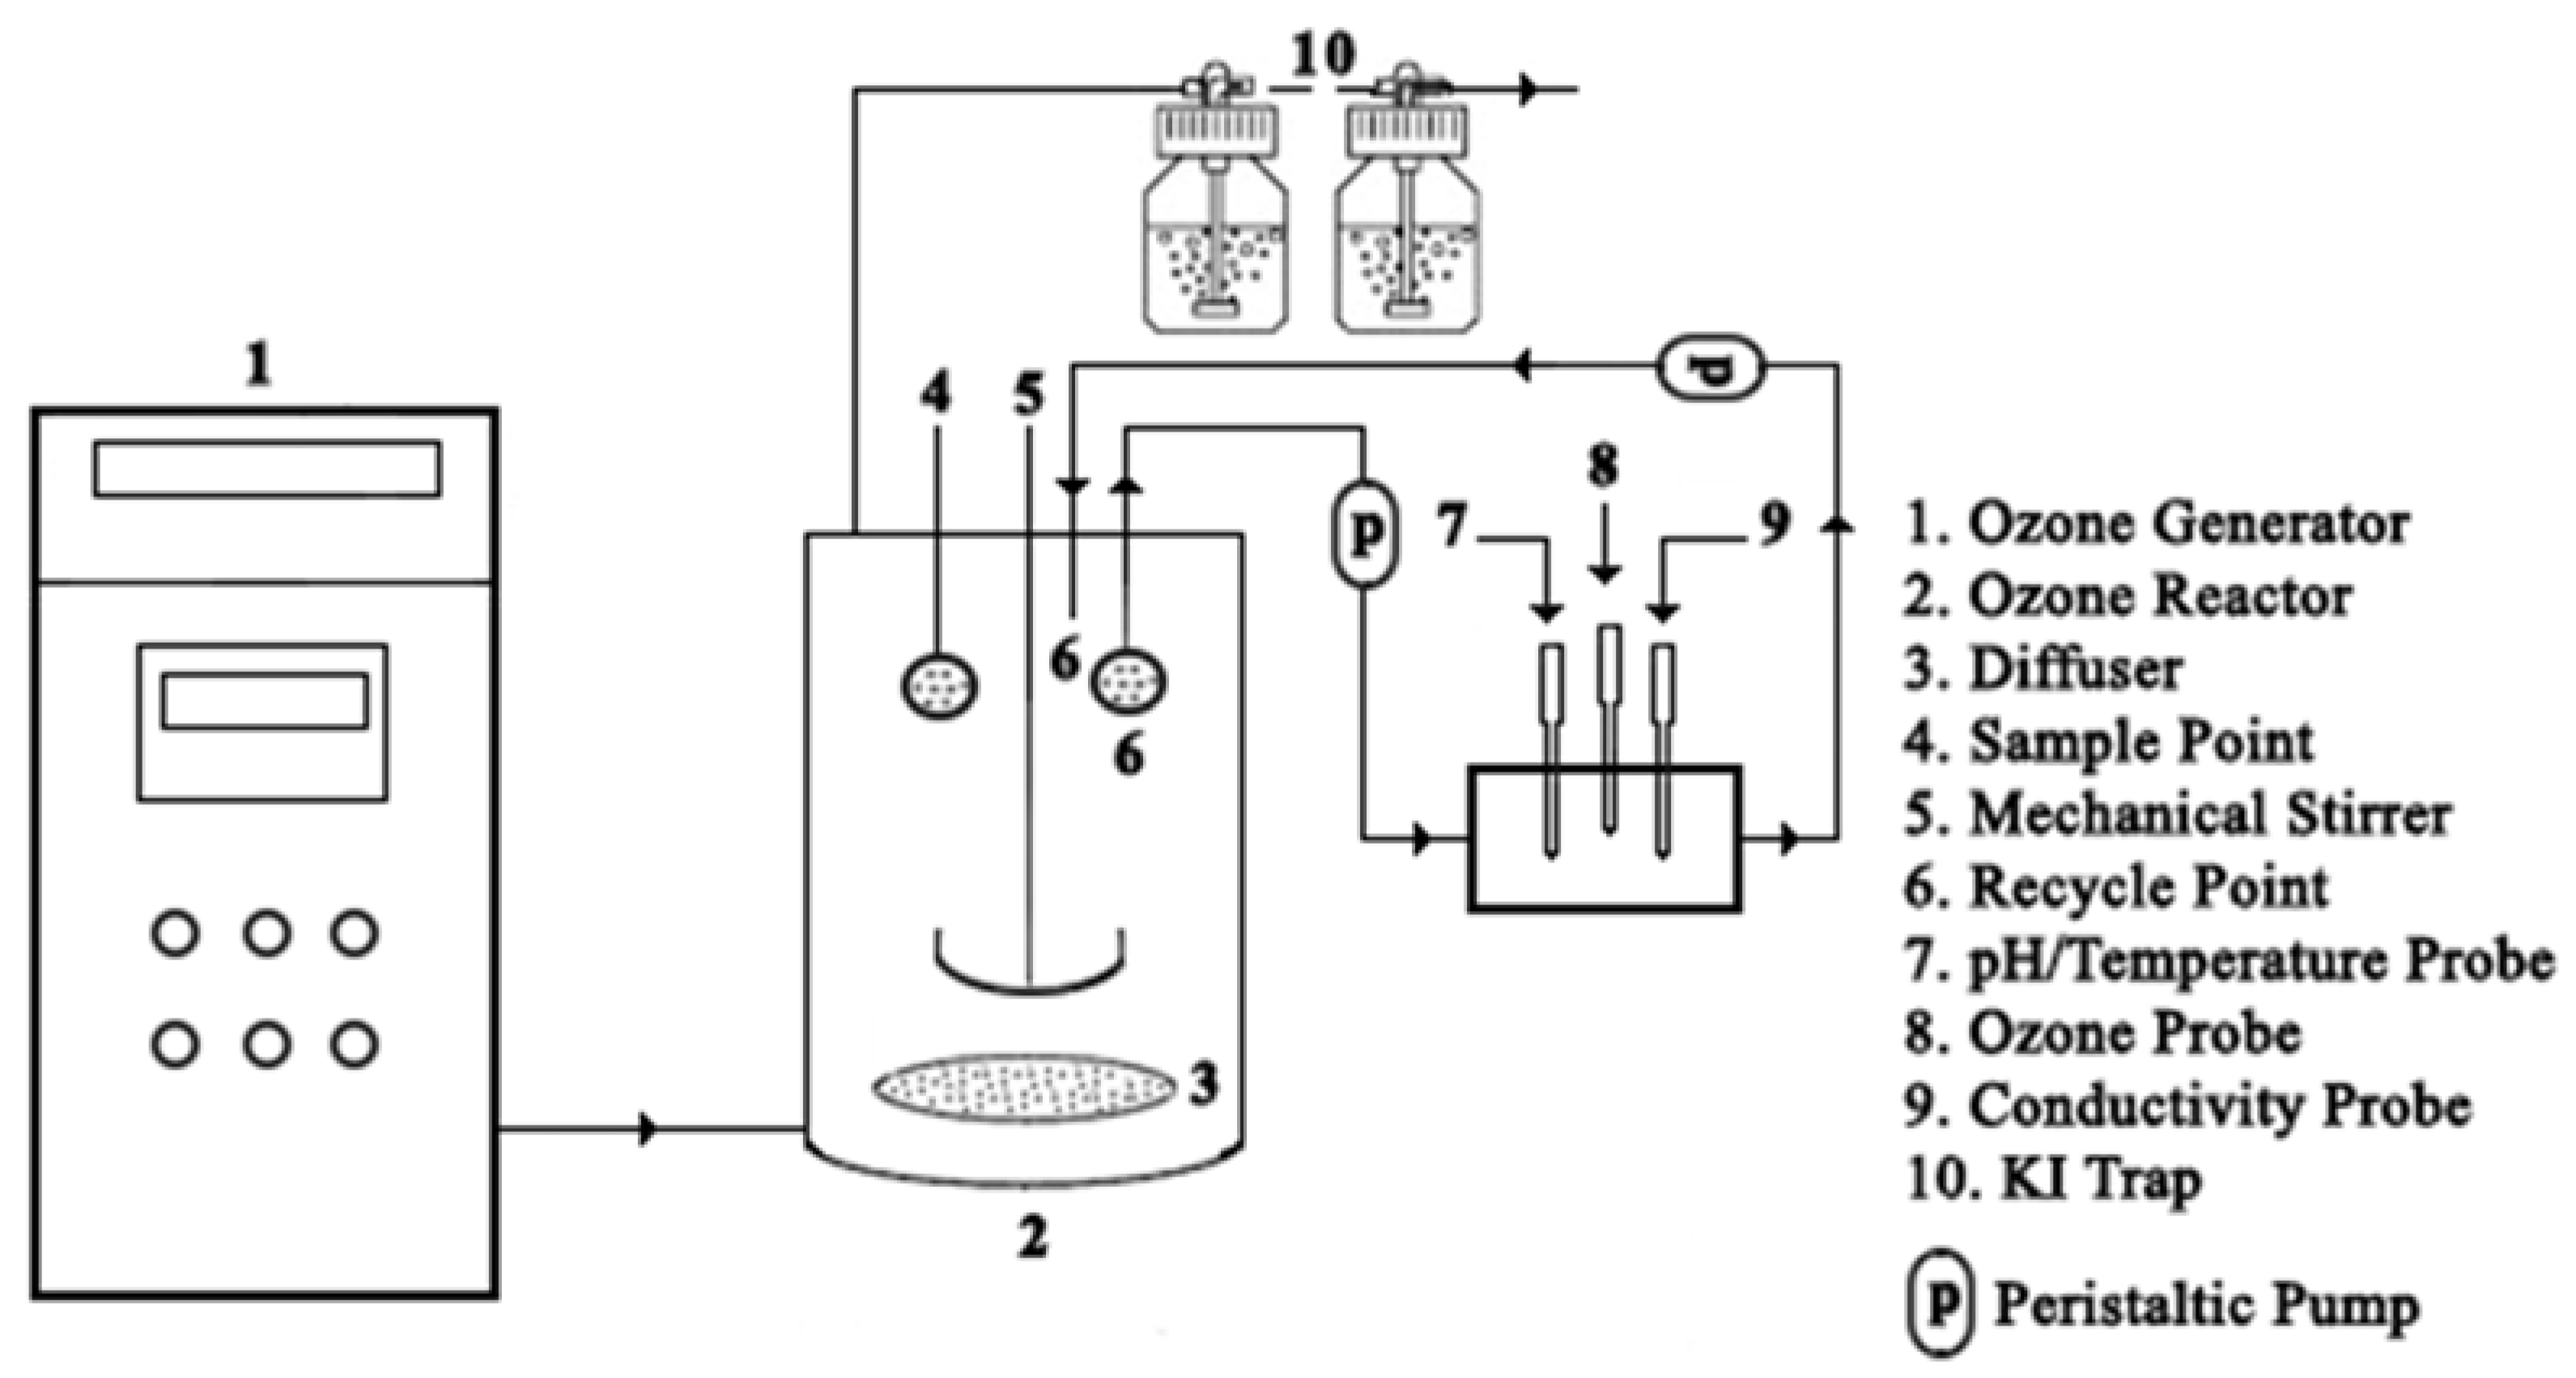
Catalytic ozone experiments were carried out in a 1000 mL cylindrical glass bubble reactor (80 mm i.d.) operated in a batch mode. The temperature was controlled by immersion of the reactor in a thermostatic batch. The reactor was covered with a light-proof material in order to avoid daylight. All connections of the ozonation system are either polytetrafluoroethylene (PTFE) or 316-grade stainless steel, to prevent ozone oxidation. A schematic representation of the experimental setup is given in Figure 16. Experiments were conducted in a batch mode at room temperature (22 °C). Ozone gas was produced by an oxygen concentrator equipped a PRO DO 20 ozone generator (PRODA Group, Ankara, Turkey), and 0.333 g min−1 of ozone gas was fed into the reactor from the bottom with a PTFE porous diffuser in the form fine bubbles, to achieve the desired concentration. All gaseous ozone escaping from the top of the reactor was captured in gas wash bottles filled with a 10% potassium iodide (KI) solution. A stock solution of humic acid and the catalyst particles were then immediately added into the reactor. The continuous mixture was provided with a mechanical stirrer rotating at 600 rpm. Samples collected at predetermined time intervals were immediately quenched into an excess of the Na2S2O3 solution to prevent ozone interference, and filtered through a 0.45 µm filter prior to DOC analysis. The dissolved ozone concentration in the liquid phase was constantly monitored with a JUMO AQUIS 500 AS ozone analyzer (JUMO Corp. Group, Fulda, Germany), according to ASTM D7677 Standard Methods [43]. Also, the THMFP and HAAFP analyses were performed on the samples.
Different concentrations of variables and initial pH values were applied to investigate the reaction kinetics of catalytic ozonation. Given the high speed and efficiency reaction of organic substances with ozone, reaction kinetics were determined according to initial rate. All the ozonation experiments were carried out in triplicate.
Tert-butyl alcohol (TBA) was applied in the study as a radical scavenger to extinguish OH•, and further restrict the ozonation indirect radical pathway. Tert-BuOH was found to be practically inert toward ozone (kO3 = 3 × 10⁻³ M–1 s–1), while it acts as an OH• scavenger (kOH ≤ 6 × 10⁸ M–1 s–1) and inhibits the chain reaction between radicals and HAs. Additionally, 50, 100, and 250 mL L–1 of TBA was added to the aqueous solutions to extinguish OH• for the investigation of reaction rates of the HA ozonation direct pathway [44]. The DOC amount which is composed of TBA was eliminated in the DOC analyzes.
The sole adsorption and ozonation experiments were carried out in the same experimental conditions using the optimal contaminants, ozone, and catalyst dosages determined in the catalytic ozonation experiments, to determine the influence of catalytic ozonation process.
3.3. Analytical Methods
The physical properties of the catalyst samples were detected based on the BET method, using an accelerated surface area and porosimetry instrument (Micromeritics TriStar II Plus, Norcross, GA, USA). A TEM analyzer (JEM-2100 Plus, Tokyo, Japan) was used for directly imaging materials to obtain quantitative measures of particle size, size distribution, and morphology. The crystalline structure of the catalysts was detected with an XRD analyzer (D8 Advance Diffractometer, Bruker AXS, Karlsruhe, Germany). The catalyst particle size was determined using a DLS (Malvern Zetasizer Nano ZS, Malvern, UK). The infrared spectra of catalysts were analyzed using an FT-IR spectrum instrument (Bruker Vertex 70, Bruker Optics GmbH, Faellanden, Switzerland). The pH at the point of zero charges (pHPZC) was measured using a mass titration method [45,46].
A total organic carbon (TOC) analyzer (Shimadzu TOC-VCPH, Kyoto, Japan) was used to measure the dissolved organic carbon (DOC) of the samples, as described in Standard Methods 5310 B [47].
4. Conclusions
This research study involves the efficient removal of HA by catalytic ozonation using ICP. Coating of the pumice with iron increased the BET surface area and surface hydroxyl concentration, and reduced the SiO2/metal oxide mass ratio and average pore diameter. The porous structure of the ICP catalyst is an important parameter for the adsorption of ozone. The hydroxyl groups on the metal oxide are active sites where the ozone is decomposed. The uncharged hydroxyl groups present on the catalyst surface benefit the catalytic activity.
A significant increase in NOM removal efficiency was observed with ozonation in ICP catalysis, compared to individual ozone. The degradation of HA by heterogeneous catalytic ozonation was investigated under different experimental conditions. pH is an important factor in the stability of the ozone in the liquid phase, as well as the way the ozonation process occurs. The critical pH value for each chemical compound in the liquid phase is defined and known to be variable for different solutions. Oxidation reactions are dependent on molecular ozone while below the critical pH level and OH• above. Compared with acidic conditions, under alkaline conditions, hydroxyl anions are used as ozone decomposition accelerators, which leads to faster OH formation. This is evidence that the oxidation process is occurring faster at basic pH, but that the resulting radicals are less selective. Although the basic environment positively affects catalytic ozone, neutral pH values close to the pHPZC value of the catalyst may be preferred. The initial HA concentration appears to be a function of the rate of catalytic ozonation disruption. HA degradation is increased due to increased initial pollutant concentration. The L-H model was applied according to HA concentrations. kL-H is determined as 1.7047 mg L−1min−1 and kads is 0.0363 L mg−1. Optimum catalyst dosage is one of the main factors affecting the efficiency of catalytic ozonation. HA degradation acceleration is generally increased by increasing the catalyst dose, but after acceleration of the catalyst dose to 0.050 g L−1, this acceleration slows down. The presence of different inorganic contaminants in the environment during HA degradation lowers HA degradation efficiency. Therefore, it can be said that the catalytic reactions are predominantly in the solution phase when ksolution (1.29 × 10⁻⁴ min−1) and kinterface (0.09 × 10⁻⁴ min−1) are compared. At the same time the stability of the catalyst was investigated, and repeated use of the catalyst, according to the observed ten repetitions, does not cause a great difference in the HA degradation, so the catalyst can be said to be stable.
The model used in the study has an inhibitory effect on the HA degradation of TBA, which is similar to the organic pollutant, and is known as a radical scavenger. The presence of TBA in singular ozonation processes inhibits HA degradation performance by 12.99%, while this rate increases to 66.22% in catalytic ozonation processes. In catalytic ozonation, OH is responsible for HA degradation, and the inhibition effect is more pronounced in these processes, as more OH• formation is observed than in single ozonation.
Author Contributions
The following statements should be used A.A. and A.K. conceived and designed the experiments; A.A. performed the experiments; A.A. and A.K. analyzed the data; A.A. and A.K. wrote the paper.
Acknowledgments
We would like to thank the Environmental Engineering Department of Aksaray University for funding this paper and support us. The authors thank Emine BAŞTÜRK for her technical assistance in the lab work. Thanks are due to a range of people who gave advice, offered comments or help in other ways during this paper. This work was supported by Scientific Research Projects Coordination Unit of Aksaray University. The project number is 2015-050.
Conflicts of Interest
The authors declare no conflict of interest. The founding sponsors had no role in the design of the study; in the collection, analyses, or interpretation of data; in the writing of the manuscript, and in the decision to publish the results.
References
- Abdelhalim, N.H.; Imam, E.H.; Nour, M.H. Fate of natural organic matter and formation of disinfection byproducts in a conventional water treatment plant. Proc. Water Environ. Fed. 2014, 2014, 2703–2718. [Google Scholar] [CrossRef]
- Matilainen, A.; Sillanpää, M. Removal of natural organic matter from drinking water by advanced oxidation processes. Chemosphere 2010, 80, 351–365. [Google Scholar] [CrossRef] [PubMed]
- Sillanpää, M. Natural Organic Matter in Water: Characterization and Treatment Methods; Butterworth-Heinemann: Oxford, UK, 2014. [Google Scholar]
- Kim, J.K.; Alajmy, J.; Borges, A.C.; Joo, J.C.; Ahn, H.; Campos, L.C. Degradation of Humic Acid by Photocatalytic Reaction Using Nano-sized ZnO/Laponite Composite (NZLC). Water Air Soil Pollut. 2013, 224, 1749. [Google Scholar] [CrossRef]
- Xu, B.; Qi, F.; Zhang, J.; Li, H.; Sun, D.; Robert, D.; Chen, Z. Cobalt modified red mud catalytic ozonation for the degradation of bezafibrate in water: Catalyst surface properties characterization and reaction mechanism. Chem. Eng. J. 2016, 284, 942–952. [Google Scholar] [CrossRef]
- Yuan, L.; Shen, J.; Chen, Z.; Guan, X. Role of Fe/pumice composition and structure in promoting ozonation reactions. Appl. Catal. B Environ. 2016, 180, 707–714. [Google Scholar] [CrossRef]
- Yuan, L.; Shen, J.; Chen, Z.; Liu, Y. Pumice-catalyzed ozonation degradation of p-chloronitrobenzene in aqueous solution. Appl. Catal. B Environ. 2012, 117, 414–419. [Google Scholar] [CrossRef]
- Oh, W.-D.; Dong, Z.; Lim, T.-T. Generation of sulfate radical through heterogeneous catalysis for organic contaminants removal: Current development, challenges and prospects. Appl. Catal. B Environ. 2016, 194, 169–201. [Google Scholar] [CrossRef]
- Kaplan Bekaroglu, S.S.; Yigit, N.O.; Harman, B.I.; Kitis, M. Hybrid adsorptive and oxidative removal of natural organic matter using iron oxide-coated pumice particles. J. Chem. 2016, 2016, 3108034. [Google Scholar] [CrossRef]
- Chen, C.; Chen, Y.; Yoza, B.A.; Du, Y.; Wang, Y.; Li, Q.X.; Yi, L.; Guo, S.; Wang, Q. Comparison of efficiencies and mechanisms of catalytic ozonation of recalcitrant petroleum refinery wastewater by Ce, Mg, and Ce-Mg oxides loaded Al2O3. Catalysts 2017, 7, 72. [Google Scholar] [CrossRef]
- Nawrocki, J.; Kasprzyk-Hordern, B. The efficiency and mechanisms of catalytic ozonation. Appl. Catal. B Environ. 2010, 99, 27–42. [Google Scholar] [CrossRef]
- Li, F.; Liang, J.; Zhu, W.; Song, H.; Wang, K.; Li, C. In-situ liquid hydrogenation of m-chloronitrobenzene over Fe-modified Pt/carbon nanotubes catalysts. Catalysts 2018, 8, 62. [Google Scholar] [CrossRef]
- Zhang, X.; Yang, Y.; Lv, X.; Wang, Y.; Cui, L. Effects of preparation method on the structure and catalytic activity of Ag–Fe2O3 catalysts derived from MOFs. Catalysts 2017, 7, 382. [Google Scholar] [CrossRef]
- Martins, R.C.; Ramos, C.M.; Quinta-Ferreira, R.M. Low-cost catalysts to enhance ozone action on the depuration of olive mill wastewaters. Ind. Eng. Chem. Res. 2014, 53, 15357–15368. [Google Scholar] [CrossRef]
- Gomes, J.F.; Quinta-Ferreira, M.E.; Costa, R.; Quinta-Ferreira, R.M.; Martins, R.C. Paraben degradation using catalytic ozonation over volcanic rocks. Environ. Sci. Pollut. Res. 2018, 25, 7346–7357. [Google Scholar] [CrossRef] [PubMed]
- Kitis, M.; Kaplan, S. Advanced oxidation of natural organic matter using hydrogen peroxide and iron-coated pumice particles. Chemosphere 2007, 68, 1846–1853. [Google Scholar] [CrossRef] [PubMed]
- Magario, I.; Einschlag, F.G.; Rueda, E.; Zygadlo, J.; Ferreira, M. Mechanisms of radical generation in the removal of phenol derivatives and pigments using different Fe-based catalytic systems. J. Mol. Catal. A Chem. 2012, 352, 1–20. [Google Scholar] [CrossRef]
- Alver, A.; Karaarslan, M.; Kılıç, A. The catalytic activity of the iron-coated pumice particles used as heterogeneous catalysts in the oxidation of natural organic matter by H2O2. Environ. Technol. 2016, 37, 2040–2047. [Google Scholar] [CrossRef] [PubMed]
- Krehula, S.; Musić, S. The influence of Cd-dopant on the properties of α-FeOOH and α-Fe2O3 particles precipitated in highly alkaline media. J. Alloy. Compd. 2007, 431, 56–64. [Google Scholar] [CrossRef]
- Lan, B.; Huang, R.; Li, L.; Yan, H.; Liao, G.; Wang, X.; Zhang, Q. Catalytic ozonation of p-chlorobenzoic acid in aqueous solution using Fe-MCM-41 as catalyst. Chem. Eng. J. 2013, 219, 346–354. [Google Scholar] [CrossRef]
- Zhao, W.; Zhang, S.; Ding, J.; Deng, Z.; Guo, L.; Zhong, Q. Enhanced catalytic ozonation for NOx removal with CuFe2O4 nanoparticles and mechanism analysis. J. Mol. Catal. A Chem. 2016, 424, 153–161. [Google Scholar] [CrossRef]
- Gao, G.; Shen, J.; Chu, W.; Chen, Z.; Yuan, L. Mechanism of enhanced diclofenac mineralization by catalytic ozonation over iron silicate-loaded pumice. Sep. Purif. Technol. 2017, 173, 55–62. [Google Scholar] [CrossRef]
- Yang, Y.; Ma, J.; Qin, Q.; Zhai, X. Degradation of nitrobenzene by nano-TiO2 catalyzed ozonation. J. Mol. Catal. A Chem. 2007, 267, 41–48. [Google Scholar] [CrossRef]
- Valdes, H.; Murillo, F.; Manoli, J.; Zaror, C. Heterogeneous catalytic ozonation of benzothiazole aqueous solution promoted by volcanic sand. J. Hazard. Mater. 2008, 153, 1036–1042. [Google Scholar] [CrossRef] [PubMed]
- Wang, Q.; Yang, Z.; Chai, B.; Cheng, S.; Lu, X.; Bai, X. Heterogeneous catalytic ozonation of natural organic matter with goethite, cerium oxide and magnesium oxide. RSC Adv. 2016, 6, 14730–14740. [Google Scholar] [CrossRef]
- Yang, L.; Liya, E.Y.; Ray, M.B. Degradation of paracetamol in aqueous solutions by TiO2 photocatalysis. Water Res. 2008, 42, 3480–3488. [Google Scholar] [CrossRef] [PubMed]
- Li, X.; Fan, C.; Sun, Y. Enhancement of photocatalytic oxidation of humic acid in TiO2 suspensions by increasing cation strength. Chemosphere 2002, 48, 453–460. [Google Scholar] [CrossRef]
- Uyguner, C.S.; Bekbolet, M. A comparative study on the photocatalytic degradation of humic substances of various origins. Desalination 2005, 176, 167–176. [Google Scholar] [CrossRef]
- Pirgalıoğlu, S.; Özbelge, T.A. Comparison of non-catalytic and catalytic ozonation processes of three different aqueous single dye solutions with respect to powder copper sulfide catalyst. Appl. Catal. A Gen. 2009, 363, 157–163. [Google Scholar] [CrossRef]
- Daifullah, A.; Girgis, B.; Gad, H. A study of the factors affecting the removal of humic acid by activated carbon prepared from biomass material. Colloids Surf. A Physicochem. Eng. Asp. 2004, 235, 1–10. [Google Scholar] [CrossRef]
- Zouboulis, A.I.; Jun, W.; Katsoyiannis, I.A. Removal of humic acids by flotation. Colloids Surf. A Physicochem. Eng. Asp. 2003, 231, 181–193. [Google Scholar] [CrossRef]
- Ikhlaq, A.; Brown, D.R.; Kasprzyk-Hordern, B. Mechanisms of catalytic ozonation: An investigation into superoxide ion radical and hydrogen peroxide formation during catalytic ozonation on alumina and zeolites in water. Appl. Catal. B Environ. 2013, 129, 437–449. [Google Scholar] [CrossRef]
- Am Water Works Res, F.; Langlais, B.; Reckhow, D.A.; Brink, D.R. Ozone in Water Treatment: Application and Engineering; CRC Press: Boca Raton, FL, USA, 1991. [Google Scholar]
- Hoigné, J.; Bader, H. Rate constants of reactions of ozone with organic and inorganic compounds in water—I: Non-dissociating organic compounds. Water Res. 1983, 17, 173–183. [Google Scholar] [CrossRef]
- Hoigné, J.; Bader, H. Rate constants of reactions of ozone with organic and inorganic compounds in water—II: Dissociating organic compounds. Water Res. 1983, 17, 185–194. [Google Scholar] [CrossRef]
- Halliwell, B.; Gutteridge, J.M. Free Radicals in Biology and Medicine; Oxford University Press: Cary, NC, USA, 2015. [Google Scholar]
- Von Gunten, U. Ozonation of drinking water: Part I. Oxidation kinetics and product formation. Water Res. 2003, 37, 1443–1467. [Google Scholar] [CrossRef]
- Qi, F.; Chen, Z.; Xu, B.; Shen, J.; Ma, J.; Joll, C.; Heitz, A. Influence of surface texture and acid–base properties on ozone decomposition catalyzed by aluminum (hydroxyl) oxides. Appl. Catal. B Environ. 2008, 84, 684–690. [Google Scholar] [CrossRef]
- Li, W.; Qiang, Z.; Zhang, T.; Cao, F. Kinetics and mechanism of pyruvic acid degradation by ozone in the presence of PdO/CeO2. Appl. Catal. B Environ. 2012, 113, 290–295. [Google Scholar] [CrossRef]
- Turkay, O.; Inan, H.; Dimoglo, A. Experimental and theoretical investigations of CuO-catalyzed ozonation of humic acid. Sep. Purif. Technol. 2014, 134, 110–116. [Google Scholar] [CrossRef]
- Lai, C.; Lo, S.; Chiang, H. Adsorption/desorption properties of copper ions on the surface of iron-coated sand using BET and EDAX analyses. Chemosphere 2000, 41, 1249–1255. [Google Scholar] [CrossRef]
- Lai, C.; Chen, C.-Y. Removal of metal ions and humic acid from water by iron-coated filter media. Chemosphere 2001, 44, 1177–1184. [Google Scholar] [CrossRef]
- ASTM International. Annual Book of Astm Standards; American Society for Testing and Materials Annual: Philadelphia, PA, USA, 2004; Volume 4. [Google Scholar]
- Miao, H.; Tao, W.; Cui, F.; Xu, Z.; Ao, Z. Kinetic study of humic acid ozonation in aqueous media. CLEAN Soil Air Water 2008, 36, 893–899. [Google Scholar] [CrossRef]
- Noh, J.S.; Schwarz, J.A. Estimation of the point of zero charge of simple oxides by mass titration. J. Colloid Interface Sci. 1989, 130, 157–164. [Google Scholar] [CrossRef]
- Noh, J.S.; Schwarz, J.A. Effect of HNO3 treatment on the surface acidity of activated carbons. Carbon 1990, 28, 675–682. [Google Scholar] [CrossRef]
- Rice, E.W.; Baird, R.B.; Eaton, A.D.; Clesceri, L. Standard Methods for the Examination of Water and Wastewater; American Public Health Association: Washington, DC, USA, 2012. [Google Scholar]
Figure 1.
EDAX analysis of (a) raw pumice and (b) iron coated pumice.
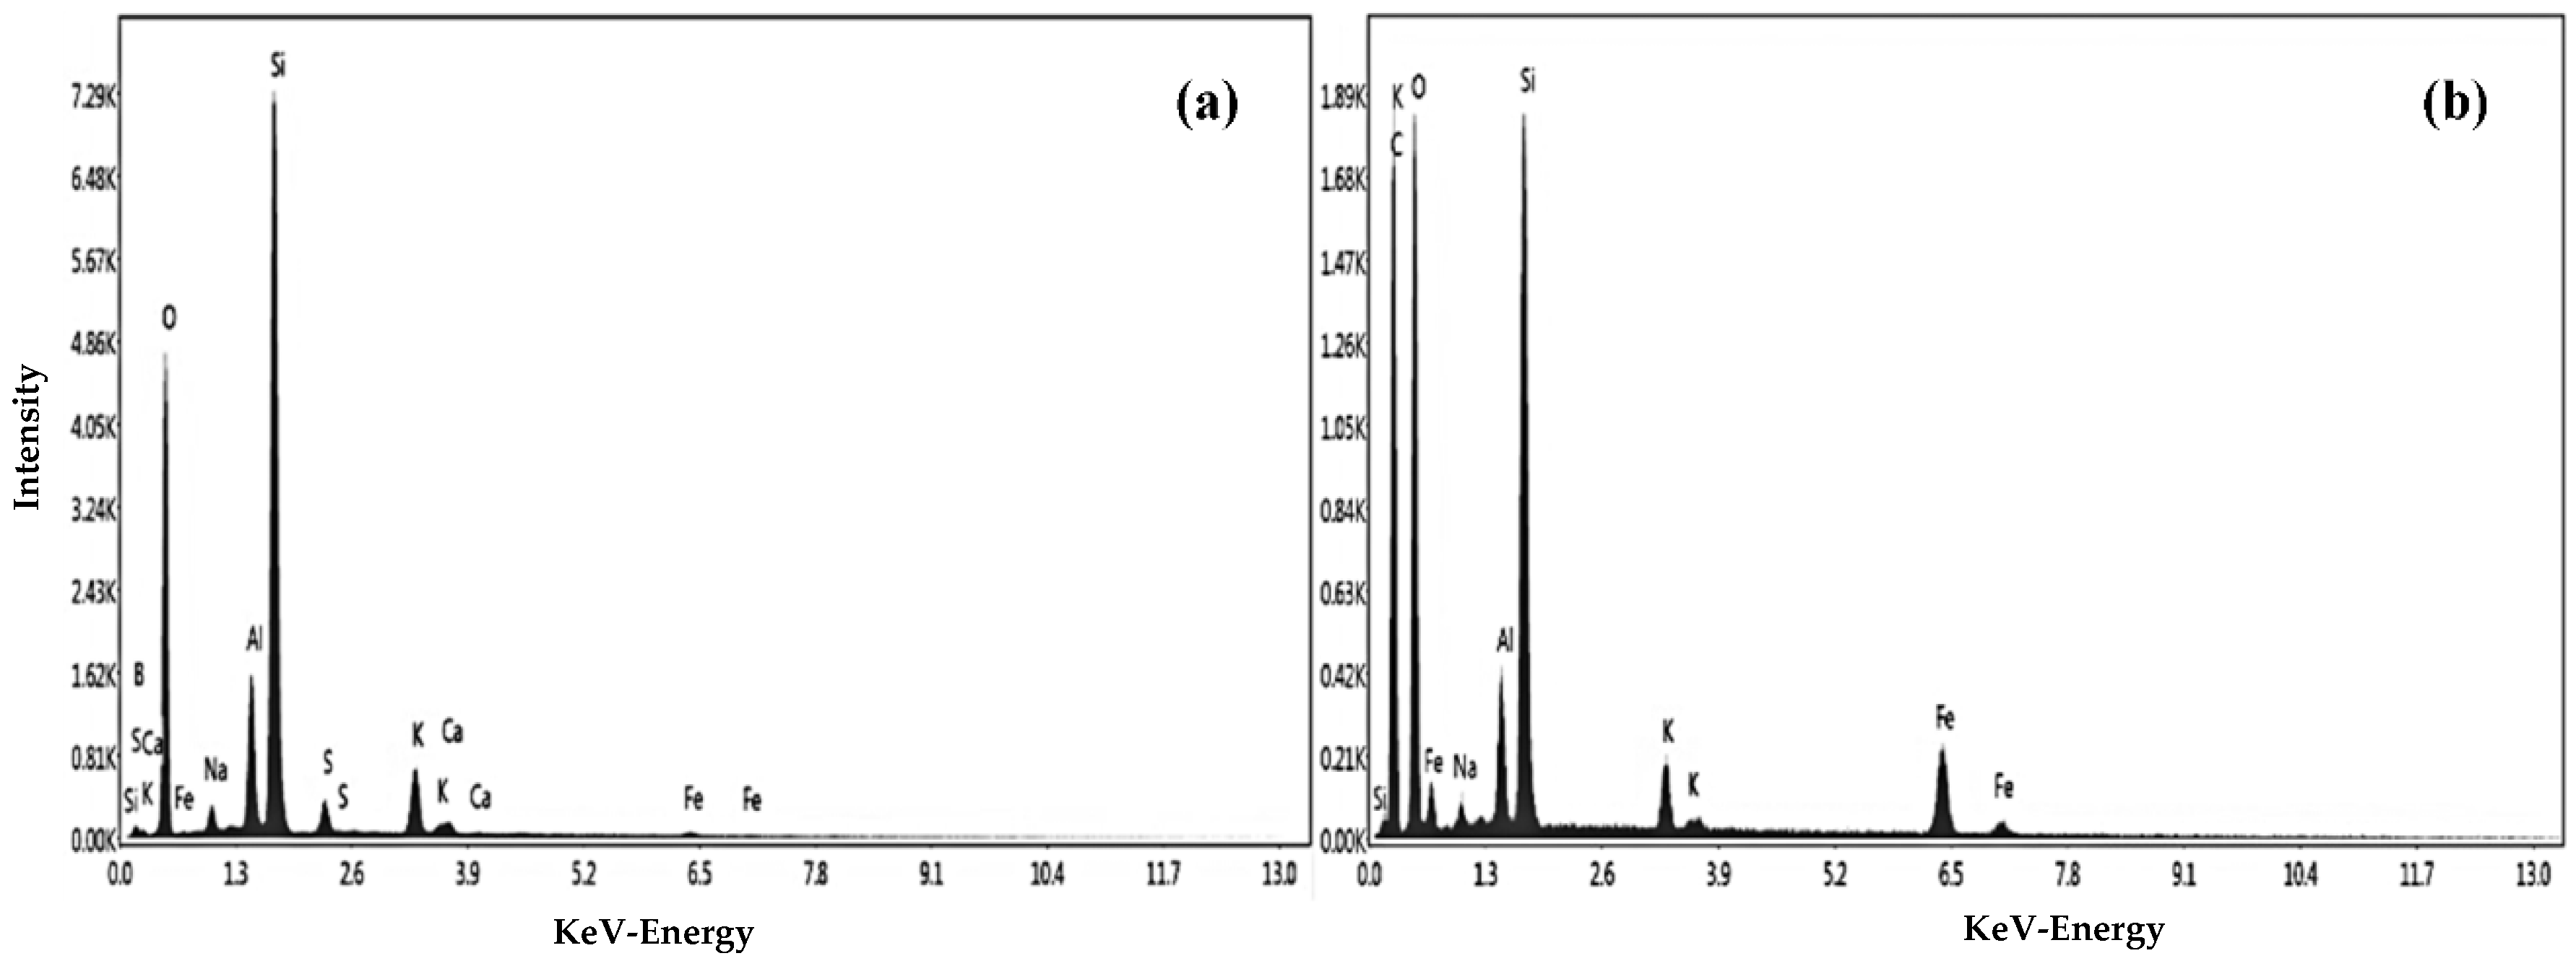
Figure 2.
XRD patterns for raw and iron-coated pumice samples (•: (Ca, Na)(Si, Al)4O8, ▼: Na(Si3Al)O8, ▲: α-Fe2O3, ■: α-FeOOH, ◊: Fe).
Figure 2.
XRD patterns for raw and iron-coated pumice samples (•: (Ca, Na)(Si, Al)4O8, ▼: Na(Si3Al)O8, ▲: α-Fe2O3, ■: α-FeOOH, ◊: Fe).

Figure 3.
FT-IR spectrum of raw and iron-coated pumice samples.

Figure 4.
TEM photograph of the catalyst; (a,b) Raw Pumice and (c,d) Iron Coated Pumice
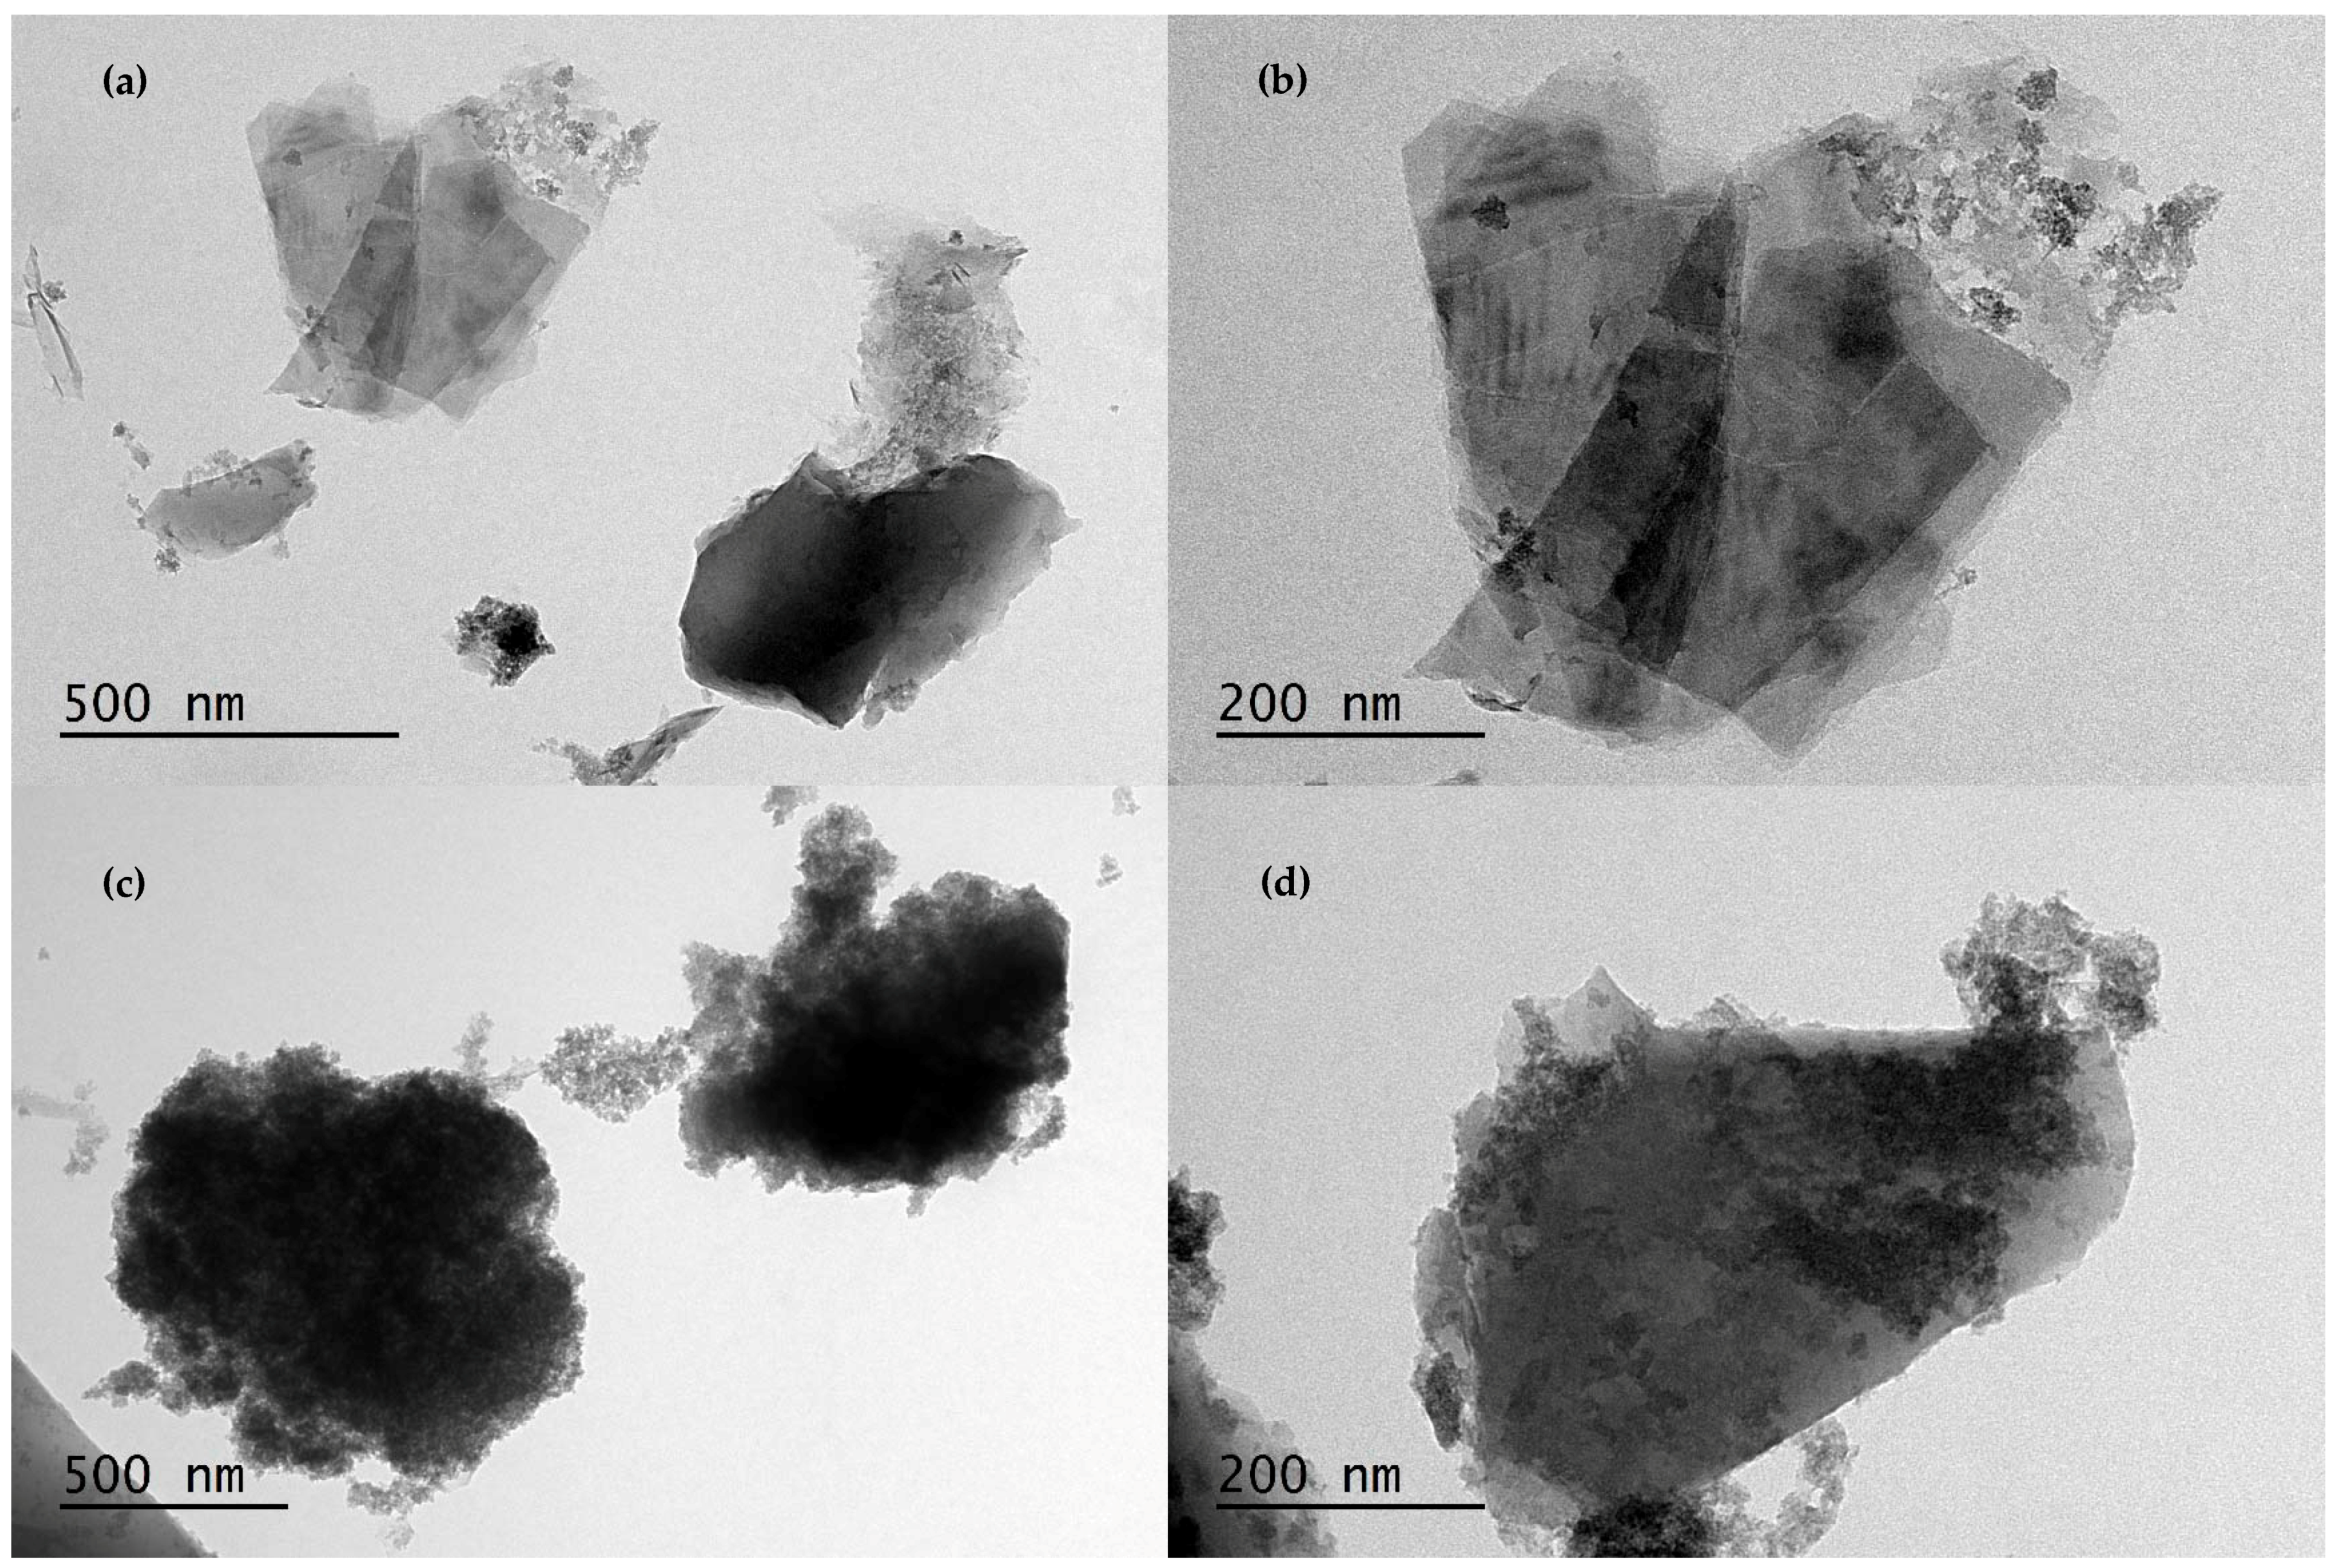
Figure 5.
Promotion of ozone decomposition with different catalyst dosage (The catalyst dosages are given in g L−1, DDW: Deionized and distilled water, Conditions: t = 22 °C, pH = 6.72, [O3] = 10 mg L−1).
Figure 5.
Promotion of ozone decomposition with different catalyst dosage (The catalyst dosages are given in g L−1, DDW: Deionized and distilled water, Conditions: t = 22 °C, pH = 6.72, [O3] = 10 mg L−1).

Figure 6.
Comparison of DOC (dissolved organic carbon) removals among different processes (Conditions: t = 22 °C, pH = 6.72, [HA] = 10 mg L−1, [O3] = 10 mg L−1, [ICP and Raw Pumice] = 0.050 g L−1).
Figure 6.
Comparison of DOC (dissolved organic carbon) removals among different processes (Conditions: t = 22 °C, pH = 6.72, [HA] = 10 mg L−1, [O3] = 10 mg L−1, [ICP and Raw Pumice] = 0.050 g L−1).

Figure 7.
Effect of catalyst dosage on the performance of catalytic ozonation (Catalyst dosages are given in g L−1, [O3] = 10 mg L−1, [HA] = 10 mg L−1, pH = 6.8 ± 0.4, n = 600 rpm).
Figure 7.
Effect of catalyst dosage on the performance of catalytic ozonation (Catalyst dosages are given in g L−1, [O3] = 10 mg L−1, [HA] = 10 mg L−1, pH = 6.8 ± 0.4, n = 600 rpm).

Figure 8.
Effect of ozone dosage on the performance of catalytic ozonation (The ozone dosages are given in mg L−1 Conditions: t = 22 °C, pH = 6.72, [HA] = 10 mg L−1, [Catalyst] = 0.050 g L−1).
Figure 8.
Effect of ozone dosage on the performance of catalytic ozonation (The ozone dosages are given in mg L−1 Conditions: t = 22 °C, pH = 6.72, [HA] = 10 mg L−1, [Catalyst] = 0.050 g L−1).

Figure 9.
Effect of humic acid dosage on the performance of catalytic ozonation (The humic acid dosages are given in mg L−1, [Catalyst] = 0.050 g L−1, [O3] = 10 mg L−1, pH = 6.8 ± 0.4, n = 600 rpm).
Figure 9.
Effect of humic acid dosage on the performance of catalytic ozonation (The humic acid dosages are given in mg L−1, [Catalyst] = 0.050 g L−1, [O3] = 10 mg L−1, pH = 6.8 ± 0.4, n = 600 rpm).
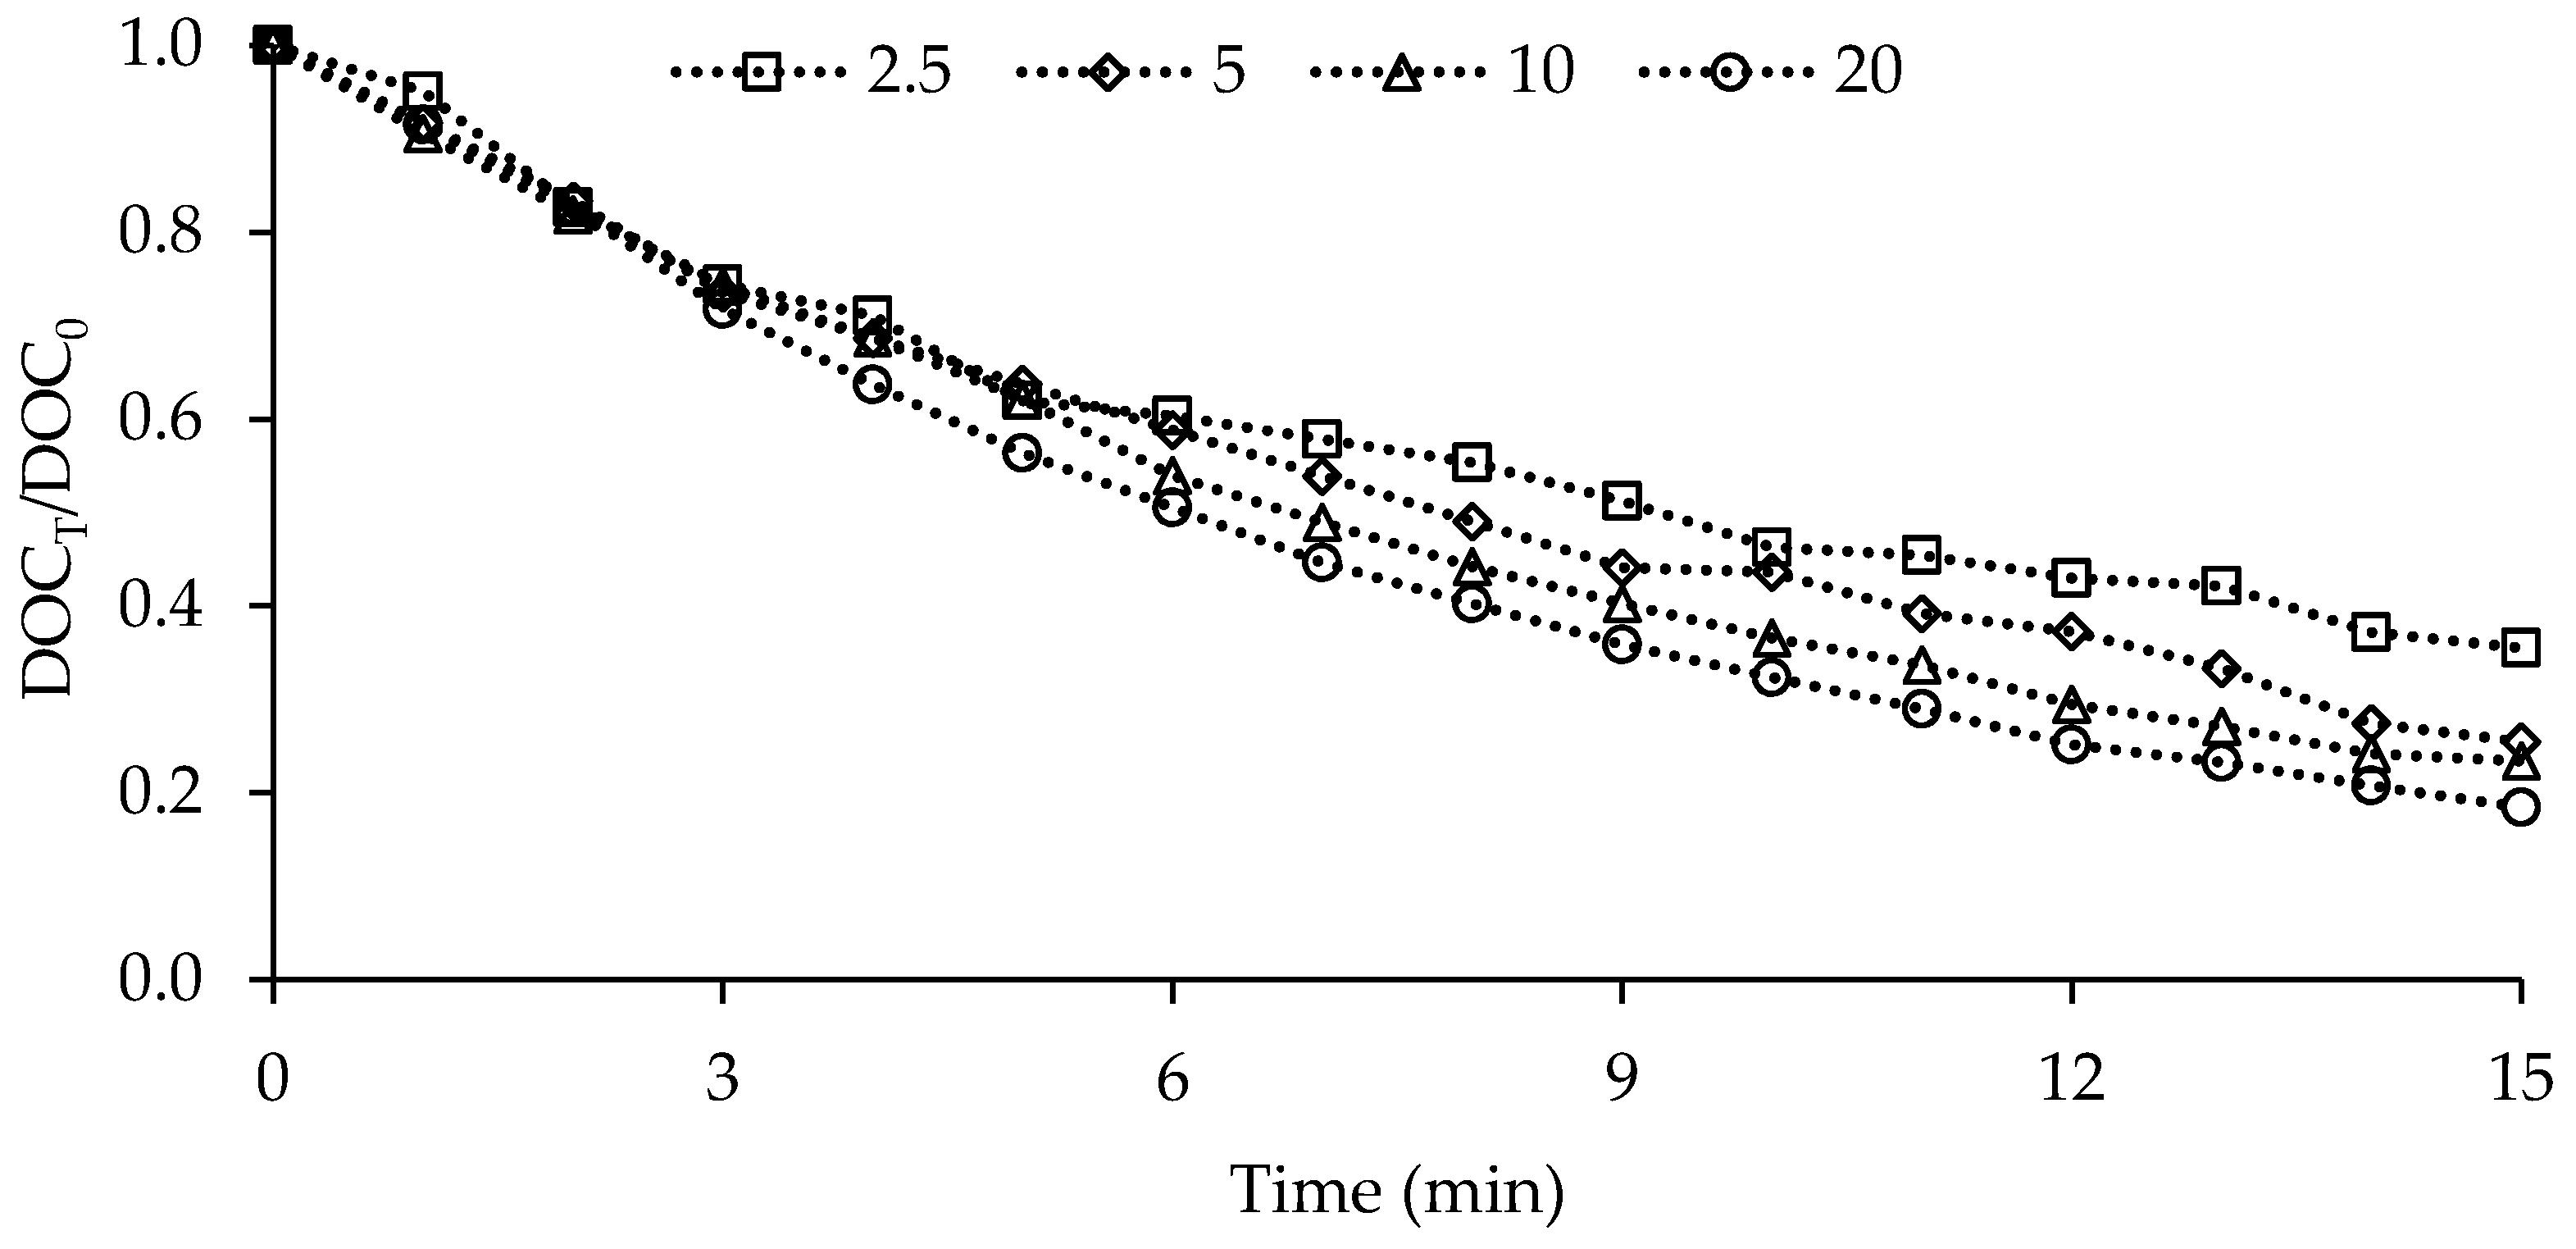
Figure 10.
Effect of initial pH values on the performance of catalytic ozonation ([Catalyst] = 0.050 g L−1, [O3] = 10 mg L−1, [HA] = 10 mg L−1, n = 600 rpm).
Figure 10.
Effect of initial pH values on the performance of catalytic ozonation ([Catalyst] = 0.050 g L−1, [O3] = 10 mg L−1, [HA] = 10 mg L−1, n = 600 rpm).

Figure 11.
Effect of phosphate on the performance of catalytic ozonation.

Figure 12.
Phosphate concentration and linearity of reaction rate constants.
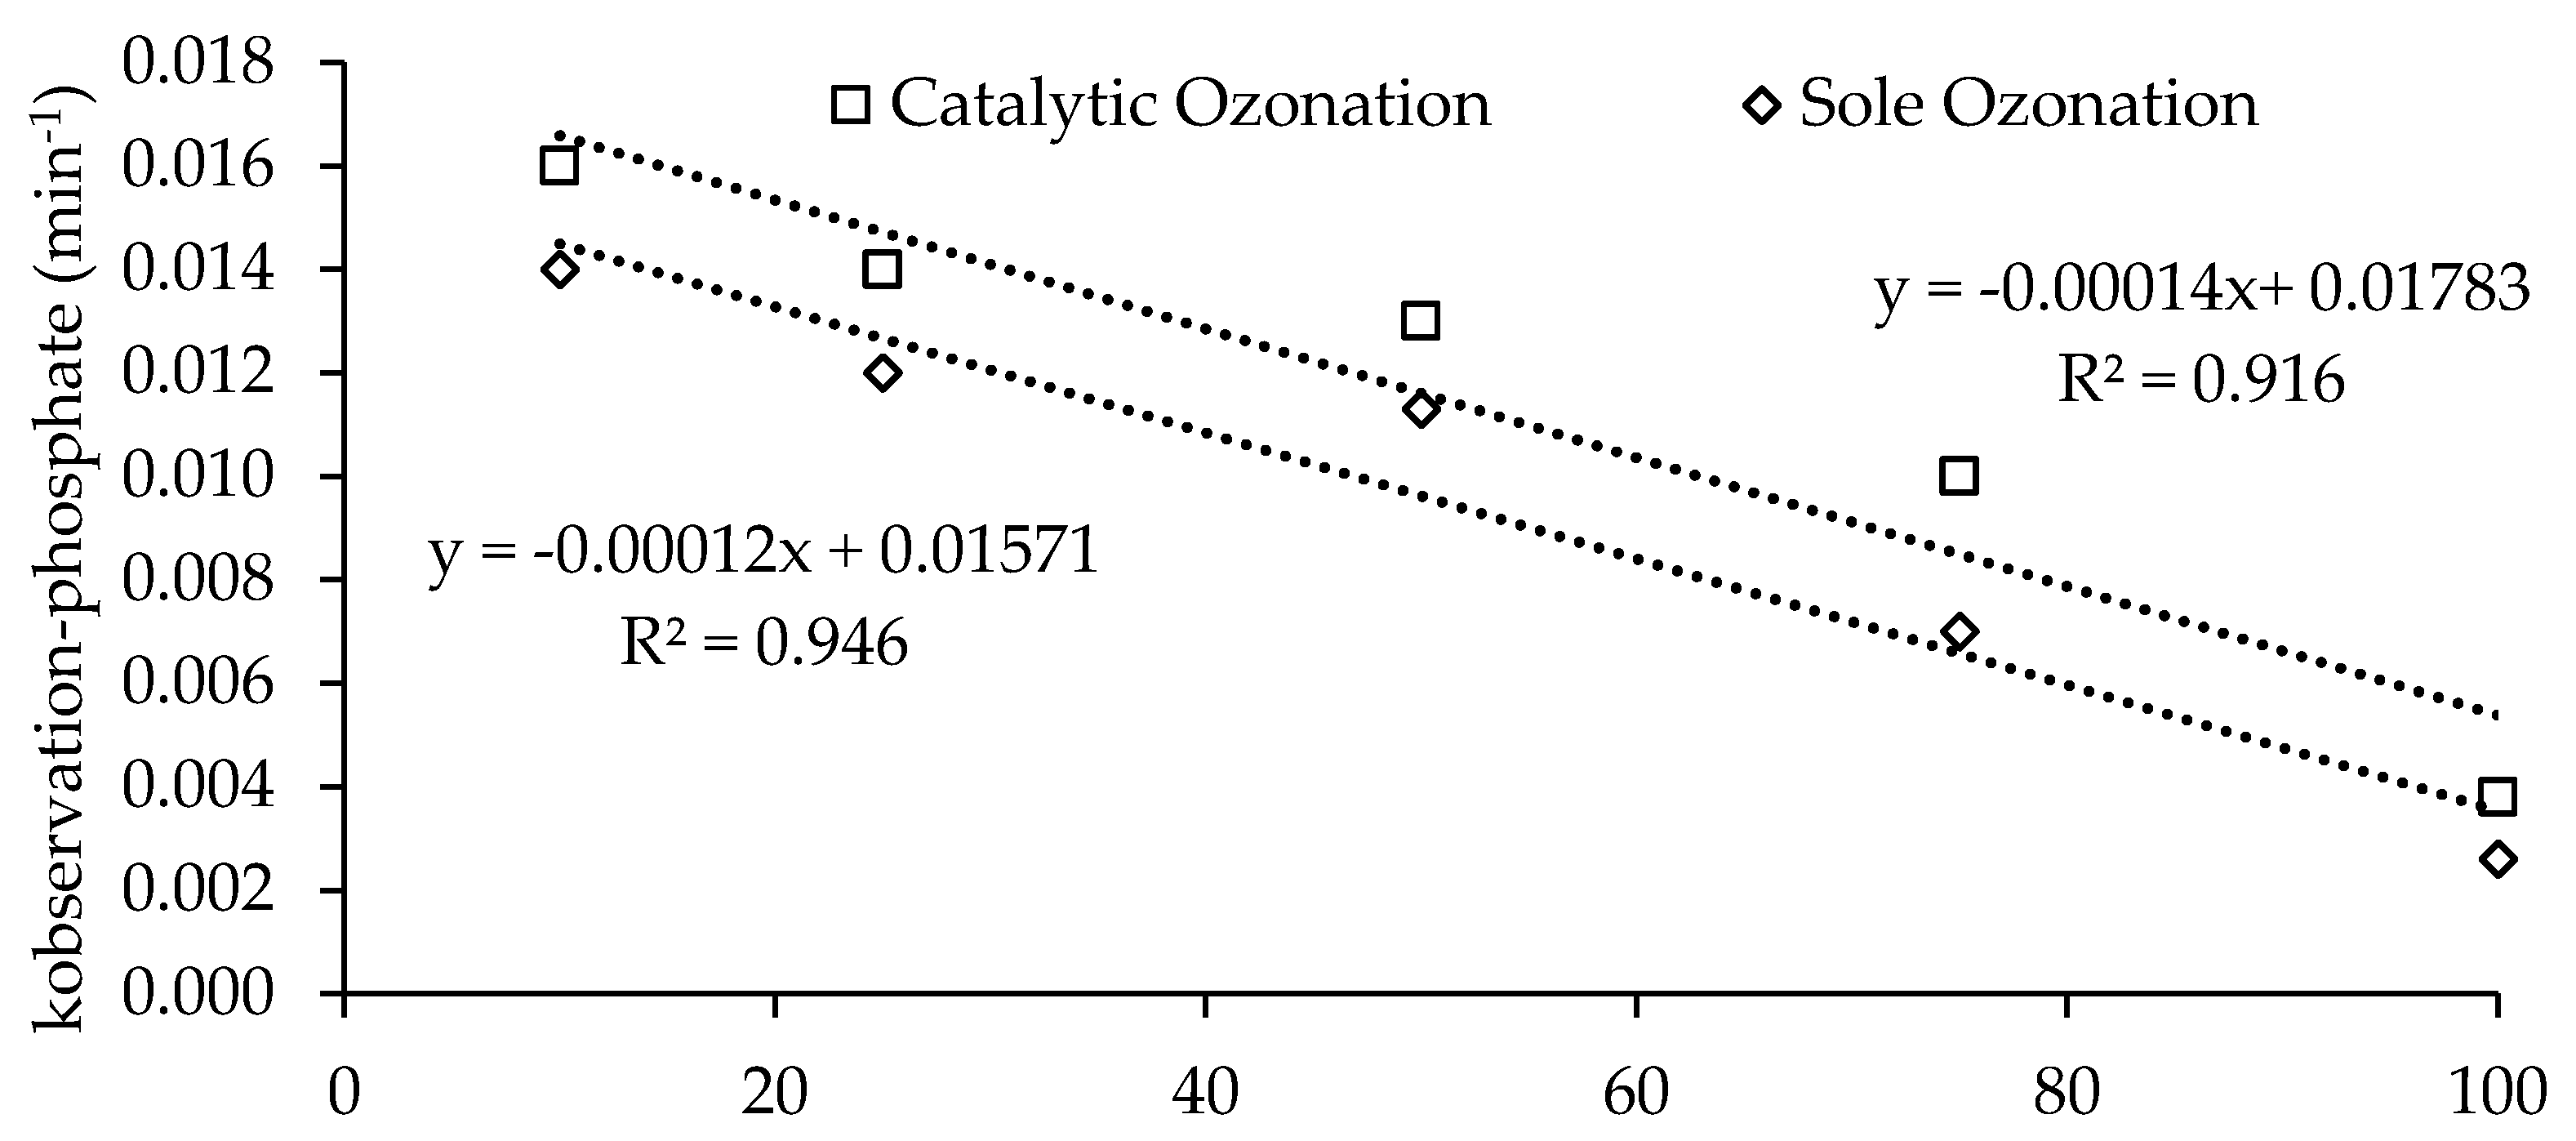
Figure 13.
Effect of TBA on catalytic ozonation process ([HA] = 10 mg L−1, [Catalyst] = 0.050 g L−1, [O3] = 10 mg L−1).
Figure 13.
Effect of TBA on catalytic ozonation process ([HA] = 10 mg L−1, [Catalyst] = 0.050 g L−1, [O3] = 10 mg L−1).
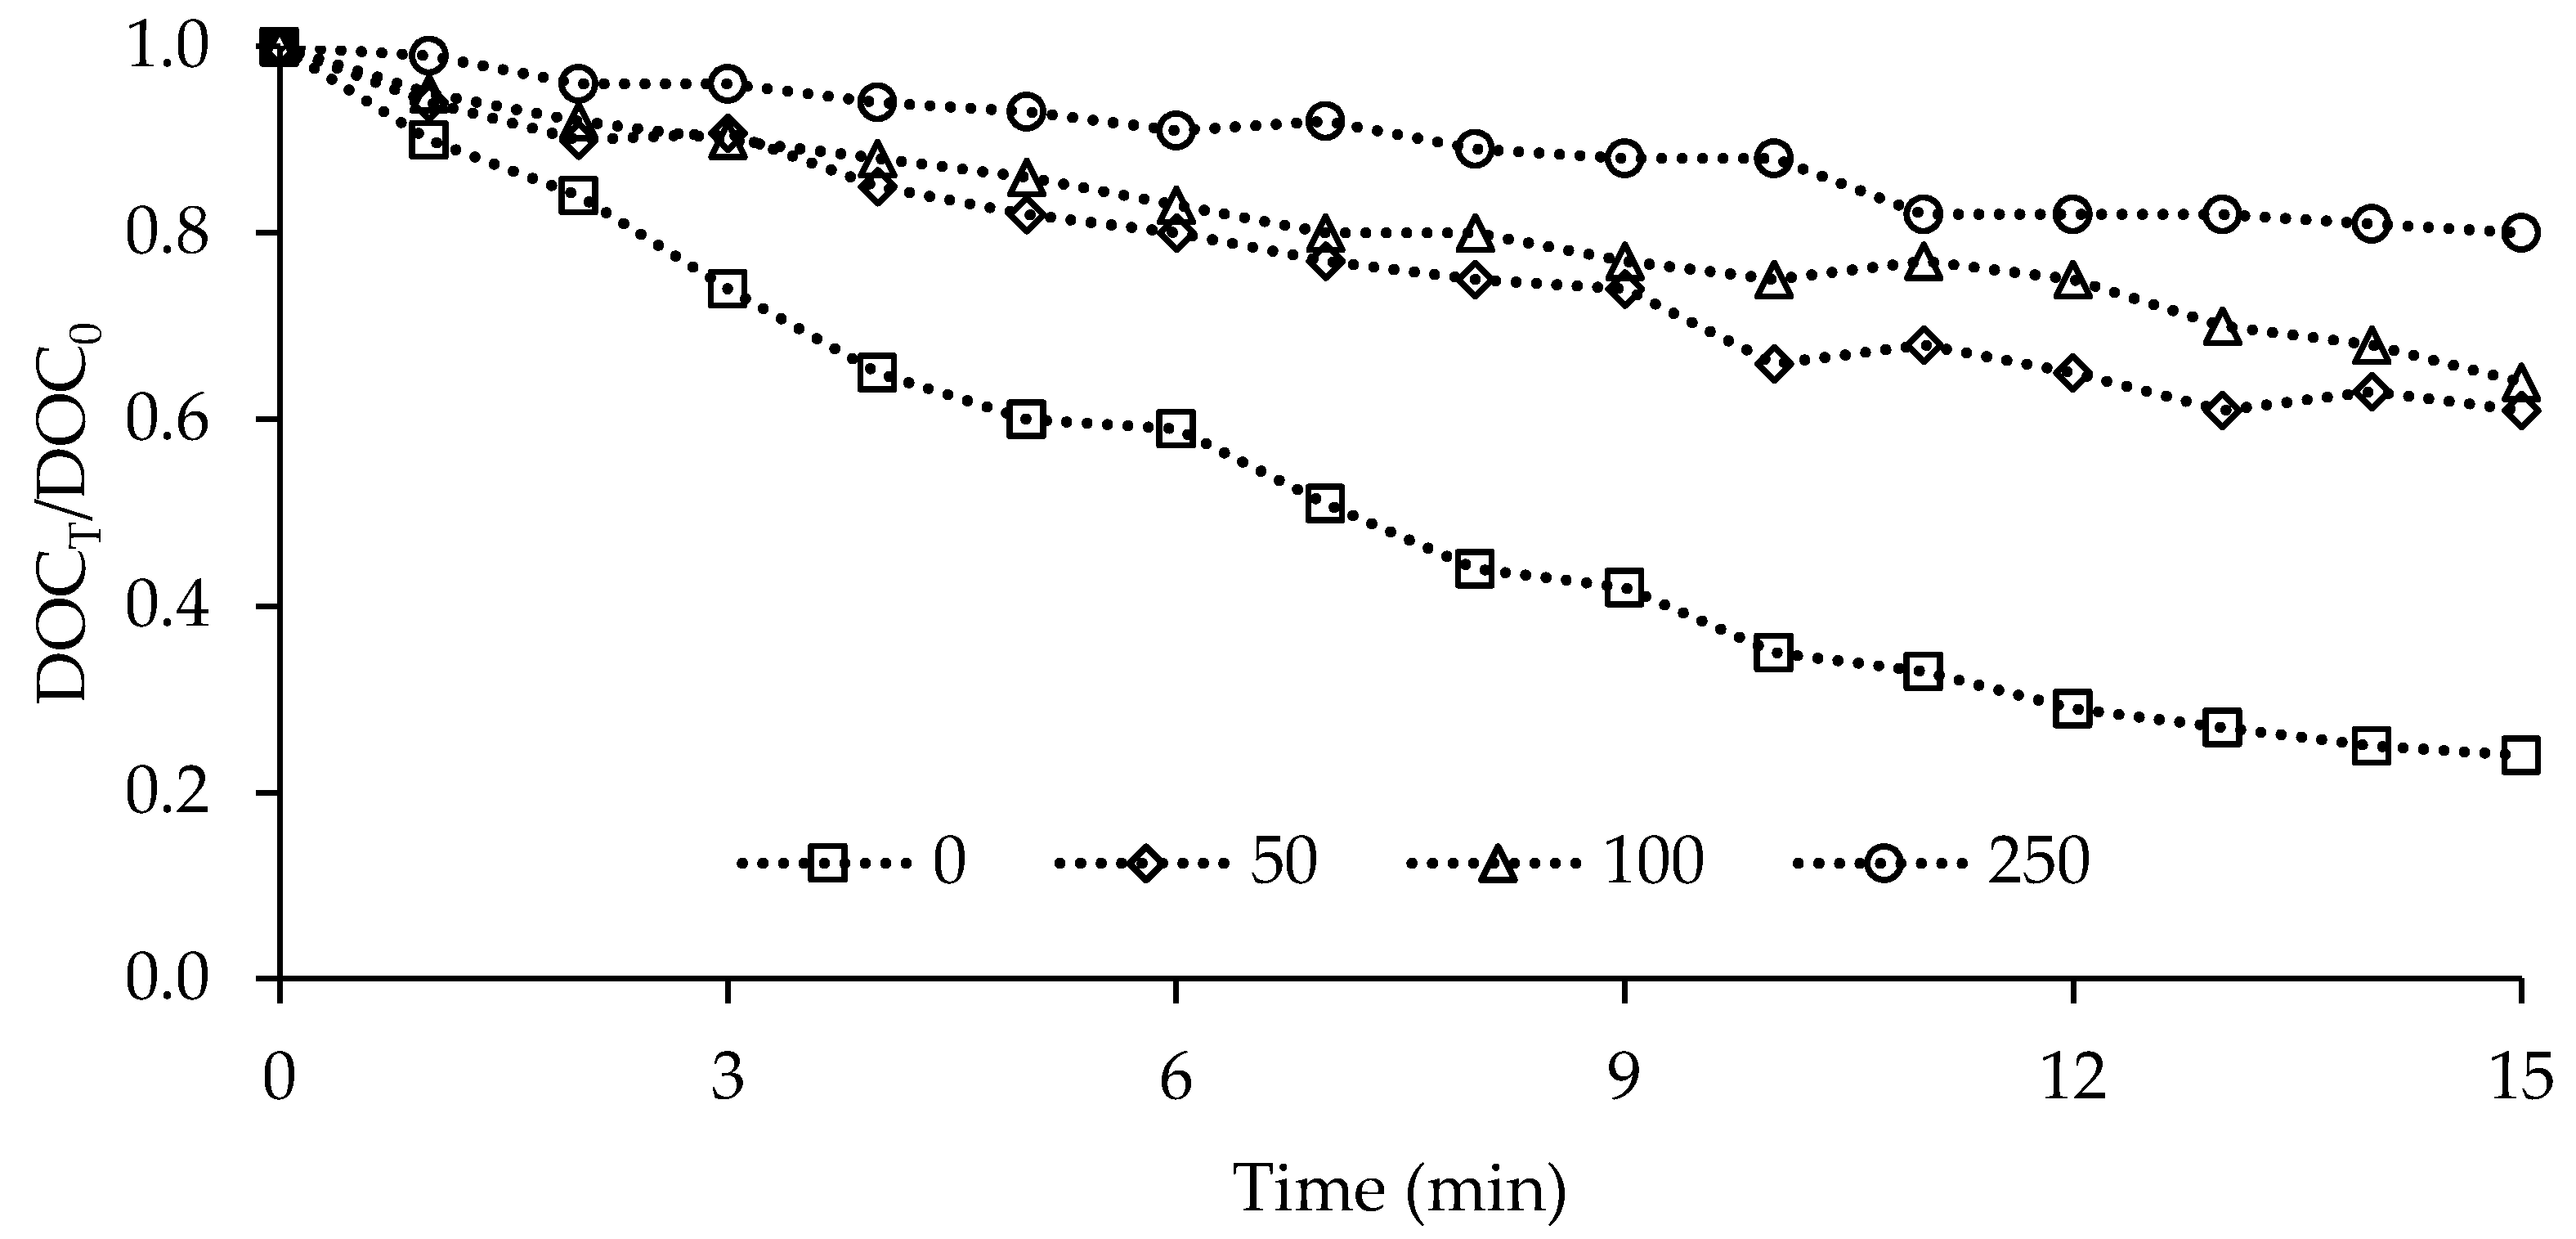
Figure 14.
Change of reaction rate constants depending on the effect of TBA on catalytic ozonation.
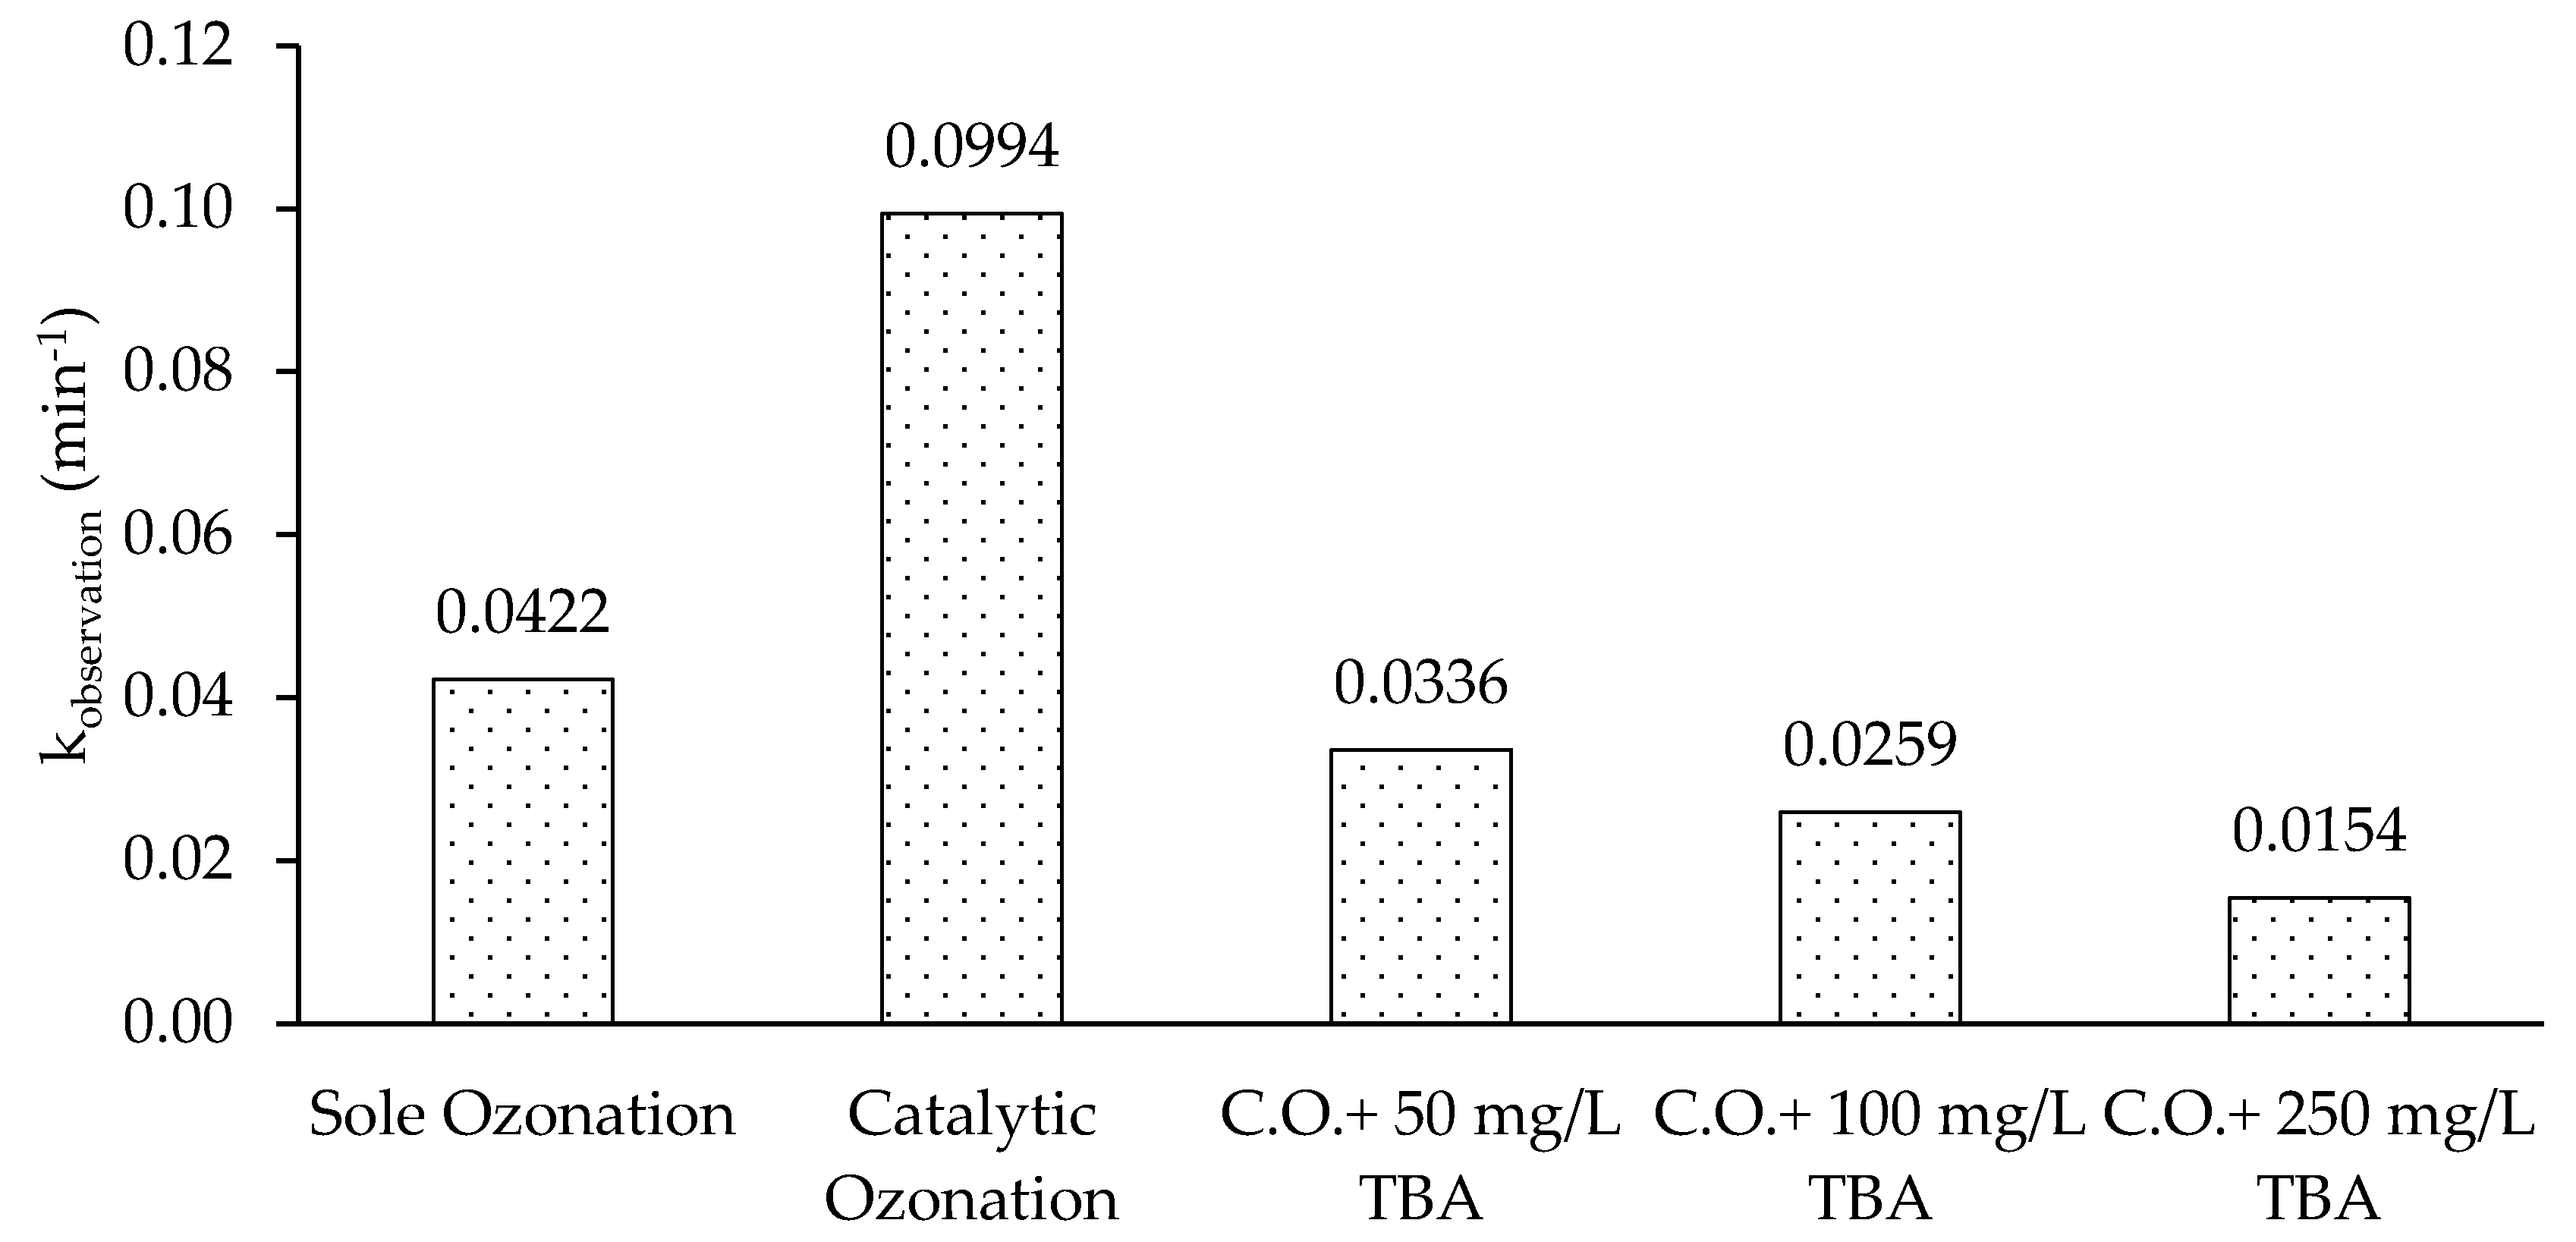
Figure 15.
Effect of TBA on a hydroxyl radical fraction.
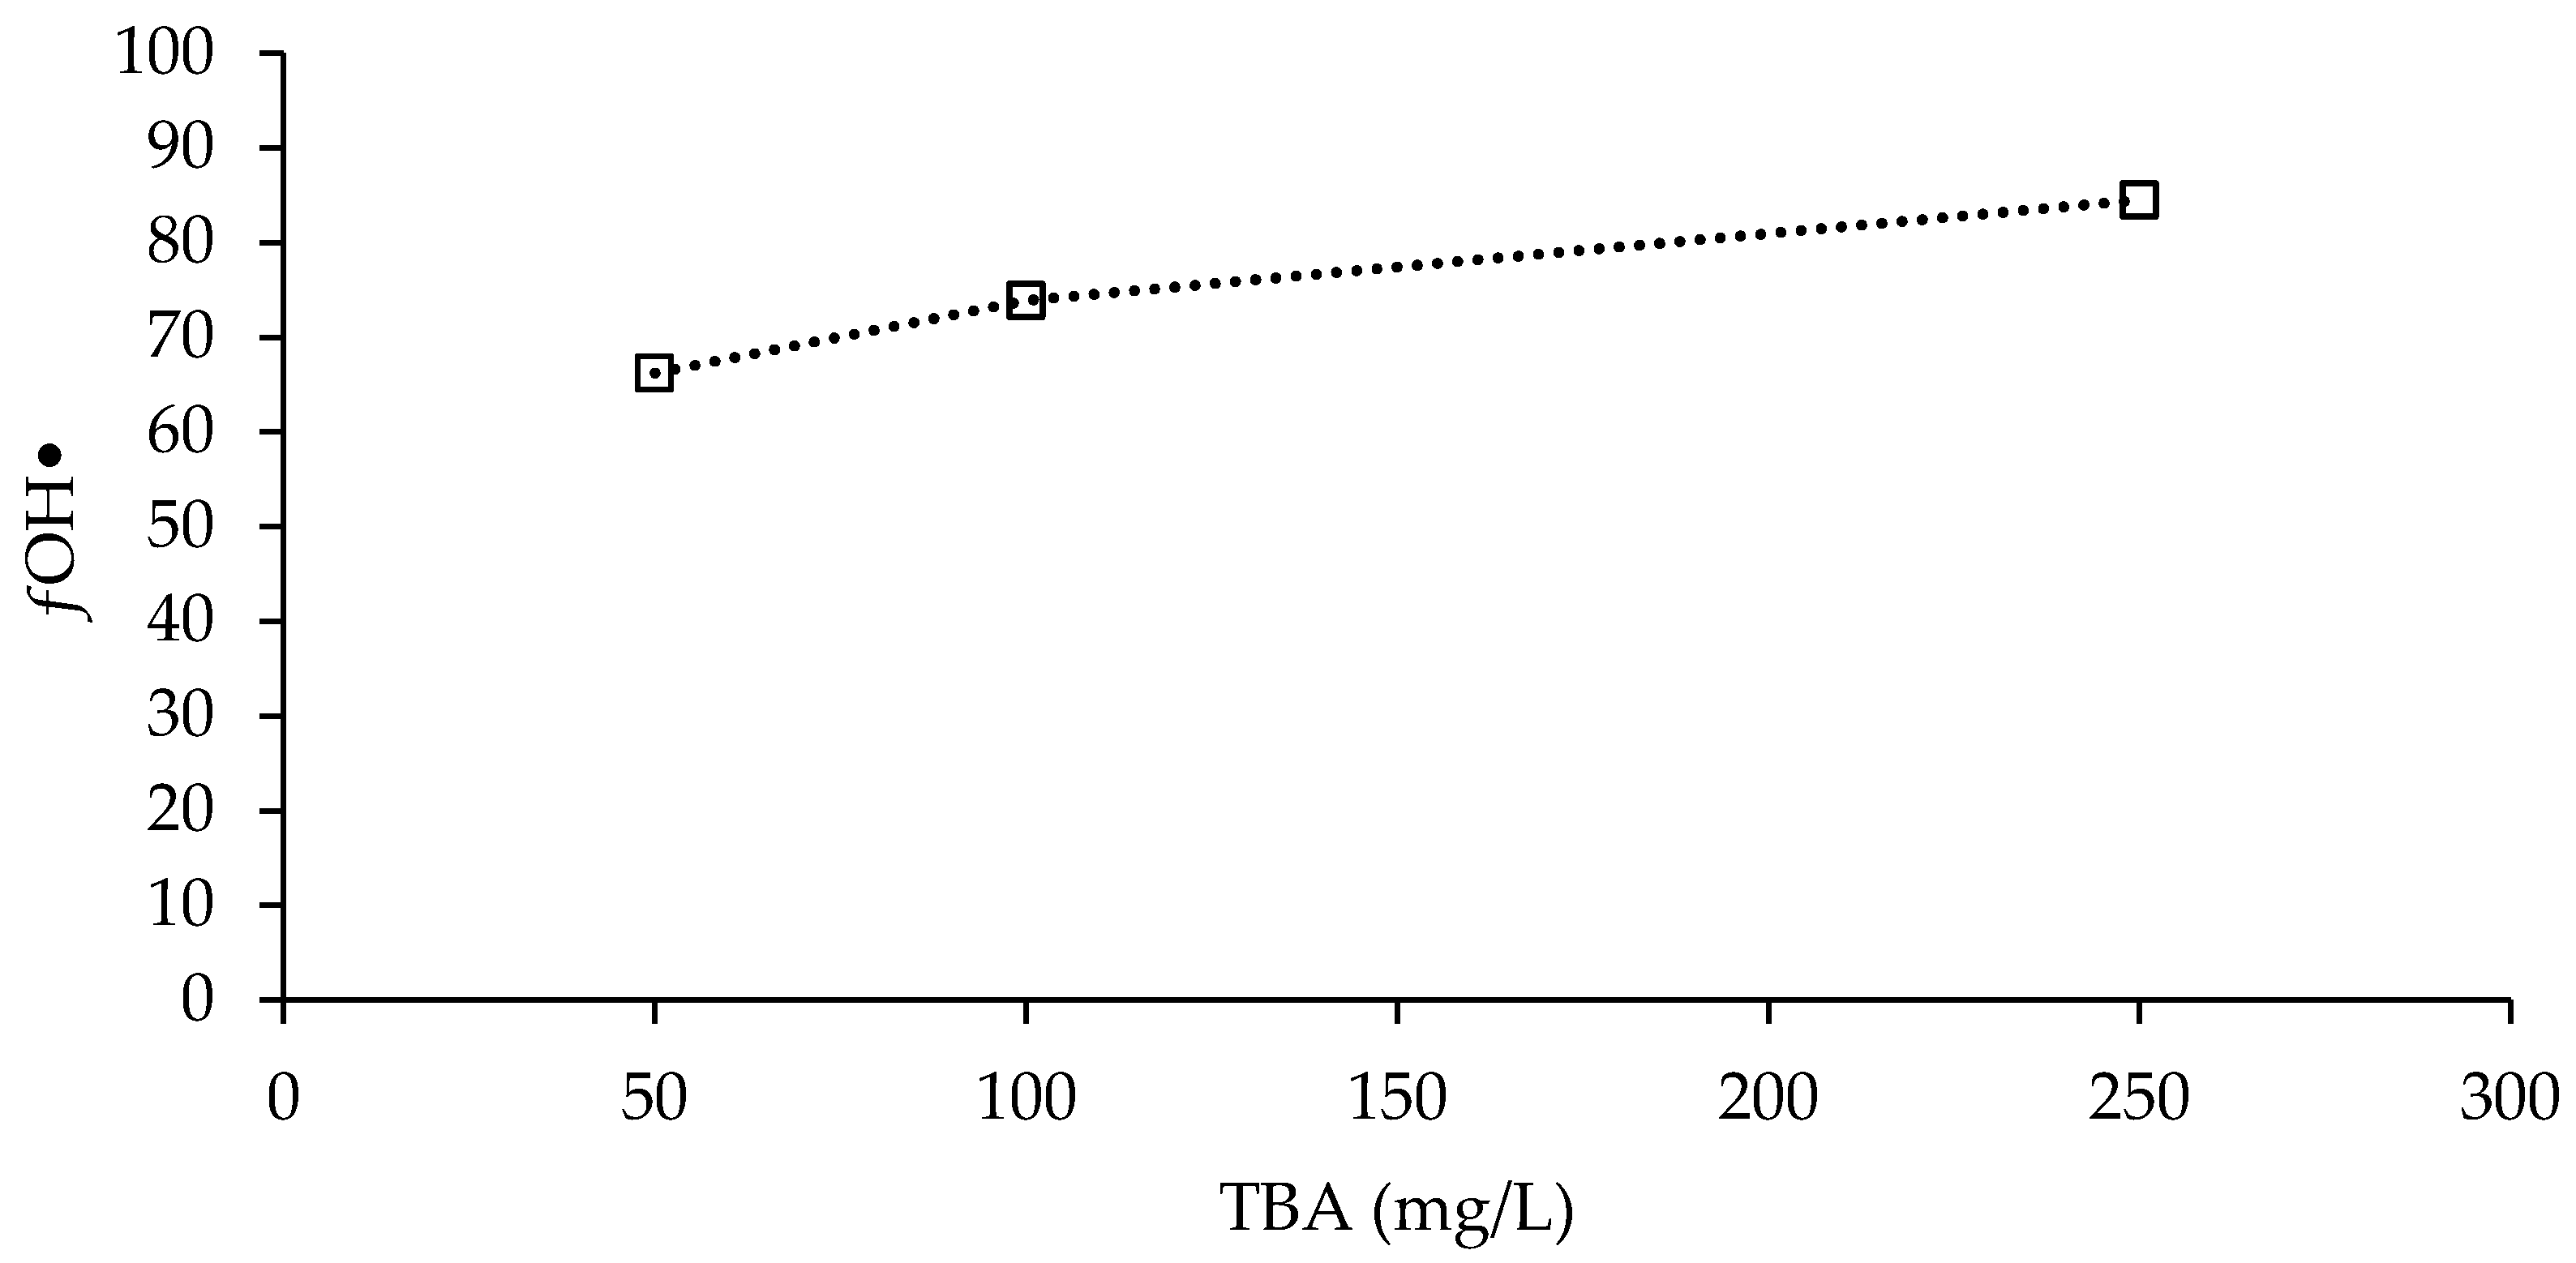
Figure 16.
Experimental setup.


Table 1.
DLS and BET analysis results of crude and iron coated pumice.
| Parameter | Raw Pumice | ICP |
|---|---|---|
| Average Particle Diameter (d/nm) | 192.70 | 248.10 |
| BET Surface Area (m2/g) | 4.66 | 10.56 |
| Average Adsorption Pore Diameter (nm) | 4.38 | 7.55 |
| Average BJH Adsorption Pore Diameter (nm) | 8.98 | 7.16 |
| Average BJH Desorption Pore Diameter (nm) | 6.12 | 6.09 |
| pHPZC | 6.98 | 7.13 |
Table 2.
Regression coefficients for catalytic degradation of HA and kobservation.
| L-H Kinetic Rate Constants | Input Pollutant Concentration, C0 (mg/L) | |||
|---|---|---|---|---|
| 2.5 | 5.0 | 10 | 20 | |
| kobservation (min−1) | 0.0664 | 0.0870 | 0.0994 | 0.1138 |
| R2 | 0.9821 | 0.9926 | 0.9984 | 0.9993 |
Table 3.
Langmuir-Hinshelwood kinetic parameters for HA.
| Parameter | Value |
|---|---|
| kL-H (mg L−1 min−1) | 1.7047 |
| kads (L mg−1) | 0.0363 |
| R2 | 0.9900 |
Table 4.
ksolution-phosphate/kinterface-phosphate ratio in different reactions.
| Reaction Type | ksolution-phosphate (min−1) | kinterface-phosphate (min−1) | ksol.-phosphate/kint.-phosphate |
|---|---|---|---|
| Sole Ozonation | 1.25 × 10⁻⁴ | - | - |
| Catalytic Ozonation | 1.22 × 10⁻⁴ | 0.09 × 10⁻⁴ | 14.33 |
Table 5.
Contribution of oxidation type and adsorption to HA degradation.
| Reaction Type | ɳadsorption | ɳOH• | ɳozone |
|---|---|---|---|
| Singular ozonation | - | 12.99 | 87.01 |
| Catalytic ozonation | 21.29 | 66.22 | 12.49 |
Table 6.
Effect of catalyst stability on catalytic ozonation.
| Repetition | DOC Removal (%) | Dissolved Iron Concentration In Solution (µg L−1) |
|---|---|---|
| 1 | 76.58 | 2.64 |
| 3 | 75.89 | 8.45 |
| 5 | 77.02 | 11.10 |
| 7 | 76.41 | 12.60 |
| 10 | 75.26 | 9.80 |
Conditions: T = 23 °C; pH = 6.86; [HA] = 10 mg L−1; [O3] = 10 mg L−1; [ICP] = 0.050 g L−1.
© 2018 by the authors. Licensee MDPI, Basel, Switzerland. This article is an open access article distributed under the terms and conditions of the Creative Commons Attribution (CC BY) license (http://creativecommons.org/licenses/by/4.0/).
Share and Cite
MDPI and ACS Style
Alver, A.; Kılıç, A. Catalytic Ozonation by Iron Coated Pumice for the Degradation of Natural Organic Matters. Catalysts 2018, 8, 219. https://doi.org/10.3390/catal8050219
AMA Style
Alver A, Kılıç A. Catalytic Ozonation by Iron Coated Pumice for the Degradation of Natural Organic Matters. Catalysts. 2018; 8(5):219. https://doi.org/10.3390/catal8050219
Chicago/Turabian StyleAlver, Alper, and Ahmet Kılıç. 2018. "Catalytic Ozonation by Iron Coated Pumice for the Degradation of Natural Organic Matters" Catalysts 8, no. 5: 219. https://doi.org/10.3390/catal8050219
Note that from the first issue of 2016, this journal uses article numbers instead of page numbers. See further details here.