Article

Rh/CeO2 Thin Catalytic Layer Deposition on Alumina Foams: Catalytic Performance and Controlling Regimes in Biogas Reforming Processes

by
Cristina Italiano
1,*,
Muhammad Arsalan Ashraf
2,
Lidia Pino
1,
Carmen Williana Moncada Quintero
3,
Stefania Specchia
1,3 and
Antonio Vita
1
1
CNR-ITAE, Institute for Advanced Energy Technologies “Nicola Giordano”, Via S. Lucia sopra Contesse 5, 98126 Messina, Italy
2
Department of Chemical Engineering, University of Bath, Claverton Down Rd., Bath BA2 7AY, UK
3
Department of Applied Science and Technology, Politecnico di Torino, Corso Duca degli Abruzzi 24, 10129 Torino, Italy
*
Author to whom correspondence should be addressed.
Catalysts 2018, 8(10), 448; https://doi.org/10.3390/catal8100448
Submission received: 10 September 2018 / Revised: 5 October 2018 / Accepted: 8 October 2018 / Published: 11 October 2018
(This article belongs to the Special Issue Structured Catalysts for Catalytic Processes Intensification)

Abstract

:
The application of ceramic foams as structured catalyst supports is clearly expanding due to faster mass/heat transfer and higher contact efficiency than honeycomb monoliths and, mainly, packed beds. In this paper, alumina open-cell foams (OCFs) with different pore density (20, 30 and 40 ppi) were coated with Rh/CeO2 catalyst via a two steps synthesis method involving: (i) the solution combustion synthesis (SCS) to in-situ deposit the CeO2 carrier and (ii) the wet impregnation (WI) of the Rh active phase. The catalytic coatings were characterized in terms of morphology and adhesion properties by SEM/EDX analysis and ultrasounds test. Permeability and form coefficient were derived from pressure drop data. Catalytic performance was evaluated towards biogas Steam Reforming (SR) and Oxy-Steam Reforming (OSR) processes at atmospheric pressure by varying temperature (800–900 °C) and space velocity (35,000–140,000 NmL·g−1·h−1). Characteristics time analysis and dimensionless numbers were calculated to identify the controlling regime. Stability tests were performed for both SR and OSR over 200 h of time-on-stream (TOS) through consecutive start-up and shut-down cycles. As a result, homogenous, thin and high-resistance catalytic layers were in situ deposited on foam struts. All structured catalysts showed high activity, following the order 20 ppi < 30 ppi ≈ 40 ppi. External interphase (gas-solid) and external diffusion can be improved by reducing the pore diameter of the OCF structures. Anderson criterion revealed the absence of internal heat transfer resistances, as well as Damköhler and Weisz-Prater numbers excluded any internal mass transfer controlling regime, mainly due to thin coating thickness provided by the SCS method. Good stability was observed over 200 h of TOS for both SR and OSR processes.

Graphical Abstract

1. Introduction

Bio-economy is a sustainable solution to meet the challenges of food security, resource scarcity, energy demand and climate change by efficient production of bio-resources and their conversion into food, bio-energy and biomaterials [1]. Process intensification (PI) is a promising strategy to develop more competitive and sustainable processes in a transition towards a bio-based economy. The innovative methodologies of PI are exploited to overcome limitations of conventional processes and develop novel processes by implementing efficient technologies that is, novel reactors, materials, separation processes, bio-materials and bio-based process routes [2,3]. The most interesting technological approach in heterogeneous catalysis is the application of structured catalysts (e.g., monoliths and foams) which paves a way for more energy and resources through efficient chemical transformations [4,5]. Monolith- and foam-structured catalysts are widely used in environmental applications for controlling both automotive and stationary emissions [6]. Moreover, they are increasingly under development for many reaction applications, such as highly endothermic and exothermic reactions (hydrogenation, combustion or reforming processes) especially at low contact time [7,8].
Biogas plays a major role as a renewable energy source in the bio-economy domain according to the European Union policy [9,10]. Biogas is produced by anaerobic digestion of biomasses coming from different sources such as sewage, sludge, landfill, or industry [11]. Basically, it consists of 50–75% CH4, 25–45% CO2, 2–7% H2O (at 20–40 °C), 2% N2, <1% H2 with traces of H2S, O2, NH3, halides and siloxanes [12,13]. The high levels of CO2 and CH4 enable the conversion of biogas to syngas (CO and H2) by methane dry reforming (DR) reaction [14,15,16]:
CH 4   +   CO 2     2 H 2   +   2 CO Δ H 298 K 0   =   + 247   kJ · mol 1
The high operating temperatures needed to perform the endothermic DR reaction lead to active species sintering and coke formation [17]. Besides, DR is accompanied by several side reactions, among which the methane cracking reaction (CH4 → C + 2H2, Δ H 298 K 0 = +75 kJ·mol−1) and the Boudouard reaction (2CO → C + CO2, Δ H 298 K 0 = −173 kJ·mol−1) appear to be the most important [17,18]. The steam reforming (SR) of biogas is a combination of DR (Equation (1)) and methane SR (Equation (2)). The presence of steam reduces carbon formation by coke reforming reaction (C + H2O → CO + H2, Δ H 298 K 0 = +131 kJ·mol−1) and increases H2 concentration in the product mixture by favouring the water gas shift (WGS) reaction (CO + H2O → CO2 + H2, Δ H 298 K 0 = −41 kJ·mol−1) [19].
CH 4   +   H 2 O     3 H 2   +   CO Δ H 298 K 0   =   + 206   kJ · mol 1
Moreover, in the oxy-steam reforming (OSR) of biogas, the presence of oxygen improves the energy efficiency of the process by exothermic methane partial/total oxidation reactions (Equations (3) and (4)), as well as favours coke oxidation (C + O2 → CO2, Δ H 298 K 0 = −394 kJ·mol−1) [20,21].
CH 4   +   ½ O 2     2 H 2   +   CO Δ H 298 K 0   =   36   kJ · mol 1
CH 4   +   2 O 2     2 H 2 O   +   CO 2 Δ H 298 K 0   =   802   kJ · mol 1
Biogas can be effectively transformed to syngas by reforming processes, with the aim to further upgrade it into bio-hydrogen, bio-fuels or chemicals. SR is a well-established conventional process for syngas production at industrial scale, which is usually carried out over Ni- and Ru-based pellet catalysts in tubular reactors [22,23], with severe heat and mass transport limitations [24]. As a toolbox of PI, structured catalysts provide a promising way to overcome these limitations thanks to enhanced heat and mass transfer coefficients, higher surface-to-volume ratio and lower pressure drop [25,26]. These characteristics enhance the catalytic performance of reforming reactions, allowing operation at high space velocity simultaneously reducing the amount of catalytic material [27,28]. Thus, the research interest in structured catalysts development is constantly growing [4,27,29,30,31,32,33,34,35,36].
Monolith-based catalysts have been tested successfully for reforming reactions with improved catalytic performance but limitations still exist due to the absence of radial mass and convective heat transfer in straight channels. On the other hand, the tortuous structure of ceramic open-cell foam (OCF) provides a fast radial heat and mass transport with higher contact efficiency [37,38]. Indeed, OCFs are macroporous reticulated three-dimensional (3D) structures in which the cells are connected by open windows, providing high porosity with 80–90% void space [39]. As an alternative to conventional systems (pellets made of magnesium aluminate or calcium aluminate spinels), alumina OCFs are potential structured supports for reforming processes with proven mechanical, chemical and hydrothermal suitability for severe working conditions: high temperature (600–900 °C), high pressure (20–30 bar) and steam rich environment (S/CH4 = 1.5–3.0) [40,41]. However, the catalytic functionalization of the foam structures still remains one of the main critical issues. In fact, the catalytic coated layer needs to be highly active and stable, as well as resistant to thermal and mechanical stresses occurring during reforming reactions [4,29,42]. The conventional washcoating technique suffers from non-uniformity and exfoliation of coatings, as well as binder contamination. Moreover, a proper use of the washcoating method implies the optimization of many parameters, such as pH, viscosity of the slurry, primers’ and binders’ utilization, speed of dipping and so forth. [7,30,43]. Recently, we proved that solution combustion synthesis (SCS) is a suitable procedure to in-situ deposit uniform, thin and high-strength catalytic layers on the surface of both ceramic monoliths [7,25,30,31,32] and foams [7,44]. The SCS method takes the advantage of an exothermic, very quick and self-sustaining chemical reaction between metal precursors and an organic fuel (i.e., urea), resulting in the synthesis of nanocrystalline oxide powders over the surface of structured supports [4,45,46,47].
In this paper, alumina OCFs with different pore density (20, 30 and 40 pore per square inch, ppi) were coated with Rh/CeO2 catalyst by SCS. The coated structures were physically characterized by scanning electron microscopy with energy dispersive X-ray spectroscopy (SEM/EDX) and transmission electron microscopy (TEM) to analyse their morphological characteristics. The mechanical stability of the coating was analysed using ultrasound tests. The permeability and form coefficients were derived from pressure drop data. The catalytic performance was investigated towards biogas SR and OSR reactions, evaluating the effects of temperature and space velocity. Characteristics time analysis and dimensionless numbers were calculated to identify the reaction controlling regime. Stability tests were also performed as a function of time-on-stream (TOS).

2. Results

2.1. Characterization of Samples

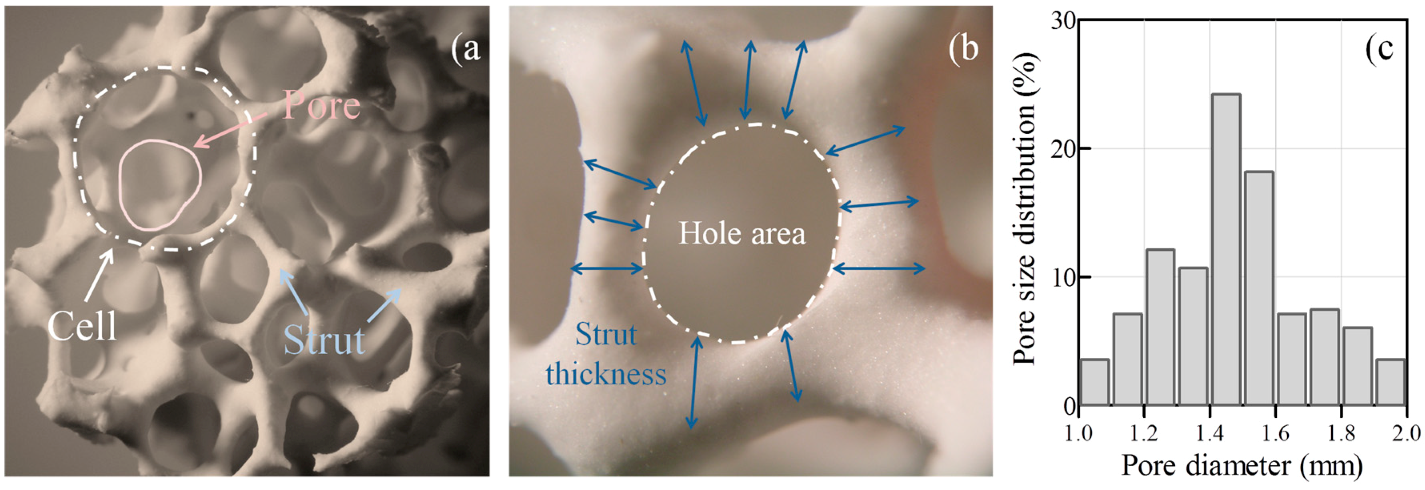
2.1.1. Geometrical Properties of OCFs Structures

Figure 1 shows one of the three structures used in this work (30 ppi OCF), with the characteristic geometric parameters and pore diameter distribution. OCFs are composed of cell units which are repeated in all space dimensions; cells are the void part enclosed by struts and interconnected pores (Figure 1a). The measured hole area (A) and strut thickness (ts) (Figure 1b) were averaged among at least 250 images of 15 different bare supports. Pore diameter ( d p = 4 A π ) was calculated by considering the hole as an equivalent circle [48]. A broad pore diameter distribution ranging from 1.0 to 2.0 mm was evaluated, as shown in Figure 1c.
Table 1 lists the geometrical properties of OCFs structures (20, 30 and 40 ppi) and the related equations. The voidage (ε) was calculated from the relative density (ρr) by the equation ε = 1 [ 2.59 ( t s t s + d p ) 2 ] [49]. Bed porosity (Vp) was determined by helium pycnometry. The geometric surface area (GSA) was calculated according to the tetrakaidecahedron model reported by of Buciuman and Kraushaar-Czarnetzki [50].

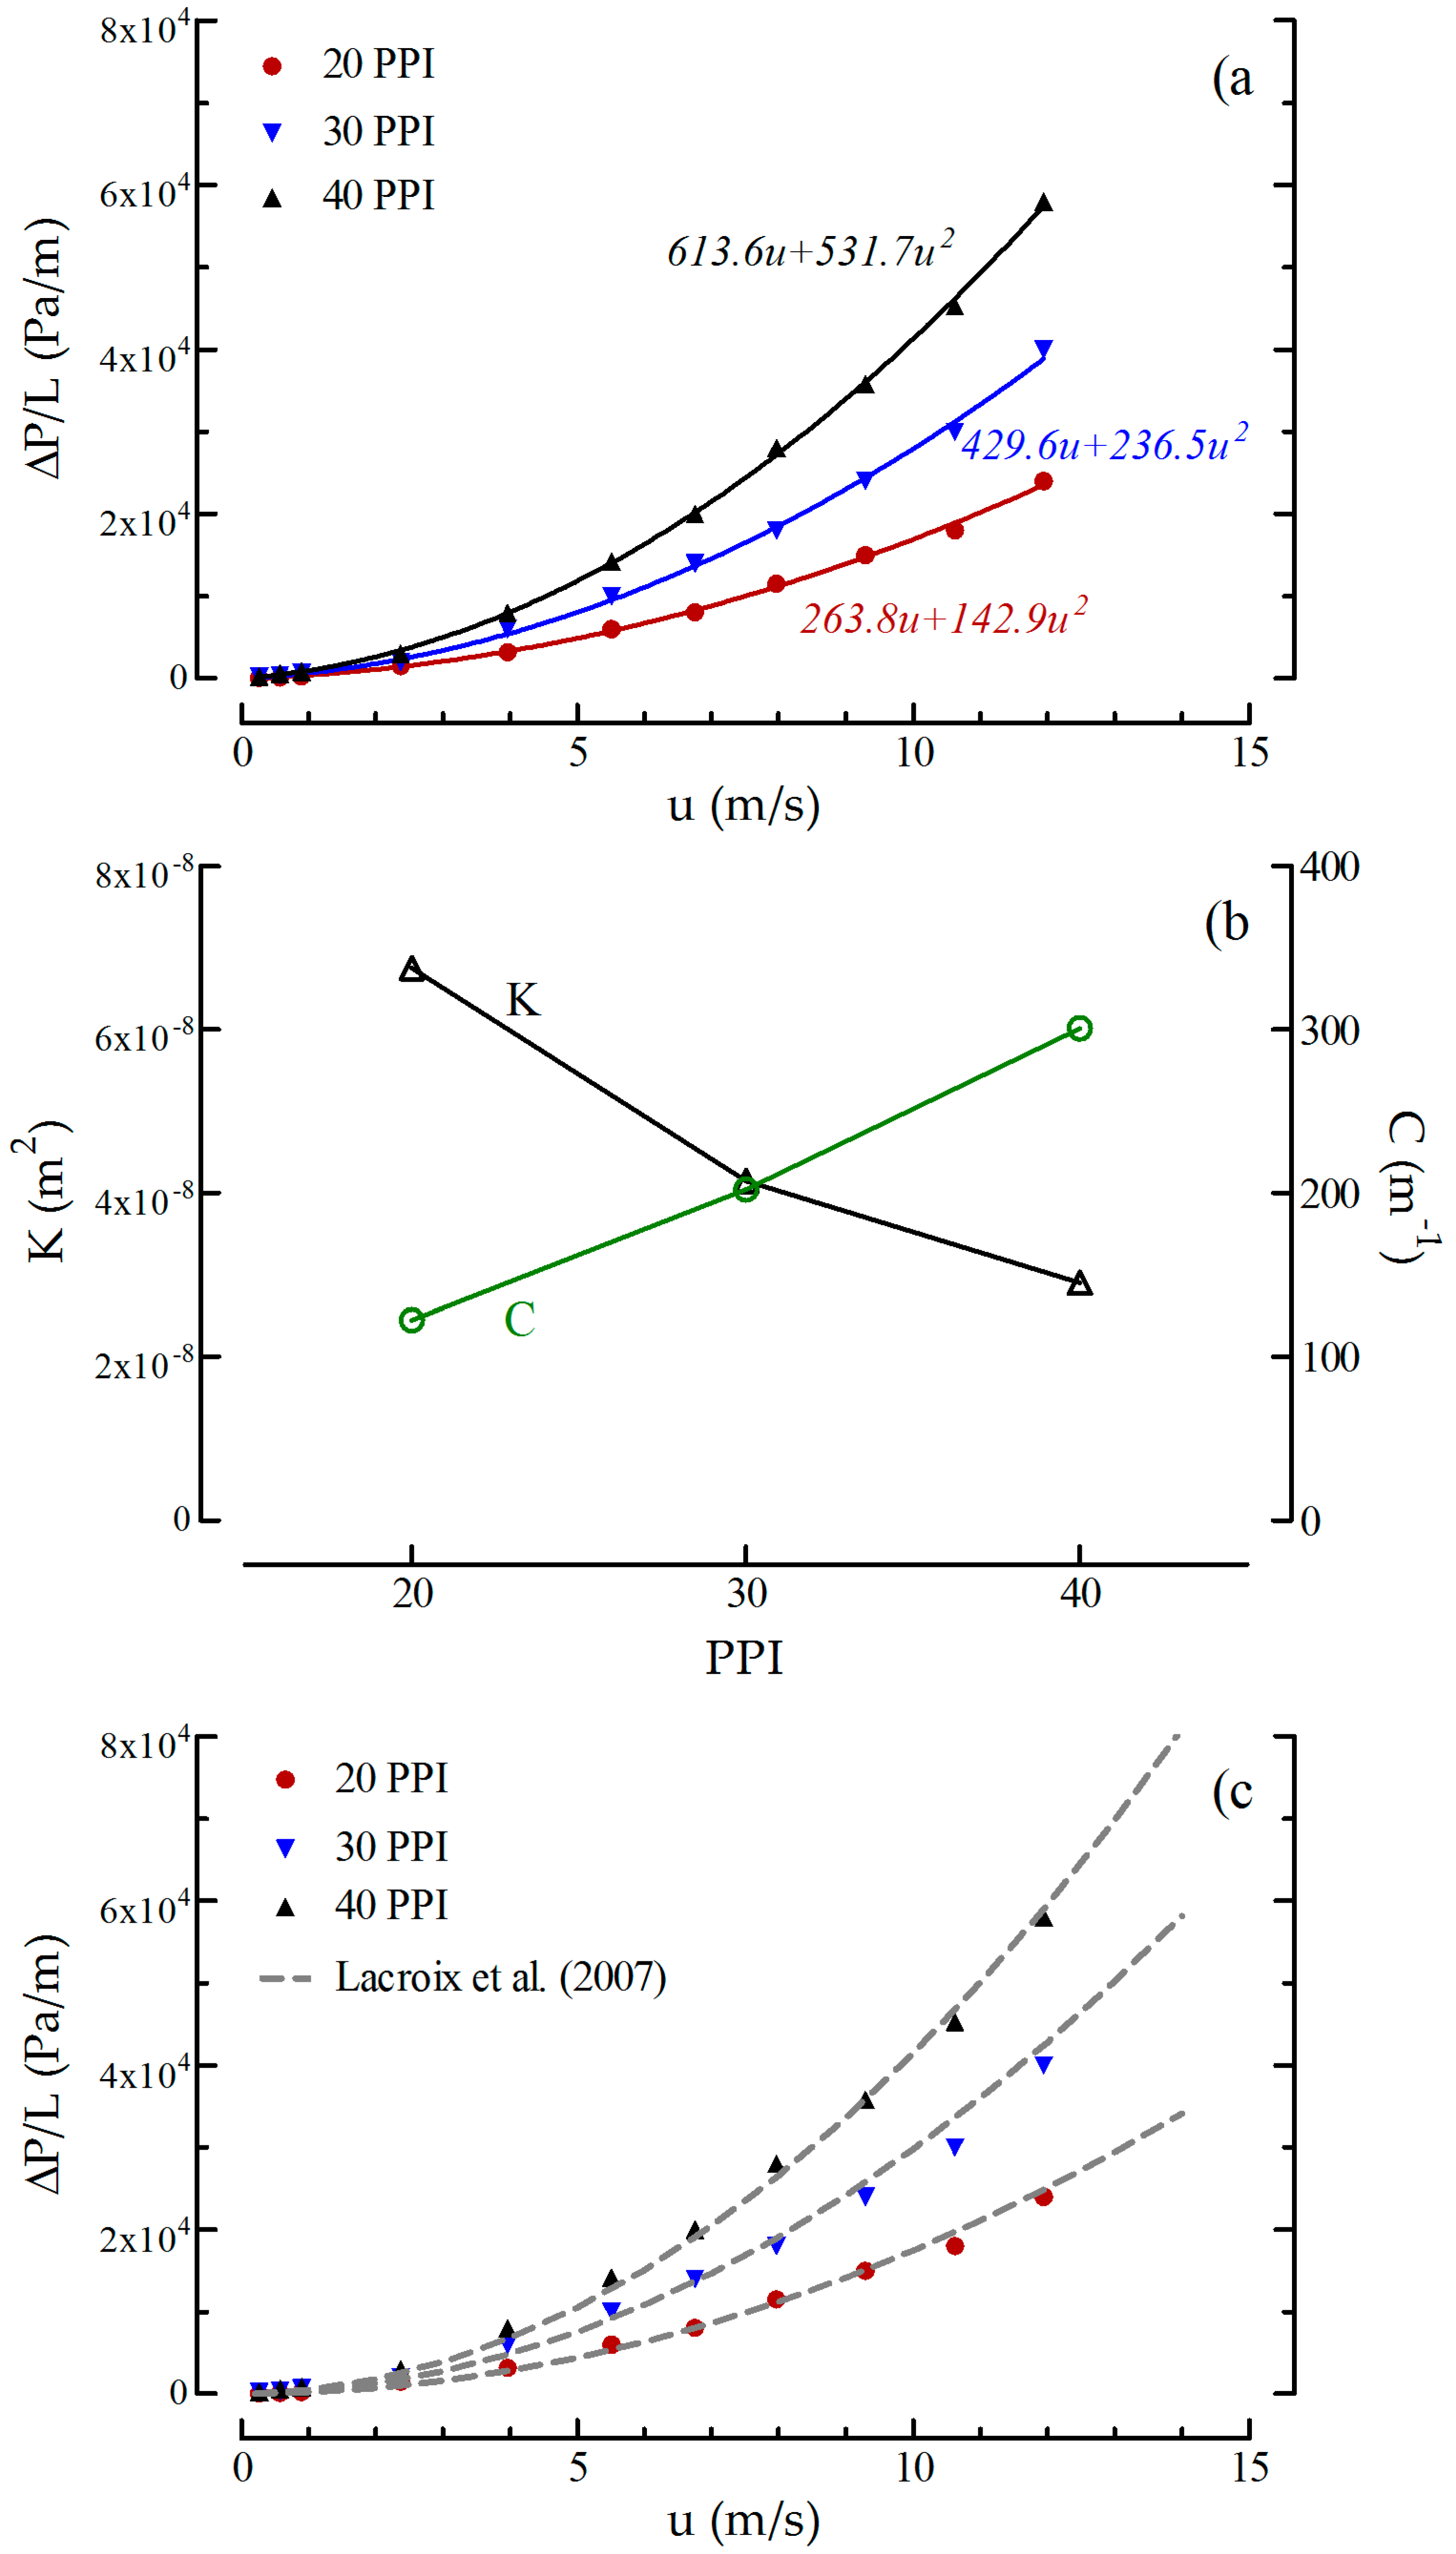
2.1.2. Pressure Drop Measurements

Figure 2 shows the pressure drops of all OCFs structures measured at different superficial velocities, together with the theoretical estimations. As reported by several Authors [51,52,53], Forchheimer-extended Darcy equation is a valid model for describing the pressure drop in OCFs at fluid velocity higher than 0.1 m·s−1. In the proposed model, the pressure drop per unit length (∆P/L) is expressed as a quadratic function of the inlet gas velocity (u) by the following equation:
Δ P L = a u + b u 2
The terms a and b represent the viscous drag and the inertial drag, respectively [48,54,55]. The first term (a = μ/K) represents the linear dependence of pressure drop on flow velocity. It can be expressed as the ratio between the dynamic viscosity of the fluid (μ) and the permeability of the foam (K). The second term (b = ρ·C), representing the quadratic dependence of the pressure drop on flow velocity, can be determined from the product of fluid density (ρ) and the form coefficient of the foam (C) [53,54,56].
By fitting the measured pressure drop values as a quadratic function of the fluid velocity (Figure 2a), the two hydraulic properties of a porous medium, permeability (K) and form coefficient (C), were determined from a and b constants of the curve-fit, known the dynamic viscosity ( μ N 2 ) = 1.78 × 10⁻⁵ Pa·s) and density ( ρ N 2 ) = 1.17 kg·m−3) of N2. Indeed, the permeability decreased by increasing the pore density from 6.7 × 10⁻⁸ (20 ppi OCF) to 2.9 × 10⁻⁸ m2 (40 ppi OCF). An opposite trend was observed for the form coefficient, which increased from 122.1 to 300.6 m−1 for 20 ppi and 40 ppi OCFs, respectively (Figure 2b). Similar results were reported by Wang and Guo [54], measuring the pressure drop of different foams as a function of the material porosity.
In the literature, several researchers adopted Ergun model to explain and fit the experimental data [57,58,59]:
Δ P L = E 1 μ N 2 ( 1 ε ) 2 ε 3 d p 2 u + E 2 ρ N 2 ( 1 ε ) ε 3 d p u 2
where the Ergun constants E1 and E2, depending on the nature of the porous media, ranged between 100 to 865 and 0.65 to 2.65, respectively [59]. In the work of Lacroix et al. [60], a simple analogy between the traditional spherical particle bed and the foam was proposed. Thus, the values of 150 and 1.75 for E1 and E2, respectively, were used for the estimation of the pressure drop in OCFs with different porosity. As shown in Figure 2c, the Ergun model is in good agreement with our experimental data. As expected, the measured pressure drop increased by decreasing the pore diameter and voidage (Table 1), following the order F20 < F30 < F40 structures.

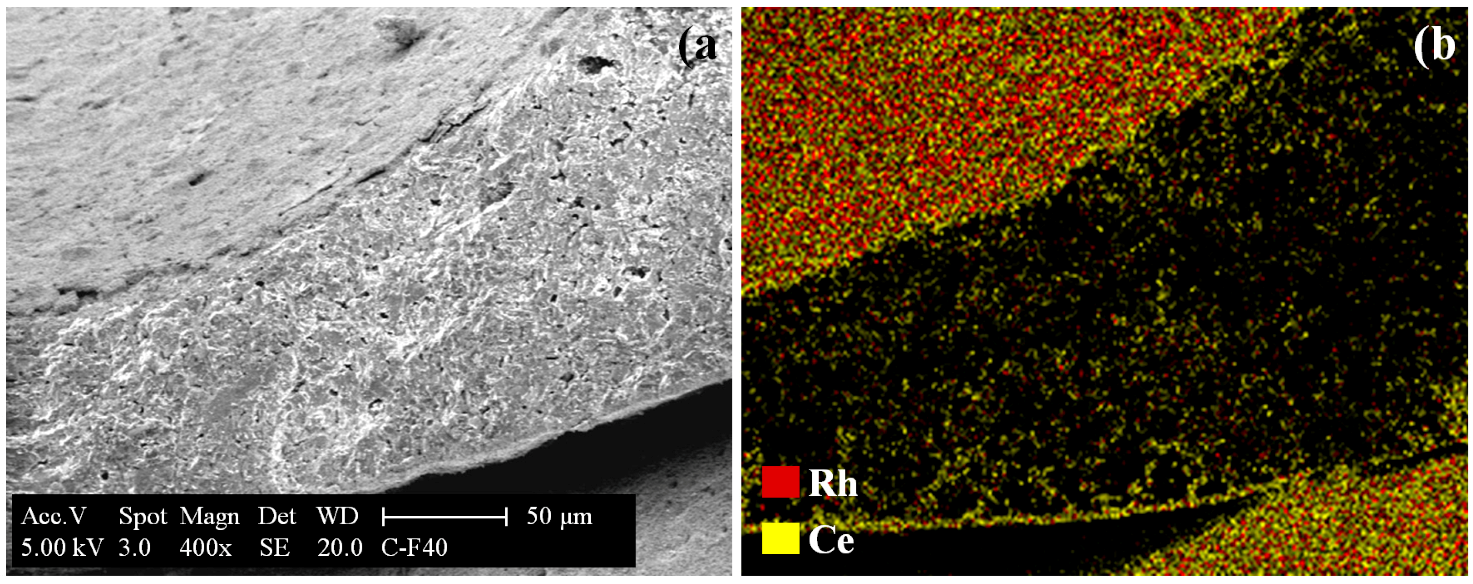
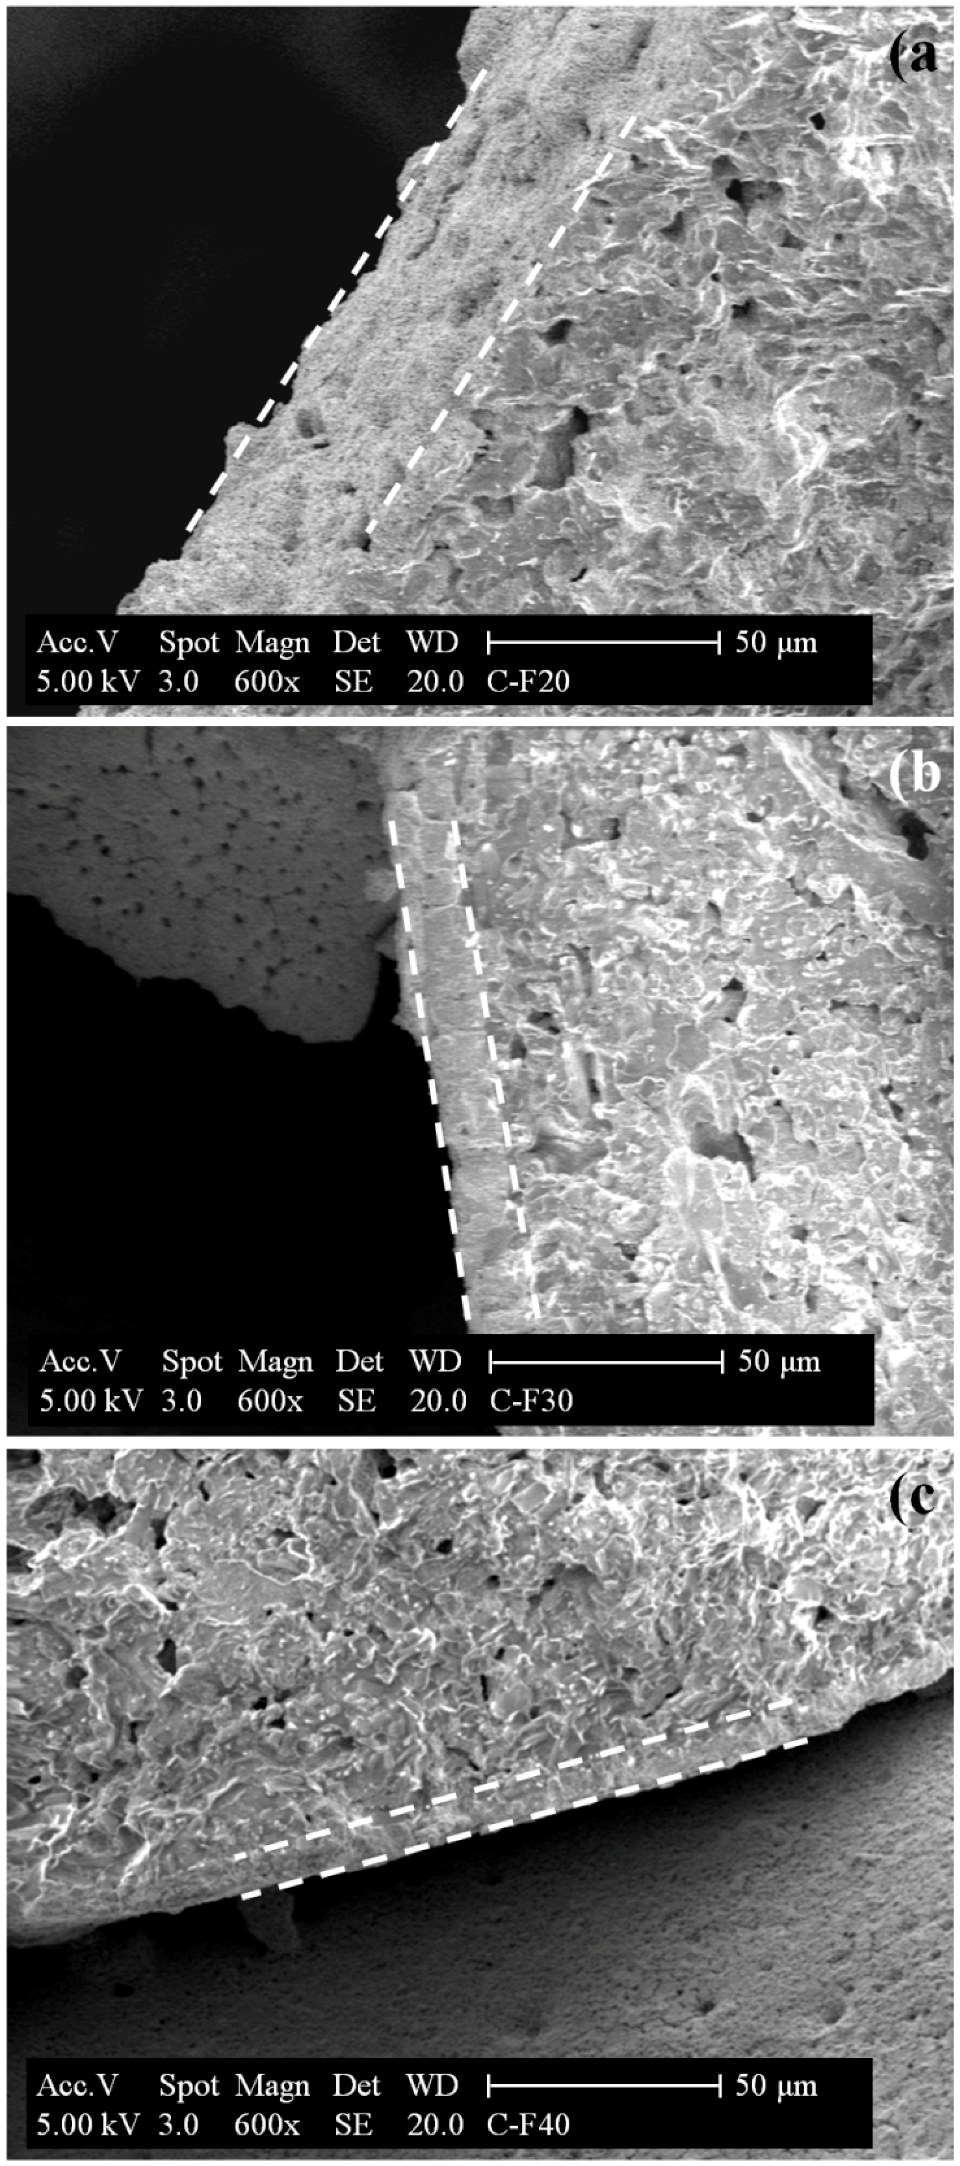
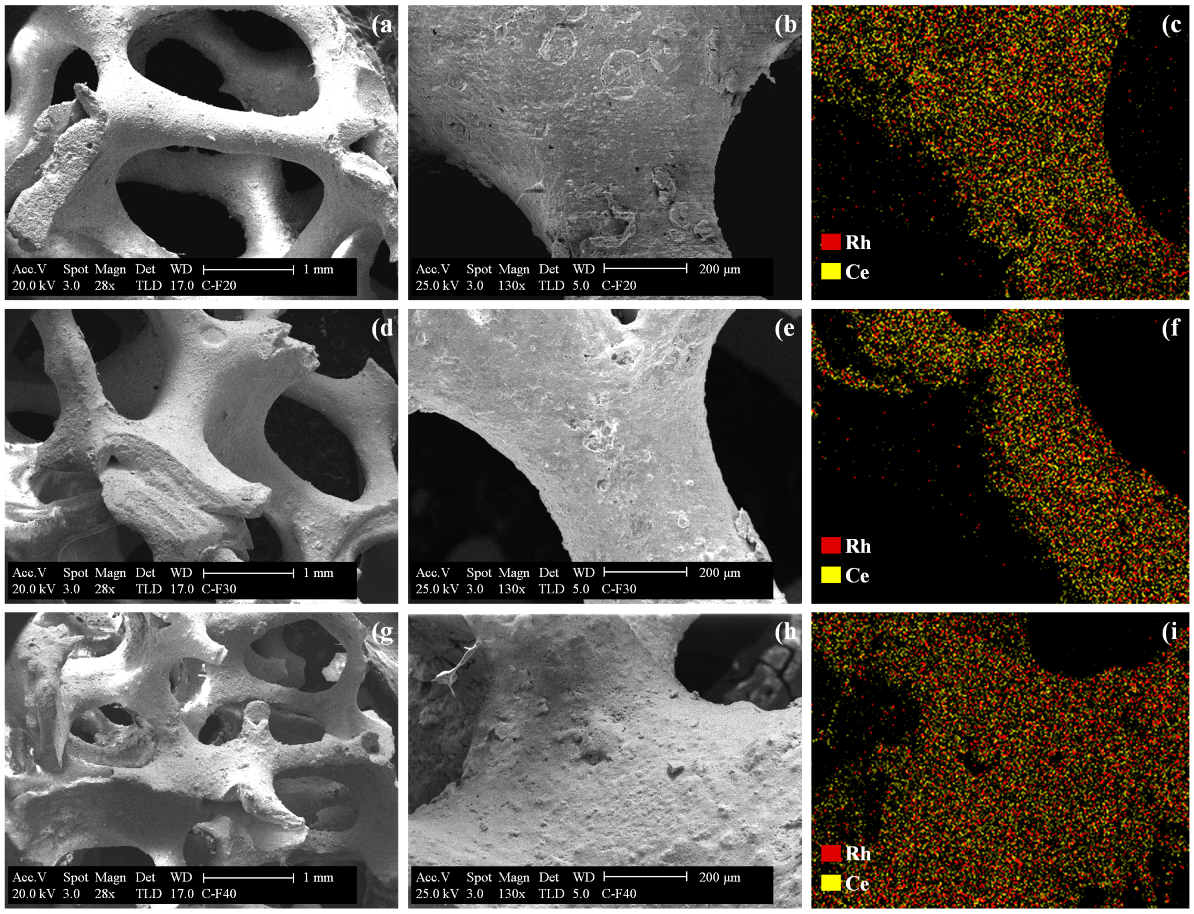
2.1.3. SEM/EDX Measurements

A homogeneous catalytic coating fully covering the OCFs was observed, without clogging of cells or pores (as highlighted in Figure 3a,b,d,e,g,h). The EDX mapping of the coated structured samples evidenced that ceria is well deposited on the alumina surface. Furthermore, rhodium seemed to be in turn well dispersed on the surface of ceria (Figure 3c,f,i). A homogeneous morphology of the catalytic layer was further evidenced in the cross-section view of the F40 system, highlighting a good interconnection between the foam and coated layer (Figure 4). Moreover, the catalyst particles penetrated into the porosity of the alumina foam, thus ensuring an optimal adhesion of the catalytic layer [61]. Indeed, a reduction of the macro-porosity of the alumina surface was observed after depositing the catalytic layer (see Figure S1 in Supplementary Materials).
In order to compare the catalytic behaviour of OCFs with different pore density, the same amount of catalyst (1.5 wt.% Rh immobilized over ~170 mg of ceria carrier) was deposited on each foam. The catalyst loading decreased from 22.2 to 12.0 mg·cm−2 due to the increase of GSA from 669 (F20) to 1273 m2·m−3 (F40), as reported in Table 1. The higher the GSA, the thinner catalytic coated layer. Therefore, thickness values between 5–20 μm, 15–30 μm and 25–40 μm were determined for F40, F30 and F20 structures, respectively (Figure 5).

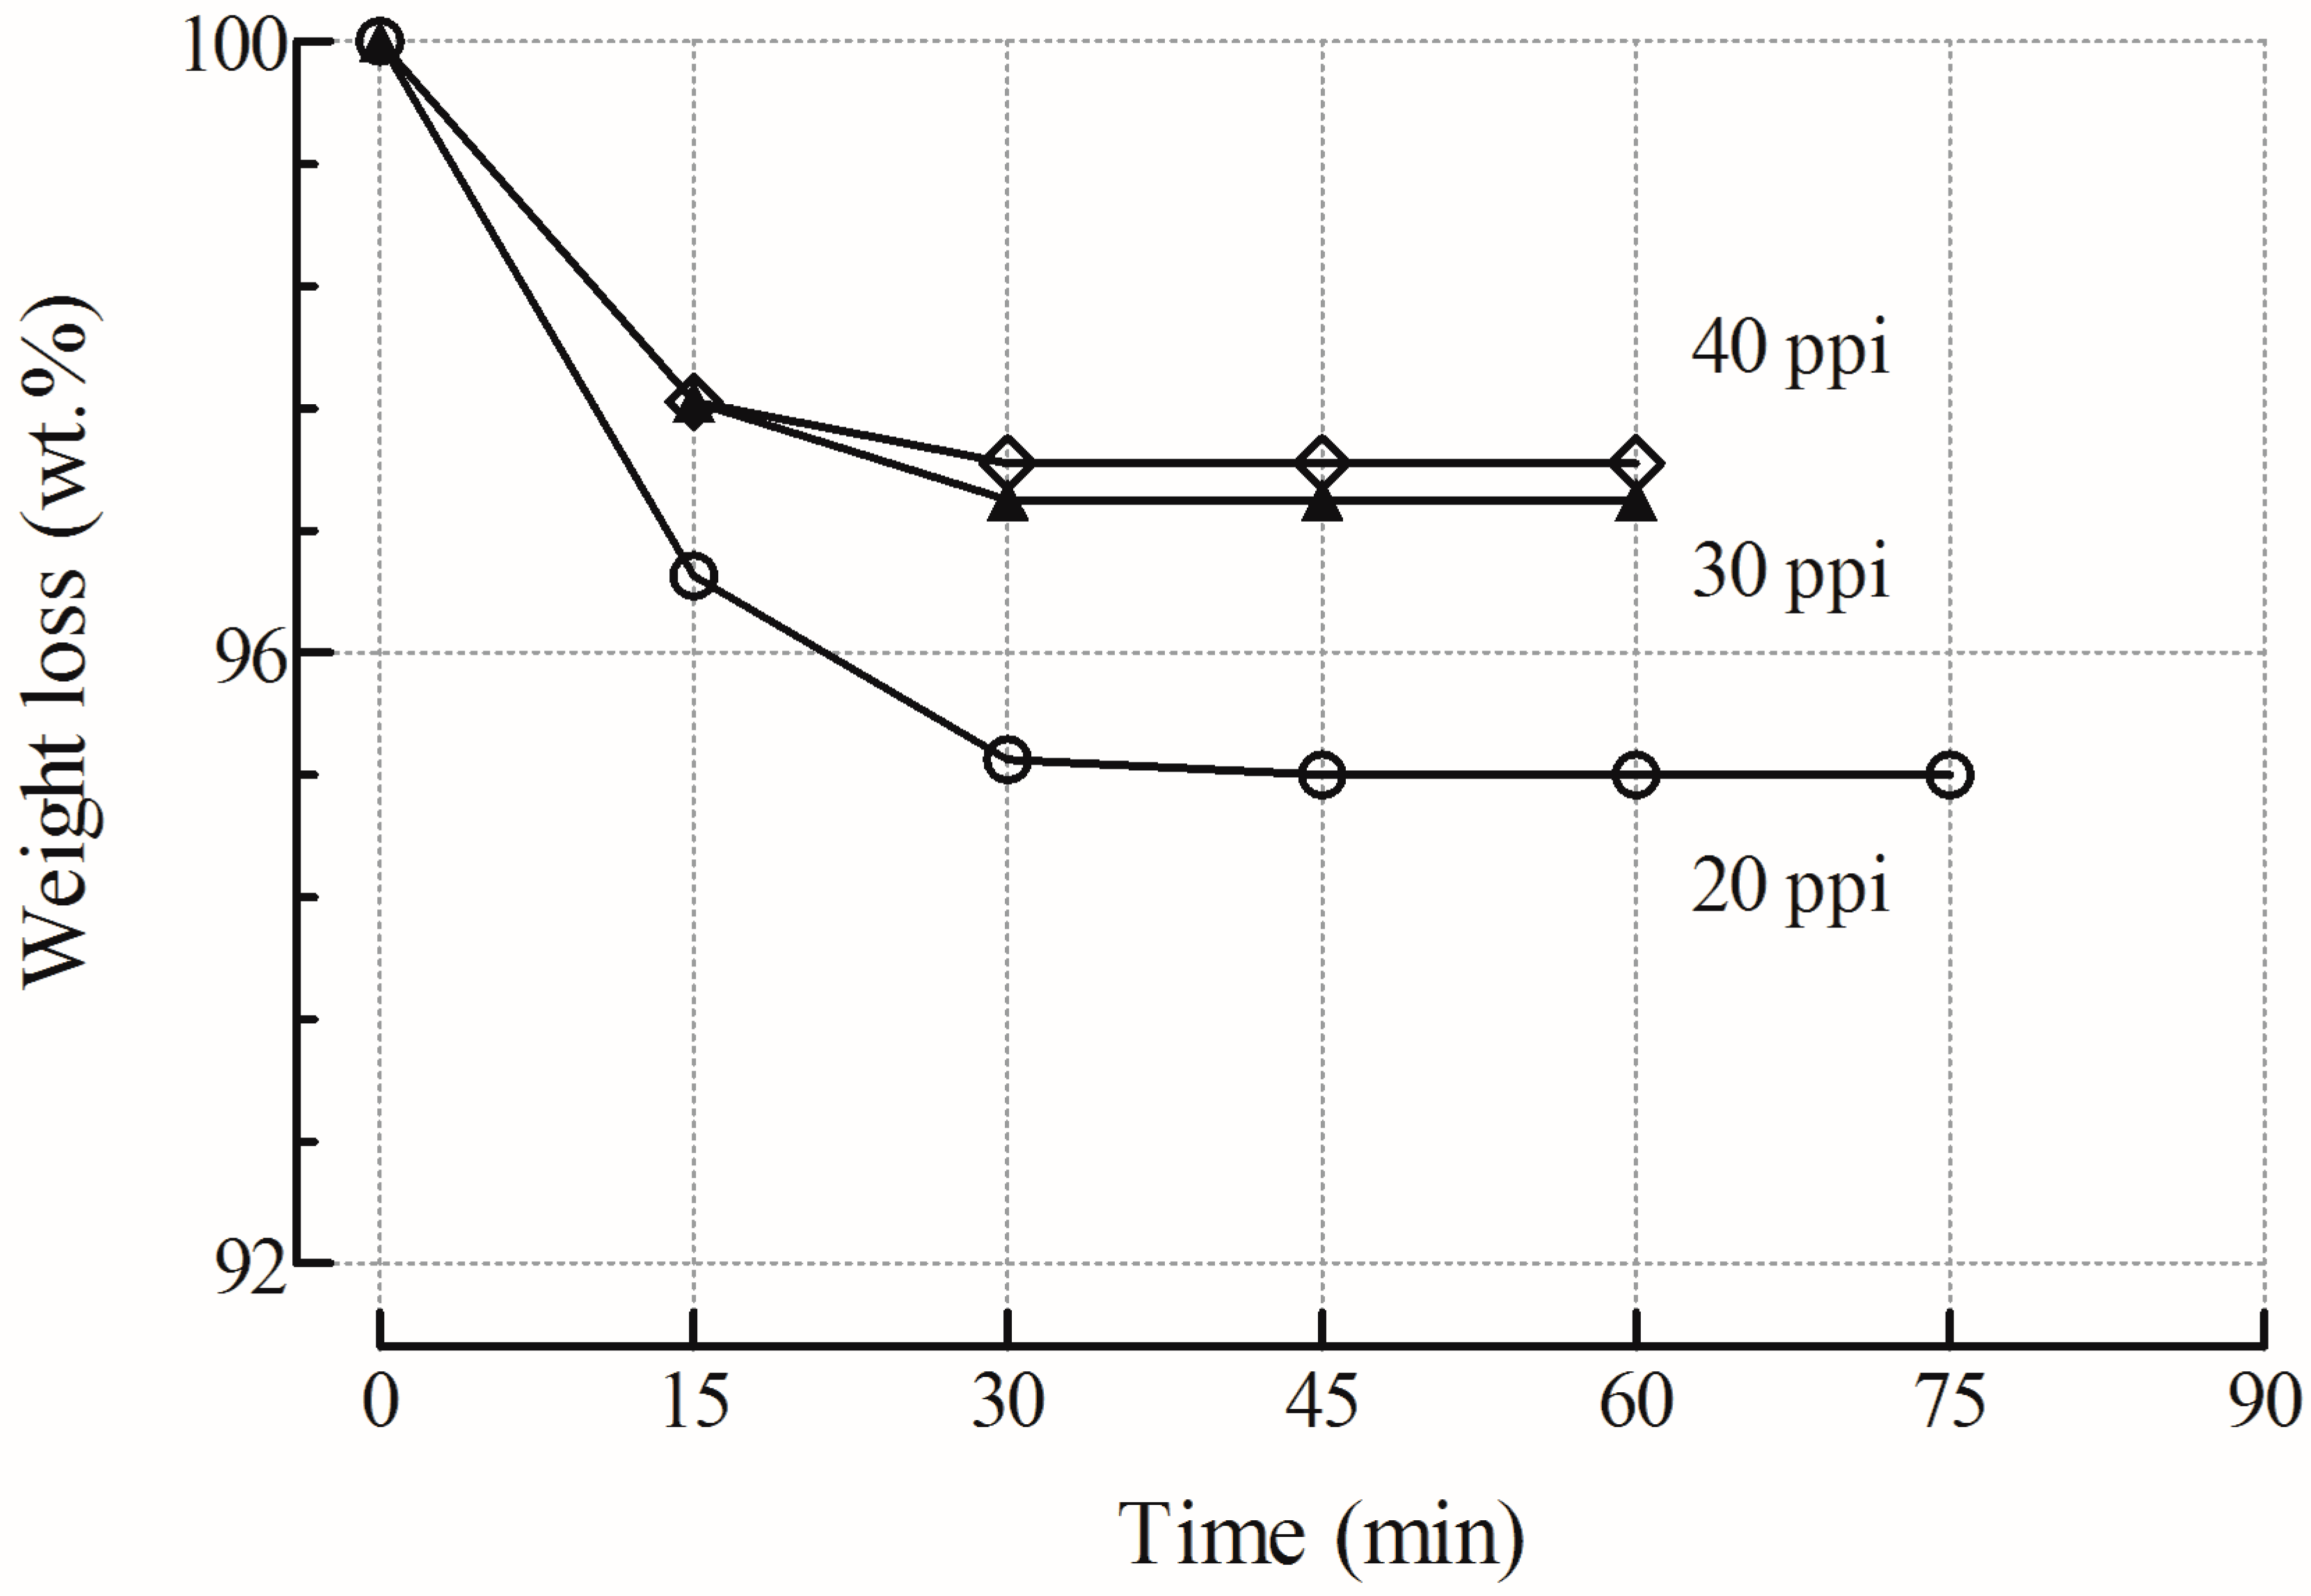
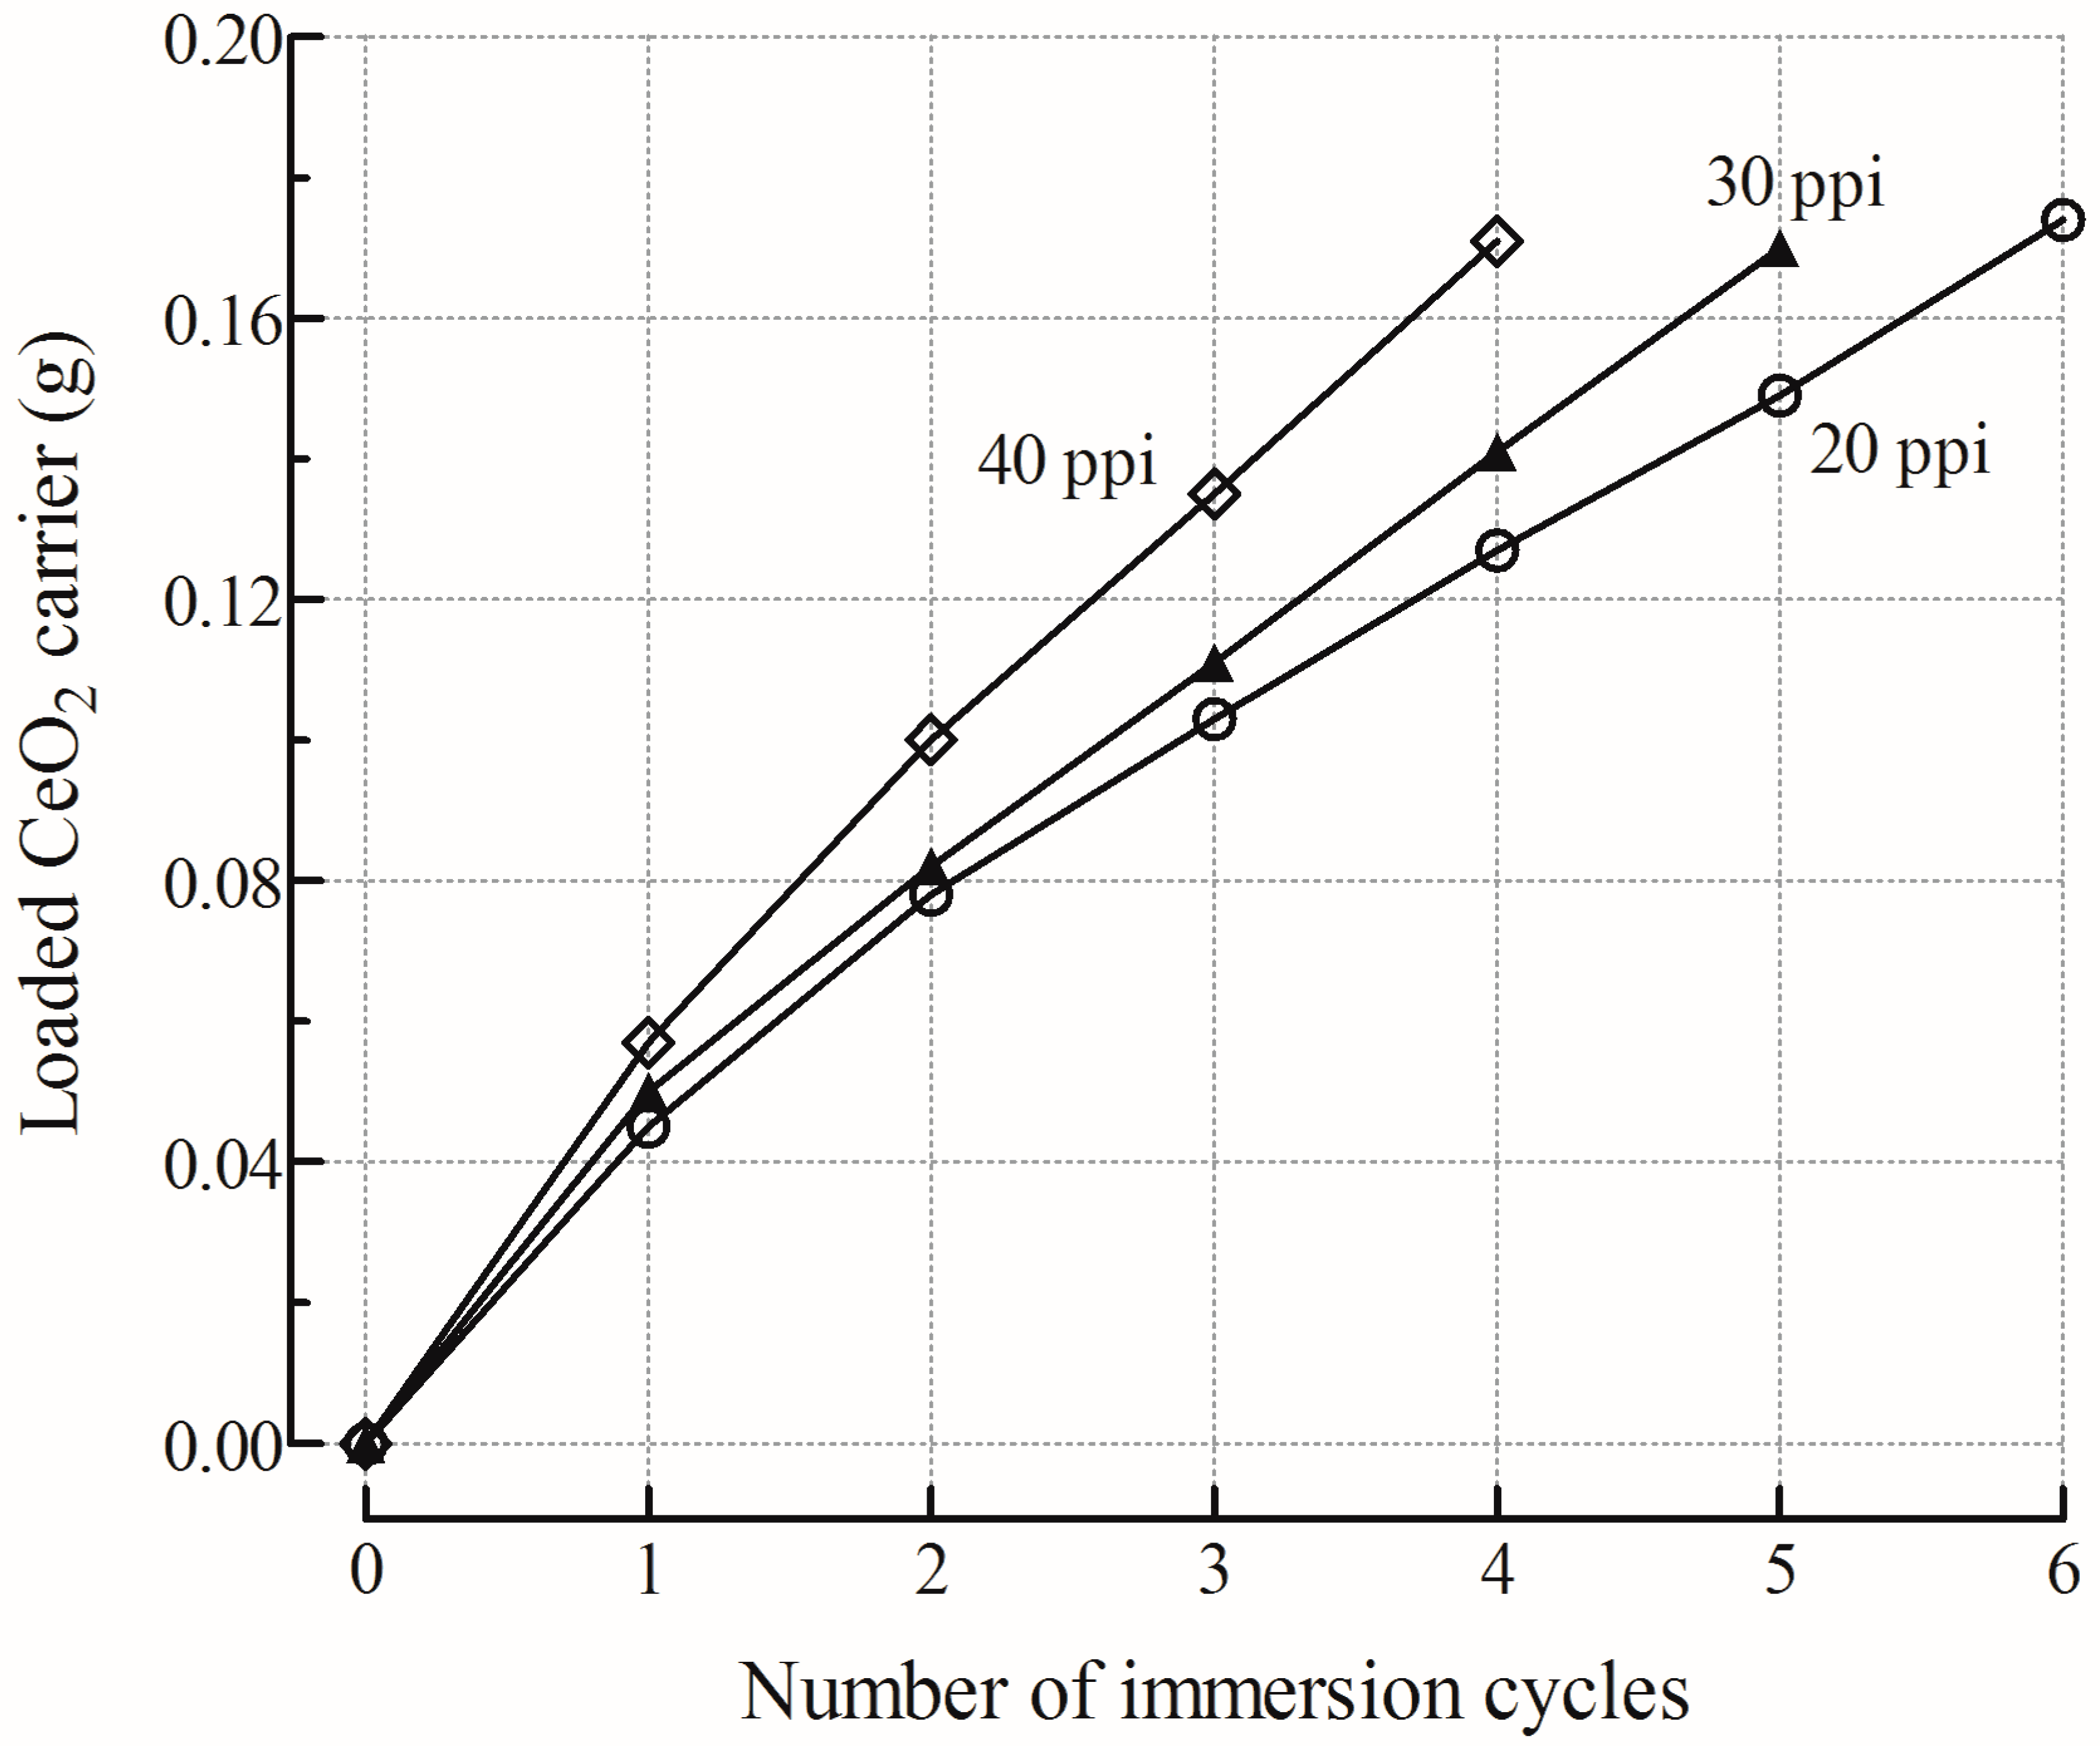
2.1.4. Adhesion Measurements

The mechanical resistance of the coated layers onto the foam structures was evaluated by ultrasonic treatment in isopropyl alcohol solution. Figure 6 shows the weight loss of the coated F20, F30 and F40 structures after each stability cycle. In all cases, the adherence of the catalytic layer to the alumina support was very good, with weight losses lower than 5%, in agreement with the literature [7,30,31,32,44]. Therefore, SCS allowed overcoming the exfoliation of coatings usually encountered in conventional dip-coating techniques [7,39,62]. The good resistance of the coated layer to mechanical stress can be ascribed to the irregular porous surface of the support, which is beneficial to anchoring or interlocking the catalytic precursors (see Figure S1 in Supplementary Materials) [63]. The worst (but even good) stability was observed for the F20 OCF, probably due to the thicker catalyst layer compared to that of F30 and F40 structures (Figure 5). Similar results were previously reported by other Authors, suggesting that the pore density of the substrate influenced the adherence properties of the resulting systems [64,65]. An increase in pore density led to a decreased GSA and, in turn, increased thickness of the catalytic layer, hindering the adhesion of the coating due to the convex surface of the foam structures [65].

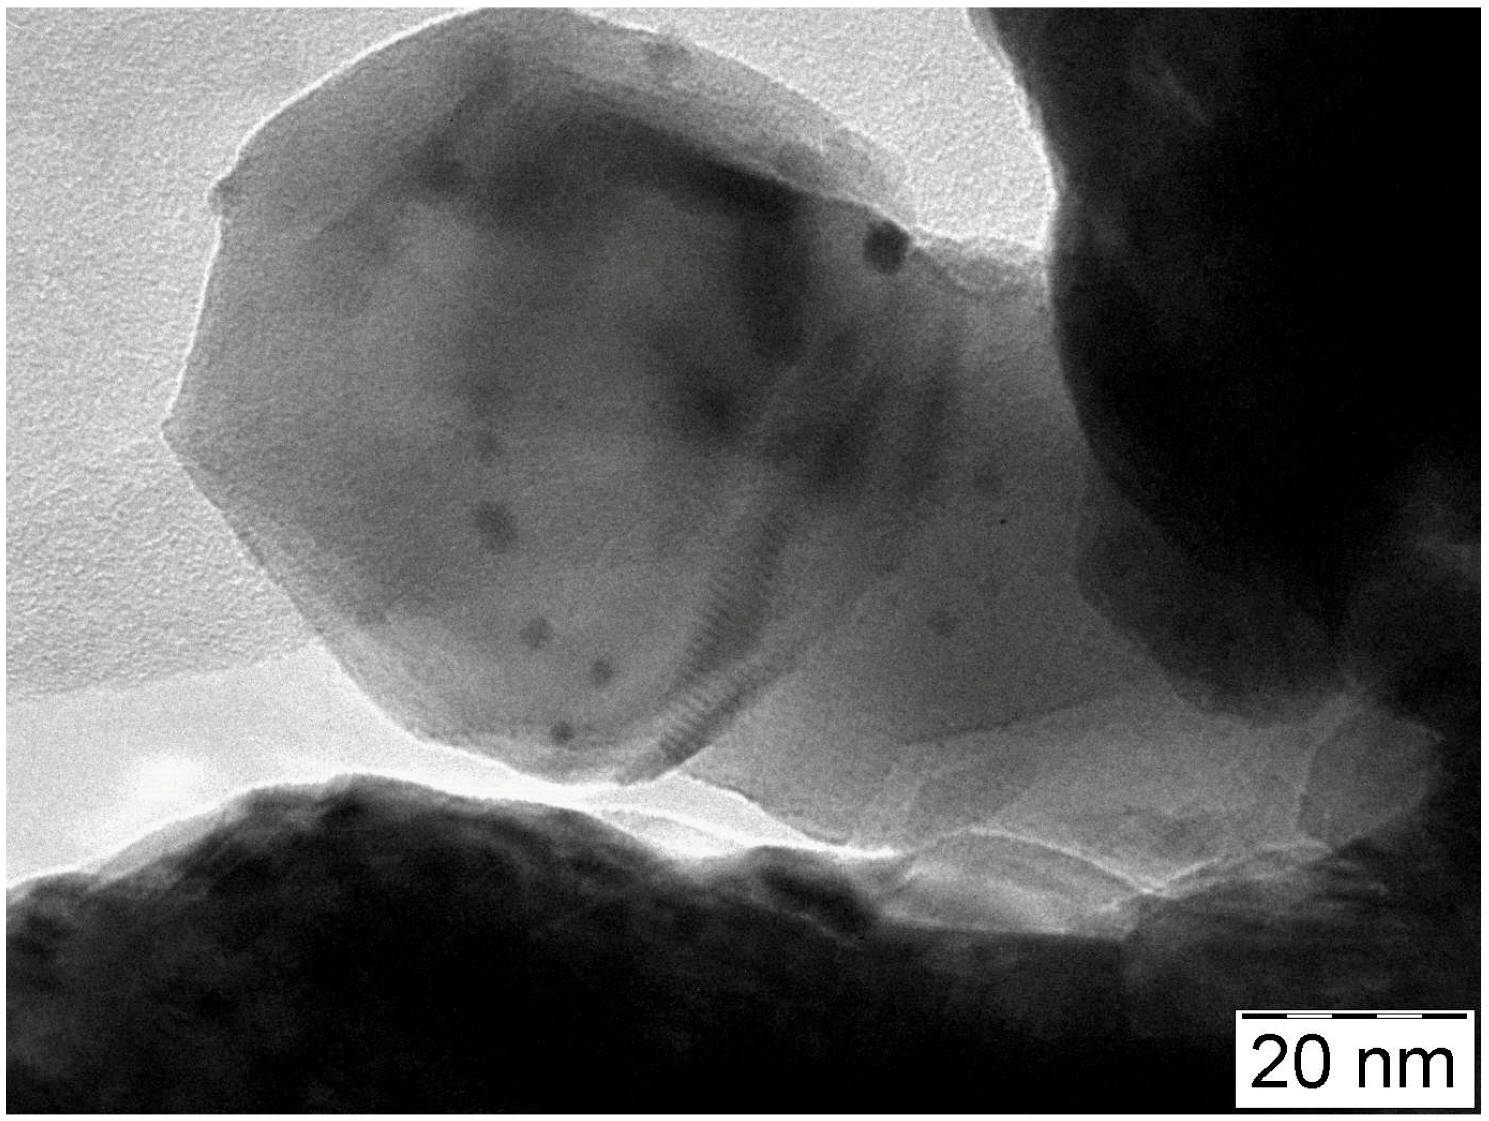
2.1.5. TEM Measurements

The morphology of the Rh/CeO2 catalytic layer was investigated by TEM analysis on the powder mechanically scraped from F40 alumina walls. TEM image in Figure 7 showed 40–70 nm CeO2 particles in agglomerate form, with well distributed Rh particles, ranging between 2 and 7 nm. A similar morphology was previously observed for Rh/CeO2 catalytic phase deposited on the inner walls of cordierite monoliths [30].

2.2. Catalytic Tests towards Biogas Steam and Oxy-Steam Reforming

2.2.1. Evaluation of External Interphase (Gas-Solid) and Internal Heat Transfer Limitations

Due to the consumption of reactants and the production or consumption of heat, temperature profiles can develop around the catalytic coating and inside the catalyst particles [66]. The criterion proposed by Mears [67] was used to check the significance of external interphase (gas-solid) heat transport limitations:
E a   ( Δ H r 0 )   R C H 4 h   G S A   R   T b 2 < 0.15
Tee values calculated ranged between 0.037–0.133 (F20), 0.022–0.079 (F30) and 0.013–0.050 (F40). Indeed, the criterion was satisfied and therefore interphase heat transport limitations can be ignored. However, it could be noticed that the gas-solid heat transfer resistance increased by the decreasing of GSA, following the order F20 > F30 > F40.
The temperature gradients inside the catalytic coating can be neglected since the Anderson criterion (Equation (8)) was satisfied [67,68]:
E a   ( Δ H r 0 )   r C H 4   ρ c   δ c 2 λ c   R   T 2 < 0.75
The values calculated (0.0001–000067) were found to be much lower than 0.75, mainly due to the extremely thin coating layer, as evidenced in SEM images (Figure 4 and Figure 5). A detailed explanation of the Mears and Anderson criteria is provided in the Supplementary Materials.

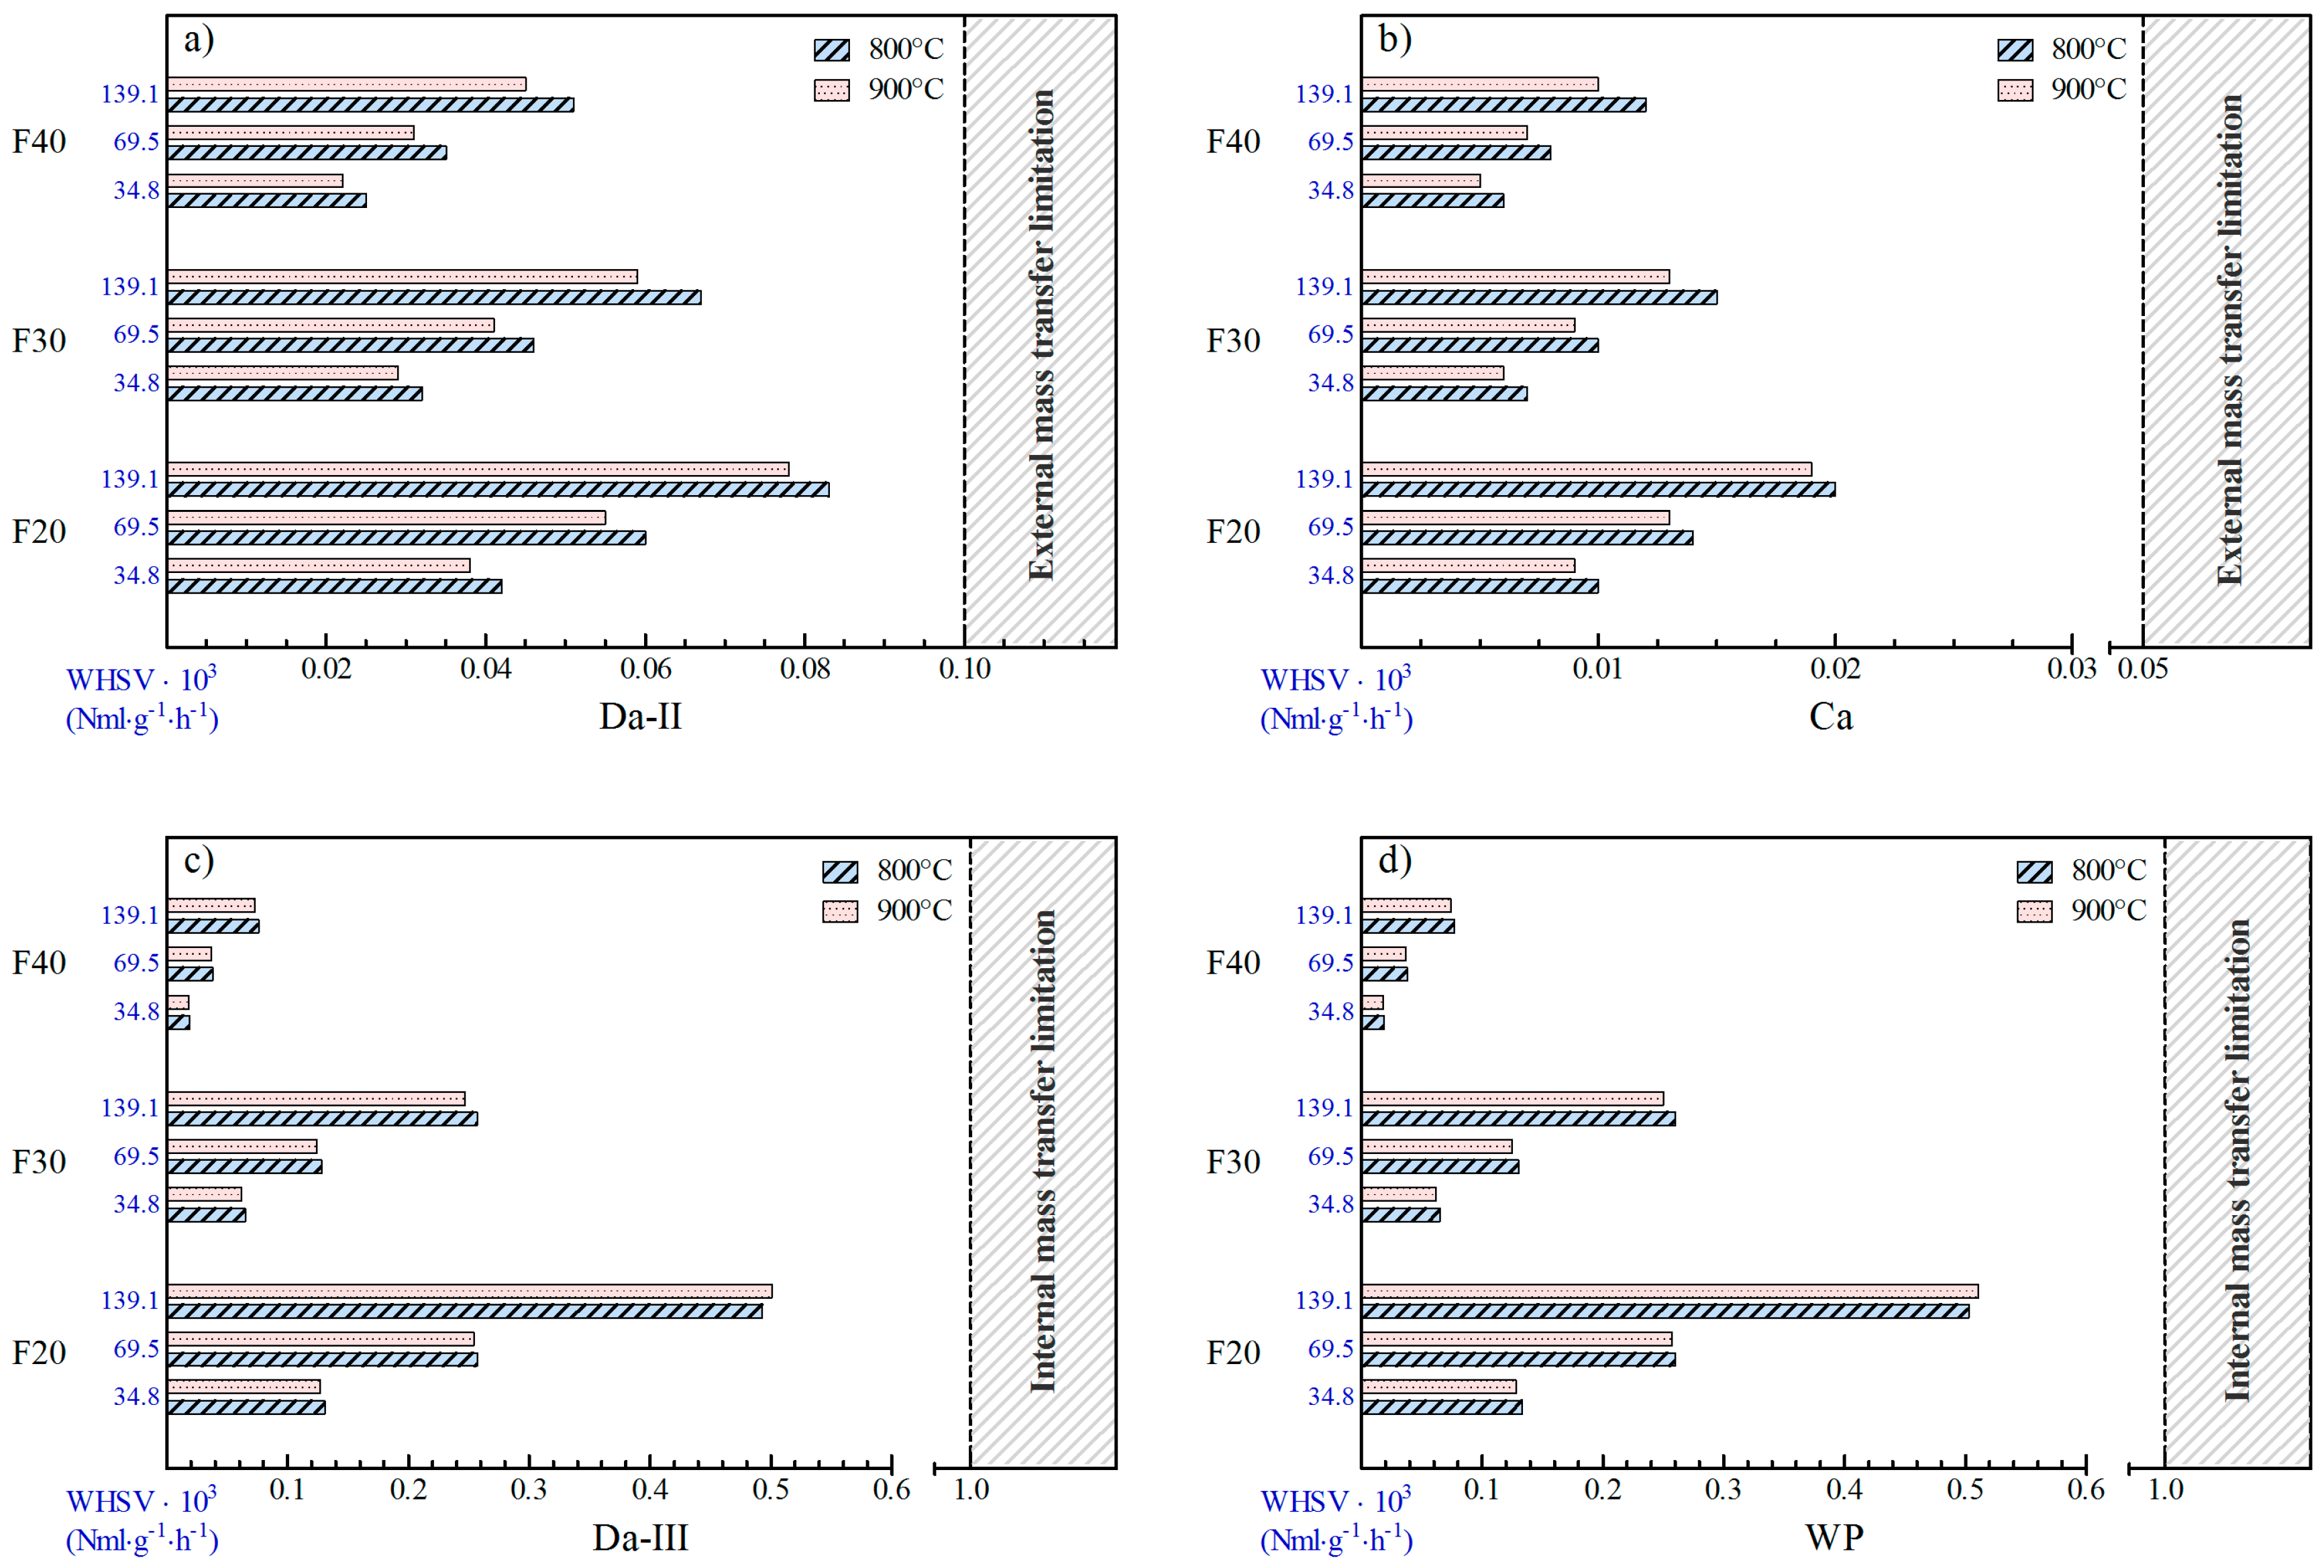
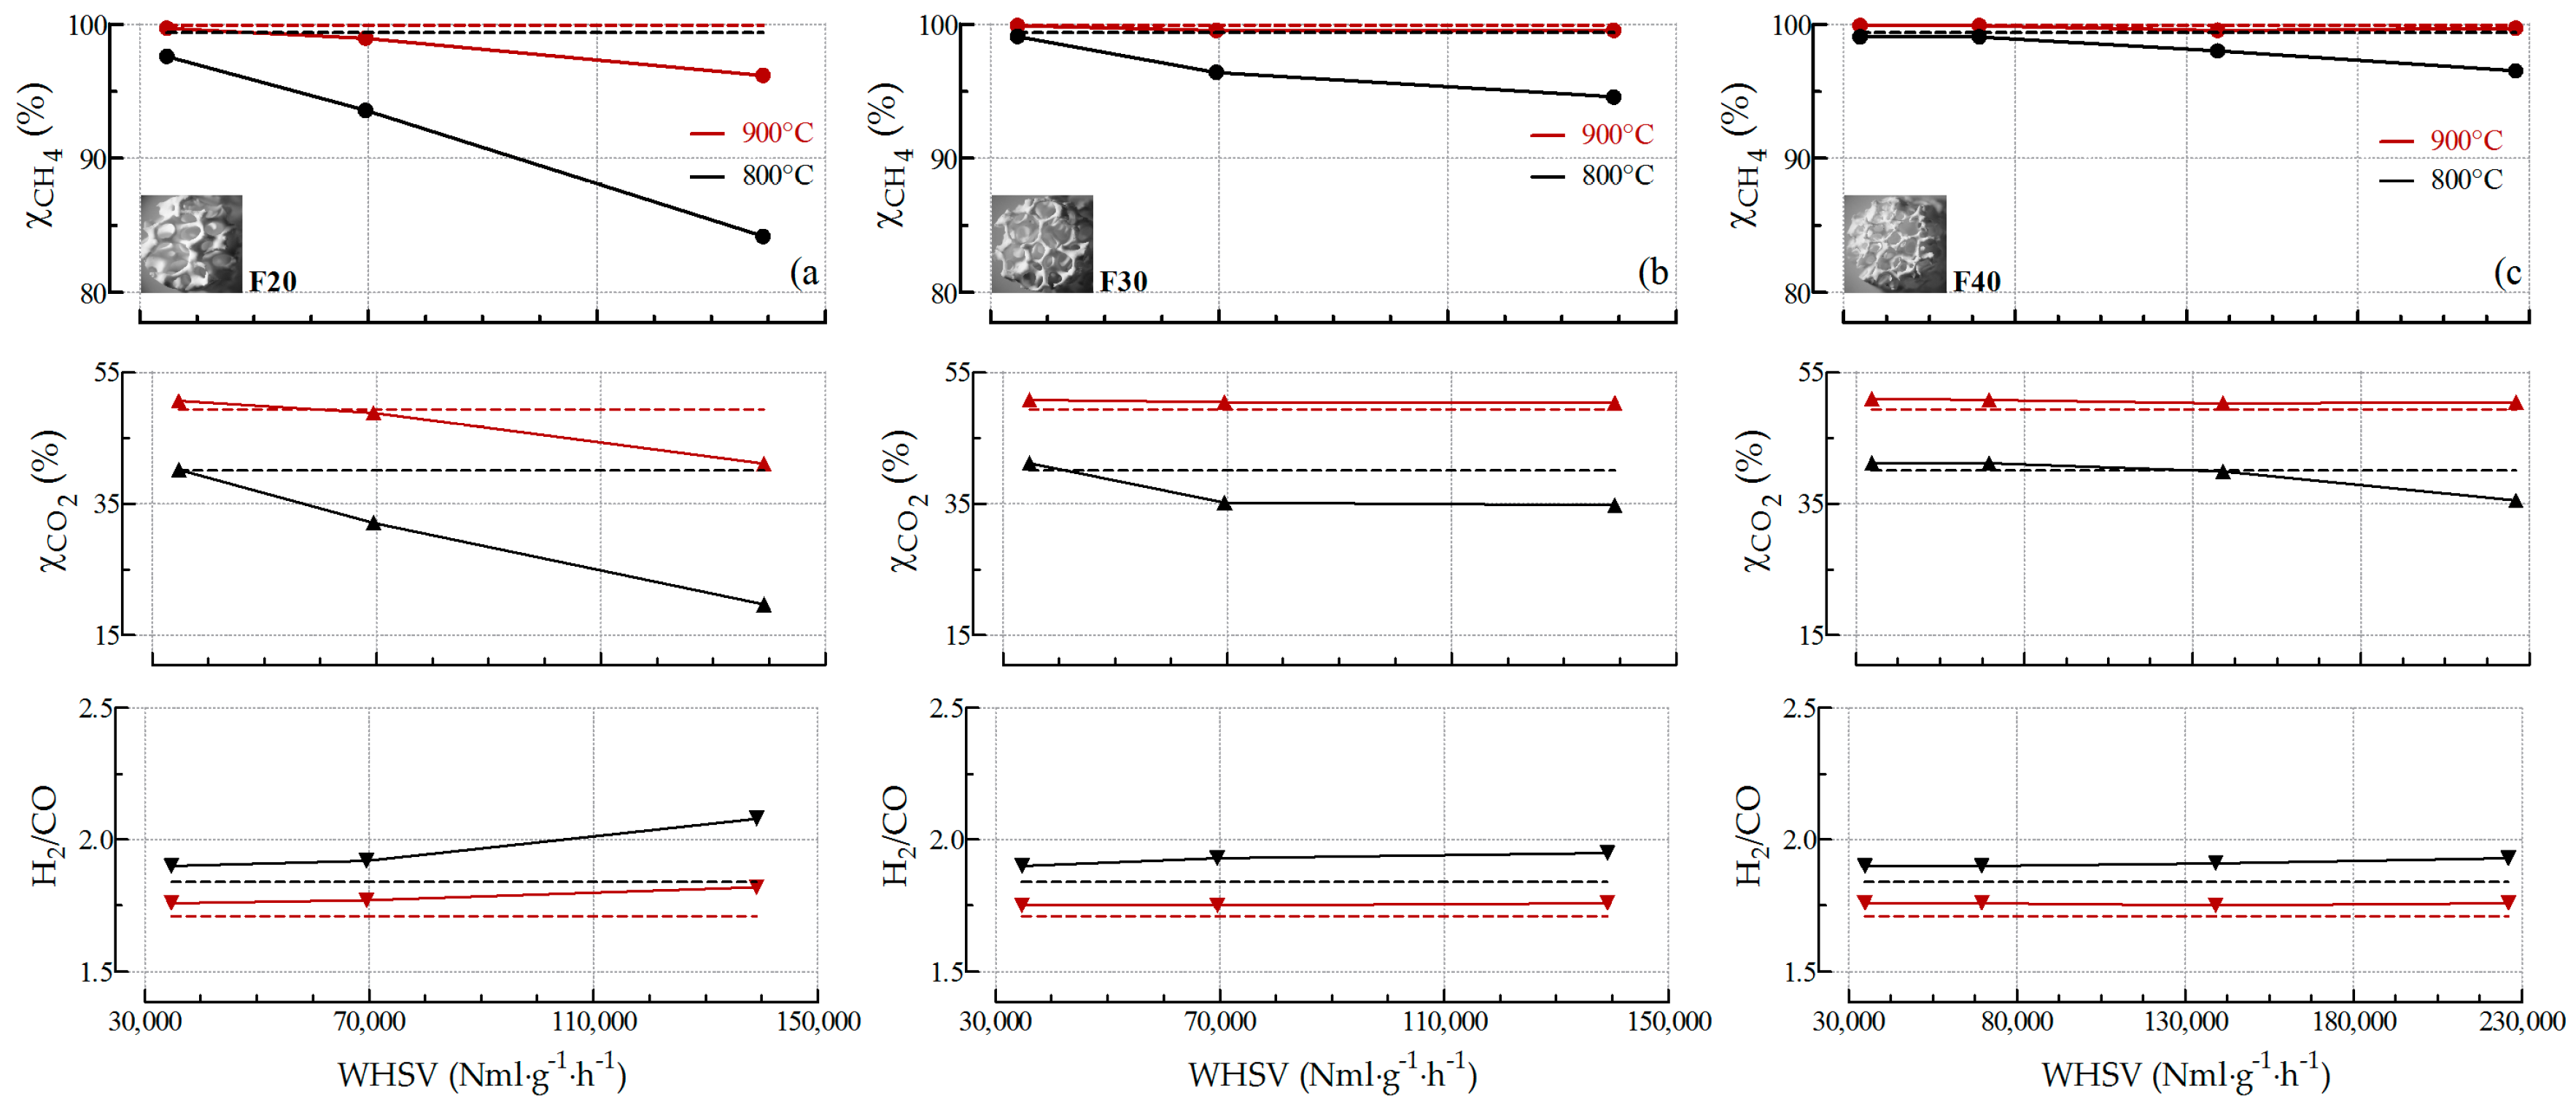
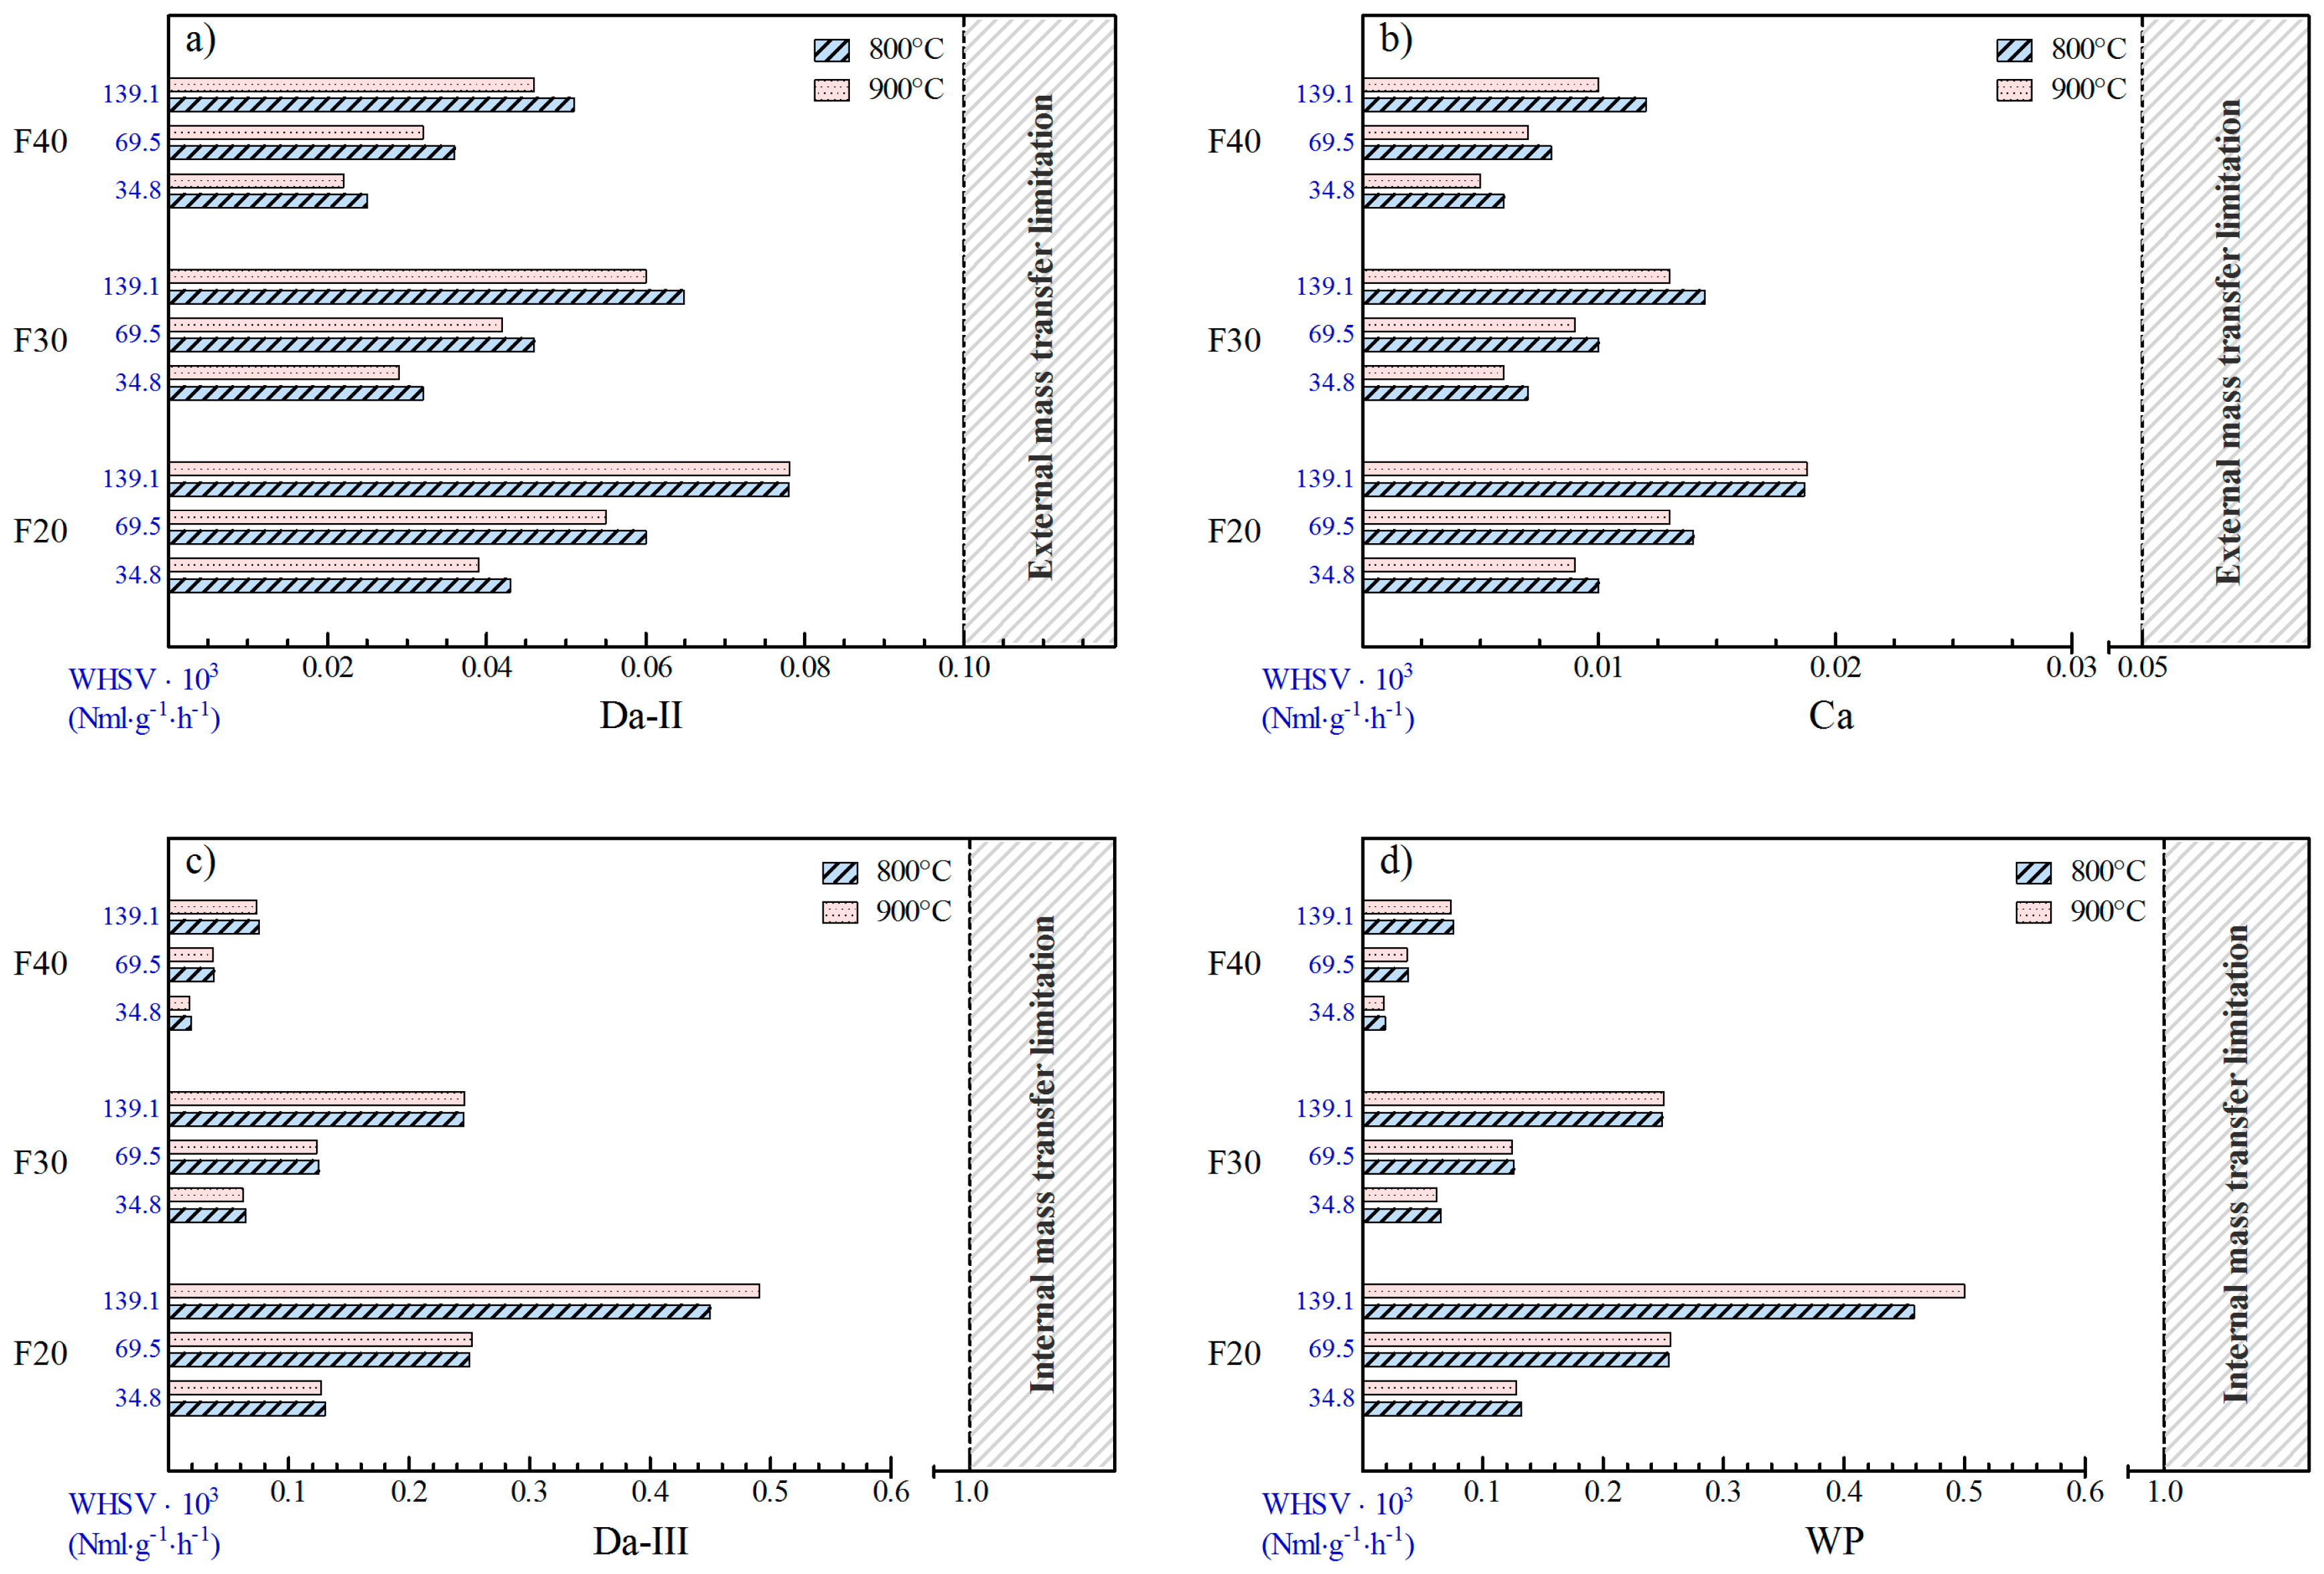
2.2.2. Evaluation of External and Internal Mass Transfer Limitations

The tortuous nature of the OCFs structures allows high contact efficiency between reactants and catalyst. However, mass transfer limitations can still occur with strong impact on the catalytic performance [69]. The catalytic reaction between reactant molecules and active sites, generally located inside the catalyst pores, takes place after the reactant molecules diffuse from gas phase to the catalyst surface (external diffusion) and through the pores of the coated layer (internal diffusion). Thus, three operating regimes, namely kinetic, external mass transfer and internal diffusion, can control the reforming processes. In addition, it is important to exclude any type of mass transfer limitation in order to improve the mixing and optimize the geometry of the reforming reactor [69,70].
As previously reported [31], the characteristic time analysis is widely used to investigate physical and chemical processes involved in structured catalysts. A detailed explanation of the calculations is provided in the Supplementary Materials. To describe the trade-off between reaction kinetic (reaction time scale) and convective transport flux (diffusion time scale) the first Damkohler (Da-I) number was introduced as the ratio between the residence time (tc) and the characteristic reaction time (tr):
D a - I = t c t r > 1
The Da-I numbers calculated (2.8–3.2) were found to be greater than 1 due to high voidage of alumina OCFs (0.86–0.89, as shown in Table 1), confirming that the reactant mixture had sufficient time to react over the catalyst within OCFs pores. High Da-I values showed the potential to increase space velocity even at values higher than 140,000 NmL·g−1·h−1. This condition is necessary to ensure high reforming performances of the catalysts under investigation, while the influence of the external and internal mass transfer limitations was investigated by calculating the second Damköhler (Da-II) and the third Damköhler (Da-III) numbers, respectively [42,71,72,73].
The dimensionless Da-II number relates the reaction rate to the external transport phenomena in the system. It can be calculated from a relation between the characteristic external mass transfer time (text) and the characteristic reaction time (tr):
D a - I I = t e x t t r < 0.1
If Da-II number is greater than 0.1, external mass transfer limitations become important in the system, allowing for a concentration gradient between the bulk gas and the outside surface of the coated layer [74,75]. Figure 8a and Figure 9a show the calculated values for biogas SR and OSR experiments, respectively. In both cases, Da-II increased by increasing the space velocity or by decreasing the pore density, whereas it was not much affected by the temperature [75]. Moreover, Da-II number lower than 0.1 (0.02–0.08) revealed the absence of external diffusion limitations at all the investigated conditions. However, F20 catalyst showed Da-II numbers close to 0.1 (0.08) at 140,000 NmL·g−1·h−1, indicating that the reactants could not have enough time for mass transfer and reaction. The effect of external diffusion on the reforming activity was also estimated by the Carberry criterion for a first-order reaction with respect to methane [76,77]:
C a = R C H 4 k G   G S A   C C H 4 < 0.05
According to Ca numbers, the results showed that biogas SR (Figure 8b) and OSR (Figure 9b) experiments were not affected by external diffusion limitations, confirming the results obtained by calculating Da-II. However, high pore density OCF (F40) with smaller pore diameter and higher geometric surface area (Table 1) emerged as the more adequate configuration.
The internal mass transfer limitations were investigated by calculating the third Damköhler number (Da-III) as the ratio between the characteristic coated layer diffusion time (tint) and the characteristic reaction time (tr):
D a - I I I = t i n t t r < 1
Da-III values (0.02–0.50) lower than 1 excluded any internal mass transfer controlling regime at all the investigated conditions (Figure 8c and Figure 9c). Thus, reactants rapidly diffused through the pores of the coated layer, avoiding the formation of concentration gradients between the catalyst surface and active sites [78,79]. These results were also confirmed by using the Weisz-Prater criterion [25,31], as reported in Figure 8d (biogas SR) and Figure 9d (biogas OSR).
W P = r C H 4   ρ c   δ c 2 D C H 4 , e   C C H 4 , s < 1
The WP values calculated (0.02–0.50) highlighted the absence of any internal mass transfer limitation, mainly due to thin coating thickness provided by the SCS method (Figure 5).

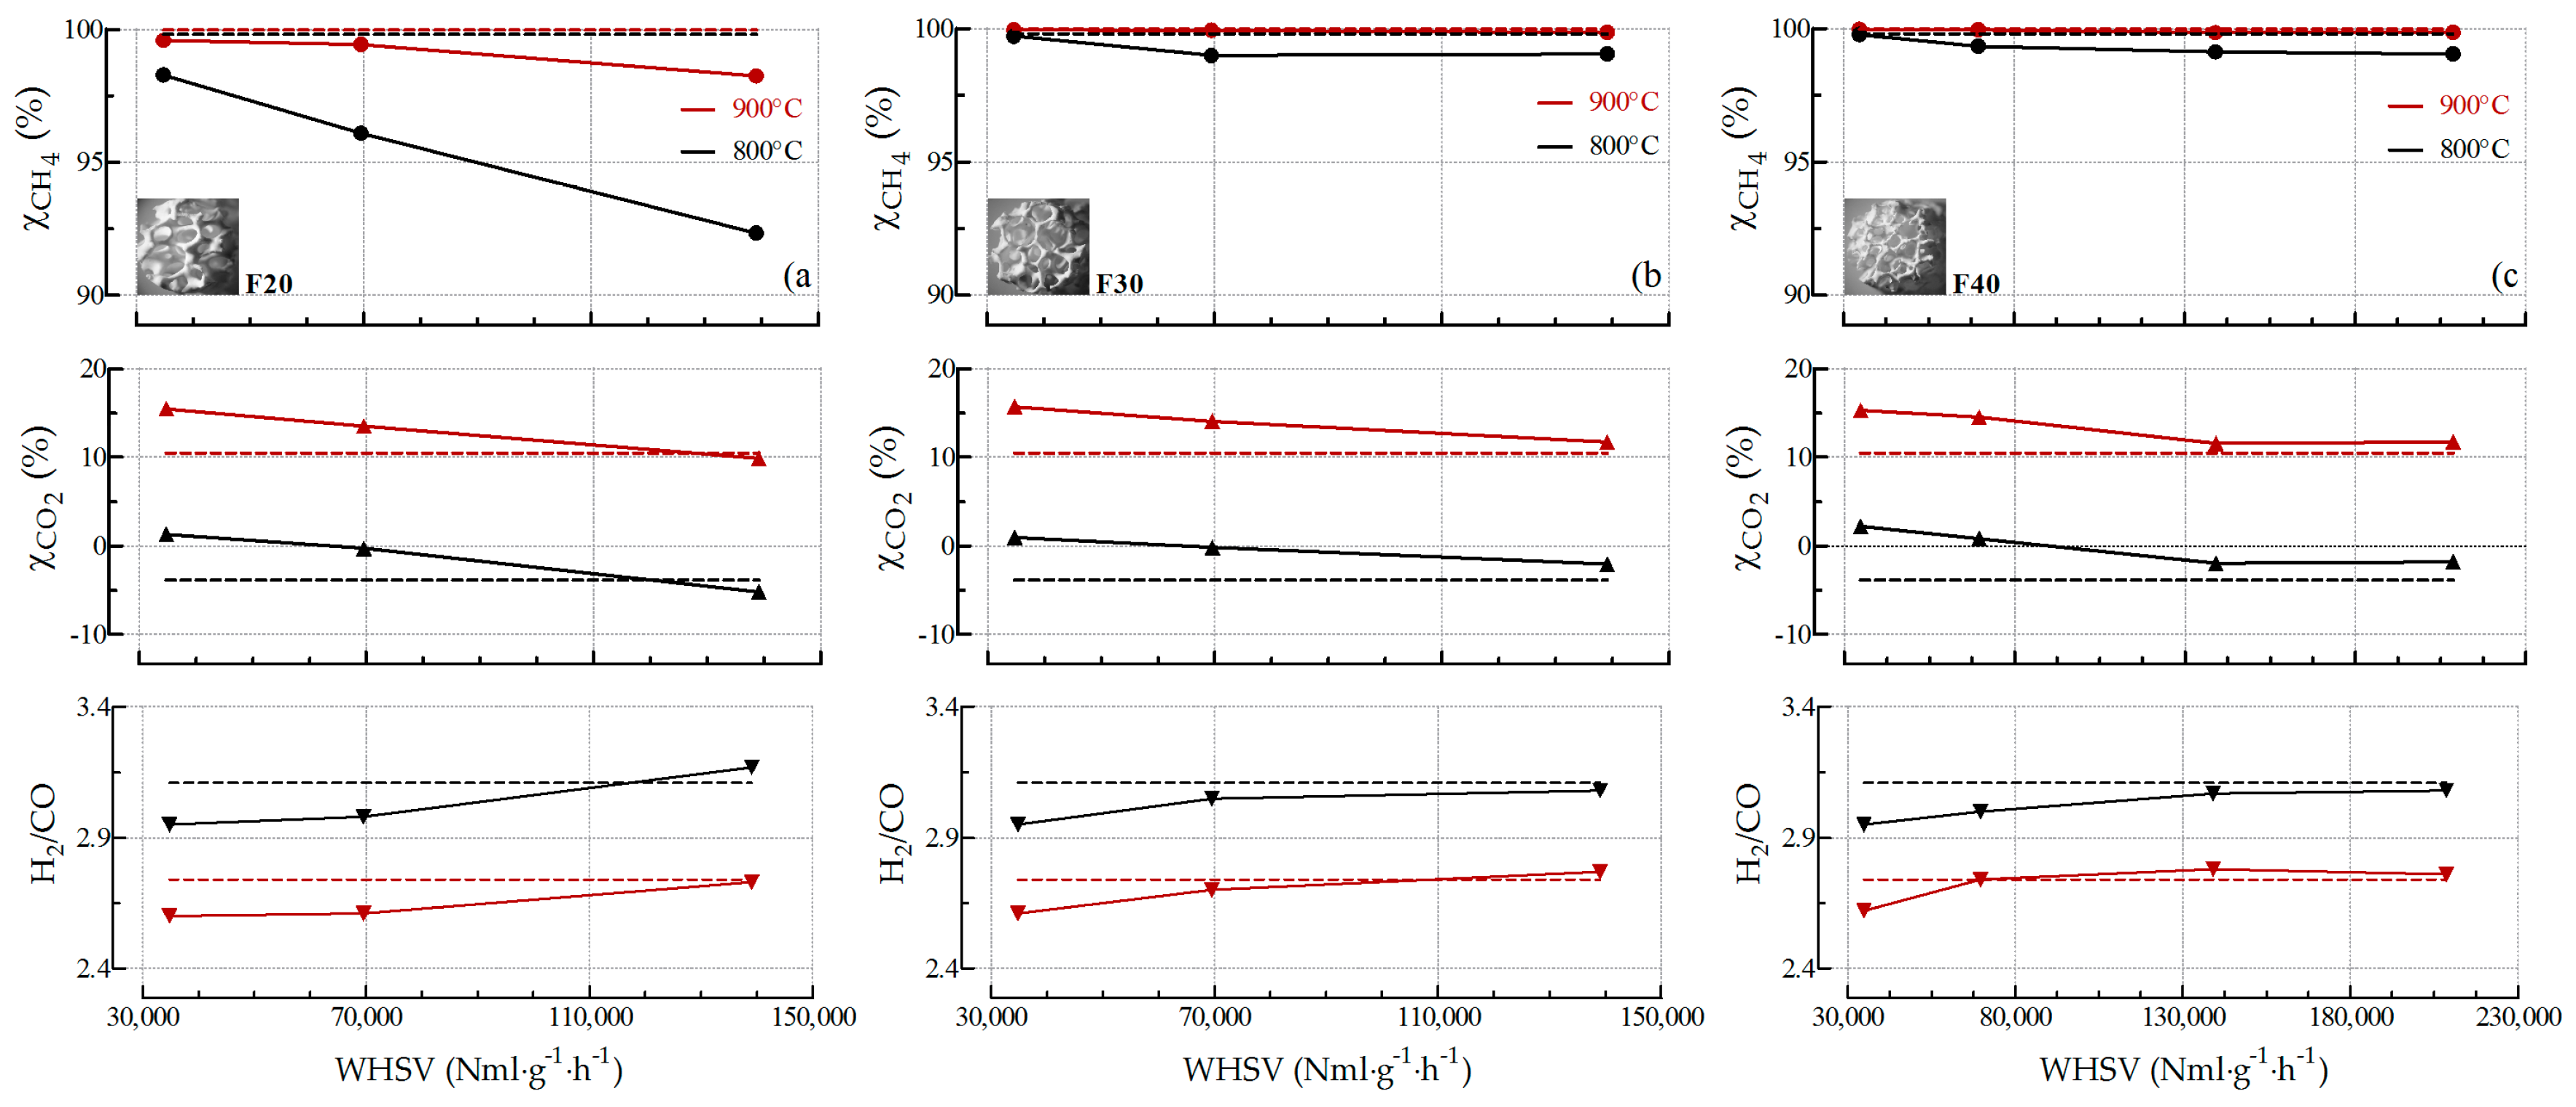
2.2.3. Influence of the Pore Density on Biogas SR and OSR Activity

Figure 10 shows the influence of temperature (TSET = 800–900 °C) and space velocity (WHSV = 35,000–140,000 NmL·g−1·h−1) on biogas SR activity in terms of CH4 and CO2 conversion and H2/CO molar ratio. Thermodynamic data are also reported for comparison. The F20 structured catalyst showed almost total CH4 conversion at 900 °C and 35,000 NmL·g−1·h−1 (Figure 10a), slightly decreasing afterwards to ca. 98% by increasing the space velocity up to 140,000 NmL·g−1·h−1. The same trend was observed for CO2 conversion, which decreased from 16 to 10%, remaining slightly higher than the equilibrium value, due to the effect of the reverse WGS reaction [30,32,33]. This result led to H2/CO ratios (2.60–2.73) slightly lower than the thermodynamic values (2.74). Both CH4 and CO2 conversions decreased by decreasing the temperature and increasing the space velocity (Figure 10a). Indeed, the F20 sample showed ca. 98% of CH4 conversion at 800 °C and 35,000 NmL·g−1·h−1, which lowered to ca. 92% at 140,000 NmL·g−1·h−1, due to the decreased contact time between reactants and catalyst. Moreover, negative values of CO2 conversion were revealed as the result of the competition between DR (Equation (1)), SR (Equation (2)) and WGS reactions [19,33,80]. Indeed, at high steam content (S/CH4 = 3), CH4 reacted preferentially with steam due to the more stable nature of CO2, leading to a lower contribution of the DR reaction. Simultaneously, the greater contribution of the CO2-producing WGS reaction led to a negative CO2 conversion at 800 °C and 140,000 NmL·g−1·h−1 (Figure 10a). Similar trends were reported by Ashrafi et al. [81]; CO2 conversion data ranged from ca. −27% to 10% were shown at S/CH4 ratio of 2.71 in the temperature range of 600–900 °C [81]. The decrease in catalytic activity by increasing the space velocity was less pronounced as the pore density increased to 30 ppi (Figure 10b, F30) and 40 ppi (Figure 10c, F40). In fact, F30 and F40 catalysts showed almost total (<99%) and stable CH4 conversion at all the investigated conditions.
Similarly, the pore density of OFCs affected the OSR activity. Figure 11 shows the influence of temperature (TSET = 800–900 °C) and space velocity (WHSV = 35,000–140,000 NmL·g−1·h−1) on biogas OSR activity for the three OCFs catalysts, along with the thermodynamic data, reported as dotted lines. At WHSV of 35,000 NmL·g−1·h−1, the experimental results were very close to the equilibrium calculations for all the structured catalysts. However, both CH4 and CO2 conversion decreased by increasing space velocity over the F20 system (Figure 11a), leading to an increase of the H2/CO ratio [82,83]. As expected, a higher activity was observed by increasing the pore density to 30 and 40 ppi. At high temperature (900 °C), the F30 and F40 catalysts showed CH4 (99.6%) and CO2 (50.6%) conversion very close to the equilibrium at all the investigated space velocities. Instead, a slight decrease of CH4 conversion from ca. 99 to 95% was observed at 800 °C by increasing the space velocity up to 140,000 NmL·g−1·h−1 over the F30 system (Figure 11b). In these conditions, the F40 catalyst still showed high CH4 conversion (ca. 98–99%), which slightly decreased to ca. 96% by further increasing the space velocity up to 140,000 NmL·g−1·h−1.

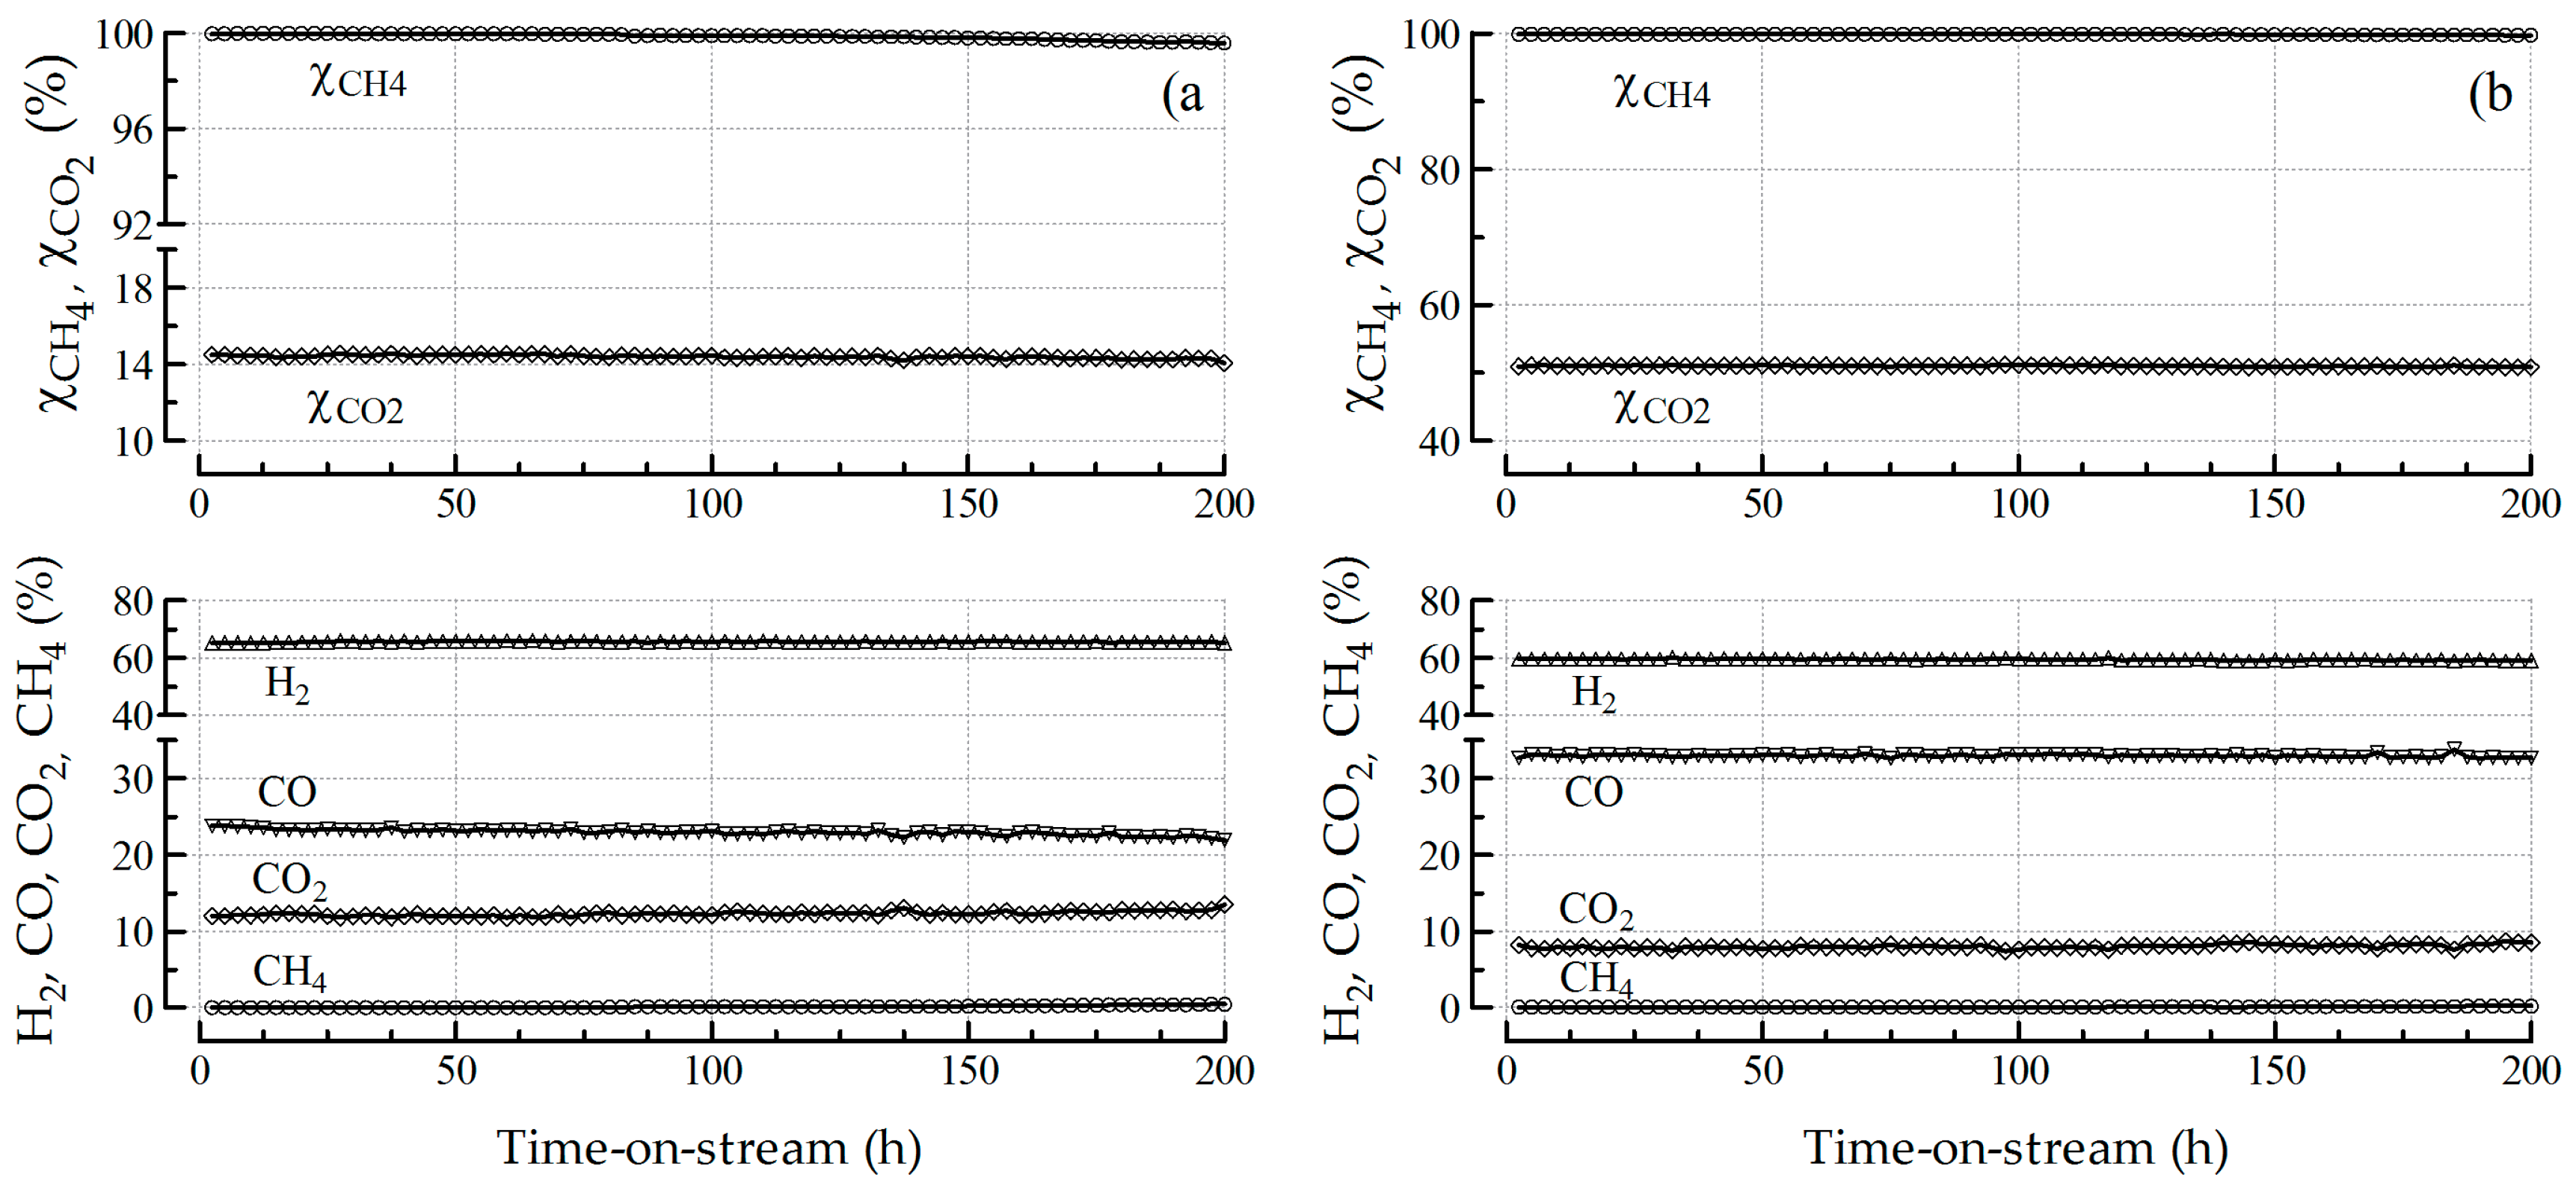
2.2.4. Stability towards SR and OSR Processes

The stability evaluation is a noticeable issue in commercial application of heterogeneous structured catalysts [33,84]. Long-term tests were carried out over F40 catalyst at extreme operative conditions, such as TSET = 900 °C and GHSV = 70,000 NmL·g−1·h−1, with consecutive start-up and shut-down cycles. Figure 12 shows the results as CH4 and CO2 conversion and effluent composition over 200 h TOS for both SR (Figure 12a) and OSR (Figure 12b) experiments. Clearly, the F40 catalyst showed a steady performance, with negligible changes during the stability tests, indicating that the Rh/CeO2 catalytic phase did not deactivate during TOS. Only a slight deactivation was observed for biogas SR test after 150 h, probably due to a slight sintering of Rh active phase induced by the high reaction temperature, as previously reported [30].

3. Discussion

The SR and OSR activity of OCFs coated with Rh/CeO2 catalyst increased with pore density of the structures under investigation (Figure 10 and Figure 11). As the number of catalyst active sites were fixed per unit volume of alumina foam by using the same catalyst loading (1.5 wt.% Rh immobilized over ~170 mg of ceria carrier), the observed catalytic performances indicated the importance of catalyst layer thickness and geometric characteristics. Indeed, activity results could be attributed first to the exposed surface area of the catalysts. In fact, the increase of GSA from 669 (F20) to 1273 m2·m−3 (F40) (Table 1) led to an increase in both SR and OSR activity following the order F20 < F30 ≈ F40. Moreover, a decrease in pore diameter resulted in improved heat and mass transport properties, as evidenced by the results of the previously discussed criteria.
Although the Mears criterion revealed the absence of external interphase (gas-solid) heat transport limitations, as well as Damköhler (Da-II) and Carberry numbers revealed the absence of external mass transfer limitations, the observed transport properties can play an important role in determining the catalytic performances. The values of these criteria decreased with increasing pore density, which indicated the enhancement in heat and mass transfer characteristics. It is well known that the fluid turbulence caused by tortuous flow path and radial convective flows is a major cause of gas-solid heat transfer improvement. Therefore, the increase in pressure drop values with pore density (Figure 3) led to higher turbulence and improved transport characteristics with potential reduction of reactor size. The higher values on the F20 catalyst estimated by Mears criterion were indicative of lower gas-solid heat transfer efficiency, contributing to the lower catalytic activity of F20 catalyst as compared to F30 and F40 systems. Similarly, the high external mass transfer resistance (Figure 8 and Figure 9) of F20 catalyst allowed for a concentration gradient between the bulk gas and catalyst surface, leading to a drop in reactants conversion (Figure 10a and Figure 11a) while almost stable activity was observed for F30 and F40 catalysts, due to their improved transport properties, as confirmed by Da-II and Carberry numbers. Mbodji et al. [85] reported comparable results on methane SR in a millistructured reactor. In their study, external mass transfer limitations appeared on a highly active catalyst at high temperature and large hydraulic diameter (< 1 mm). Arzamendi et al. [86] showed that in the case of Rh-based catalyst, it was needed to decrease the hydraulic diameter below 0.4 mm to eliminate external mass transfer limitations for process intensification. In addition, the lower porosity and pores size of the 40 ppi system led to higher pressure drop (Figure 2) and increased residence time of reactants, thus resulting as the more adequate configuration for hydrogen production [87].
As reported by several Authors [88,89,90,91], the thickness of the coated layer strongly affects both the heat and reactants diffusion through the catalyst pores. Indeed, the resistance to internal diffusion increased with increasing the coating thickness, leading to higher Anderson criterion values (heat transfer limitations), as well as higher Da-III and W-P numbers (mass transfer limitations) [31,38,69,79]. In this regard, a thicker catalyst layer (such as > 100–150 μm) still remains a major issue of the systems prepared by conventional washcoating technique [62,92,93]. If the washcoat is thin and well anchored, all the active sites are accessible to reagents but the amount of catalyst could be not sufficient to process the inflowing reactants, decreasing CH4 and CO2 conversions. On the other side, the greater the amount of catalyst, the thicker washcoated layer, resulting in internal transfer limitations. Thus, high reactor throughput requires an excellent control of the catalyst layer thickness, that need to be sufficient (to ensure high H2 yield) and sufficiently thin (to guarantee the absence of internal limitation) [91,94], as demonstrated also for other catalytic reactions [95]. As most interesting conclusion, the SCS method allowed the in-situ deposition of very thin (5–40 μm) catalytic layers (Table 1), avoiding internal heat and mass transfer limitations and positively affecting the performance towards biogas reforming processes. Moreover, this resulted in increased volumetric catalyst productivity for high reactor throughput with increasing in pore density while operating in kinetic control regime.

4. Experimental Section

4.1. Chemicals and Foams

Technical grade cerium nitrate (Ce(NO3)3·3H2O), rhodium nitrate (Rh(NO3)3·nH2O), urea (CH4N2O), isopropyl alcohol (C3H8O) and acetone (C3H6O) were purchased from Sigma-Aldrich (St. Louis, MO, USA). All aqueous solutions were prepared using ultrapure water (Millipore Milli-Q system with resistivity > 18 MΩ cm). High purity (99.999 vol%) CH4, CO2, H2, N2 and O2 gases were supplied in cylinders by Rivoira S.p.A. (Milan, Italy). Alumina-based ceramic OCFs with pore density of 20, 30 and 40 ppi were purchased from Lanik S.r.o. (Czech Republic).

4.2. Catalysts Preparation

Cylindrical OCFs (10 mm diameter, 15 mm length) were sonicated in water/acetone (50/50 vol.%) mixture for 30 min and dried at 120 °C for 2 h. The structured catalysts were prepared in two subsequent steps: (i) SCS procedure to in-situ deposit the CeO2 carrier and (ii) WI of the Rh active phase.
Briefly, the OCFs were dipped in an aqueous solution containing cerium nitrate as precursor and urea as fuel, then introduced into a muffle furnace preheated at 600 °C for ca. 10 min to initiate the combustion reaction and rapidly cooled down to room temperature in few minutes. The process was repeated for 4–6 times to deposit ca. 170 mg of CeO2 carrier [25,30,32,46,47]. Figure 13 shows the loaded CeO2 carrier versus the number of immersion cycles for different substrates. 4 cycles were needed for 40 ppi OCF due to its relatively high GSA (Table 1), while 6 cycles were required to deposit approximately the same CeO2 loading (170 mg) on 20 ppi OCF.
Then, the 1.5 wt.% Rh active phase was deposited by WI technique. The coated structures were dipped in an aqueous solution of rhodium precursor, calculated based on the deposited CeO2 carrier. After each immersion, the structures were dried at 120 °C for ca. 10 min. Afterwards, the coated OCFs were calcined at 800 °C in static air for 2 h.
The analysis of the diffraction pattern of coated OCF showed the characteristic peaks of both cubic CeO2 fluorite and α-Al2O3 phase, while no diffraction peaks of Rh oxides were detected, due to the low loading and high dispersion of the noble metal (see Figure S2 in Supplementary Materials) [96,97,98,99].
The calculated catalyst loading, as amount of Rh/CeO2 catalyst per exposed surface area of the foam structure, followed the order 40 ppi OCF (12.0 mg·cm−2) < 30 ppi OCF (15.2 mg·cm−2) < 20 ppi OCF (22.2 mg·cm−2) (Table 1).

4.3. Physicochemical Characterization

All OCFs were scanned with Nikon SMZ1500 Stereoscope (Nikon Cooperation, Tokyo, Japan) and the images processed by ImageJ software (NIH, Bethesda, MD, USA) to measure characteristic geometric dimensions.
OCFs porosity was determined by helium pycnometry using a Micromeritics 1305 Multivolume Pycnometer (Norcross, GA, USA).
X-ray diffraction (XRD) patterns were recorded by a Philips X-Pert 3710 diffractometer (Almelo, the Netherlands) with a scanning speed of 1.50°·min−1 over the range 2θ = 20°–75°. The diffractometer was equipped with a Cu Kα radiation source, operating at 40 kV and 20 mA. The coated OCF was finely ground before the measurements. The peaks were assigned according to the PCPFWIN database. The CeO2 crystallite size was calculated by the Scherrer equation based on the CeO2 (111) reflection peak.
N2 adsorption-desorption was carried out at liquid nitrogen temperature (196 °C) with a Micromeritics ASAP 2020 instrument (Micrometrics Inc., Norcross, GA, USA) to measure the Brunauer-Emmett-Teller (BET) specific surface area Barrett-Joyner-Halenda (BJH) pore volume. The samples were degassed by heating at 300 °C under vacuum for 6 h before the measurement.
A U-tube manometer connected to the reactor containing the OCFs was used to measure the pressure drop at different superficial velocities. N2 flow was supplied at ambient temperature by a mass flow-meter (Brooks Instrument, Hatfield, PA, USA) and measured by a digital flow-meter (Agilent ADM 2000, Santa Clara, CA, USA). The height difference between the two columns of water in the two branches of the U-tube manometer was converted into pressure drop via the Stevin’s law ( Δ z = Δ P g · ρ H 2 O ) [7].
The coating procedure was evaluated in terms of homogeneity of the coating, amount of catalyst deposited and adhesion force. SEM/EDX images were collected by using a Philips XL-30 FEG ESEM (FEI-Phillips, Hillsboro, OR, USA) in order to analyse the morphological characteristics of the coatings deposited onto the structures. The structured samples were cut longitudinally to evaluate the thickness of the catalytic layer. At least 30 images for each OCF were collected. The adherence of the coating layer was evaluated in terms of weight loss after ultrasonic treatment in 50 vol.% isopropyl alcohol solution. The coated OCFs were treated for 15 min at 45 kHz and 130 W using the USC 900D ultrasonic bath and dried for 1 h at 120 °C. The sequence was repeated several times until the weight loss stayed stable. The weight loss percentage was referred to the catalytic layer deposited.
TEM micrographs were obtained using a Philips CM12 instrument (FEI-Phillips, Hillsboro, OR, USA). The reduced coating layer was scraped from the OCF walls, dispersed in isopropyl alcohol by ultrasonic treatment and placed on holey copper grids.

4.4. Catalytic Tests

A detailed description of the experimental setup is provided in our previous publications [25,30,32,46,47]. Biogas SR and OSR experiments were carried out at atmospheric pressure in a quartz fixed-bed reactor. The structured catalysts were placed at the centre of the reactor and inserted into a furnace equipped with a PID temperature controller. A simulated biogas (CH4:CO2 = 60:40 v/v) was used for the investigations. SR experiments were carried out at fixed steam-to-methane molar ratio (S/CH4 = 3), varying temperature (TSET = 800–900 °C) and space velocity (WHSV = 35,000–140,000 NmL·g−1·h−1, defined as hourly volume of the gaseous feed per gram of catalytic layer). Similarly, OSR experiments were carried out at fixed S/CH4 = 1 and oxygen-to-methane molar ratio (O2/CH4 = 0.2). Activity tests were conducted for 6 h and repeated three times to verify the repeatability. Catalyst stability was investigated over 200 h of TOS through consecutive start-up and shut-down cycles as accelerated stress test. Before the catalytic tests, the structured catalysts were reduced in-situ with a flow of H2/N2 (50/50 vol.%, 30 Nml·min−1) at 300 °C for 1 h. Mass flow controllers (Brooks Instrument Smart Mass Flow, Hatfield, PA, USA) were used to measure and control the flow of gaseous reactants. Steam was fed using an isocratic pump (Agilent 1100 Series) and an evaporator. The composition of reagents and products was determined using an on-line gas chromatograph (Agilent 6890 Plus) equipped with thermal conductivity (TCD) and flame ionization (FID) detectors. The results are reported in terms of CH4 conversion ( χ CH 4 ), CO2 conversion ( χ CO 2 ) and hydrogen-to-carbon monoxide ratio (H2/CO) in reaction products. Chemical composition in thermochemical equilibrium was calculated with HSC Chemistry 7.1® calculation software (Outotec Oyj Technologies, Espoo, Finland), using the Gibbs free-energy minimization method.

5. Conclusions

As potential structured catalytic supports, alumina open-cell foams (OCFs) with different pore density (20, 30 and 40 ppi) were investigated towards biogas steam reforming (SR) and oxidative steam reforming (OSR) processes for syngas production. Catalytic alumina OCFs were synthesized with a thin and uniform Rh/CeO2 catalyst layer by coupling: (i) solution combustion synthesis (SCS) to in-situ deposit the CeO2 carrier and (ii) wet impregnation (WI) of the Rh active phase. Various physico-chemical characterization techniques were utilized to determine geometric and catalytic characteristics of bare and coated foams. Then, the catalytic performance of coated foams was evaluated at atmospheric pressure by varying temperature (800–900 °C) and space velocity (35,000–140,000 NmL·g−1·h−1). Characteristic time analysis and dimensionless numbers were calculated to assess the prevalence of the kinetic regime on mass and heat transfer limitations. OCFs showed a variation in pore size with increasing pore density which further influenced the other geometric and catalytic characteristics. The results of characterization techniques (XRD, SEM/EDX and TEM) highlighted the non-dependence of physico-chemical characteristics of coated catalysts on the geometry of the OCFs, with the exception of the catalyst layer thickness. Ultrasound adherence tests confirmed the excellent mechanical resistance of the coated layers, with weight losses lower than 5%. The structured catalysts showed outstanding results in biogas SR and OSR, following the activity order 20 ppi < 30 ppi ≈ 40 ppi, mainly due to the increased geometric surface area, heat and mass transfer properties. No internal and external heat and mass transport limitations were observed as evaluated by different criteria. A very homogeneous and thin (ranging from 5 to 40 μm with increasing the pore density) catalytic coated layer was successfully deposited by using the SCS technique which resulted in negligible internal heat and mass transport limitations and excellent catalytic performance. The decrease in pore size of the alumina OCF resulted in higher pressure drop and fluid turbulence, leading to improved gas-solid transport characteristics and catalytic performances with potential reduction of reactor size. A stable catalytic activity of F40 structured catalyst was observed over 200 h of TOS for both biogas SR and OSR processes.

Supplementary Materials

The following are available online at https://www.mdpi.com/2073-4344/8/10/448/s1, Figure S1. SEM micrographs of bare (a,c,e) and Rh/CeO2-coated (b,d,f) OCFs: F20 (a,b), F30 (c,d) and F40 (e,f) structures (inset: images of the macroscopic bare OFCs), Figure S2. XRD pattern of Rh/CeO2 as a powder, bare and Rh/CeO2-coated F30 (included also reference peaks of CeO2: JPDS 4-593 and reference peaks of Al2O3: JPDS 10-0173).

Author Contributions

All Authors have written the manuscript. C.I. has prepared the samples and performed the catalytic tests. C.I. and A.V. performed XRD, BET and SEM analysis. M.A.A. and S.S. determined geometric properties and pressure drops. M.A.A., C.I. and C.W.M.Q. performed the calculations. A.V., L.P. and S.S. coordinated the research activities.

Funding

This research was funded by the Italian Ministry of Education, University and Research (MIUR).

Acknowledgments

This work was financially supported by the Italian Ministry of Education, University and Research (MIUR, Progetti di Ricerca Scientifica di Rilevante Interesse Nazionale 2010–2011) within the project: “Intensification of catalytic processes for clean energy, low-emission transport and sustainable chemistry using open-cell FOAMS as novel advanced structured materials” (IFOAMS, protocol no. 2010XFT2BB).

Conflicts of Interest

The authors declare no conflict of interest.

Nomenclature

OCFs propertiesdpAverage pore diameter (m)
dfAverage face diameter (m)
GSAGeometric surface area (m2·m−3)
LLength (m)
OFAOpen frontal area (m2)
εVoidage
ϕDiameter (m)
Coated layer propertiesdp,cAverage coated pore diameter (m)
df,cAverage coated face diameter (m)
rpPore radius (m)
δcCoated layer thickness (m)
εcCoated layer porosity
λcCoated layer effective thermal conductivity (kW·m−1·K−1)
ρcCoated layer density (kg·m−3)
τTortuosity factor
Reaction dataEaApparent activation energy (J·mol−1)
FtotTotal gas flow rate (m3·s−1)
PReaction pressure (kPa)
TReaction temperature (K)
TbBulk fluid temperature (K)
TINInlet bed temperature (K)
TOUTOutlet bed temperature (K)
r C H 4 Reaction rate for CH4 (kmol·kg−1·s−1)
R C H 4 Volumetric reaction rate for CH4 (kmol·m−3·s−1)
Δ H r 0 Standard reaction enthalpy (J·mol−1)
Dimensionless NumbersCaCarberry number
E1Ergun Constant
E2Ergun Constant
NuNusselt number
ReReynold number
ScSchmidt number
ShSherwood number
WPWeisz-Prater number
Fluid Properties C C H 4 Methane concentration in feed mixture (kmol·m−3)
C C H 4 , s Methane concentration at catalyst surface (kmol·m−3)
D C H 4 Diffusivity of CH4 in gas phase (m2·s−1)
D C H 4 , e Effective diffusivity of CH4 in coated layer (m2·s−1)
D C H 4 i Binary diffusion of CH4 and i gas species (m2·s−1)
DkKnudsen diffusion (m2·s−1)
hGas-solid heat transfer coefficient (kW·m−2·K−1)
kGMass transfer coefficient of CH4 (m·s−1)
M C H 4 Molecular weight of CH4 (kg·kmol−1)
MiMolecular weight of i compound (kg·kmol−1)
MjMolecular weight of j compound (kg·kmol−1)
MmixMolecular weight of gas mixture (kg·kmol−1)
Pc,iCritical pressure of i compound (kPa)
RUniversal gas constant (J·mol−1·K−1)
Tc,iCritical temperature of i compound (K)
uInlet gas velocity (m·s−1)
y i Mole fraction of i compound
λiThermal conductivity of i compound (kW·m−1·K−1)
λmixThermal conductivity of gas mixture (kW·m−1·K−1)
μ H 2 Viscosity of H2 (kg·m−1·s−1)
μ H 2 O Viscosity of H2O (kg·m−1·s−1)
μiViscosity of i compound (kg·m−1·s−1)
μjViscosity of j compound (kg·m−1·s−1)
μmixViscosity of gas mixture (kg·m−1·s−1)
μ N 2 Viscosity of N2 (kg·m−1·s−1)
ρmixDensity of gas mixture (kg·m−3)
ρ N 2 Density of N2 (kg·m−3)
v C H 4 Molar volume of CH4 (cm3·mol−1)
νiMolar volume of i compound (cm3·mol−1)
Characteristic TimestcCharacteristic contact time (s)
textCharacteristic external mass transfer time (s)
tintCharacteristic coated layer diffusion time (s)
trCharacteristic reaction time (s)

References

  1. Lewandowski, I. Bioeconomy. Shaping the Transition to a Sustainable, Biobased Economy; Springer: Berlin, Germany, 2018; pp. 5–74. ISBN 978-3-319-68152-8. [Google Scholar]
  2. Piemonte, V.; De Falco, M.; Basile, A. Sustainable Development in Chemical Engineering: Innovative Technologies; John Wiley & Sons Ltd.: Chichester, UK, 2013; pp. 95–118. ISBN 978-1-118-62984-0. [Google Scholar]
  3. Balzarotti, R.; Ciurlia, M.; Cristiani, C.; Paparella, F. Washcoat deposition of Ni- and Co-ZrO2 low surface area powders onto ceramic open-cell foams: Influence of slurry formulation and rheology. Catalysts 2015, 5, 2271–2286. [Google Scholar] [CrossRef] [Green Version]
  4. Specchia, S.; Ercolino, G.; Karimi, S.; Italiano, C.; Vita, A. Solution combustion synthesis for preparation of structured catalysts: A mini-review on process intensification for energy applications and pollution control. J. Self-Propag. High-Temp. Synth. 2017, 26, 166–186. [Google Scholar] [CrossRef]
  5. Moulin, J.A.; Stankewicz, A.; Kapteijn, F. The pontential of structured reactors in process intensification. Chem. Sustainable Dev. 2003, 11, 3–9. [Google Scholar]
  6. Williams, J.L. Monolith structures, materials, properties and uses. Catal. Today 2001, 69, 3–9. [Google Scholar] [CrossRef] [Green Version]
  7. Ercolino, G.; Karimi, S.; Stelmachowski, P.; Specchia, S. Catalytic combustion of residual methane on alumina monoliths and open cell foams coated with Pd/Co3O4. Chem. Eng. J. 2017, 326, 339–349. [Google Scholar] [CrossRef]
  8. Cybulski, A.; Moulijn, J.A. Structured Catalysts and Reactors, 2nd ed.; CRC Press, Taylor & Francis Group: Boca Raton, FL, USA, 2005; pp. 1–18. ISBN 978-1-4200-2800-3. [Google Scholar]
  9. Pfau, S.F.; Hagens, J.E.; Dankbaar, B. Biogas between renewable energy and bio-economy policies—Opportunities and constraints resulting from a dual role. Energy. Sustain. Soc. 2017, 7, 1–15. [Google Scholar] [CrossRef]
  10. Nahar, G.; Mote, D.; Dupont, V. Hydrogen production from reforming of biogas: Review of technological advances and an Indian perspective. Renew. Sust. Energy Rev. 2017, 76, 1032–1052. [Google Scholar] [CrossRef] [Green Version]
  11. Lo Faro, M.; Vita, A.; Pino, L.; Aricò, A.S. Performance evaluation of a solid oxide fuel cell coupled to an external biogas tri-reforming process. Fuel Process. Technol. 2013, 115, 238–245. [Google Scholar] [CrossRef]
  12. Farhad, S.; Yoo, Y.; Hamdullahpur, F. Effects of fuel processing methods on industrial scale biogas-fuelled solid oxide fuel cell system for operating in wastewater treatment plants. J. Power Sources 2010, 195, 1446–1453. [Google Scholar] [CrossRef] [Green Version]
  13. Rasi, S.; Veijanen, A.; Rintala, J. Trace compounds of biogas from different biogas production plants. Energy 2007, 32, 1375–1380. [Google Scholar] [CrossRef]
  14. Rathod, V.; Bhale, P.V. Experimental investigation on biogas reforming for syngas production over an alumina based nickel catalyst. Energy Procedia 2014, 54, 236–245. [Google Scholar] [CrossRef]
  15. Lino, A.V.P.; Assaf, E.M.; Assaf, J.M. Hydrotalcites derived catalysts for syngas production from biogas reforming: Effect of nickel and cerium load. Catal. Today 2017, 289, 78–88. [Google Scholar] [CrossRef]
  16. Eltejaei, H.; Reza Bozorgzadeh, H.; Towfighi, J.; Reza Omidkhah, M.; Rezaei, M.; Zanganeh, R.; Zamaniyan, A.; Zarrin Ghalam, A. Methane dry reforming on Ni/Ce0.75Zr0.25O2–MgAl2O4 and Ni/Ce0.75Zr0.25O2-γ–alumina: Effects of support composition and water addition. Int. J. Hydrogen Energy 2012, 37, 4107–4118. [Google Scholar] [CrossRef]
  17. Löfberg, A.; Kane, T.; Guerrero-Caballero, J.; Jalowiecki-Duhamel, L. Chemical looping dry reforming of methane: Toward shale-gas and biogas valorization. Chem. Eng. Process. Process Intensif. 2017, 122, 523–529. [Google Scholar] [CrossRef]
  18. Lahijani, P.; Zainal, Z.A.; Mohammadi, M.; Mohamed, A.R. Conversion of the greenhouse gas CO2 to the fuel gas CO via the boudouard reaction: A review. Renew. Sustain. Energy Rev. 2015, 41, 615–632. [Google Scholar] [CrossRef]
  19. Vita, A.; Italiano, C.; Previtali, D.; Fabiano, C.; Palella, A.; Freni, F.; Bozzano, G.; Pino, L.; Manenti, F. Methanol synthesis from biogas: A thermodynamic analysis. Renew. Energy 2018, 118, 673–684. [Google Scholar] [CrossRef]
  20. Song, C.; Pan, W. Tri-reforming of methane: A novel concept for catalytic production of industrially useful synthesis gas with desired H2/CO ratios. Catal. Today 2004, 98, 463–484. [Google Scholar] [CrossRef]
  21. Cipitì, F.; Pino, L.; Vita, A.; Laganà, M.; Recupero, V. Model-based investigation of a CO preferential oxidation reactor for polymer electrolyte fuel cell systems. Int. J. Hydrogen Energy 2007, 32, 4040–4051. [Google Scholar] [CrossRef]
  22. Holladay, J.D.; Hu, J.; King, D.L.; Wang, Y. An overview of hydrogen production technologies. Catal. Today 2009, 139, 244–260. [Google Scholar] [CrossRef]
  23. Joensen, F.; Rostrup-Nielsen, J.R. Conversion of hydrocarbons and alcohols for fuel cells. J. Power Sources 2002, 105, 195–201. [Google Scholar] [CrossRef]
  24. Karakaya, M.; Keskin, S.; Avci, A.K. Parametric study of methane steam reforming to syngas in a catalytic microchannel reactor. Appl. Catal. A Gen. 2012, 411–412, 114–122. [Google Scholar] [CrossRef]
  25. Vita, A.; Italiano, C.; Pino, L.; Frontera, P.; Ferraro, M.; Antonucci, V. Activity and stability of powder and monolith-coated Ni/GDC catalysts for CO2 methanation. Appl. Catal. B Environ. 2018, 226, 384–395. [Google Scholar] [CrossRef]
  26. Frey, M.; Édouard, D.; Roger, A.-C. Optimization of structured cellular foam-based catalysts for low-temperature carbon dioxide methanation in a platelet milli-reactor. C. R. Chim. 2015, 18, 283–292. [Google Scholar] [CrossRef]
  27. Ricca, A.; Palma, V.; Martino, M.; Meloni, E. Innovative catalyst design for methane steam reforming intensification. Fuel 2017, 198, 175–182. [Google Scholar] [CrossRef]
  28. Tomašić, V.; Jović, F. State-of-the-art in the monolithic catalysts/reactors. Appl. Catal. A gen. 2006, 311, 112–121. [Google Scholar] [CrossRef]
  29. Weng, J.; Lu, X.; Gao, P.-X. Nano-array integrated structured catalysts: A new paradigm upon conventional wash-coated monolithic catalysts? Catalysts 2017, 7, 253. [Google Scholar] [CrossRef]
  30. Vita, A.; Cristiano, G.; Italiano, C.; Pino, L.; Specchia, S. Syngas production by methane oxy-steam reforming on Me/CeO2 (Me = Rh, Pt, Ni) catalyst lined on cordierite monoliths. Appl. Catal. B Environ. 2015, 162, 551–563. [Google Scholar] [CrossRef]
  31. Ashraf, M.A.; Sanz, O.; Italiano, C.; Vita, A.; Montes, M.; Specchia, S. Analysis of Ru/La-Al2O3 catalyst loading on alumina monoliths and controlling regimes in methane steam reforming. Chem. Eng. J. 2018, 334, 1792–1807. [Google Scholar] [CrossRef]
  32. Vita, A.; Cristiano, G.; Italiano, C.; Specchia, S.; Cipitì, F.; Specchia, V. Methane oxy-steam reforming reaction: Performances of Ru/γ-Al2O3 catalysts loaded on structured cordierite monoliths. Int. J. Hydrogen Energy 2014, 39, 18592–18603. [Google Scholar] [CrossRef]
  33. Roy, P.S.; Song, J.; Kim, K.; Kim, J.-M.; Park, C.S.; Raju, A.S.K. Effects of CeZrO2–Al2O3 support composition of metal-foam-coated Pd–Rh catalysts for the steam-biogas reforming reaction. J. Ind. Eng. Chem. 2018, 62, 120–129. [Google Scholar] [CrossRef]
  34. Zapf, R.; Thiele, R.; Wichert, M.; O’Connell, M.; Ziogas, A.; Kolb, G. Application of rhodium nanoparticles for steam reforming of propane in microchannels. Catal. Commun. 2013, 41, 140–145. [Google Scholar] [CrossRef]
  35. Sadykov, V.; Mezentseva, N.; Fedorova, Y.; Lukashevich, A.; Pelipenko, V.; Kuzmin, V.; Simonov, M.; Ishchenko, A.; Vostrikov, Z.; Bobrova, L.; et al. Structured catalysts for steam/autothermal reforming of biofuels on heat-conducting substrates: Design and performance. Catal. Today 2015, 251, 19–27. [Google Scholar] [CrossRef]
  36. Govender, S.; Friedrich, H.B. Monoliths: A review of the basics, preparation methods and their relevance to oxidation. Catalysts 2017, 7, 62. [Google Scholar] [CrossRef]
  37. Carty, M.W.; Lednor, P.W. Monolithic ceramics and heterogeneous catalysts: Honeycombs and foams. Curr. Opin. Solid State Mater. Sci. 1996, 1, 88–95. [Google Scholar] [CrossRef]
  38. Voltolina, S.; Marín, P.; Díez, F.V.; Ordóñez, S. Open-cell foams as beds in multiphase reactors: Residence time distribution and mass transfer. Chem. Eng. J. 2017, 316, 323–331. [Google Scholar] [CrossRef]
  39. Zhao, G.; Liu, Y.; Lu, Y. Foam/fiber-structured catalysts: Non-dip-coating fabrication strategy and applications in heterogeneous catalysis. Sci. Bull. 2016, 61, 745–748. [Google Scholar] [CrossRef]
  40. Faure, R.; Rossignol, F.; Chartier, T.; Bonhomme, C.; Maître, A.; Etchegoyen, G.; Del Gallo, P.; Gary, D. Alumina foam catalyst supports for industrial steam reforming processes. J. Eur. Ceram. Soc. 2011, 31, 303–312. [Google Scholar] [CrossRef]
  41. Faure, R.; Basile, F.; Bersani, I.; Chartier, T.; Cuni, A.; Cornillac, M.; Gallo, P.D.; Etchegoyen, G.; Gary, D.; Rossignol, F.; et al. Foam-supported catalysts tailored for industrial steam reforming processes. In Studies in Surface Science and Catalysis; Gaigneaux, E.M., Devillers, M., Eds.; Elsevier: Amsterdam, The Netherlands, 2010; pp. 241–244. ISBN 978-0-444-53601-3. [Google Scholar]
  42. Laguna, O.H.; Domínguez, M.I.; Centeno, M.A.; Odriozola, J.A. Catalysts on metallic surfaces: Monoliths and microreactors. In New Materials for Catalytic Applications; Parvulescu, V.I., Kemnitz, E., Eds.; Elsevier: Amsterdam, The Netherlands, 2016; pp. 81–120. ISBN 978-0-444-63587-7. [Google Scholar]
  43. Balzarotti, R.; Italiano, C.; Pino, L.; Cristiani, C.; Vita, A. Ni/CeO2-thin ceramic layer depositions on ceramic monoliths for syngas production by oxy steam reforming of biogas. Fuel Process. Technol. 2016, 149, 40–48. [Google Scholar] [CrossRef]
  44. Ercolino, G.; Stelmachowski, P.; Specchia, S. Catalytic performance of Pd/Co3O4 on SiC and ZrO2 open cell foams for process intensification of methane combustion in lean conditions. Ind. Eng. Chem. Res. 2017, 56, 6625–6636. [Google Scholar] [CrossRef]
  45. Rivero-Mendoza, D.E.; Stanley, J.N.G.; Scott, J.; Aguey-Zinsou, K.-F. An alumina-supported Ni-La-based catalyst for producing synthetic natural gas. Catalysts 2016, 6, 170–184. [Google Scholar] [CrossRef]
  46. Italiano, C.; Vita, A.; Fabiano, C.; Laganà, M.; Pino, L. Bio-hydrogen production by oxidative steam reforming of biogas over nanocrystalline Ni/CeO2 catalysts. Int. J. Hydrogen Energy 2015, 40, 11823–11830. [Google Scholar] [CrossRef]
  47. Vita, A.; Italiano, C.; Fabiano, C.; Laganà, M.; Pino, L. Influence of Ce-precursor and fuel on structure and catalytic activity of combustion synthesized Ni/CeO2 catalysts for biogas oxidative steam reforming. Mater. Chem. Phys. 2015, 163, 337–347. [Google Scholar] [CrossRef]
  48. Patcas, F.C.; Garrido, G.I.; Kraushaar-Czarnetzki, B. CO oxidation over structured carriers: A comparison of ceramic foams, honeycombs and beads. Chem. Eng. Sci. 2007, 62, 3984–3990. [Google Scholar] [CrossRef]
  49. Gibson, L.J.; Ashby, M.F. Cellular Solids Structure and Properties, 2nd ed.; Cambridge University Press: Cambridge, UK, 1999; pp. 15–51. ISBN 0521499119. [Google Scholar]
  50. Buciuman, F.C.; Kraushaar-Czarnetzki, B. Ceramic foam monoliths as catalyst carriers. 1. Adjustment and Description of the Morphology. Ind. Eng. Chem. Res. 2003, 42, 1863–1869. [Google Scholar] [CrossRef]
  51. Bhattacharya, A.; Calmidi, V.V.; Mahajan, R.L. Thermophysical properties of high porosity metal foams. Int. J. Heat. Mass Transf. 2002, 45, 1017–1031. [Google Scholar] [CrossRef]
  52. Boomsma, K.; Poulikakos, D.; Ventikos, Y. Simulations of flow through open cell metal foams using an idealized periodic cell structure. Int. J. Heat Fluid Flow 2003, 24, 825–834. [Google Scholar] [CrossRef]
  53. Hamadouche, A.; Nebbali, R.; Benahmed, H.; Kouidri, A.; Bousri, A. Experimental investigation of convective heat transfer in an open-cell aluminum foams. Exp. Therm. Fluid Sci. 2016, 71, 86–94. [Google Scholar] [CrossRef]
  54. Wang, H.; Guo, L. Experimental investigation on pressure drop and heat transfer in metal foam filled tubes under convective boundary condition. Chem. Eng. Sci. 2016, 155, 438–448. [Google Scholar] [CrossRef]
  55. Richardson, J.; Remue, D.; Hung, J.-K. Properties of ceramic foam catalyst supports: Mass and heat transfer. Appl. Catal. A Gen. 2003, 250, 319–329. [Google Scholar] [CrossRef]
  56. Richardson, J.; Peng, Y.; Remue, D. Properties of ceramic foam catalyst supports: Pressure drop. Appl. Catal. A Gen. 2000, 204, 19–32. [Google Scholar] [CrossRef]
  57. Nie, Z.; Lin, Y.; Tong, Q. Numerical investigation of pressure drop and heat transfer through open cell foams with 3D Laguerre-Voronoi model. Int. J. Heat Mass Transfer 2017, 113, 819–839. [Google Scholar] [CrossRef]
  58. Ergun, S.; Orning, A.A. Fluid flow through randomly packed columns and fluidized beds. Ind. Eng. Chem. 1949, 41, 1179–1184. [Google Scholar] [CrossRef]
  59. Edouard, D.; Lacroix, M.; Huu, C.P.; Luck, F. Pressure drop modeling on SOLID foam: State-of-the art correlation. Chem. Eng. J. 2008, 144, 299–311. [Google Scholar] [CrossRef]
  60. Lacroix, M.; Nguyen, P.; Schweich, D.; Huu, C.P.; Savin-Poncet, S.; Edouard, D. Pressure drop measurements and modeling on SiC foams. Chem. Eng. Sci. 2007, 62, 3259–3267. [Google Scholar] [CrossRef]
  61. Sollier, B.M.; Gómez, L.E.; Boix, A.V.; Miró, E.E. Oxidative coupling of methane on Sr/La2O3 catalysts: Improving the catalytic performance using cordierite monoliths and ceramic foams as structured substrates. Appl. Catal. A Gen. 2017, 532, 65–76. [Google Scholar] [CrossRef]
  62. Palma, V.; Pisano, D.; Martino, M. The influence of the textural properties of aluminum foams as catalyst carriers for water gas shift process. Int. J. Hydrogen Energy 2017, 42, 23517–23525. [Google Scholar] [CrossRef]
  63. Chai, R.; Zhang, Z.; Chen, P.; Zhao, G.; Liu, Y.; Lu, Y. Ni-foam-structured NiO-MOx-Al2O3 (M = Ce or Mg) nanocomposite catalyst for high throughput catalytic partial oxidation of methane to syngas. Microporous Mesoporous Mater. 2017, 253, 123–128. [Google Scholar] [CrossRef]
  64. Méndez, F.J.; Sanz, O.; Montes, M.; Guerra, J.; Olivera-Fuentes, C.; Curbelo, S.; Brito, J.L. Selective hydrogenation of 1,3-butadiene in the presence of 1-butene under liquid phase conditions using structured catalysts. Catal. Today 2016, 151–161. [Google Scholar] [CrossRef]
  65. Sanz, O.; Javier Echave, F.; Sánchez, M.; Monzón, A.; Montes, M. Aluminium foams as structured supports for volatile organic compounds (VOCs) oxidation. Appl. Catal. A Gen. 2008, 340, 125–132. [Google Scholar] [CrossRef]
  66. Ertl, G.; Knözinger, H.; Schüth, F.; Weitkamp, J. Handbook of Heterogeneous Catalysis, 2nd ed.; Wiley-VCH: Weinheim, Germany, 2008; ISBN 978-3-527-31241-2. [Google Scholar]
  67. Mears, D.E. Diagnostic criteria for heat transport limitations in fixed bed reactors. J. Catal. 1971, 20, 127–131. [Google Scholar] [CrossRef]
  68. Anderson, J.B. A criterion for isothermal behaviour of a catalyst pellet. Chem. Eng. Sci. 1963, 18, 147–148. [Google Scholar]
  69. Daele, T.V.; del Pozo, D.F.; Hauwermeiren, D.V.; Gernaey, K.V.; Wohlgemuth, R.; Nopens, I. A generic model-based methodology for quantification of mass transfer limitations in microreactors. Chem. Eng. J. 2016, 300, 193–208. [Google Scholar] [CrossRef] [Green Version]
  70. Wijaya, W.Y.; Kawasaki, S.; Watanabe, H.; Okazaki, K. Damköhler number as a descriptive parameter in methanol steam reforming and its integration with absorption heat pump system. Appl. Energy 2012, 94, 141–147. [Google Scholar] [CrossRef]
  71. Liao, C.; Erickson, P.A. Characteristic time as a descriptive parameter in steam reformation hydrogen production processes. Int. J. Hydrogen Energy 2008, 33, 1652–1660. [Google Scholar] [CrossRef]
  72. Talebian-Kiakalaieh, A.; Amin, N.A.S. Theoretical and experimental evaluation of mass transfer limitation in gas phase dehydration of glycerol to acrolein over supported hsiw catalyst. J. Taiwan Inst. Chem. Eng. 2016, 59, 11–17. [Google Scholar] [CrossRef]
  73. Bandopadhyay, A.; Borgne, T.L.; Méheust, Y.; Dentz, M. Enhanced reaction kinetics and reactive mixing scale dynamics in mixing fronts under shear flow for arbitrary Damköhler numbers. Adv. Water Resour. 2017, 100, 78–95. [Google Scholar] [CrossRef] [Green Version]
  74. Metkar, P.S.; Salazar, N.; Muncrief, R.; Balakotaiah, V.; Harold, M.P. Selective catalytic reduction of NO with NH3 on iron zeolite monolithic catalysts: Steady-state and transient kinetics. Appl. Catal. B Environ. 2011, 104, 110–126. [Google Scholar] [CrossRef]
  75. Groppi, G.; Tronconi, E. Design of novel monolith catalyst supports for gas/solid reactions with heat exchange. Chem. Eng. Sci. 2000, 55, 2161–2171. [Google Scholar] [CrossRef]
  76. Boldrini, D.E.; Sánchez, M.J.F.; Tonetto, G.M.; Damiani, D.E. Monolithic stirrer reactor: Performance in the partial hydrogenation of sunflower oil. Ind. Eng. Chem. Res. 2012, 51, 12222–12232. [Google Scholar] [CrossRef]
  77. Dekker, F.H.M.; Bliek, A.; Kapteijn, F.; Moulijn, J.A. Analysis of mass and heat transfer in transient experiments over heterogeneous catalysts. Chem. Eng. Sci. 1995, 50, 3573–3580. [Google Scholar] [CrossRef] [Green Version]
  78. Hayes, R.E.; Kolaczkowskib, S.T.; Li, P.K.C.; Awdry, S. Evaluating the effective diffusivity of methane in the washcoat of a honeycomb monolith. Appl. Catal. B Environ. 2000, 25, 93–104. [Google Scholar] [CrossRef]
  79. Joshi, S.Y.; Harold, M.P.; Balakotaiah, V. Overall mass transfer coefficients and controlling regimes in catalytic monoliths. Chem. Eng. Sci. 2010, 65, 1729–1747. [Google Scholar] [CrossRef]
  80. Roy, P.S.; Raju, A.S.K.; Kim, K. Influence of S/C ratio and temperature on steam reforming of model biogas over a metal-foam-coated Pd–Rh/(CeZrO2–Al2O3) catalyst. Fuel 2015, 139, 314–320. [Google Scholar] [CrossRef]
  81. Ashrafi, M.; Pröll, T.; Pfeifer, C.; Hofbauer, H. Experimental study of model biogas catalytic steam reforming: 1. Thermodynamic optimization. Energy Fuels 2008, 22, 4182–4189. [Google Scholar] [CrossRef]
  82. Zeppieri, M.; Villa, P.L.; Verdone, N.; Scarsella, M.; De Filippis, P. Kinetic of methane steam reforming reaction over nickel- and rhodium-based catalysts. Appl. Catal. A Gen. 2010, 387, 147–154. [Google Scholar] [CrossRef]
  83. Roh, H. Methane-reforming reactions over Ni/Ce-ZrO2/θ-Al2O3 catalysts. Appl. Catal. A Gen. 2003, 251, 275–283. [Google Scholar] [CrossRef]
  84. Zhang, Z.; Ding, J.; Chai, R.; Zhao, G.; Liu, Y.; Lu, Y. Oxidative dehydrogenation of ethane to ethylene: A promising CeO2-ZrO2-modified NiO-Al2O3/Ni-foam catalyst. Appl. Catal. A Gen. 2018, 550, 151–159. [Google Scholar] [CrossRef]
  85. Mbodji, M.; Commenge, J.M.; Falk, L.; Di Marco, D.; Rossignol, F.; Prost, L.; Valentin, S.; Joly, R.; Del-Gallo, P. Steam methane reforming reaction process intensification by using a millistructured reactor: Experimental setup and model validation for global kinetic reaction rate estimation. Chem. Eng. J. 2012, 207–208, 871–884. [Google Scholar] [CrossRef]
  86. Arzamendi, G.; Diéguez, P.M.; Montes, M.; Odriozola, J.A.; Sousa-Aguiar, E.F.; Gandía, L.M. Methane steam reforming in a microchannel reactor for GTL intensification: A computational fluid dynamics simulation study. Chem. Eng. J. 2009, 154, 168–173. [Google Scholar] [CrossRef]
  87. Zhou, W.; Ke, Y.; Wang, Q.; Wan, S.; Lin, J.; Zhang, J.; Hui, K.S. Development of cylindrical laminated methanol steam reforming microreactor with cascading metal foams as catalyst support. Fuel 2017, 191, 46–53. [Google Scholar] [CrossRef] [Green Version]
  88. Mbodji, M.; Commenge, J.-M.; Falk, L. Preliminary design and simulation of a microstructured reactor for production of synthesis gas by steam methane reforming. Chem. Eng. Res. Des. 2014, 92, 1728–1739. [Google Scholar] [CrossRef]
  89. González-Castaño, M.; Ivanova, S.; Laguna, O.H.; Martínez, T.L.M.; Centeno, M.A.; Odriozola, J.A. Structuring Pt/CeO2/Al2O3 WGS catalyst: Introduction of buffer layer. Appl. Catal. B Environ. 2017, 200, 420–427. [Google Scholar]
  90. Deutschmann, O.; Schwiedemoch, R.; Maier, L.I.; Chatterjee, D. Natural gas conversion in monolithic catalysts: Interaction of chemical reactions and transport phenomena. Stud. Surf. Sci. Catal. 2001, 251–258. [Google Scholar]
  91. Stutz, M.J.; Poulikakos, D. Optimum washcoat thickness of a monolith reactor for syngas production by partial oxidation of methane. Chem. Eng. Sci. 2008, 63, 1761–1770. [Google Scholar] [CrossRef]
  92. Montebelli, A.; Visconti, C.G.; Groppi, G.; Tronconi, E.; Kohler, S.; Venvik, H.J.; Myrstad, R. Washcoating and chemical testing of a commercial Cu/ZnO/Al2O3 catalyst for the methanol synthesis over copper open-cell foams. Appl. Catal. A Gen. 2014, 481, 96–103. [Google Scholar] [CrossRef]
  93. Italiano, C.; Balzarotti, R.; Vita, A.; Latorrata, S.; Fabiano, C.; Pino, L.; Cristiani, C. Preparation of structured catalysts with Ni and Ni–Rh/CeO2 catalytic layers for syngas production by biogas reforming processes. Catal. Today 2016, 273, 3–11. [Google Scholar] [CrossRef]
  94. Cao, C.; Zhang, N.; Cheng, Y. Numerical analysis on steam methane reforming in a plate microchannel reactor: Effect of washcoat properties. Int. J. Hydrog. Energy 2016, 41, 18921–18941. [Google Scholar] [CrossRef]
  95. Wójcik, S.; Ercolino, G.; Gajewska, M.; Moncada Quintero, C.M.; Specchia, S.; Kotarba, A. Robust Co3O4|α–Al2O3|cordierite structured catalyst for N2O abatement—Validation of the SCS method for active phase synthesis and deposition. Chem. Eng. J. 2018, in press. [Google Scholar]
  96. Palma, V.; Pisano, D.; Martino, M.; Ciambelli, P. Structured catalysts with high thermoconductive properties for the intensification of water gas shift process. Chem. Eng. J. 2016, 304, 544–551. [Google Scholar] [CrossRef]
  97. Vita, A.; Italiano, C.; Pino, L.; Laganà, M.; Recupero, V. Hydrogen-rich gas production by steam reforming of n-dodecane. Part II: Stability, regenerability and sulfur poisoning of low loading Rh-based catalyst. Appl. Catal. B Environ. 2017, 218, 317–326. [Google Scholar] [CrossRef]
  98. Zhang, M.; Ning, T.; Sun, P.; Yan, Y.; Zhang, D.; Li, Z. Effect of Al2O3-SiO2 substrate on gas-sensing properties of TiO2 based lambda sensor at high temperature. Ceram. Int. 2018, 44, 3000–3004. [Google Scholar] [CrossRef]
  99. Shi, R.; Shang, Y.; Zhang, Y.; Wang, P.; Zhang, A.; Yang, P. Synthesis of ultrafine α-Al2O3 powder by two-step hydrolysis. Ceram. Int. 2018, 44, 3741–3750. [Google Scholar] [CrossRef]
Figure 1. Geometric parameters (a,b) and pore diameter distribution (c) of 30 ppi alumina OCF structure.
Catalysts 08 00448 g001
Figure 2. Pressure drop measurements for different foam density: Forchheimer-extended Darcy theoretical estimation (a); effect of pore density on the permeability and form coefficient (b); Lacroix-extended Ergun theoretical estimation (c).
Catalysts 08 00448 g002
Figure 3. Scanning electron microscopy (SEM) micrographs at different magnification of the Rh/CeO2-coated F20 (a,b), F30 (d,e) and F40 (g,h) structures and corresponding EDX mapping (c,f,i).
Catalysts 08 00448 g003
Figure 4. SEM micrographs of the Rh/CeO2-coated F40 catalyst: cross section (a) and relative EDX mapping (b).
Catalysts 08 00448 g004
Figure 5. SEM images of 20 ppi (a), 30 ppi (b) and 40 ppi (c) coated layers.
Catalysts 08 00448 g005
Figure 6. Weight loss as a function of time during the ultrasonic treatment of the coated foams.
Catalysts 08 00448 g006
Figure 7. TEM images of the Rh/CeO2 catalyst reduced at 300 °C under hydrogen flow and scraped from the foam walls.
Catalysts 08 00448 g007
Figure 8. Influence of temperature and space velocity on (a) Da-II, (b) Ca, (c) Da-III and (d) WP dimensionless numbers on biogas SR experiments over F20, F30 and F40 catalysts.
Catalysts 08 00448 g008
Figure 9. Influence of temperature and space velocity on (a) Da-II, (b) Ca, (c) Da-III and (d) WP dimensionless numbers on biogas OSR experiments over F20, F30 and F40 catalysts.
Catalysts 08 00448 g009
Figure 10. Biogas SR activity (S/CH4 = 3) over F20 (a), F30 (b) and F40 (c) catalysts. Influence of temperature (TSET = 800–900 °C) and space velocity (WHSV = 35,000–140,000 NmL·g−1·h−1) on CH4 conversion and H2/CO molar ratio (thermodynamic data reported as dotted lines).
Catalysts 08 00448 g010
Figure 11. Biogas OSR activity (S/CH4 = 1; O2/CH4 = 0.2) over F20 (a), F30 (b) and F40 (c) catalysts. Influence of temperature (TSET = 800–900 °C) and space velocity (WHSV = 35,000–140,000 NmL·g−1·h−1) on CH4 conversion, CO2 conversion and H2/CO molar ratio (thermodynamic data reported as dotted lines).
Catalysts 08 00448 g011
Figure 12. Biogas SR (a) and OSR (b) stability over F40 catalyst. CH4 conversion, CO2 conversion and effluent composition as a function of time-on-stream (TSET = 900 °C; WHSV = 70,000 NmL·g−1·h−1).
Catalysts 08 00448 g012
Figure 13. Evolution of the loaded CeO2 carrier after sequential immersion cycles of the different OCFs.
Catalysts 08 00448 g013
Table 1. Geometrical characteristics of the investigated open cell foam (OCF) structures.
Structured SubstrateF20F30F40
Catalysts 08 00448 i001 Catalysts 08 00448 i002 Catalysts 08 00448 i003
Pore per inch, ppi203040
Diameter, ϕ—Length, L (mm)10–1510–1510–15
Hole area, A (mm2)2.881.550.92
Average pore diameter, dp (mm)
d p = 4 A π
1.921.401.08
Average strut thickness, ts (mm)0.510.410.33
Face diameter, df (mm)
d f = d p + t s
2.421.811.41
Relative density, ρr
ρ r = 2.59 ( t s d f ) 2
0.110.130.14
Voidage, ε
ε = 1 ρ r
0.890.870.86
Bed porosity, Vp (%)88.385.183.6
Geometric surface area, GSA (m2·m−3)
G S A = 4.82 d f ρ r
6699671273
Exposed surface area, SAOCF (mm2)
S A O C F = V O C F G S A
78811381500
Catalyst loading, Cload (mg·cm−2)
C l o a d = W c a t S A O C F
22.215.212.0
Catalytic layer thickness, δc (μm)25–4015–305–20

