Catalytic Degradation of Ortho-Chlorophenol Using Activated Carbon Modified by Different Methods


Beijing Engineering Research Center of Process Pollution Control, National Engineering Laboratory for Hydrometallurgical Cleaner Production Technology, Institute of Process Engineering, Chinese Academy of Sciences, Beijing 100190, China
*
Authors to whom correspondence should be addressed.
Catalysts 2018, 8(1), 37; https://doi.org/10.3390/catal8010037
Submission received: 6 January 2018
/
Revised: 15 January 2018
/
Accepted: 16 January 2018
/
Published: 19 January 2018
(This article belongs to the Special Issue Catalysts for Oxidative Destruction of Volatile Organic Compounds)
Abstract
:The performance of activated carbon (AC) modified by different methods was compared for its catalytic degradation of ortho-chlorophenol (o-CP). For the chemically treated AC, the catalytic effect of AC–NH3·H2O was superior to the other catalysts examined, having an o-CP removal efficiency of 82.2% at 330 °C. For the metal-modified catalysts, AC–V and AC–Co showed similar removal performances of 93.2% at 330 °C. N2 adsorption-desorption isotherms, Raman spectroscopy, X-ray photoelectron spectroscopy (XPS), and gas chromatography—mass spectrometry (GC-MS) analyses were used to characterize the reaction products, and different reaction mechanisms were proposed for both AC–NH3·H2O and AC–V according to the results. Complete oxidative degradation of o-CP was achieved by AC–V, with AC–NH3·H2O leading to the formation of additional dioxins. It can be deduced that a risk of dioxin synthesis and escape during the regeneration process is possible when nitrogen-modified carbon is used in selective catalytic reduction (SCR) denitrification reactions, especially in the presence of chlorine atoms, benzene rings, and oxygen.
1. Introduction
Dioxins collectively refer to polychlorinated dibenzofurans (PCDFs) and polychlorinated dibenzodioxins (PCDDs) [1,2]. Dioxins rank first among the world’s most toxic compounds known and have been titled as the “poisons of the century” [3]. Approximately 90% of dioxin in the environment is produced by human industrial processes, mainly from waste incineration, chemical production, metal smelting, and the paper manufacturing industry [4]. The emission mechanism and status of dioxins from different sources differ widely. For this reason, dioxin has become a focal point of emission reductions of persistent organic pollutants worldwide.
Using the porous adsorption property of carbon-based materials, dioxins in industrial flue gas can be effectively captured [5]. Heating can then regenerate the resultant saturated carbon-based materials. However, it has been suggested [6] that when using carbon-based materials to remove dioxins, it does not occur simply via physical adsorption. In the regeneration process, the carbon-based material destroys the oxygen radicals within the benzene rings of dioxin, leading to its structural change. As a result, carbon-based materials play a catalytic role in dioxin decomposition, thus reducing the risk of secondary release caused by physical adsorption.
The decomposition efficiency of activated carbon (AC) to dioxin can reach over 99% at 150 °C [7], and the dioxin adsorbed on AC can be completely decomposed at 400 °C in an oxygen-free atmosphere [8]. For industrial carbon-based materials, however, the nature of the catalytic sites for dioxin degradation and their mechanisms in carbon-based materials are still debated because of their highly disordered structure and differences in the industrial activation methods.
Atkinson et al. [9] found that AC has almost no effect on the decomposition of dioxins after hydrogen reduction and suggested that oxygen-containing functional groups in the AC are the primary active sites for the catalytic degradation of dioxins. According to these authors, irreversible adsorption between oxygen groups and dioxin is the key step to initiating dechlorination in the desorption process. By comparison, Furubayashi et al. [8] reported that lattice defects and polar groups of active coke constitute the catalytic sites for dioxins. Oxygen and other polar groups are central for binding dioxins to the carbon-based surface, and reactions involving the oxygen groups of dioxins become a prerequisite for its degradation.
These previous reports comprise two aspects of the debate concerning dioxin degradation in carbon-based materials: (1) the binding sites and patterns between dioxins and the carbon surface; and (2) the order of bond cleavage in dioxin, as well as its precise mechanism. These two points play an important role in understanding the mechanism of low-temperature degradation of dioxins and in enhancing dioxin degradation with carbon-based materials. Therefore, it is necessary to clarify the interaction between dioxin and carbon substrates and to identify methods that strengthen dioxin degradation so as to improve the efficiency of harmless dioxin degradation.
Due to the high toxicity of dioxin, ortho-chlorophenol (o-CP) has been chosen as the investigated compound owing to its structural similarity. It is well known that the degradation of chlorobenzene has been widely studied. In contrast, chlorinated phenols (CPhs) are relatively rare used as model compounds, which now are recognized as a particular group of top toxic pollutants [10]. Another more important reason for choosing o-CP is that CPhs are also present in the real flue gas streams and have the highest potential for generating dioxins among the possible precursors according to reference [11].
AC catalytic activity could be improved by modifying the AC surface with moieties such as HNO3 and NH3·H2O [12]. In order to compare the AC catalytic performance of changes such as these, two types of carbon-based catalysts were synthesized using chemical treatment and metal modification. Evaluation of the catalysts was performed in a fixed-bed reactor and gas chromatography-mass spectrometry (GC-MS) was used to detect the gaseous products. Finally, catalytic mechanisms have been proposed according to the results of Raman, X-ray photoelectron spectroscopy (XPS), and N2 adsorption-desorption isotherms analyses.
2. Results and Discussion
2.1. Catalytic Performance of Different Catalysts for o-CP Oxidation
The evolution of the downstream o-CP concentration during the catalytic test is shown in Figure 1a. As seen, it took 40 min for o-CP to reach saturation and ~60 min for its complete penetration into the catalysts. Initially, the o-CP signal increases sharply when the temperature increases but it then becomes flat after 30 min. This phenomenon is more obvious at temperatures from 150 to 210 °C, as shown in Figure 1b. When the temperature is higher than 210 °C, this phenomenon is not as obvious as before, which may be attributed to the removal effect of o-CP at high temperatures.
Figure 2 presents the o-CP conversion versus reaction temperature over various catalysts. The catalytic evaluation began at 180 °C to avoid the calculation of negative removal effects of o-CP caused by desorption of the initial adsorption process [13,14].
For AC modified by chemical reagents and thermal treatment, o-CP oxidation barely occurred below 270 °C. Almost all the catalysts shown in Figure 2a performed poorly for the conversion of o-CP. Indeed, the conversion remained lower than 25% even at 330 °C, except for the AC–NH3 and AC–NH3·H2O catalysts. The T50 values (i.e., the temperature required to remove 50% o-CP) of AC–NH3 and AC–NH3·H2O are 310 °C and 300 °C, and their o-CP conversions at 330 °C were 64.7% and 82.2%, respectively. It can be inferred that ammonia modification is beneficial for o-CP conversion, especially with AC–NH3·H2O; indeed, the o-CP conversion increased 192% after this modification.
As seen in Figure 2b, AC–Pt and AC–Pd performed very poorly with almost no o-CP conversion. This result may reflect poisoning of these noble metal-based catalysts as a result of their low stability toward chlorine [2]. The decrease of o-CP with the other four types of metal catalysts began appreciably at 240 °C. At 330 °C, the o-CP conversions for AC–V, AC–Co, AC–Ce, and AC–Mn were 93.2%, 82.8%, 80.2%, and 65.3%, respectively, with corresponding T50 values of 308, 309, 288, and 315 °C, respectively. The results indicate that AC–V and AC–Co show similar removal performances, and although AC-Ce demonstrated a lower T50 value, its conversion did not significantly increase as the temperature increased.
Overall, the catalytic activity of the original AC is quite unremarkable; ammonia-water modification (AC–NH3·H2O) increased the o-CP conversion to 82.2% at 330 °C, and V modification (AC–V) increased the o-CP conversion to 93.2% at this temperature. These catalysts demonstrated that both surface modification and metal impregnation can improve the catalytic performance of AC. Specifically, nitrogen-containing functional groups and V2O5 on AC may act as active sites, although the catalytic activity of V2O5 is relatively higher than that of nitrogen-containing functional groups.
2.2. Catalytic Selectivity and By-Product Analysis
2.2.1. Carbon Mass Balance and Catalytic Selectivity
AC–NH3·H2O and AC–V were selected for further CO and CO2 detection using an online GC equipped with an FID and methanizer furnace. The theoretically complete oxidation products of o-CP are COx and H2O; ideally, there should be perfect agreement between the amount of o-CP removed and the total oxidation product concentration, without the formation of partial oxidation products.
Figure 3 demonstrates the CO, CO2, and by-product distribution of o-CP oxidation over the AC–O, AC–NH3·H2O, and AC–V catalysts from 180 to 330 °C. The experimental method employed was identical to that mentioned in Section 3.2. The yields of CO2 and CO were calculated according to the following equation:
where GRCO2/GRCO is the generation rate of CO2/CO from o-CP, Co-CP is the generated concentration of o-CP (200 ppm), and CCO2/CCO is the detected concentration using an online GC at temperature T.
The blank run (without catalyst) performed at 180–330 °C revealed that no COx products were generated. Thus, the by-product formation efficiency can be calculated according to the following equation, considering the carbon balance [13]:
where GRbp is the generation rate of by-products during the o-CP oxidation reaction and RT is the total removal efficiency of o-CP at temperature T detected by online GC, as shown in Figure 3.
Figure 3a shows the diverse performances of the catalysts on the formation of COx species. The CO2 generation efficiencies were 18.7% and 13.5% for AC–O and AC–NH3·H2O at 330 °C, respectively, with the efficiency increasing sharply to 86.2% for AC–V. The selectivity to CO varied between 20% and 25% during the reaction from 240 to 330 °C for all three catalysts, which is consistent with previous reports [2]. As seen in Figure 3b, the by-product formation efficiencies at 330 °C were 4.6% and 0.84% for AC–O and AC–V, respectively, and it was as high as 64.3% for AC–NH3·H2O. It is noteworthy that although AC–NH3·H2O exhibited good catalytic efficiency, only a small portion of the catalytic products was converted into carbon oxides. It is possible that the by-products accumulated on the carbon surface [13]. Clearly, o-CP was almost completely degraded with the AC–V catalyst. The o-CP removal efficiency on AC–NH3·H2O exhibited similar behavior to the by-product composition. On this basis, it can be speculated that the catalytic mechanisms of these two catalysts are quite different. As for AC–O, CO2 and CO were indeed detected during the reaction, showing catalytic properties of unsaturation carbon compounds, as reported previously [6].
2.2.2. Sample Characterization before and after Reaction
Changes to the three catalysts adopted in Section 2.2.1 before and after reaction have been investigated. The catalysts after reaction were named AC–O-a, AC–NH3·H2O-a, and AC–V-a.
The physical properties of the six catalysts are listed in Table 1, including their BET-specific surface areas (SBET), total pore volumes (Vtotal), micro-pore volumes (Vmi), and pore sizes. It can be inferred that modification with NH3·H2O and VOx increased the samples’ BET surfaces. However, the BET surfaces of AC–NH3·H2O and AC–V were both close to 600 m2/g, which was only 70 m2/g larger than that of AC–O. The BET surface areas and pore volumes of the catalysts decreased significantly after reaction with values of only 155.5 m2/g for AC–O-a, 91.2 m2/g for AC–NH3·H2O-a, and 172.8 m2/g for AC–V-a, which was a decrease of 71.2–84.8% compared with that of AC–O. The pore sizes of AC–O, AC–NH3·H2O, and AC–V enlarged by 3.9~14.1% after reaction. This phenomenon may be caused by blockage of by-products formed during the reaction.
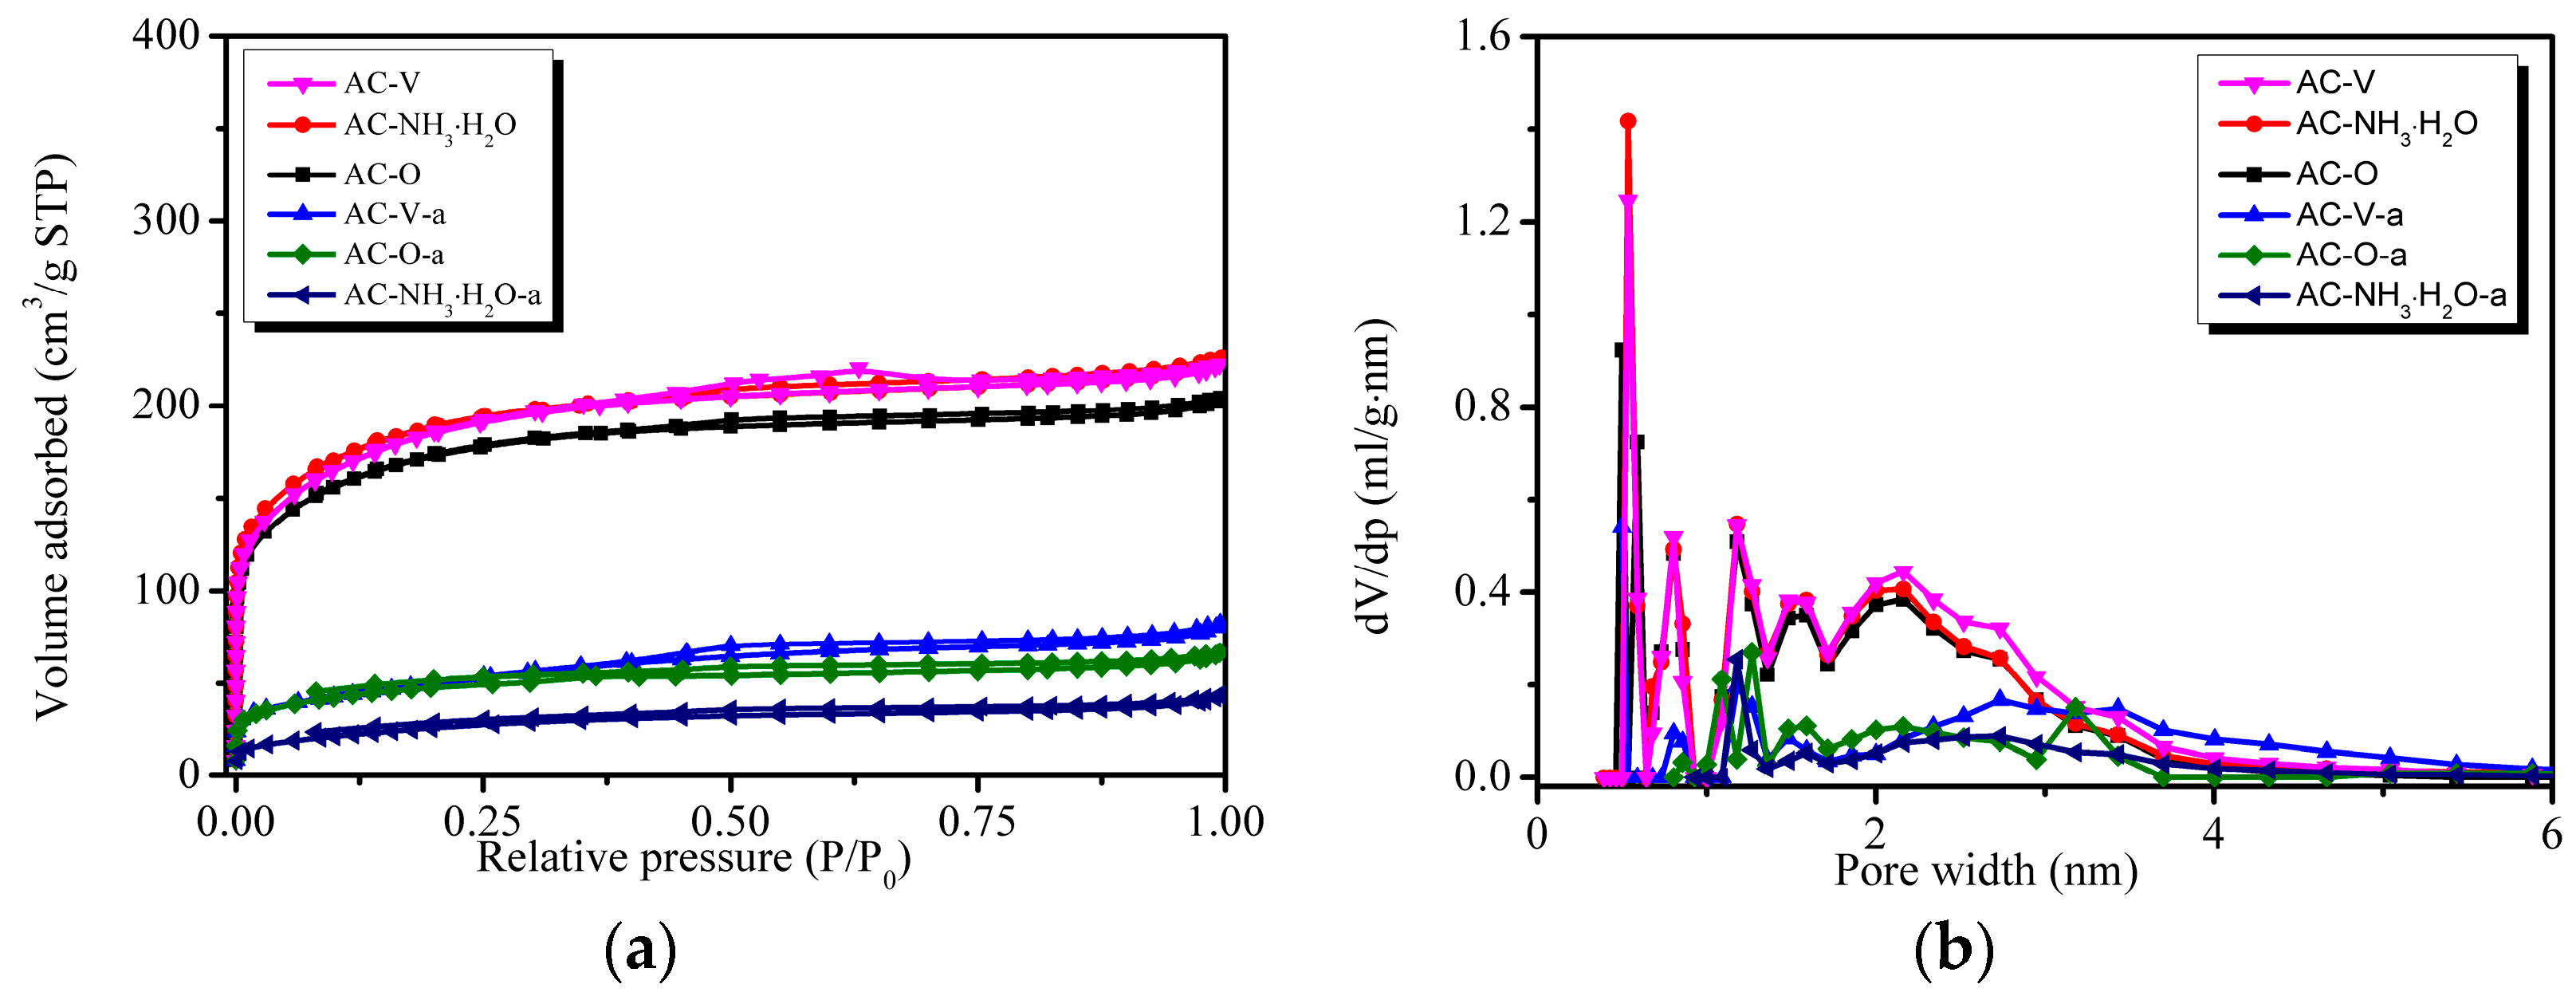
Figure 4 shows the nitrogen isotherms and pore size distributions of the six catalysts. All the isotherms belong to a typical type I curve, suggesting microstructure properties of the catalysts [15]. Figure 4b shows that pores smaller than 1 nm are almost non-existent and that the number of pores close to 2 nm decreased considerably, supporting the notion that pore blockage with by-products had occurred.
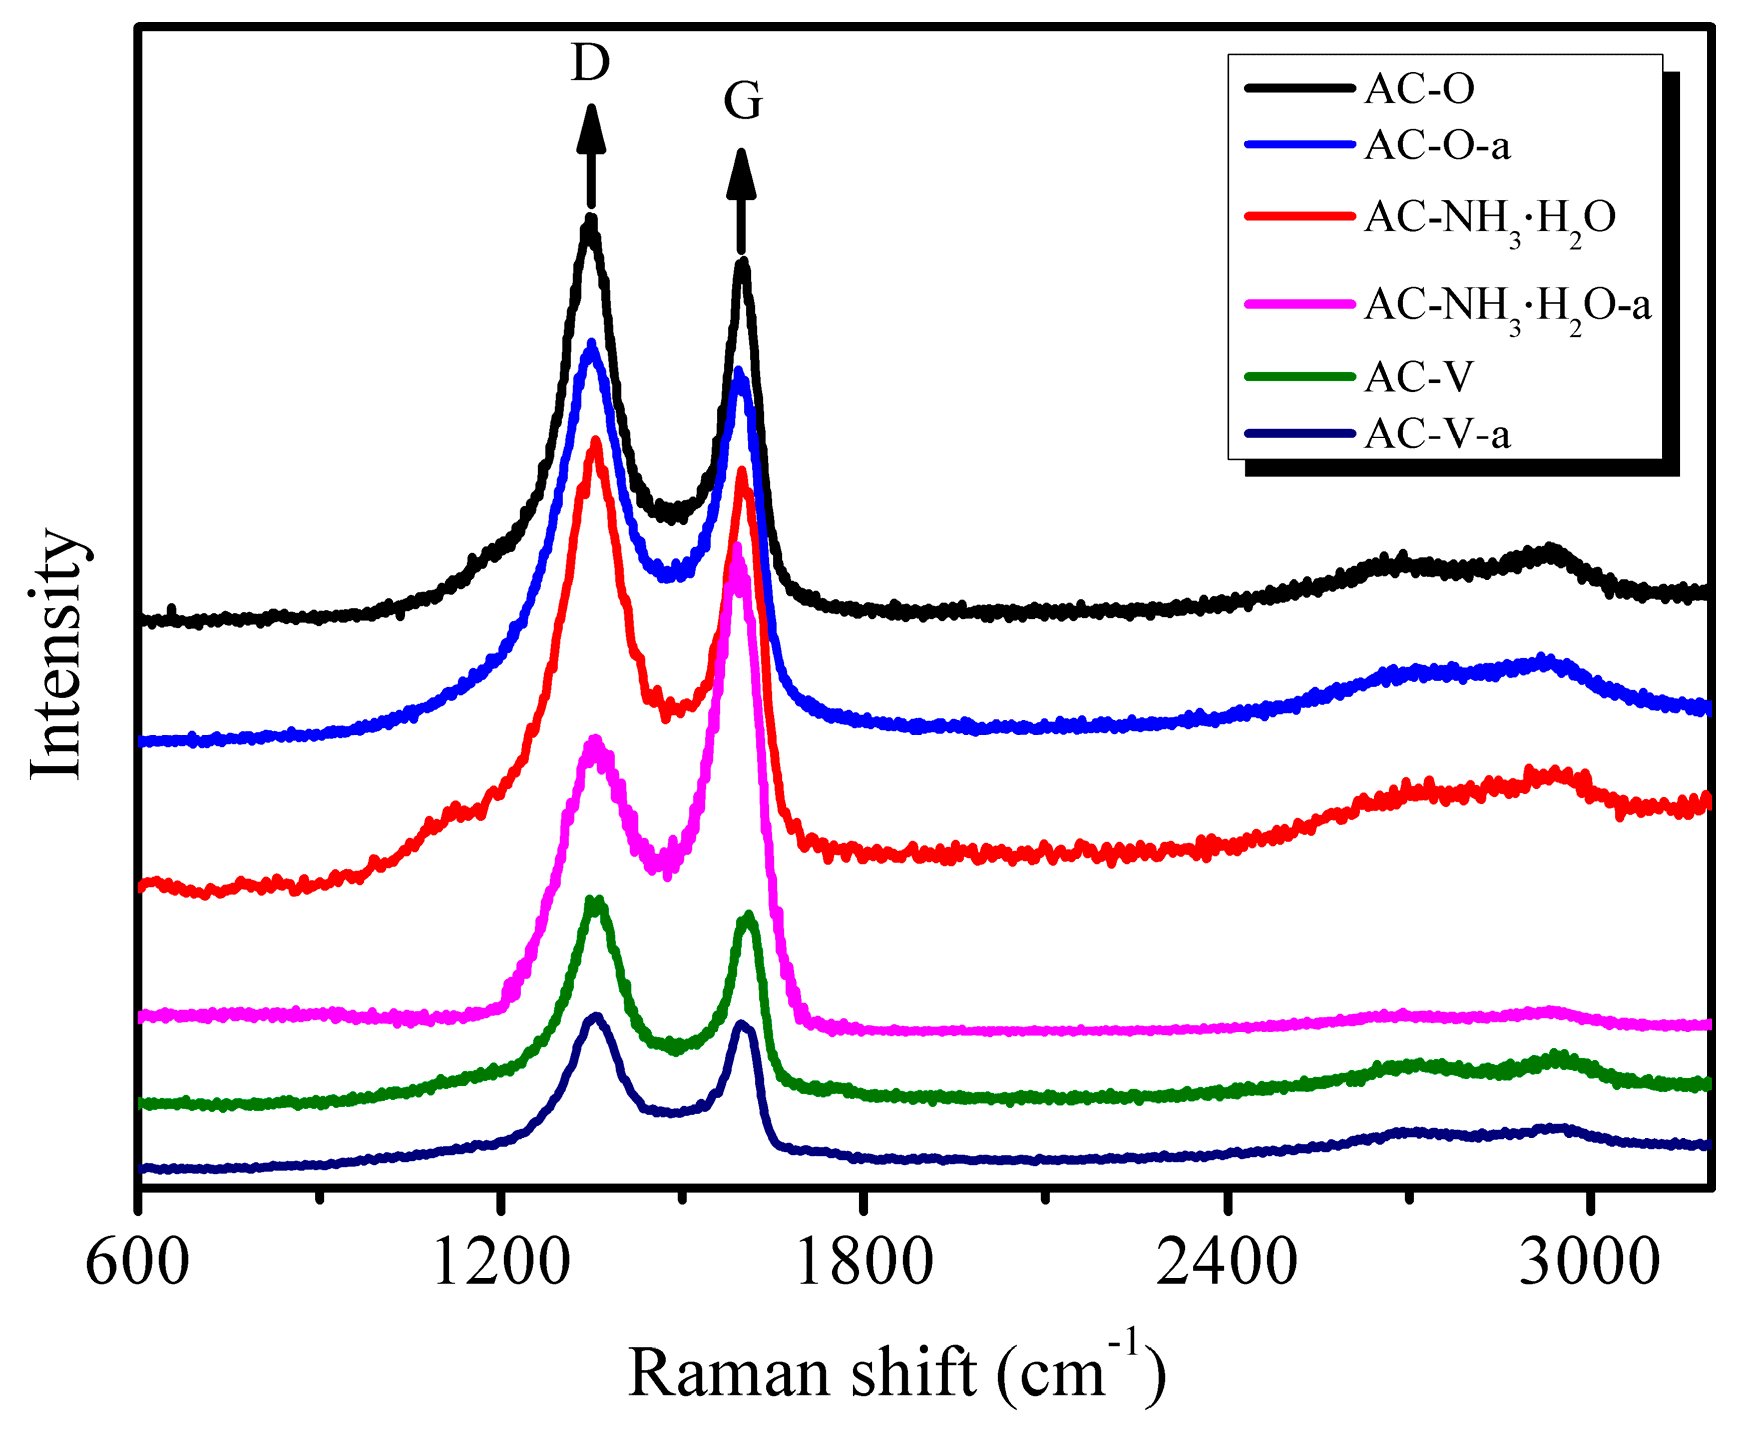
Being sensitive to crystal symmetry, Raman spectroscopy is a very useful tool to provide structural information [16]. The Raman spectra of the AC and modified AC catalysts are presented in Figure 5. Such spectra are conventionally divided into first- (1100–1800 cm−1) and second-order (2200–3400 cm−1) regions. All carbonaceous forms are related to the graphite lattice. In the first-order region, the band at ca. 1350 cm−1 (E2g mode) is a shear mode and corresponds to the relative vibration of the atoms perpendicular to the aromatic layers; the band at ca. 1600 cm−1 (E2g mode) corresponds to the stretching vibration in the aromatic layers and is called the G band. In perfect crystalline AC, only the G band in the first-order region is present [17].
As seen in Figure 5, chemical and metal modifications had no effect on the structure of AC. For the catalyst AC–NH3·H2O, the G band increased significantly after the catalytic reaction (AC–NH3·H2O-a). This result may be attributed to the deposition of regularly stacked aromatic by-products on the AC surface.
XPS analysis was used to obtain quantitative and qualitative information on the chemical composition of AC [18]. The contents of selected elements in the samples determined from XPS analysis are listed in Table 2. The XPS survey spectra of AC–O and AC–NH3·H2O before and after the catalytic reaction show the presence of C, O, N, and Cl; the catalyst AC–V also shows the presence of V before and after the catalytic reaction (Table 2). The exclusive presence of these elements indicates the high level of purity of these membranes. Compared with AC–O, the nitrogen content in AC–NH3·H2O decreased by 20.6% and its oxygen content increased by 0.98%; in AC–V, the nitrogen content decreased by 14.7% and the oxygen content increased by 10.0% compared with AC–O. In AC–O-a, the nitrogen content increased by 11.8% and the oxygen content increased by 7.6% compared with AC–O. Following the reaction, the nitrogen content in AC–NH3·H2O-a decreased by 20.4% and its oxygen content increased by 9.4% compared with AC–NH3·H2O, and compared with AC–V, the nitrogen content in AC–V-a increased by 36.2% and its oxygen content increased by 6.9%.
The chlorine content within the catalysts clearly increased after the catalytic reaction. Compared with the original AC–O catalyst (Cl content of just 0.05), the chlorine content in AC–O-a increased to 0.84. The Cl content in AC–NH3·H2O-a increased from 0.04 in AC–NH3·H2O to 0.40. Further, the chlorine content in AC–V-a increased to 0.49 from a Cl content of just 0.04 in AC–V. In summary, the chlorine content increased by 15.8, 9, and 11.3 times for AC–O, AC–NH3·H2O, and AC–V, respectively, after the catalytic reaction.
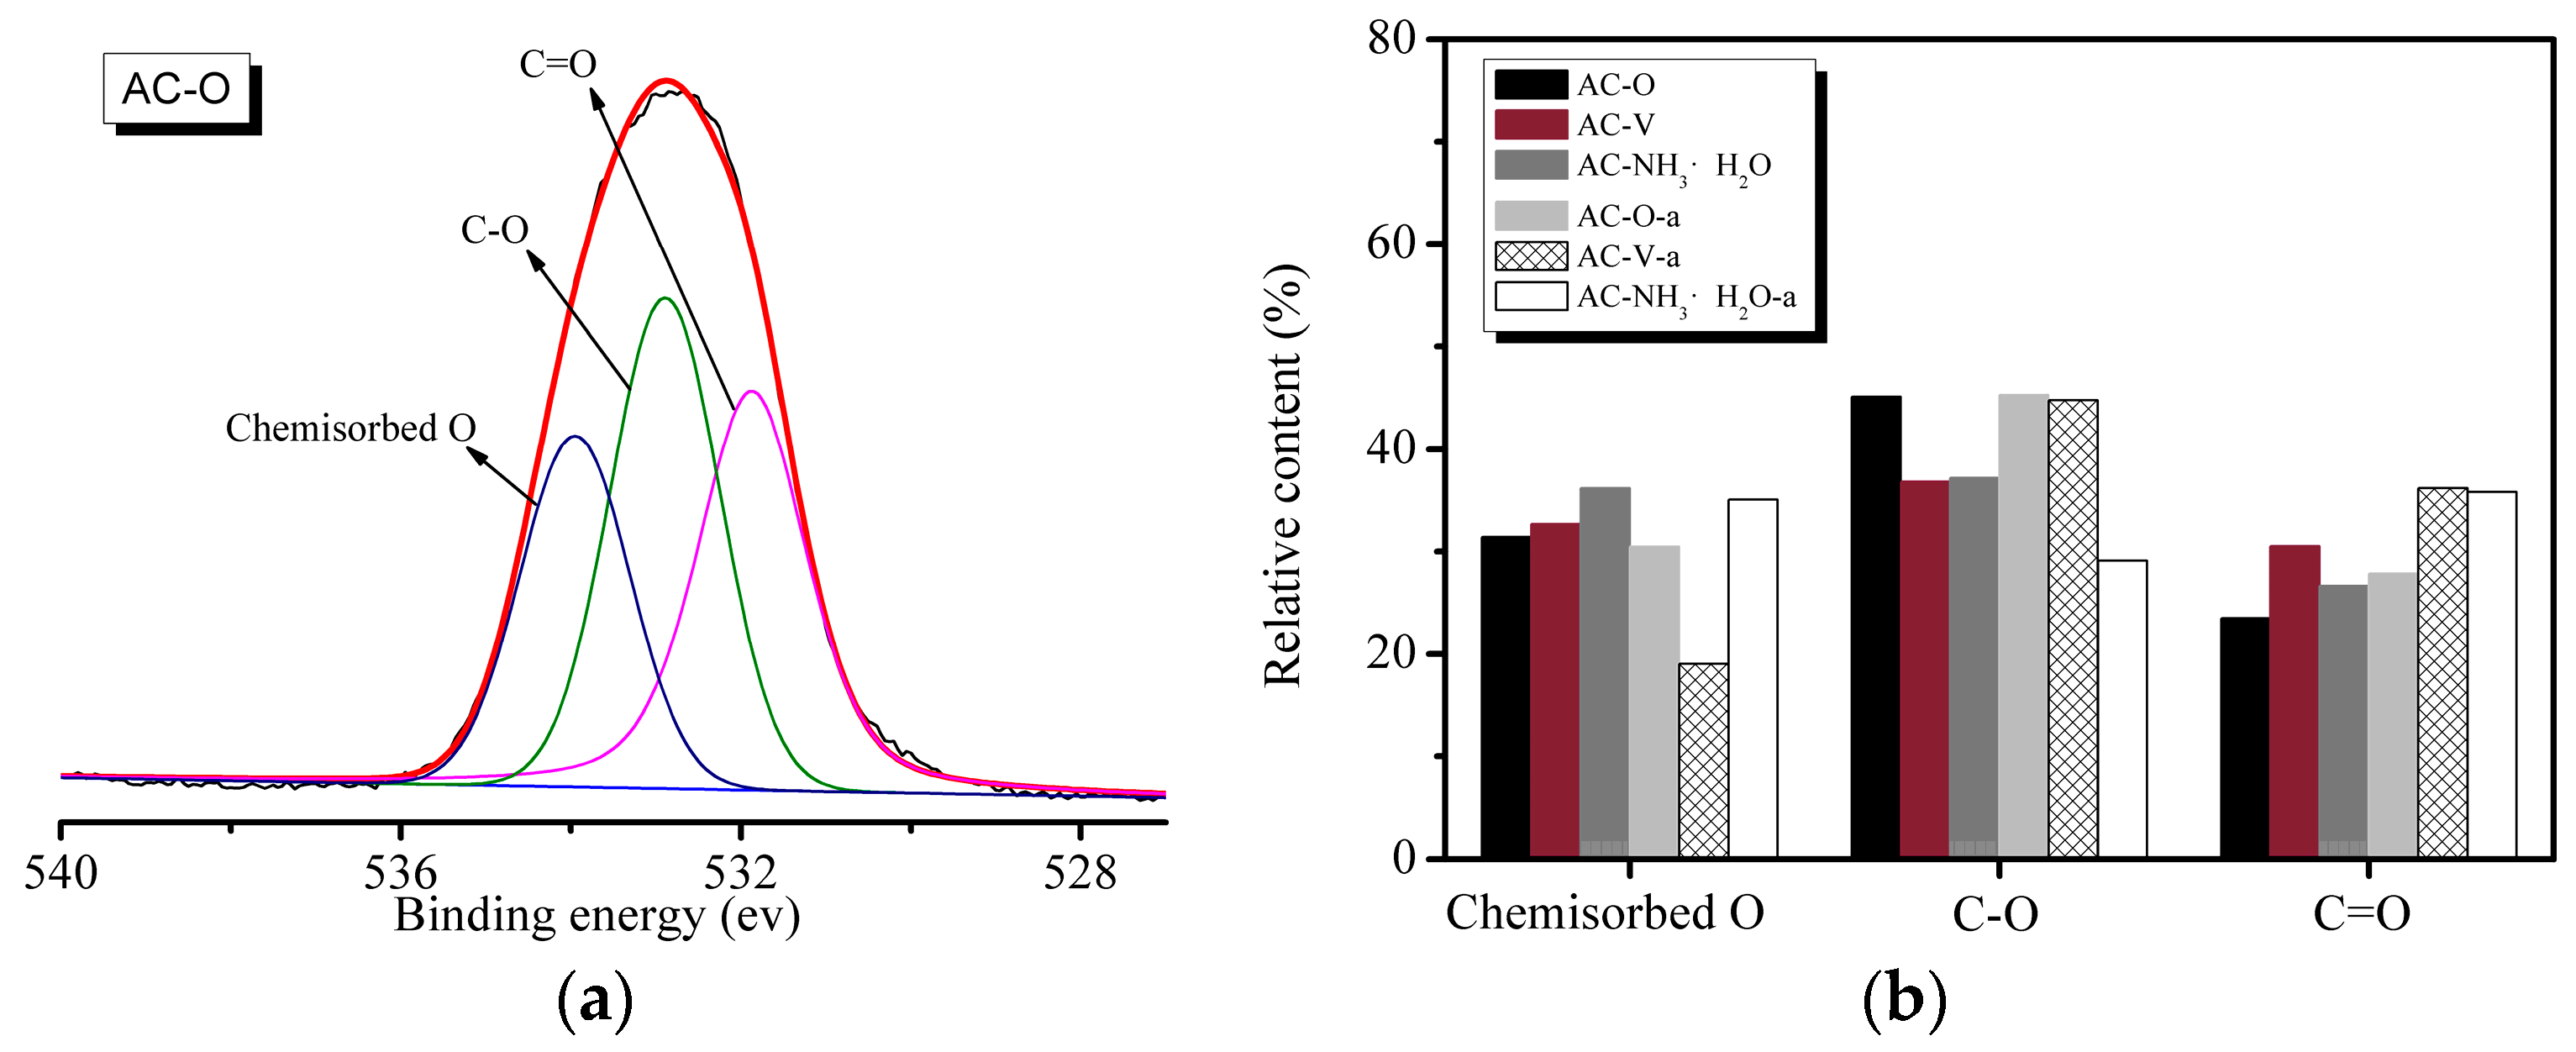
Figure 6 shows the high-resolution O 1s XPS data of the samples. Figure 6a shows the peak fitting spectra using the Peakfit software (Version 4.1, SeaSolve Software Inc., Framingham, San Jose, CA, USA, 2003), which are deconvoluted into three peaks for O 1s located at binding energies of 531.1 ± 0.2 eV, 533.2 ± 0.2 eV, and 535.2 ± 0.3 eV. The high-resolution O 1s spectrum (Figure 6a) reveals the presence of three peaks, corresponding to C=O groups (Peak 1: binding energy (BE) = 531.5–531.9 eV), C-OH and/or C-O-C groups (Peak 2: BE = 532.5–533.4 eV), and chemisorbed oxygen and/or water (Peak 3: BE = 533.7–534.9 eV). According to Figure 6b, the catalytic reaction leads to a decrease in the concentration of surface oxygen functional groups and a change in their distribution. Surface oxides appear at the reactive centers as a result of chemisorption of oxygen or water at room temperature during heating. The proportion of carbon atoms linked to oxygen atoms is higher in the saturated samples than in the fresh catalysts. This may originate from the presence of various O-containing species produced from the reaction of o-CP with the catalyst.
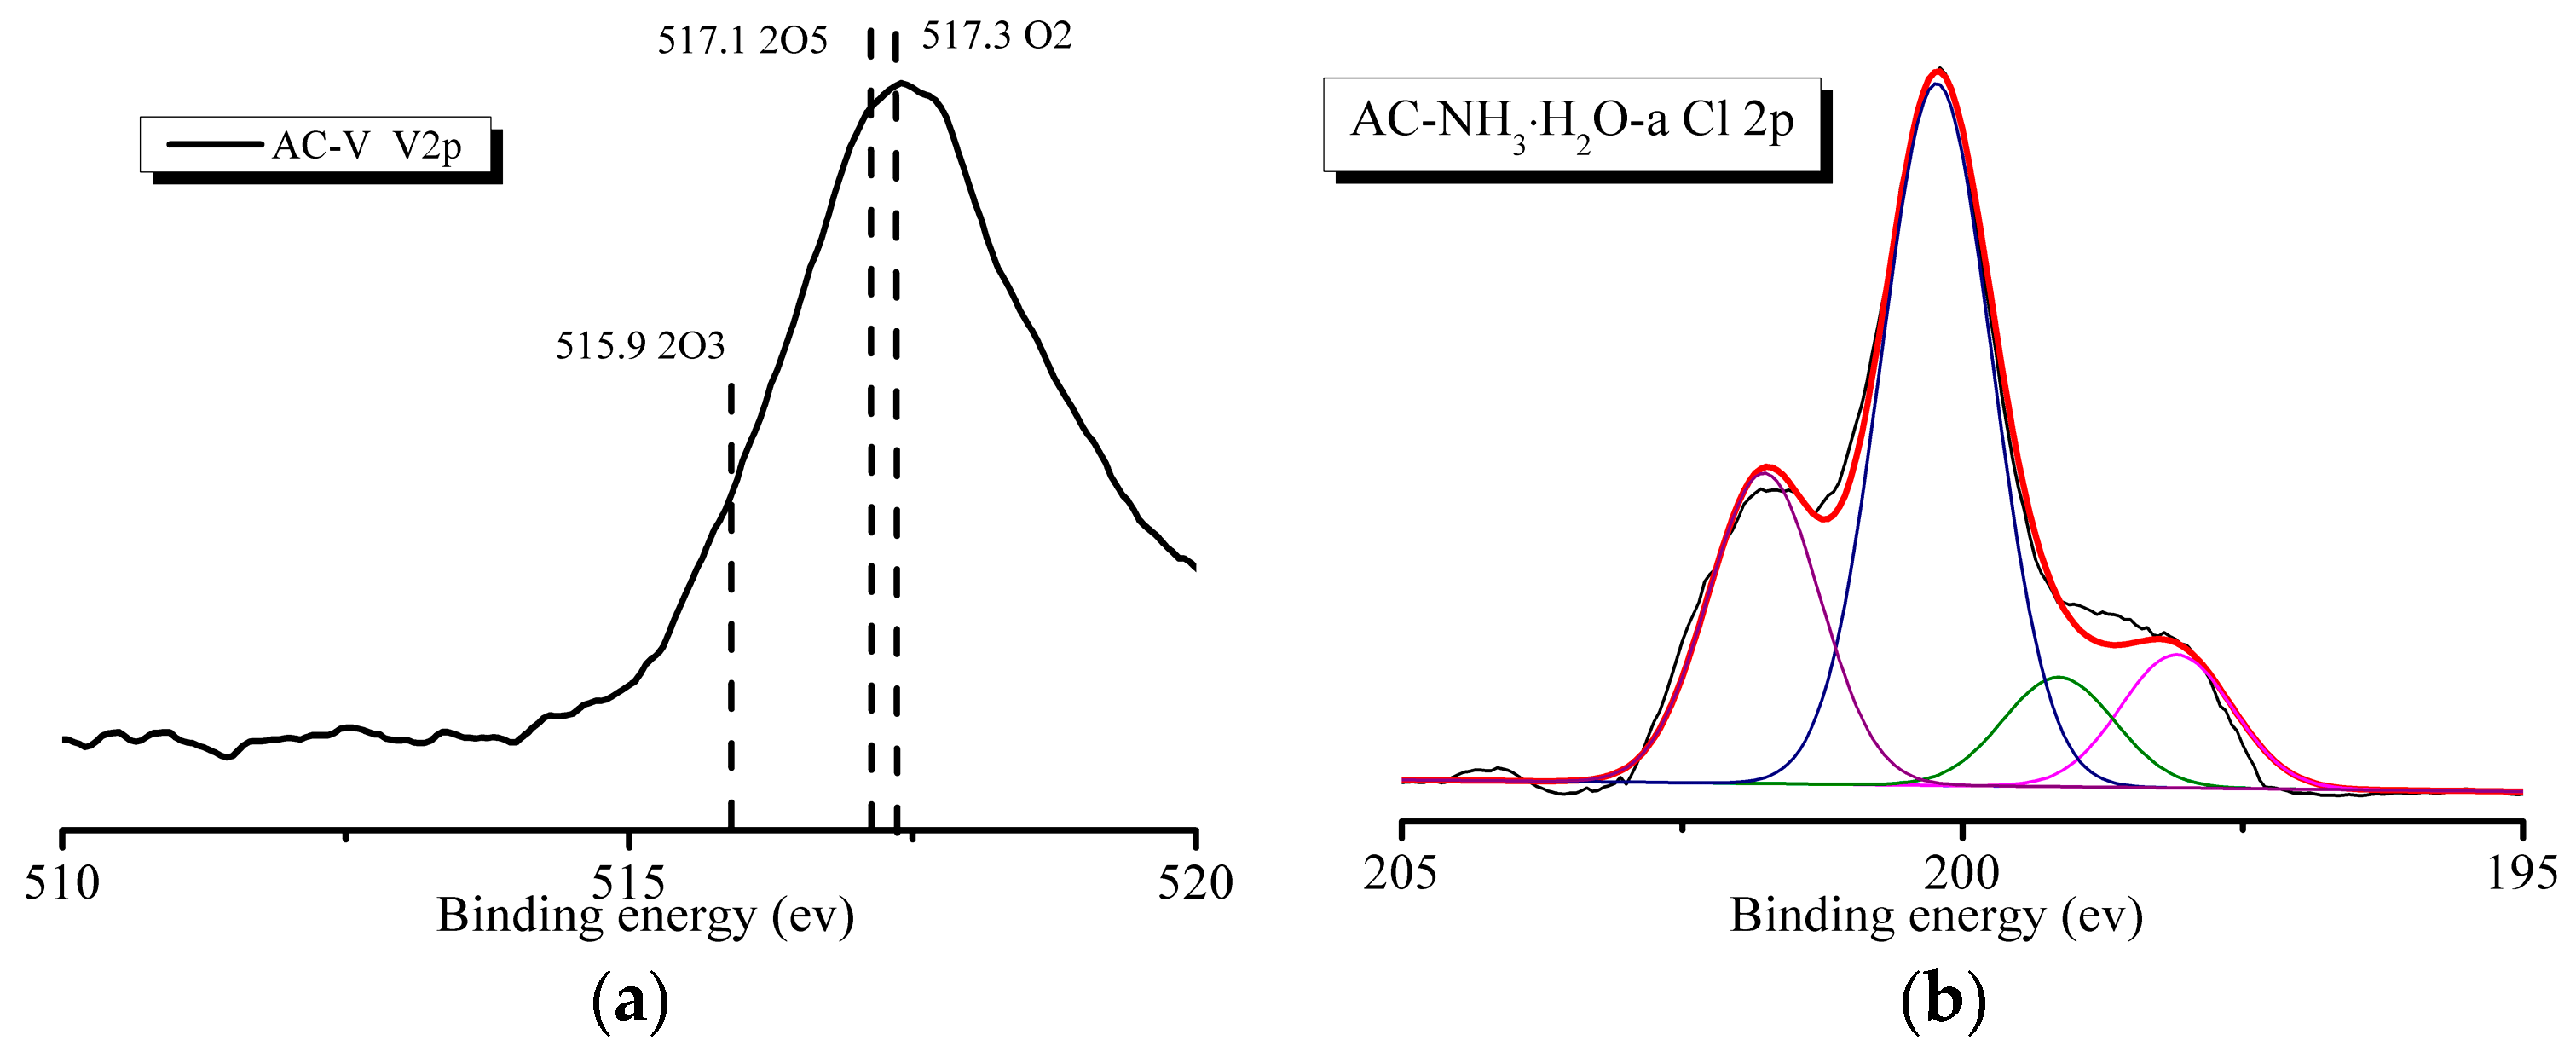
As shown in Figure 7a, the AC–V sample exhibits a peak corresponding to V 2p. The high-resolution V 2p spectrum (Figure 7a) reveals the presence of three peaks corresponding to V2O3 (BE = 515.9 eV), V2O5 (BE = 517.1 eV), and V3O2 (BE = 517.3 eV). All the catalysts reveal the presence of a Cl 2p peak after the reaction, as shown in Figure 7b. Figure 7b also shows the peak fitting spectra using the Peakfit 4.1 software, which are deconvoluted into four peaks. The peaks at 199.2 eV and 200.3 eV correspond to metal-Cl and C-Cl bonds, indicating the combination of Cl and V and the existence of C-Cl from o-CP.
2.3. By-Product Analysis and Catalytic Mechanism
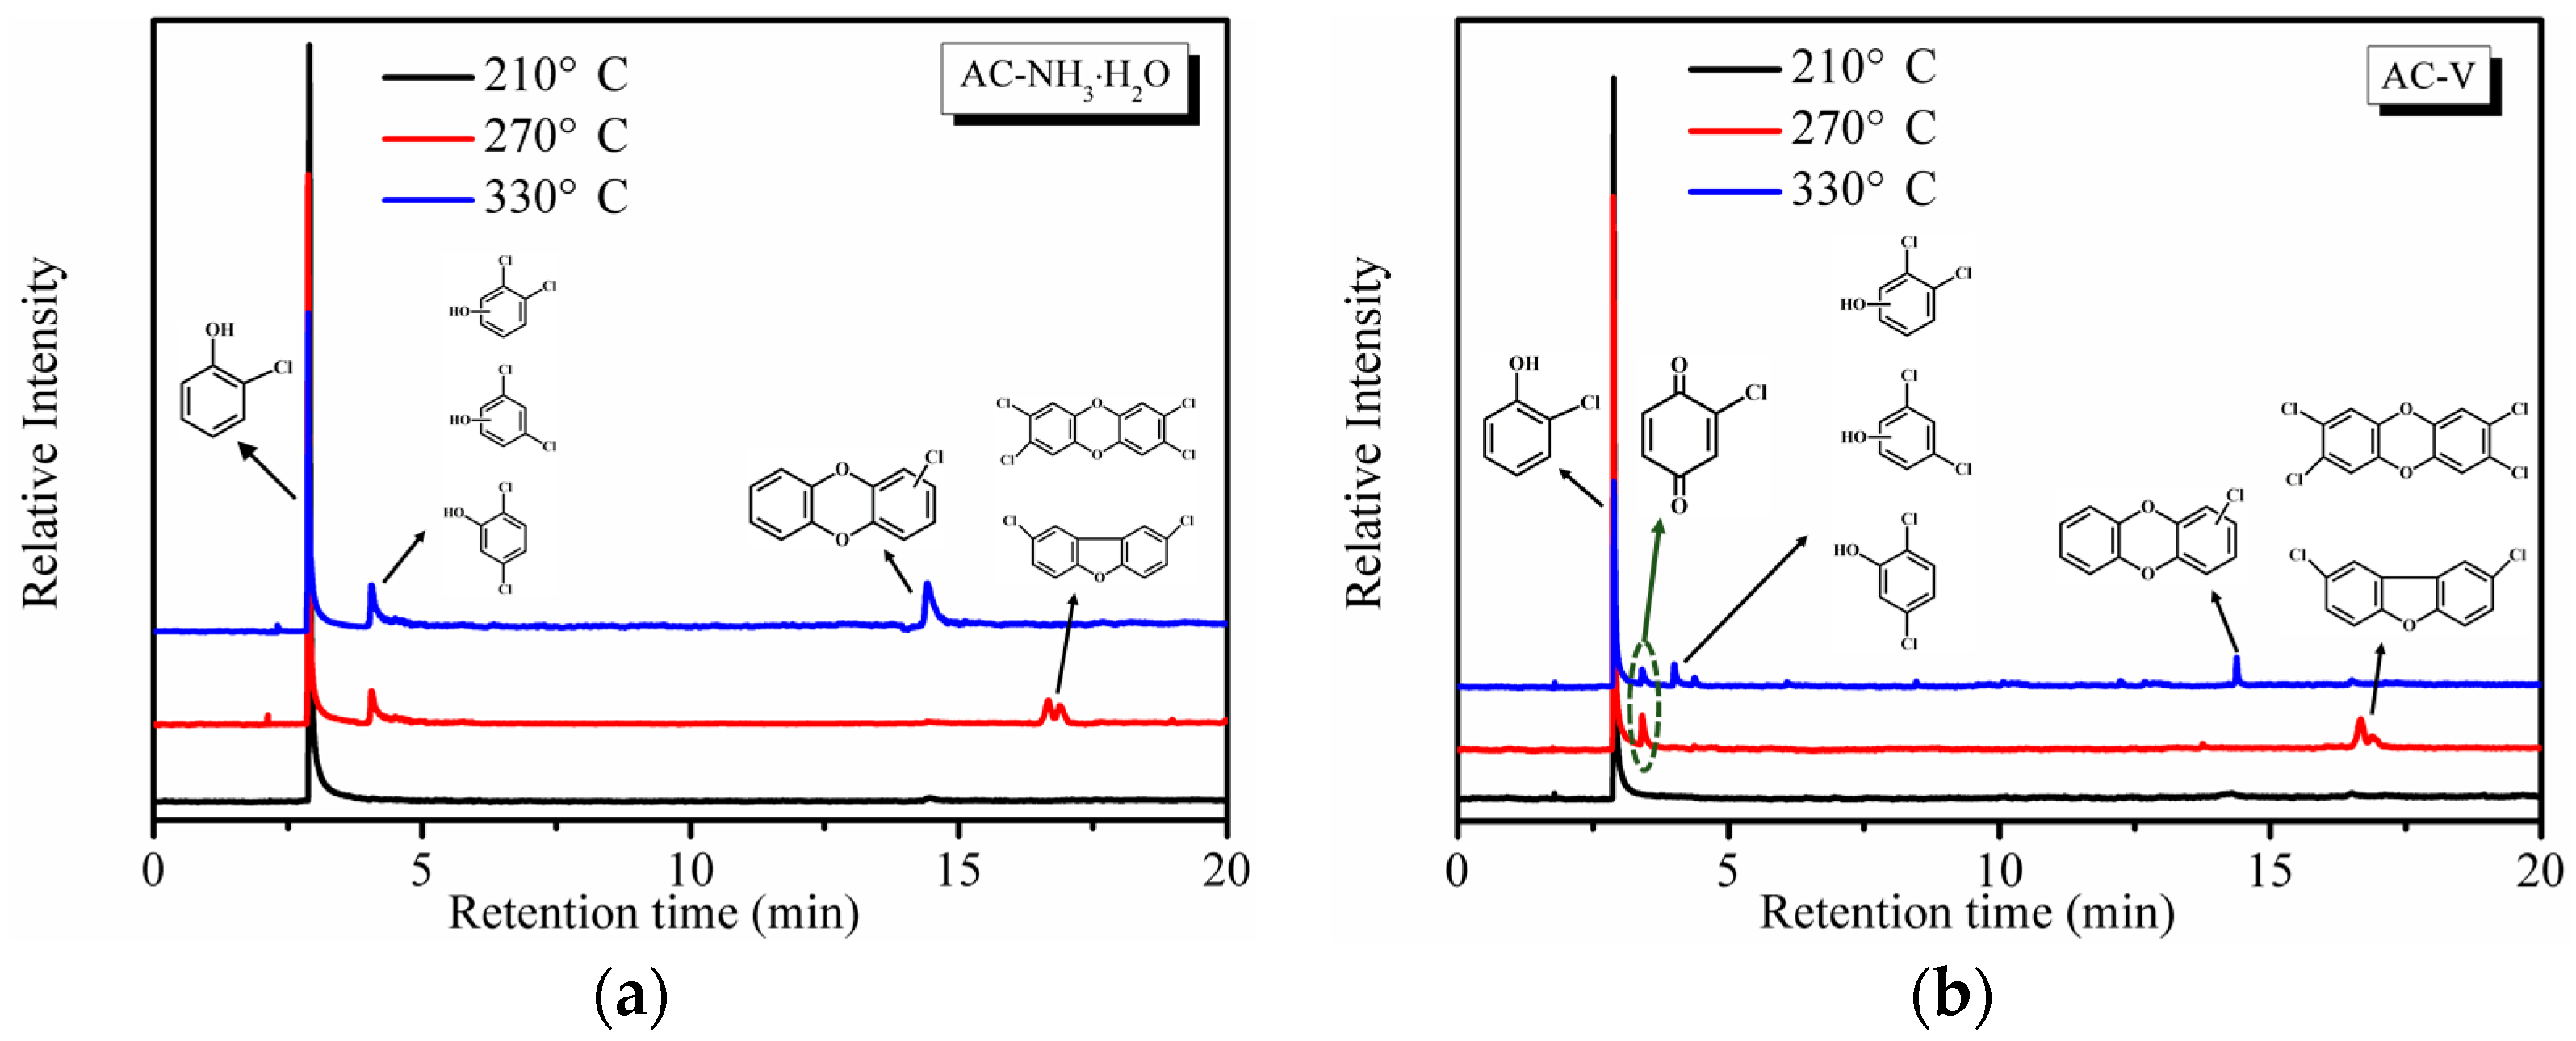
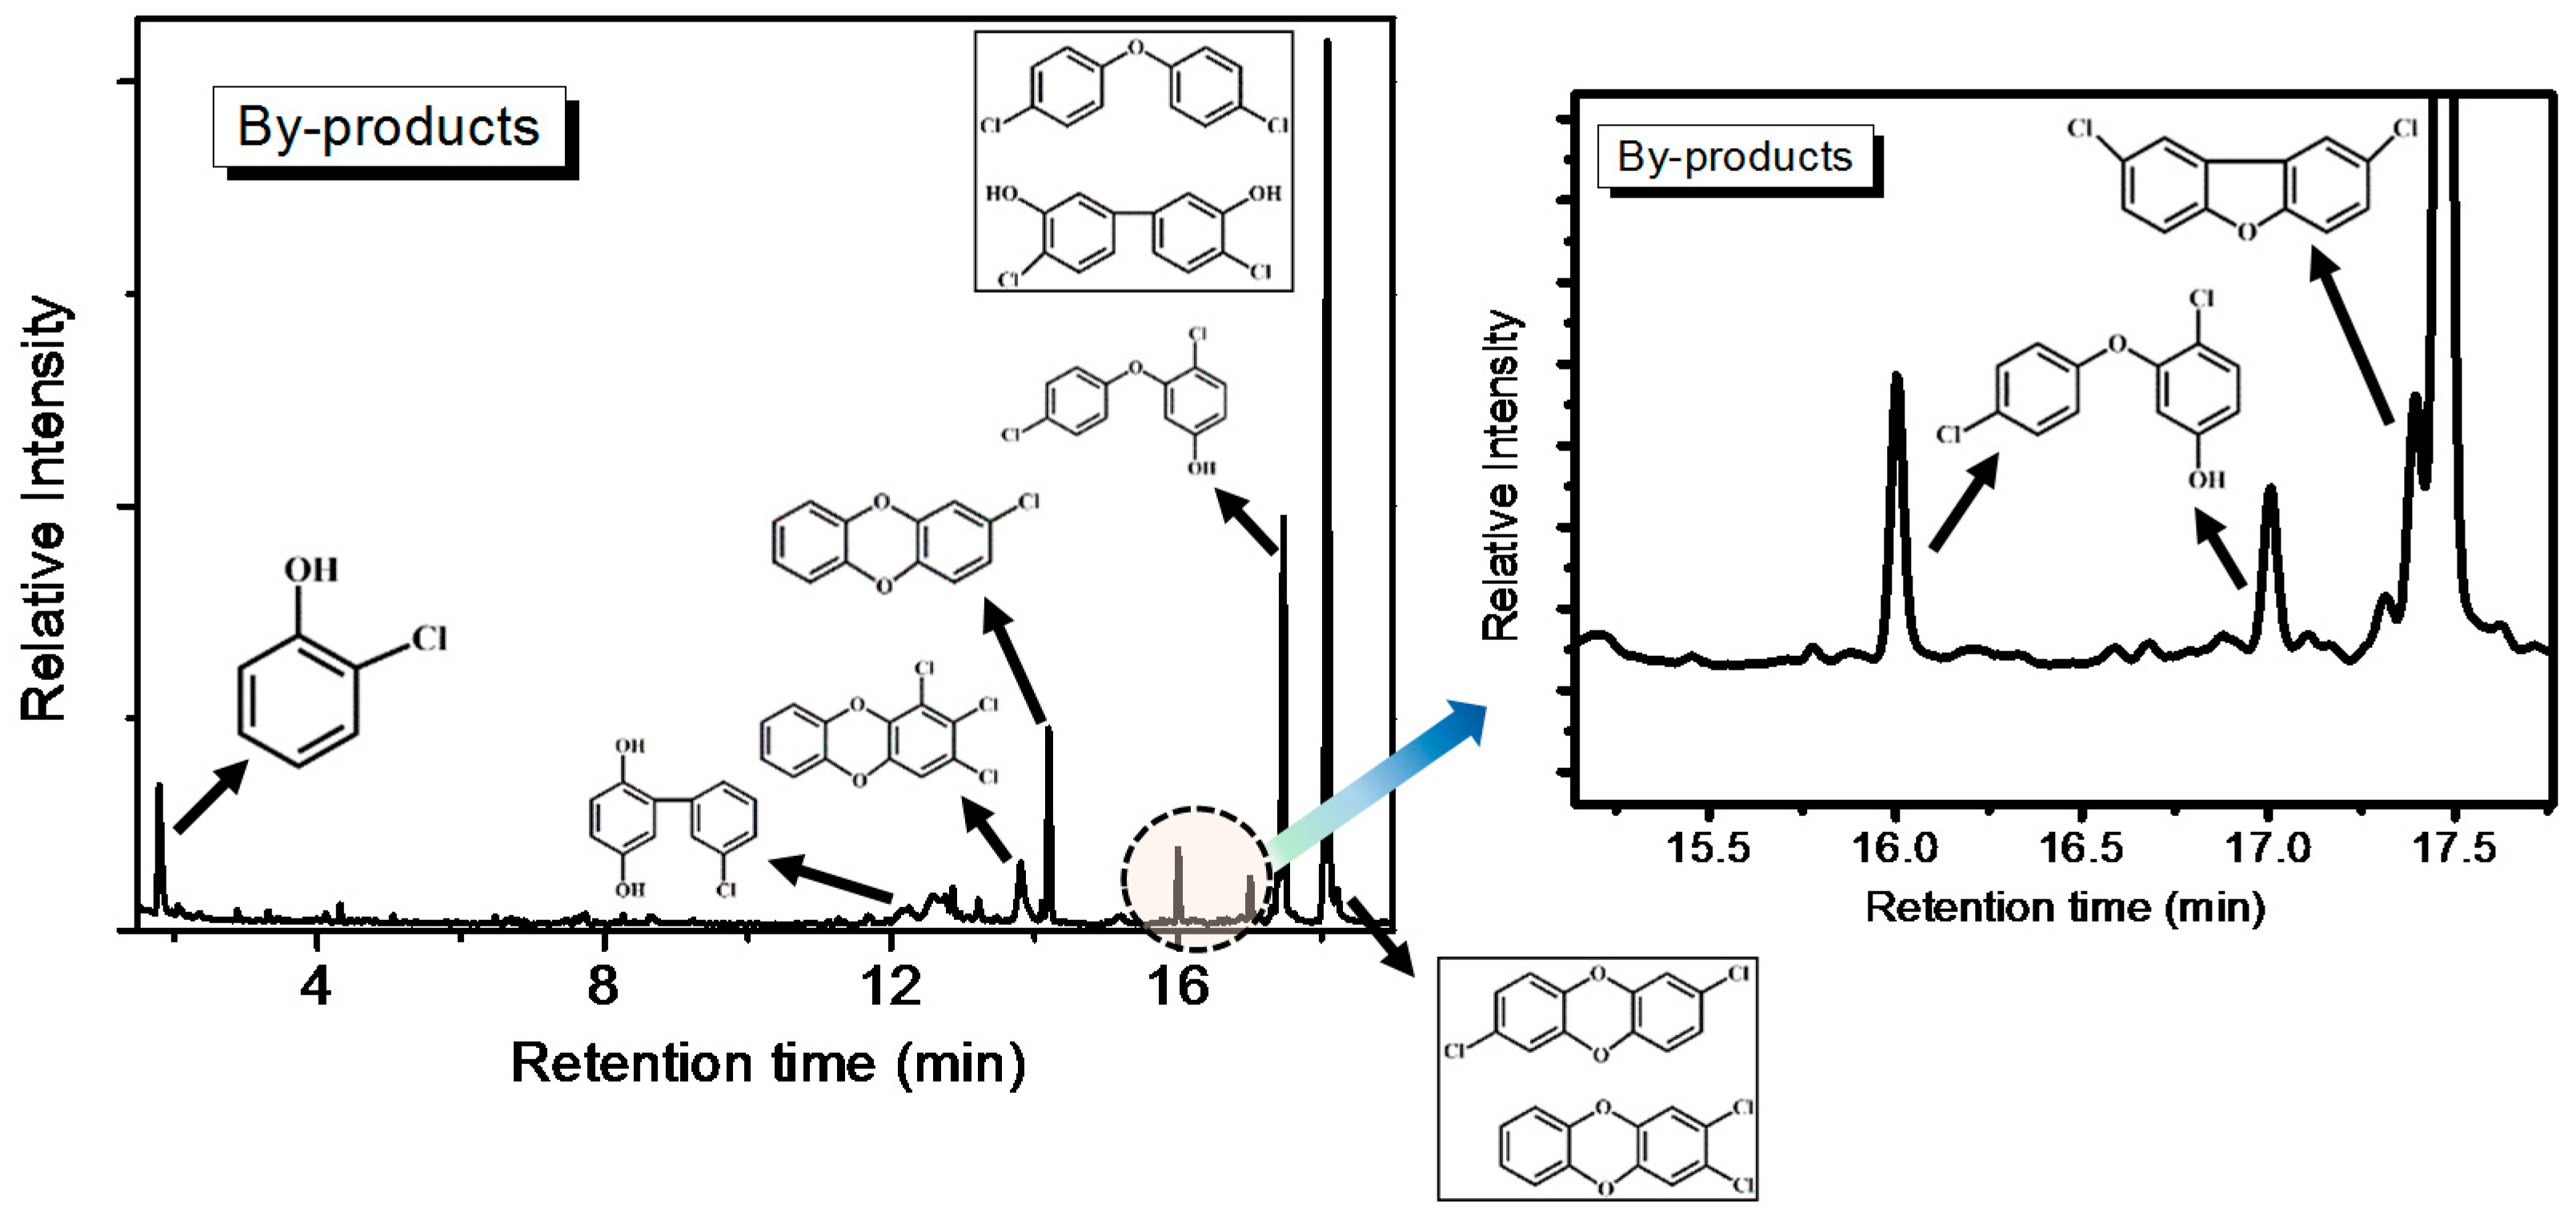
To evaluate the formation of by-products, online GC-MS measurements were performed. Reaction temperatures of 210 °C, 270 °C, and 330 °C were selected to ensure the highest removal efficiency of o-CP that would generate a sufficient number of by-products for measurement. Note that by-products were not observed during the stability tests. As seen in Figure 8, a significant amount of partial oxidation products was detected during the oxidation of o-CP over both AC–NH3·H2O and AC–V. As shown in Figure 8a, the AC–NH3·H2O catalyst yielded the main products of o-CP, chlorophenesic acid (C6H3Cl2OH) and PCDD/Fs. According to the XPS results in Figure 6, polymerization of o-CP or its derivatives occurred on the catalyst’s surface, which is not surprising as Amiridis et al. [19] have already demonstrated the high reactivity of o-CP.
By-products began to appear at 270 °C, including chlorophenesic acid, dichlorinated dibenzofurans, and 2,3,7,8-tetrachlorinated dibenzo-p-dioxin, which is the most toxic PCDD/Fs substance. Notably, the dichlorinated dibenzofurans and 2,3,7,8-tetrachlorinated dibenzo-p-dioxin completely disappeared when the temperature reached 303 °C and a new substance, monochlorinated dibenzo-p-dioxins, emerged, which shows that the toxicity is reduced as the temperature increases.
The catalyst AC–V is clearly different from AC–NH3·H2O, as shown in Figure 8b, which exhibits the presence of o-chloranil (C6H3ClO2) instead of chlorophenesic acid at 270 °C. Further, the peak area of the PCDD/Fs is much smaller than those degraded by AC–NH3·H2O. At 303 °C, the o-chloranil peak remained unchanged, while the peak areas of chlorophenesic acid and monochlorinated dibenzo-p-dioxins are much smaller than the analogous peaks of AC–NH3·H2O, suggesting that the amount of polychlorobenzene produced by AC–V was much smaller. The occurrence of the o-chloranil by-product indicates that the aromatic ring of o-CP was effectively oxidized over the AC–V catalyst relative to AC–NH3·H2O, since the chromatogram of the latter catalyst lacked the o-chloranil by-products, with only polychlorophenol being detected. Thus, it appears likely that two different catalytic mechanisms are operative for these two catalysts.
Heavier partially oxidized products following the oxidation of o-CP with the AC–NH3·H2O catalyst, including biphenyl, chlorobenzene-diols, chlorinated ethers, PCDD/Fs, and furans, were collected in a cold trap and analyzed offline by GC-MS. The results are shown in Figure 9. The formation of these products can be attributed to concomitant reactions involving condensation, coupling, and chlorination/de-chlorination [1,20]. The detection of trace amounts of PCDD/Fs is consistent with previous literature concerning the oxidation of chlorinated phenols, as well as the oxidation of phenol in the presence of HCl over fly ash and CuO [1]. In fact, chlorophenol is considered to be the predominant precursor in heterogeneously catalyzed reaction mechanisms of PCDD/Fs formation [21]. Furthermore, the chlorinated PCDD/Fs, ethers, and furans observed are condensation products resulting from reactions between either two adsorbed species (via a Langmuir-Hinshelwood mechanism) or a surface and gas-phase/weakly adsorbed species (via an Eley–Rideal-type mechanism).
Treatment of AC with nitrogen-containing molecules such as ammonia could introduce nitrogen functionalities, and pyridine is the most important such species. That is, studies have shown that increased levels of SCR denitrification are associated with the existence of a higher proportion of pyridine molecules on the AC surface [22,23]. However, the role of pyridine in the catalytic mechanism remains uncertain.
Pyridine has an electron-rich structure, and its catalytic prowess may be derived from the basicity of its nitrogen atom. Furthermore, the synthesis of PCDDs is a radical-type reaction, and the presence of an electron-rich structure such as pyridine may promote the formation of free radicals. Based on the above analysis, a reaction mechanism is proposed in Figure 10a. Under heating, the nitrogen atoms on pyridine abstract hydrogen atoms from the phenolic hydroxyl groups on o-CP to generate radical A. Different collision sites of two radical A molecules can produce different polymer products. Using pathway C in Figure 10a as an example, dichlorine PCDDs are produced from the reaction. Clearly, the presence and position of hydroxyl and chlorine groups on the aromatic ring leads to the formation of distinct products [1]. Pathway C may be the most unlikely scenario , which is why only a small amount of the product PCDDs was observed (Figure 9). Radical C is oxidized to pyridine in the presence of molecular oxygen. It can be deduced from the above arguments that a risk of dioxin synthesis and escape during the regeneration process is possible when nitrogen-modified carbon is used in the SCR catalytic reaction, especially in the presence of chlorine atoms, benzene rings, and oxygen.
Various mechanisms of PCDD/Fs oxidation have been proposed using model substances including chlorobenzene [24] and polychlorobenzene [25]. The oxidation of o-CP may possess a distinct mechanism. On the basis of the collective results presented herein, a reaction mechanism for the degradation of o-CP on the AC–V surface is proposed (Figure 10b). For AC–V, o-CP reacts to form transition state D involving the double-bond oxygen atom of vanadium oxide and vanadium, which transforms quickly to E. Subsequently, an electron transfer occurs to form a positively charged oxygen compound F, which restores vanadium (V) to vanadium (IV). Note that compounds F, the carbocation G, and H are resonance forms. Further oxidation of H into o-chloranil occurs in the presence of molecular oxygen. A ring-opening reaction involving oxygen then occurs for o-chloranil to generate various types of acids, alcohols, and other small molecular species, which ultimately lead to the formation of the final products such as COx, H2O, and HCl. Vanadium (IV) can be re-oxidized by molecular oxygen to regenerate the original state.
3. Experimental
The original activated carbon (AC–O, 20–40 mesh) used in the experiments was obtained from the Gongyi AC plant in Henan province, China. It was washed with distilled water and dried at 110 °C for 24 h before modification. Nitrogen, carbon dioxide, ammonia were purchased from Dalian Special Gases Co., Ltd. (Dalian, China). NH3·H2O, n-hexane and HNO3 were obtained from China National Pharmaceutical Group Corporation (Beijing, China). Vanadic anhydride, oxalic acid, cobalt nitrate, cerous nitrate, platinum nitrate, palladium nitrate, manganese nitrate, cobalt nitrate and ferric nitrate were obtained from Aladdin Industrial Corporation (Los Angeles, CA, USA). All of the chemicals were of analytical grade except for n-hexane used for the GC-MS measurements, which was of chromatographic purity.
3.1. Preparation of Modified Activated Carbon
To prepare the modified AC, chemical and thermal treatments were performed on AC–O to obtain carbon surfaces with different reactivity. N2, CO2, NH3, NH3·H2O, and HNO3 were used for the chemical treatment by high-temperature calcination or room-temperature impregnation. For the AC modified by metals, V, Co, Ce, Mn, Pt, and Pb were selected for impregnation using metal nitrate as the precursor.
3.1.1. Chemical Treatment
The chemical treatment of AC–O was performed using HNO3 (6 mol/L) and NH3·H2O (30 wt.%) at room temperature for 24 h. The samples were then washed with distilled water repeatedly to pH 7 to remove any excess reagent and water-soluble compounds. Finally, the samples were dried at 110 °C for 24 h and stored in a desiccator for later use. The samples are referred to as AC–HNO3 and AC–NH3·H2O for AC–O modified by HNO3 and NH3·H2O, respectively.
Thermal treatment was performed in a tubular reactor (Tube Furnace OTF-1200X, Sino US Joint Venture Hefei Branch Crystal Materials Technology Co., Ltd., Hefei, China). Initially, AC–O (10 g) was placed in the reactor and treated with NH3 (1 wt.%, argon gas balance), CO2 (1 wt.%, argon gas balance), and N2 (99.999%) at 900 °C. The total gas flow was 300 mL/min and the thermal process was set from 20 to 900 °C at a heating rate of 10 °C/min. The samples were then held at 900 °C for 3 h. Here, the thermal treatment of samples are referred to as AC–NH3, AC–CO2, and AC–N2 following modification by NH3, CO2, and N2, respectively.
3.1.2. Metal Modification
Impregnation by precipitation into AC–O was conducted in a similar manner to that employed by Yu et al. in their study involving the precipitation of iron into nano-TiO2 [28]. In this study, AC–O (10 g) was impregnated with nitrate solutions of Co, Ce, Mn, Fe, Pt, and Pd. For impregnation with V, 10 g of AC–O was impregnated in a mixed solution of ammonium metavanadate and oxalic acid dehydrate (2:1, mole ratio). The concentration of the metal elements was . The solutions were maintained under magnetic stirring for 12 h until equilibrium was reached. The samples were then dried at 110 °C for 12 h. Next, the samples were placed in a tubular reactor and 300 mL/min of N2 (99.999%) was flowed through for 3 h at 500 °C. After cooling, the loaded metal was then oxidized by 300 mL/min of air at 250 °C for 3 h.
3.2. Catalytic Evaluation and By-Product Measurement
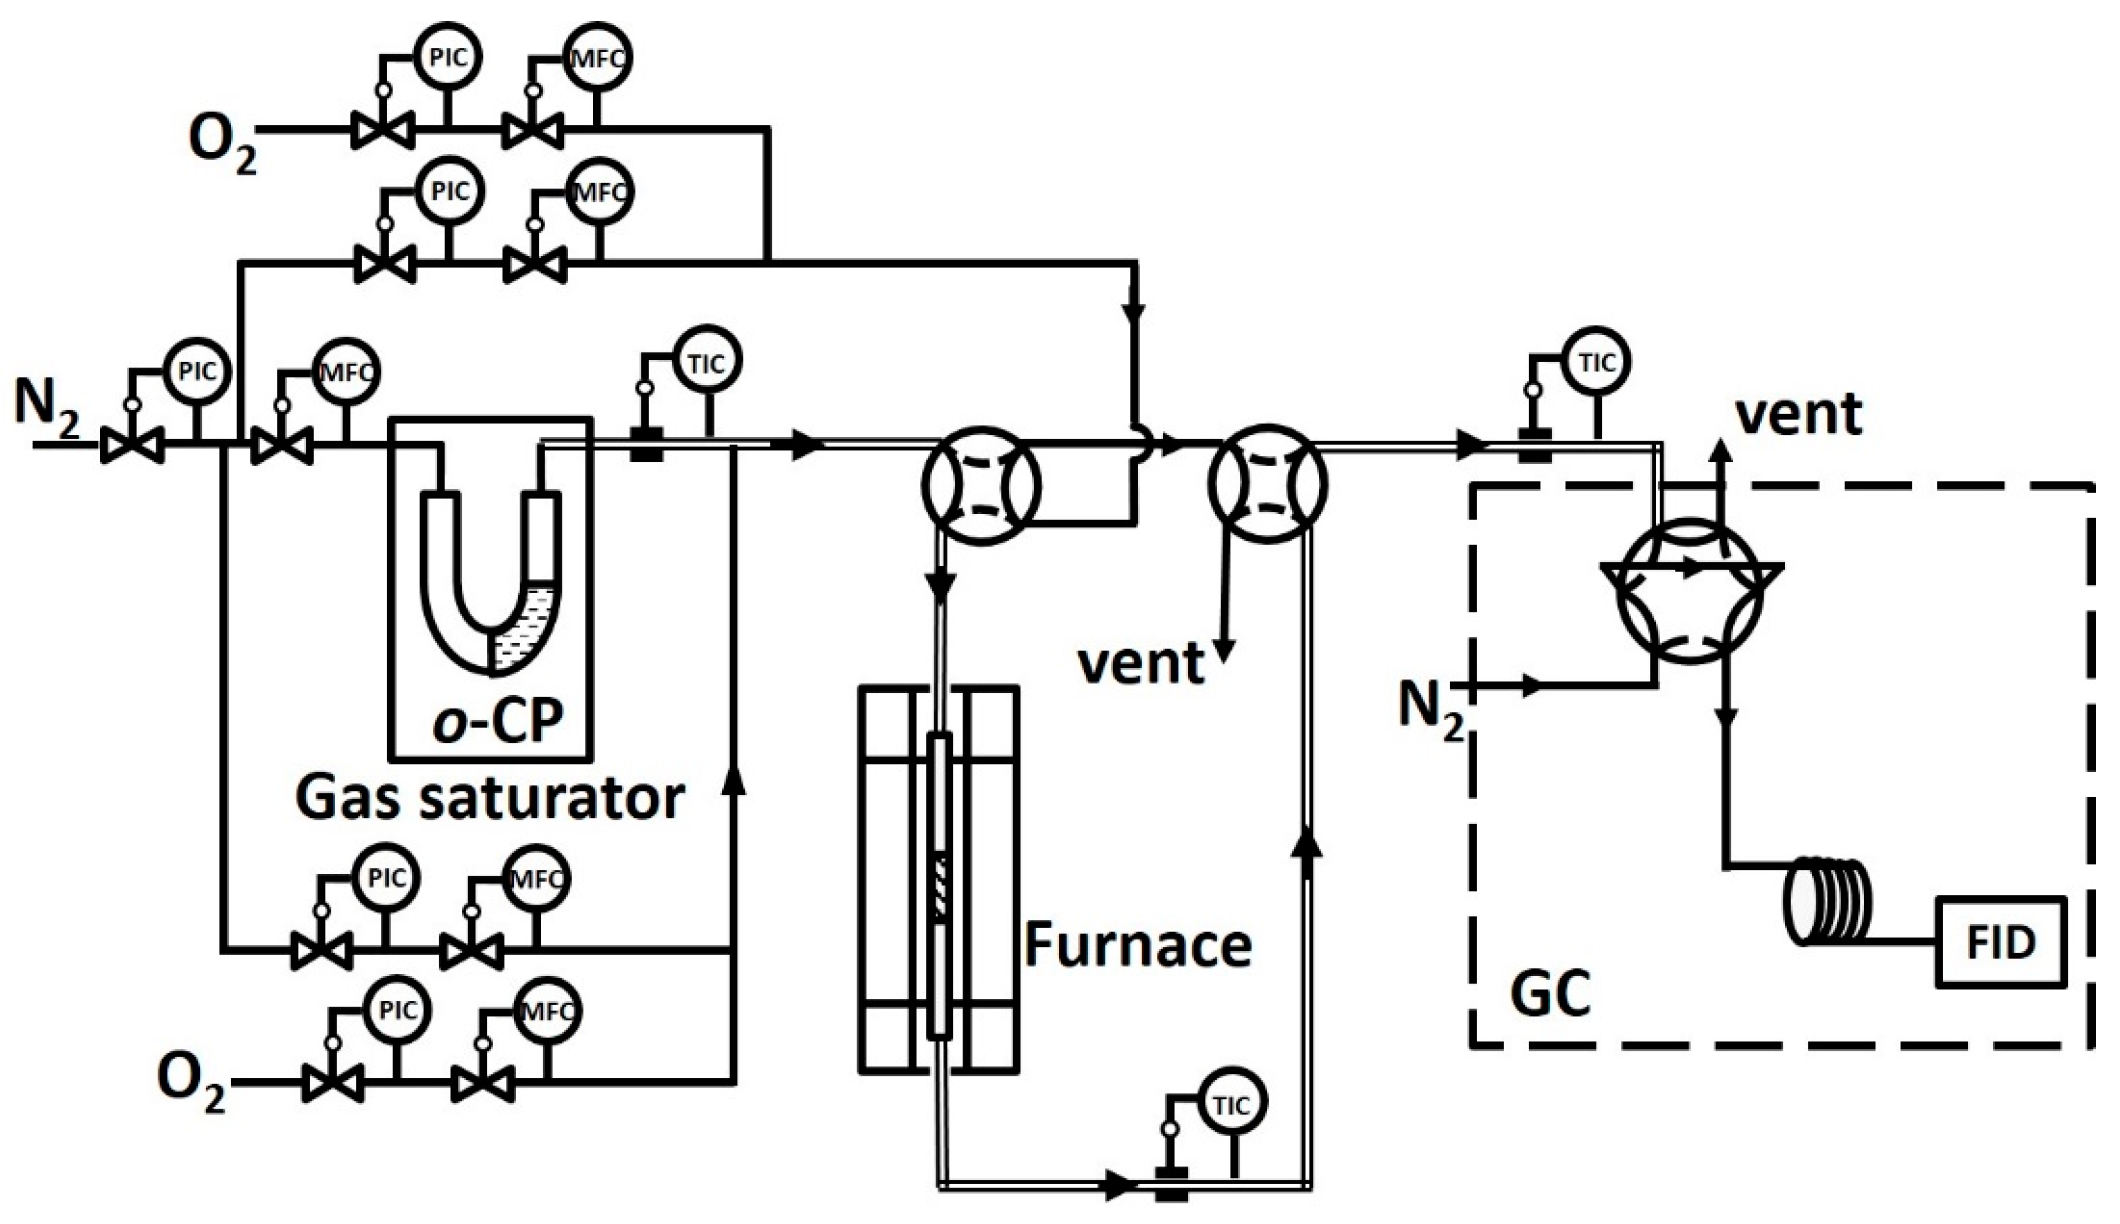
A schematic representation of the experimental setup is shown in Figure 11. o-CP vapor was generated by bubbling a 10 mL/min (±1%) N2 (99.999%) stream through the material heated by a water bath at 50 ± 0.1 °C. This stream was further mixed with N2 and 6% O2 (99.999%) to maintain an inlet concentration of o-CP of 200 ppm (±2.5%). Then, the mixed gases were flowed into the reactor. The volumetric flow through the catalyst bed was 300 mL/min (±3%; measured at 101 kPa and 25 °C) corresponding to a gaseous hourly space velocity (GHSV) of 95,000 h−1.
The catalytic studies of the prepared catalysts were performed in a fixed-bed quartz tube reactor with a 6 mm diameter and 440 mm height using a sieve plate in the middle. Approximately 100 mg of the catalyst in the form of 20–40 mesh particles were utilized in each experiment, and a tube furnace was used to maintain the reaction temperature. All tubing was heated to 80 °C before and after the reaction to avoid gas condensation.
The concentrations of o-CP in the reactor inlet and outlet streams were calibrated online by a gas chromatograph (7890, Agilent, Palo Alto, CA, USA) equipped with a DB-XLB capillary column and a flame ionization detector (FID). The removal efficiency of o-CP was calculated by the following expression:
where R is the removal efficiency of o-CP and Cin and Cout are the inlet and outlet concentrations of gaseous o-CP, respectively.
The reaction was performed from 180 to 330 °C in step mode. At each temperature investigated, the catalyst was stabilized for 60 min. According to the literature [19], the “sat” procedure was used to eliminate instability; that is, the catalyst first contacted a concentrated flow of o-CP (200 ppm) for 90 min at 150 °C. Subsequently, the flow composition was stabilized at a steady state, which was followed by the usual temperature-programmed test. The analysis parameters were set to allow one analysis every 10 min and to obtain an accuracy within a range of ~1% (relative) for the removal of o-CP. To calculate the removal efficiency at a given temperature, only the reactant concentrations were considered; they were the averaged values of measurements taken from 30 to 60 min after stabilization. The blank run (without catalyst), which was performed at 180–330 °C, revealed that neither catalytic nor gas-phase homogeneous reactions had occurred.
By-products were identified by condensing the product stream with a cold trap, dissolving in n-hexane, and analyzing with GC-MS (Shimadzu, QP 2010 Plus, Kyoto, Japan) equipped with a Rxi®-5Sil MS (Restek, PA, USA) column. The by-products were also detected by online analysis using the same instrument. The production of CO and CO2 was monitored by online analysis using a GC (Shimadzu, QP 2010 Plus, Kyoto, Japan) with an FID detector with a methanizer furnace for the conversion of COx to CH4.
3.3. Sample and Product Characterization
X-ray photoelectron spectroscopy (XPS) was performed on an ESCALAB 250 spectrometer from Thermo Fisher Scientific (Waltham, MA, USA) with monochromatic Al Kα (1486.6 eV) radiation (15 kV, 10 mA). The analysis chamber was operated under ultrahigh vacuum with a pressure close to 2 × 10⁻⁹ Torr. Charge compensation was achieved by using an electron flood gun adjusted at 8 eV and placing a nickel grid 3.0 mm above the sample. Pass energy for the analyzer was 20 eV and the spot size was approximately 500 μm. The surface atomic concentrations were calculated by correcting the intensities with theoretical sensitivity factors based on Scofield cross-sections [29]. The following peaks were used for the quantitative analysis: O 1s, C 1s, V 2p, Co 2p, and Cl 2p. Based on the XPS analysis, the surface ratio of impregnated oxide/support was estimated by the formula:
N2 adsorption measurements were performed at 77 K under a N2-partial pressure of P/P0 = 0.3 on a NOVA3200e, Quantachrome (Boynton Beach, FL, USA) in order to determine the Brunauer-Emmett-Teller (BET) surface area (using the BET equation) of the catalysts and supports. The total pore volume, Vtotal, was determined from the amount of N2 adsorbed at P/P0 = 0.995. The micropore pore volume, Vmi, was determined using the t-plot method and the pore size distributions were calculated using the Quenched Solid Density Functional Theory (QSDFT) split model. Prior to the measurement, the samples were degassed under N2 at 300 °C for 12 h.
Raman spectra were obtained on a Renishaw in Via-plus spectrometer (Renishaw, London, UK) equipped with confocal optics before the spectrometer entrance and a nitrogen-cooled Spectrum-1 CCD detector. A microscope was used to focus the excitation laser beam (514.5 nm excitation line of a Spectra Physics Ar+/laser) on the sample and to collect the Raman signal in the backscattered direction. The presence of the confocal pinhole before the spectrometer entrance ensures a sampling of a 1–3 μm diameter area using the 50× objective, with a final laser power of ~1–4 mW at the sample surface. Acquisition time was 20–300 s and 15–20 spectra were recorded for each sample.
4. Conclusions
A series of AC-based catalysts with different modification methods were synthesized and used as catalysts for the degradation of o-CP in the gas phase. For the catalysts treated chemically, the catalytic effect of AC–NH3·H2O was slightly better than that of AC–NH3, showing a removal efficiency of 82.2% at 330 °C. For the metal-modified catalysts, AC–V and AC–Co demonstrated a similar removal efficiency performance of 93.2% at 330 °C. Although AC–Ce showed a lower T50 value than AC–V and AC–Co, its removal efficiency did not significantly increase with increased temperature. Moreover, the catalytic effect of AC–V was found to be superior to than that of AC–NH3·H2O. Most of the catalytic products were converted into carbon oxides. AC–O exhibited almost no catalytic activity for the generation of both carbon oxides and by-products. In general, modification of the catalysts with metals was found to be more effective than chemical treatment for the removal of o-CP. The results of BET, Raman, XPS, and GC-MS analyses show that complete oxidative degradation of o-CP was achieved by AC–V but not AC–NH3·H2O, with each catalyst operating via distinct reaction mechanisms.
Acknowledgments
This research was financially supported by the National Key Research and Development Program of China (2017YFC021080401) and the National Nature Science Foundation of China (Nos. 51608508, 51778600).
Author Contributions
Yang Zheng conceived and designed the experiments; Yang Zheng and Lei Luo performed the experiments; Yang Zheng analyzed the data; Tingyu Zhu and Yangyang Guo contributed reagents/materials/analysis tools; Yang Zheng and Yangyang Guo wrote the paper.
Conflicts of Interest
The authors declare no conflict of interest.
References
- Lomnicki, S.; Dellinger, B. A detailed mechanism of the surface-mediated formation of PCDD/F from the oxidation of 2-Chlorophenol on a CuO/Silica surface. J. Phys. Chem. A 2003, 107, 4387–4395. [Google Scholar] [CrossRef]
- Deng, W.; Dai, Q.; Lao, Y.; Shi, B.; Wang, X. Low temperature catalytic combustion of 1,2-dichlorobenzene over CeO2–TiO2 mixed oxide catalysts. Appl. Catal. B Environ. 2016, 181, 848–861. [Google Scholar] [CrossRef]
- Bjurlid, F.; Kärrman, A.; Ricklund, N.; Hagberg, J. Occurrence of brominated dioxins in a study using various firefighting methods. Sci. Total Environ. 2017, 599, 1213–1221. [Google Scholar] [CrossRef] [PubMed]
- Long, R.Q.; Yang, R.T. Carbon nanotubes as superior sorbent for dioxin removal. J. Am. Chem. Soc. 2001, 123, 2058–2059. [Google Scholar] [CrossRef] [PubMed]
- Liu, X.; Ye, M.; Wang, X.; Liu, W.; Zhu, T. Gas-phase and particle-phase PCDD/F congener distributions in the flue gas from an iron ore sintering plant. J. Environ. Sci. 2017, 54, 239–245. [Google Scholar] [CrossRef] [PubMed]
- Li, W.; Lin, X.; Yu, M.; Mubeen, I.; Buekens, A.; Li, X. Experimental study on PCDD/Fs adsorption onto Nano-graphite. Aerosol Air Qual. Res. 2016, 16, 3281–3289. [Google Scholar] [CrossRef]
- Hung, P.C.; Lo, W.C.; Chi, K.H.; Chang, S.H.; Chang, M.B. Reduction of dioxin emission by a multi-layer reactor with bead-shaped activated carbon in simulated gas stream and real flue gas of a sinter plant. Chemosphere 2011, 82, 72–77. [Google Scholar] [CrossRef] [PubMed]
- Furubayashi, M.; Hamano, S.; Nagai, K. Regeneration of activated carbon used for removal of dioxins removal from flue gas. Kagaku Kogaku Ronbunshu 2002, 28, 718–725. [Google Scholar] [CrossRef]
- Atkinson, J.D.; Hung, P.C.; Zhang, Z.; Chang, M.B.; Yan, Z.; Rood, M.J. Adsorption and destruction of PCDD/Fs using surface-functionalized activated carbons. Chemosphere 2015, 118, 136–142. [Google Scholar] [CrossRef] [PubMed]
- Everaert, K.; Baeyens, J. Removal of PCDD/F from flue gases in fixed or moving bed adsorbers. Waste Manag. 2004, 24, 37–42. [Google Scholar] [CrossRef]
- Hell, K.; Stieglitz, L.; Altwicker, E.R.; Addink, R.; Will, R. Reactions of 2,4,6-trichlorophenol on model fly ash: Oxidation to CO and CO2, condensation to PCDD/F and conversion into related compounds. Chemosphere 2001, 42, 697–702. [Google Scholar] [CrossRef]
- Alslaibi, T.M.; Abustan, I.; Ahmad, M.A.; Foul, A.A. A review: Production of activated carbon from agricultural byproducts via conventional and microwave heating. J. Chem. Technol. Biotechnol. 2013, 88, 1183–1190. [Google Scholar] [CrossRef]
- Paulis, M.; Gandía, L.M.; Gil, A.; Sambeth, J.; Odriozola, J.A.; Montes, M. Influence of the surface adsorption–desorption processes on the ignition curves of volatile organic compounds (VOCs) complete oxidation over supported catalysts. Appl. Catal. B Environ. 2000, 26, 37–46. [Google Scholar] [CrossRef]
- Leclercq, J.; Giraud, F.; Bianchi, D.; Fiaty, K.; Gaillard, F. Novel inductively-heated catalytic system for fast VOCs abatement, application to IPA in air. Appl. Catal. B Environ. 2014, 146, 131–137. [Google Scholar] [CrossRef]
- Sing, K.S.W.; Everett, D.H.; Haul, R.A.W.; Mouscou, L.; Pierotti, R.A.; Rouquerol, J.; Siemieniewska, T. Reporting physisorption data for gas/solid systems with special reference to the determination of surface area and porosity (Recommendations 1984). Pure Appl. Chem. 1985, 57, 603–619. [Google Scholar] [CrossRef]
- Wesełucha-Birczyńska, A.; Babeł, K.; Jurewicz, K. Carbonaceous materials for hydrogen storage investigated by 2D Raman correlation spectroscopy. Vib. Spectrosc. 2012, 60, 206–211. [Google Scholar] [CrossRef]
- Savchenko, D.; Vorliček, V.; Kalabukhova, E.; Sitnikov, A.; Vasin, A.; Kysil, D.; Sevostianov, S.; Tertykh, V.; Nazarov, A. Infrared, Raman and magnetic resonance spectroscopic study of SiO2:C Nanopowders. Nanoscale Res. Lett. 2017, 12, 292. [Google Scholar] [CrossRef] [PubMed]
- Alsawat, M.; Altalhi, T.; Santos, A.; Losic, D. Facile and controllable route for nitrogen doping of carbon nanotubes composite membranes by catalyst-free Chemical Vapour Deposition. Carbon 2016, 106, 295–305. [Google Scholar] [CrossRef]
- Hetrick, C.E.; Lichtenberger, J.; Amiridis, M.D. Catalytic oxidation of chlorophenol over V2O5/TiO2 catalysts. Appl. Catal. B Environ. 2008, 77, 255–263. [Google Scholar] [CrossRef]
- Dai, Q.; Wang, W.; Wang, X.; Lu, G. Sandwich-structured CeO2@ZSM-5 hybrid composites for catalytic oxidation of 1, 2-dichloroethane: An integrated solution to coking and chlorine poisoning deactivation. Appl. Catal. B Environ. 2017, 203, 31–42. [Google Scholar] [CrossRef]
- Evans, C.S.; Dellinger, B. Mechanisms of dioxin formation from the high-temperature oxidation of 2-chlorophenol. Environ. Sci. Technol. 2005, 39, 122–127. [Google Scholar] [CrossRef] [PubMed]
- Muñiz, J.; Marbán, G.; Fuertes, A.B. Low temperature selective catalytic reduction of NO over modified activated carbon fibres. Appl. Catal. B Environ. 2000, 27, 27–36. [Google Scholar] [CrossRef]
- Wang, Z.; Wang, Y.; Long, D.; Mochida, I.; Qiao, W.; Zhan, L.; Liu, X.; Yoon, S.; Ling, L. Kinetics and Mechanism study of low-temperature selective catalytic reduction of NO with urea supported on pitch-based spherical activated carbon. Ind. Eng. Chem. Res. 2011, 50, 6017–6027. [Google Scholar] [CrossRef]
- Sun, P.; Wang, W.; Dai, X.; Weng, X.; Wu, Z. Mechanism study on catalytic oxidation of chlorobenzene over MnxCe1−xO2/H-ZSM5 catalysts under dry and humid conditions. Appl. Catal. B Environ. 2016, 198, 389–397. [Google Scholar] [CrossRef]
- Chen, Y.; Wu, Q.; Liu, K.R. Dual degradation of gaseous 1,2-dichlorobenzene and PCDD/Fs using Ce doped VxOy/TiO2 immobilized on cordierite. Chemosphere 2016, 154, 472–481. [Google Scholar] [CrossRef] [PubMed]
- Wang, J.; Wang, X.; Liu, X.L.; Zeng, J.L.; Guo, Y.Y.; Zhu, T.Y. Kinetics and mechanism study on catalytic oxidation of chlorobenzene over V2O5/TiO2 catalysts. J. Mol. Catal. A Chem. 2015, 402, 1–9. [Google Scholar] [CrossRef]
- Gallastegi-Villa, M.; Aranzabal, A.; González-Marcos, J.A.; González-Velasco, J.R. Metal-loaded ZSM5 zeolites for catalytic purification of dioxin/furans and NOx containing exhaust gases from MWI plants: Effect of different metal cations. Appl. Catal. B Environ. 2016, 184, 238–245. [Google Scholar] [CrossRef]
- Yu, M.; Li, W.; Li, X.; Lin, X.; Chen, T.; Yan, J. Development of new transition metal oxide catalysts for the destruction of PCDD/Fs. Chemosphere 2016, 156, 383–391. [Google Scholar] [CrossRef] [PubMed]
- Debecker, D.P.; Bertinchamps, F.; Blangenois, N.; Eloy, P.; Gaigneaux, E.M. On the impact of the choice of model VOC in the evaluation of V-based catalysts for the total oxidation of dioxins: Furan vs. chlorobenzene. Appl. Catal. B Environ. 2007, 74, 223–232. [Google Scholar] [CrossRef]
Figure 1.
(a) Evolution of the downstream ortho-chlorophenol (o-CP) concentration during the catalytic test. (b) Local magnification from 150 to 210 °C of panel (a).
Figure 1.
(a) Evolution of the downstream ortho-chlorophenol (o-CP) concentration during the catalytic test. (b) Local magnification from 150 to 210 °C of panel (a).
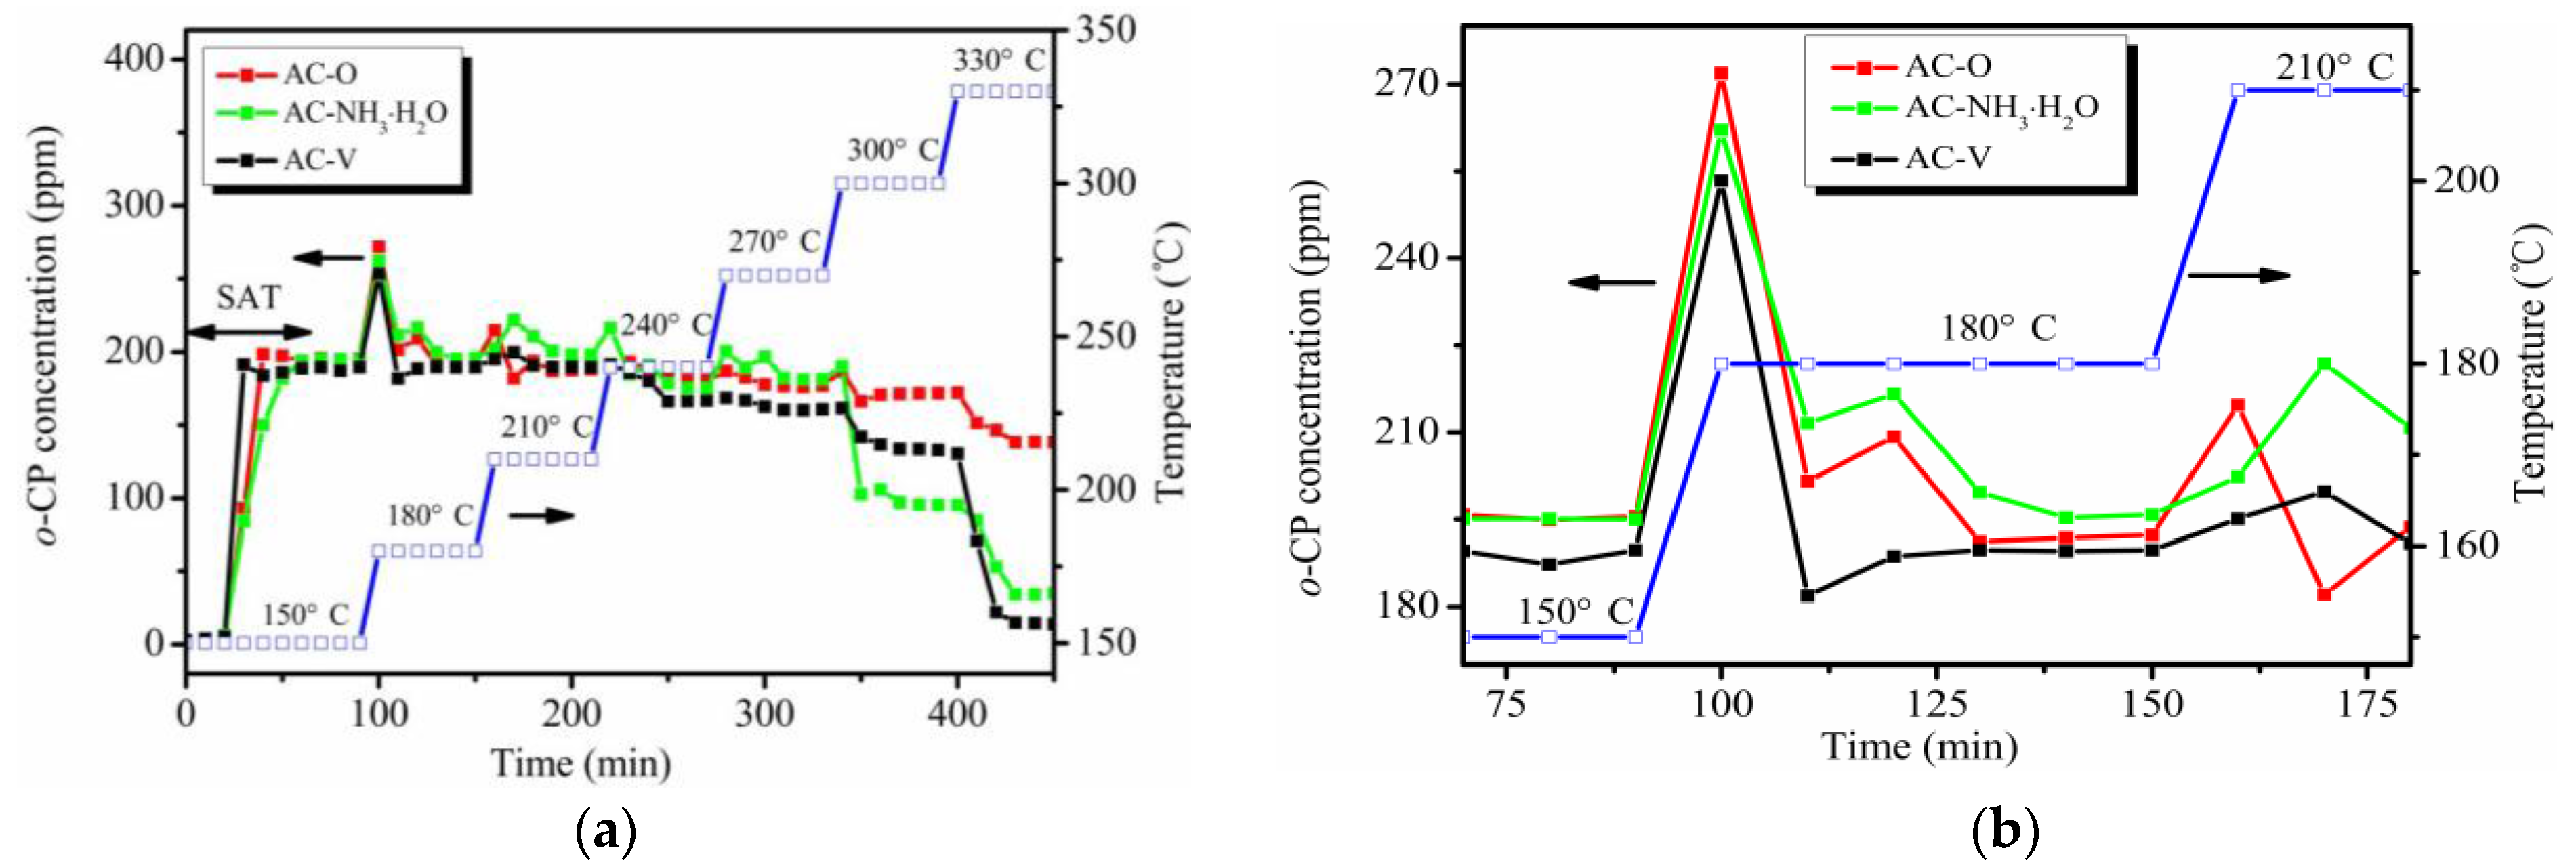
Figure 2.
o-CP conversion as a function of temperature over different catalysts. Conditions: 200 ppm o-CP, the gaseous hourly space velocity (GHSV) of 95,000 h−1 (a) the chemical treated catalysts; (b) the metal modified catalysts.
Figure 2.
o-CP conversion as a function of temperature over different catalysts. Conditions: 200 ppm o-CP, the gaseous hourly space velocity (GHSV) of 95,000 h−1 (a) the chemical treated catalysts; (b) the metal modified catalysts.

Figure 3.
(a) Product distribution of CO and CO2, and (b) Removal efficiencies of by-products and COx following catalytic oxidation of o-CP over three catalysts at 330 °C.
Figure 3.
(a) Product distribution of CO and CO2, and (b) Removal efficiencies of by-products and COx following catalytic oxidation of o-CP over three catalysts at 330 °C.
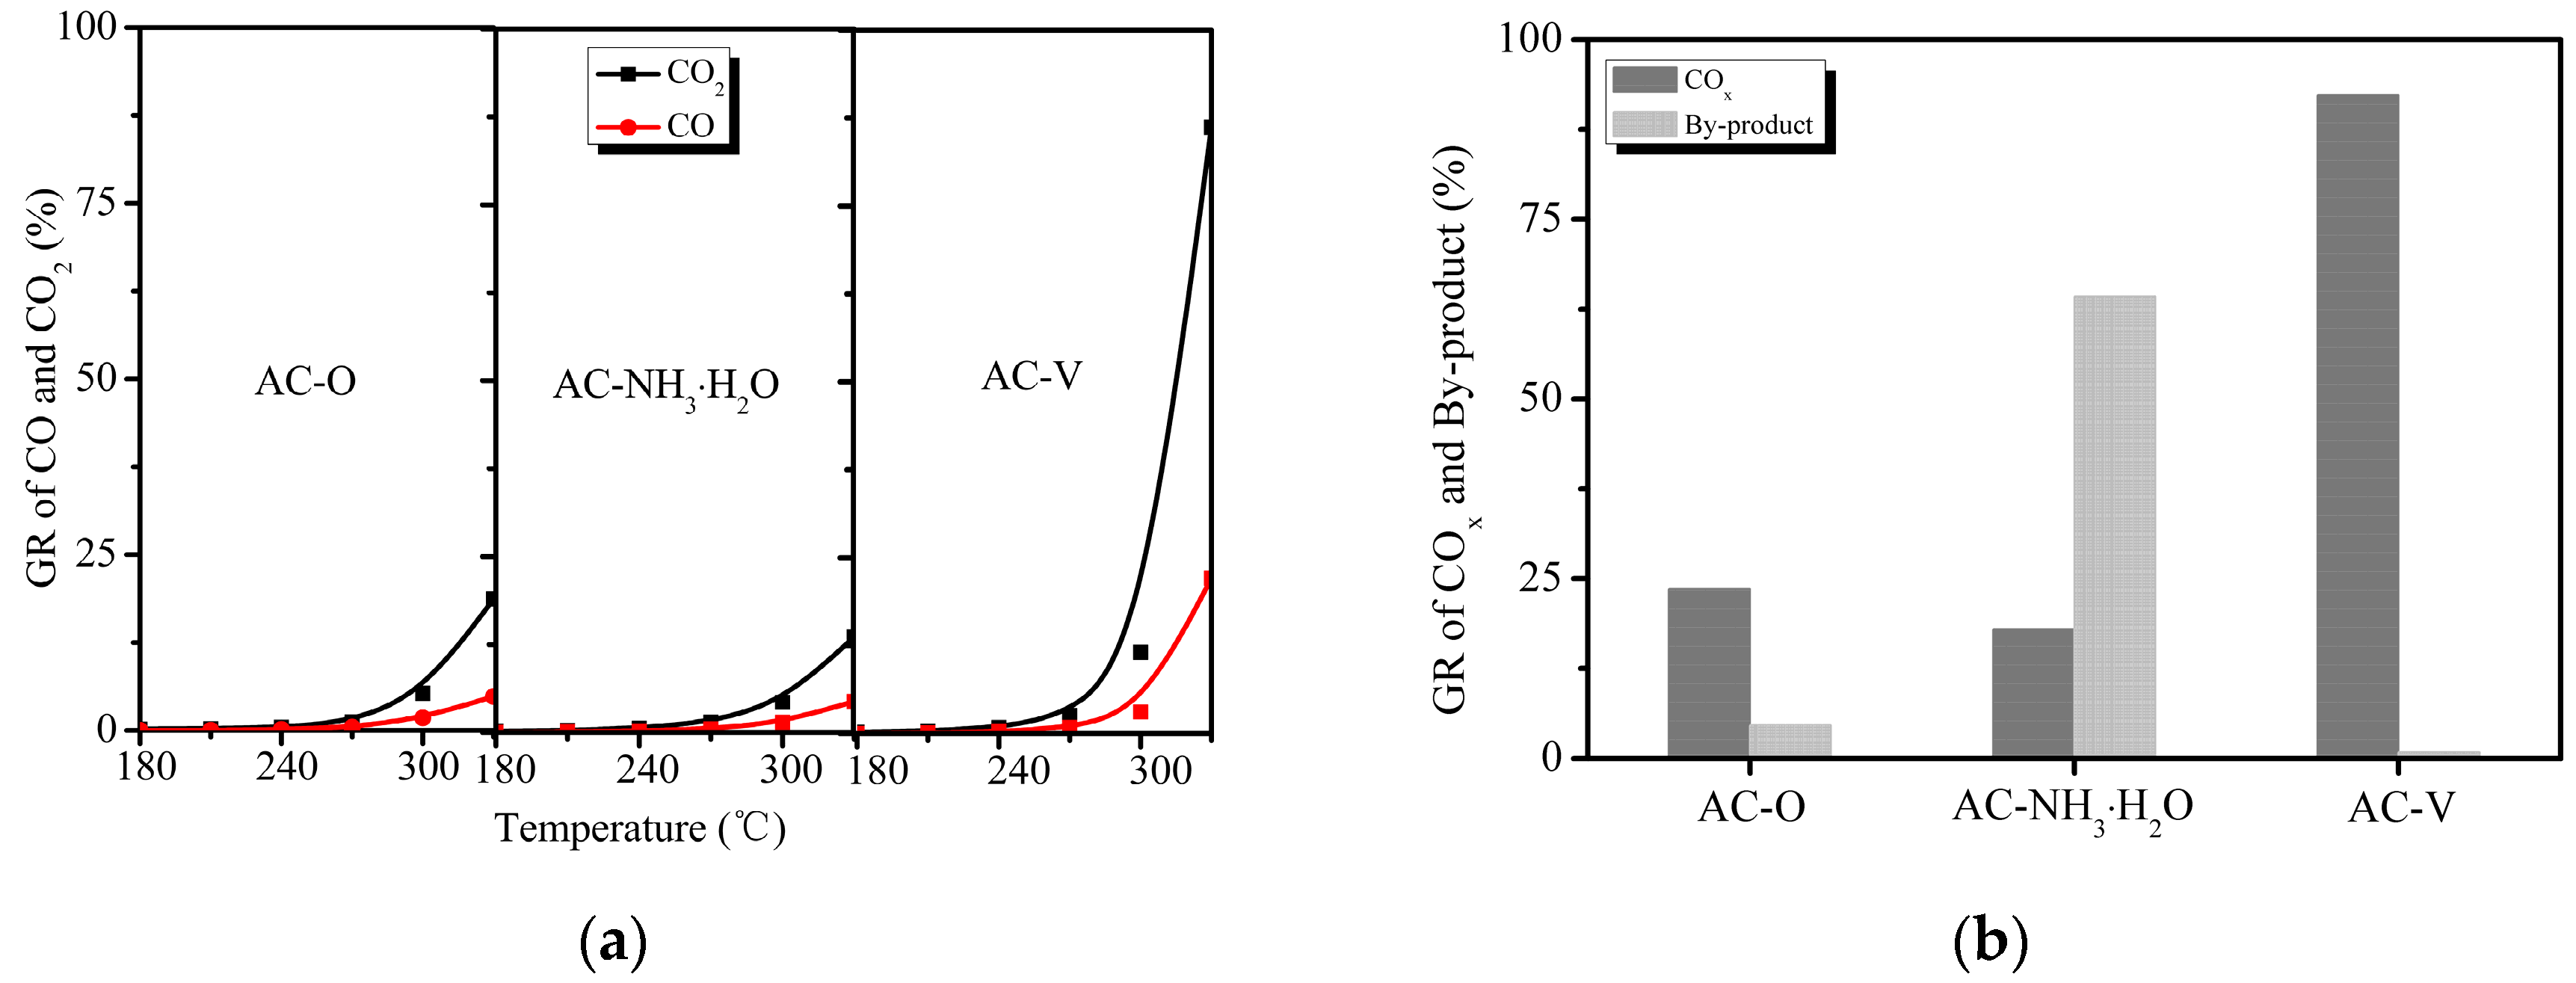
Figure 4.
(a) Low-temperature nitrogen adsorption–desorption isotherms, and (b) Pore size distribution patterns of different catalysts.
Figure 4.
(a) Low-temperature nitrogen adsorption–desorption isotherms, and (b) Pore size distribution patterns of different catalysts.

Figure 5.
Raman spectra of carbonaceous materials in the region 3200–600 cm−1, showing first- and second-order regions of disordered AC.
Figure 5.
Raman spectra of carbonaceous materials in the region 3200–600 cm−1, showing first- and second-order regions of disordered AC.

Figure 6.
XPS results of the samples. (a) O 1s spectrum of AC–O. (b) Area percentages of the functional groups on the basis of the O 1s spectra.
Figure 6.
XPS results of the samples. (a) O 1s spectrum of AC–O. (b) Area percentages of the functional groups on the basis of the O 1s spectra.

Figure 7.
XPS spectra of AC–V: (a) V 2p and (b) Cl 2p.

Figure 8.
Online GC-MS measurements for o-CP oxidation over (a) AC–NH3·H2O and (b) AC–V catalysts.

Figure 9.
Offline GC-MS measurements of o-CP oxidation with AC–NH3·H2O.

Figure 10.
Reaction mechanisms of o-CP oxidation involving (a) AC–NH3·H2O and (b) AC–V.
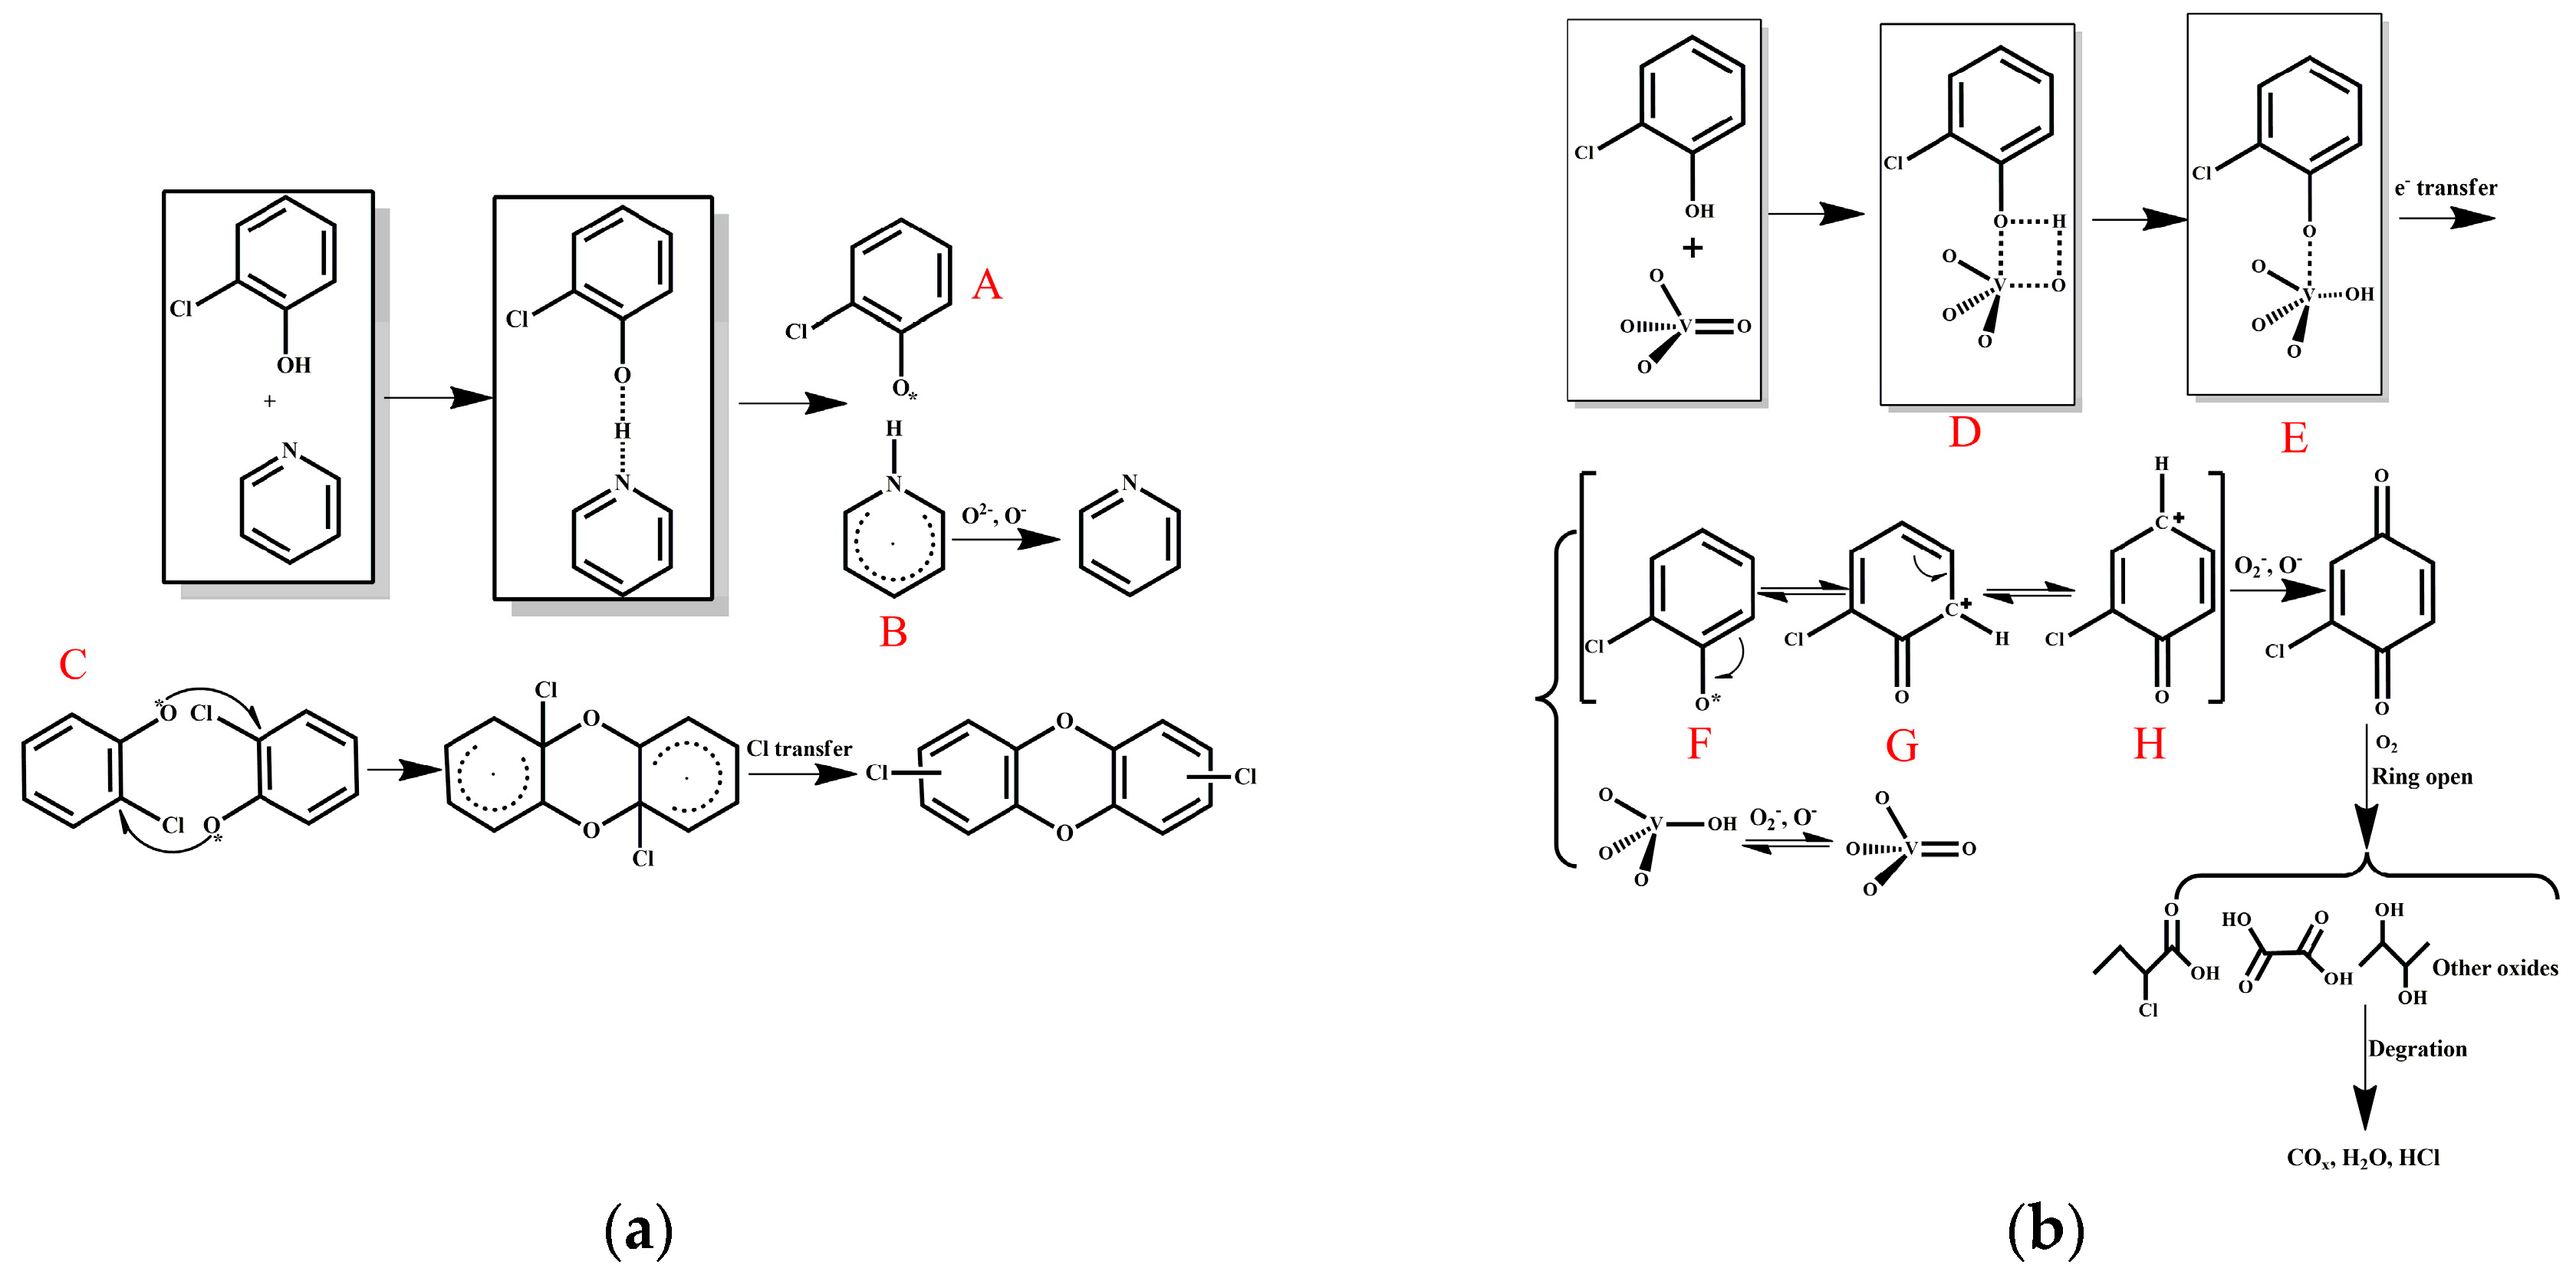
Figure 11.
Schematic representation of the experimental setup. Abbreviations: FID, flame ionization detector; PIC, pressure indicator controller; TIC, temperature indicator controller; MFC, mass flow controller.
Figure 11.
Schematic representation of the experimental setup. Abbreviations: FID, flame ionization detector; PIC, pressure indicator controller; TIC, temperature indicator controller; MFC, mass flow controller.


Table 1.
Physical properties of AC–O and other catalysts.
| Catalysts | SBET/m2·g−1 | Vtotal/cm3·g−1 | Vmi/cm3·g−1 | Pore Size/nm |
|---|---|---|---|---|
| AC–O | 553.1 | 0.3157 | 0.2783 | 0.3692 |
| AC–NH3·H2O | 600.9 | 0.3494 | 0.2984 | 0.3729 |
| AC–V | 599.3 | 0.3440 | 0.2981 | 0.3762 |
| AC–O-a | 155.5 | 0.1027 | 0.0740 | 0.4086 |
| AC–NH3·H2O-a | 91.2 | 0.0676 | 0.0417 | 0.4253 |
| AC–V-a | 172.8 | 0.1270 | 0.0795 | 0.3911 |
Table 2.
Summary of elemental composition and high-resolution C 1s and O 1s spectra of different catalysts before and after reaction.
Table 2.
Summary of elemental composition and high-resolution C 1s and O 1s spectra of different catalysts before and after reaction.
| Samples | AC–O | AC–NH3·H2O | AC–V | AC–O-a | AC–NH3·H2O-a | AC–V-a |
|---|---|---|---|---|---|---|
| N/C | 0.68 | 0.54 | 0.58 | 0.76 | 0.43 | 0.79 |
| O/C | 19.37 | 19.56 | 21.31 | 20.84 | 21.39 | 22.79 |
| Cl/C | 0.05 | 0.04 | 0.04 | 0.84 | 0.40 | 0.49 |
| V/C | - | - | 0.60 | - | - | 0.55 |
© 2018 by the authors. Licensee MDPI, Basel, Switzerland. This article is an open access article distributed under the terms and conditions of the Creative Commons Attribution (CC BY) license (http://creativecommons.org/licenses/by/4.0/).
Share and Cite
MDPI and ACS Style
Zheng, Y.; Guo, Y.; Luo, L.; Zhu, T. Catalytic Degradation of Ortho-Chlorophenol Using Activated Carbon Modified by Different Methods. Catalysts 2018, 8, 37. https://doi.org/10.3390/catal8010037
AMA Style
Zheng Y, Guo Y, Luo L, Zhu T. Catalytic Degradation of Ortho-Chlorophenol Using Activated Carbon Modified by Different Methods. Catalysts. 2018; 8(1):37. https://doi.org/10.3390/catal8010037
Chicago/Turabian StyleZheng, Yang, Yangyang Guo, Lei Luo, and Tingyu Zhu. 2018. "Catalytic Degradation of Ortho-Chlorophenol Using Activated Carbon Modified by Different Methods" Catalysts 8, no. 1: 37. https://doi.org/10.3390/catal8010037
Note that from the first issue of 2016, this journal uses article numbers instead of page numbers. See further details here.