Experimental Research of an Active Solution for Modeling In Situ Activating Selective Catalytic Reduction Catalyst

1
School of Energy and Power Engineering, Changsha University of Science and Technology, Changsha 410114, China
2
School of Electric Power, South China University of Technology, Guangzhou 510640, China
*
Author to whom correspondence should be addressed.
Catalysts 2017, 7(9), 258; https://doi.org/10.3390/catal7090258
Submission received: 21 July 2017
/
Revised: 29 August 2017
/
Accepted: 29 August 2017
/
Published: 31 August 2017
(This article belongs to the Special Issue Selective Catalytic Reduction of NOx)
Abstract
:The effect of active solutions suitable for the in situ activation of selective catalytic reduction (SCR) catalysts was experimentally investigated using a designed in situ activation modeling device. To gain further insight, scanning electron microscopy (SEM), specific surface area analysis (BET), Fourier transform infrared spectroscopy (FT-IR), X-ray diffraction (XRD), and energy dispersive spectroscopy (EDS) analyses were used to investigate the effects of different reaction conditions on the characteristics of the deactivated catalysts. The activation effect of loading V2O5, WO3 and MoO3 on the surface of the deactivated catalysts was analyzed and the correlation to the denitrification activity was determined. The results demonstrate that the prepared activating solution of 1 wt % vanadium (V), 9 wt % tungsten (W), and 6 wt % molybdenum (Mo) has a beneficial effect on the deactivation of the catalyst. The activated catalyst resulted in a higher NO removal rate when compared to the deactivated catalyst. Furthermore, the NO removal rate of the activated catalyst reached a maximum of 32%. The activity of the SCR catalyst is closely linked to the concentration of the active ingredients. When added in optimum amounts, the active ingredients helped to restore the catalytic activity. In particular, the addition of active ingredients, the availability of labile surface oxygen, and the presence of small pores improved the denitrification efficiency. Based on these results, active solutions can effectively solve the problem of denitrification catalyst deactivation. These findings are a reference for the in-situ activation of the selective catalytic reduction of nitrogen oxides (SCR-DeNOx) catalyst.
1. Introduction
Selective catalytic reduction of nitrogen oxides (SCR-DeNOx) has been widely used for the treatment of flue gas streams in coal-fired power plants in China, owing to its superior denitrification efficiency and lower ammonia emissions [1]. However, when the flue gas contacts the catalyst, the adsorption and desorption of the reactants are affected, the specific surface area of the catalyst is reduced, and thus the number of active catalyst sites derease, leading to the deactivation of the catalyst. SO2, SO3, fly ash, and alkali metals contained in the flue gas may decrease the denitrification capacity of the catalyst. SO3 reacts with NH3 to form (NH4)2SO4 [2], NH4HSO4 [3], and CaSO4 [4]. These small particles, with a particle size <10 μm [5], with sticky ammonium sulfate particles, especially ammonium bisulfate, may clog the micropores of the catalyst surface [6,7] and stain and corrode the downstream devices of the SCR, such as the air preheater [8,9]. The combined presence of metal sites and SOx may also result in irreversible loss of active sites via metal sulfates formation [10,11,12]. Fly ash particles hitting the catalyst surface can degrade the catalyst. The particles can also block the microporous channels on the catalyst surface [13], and the deposition of fly ash on the surface of the catalyst may contaminate and shield the catalyst [14], which may prevent the NOx, NH3, and O2 in the flue gas from reaching the active site of the catalyst [5]. The alkali metal oxide decreases the number of active sites on the catalyst and poisons the catalyst by combining with the active acid sites of V2O5, which also reduces the ammonia adsorption on the catalyst surface, decreasing the denitrification activity of the catalyst [15,16,17].
Two main technical methods are generally accepted for addressing the problem of denitrification capacity decrease of the SCR-DeNOx catalyst caused by the flue gas. The first involves the use of fresh catalyst in the overall replacement of deactivated catalyst when the denitrification catalyst activity decreases to a certain level. The cost of this method is prohibitive for the boiler users. The second method is returning the deactivated catalyst back to the plant and then reinstalling it in the denitrification reactor. However, the deactivated catalyst must be removed from the boiler’s denitrification reactor. This requires long-distance transport and secondary installation, which not only requires time and effort, but also causes secondary mechanical damage to the catalyst.
With the aim of solving these problems by increasing the activity of the deactivated catalysts, a method of in situ activation of the denitrified catalyst based on the activating solution is proposed in this study. The activating solution was used to activate the deactivated catalyst in the SCR denitrification reactor to effectively load the active ingredients. It in the in-situ activation process, it is important that the activating solution be efficient, cost effective, and does not cause secondary pollution. The acidity of an in situ activating solution cannot be too strong as it may damage the denitrification reactor. The solution should not only result in the recovery of the denitrification catalyst activity, but should be able to be recycled. Several studies were carried out that resulted in important achievements. For example, Li et al. [18] studied the effect of 1-hydroxy ethylidene-1 and 1-diphosphonic acid solution on the removal of CaWO4, caused by the high content of CaO, from the catalyst surface to activate the denitrified catalyst. However, this activation method was not able to recover the strong acid sites and supplement the active sites. In addition, the effect of flue gas was not considered, and a higher vanadium content must be maintained to ensure the denitrification efficiency. Dong et al. [19] investigated the effect of the acidity of the precursor solution on the activity of the denitrified catalyst. The results showed that with increasing acidity of the precursor solution, more vanadium species and active sites would form on the surface of the catalyst. However, the optimum acidity of the activating solution and the vanadium content in the catalyst activity recovery have not been reported. Although these investigations provided valuable information about activating the SCR denitrification catalyst, only a few studies have reported in situ activation of the catalyst, and the activating solution suitable for in situ activation has not been investigated. Not only is there no activating solution suitable for in situ activation, but no research on the effect of the flue gas in in situ activation process exists.
This study aimed to find an efficient and inexpensive activation solution suitable for in situ activation. An in-situ activation modeling device was designed to activate the deactivated catalyst. The denitrification activity of the catalyst was tested using an activity measuring device. First, the effects of the active ingredients, including vanadium, tungsten, molybdenum, and oxalic acid, and the flue gas conditions, including space velocity, oxygen concentration, ammonia to nitrogen ratio, and the initial concentration of NO, on the in-situ activation of the catalyst were studied. In addition, the effects of these different reaction conditions on the deactivated catalysts were analyzed by scanning electron microscopy (SEM), specific surface area analysis (BET), Fourier transform infrared spectroscopy (FT-IR), X-ray diffraction (XRD), and energy dispersive spectroscopy (EDS). Finally, an efficient activating solution for in situ activation was obtained. The in situ activating modeling experiment provides a powerful platform for activating the deactivated catalysts and is broadly applicable to a variety of systems and experimental conditions. We expect that these results can pave the way for the application of the above catalysts to in situ denitrification situations.
2. Experimental Materials and Methods
2.1. Equipment
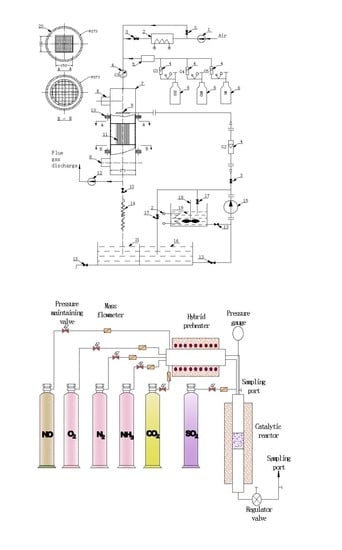
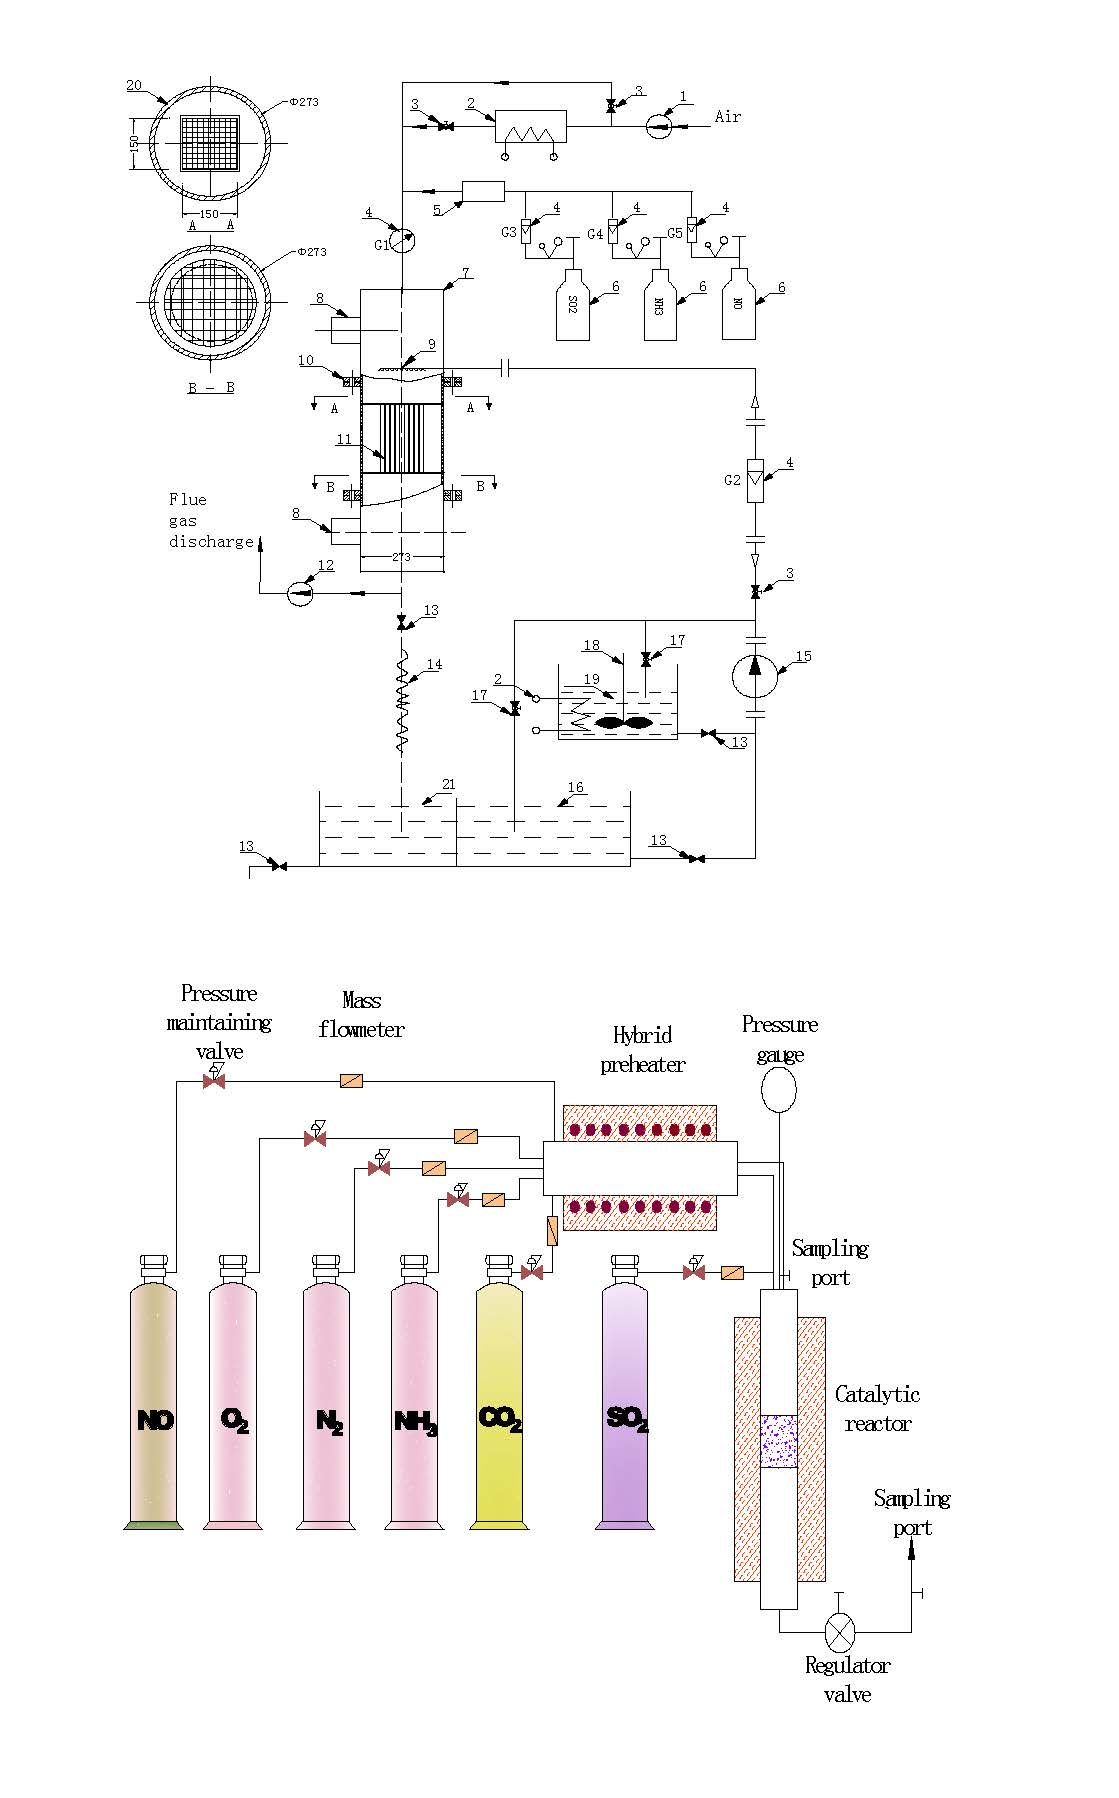
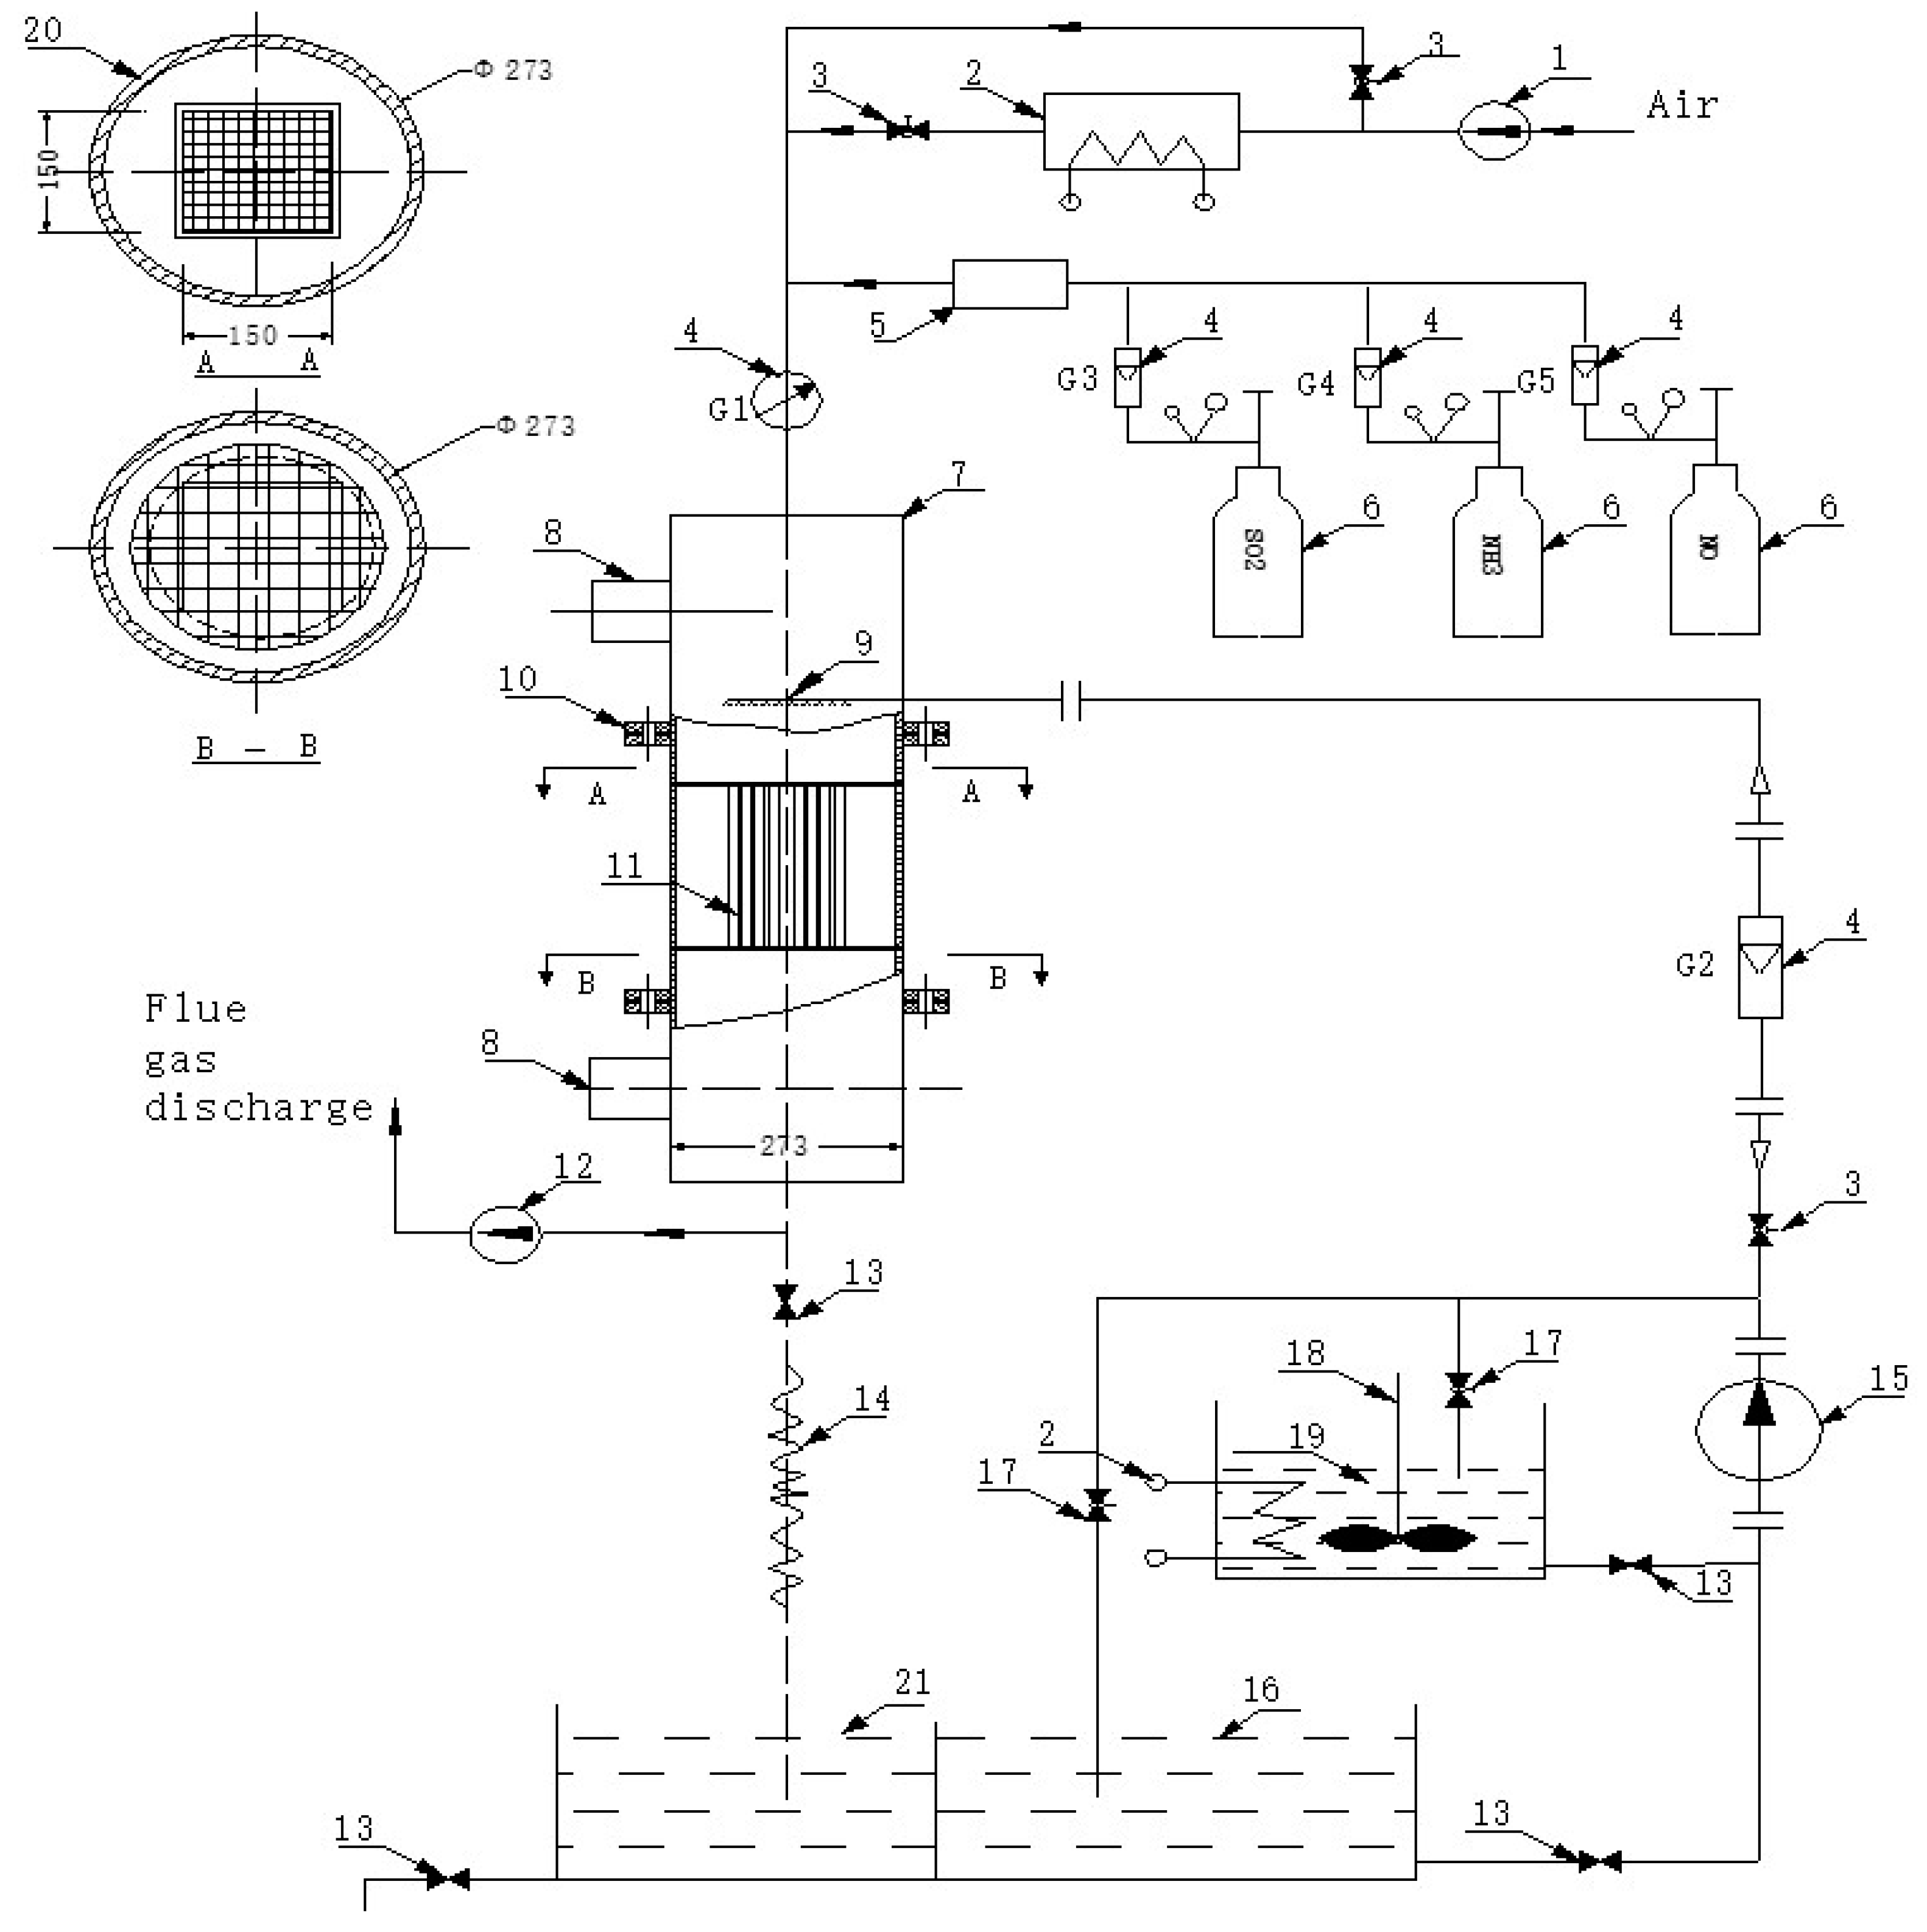
The experimental system includes cleaning system, activation system, drying and roasting system. As shown in Figure 1.
2.1.1. Cleaning
The in-situ denitrification modeling system for the activation process included a clean water tank, sewage tank, valves, flowmeters, and other devices used in the cleaning process of deactivated catalysts. The valve on the clean water tank was adjusted and the flowmeter was used to adjust the rinsing water to appropriate flow volume. The outlet valve of the clean water tank was opened and the pump was started to ensure the water was completely sprayed on the catalyst.
2.1.2. Activation
The in-situ denitrification modeling system for the activation process included activation pools, pumps, valves, and other devices used in the activation process of deactivated catalysts. The inlet valve of the sewage pool and the outlet valve of the clean-water reservoir were closed, while the inlet and outlet valves of the activation pool were opened. Subsequently, the pump was started and the flowmeter was used to adjust the regulating valve of the activation pool until the activate fluid reached a certain flow volume and rate and completely covered the surface of the catalyst.
2.1.3. Drying and Roasting
The in-situ denitrification modeling system for the activation process included air heaters, induced draft fans, regulating valves, and other devices used in the drying and roasting process of catalysts. The air volume and air temperature were adjusted by controlling the heaters, induced draft fans, and regulating valves, to achieve the drying and roasting of the catalysts.
2.2. Materials
2.2.1. Catalyst Preparation
The fresh and deactivated commercial honeycomb catalysts were obtained from a coal-fired power plant. The type of the prepared catalyst samples was ZERONOX1831K, and the catalyst parameters are listed in Table 1. The catalyst adopts TiO2 as the carrier, and the main active ingredients are V2O5, WO3, and MoO3. The fresh and deactivated catalysts were labeled as C and C0, respectively.
2.2.2. Activating Solution Preparation
Commercial vanadium catalysts usually contain ~1 wt % vanadium and ~9 wt % tungsten-molybdenum on a titanium (anatase) substrate. The activating solution composition was calculated according to the mass percentages of active precursors, and were weighed using an electronic balance (JA3003N, accuracy of ±1 mg). In this experiment, a single factor method was used to prepare the activating solution. The main ingredients of the prepared activating solution are listed in Table 2.
2.2.3. Catalyst Activation
To improve the denitrification efficiency of the deactivated catalyst, in situ activation of the deactivated catalyst was performed using an in-situ activation modeling device. First, a water flow of 2500 L/h was used to clean the deactivated catalyst for 1.0 min; the removal of the toxic ingredients with the water improved the micromorphology of the deactivated catalyst. After the cleaning was completed, a 2500 L/h flow of the activation solution was used to spray the deactivation catalyst for 6 min, completely covering the surface of the catalyst and penetrating into it. Then, regulating the frequency of a draft fan and blower, the cold air was blown over the catalyst for 10 min to take away the dust and sulfuric acid, adhering to the surface of the catalyst. Then, an electric heater was turned on to heat the cold air to 100 ± 10 °C to dry the catalyst for 1 h, reducing the water content and the competitive adsorption of H2O and NH3 and increasing the denitrification efficiency of the catalyst. Finally, the frequency of the draft fan and the blower was adjusted to 45 Hz, the temperature of the electric heater was adjusted to 380 ± 10 °C, and the catalyst was reacted in the hot air for 1 h, forming V2O5, WO3, MoO3, and other active ingredients.
During the calcination of the catalyst, the chemical reactions in Equations (1) to (3) occur between the active ingredients:
2NH4VO3→2NH3 + H2O + V2O5
(NH4)10·H2(W2O7)6·H2O→10NH3 + 7H2O + 12WO3
(NH4)6·(Mo7O24)6·4H2O→6NH3 + 7H2O + 7MoO3
The main active ingredient (V2O5) would evenly precipitate and attach to the surface of the catalyst to supplement the active ingredient lost by the deactivated catalyst, which is either lost, poisoned, or abraded at high temperature. At the same time, a chemical reaction also occurs on the surface of the catalyst to produce WO3 and MoO3, which are evenly distributed on the surface of the catalyst.
2.3. Methodology
2.3.1. Catalytic Performance Test
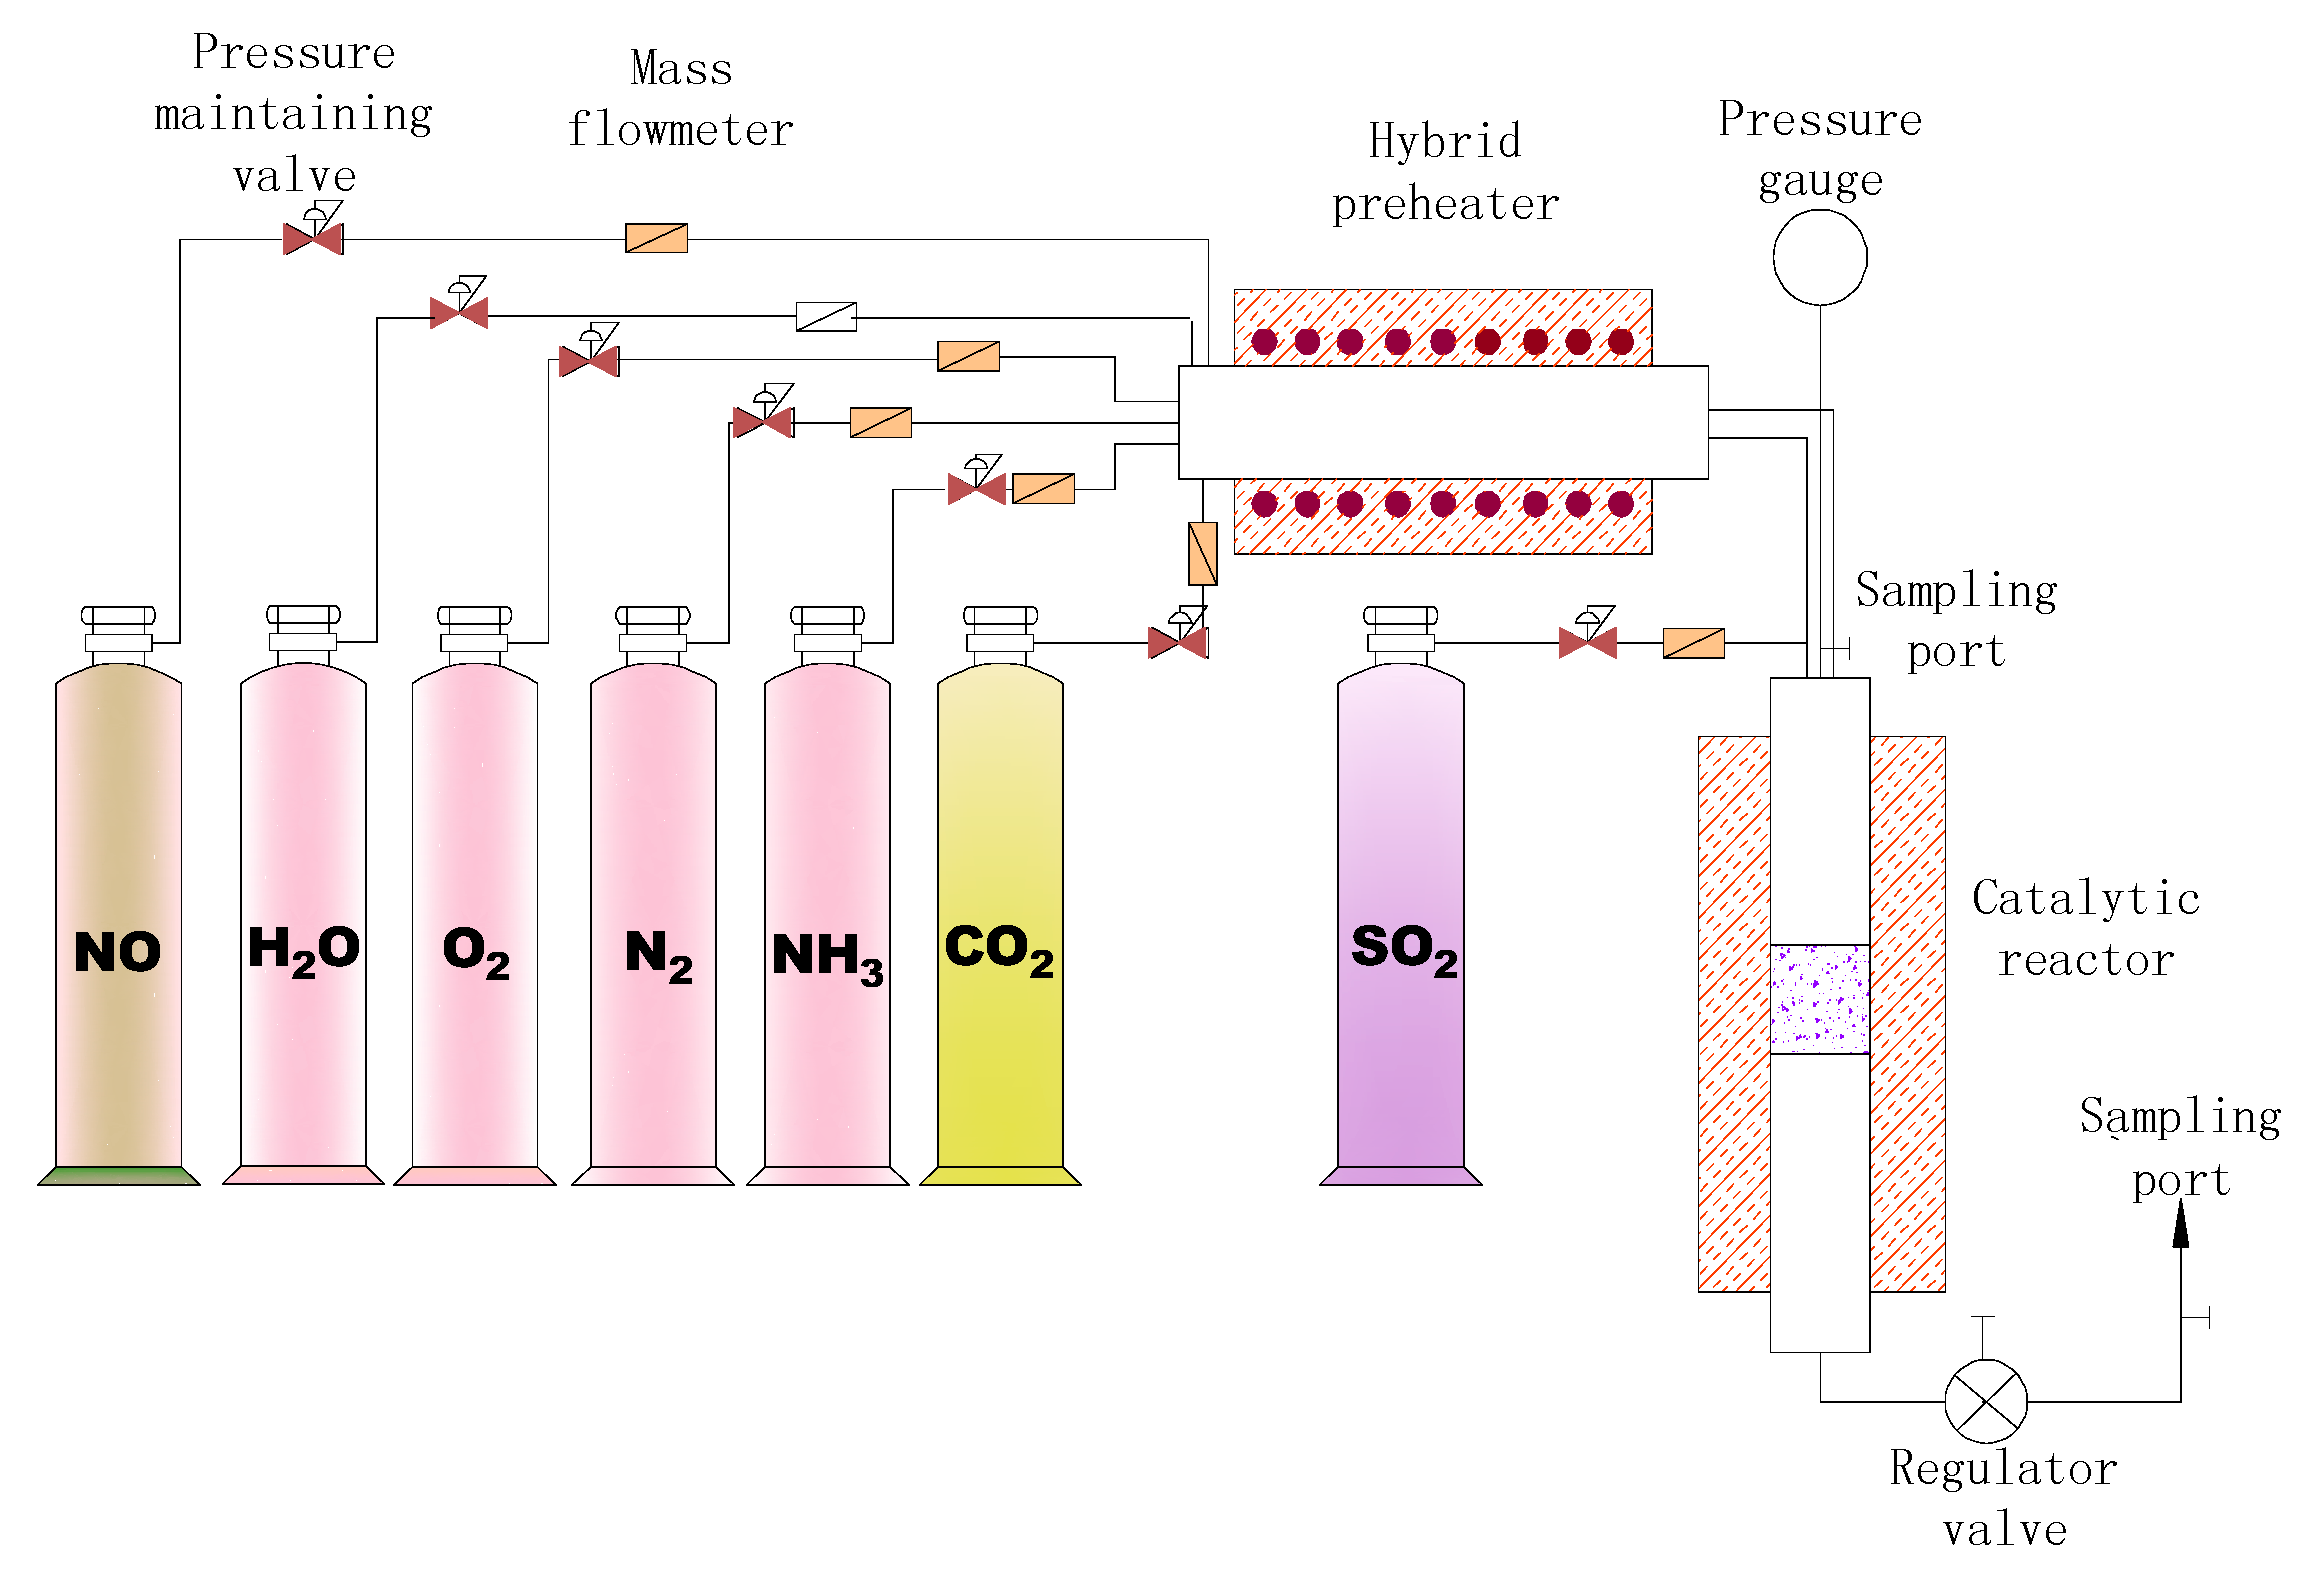
Figure 2 shows the schematic diagram of the experimental device, used to test the denitrification efficiency of catalysts. Industrial gas flow was simulated by flowing a test gas with the following composition: NH3 (1000 ppm), NO (1000 ppm), SO2 (1200 ppm), CO2 (13%), O2 (5%), and H2O (5%). N2 was used as the equilibrium gas. The feed gases were mixed to preheat in a chamber before entering the reactor. The total gas flow rate was 600 mL/min at a space velocity of 6000 h−1. The gas flow was controlled using a mass flow meter, and the NOx concentration before and after the reaction was measured using an in-situ flue gas analyzer (T-350, Testo Company, Selangor, Malaysia). In addition, the temperature range of the flue gases was varied from 300 to 400 °C. The NO removal rate was calculated according to Equation (4):
where ηNOx is the nitrogen oxide removal rate, CNOxin is the nitrogen oxide inlet concentration, and CNOxout is the nitrogen oxide outlet concentration.
The gas flow at the outlet was controlled by adjusting the valve, and the concentrations of NO and NH3 were the same. The change in NO would change the concentration of NH3. The concentration of NH3 in the flue gas should be <5% to prevent explosion due to NH3 combustion. The inlet and outlet temperatures, and the concentration of NO in the denitrification reactor, were measured using a flue gas analyzer. The denitrification rate of the experimental flue gas, under different activating solution formulations and different flue gas conditions, was calculated, and the catalyst activity (K) was also calculated.
2.3.2. Activity Evaluations
In order to evaluate the catalytic activity, kinetic parameters were calculated by using Equation (5):
where κ is the catalyst activity coefficient, Vfg is the flue gas flow (m3/h), Vcat is the catalyst volume (m3), ηNOx is the nitrogen oxide removal rate, M is the NH3/NO molar ratio, and SV is the space velocity. Based on the experimental conditions, M is always 1.0, and SV is always 6000 h−1. The denitrification efficiency and activity of the activated catalyst was calculated by using Equations (4) and (5), respectively.
2.3.3. Catalyst Characteristics
Pore Structure and Morphology
The morphology of the samples was analyzed by the SEM (Sirion200, FEI, Eindhoven, The Netherlands). The magnification was 20,000 times when the photos were analyzed. The specific surface area, pore volume, and pore size distribution of the samples were determined by the BET (V-Sorb2800, Gold APP Instruments, Beijing, China), which yielded important information about the structural features. Crystal structures of the samples were established by using an X-ray diffractometer (XRD, D/MAX-2200, Rigaku, Tokyo, Japan). The XRD patterns of all samples were recorded on a Phillips X-pert (50 KV, 40 mA, 10° min−1 from 10° to 80°). An Energy Dispersive Spectrometer (EDS) was used to identify the elemental mapping of the samples.
Carbon Surface Chemistry
The main functional groups of the active substances’ surfaces were determined by FT-IR (Nicolet iS10, Thermo Fisher, Waltham, MA, USA); the spectral range was 400 to 4000 cm−1, and the resolution was 4.0 cm−1.
3. Results and Discussion
3.1. Effect of Active Ingredients on NO Removal Rate
3.1.1. Effect of Vanadium
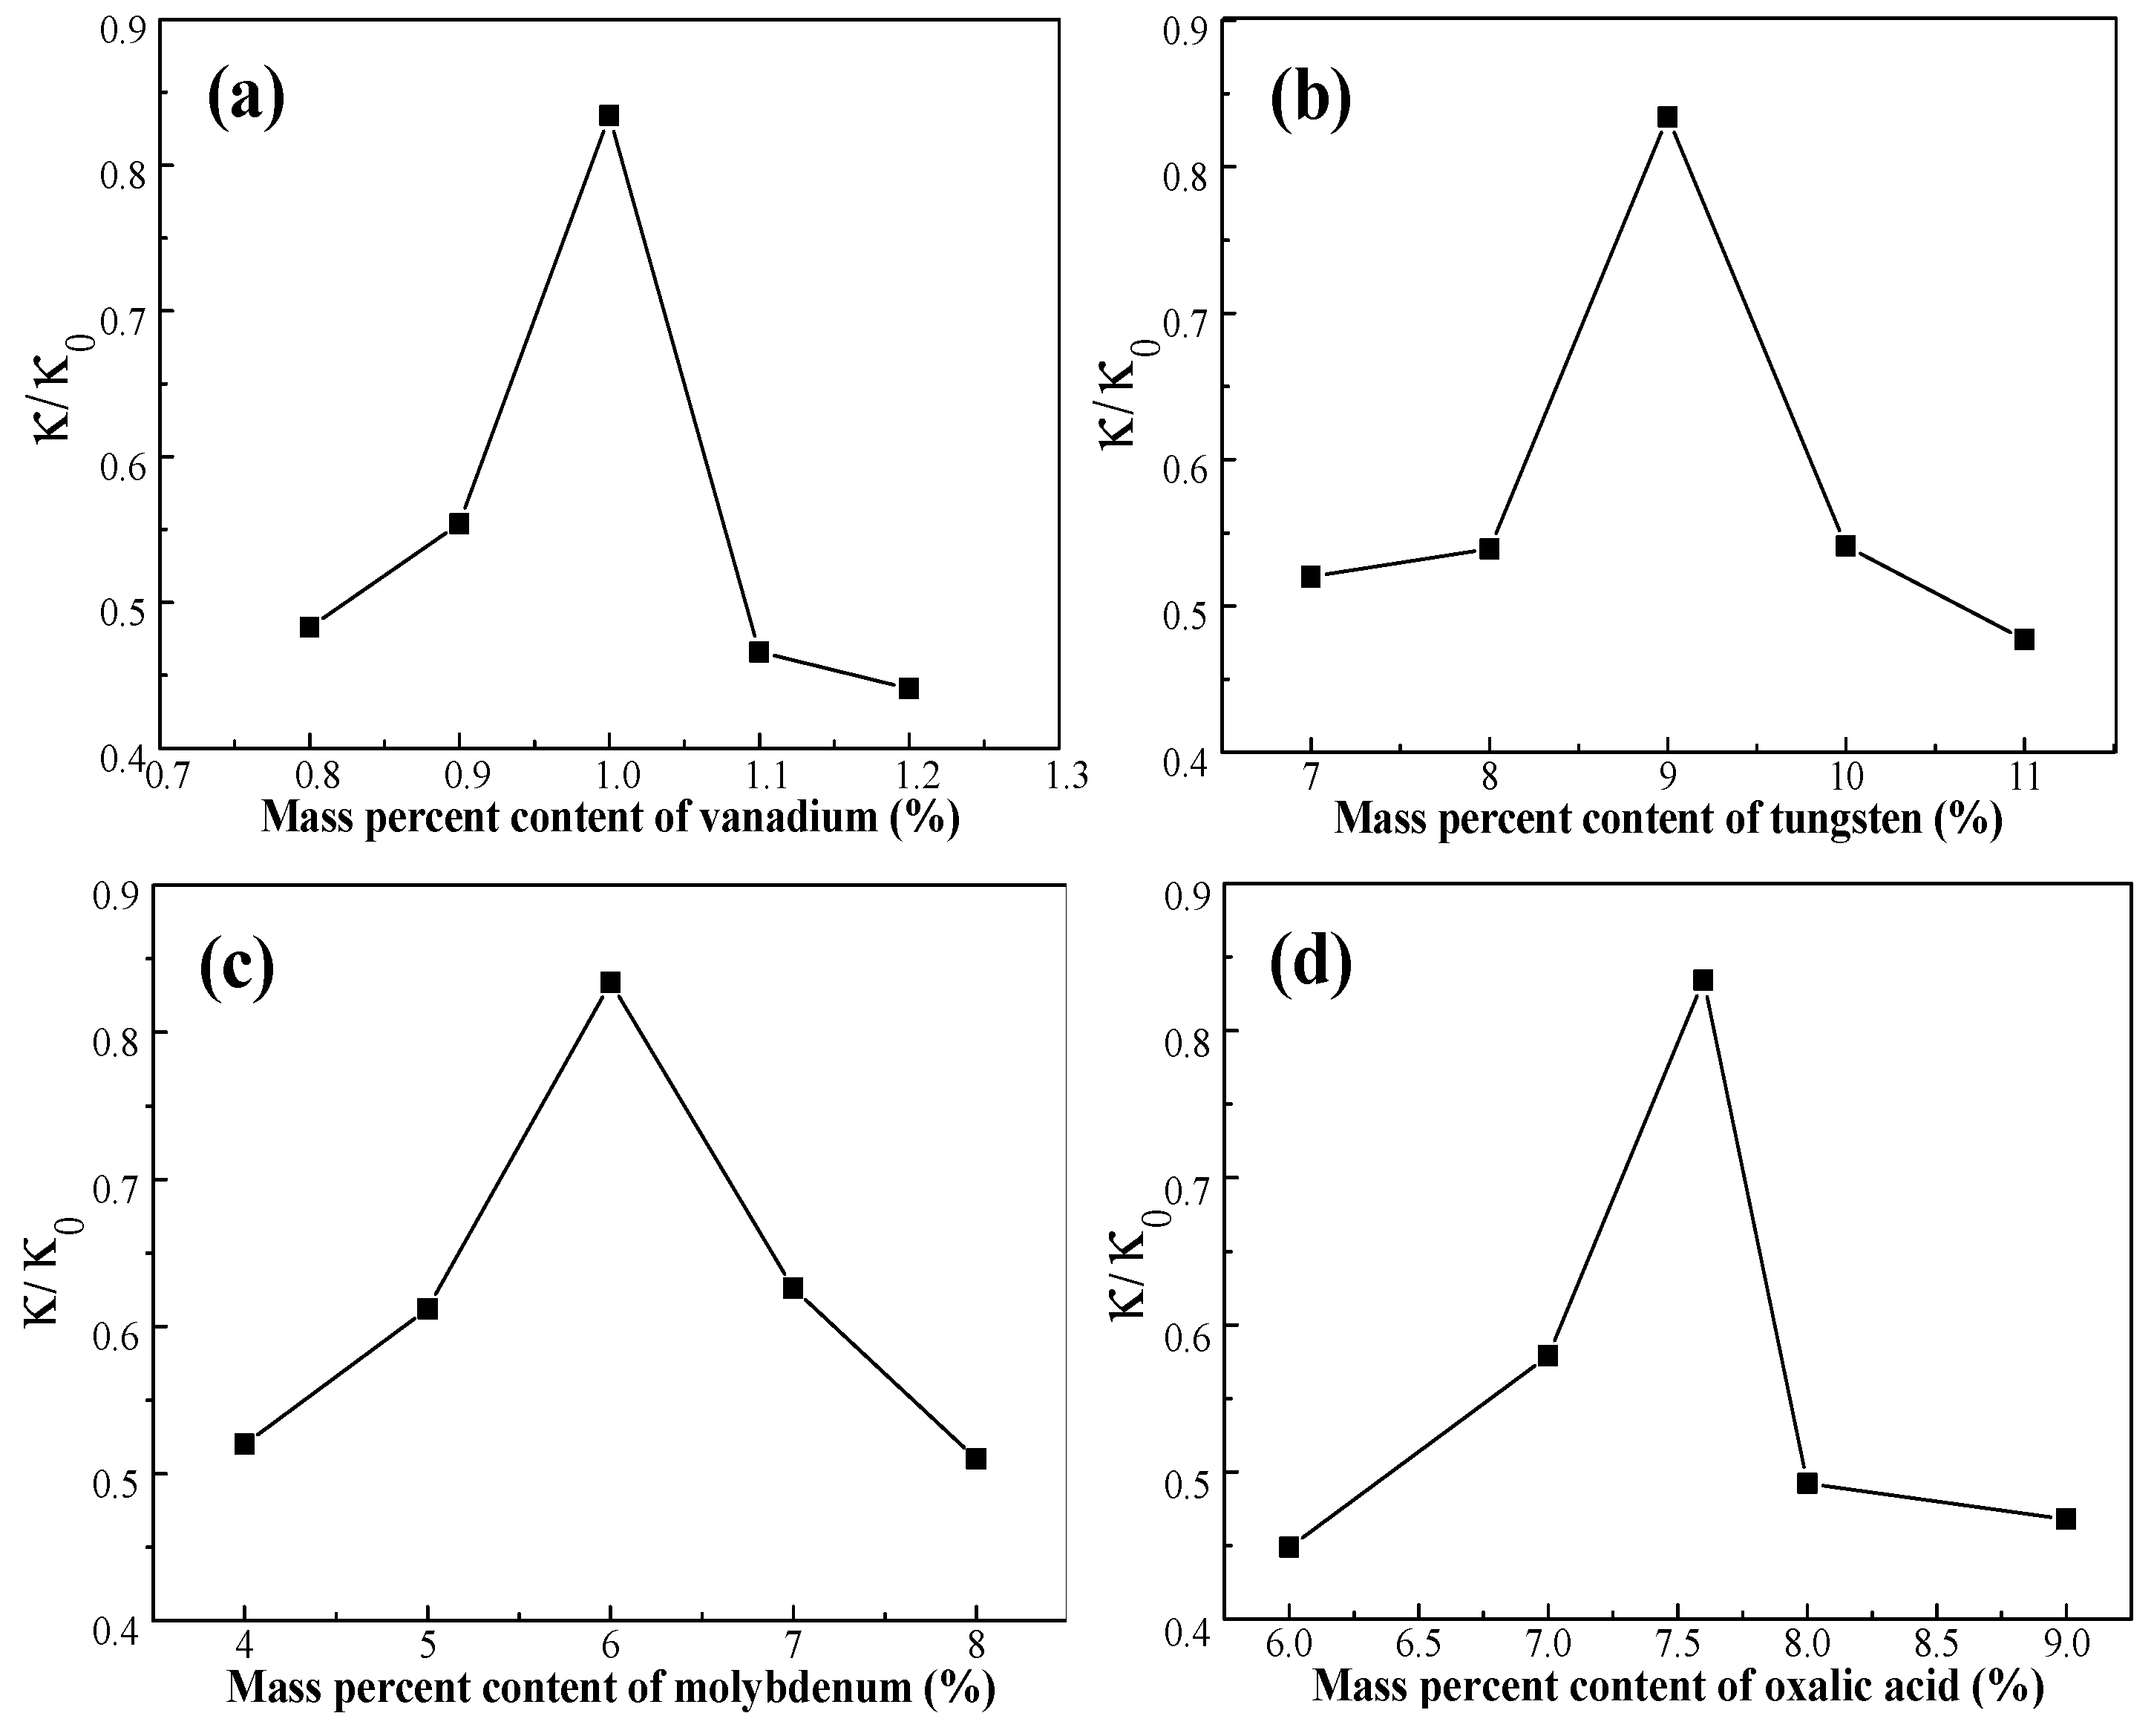
The effect of the activating solution with vanadium on the NO removal rate is displayed in Figure 3a. The NO removal rate of the activated catalyst increased significantly with increasing vanadium concentration in the activating solution. From Figure 3a, Catalyst L2 had the greatest impact on NO removal rate. The NO removal rate of the active catalyst increased by 32% compared to the deactivated catalyst. The addition of vanadium increases the concentration of Brønsted acid sites and ammonia adsorption, and the Brønsted acid site concentration is directly correlated to the rate of NO removal. NH3 adsorbs on V-OH, the Brønsted acid site, and acts in conjunction with an oxidation state shift of the V=O site (+4 to +5) to reduce the gas phase NO [20]. Nevertheless, the NO removal rate showed a downward trend when the vanadium concentration exceeded 1%. The reason for this may be that with increasing V2O5 content, the number of vanadium active sites increases, and the surface adsorption of SO2 increases. This increasing ammonium sulfate formation after the adsorption of NH3 affects the NO removal rate. Vanadium will also accelerate the formation of anatase TiO2 crystals, decreasing the anatase surface area, forming low-activity vanadium species and serious pore blockages, reducing the performance of the catalyst. At the same time, the presence of vanadium affects the sintering of TiO2, and the transformation from anatase to rutile is faster with high vanadium content [21]. The experimental consequences of different vanadium loadings on the catalyst are consistent with the experimental results of Giakoumelou et al. [22].
3.1.2. Effect of Tungsten
The activating effect of tungsten on the catalyst is shown in Figure 3b. The presence of WO3 effectively improved the NO removal rate, reaching the maximum removal rate at a WO3 concentration of 9 wt % (Figure 3b). Tungsten contributes significantly to the number of Brønsted acid sites and hence the activity of vanadia-based catalysts [21]. Tungsten also plays an important role in maintaining the structure and morphology properties of the samples and can stabilize the anatase and disperse the vanadium oxide on the surface [21]. In addition, WO3 (9–10 wt %) has been applied to improve the activity of surface acidity, as well as significantly to mitigate the effects of alkali and alkaline soil poisoning [23]. Tungsten oxide delays the decrease in the BET surface area [24] and hinders the conversion of monomer vanadium to crystalline V2O5 [25]. However, with increasing the loading amounts of tungsten oxides, the NO removal rate initially increases then subsequently decreases, indicating that increasing the WO3 loading will not always promote the catalytic activity and a maximum is reached at an appropriate tungsten loading [26]. The activation effect of the activator gradually decreased with increasing WO3 content because the denitrification efficiency of WO3 is less than that of V2O5 and MoO3, and the excess WO3 loading will occupy the active acid sites of the original V2O5 and MoO3. The activity increase of the WO3 load is less than the activity loss value, thus decreasing the catalyst denitrification efficiency with excess WO3 loading. WO3 is generally believed to affect the stalline V2O5 growth. Detailed experimental studies of tungsten supported on titania have been reported [27,28,29].
3.1.3. Effect of Molybdenum Composition
Figure 3c shows the activation effect of molybdenum composition on the NO removal rate. The presence of MoO3 effectively improved the NO removal rate, reaching a maximum removal at a MoO3 concentration of 6 wt % (Figure 3c), because MoO3 promotes V2O5 and WO3 activity in the catalyst. The Lewis acid site formed by Mo6+ can enhance the acidity of the catalyst surface and strengthen the adsorption process of NH3 on the catalyst surface. Previous studies [30,31] have shown that Mo could promote the dispersion of VOx species on the surface of TiO2. Importantly, V and W have a synergistic effect [32]. The NO removal rate increases slowly when the MoO3 concentration is <6 wt %, which may be because the activating solution cannot supplement the loss of molybdenum. In addition, excessive molybdenum does not contribute to the recovery of the catalyst activity when the molybdenum concentration in the activating solution is >6 wt %. In addition, some researchers proposed that the structural and morphological characteristics of MoO3 and WO3 on TiO2 are similar [33]. In addition, TiO2-loaded MoO3 and WO3 catalysts have the same metal oxide loading, but exhibit different catalytic behavior [34]. Moreover, MoO3-containing catalysts produce more N2O than WO3-containing catalysts [35]. Previous studies demonstrated that the catalysts’ overall reduction ability of the dramatically improved with the addition of MoO3 [36].
3.1.4. Effect of Oxalic Acid
The effect of oxalic acid on the NO removal rate of catalysts is shown in Figure 3d. The experimental results demonstrated that using the appropriate amount of oxalic acid is advantageous for NO removal (Figure 3d). The addition of oxalic acid in the activating solution creates an acidic environment, which promotes the dissolution of ammonia, while maintaining a definite reduction property on the catalyst surfaces. The results indicate that the highest activity was observed at 7.6 wt % oxalic acid, and the NO removal rate decreased with increasing oxalic acid. Based on these results, we concluded that the excessive oxalic acid concentration increases the acidity of the activating solution, which increases the solubility of V2O5, thus decreasing the NO removal rate [37]. Oxalic acid is mainly used as an auxiliary solvent in the activating solution, and is critical for successfully dissolving the main active ingredients.
3.2. Activity Analyses of the Activated Catalyst
The activity of the catalyst can be calculated according to Equation (2), where κ0 is the catalyst activity coefficient of the fresh catalyst. The κ/κ0 of the deactivated catalyst C0 is 0.332. The κ/κ0 values of the activated catalysts, demonstrating the activation properties of the activated catalyst, are presented in Figure 4. The results show that the activity of the catalysts, activated by different formulations of the activating solutions, increases at 370 °C. This result demonstrates that the activity of the catalyst is significantly restored by activation treatment and was an improvement of up to 83.4% over the fresh catalyst. From Figure 4, we concluded that the activation of the catalyst was affected by the ingredients in the activating solution.
3.3. Effects of Activated Catalysts on the NO Removal Rate under Flue Gas Conditions
3.3.1. Space Velocity
Figure 5a shows the effect of space velocity on the activation of the NO removal rate of catalyst L2. As shown in Figure 5a, the catalyst has a high NO removal rate when the space velocity is low, but the trend gradually slows, reaching its maximum when the reaction temperature is 370 °C. However, the NO removal rate can reach >90%, when the velocity is <9000 h−1. Moreover, the removal rate reached 99% when the space velocity was 3000 and 6000 h−1. The NO removal rate also decreases with increasing space velocity, especially at a space velocity of 12,000 h−1. At a high space velocity, the decrease in the NO removal rate may be due to the following the contact time between the reactants and the catalyst may be insufficient or insufficient numbers of active sites exist to accommodate the high flux in reactants. The effect of space velocity on the NO removal rate in the high temperature zone (>370 °C) is not as obvious as that in the low temperature zone (<370 °C). Figure 5a shows the NO removal rate of Catalyst L2 varies slightly when the space velocity is <9000 h−1.
3.3.2. Oxygen Concentration
The oxygen in flue gas has an important effect on the catalysts’ NO removal rate. As shown in Figure 5b, the catalysts’ NO removal rate gradually increased as the oxygen increased from 2% to 4%. The NO removal rate of the catalyst increased gradually with increasing oxygen content. Oxygen can regenerate the active site [20] and increase the reaction rate of SCR; it is first transformed into oxygen free radicals during the transformation of SO2 [38]. Ammonia adsorbs on V=O sites by interacting with V instead of O in the V=O bond. Gas-phase NO reacts with adsorbed ammonia on the V=O sites and produces N2 and H2O. Gas-phase oxygen then oxidizes the V=O site, preparing the site for another cycle of SCR reactions [39]. The increase in the oxygen content plays an important role in the formation of N2O by ammonia oxidation [40]. The NO removal rate tends to be stable at an oxygen content of >4%. This shows that the effect of oxygen on the NO removal rate can be eliminated at an oxygen content of >4%.
3.3.3. Ratio of Ammonia to Nitrogen
Figure 5c shows the effect of the ammonia to nitrogen ratio on the NO removal rate. The NO removal rate of the catalyst increases sharply with increasing ammonia concentration when the ratio of ammonia to nitrogen is <1, which may be explained by the fact insufficient ammonia exists to encounter the acidic sites on the catalyst surface at this time. Higher ammonia to nitrogen ratios increase the diffusion pressure of ammonia in the inner and outer channels, thus accelerating the diffusion speed. Therefore, increasing the NH3 volume fraction in the reaction gas can increase the amount of NH3 adsorbed on the catalyst surface. NH3 adsorption on the Brønsted acid sites of the catalyst surface is the first step in a SCR reaction, so NH3 adsorption would increase the SCR reaction rate [41]. This is consistent with the results of Lei et al. [42], however, the NO removal rate tends to be constant when the ratio of ammonia to nitrogen is >1.0. This effect may be because the number of acid sites attached to NH3 on the catalyst surface is finite, and the catalyst surface acidity is limited at this time. Moreover, the acidity of the catalyst and ammonia essentially reached dynamic equilibrium. The maximum denitrification capacity of catalysts was theoretically attained.
3.3.4. Initial Concentration of NO
Figure 5d shows the effect of the initial NO concentration on the NO removal rate. The NO concentration in the flue gas inlet was in the range 600–1400 ppm, indicating that the change in the initial NO concentration slightly affects the NO removal rate. Moreover, this reoxidation of the vanadium phase was highly affected by the presence of the second phase of WOx and MoOx. Figure 5d shows that the NO removal rate of the catalyst increased with increasing NO content. The NO removal rate of Catalyst L2 remained >90%. This result illustrates that Catalyst L2 is adaptable and is not sensitive to the NO concentration on its entrance into the flue gas.
3.4. Characterization of the Catalyst
3.4.1. SEM
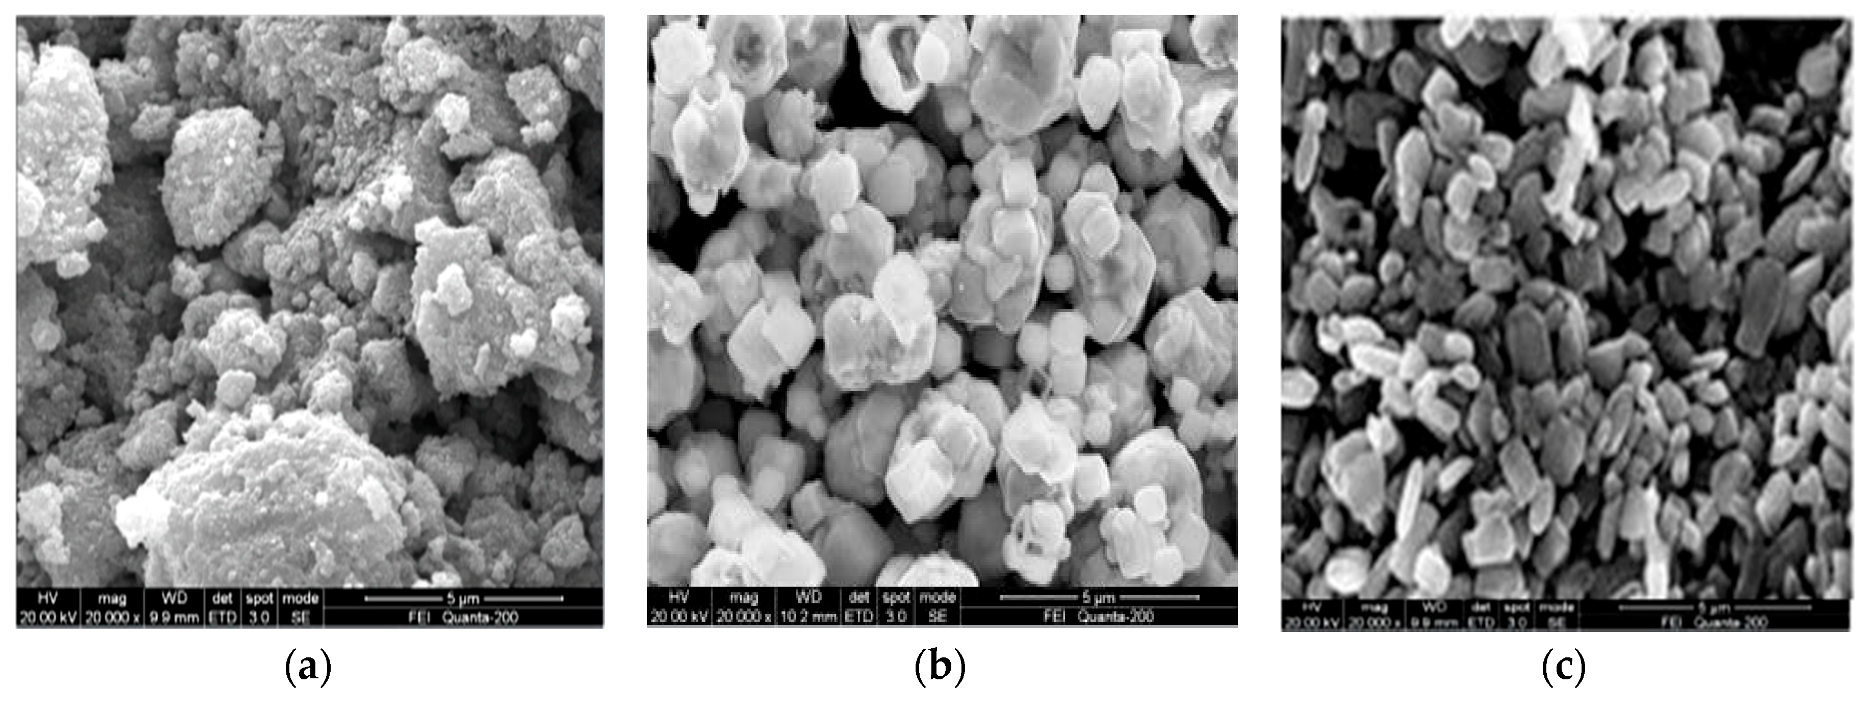
Figure 6 shows the representative SEM images of the deactivated, activated, and fresh samples. As shown in Figure 6a, the surface of the deactivated catalyst C0 is covered with fine particles and the spaces between the particles are clogged by fine particles. Fouling and masking may prevent the reactant NOx and ammonia from reaching the active catalyst sites. Figure 6a,c show that the pores disappeared in the deactivated catalyst sample, suggesting that the sediments and sintering blocked and eventually removed the catalyst pores, reducing the pore aperture and volume [43]. The gap between the particles on the catalyst surface decreases, so it is difficult for the flue gas and the active ingredient to come into contact, reducing the catalyst denitrification efficiency (Figure 2). Thus, the denitrification activity of catalyst C0 is much lower than that of the fresh catalyst. After activation (Figure 6b), the gaps between the catalyst particles increased owing to the washing and activation by the activating solution. The toxic substance was washed away [44] and the internal structure became more evident, improving the micromorphology of the catalyst surface. Simultaneously, the activating solution ingredients may partially assemble on the surface of the catalyst, forming a novel porous surface. The clear particle distribution increases the porosity, while high porosity increases the number of active sites on the catalyst, which in turn increases the denitrification efficiency of SCR catalyst, as reported by Reddy et al. [44]. Therefore, the activation process is beneficial for catalyst activation.
3.4.2. BET
The BET surface area, pore volume, and pore size of the various catalysts are shown in Table 3. The results indicate that the specific surface area of the deactivated catalysts is relatively small (41.85 m2/g), whereas the specific surface area and pore size of the activated catalyst increased significantly. This shows that the activation process increases the specific surface area and total pore volume of the catalyst. Comparing the structural characteristics results of catalyst C and catalyst C0 indicates that the specific surface area of catalyst C0 decreases 20% more than that of catalyst C, which may be because of the catalyst being sintered, abraded, blocked, contaminated, or obscured [43]. Comparing the structural characteristics results of L8, L2 and L5, the surface area decreased with increasing ammonium molybdate. We attributed the excess Mo loading to the decrease in surface area [36]. Comparing the structural characteristics results of L2 and L11, the surface area increased with increasing ammonium tungstate. Tungsten oxide was reported to delay the loss of BET surface area [24]. The effective contact area between the catalyst and the flue gases increased, and the NO removal rate increased, coinciding with the result obtained by the SEM studies (Figure 6). The pore size distribution and the catalytic activity show that the small pore active sites may be the important factor for improving the denitrification activity (Figure 6), which can be ascribed to the longer effective contact time [42].
3.4.3. FT-IR
Figure 7 shows the FT-IR spectra of the deactivated and activated catalysts. For the activated catalysts, the peaks at 2332.31 and 2360.49 cm−1 correspond to CO2, the absorption peak at 1400.18 cm−1 corresponds to the deformation vibration of the N–H bond from NH4+ adsorbed on the Brönsted acid sites [45]. The bands in the range of 1080.30–1180.95 cm−1 are close to the vibration frequency of V=O, which is associated with V2O5. The number and strength of V=O bonds are one of the most important factors adsorbing NH3 onto the V=O sites, as NH4+ reacts with NOx [20]. The infrared absorption peak of TiO2 appeared at ~519.86 and 671.07 cm−1 [46]. However, in the FT-IR spectrum of the deactivated catalyst, these active material absorption peaks almost vanished, indicating the decrease in active material content. Thus, the active ingredient on the surface of the activated catalysts increased significantly. This shows that the active ingredient can be effectively loaded, and the activation process is effective.
3.4.4. XRD
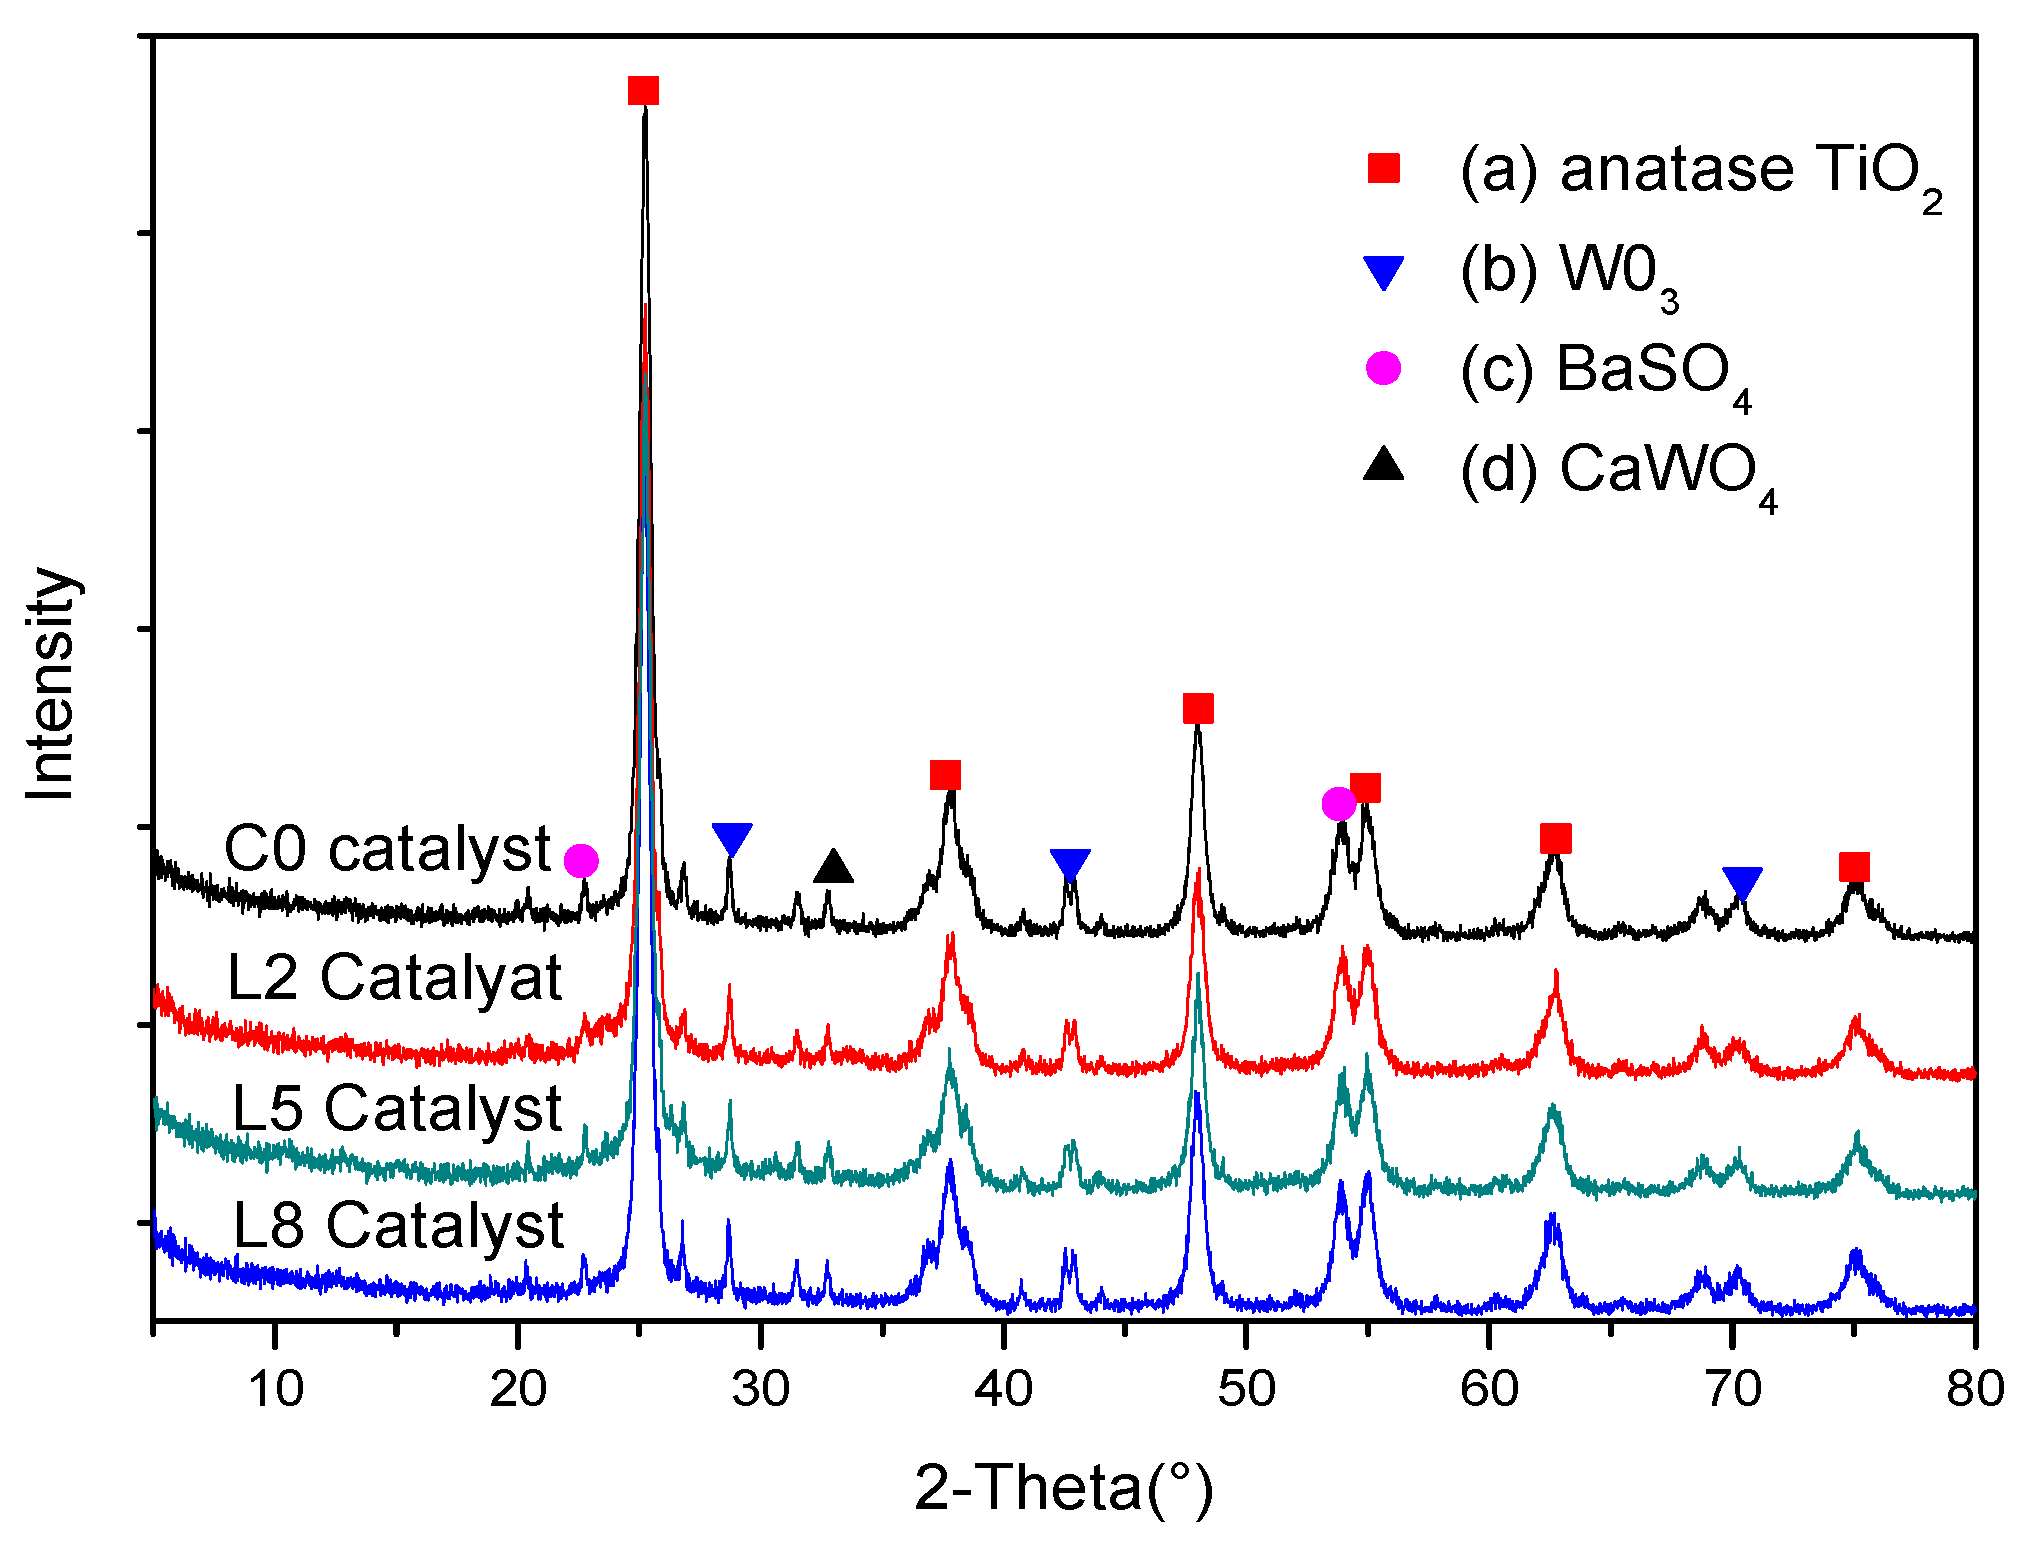
The crystal structure of the catalyst determines the catalytic performance to some extent; therefore, the deactivated and activated catalysts were characterized by XRD. Figure 8 shows that the deactivated sample exhibits the diffraction peaks of anatase TiO2. The crystal type of the TiO2 carrier does not change. The diffraction peaks of V2O5 were not detected in any of the samples. There are numerous possible reasons for this observation. Firstly, the depletion of the active ingredient (V2O5) could be the cause, the vanadium oxide could have been disseminated on the catalyst in an amorphous or highly dispersed form (Figure 8), or the molybdenum improved the dispersion of monolayer VOx species on TiO2 and the tungsten on the catalyst surface suppressed the progressive transformation of monomeric vanadyl species into crystalline V2O5 [31,47]. At the same time, the diffraction peak of WO3 appeared in the sample, but the diffraction peaks of WO3 did not appear, indicating that the dispersion of WO3 was slightly less, and WO3 did not sufficiently contact TiO2. The aggregation of WO3 occurs, to a certain extent, due to the inter molecular forces, resulting in the formation of a small amount of crystalline phase [27]. MoO3 had good dispersion on the support. The diffraction peaks of BaSO4 and CaWO4 were detected, corresponding to the byproduct of the reaction with fly ash particles and a catalyst in the process of denitrification [18,48]. The BaSO4 and CaWO4 diffraction peaks of the activated catalyst were obviously weakened, which may be the effect of the active ingredient’s adhesion and the washing away or covering of the BaSO4 and CaWO4.
3.4.5. EDS
The weight percentage of each element in the fresh, deactivated, and activated catalysts are listed in Table 4, indicating that the relative mass fractions of Ti, W, Mo, and V of the deactivated catalyst decreased significantly, and those of Al, Si, S, and Ca increased, reaching 1.66 wt %, 6.74 wt %, 6.37 wt %, and 4.93 wt %, respectively. The active ingredient of the catalyst reduced during the operation of the SCR system because of various physical and chemical effects including poisoning, abrasion, sintering, blockage, etc. The results showed that the dirt on the deactivated catalyst surface was mainly due to Al, Si, S, and Ca. The S, which might react with Al2O3 to form Al2(SO4)3, led to the distinct decrease in the specific surface area and total pore volume (Figure 6, Table 1) and this result is consistent with the study by Lisi et al. [49]. In addition, Al and Ca are derived from fly ash particles in the flue gas, in accordance with the study of Zheng et al. [50]. The active ingredient of the activated catalyst changed significantly, and W, Mo, and V content increased by 7.78 wt %, 8.11 wt %, and 0.55 wt %, respectively. Moreover, Al, Si, S, and Ca decreased significantly. The results showed that active solution L2 could effectively increase the active ingredients of deactivated catalyst.
4. Conclusions
In this study, the performance of several activating solutions, during the in situ activation of SCR-DeNOx catalysts, was investigated. Remarkable changes were observed in the deactivated catalysts after the activation process. The texture, morphology, and surface chemistry of the activated catalysts were investigated. We drew the following conclusions from the results of this study:
(1) The deactivated catalysts were effectively activated by the in-situ activation method, and the active material was found to be highly loaded. The active ingredients, V2O5, WO3, and MoO3, of the activating solution effectively increased the NO removal rate of the activated catalysts; the activation effect of the L2 solution, which contained 1.0% V, 9% W, and 6% Mo, was best, increasing the NO removal rate by 32%.
(2) The result of the flue gas conditions of the NO removal rate of the activated catalyst exhibited that the effect of space velocity on the NO removal rate in the high temperature zone (>370 °C) was not as obvious as that in the low temperature zone (<370 °C). The NO removal rate effect at a low space velocity was stronger than that at a high space velocity. When the oxygen concentration was <4%, the NO removal rate of the catalyst was effectively promoted. The NO removal rate of the catalyst increased sharply with increasing ammonia concentration at the ammonia to nitrogen ratio of <1. The initial concentration of NO had a slight effect on the NO removal rate.
(3) The fresh, deactivated, and activated catalysts were characterized by SEM, BET, FTIR, XRD, and EDS analyses. The results showed that the gaps between the activated catalyst particles increased owing to the washing and activation by the activating solution, which removed the toxic substances, resulting in a more evident internal structure. The activation process is beneficial for increasing the specific surface area and total pore volume of the catalyst. The active ingredient can be effectively loaded, and the vanadium oxide was disseminated on the catalyst in an amorphous or highly dispersed form. Activating solutions could effectively increase the active ingredients of the deactivated catalyst and enhance the NO removal rate as a result.
Our findings suggest that the in-situ activation method of denitrified catalysts, based on an activation solution, has the advantages of having a rapid activation period and prevents the disassembly and removal of the catalyst, which can solve the deactivation problem of denitrified catalysts as well. We expect that the in-situ activation and activation device have potential applications to SCR-DeNOx. In fact, it should be noted that very little optimization work has been performed on these devices. Further mechanistic studies and development of durability, activating process, and corrosion behavior are ongoing in our laboratory.
Acknowledgments
This work was financially supported by the National Natural Science Foundation of China (Grant No. 51206012), the Scientific Research Foundation of the Hunan Education Department (10A004), the Hunan Province 2011 Collaborative Innovation Center of Clean Energy and Smart Grid, the Southern Power Grid Science and Technology Project (K-GD2012-395).
Author Contributions
Tuo Ye, Donglin Chen and Xi Zeng conceived of and designed the experiments. Tuo Ye, Yanshan Yin, Xi Zeng and Jing Liu performed the experiments. Tuo Ye, Xi Zeng and Donglin Chen analyzed the data. Tuo Ye and Donglin Chen wrote the paper.
Conflicts of Interest
The authors declare no conflict of interest.
References
- Qi, C.; Bao, W.; Wang, L.; Li, H. Study of the V2O5-WO3/TiO2 Catalyst Synthesized from Waste Catalyst on Selective Catalytic Reduction of NOx by NH3. Catalysts 2017, 7, 110. [Google Scholar] [CrossRef]
- Liang, Z.; Ma, X.; Lin, H.; Tang, Y. The energy consumption and environmental impacts of SCR technology in China. Appl. Energy 2011, 88, 1120–1129. [Google Scholar] [CrossRef]
- Bao, J.; Mao, L.; Zhang, Y.; Fang, H.; Shi, Y.; Yang, L.; Yang, H. Effect of Selective Catalytic Reduction System on Fine Particle Emission Characteristics. Energy Fuels 2016, 30, 1325–1334. [Google Scholar] [CrossRef]
- Schwaemmle, T.; Heidel, B.; Brechtel, K.; Scheffknecht, G. Study of the effect of newly developed mercury oxidation catalysts on the DeNOx -activity and SO2-SO3-conversion. Fuel 2012, 101, 179–186. [Google Scholar] [CrossRef]
- Guo, X. Poisoning and Sulfation on Vanadia SCR Catalyst. Ph.D. Thesis, Brigham Young University, Provo, UT, USA, 2006. [Google Scholar]
- Peng, Y.; Li, J.; Si, W.; Luo, J.; Wang, Y.; Fu, J.; Li, X.; Crittenden, J.; Hao, J. Deactivation and regeneration of a commercial SCR catalyst: Comparison with alkali metals and arsenic. Appl. Catal. B Environ. 2015, 168–169, 195–202. [Google Scholar] [CrossRef]
- Zheng, Y.J.; Jensen, A.D.; Johnsson, J.E.; Thøgersen, J.R. Deactivation of V2O5-WO3-TiO2, SCR catalyst at biomass fired power plants: Elucidation of mechanisms by lab- and pilot-scale experiments. Appl. Catal. B Environ. 2008, 83, 186–194. [Google Scholar] [CrossRef]
- Benson, S.A.; Laumb, J.D.; Crocker, C.R.; Pavlish, J.H. SCR catalyst performance in flue gases derived from subbituminous and lignite coals. Fuel Process. Technol. 2005, 86, 577–613. [Google Scholar] [CrossRef]
- Xu, W.; He, H.; Yu, Y. Deactivation of a Ce/TiO2 Catalyst by SO2 in the Selective Catalytic Reduction of NO by NH3. J. Phys. Chem. C 2009, 113, 4426–4432. [Google Scholar] [CrossRef]
- Yu, J.; Guo, F.; Wang, Y.; Xu, G. Sulfur poisoning resistant mesoporous Mn-based catalyst for low-temperature SCR of NO with NH3. Appl. Catal. B Environ. 2010, 95, 160–168. [Google Scholar] [CrossRef]
- Shen, B.X. Deactivation of MnO-CeO/ACF Catalysts for Low-Temperature NH-SCR in the Presence of SO. Acta Phys. Chim. Sin. 2010, 26, 3009–3016. [Google Scholar]
- Aguilar-Romero, M.; Camposeco, R.; Castillo, S.; Marín, J.; Glez, V.R.; García-Serrano, L.A.; Mejía-Centeno, I. Acidity, surface species, and catalytic activity study on V2O5-WO3/TiO2 nanotube catalysts for selective NO reduction by NH3. Fuel 2017, 198, 123–133. [Google Scholar] [CrossRef]
- Wilburn, R.T.; Wright, T.L. SCR Ammonia Slip Distribution in Coal Plant Effluents and Dependence upon SO. Powerpl. Chem. 2004, 6, 295–314. [Google Scholar]
- Tang, F.; Xu, B.; Shi, H.; Qiu, J.; Fan, Y. The poisoning effect of Na+ and Ca2+ ions doped on the V2O5/TiO2 catalysts for selective catalytic reduction of NO by NH3. Appl. Catal. B Environ. 2010, 94, 71–76. [Google Scholar] [CrossRef]
- Chen, L.; Li, J.; Ge, M. The poisoning effect of alkali metals doping over nano V2O5-WO3/TiO2 catalysts on selective catalytic reduction of NOx by NH3. Chem. Eng. J. 2011, 170, 531–537. [Google Scholar] [CrossRef]
- Nicosia, D.; Czekaj, I.; Kröcher, O. Chemical deactivation of V2O5/WO3-TiO2 SCR catalysts by additives and impurities from fuels, lubrication oils and urea solution: Part II. Characterization study of the effect of alkali and alkaline earth metals. Appl. Catal. B Environ. 2008, 77, 228–236. [Google Scholar] [CrossRef]
- Xiong, Z.B.; Hu, Q.; Liu, D.Y.; Wu, C.; Zhou, F.; Wang, Y.Z.; Jin, J.; Lu, C.M. Influence of partial substitution of iron oxide by titanium oxide on the structure and activity of iron–cerium mixed oxide catalyst for selective catalytic reduction of NOx, with NH3. Fuel 2016, 165, 432–439. [Google Scholar] [CrossRef]
- Li, X.; Li, X.; Chen, J.; Hao, J. An efficient novel regeneration method for Ca-poisoning V2O5-WO3/TiO2 catalyst. Catal. Commun. 2016, 87, 45–48. [Google Scholar] [CrossRef]
- Dong, G.; Zhang, Y.; Zhao, Y. Effect of the pH value of precursor solution on the catalytic performance of VO-WO/TiO in the low temperature NH-SCR of NO. J. Fuel Chem. Technol. 2014, 42, 1455–1463. [Google Scholar] [CrossRef]
- Topsøe, N.Y.; Topsøe, H.; Dumesic, J.A. Vanadia-Titania Catalysts for Selective Catalytic Reduction (SCR) of Nitric-Oxide by Ammonia 1. Combined Temperature-Programmed In-Situ FTIR and Online Mass-Spectroscopy Studies. J. Catal. 1995, 151, 226–240. [Google Scholar] [CrossRef]
- Djerad, S.; Tifouti, L.; Crocoll, M.; Weisweiler, W. Effect of vanadia and tungsten loadings on the physical and chemical characteristics of V2O5-WO3/TiO2 catalysts. J. Mol. Catal. A Chem. 2004, 208, 257–265. [Google Scholar] [CrossRef]
- Giakoumelou, I.; Fountzoula, C.; Kordulis, C.; Boghosian, S. Molecular structure and catalytic activity of V2O5/TiO2, catalysts for the SCR of NO by NH3: In situ Raman spectra in the presence of O2, NH3, NO, H2, H2O and SO2. J. Catal. 2006, 239, 1–12. [Google Scholar] [CrossRef]
- Kobayashi, M.; Hagi, M. V2O5-WO3/TiO2-SiO2-SO42− catalysts: Influence of active components and supports on activities in the selective catalytic reduction of NO by NH3 and in the oxidation of SO2. Appl. Catal. B Environ. 2006, 63, 607–612. [Google Scholar] [CrossRef]
- Oliveri, G.; Ramis, G.; Busca, G.; Escribano, V.S. Thermal stability of vanadia–titania catalysts. J. Mater. Chem. 1993, 3, 1239–1249. [Google Scholar] [CrossRef]
- Alemany, L.J.; Lietti, L.; Ferlazzo, N.; Forzatti, P.; Busca, G.; Giamello, E.; Bregani, F. Reactivity and Physicochemical Characterization of V2O5-WO3/TiO2 De-NOx Catalysts. J. Catal. 1995, 155, 117–130. [Google Scholar] [CrossRef]
- Sun, C.; Dong, L.; Yu, W.; Liu, L.; Li, H.; Gao, F.; Dong, L.; Chen, L. Promotion effect of tungsten oxide on SCR of NO with NH3, for the V2O5-WO3/Ti0.5 Sn0.5 O2, catalyst: Experiments combined with DFT calculations. J. Mol. Catal. A Chem. 2011, 346, 29–38. [Google Scholar] [CrossRef]
- Wachs, I.E.; Kim, T.; Ross, E.I. Catalysis science of the solid acidity of model supported tungsten oxide catalysts. Catal. Today 2006, 116, 162–168. [Google Scholar] [CrossRef]
- Fierro, J.L.G. (Ed.) Metal Oxides: Chemistry and Applications; CRC Press: Boca Raton, FL, USA, 2006; pp. 1–30. [Google Scholar]
- Kobayashi, M.; Miyoshi, K. WO3-TiO2 monolithic catalysts for high temperature SCR of NO by NH3: Influence of preparation method on structural and physico-chemical properties activity and durability. Appl. Catal. B Environ. 2007, 72, 253–261. [Google Scholar] [CrossRef]
- Peng, Y.; Si, W.; Li, X.; Luo, J.; Li, J.; Crittenden, J.; Hao, J. Comparison of MoO3 and WO3 on arsenic poisoning V2O5/TiO2 catalyst: DRIFTS and DFT study. Appl. Catal. B Environ. 2016, 181, 692–698. [Google Scholar] [CrossRef]
- Yang, S.; Xiong, S.; Liao, Y.; Xiao, X.; Qi, F.; Peng, Y.; Fu, Y.; Shan, W.; Li, J. Mechanism of N2O formation during the low-temperature selective catalytic reduction of NO with NH3 over Mn-Fe Spinel. Environ. Sci. Technol. 2014, 48, 10354–10362. [Google Scholar] [CrossRef] [PubMed]
- Shan, W.; Liu, F.; He, H.; Shi, X.; Zhang, C. ChemInform Abstract: Novel Cerium-Tungsten Mixed Oxide Catalyst for the Selective Catalytic Reduction of NOx with NH3. Chem. Commun. 2011, 47, 8046–8048. [Google Scholar] [CrossRef] [PubMed]
- Liu, Z.; Zhang, S.; Li, J.; Ma, L. Promoting effect of MoO3 on the NOx reduction by NH3 over CeO2/TiO2 catalyst studied with in situ DRIFTS. Appl. Catal. B Environ. 2014, 144, 90–95. [Google Scholar] [CrossRef]
- Nova, I.; Lietti, L.; Casagrande, L.; Dall’Acquab, L.; Giamellob, E.; Forzattia, P. Characterization and reactivity of TiO2-supported MoO3 De-Nox SCR catalysts. Appl. Catal. B Environ. 1998, 17, 245–258. [Google Scholar] [CrossRef]
- Zhao, B.; Liu, X.; Zhou, Z.; Shao, H.; Wang, W.; Si, J.; Xu, M. Effect of molybdenum on mercury oxidized by V2O5-MoO3/TiO2 catalysts. Chem. Eng. J. 2014, 253, 508–517. [Google Scholar] [CrossRef]
- Huang, X.; Peng, Y.; Liu, X.; Li, K.; Deng, Y.; Li, J. The promotional effect of MoO3 doped V2O5/TiO2 for chlorobenzene oxidation. Catal. Commun. 2015, 69, 161–164. [Google Scholar] [CrossRef]
- Khodayari, R.; Odenbrand, C.U.I. Regenaration of commercial TiO2-V2O5-WO3 SCR catalysts used in biofuel plants. Appl. Catal. B Environ. 2001, 30, 87–99. [Google Scholar] [CrossRef]
- Dunn, J.P.; Koppula, P.R.; Stenger, H.G.; Wachs, I.E. Oxidation of sulfur dioxide to sulfur trioxide over supported vanadia catalysts. Appl. Catal. B Environ. 1998, 19, 103–117. [Google Scholar] [CrossRef]
- Busca, G.; Lietti, L.; Ramis, G.; Berti, F. Chemical and mechanistic aspects of the selelctive catalytic reduction of NOx by ammonia over oxide catalysts: A Review. Appl. Catal. B Environ. 1998, 18, 1–36. [Google Scholar] [CrossRef]
- Djerad, S.; Crocoll, M.; Kureti, S.; Weisweiler, W. Effect of oxygen concentration on the NOx reduction with ammonia over V2O5-WO3/TiO2 catalyst. Catal. Today 2006, 113, 208–214. [Google Scholar] [CrossRef]
- Lee, C. Modeling urea-selective catalyst reduction with vanadium catalyst based on NH3 temperature programming desorption experiment. Fuel 2016, 173, 155–163. [Google Scholar] [CrossRef]
- Lei, Z.; Liu, X.; Jia, M. Modeling of Selective Catalytic Reduction (SCR) for NO Removal Using Monolithic Honeycomb Catalyst. Energy Fuels 2009, 23, 6146–6151. [Google Scholar] [CrossRef]
- Kling, Å.; Andersson, C.; Myringer, Å.; Eskilsson, D.; Järås, S.G. Alkali deactivation of high-dust SCR catalysts used for NOx, reduction exposed to flue gas from 100 MW-scale biofuel and peat fired boilers: Influence of flue gas composition. Appl. Catal. B Environ. 2007, 69, 240–251. [Google Scholar] [CrossRef]
- Reddy, B.M.; Ganesh, I.; Chowdhury, B. Design of stable and reactive vanadium oxide catalyst supported on binary oxides. Catal. Today 1999, 49, 115–121. [Google Scholar] [CrossRef]
- Cai, Y.P. Investigation of the Reaction Network and Catalytic Sites in Selective Catalytic Reduction Ognitric Oxide with Ammonia over Vanadia Catalysts. Ph.D. Dissertation, The Ohio State University, Columbus, OH, USA, 1993. [Google Scholar]
- Liu, F.D.; He, H.; Zhang, C.B.; Shan, W.; Shi, X. Selective catalytic reduction of NO with NH3 over iron titanate catalyst: Catalytic performance and characterization. Appl. Catal. B Environ. 2010, 96, 408–420. [Google Scholar] [CrossRef]
- Peng, Y.; Li, J.; Si, W.; Luo, J.; Dai, Q.; Luo, X.; Liu, X.; Hao, J. Insight into deactivation of commercial SCR catalyst by arsenic: An experiment and DFT study. Environ. Sci. Technol. 2014, 48, 13895. [Google Scholar] [CrossRef] [PubMed]
- Choo, S.T.; Yim, S.D.; Nam, I.S.; Ham, S.W.; Lee, J.B. Effect of promoters including WO and BaO on the activity and durability of VO/sulfated TiO catalyst for NO reduction by NH. Appl. Catal. B Environ. 2003, 44, 237–252. [Google Scholar] [CrossRef]
- Lisi, L.; Lasorella, G.; Malloggi, S.; Russo, G. Single and combined deactivating effect of alkali metals and HCl on commercial SCR catalysts. Appl. Catal. B Environ. 2004, 50, 251–258. [Google Scholar] [CrossRef]
- Zheng, Y.; Jensen, A.D.; Johnsson, J.E. Deactivation of V2O5-WO3-TiO2 SCR catalyst at a biomass-fired combined heat and power plant. Appl. Catal. B Environ. 2005, 60, 253–264. [Google Scholar] [CrossRef]
Figure 1.
Schematic diagram of the experimental device used for modeling in-situ activating catalysts, where 1 is the induced draft fan, 2 is the air heater, 3 is the regulating valve, 4 is the flow meter, 5 is the mixer, 6 is the gas cylinder, 7 is the DeNOx reaction tower, 8 is the thief hole, 9 is the nozzle, 10 is the flange, 11 is the catalyst, 12 is the induced draft fan, 13 is the regulating valve, 14 is a hose, 15 is a pump, 16 is the clean water tank, 17 is the valve for circulating, 18 is the stirrer, 19 is the activating solution tank, 20 is insulation, and 21 is the sewage tank.

Figure 2.
Schematic diagram of the experimental device used for denitrified catalyst activity evaluation.
Figure 2.
Schematic diagram of the experimental device used for denitrified catalyst activity evaluation.

Figure 3.
Effect of active ingredients on NO removal rate: (a) vanadium; (b) tungsten; (c) molybdenum; and (d) oxalic acid.
Figure 3.
Effect of active ingredients on NO removal rate: (a) vanadium; (b) tungsten; (c) molybdenum; and (d) oxalic acid.
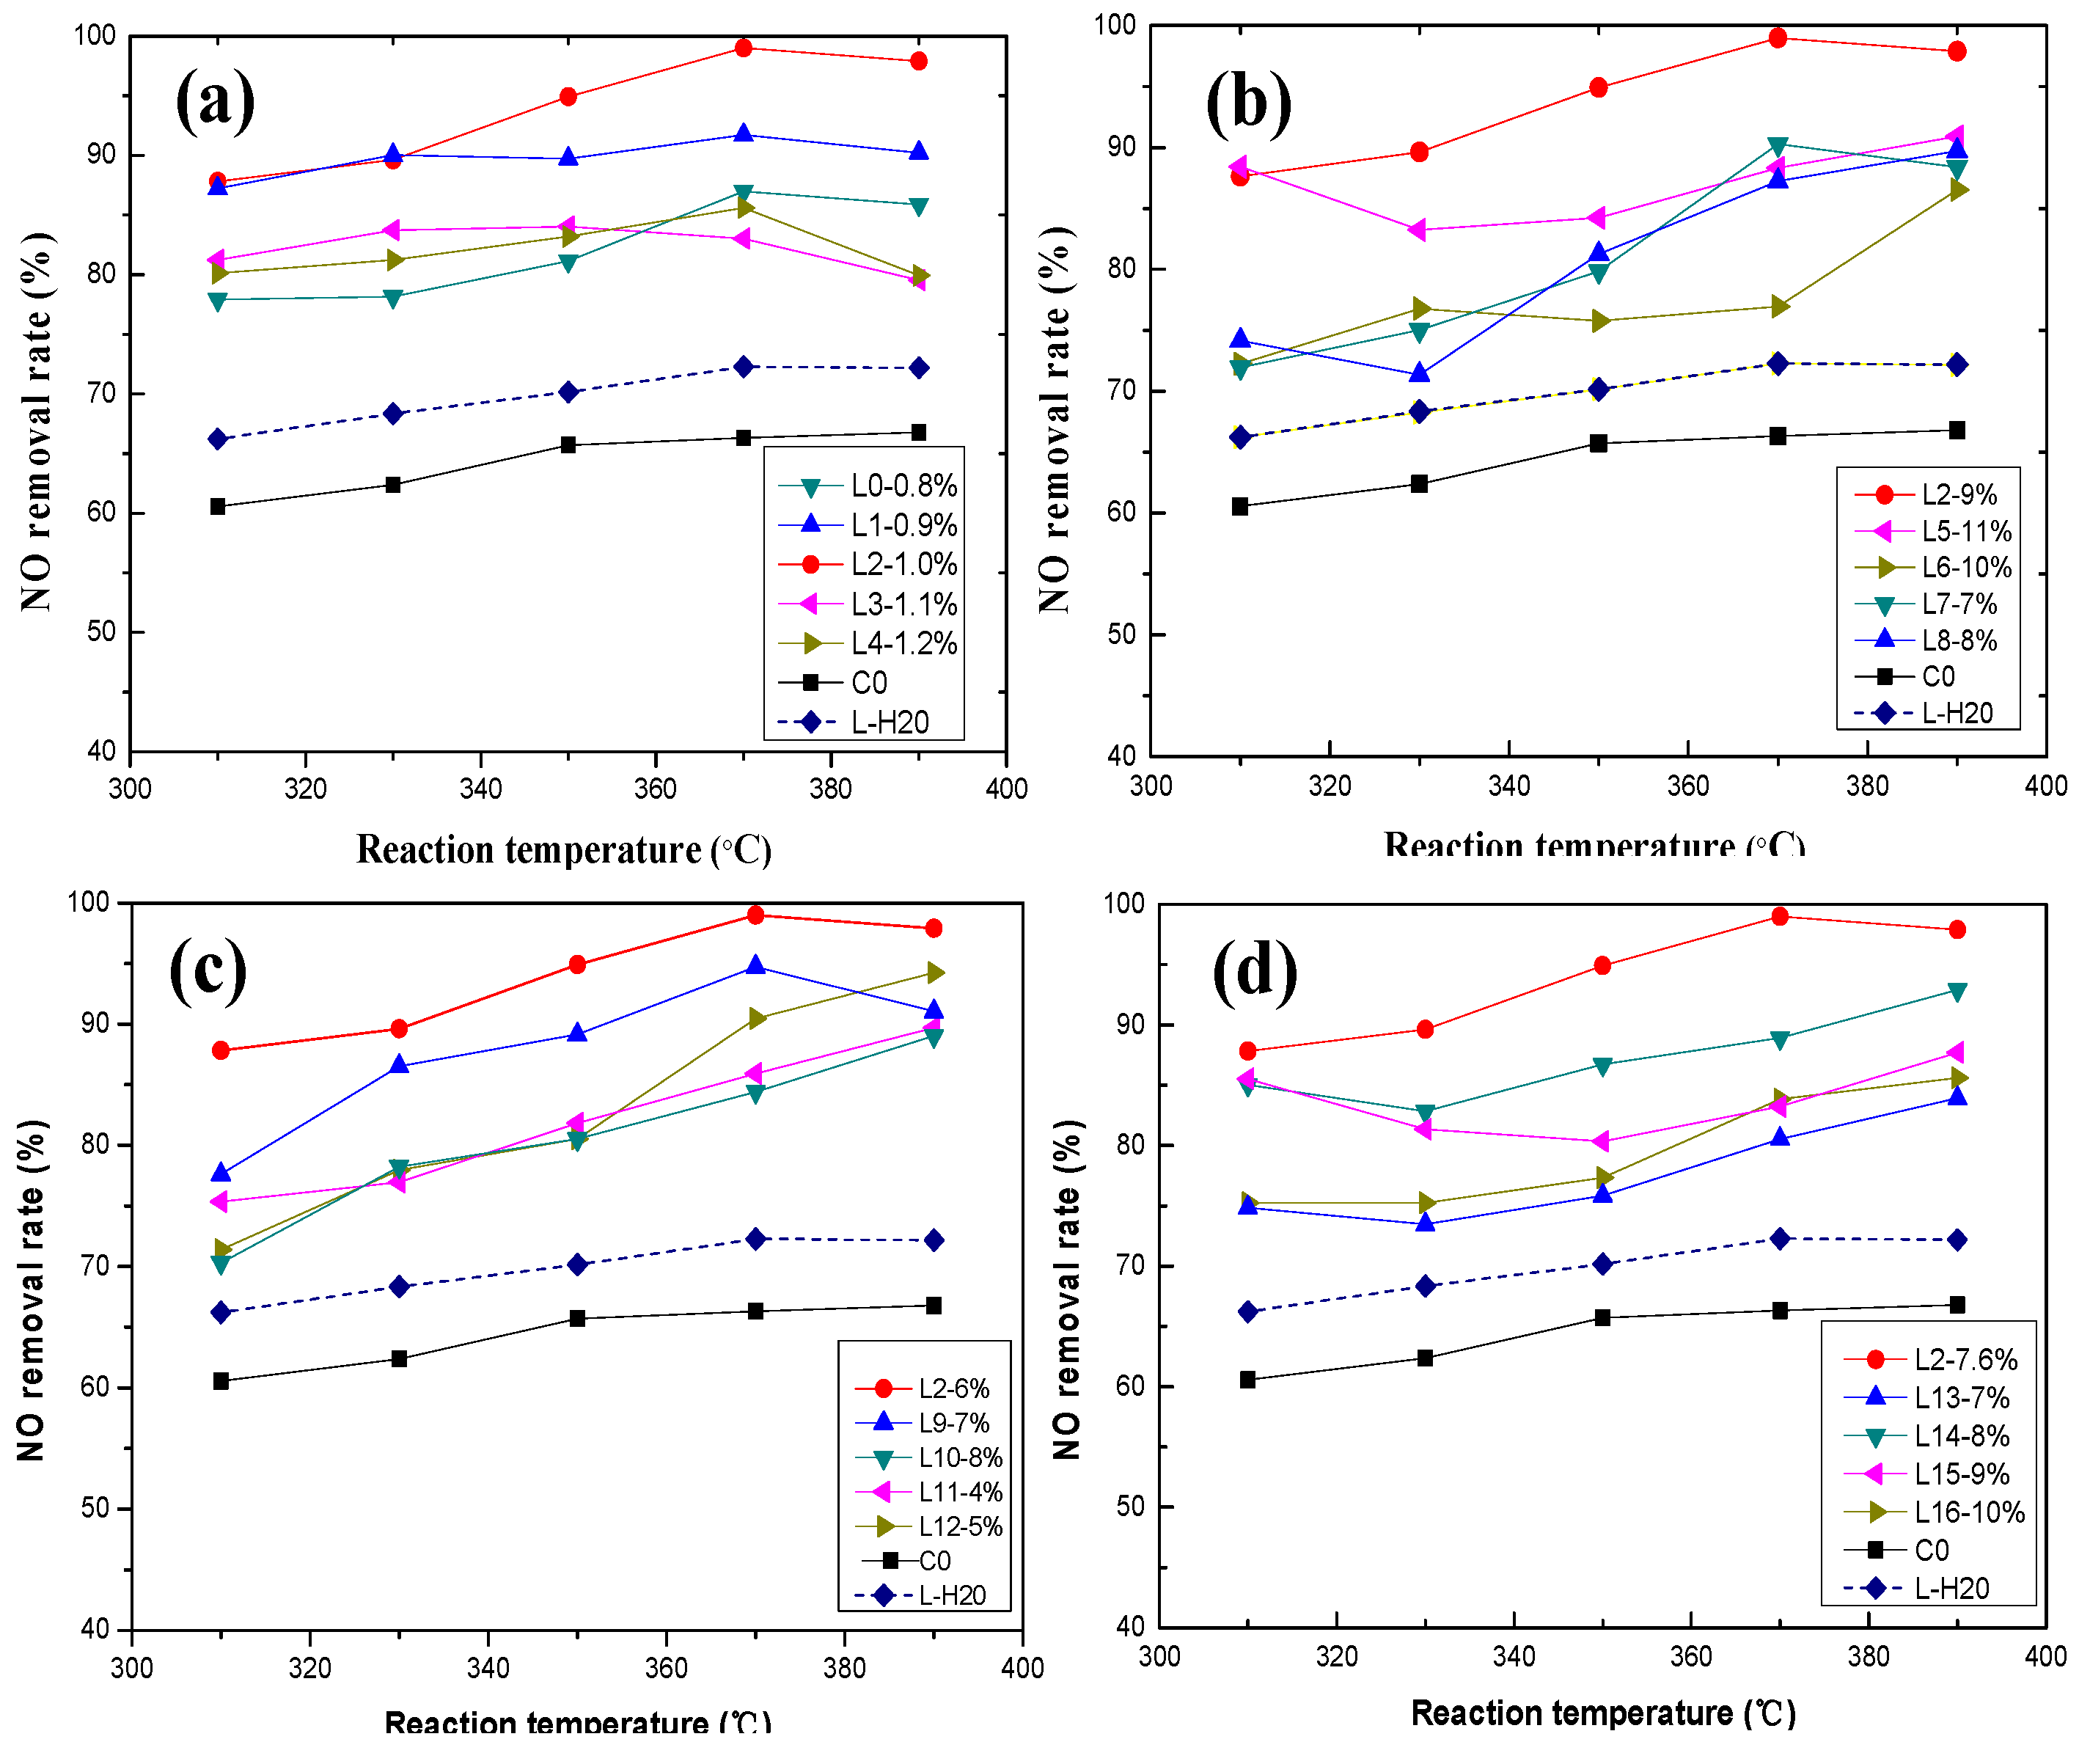
Figure 4.
Effect of active ingredients on activity of the catalyst: (a) W = 9 wt %, Mo = 6 wt %, oxalic acid = 7.6 wt %; (b) V = 1 wt %, Mo = 6 wt %, oxalic acid = 7.6 wt %; (c) V = 1 wt %, W = 9 wt %, oxalic acid = 7.6 wt %; and (d) V = 1 wt %, W = 9 wt %, Mo = 6 wt %.
Figure 4.
Effect of active ingredients on activity of the catalyst: (a) W = 9 wt %, Mo = 6 wt %, oxalic acid = 7.6 wt %; (b) V = 1 wt %, Mo = 6 wt %, oxalic acid = 7.6 wt %; (c) V = 1 wt %, W = 9 wt %, oxalic acid = 7.6 wt %; and (d) V = 1 wt %, W = 9 wt %, Mo = 6 wt %.

Figure 5.
Effect of flue gas conditions on the NO removal rate of activated catalyst: (a) space velocity; (b) O2 concentration; (c) ammonia/nitrogen ratio; and (d) NO concentration.
Figure 5.
Effect of flue gas conditions on the NO removal rate of activated catalyst: (a) space velocity; (b) O2 concentration; (c) ammonia/nitrogen ratio; and (d) NO concentration.
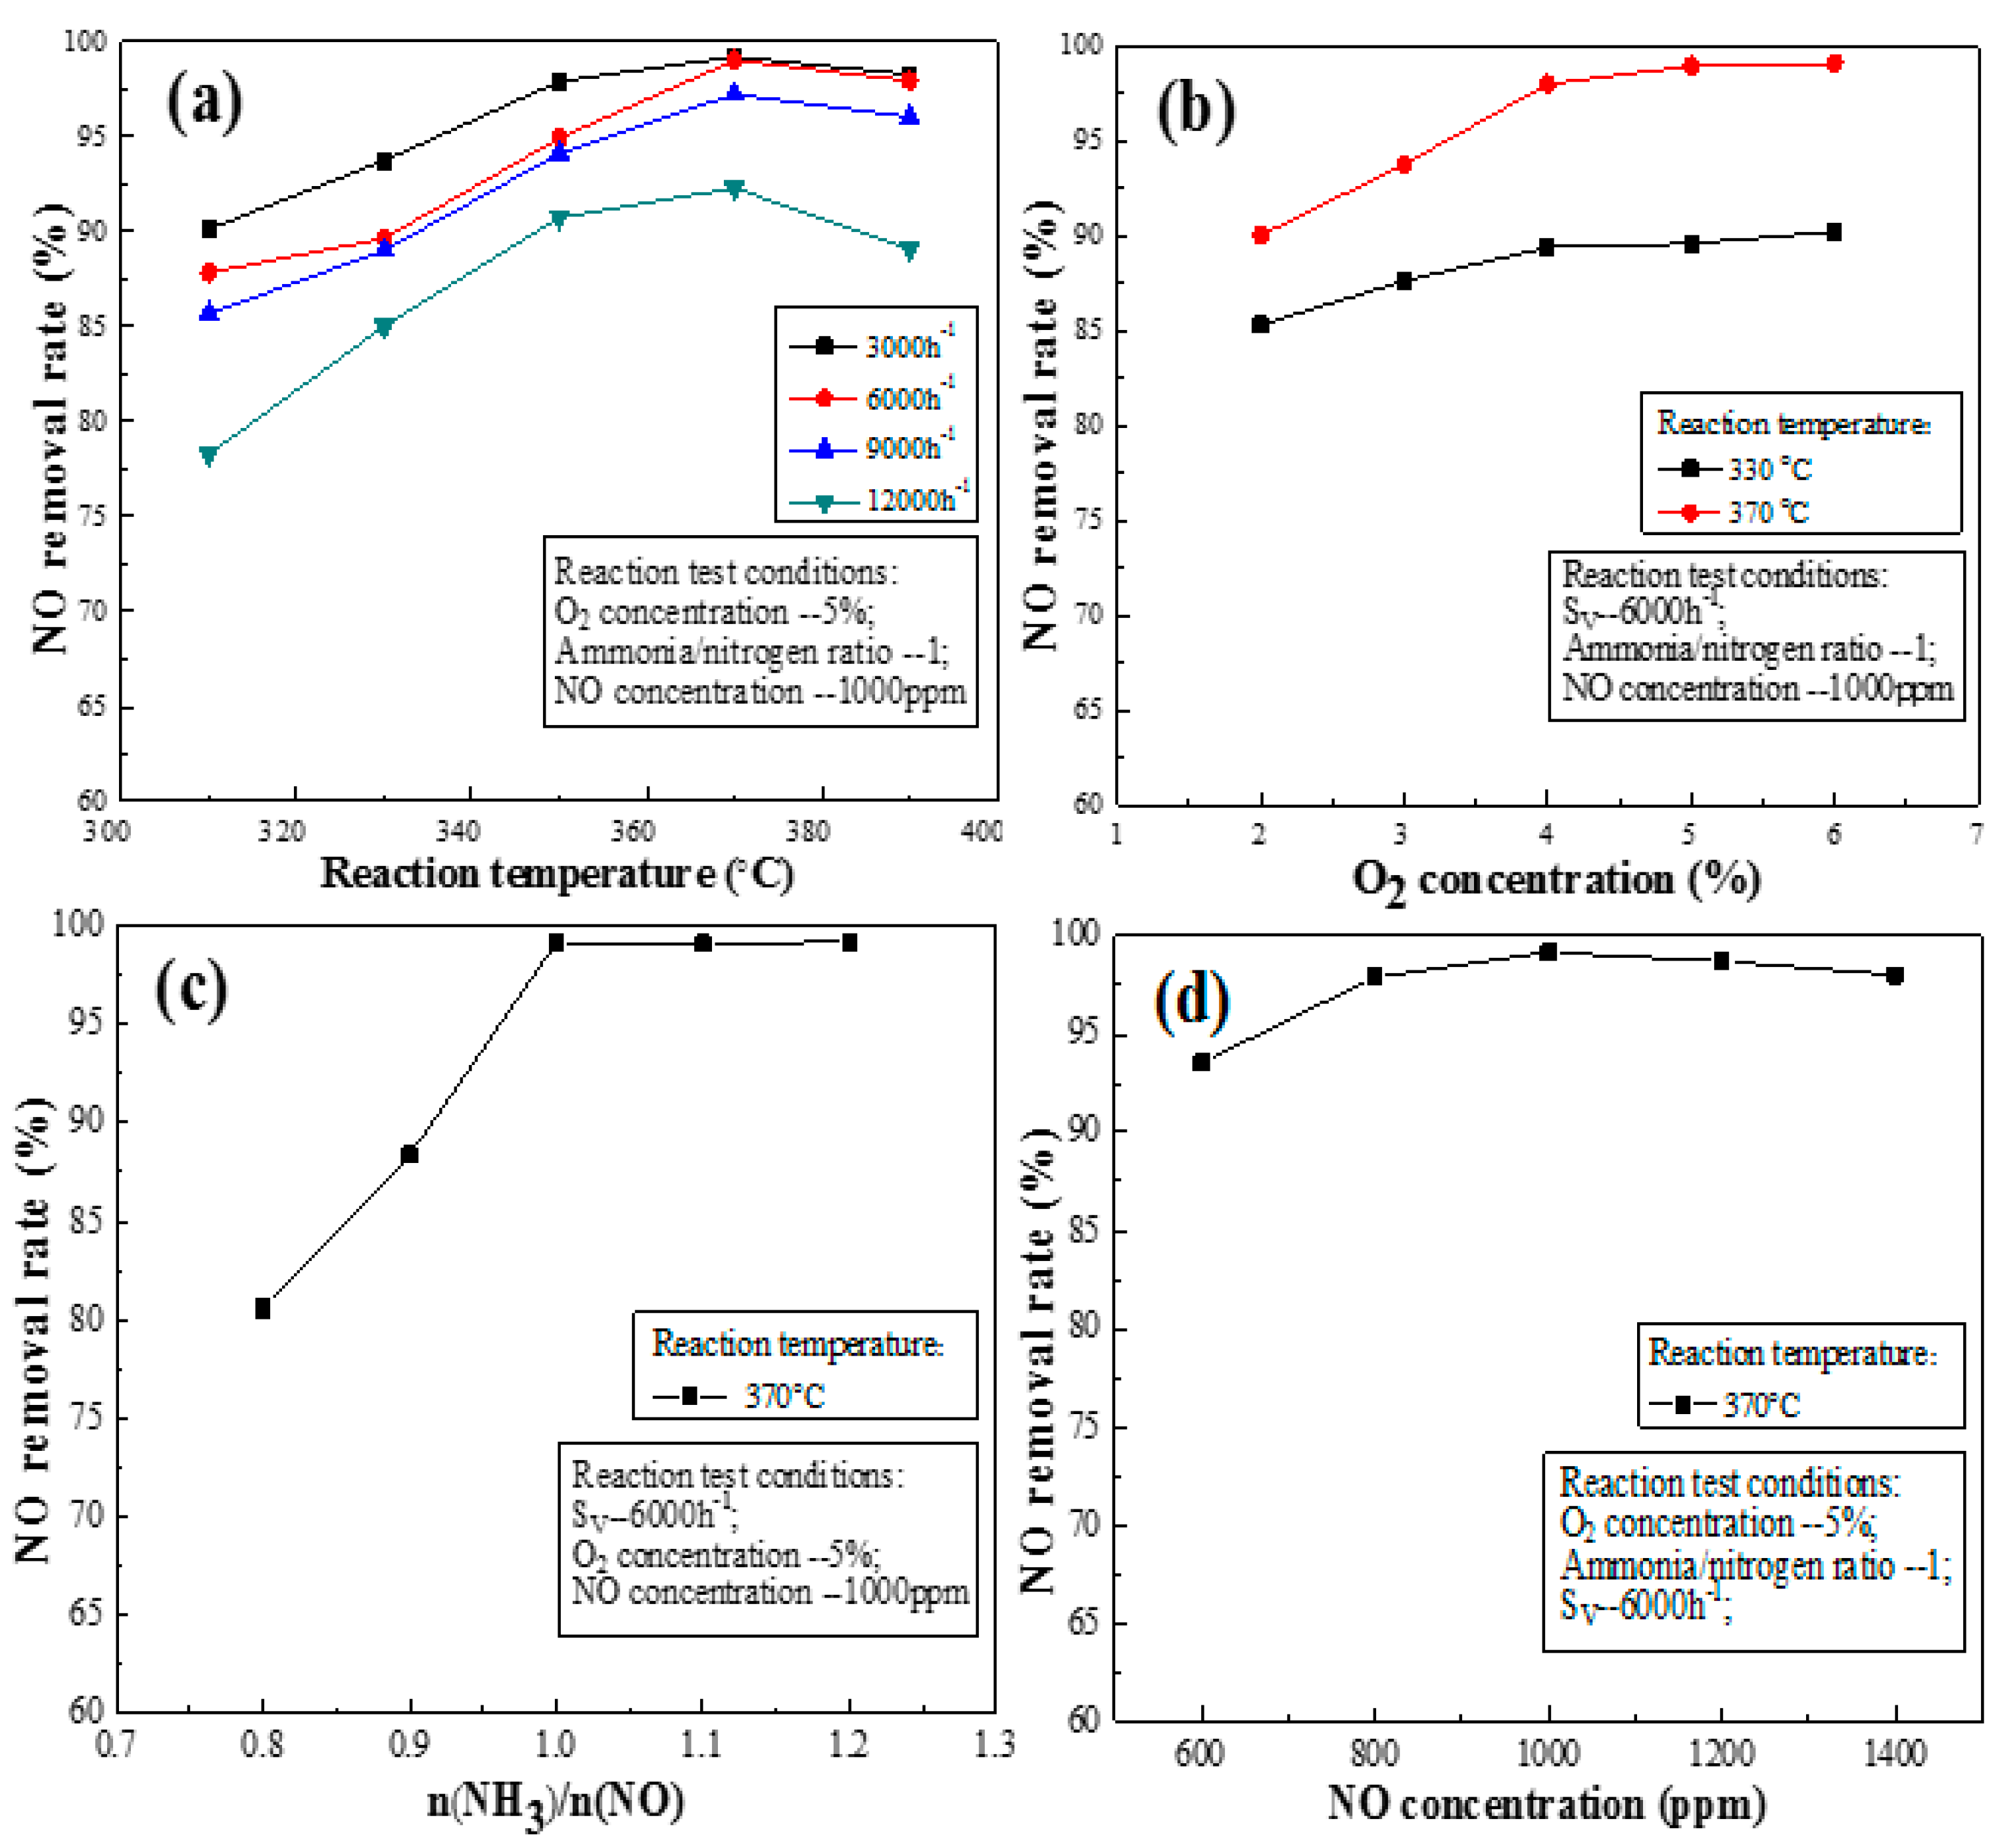
Figure 6.
SEM images of (a) C0 catalyst; (b) activated catalyst; and (c) fresh catalyst.

Figure 7.
Infrared spectra of catalysts before and after activation.
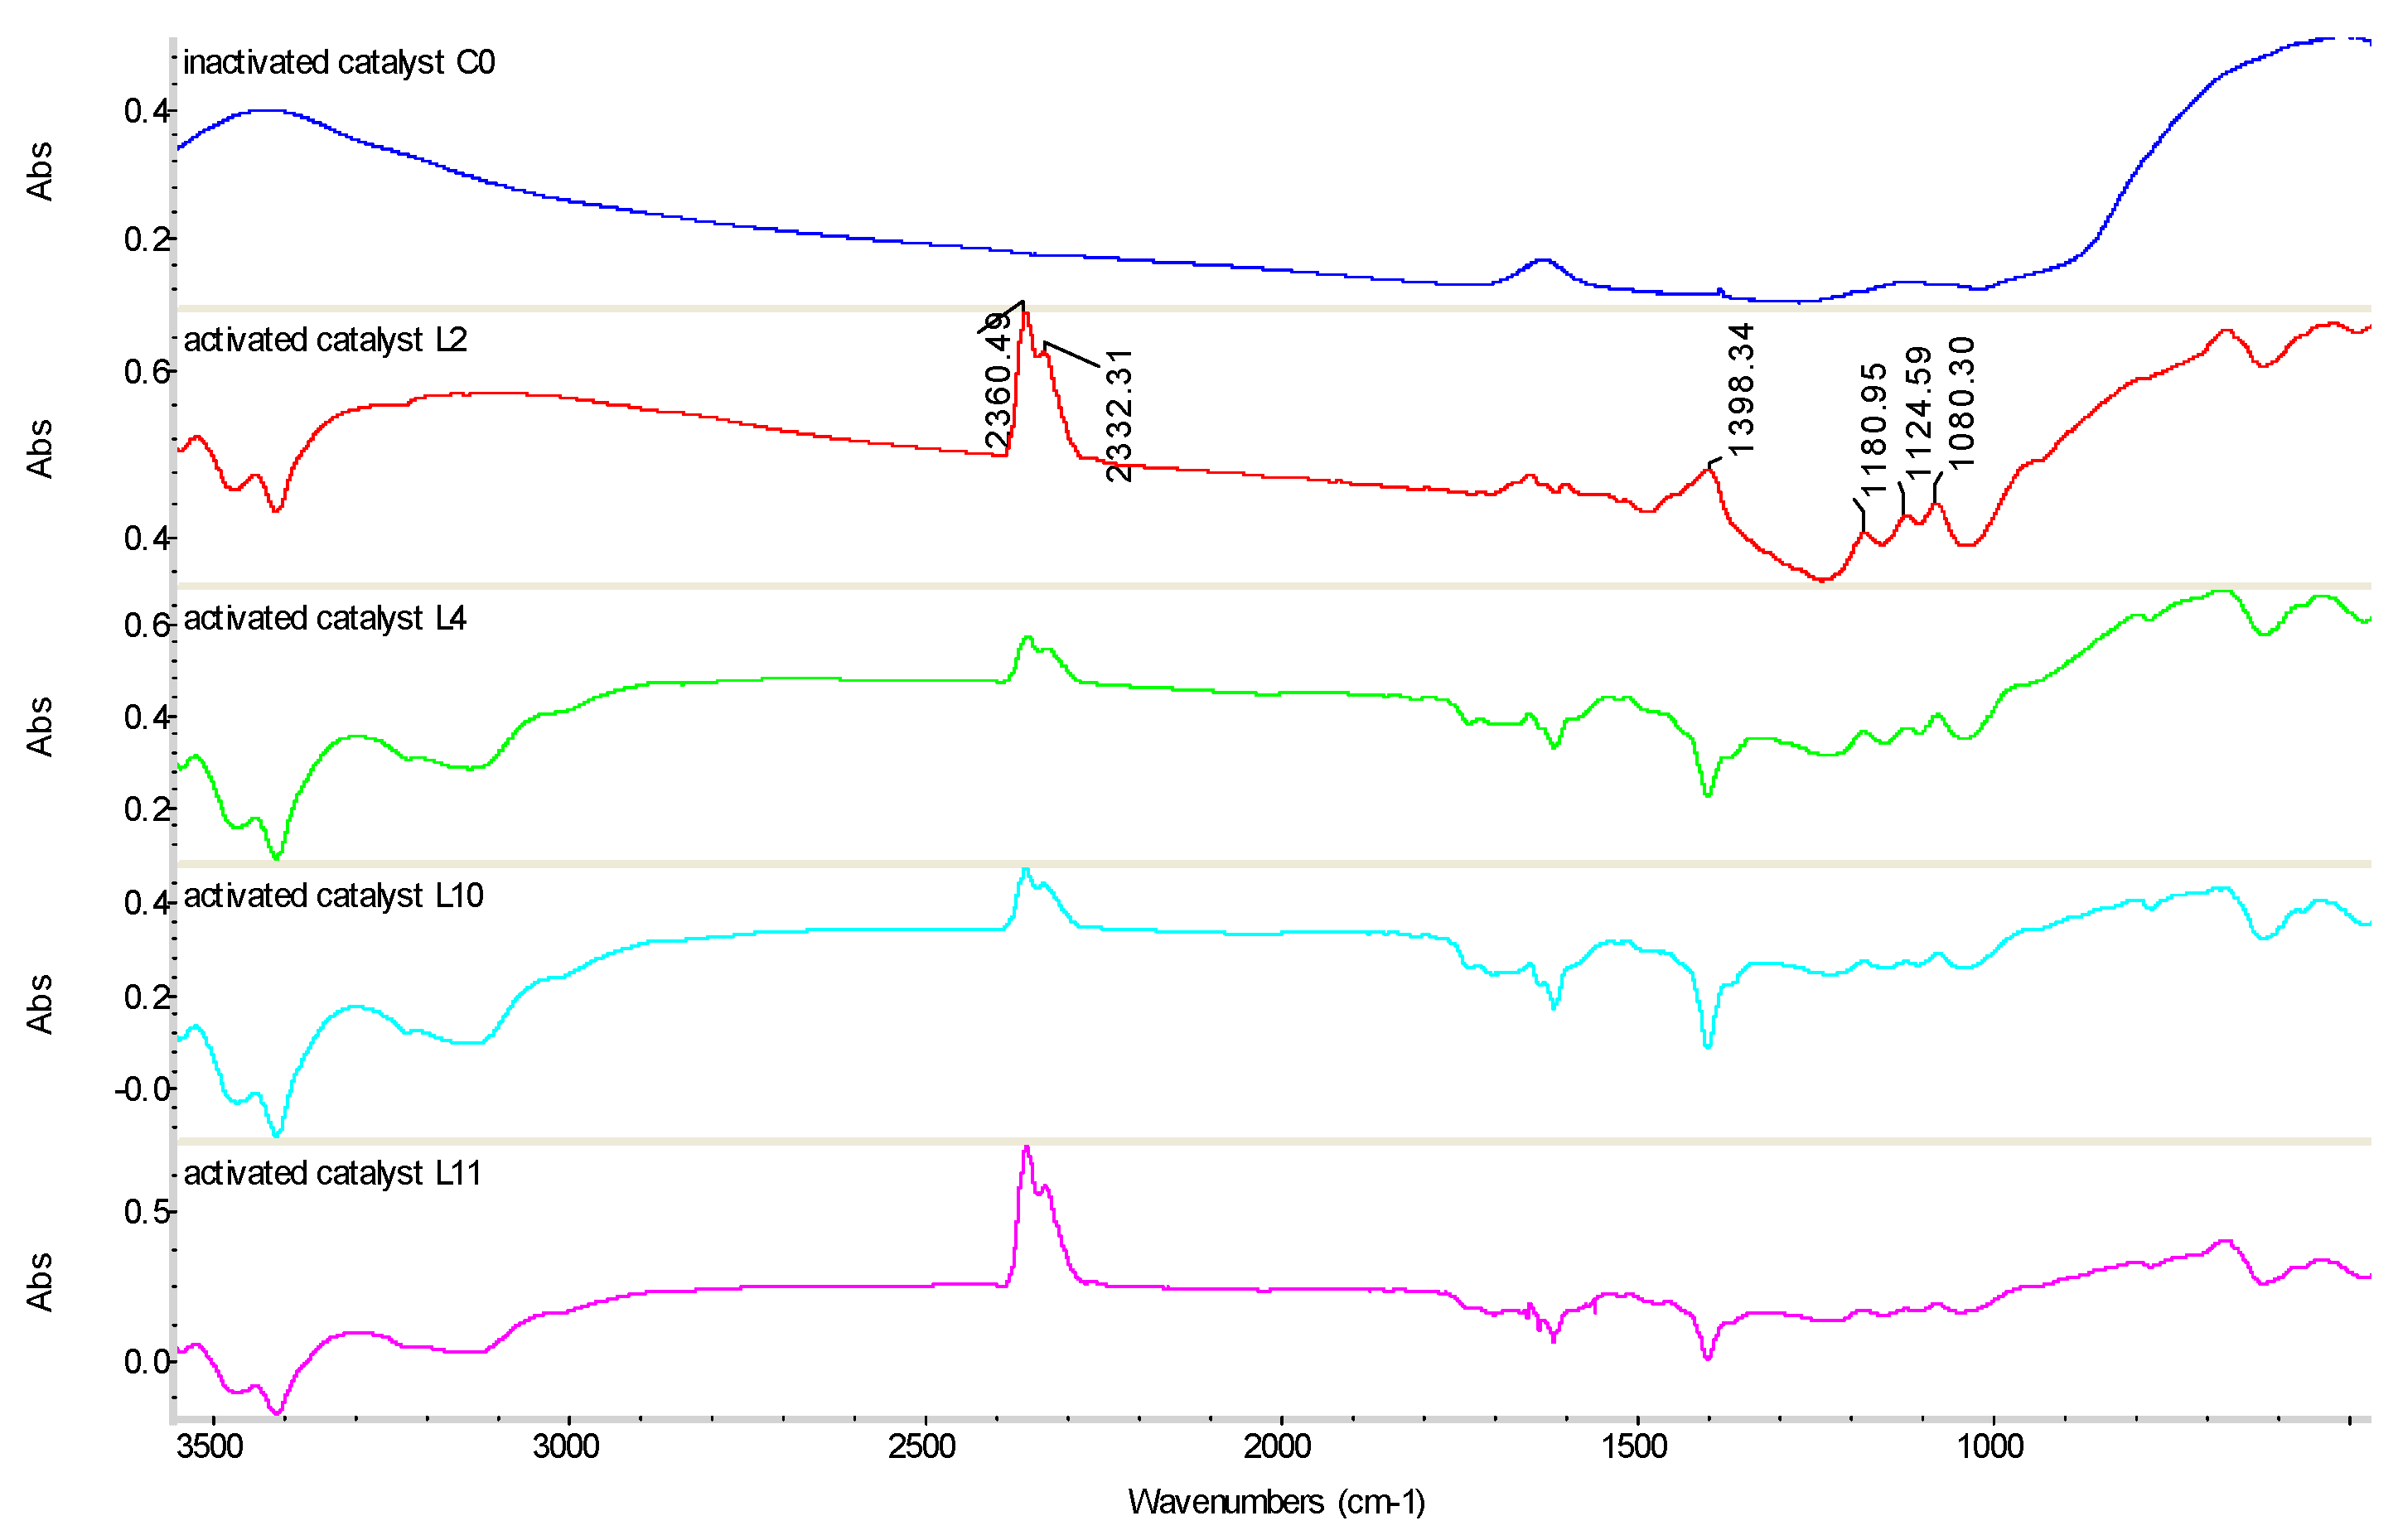
Figure 8.
X-ray diffraction (XRD) spectra of the catalysts: (a) anatase TiO2; (b) WO3; (c) BaSO4; and (d) CaWO4.
Figure 8.
X-ray diffraction (XRD) spectra of the catalysts: (a) anatase TiO2; (b) WO3; (c) BaSO4; and (d) CaWO4.

Table 1.
Catalyst parameters.
| Parameter | Value |
|---|---|
| Channel number | 18 × 18 |
| Square width | 150 mm |
| Channel width | 7.09 mm |
| Specific geometry area | 408 m2/m3 |
| Hardened front length | 25 mm |
Table 2.
Mass percentage of activating ingredients.
| Number | Ammonium Vanadate (wt %) | Ammonium Molybdate (wt %) | Ammonium Tungstate (wt %) | Oxalic Acid (wt %) | Notes | ||||
|---|---|---|---|---|---|---|---|---|---|
| L0–L4 | L0 | 0.8 | 9 | 6 | 7.6 | ||||
| L1 | 0.9 | ||||||||
| L2 | 1.0 | ||||||||
| L3 | 1.1 | ||||||||
| L4 | 1.2 | ||||||||
| L5–L8, LiF | Content of vanadate as in solution LiF | L5 | 7 | 6 | 7.6 | LiF is the number of the optimal solution in L0–L4 | |||
| L6 | 8 | ||||||||
| L7 | 10 | ||||||||
| L8 | 11 | ||||||||
| LiF | 9 | ||||||||
| L9–L12, LiW | Content of vanadate and molybdate as in solution LiW | L9 | 7 | 7.6 | LiW is the number of the optimal solution in L5–L8, LiF | ||||
| L10 | 8 | ||||||||
| L11 | 4 | ||||||||
| L12 | 5 | ||||||||
| LiW | 6 | ||||||||
| L13–L16, LiM | Content of vanadate, molybdate and tungstate as in solution LiM | L13 | 6 | LiM is the number of the optimal solution in L9–L12, LiW | |||||
| L14 | 7 | ||||||||
| L15 | 8 | ||||||||
| L16 | 9 | ||||||||
| LiM | 7.6 | ||||||||
Table 3.
Structural characteristics of catalysts before and after activation.
| Catalyst Sample | Specific Surface Area (m2/g) | Total Pore Volume (cc/g) | Aperture (nm) |
|---|---|---|---|
| C | 52.31 | 0.8022 | 18.6 |
| C0 | 41.85 | 0.3434 | 20.0 |
| L2 | 47.55 | 0.6884 | 17.0 |
| L5 | 50.61 | 0.7502 | 18.1 |
| L8 | 46.80 | 0.6710 | 16.7 |
| L11 | 47.03 | 0.6725 | 16.8 |
Table 4.
Statistical table of the weight percentage of catalyst element.
| Element | C | C0 | L2 | |||
|---|---|---|---|---|---|---|
| wt % | at % | wt % | at % | wt % | at % | |
| O | 4.3 | 13.38 | 9.25 | 22.94 | 6.87 | 21.33 |
| Al | 0 | 0 | 1.66 | 2.44 | 0 | 0 |
| Si | 0.7 | 1.25 | 6.74 | 9.53 | 2.5 | 4.43 |
| W | 13.72 | 3.72 | 8.96 | 1.93 | 18.64 | 5.04 |
| Mo | 5.52 | 2.87 | 2.48 | 1.03 | 10.59 | 5.49 |
| S | 0 | 0 | 6.37 | 7.89 | 0.10 | 0.15 |
| Ca | 0 | 0 | 4.93 | 4.88 | 0 | 0 |
| Ti | 74.08 | 77.84 | 58.97 | 48.86 | 60.10 | 62.38 |
| V | 0.96 | 0.94 | 0.65 | 0.5 | 1.2 | 1.17 |
© 2017 by the authors. Licensee MDPI, Basel, Switzerland. This article is an open access article distributed under the terms and conditions of the Creative Commons Attribution (CC BY) license (http://creativecommons.org/licenses/by/4.0/).
Share and Cite
MDPI and ACS Style
Ye, T.; Chen, D.; Yin, Y.; Liu, J.; Zeng, X. Experimental Research of an Active Solution for Modeling In Situ Activating Selective Catalytic Reduction Catalyst. Catalysts 2017, 7, 258. https://doi.org/10.3390/catal7090258
AMA Style
Ye T, Chen D, Yin Y, Liu J, Zeng X. Experimental Research of an Active Solution for Modeling In Situ Activating Selective Catalytic Reduction Catalyst. Catalysts. 2017; 7(9):258. https://doi.org/10.3390/catal7090258
Chicago/Turabian StyleYe, Tuo, Donglin Chen, Yanshan Yin, Jing Liu, and Xi Zeng. 2017. "Experimental Research of an Active Solution for Modeling In Situ Activating Selective Catalytic Reduction Catalyst" Catalysts 7, no. 9: 258. https://doi.org/10.3390/catal7090258
Note that from the first issue of 2016, this journal uses article numbers instead of page numbers. See further details here.