
Methanation of CO2 on Ni/Al2O3 in a Structured Fixed-Bed Reactor—A Scale-Up Study


Leibniz-Institut für Katalyse e.V., Albert-Einstein-Str. 29a, 18059 Rostock, Germany
*
Author to whom correspondence should be addressed.
Catalysts 2017, 7(5), 152; https://doi.org/10.3390/catal7050152
Submission received: 31 March 2017
/
Revised: 24 April 2017
/
Accepted: 4 May 2017
/
Published: 15 May 2017
(This article belongs to the Special Issue Commemorative Issue in Honor of Professor Emeritus Calvin H. Bartholomew in Anticipation of His 75th Birthday)
Abstract
:Due to the ongoing change of energy supply, the availability of a reliable high-capacity storage technology becomes increasingly important. While conventional large-scale facilities are either limited in capacity respective supply time or their extension potential is little (e.g., pumped storage power stations), decentralized units could contribute to energy transition. The concepts of PtX (power-to-X) storage technologies and in particular PtG (power-to-gas) aim at fixation of electric power in chemical compounds. CO2 hydrogenation (methanation) is the foundation of the PtG idea as H2 (via electrolysis) and CO2 are easily accessible. Methane produced in this way, often called substitute natural gas (SNG), is a promising solution since it can be stored in the existing gas grid, tanks or underground cavern storages. Methanation is characterized by a strong exothermic heat of reaction which has to be handled safely. This work aims at getting rid of extreme temperature hot-spots in a tube reactor by configuring the catalyst bed structure. Proof of concept studies began with a small tube reactor (V = 12.5 cm3) with a commercial 18 wt % Ni/Al2O3 catalyst. Later, a double-jacket tube reactor was built (V = 452 cm3), reaching a production rate of 50 L/h SNG. The proposed approach not only improves the heat management and process safety, but also increases the specific productivity and stability of the catalyst remarkably.
1. Introduction
Growing energy consumption and the political target to reduce total CO2 emissions led to a boom of plant construction for alternative power production. Further, recently in Germany, safety issues played a big a role when the abolishment of nuclear power plants was forced by politics considering past accidents and missing storage options for nuclear waste [1]. In total, 13,147.3 million tons of oil equivalent primary energy was consumed worldwide in 2015, which was mainly covered by fossil energy sources, i.e., oil, natural gas and coal (86.0%). Continental Europe consumed 2834.4 million tons of oil equivalents with a share of 78.8% fossil fuels, wherein Germany used 320.6 million tons of oil equivalents (82.3% fossil fuels). In comparison to 2014, the growth in Germany was +8.7 million tons oil equivalents, mainly covered by renewable energy sources (i.e., wind, geothermal, solar, biomass and waste) [2]. Preferably wind and sun are exploited to get alternatives to energy generation from fossil sources: 26,000 wind power plants generating approximately 45 GW electrical power (GWel) and 1.5 million photovoltaic power plants with a capacity of 40 GWel were installed in Germany by the end of 2015. In 2016, regenerative energy contributed 30% to the total generated electrical power and is planned to reach 40–45% in 2025 [3]. However, this part of the energy sector is subjected to temporal fluctuation due to weather conditions causing shortage or surplus in energy supply. Very often wind turbines have to be switched off not to overstress the power grid. Consequently, the effective storage of electric power is one of the emerging tasks in future energy supply, not only to get rid of a growing dependency on energy imports, but also to support the change in energy supply [4]. Among other storage opportunities [5], an often discussed option for excess electrical energy from renewable sources is the generation of hydrogen by water electrolysis and its temporal storage in available infrastructures such as the gas grid, underground caverns or high pressure and liquid hydrogen tanks. The problem here is that only low amounts in single-digit percentage range are accepted in gas grid or caverns [6], and expansion of the hydrogen infrastructure needs exorbitant investments. One solution is the chemical conversion of such “green” hydrogen and easily available carbon dioxide into methane (SNG) [7,8].
The long-known methanation Reactions (1) and (2) are used industrially for cleaning of hydrogen from steam reformers in the presence of hydrogenation catalysts to remove CO and CO2 traces [9,10]. The reactions are highly exothermic and controlled by chemical equilibrium, and due to high activation energy the process is run at 250–400 °C mainly over Ni-containing catalysts. It benefits from increasing pressure and is very selective towards SNG. At higher temperature, other reactions such as reversed water-gas shift Reaction (3) affect the methane yield. There are two mechanisms under discussion: (i) the direct hydrogenation of CO2 to methane; and (ii) the conversion of CO2 to CO (reverse water-gas shift reaction) followed by CO methanation. CO forms adsorbed carbon species on the catalyst surface, which are subsequently hydrogenated to methane by surface hydrogen [11,12]. In other words, the methanation mechanism might be characterized by carbon formation and carbon methanation. Additionally, adsorbed CO may react at low temperatures to hydrocarbons via the Fischer–Tropsch reaction (conversion of CO and H2) [13]. Ethane might also be formed at higher temperatures but it is easily converted to methane in surplus of hydrogen by hydrogenolysis [14].
Biomass, a further brick in the road to energy supply change, can be fermented to biogas which in dependency on the feed contains 40 vol %–75 vol % methane and 25 vol %–55 vol % CO2; in addition, some impurities such as hydrogen, hydrogen sulfide, nitrogen, ammonia and water vapor are present [15]. World biogas production has rapidly increased in recent years. More than 17,000 biogas plants (>8.3 GWel capacity) existed in Europe by the end of 2014. Germany is Europe’s biggest biogas producer and world leader in biogas technology. Roughly 11,000 plants (in 2015) are generating more than 4 GW of power with an annual turnover of 9.2 billion € [16,17]. The downstream methanation of the CO2 fraction would increase the productivity and earnings of a biogas plant. This would require catalysts that are also robust against named impurities.
Catalytic activities of metals for CO2 methanation follow the order Ru > Ni > Co > Fe > Mo [18], and noble metal proportions might increase the productivity. An overview on applied catalyst systems is given in [19]. Considering the high costs of Ru, nickel on a suitable support is a cheap and active alternative. Suitable supports have been compared, resulting in the efficiency order CeO2 > Al2O3 > TiO2 > MgO [20].
Car manufacturer Audi’s PTG facility in Werlte (Lower-Saxony, Germany) [21], online since 2013, is fed by a biogas plant; it produces 1.5 million Nm3/a SNG (6 MWel plant). Clariant has supplied the methanation catalyst [22]. In 2015, the world’s largest SNG plant went on-stream (1.4 billion Nm3/a) in Yining, China with catalysts and process technology from Haldor Topsøe [23]. More descriptions of pilot plants and commercial scale projects can be found in [24].
The high exothermicity of −206.3 kJ/mol is not a problem when only traces of carbon dioxide are converted (for example, gas purification for ammonia production), but in case of selective SNG synthesis at large scale, limited heat transfer causes hot-spots, stressing the construction materials and catalysts, and thermal runaway of the reactor could become the final consequence. Apart from this, the chemical equilibrium shifts away from optimum conditions. Published results from the conversion of a CO/CO2/H2 stream stemming from biomass gasification showed a hot-spot temperature of 460 °C and a gas outlet temperature of 270 °C [25]. To get rid of this unwanted effect, reactor concepts such as cascades of fixed bed reactors with limited conversion, wall-cooled fixed bed reactors, fluidized bed reactors or slurry bubble reactors are used or currently investigated [26,27]. These reactor set ups are mainly assisted by internal heat exchange or by diluting the gas inlet with cooled recycle gas and/or water so that combined with high pressure the methane yield can be maximized. An alternative concept with effective removal of the generated heat of reaction uses microchannel reactors, as they offer advantageous surface/volume ratio [28]. Published research results from other groups on structured fixed-bed reactors are not known. The aim of the presented work was to collect data on the heat distribution along various catalyst bed arrangements in a tube reactor at maximum SNG productivity for further scale-up, while also considering catalyst stability.
2. Results and Discussion
2.1. Catalytic Test Runs
Past studies in our group on methanation over monometallic Ni, Ru and bimetallic NiRu catalysts in a bench-scale reactor with low catalyst amount and diluted feed (50 vol % N2) revealed that the best results with respect to CO2 conversion and methane selectivity were obtained at 10 bar and 325–350 °C [29,30]. In particular, increased reaction pressure is beneficial to suppress CO and ethane formation. Observed CO2 conversion always was close to the thermodynamic equilibrium and methane selectivity was above 99.9%. Some ethane formation (<<1%) was detected below 325 °C set point temperature. Table 1 gives an overview on related runs with 5 wt % Ni/ZrO2 catalyst at 1 and 10 bar gauge pressure.
Later runs with the same bench-scale reactor aiming at increased methane productivity through setting a higher GHSV, lower inert gas dilution and/or larger catalyst volume gave first data on hot-spot formation at the entrance of the catalyst bed [31]. Since knowledge about hot-spot size and position at high catalyst load is needed for upscaling experiments, runs on diluting and stacking various catalyst/quartz beds were made at increased space velocity and decreased inert gas dilution (from 50 vol % to 10 vol % N2). Therefore, an industrial catalyst containing 18 wt % of Ni supported on Al2O3 was selected for upscaling with a larger reactor. This catalyst proved to ignite already around 250 °C (Figure 1).
2.2. Temperature Profiles in the Small Tube Reactor
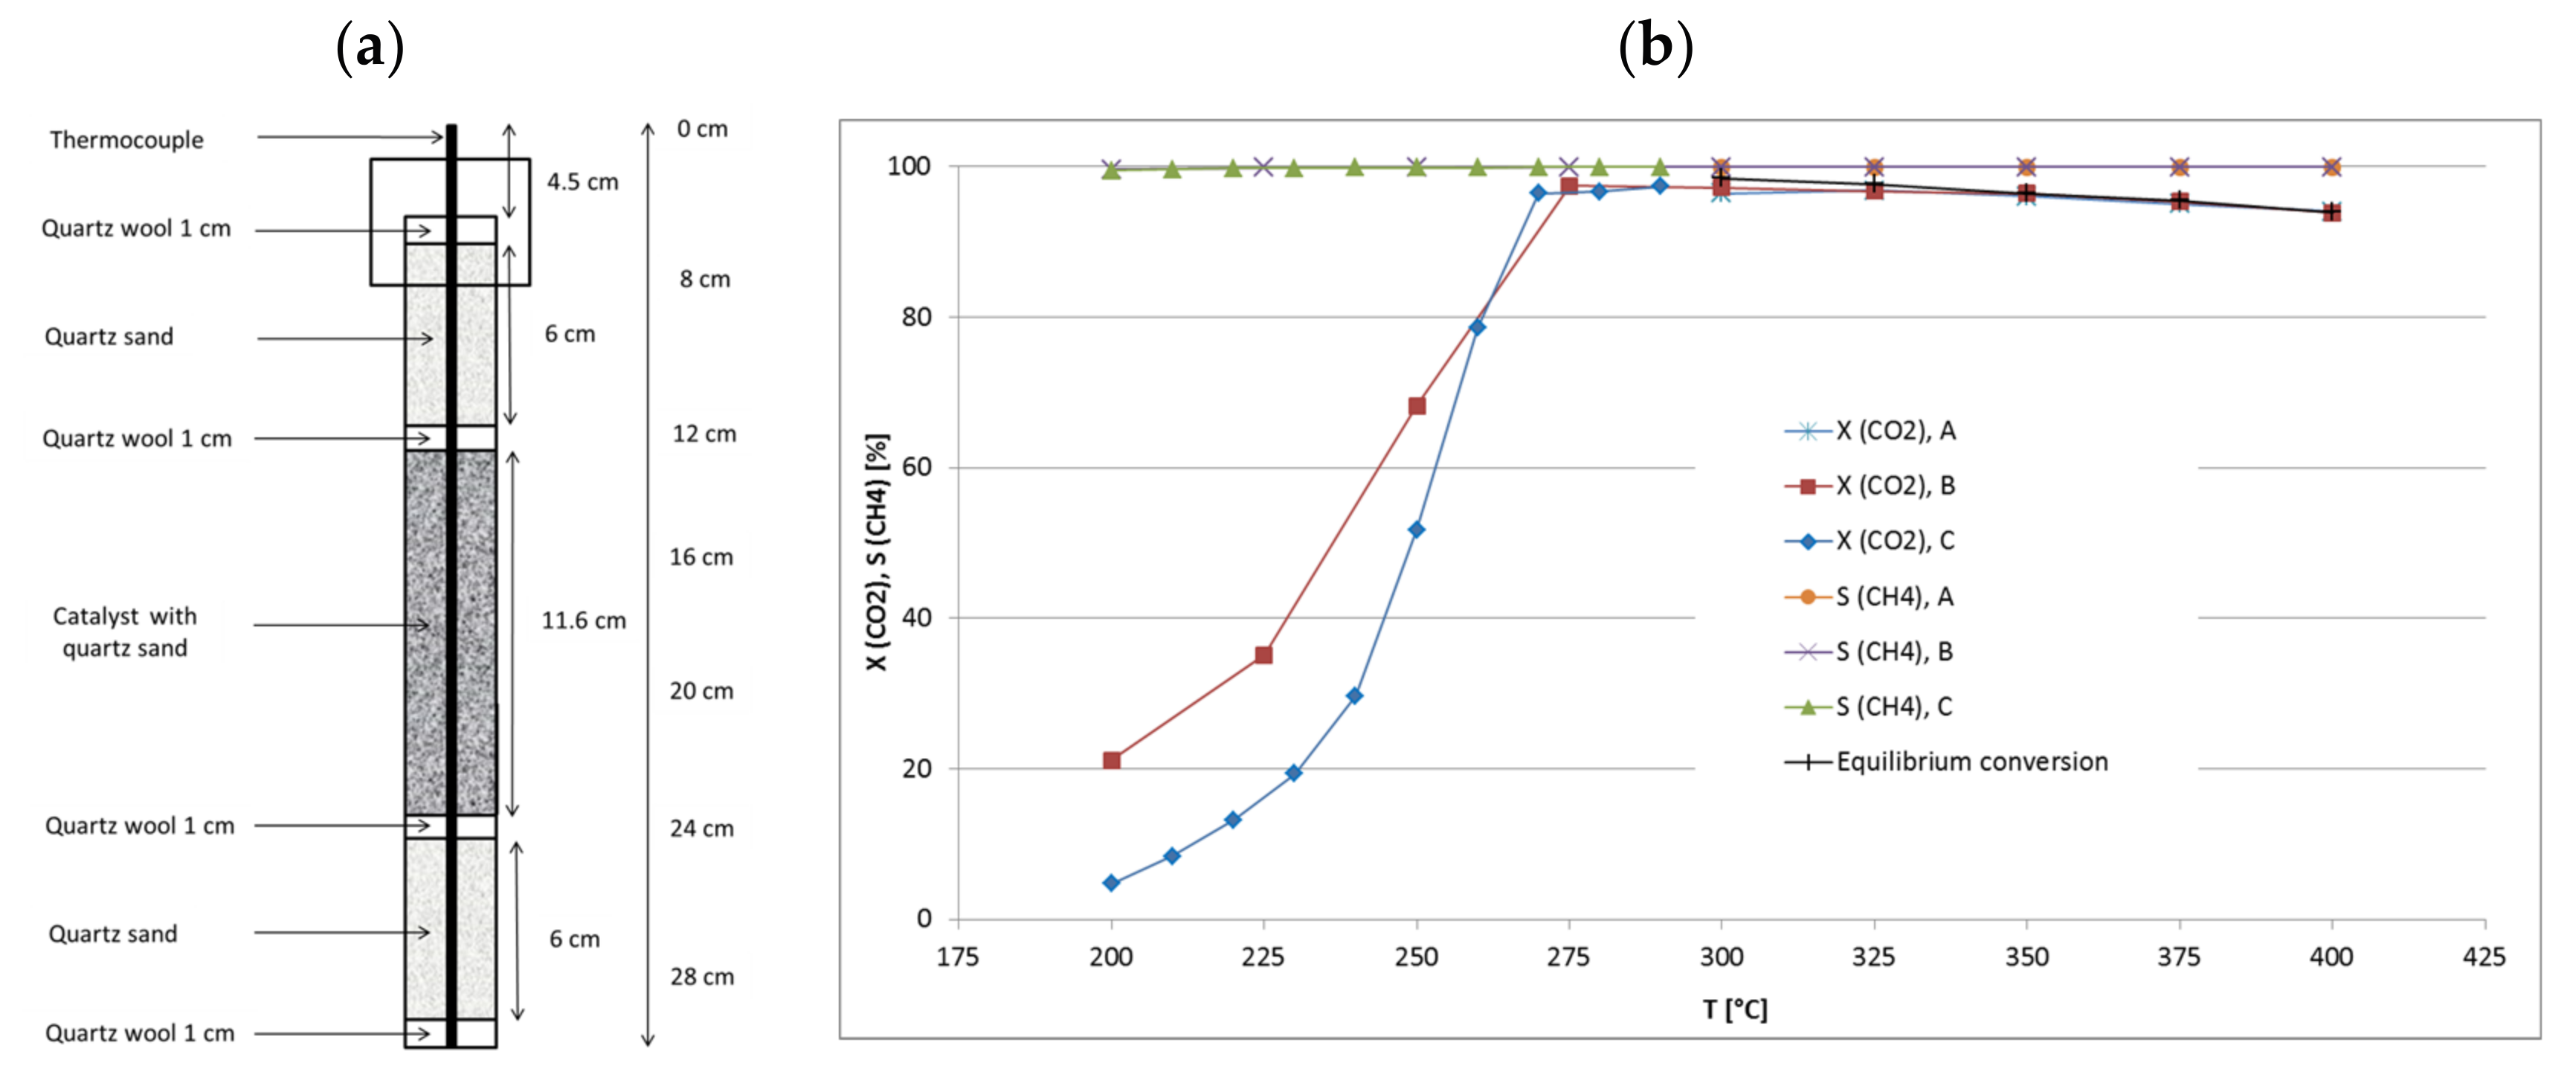
A scheme of the small bench-scale reactor is depicted in Figure 1. Conventionally, the catalyst bed was fixed in the vertical center of the tube while quartz sand layers were filled at the top and bottom of the reactor with quartz wool as separator. Temperature profile was recorded with a thermocouple which was vertically movable along the reactor through a centered guiding tube. The length scale shown in Figure 1 serves as a reference for the following figures visualizing results obtained with this reactor.
At the beginning, three runs A–C with different catalyst amount were made at a GHSV of approximately 6000 h−1 (related to catalyst volume, particle size 500–800 µm) with variation of feed flow rate, aiming at higher CO2 conversion and methane productivity. The total bed volume (catalyst + quartz) was kept constant at 5 mL while the catalyst/quartz ratio was changed (bed position from 12 to 24 cm). Run A was made with 1 mL of catalyst and 4 mL of quartz, run B with 2.5 mL of catalyst and quartz each, and run C with 4 mL of catalyst and 1 mL of quartz diluent. The feed flow rate was set accordingly: run A 6 L/h, run B 15 L/h and run C 26.4 L/h (GHSV = 6588 h−1) [31]. CO2 conversion was always near the equilibrium with maxima at the set point temperatures of 325 °C for run A, 300 °C for run B and 290 °C for run C. Because of the increasing catalyst load and methane production from run A to C, the corresponding hot-spot temperatures reached 325 °C, 336 °C and 358 °C, respectively. Decreased CO2 conversion was observed in runs A and B at higher set point temperatures due to thermodynamic limitation. Data from run C were only collected up to 290 °C because the high absolute methane production raised the hot-spot temperature by >70 K. The selectivity to CH4 always reached values above 99.9%. Table 2 summarizes these data. It is noteworthy that run C at 290 °C reached higher conversion (97.4%) than run A at 350 °C (96.1%), even though the internal bed temperatures were comparable (358 °C vs. 351 °C). This might be explained by the significantly lower temperature at the bottom of the catalyst bed in run C (Figure 2), which favors methanation over RWGS reaction.
By increasing the catalyst amount at constant space velocity, the CH4 productivity grew from 1.1 L/h (run A) and 2.6 L/h (run B) to 4.6 L/h (run C), and significantly elevated hot-spot temperatures were measured. Since the reaction temperatures were similar in the hot-spot zones, the CO2 conversions were similar though set point temperatures differed markedly. Then the methane productivity seems to be proportional to the catalyst amount. The recorded temperature profiles (Figure 2) reveal that hot-spot zones are located at the very top of the catalyst bed and very narrow (3 cm). Largest part of the catalyst bed seems not to take part in methanation. With these results in mind, a raised productivity should be expected at more equal temperature distribution over the whole catalyst bed when appropriate catalyst dilution and increased space velocity are combined.
Thus, another run D with increased catalyst dilution (catalyst:quartz = 1:9, 0.5 mL catalyst) at an increased GHSV of 12,000 h−1 was performed. The carbon dioxide conversion as well as the methane selectivity were almost the same, but reached their maxima at 350 °C (XCO2 = 96.6% and SCH4 = 99.9%, Table 3) with a methane productivity of almost 1.1 L/h.
The corresponding temperature profile (Figure 3) shows that no notable hot-spot appeared due to high dilution and flow rate. This illustrates the beneficial effect of improved temperature control on the chemical equilibrium.
Based on the results of these preliminary runs, instead of one catalyst bed with constant dilution, three beds of 1.7 mL each (5 mL in total) were used, varying the catalyst:quartz ratio from top to bottom from 1:4 and 1:1 to 4:1 (Figure 4). In total, the catalyst:quartz ratio of 1:1 (as in run B) was kept. Run E was carried out at 6000 h−1 and 13.5 L/h feed gas (CO2:H2:N2 = 1.8:7.2:1). CO2 conversion of 97.5% close to equilibrium was reached at 310 °C set point temperature. The hot spot temperature in the beds reached 325 °C, 327 °C and 317 °C (from top to bottom). The methane productivity reached 2.4 L/h (similar to run B), but the temperature profile changed dramatically and overall reaction temperature decreased significantly, making this configuration most preferable.
With these data from the bench-scale reactor [31], first estimations of maximum heat release and heat transfer were made. Additionally, basic kinetic parameters were determined. Afterwards, a larger tube reactor was constructed at an upscale factor of 36. Further optimization aimed at a methane productivity of 50 L/h, being equivalent to an electrical power of 500 W, with minimum catalyst load. It was planned together with industrial partners to integrate such reactors with optimized bed configuration into a tube bundle reactor for upscaling by increasing the number of tubes (modular design) for further increase of productivity.
2.3. Activation Energy
The Arrhenius plot (Figure 5) was calculated from experiments with the bench-scale reactor and a single fixed bed (1 mL of catalyst, catalyst:quartz = 1:4) for an estimation of the activation energy for CO2 methanation on 18Ni/Al2O3. Measurements were carried out at kinetically controlled conditions at low set point temperatures (250–280 °C) and high space velocities (8000–12,000 h−1). Resulting CO2 conversion reached 15–70%. Usually (e.g., [32]) very low conversions are preferred (<10%) but the measured conversions are far away from the chemical equilibrium and thus should be valid for a first approximation. The determined apparent activation energy was 120.4 kJ/mol, assuming first order reaction in CO2. This is slightly higher as compared to results from other groups, possibly as CO2 conversion was comparatively high. For example Weatherbee and Bartholomew got 80 kJ/mol on Ni/SiO2 [33], whereas another group reported 60 and 80 kJ/mol on Ru/Al2O3 and Ni/Al2O3, respectively [10].
2.4. Temperature Profiles in the Large Tube Reactor
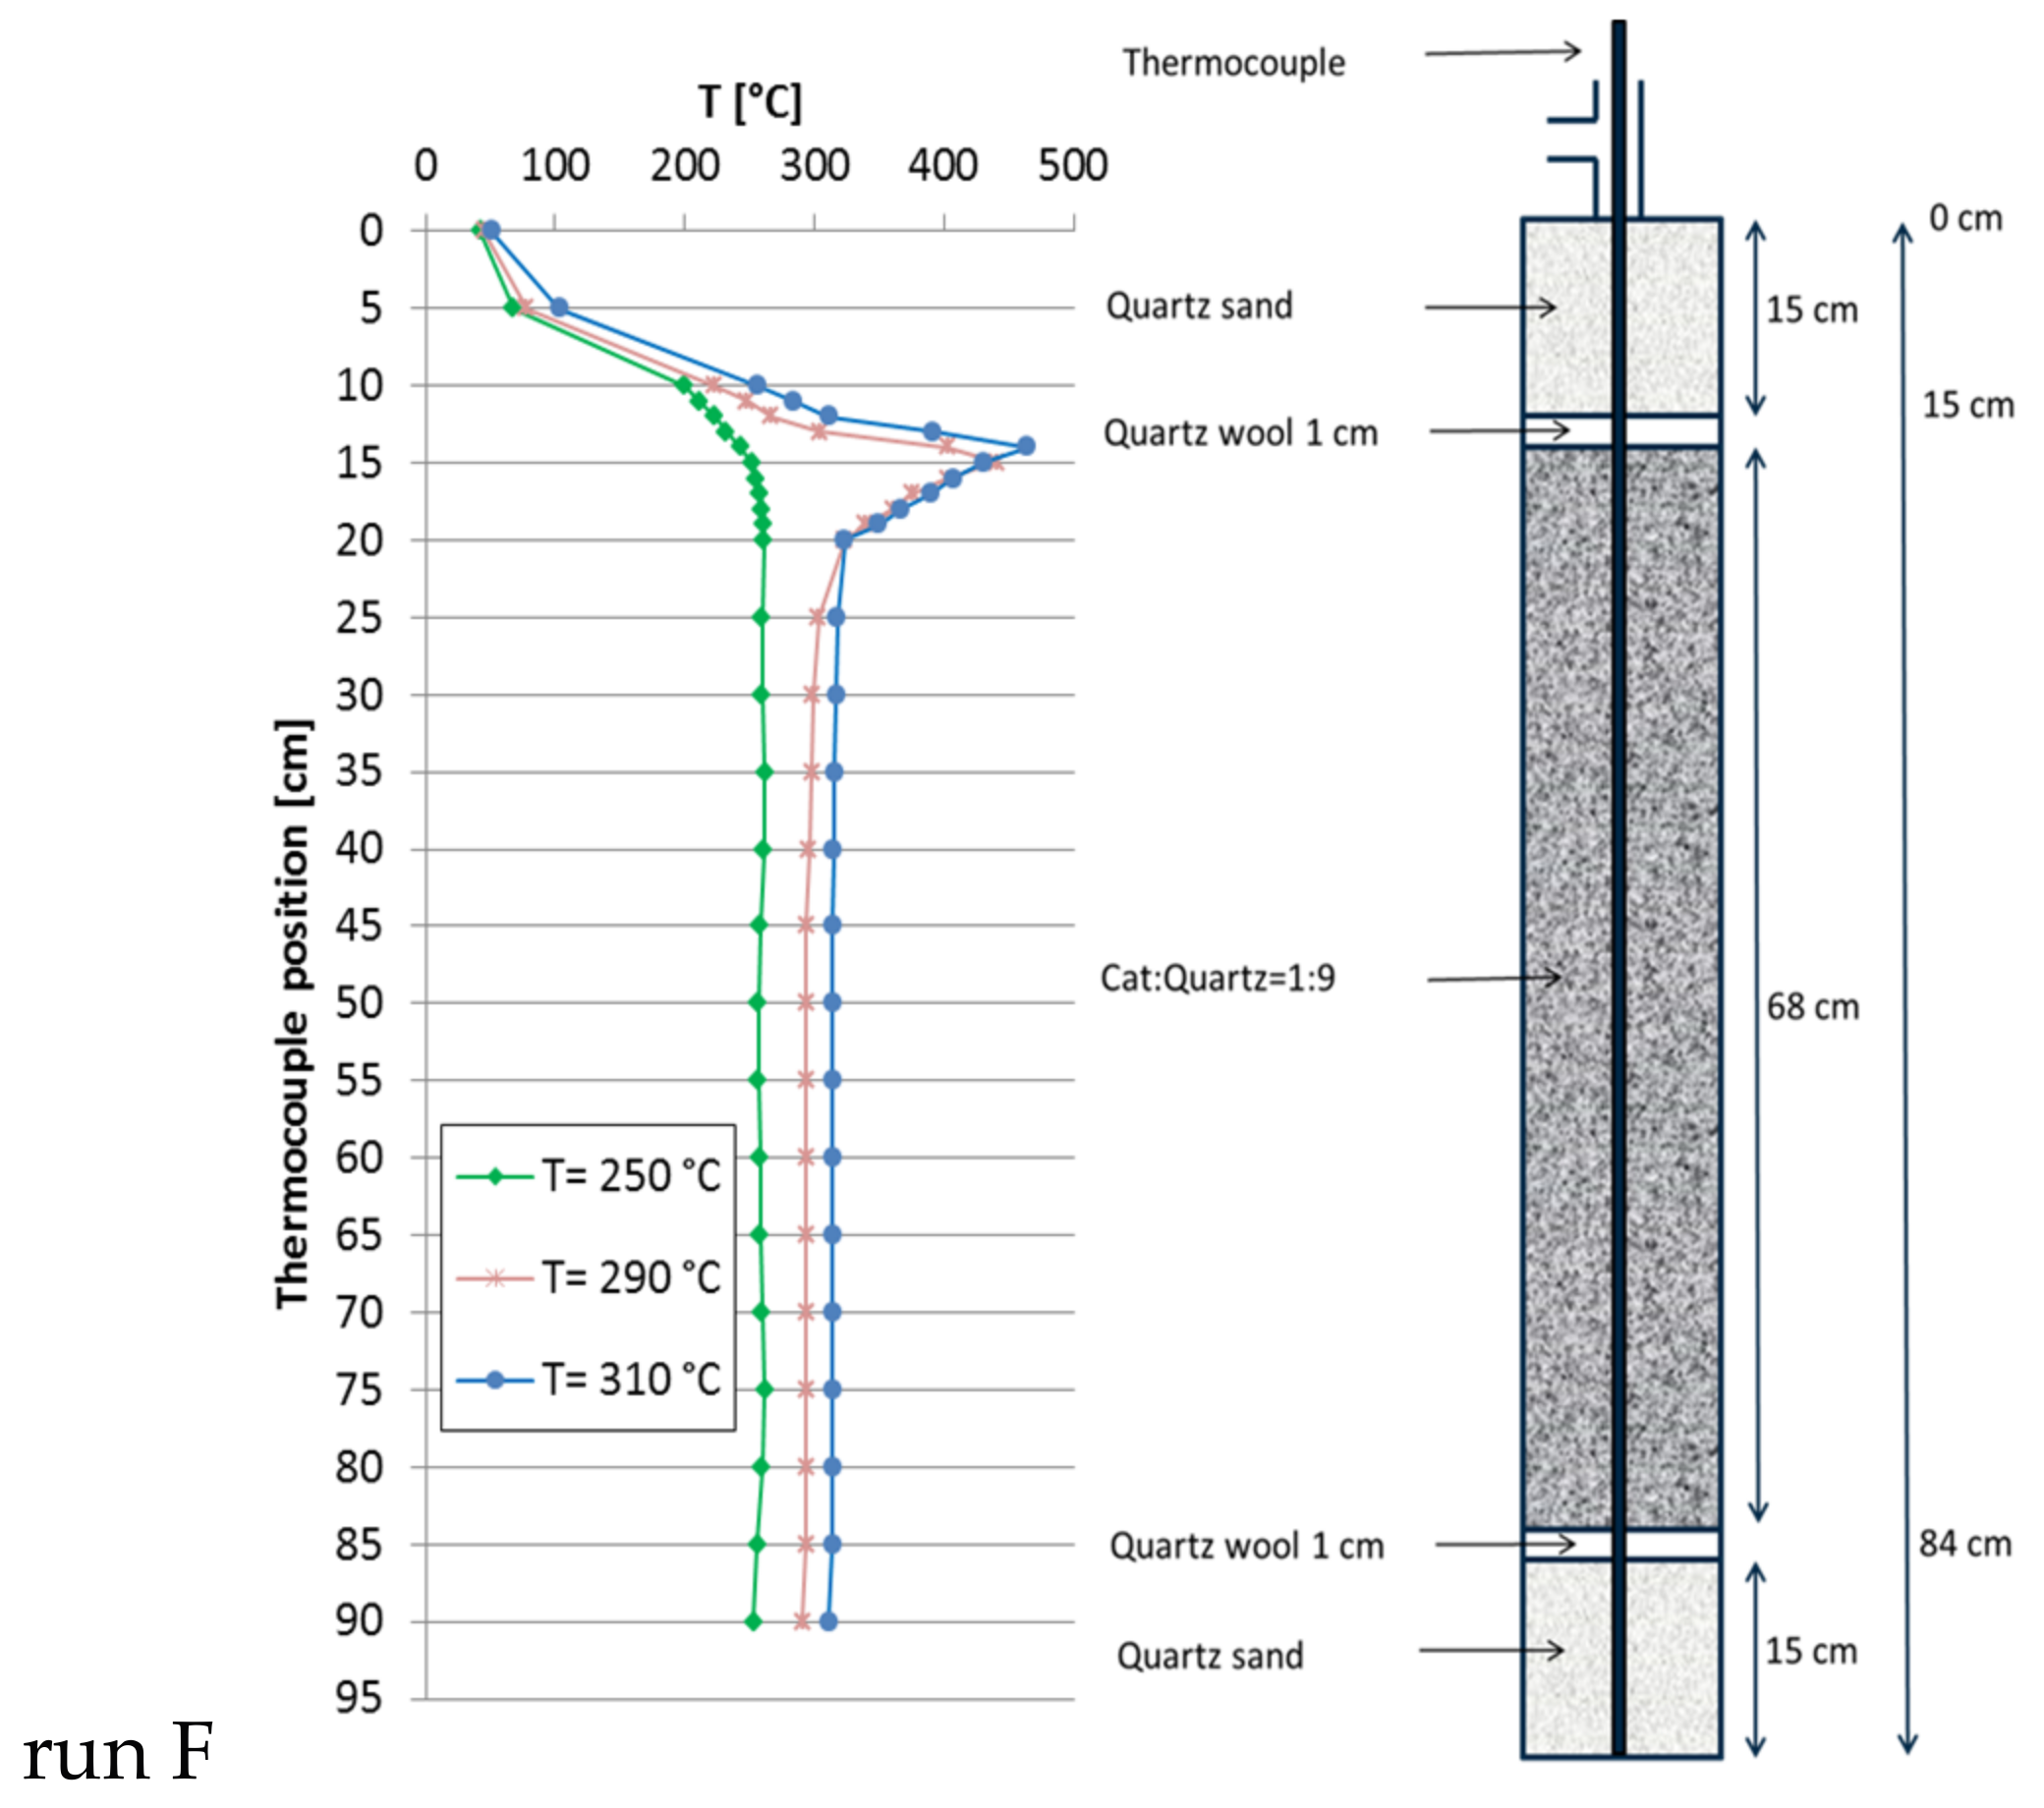
The large reactor was equipped with a double-jacket to circulate liquid heat carrier oil to provide a truly isothermal reactor (without reaction) and to improve heat transfer (dimensions cf. chapter 3). For reference purpose, a single fixed-bed with 1:9 catalyst:quartz dilution (30 mL catalyst, 270 mL quartz) was tested first (run F, Figure 6). At a GHSV of 8000 h−1 (total flow = 244.9 L/h; CO2:H2:N2 = 1.8:7.2:1) the CH4 production at 250 °C set point temperature reached 19 L/h (XCO2 = 43.0%) without any detectable hot spot. At 290 °C the methane production increased to 42 L/h (XCO2 = 96.1%), accompanied by a significant hot spot 160 K above set point temperature. At 310 °C a total of 46 L/h of methane (XCO2 = 96.2%) were formed with almost identical hot spot shape. These more pronounced hot spots are due to the larger reactor diameter and poor radial heat transfer. In view of the fact that, already at a GHSV of 8000 h−1, the hot spot temperature grew that high, no further experiments were done with this single-bed configuration.
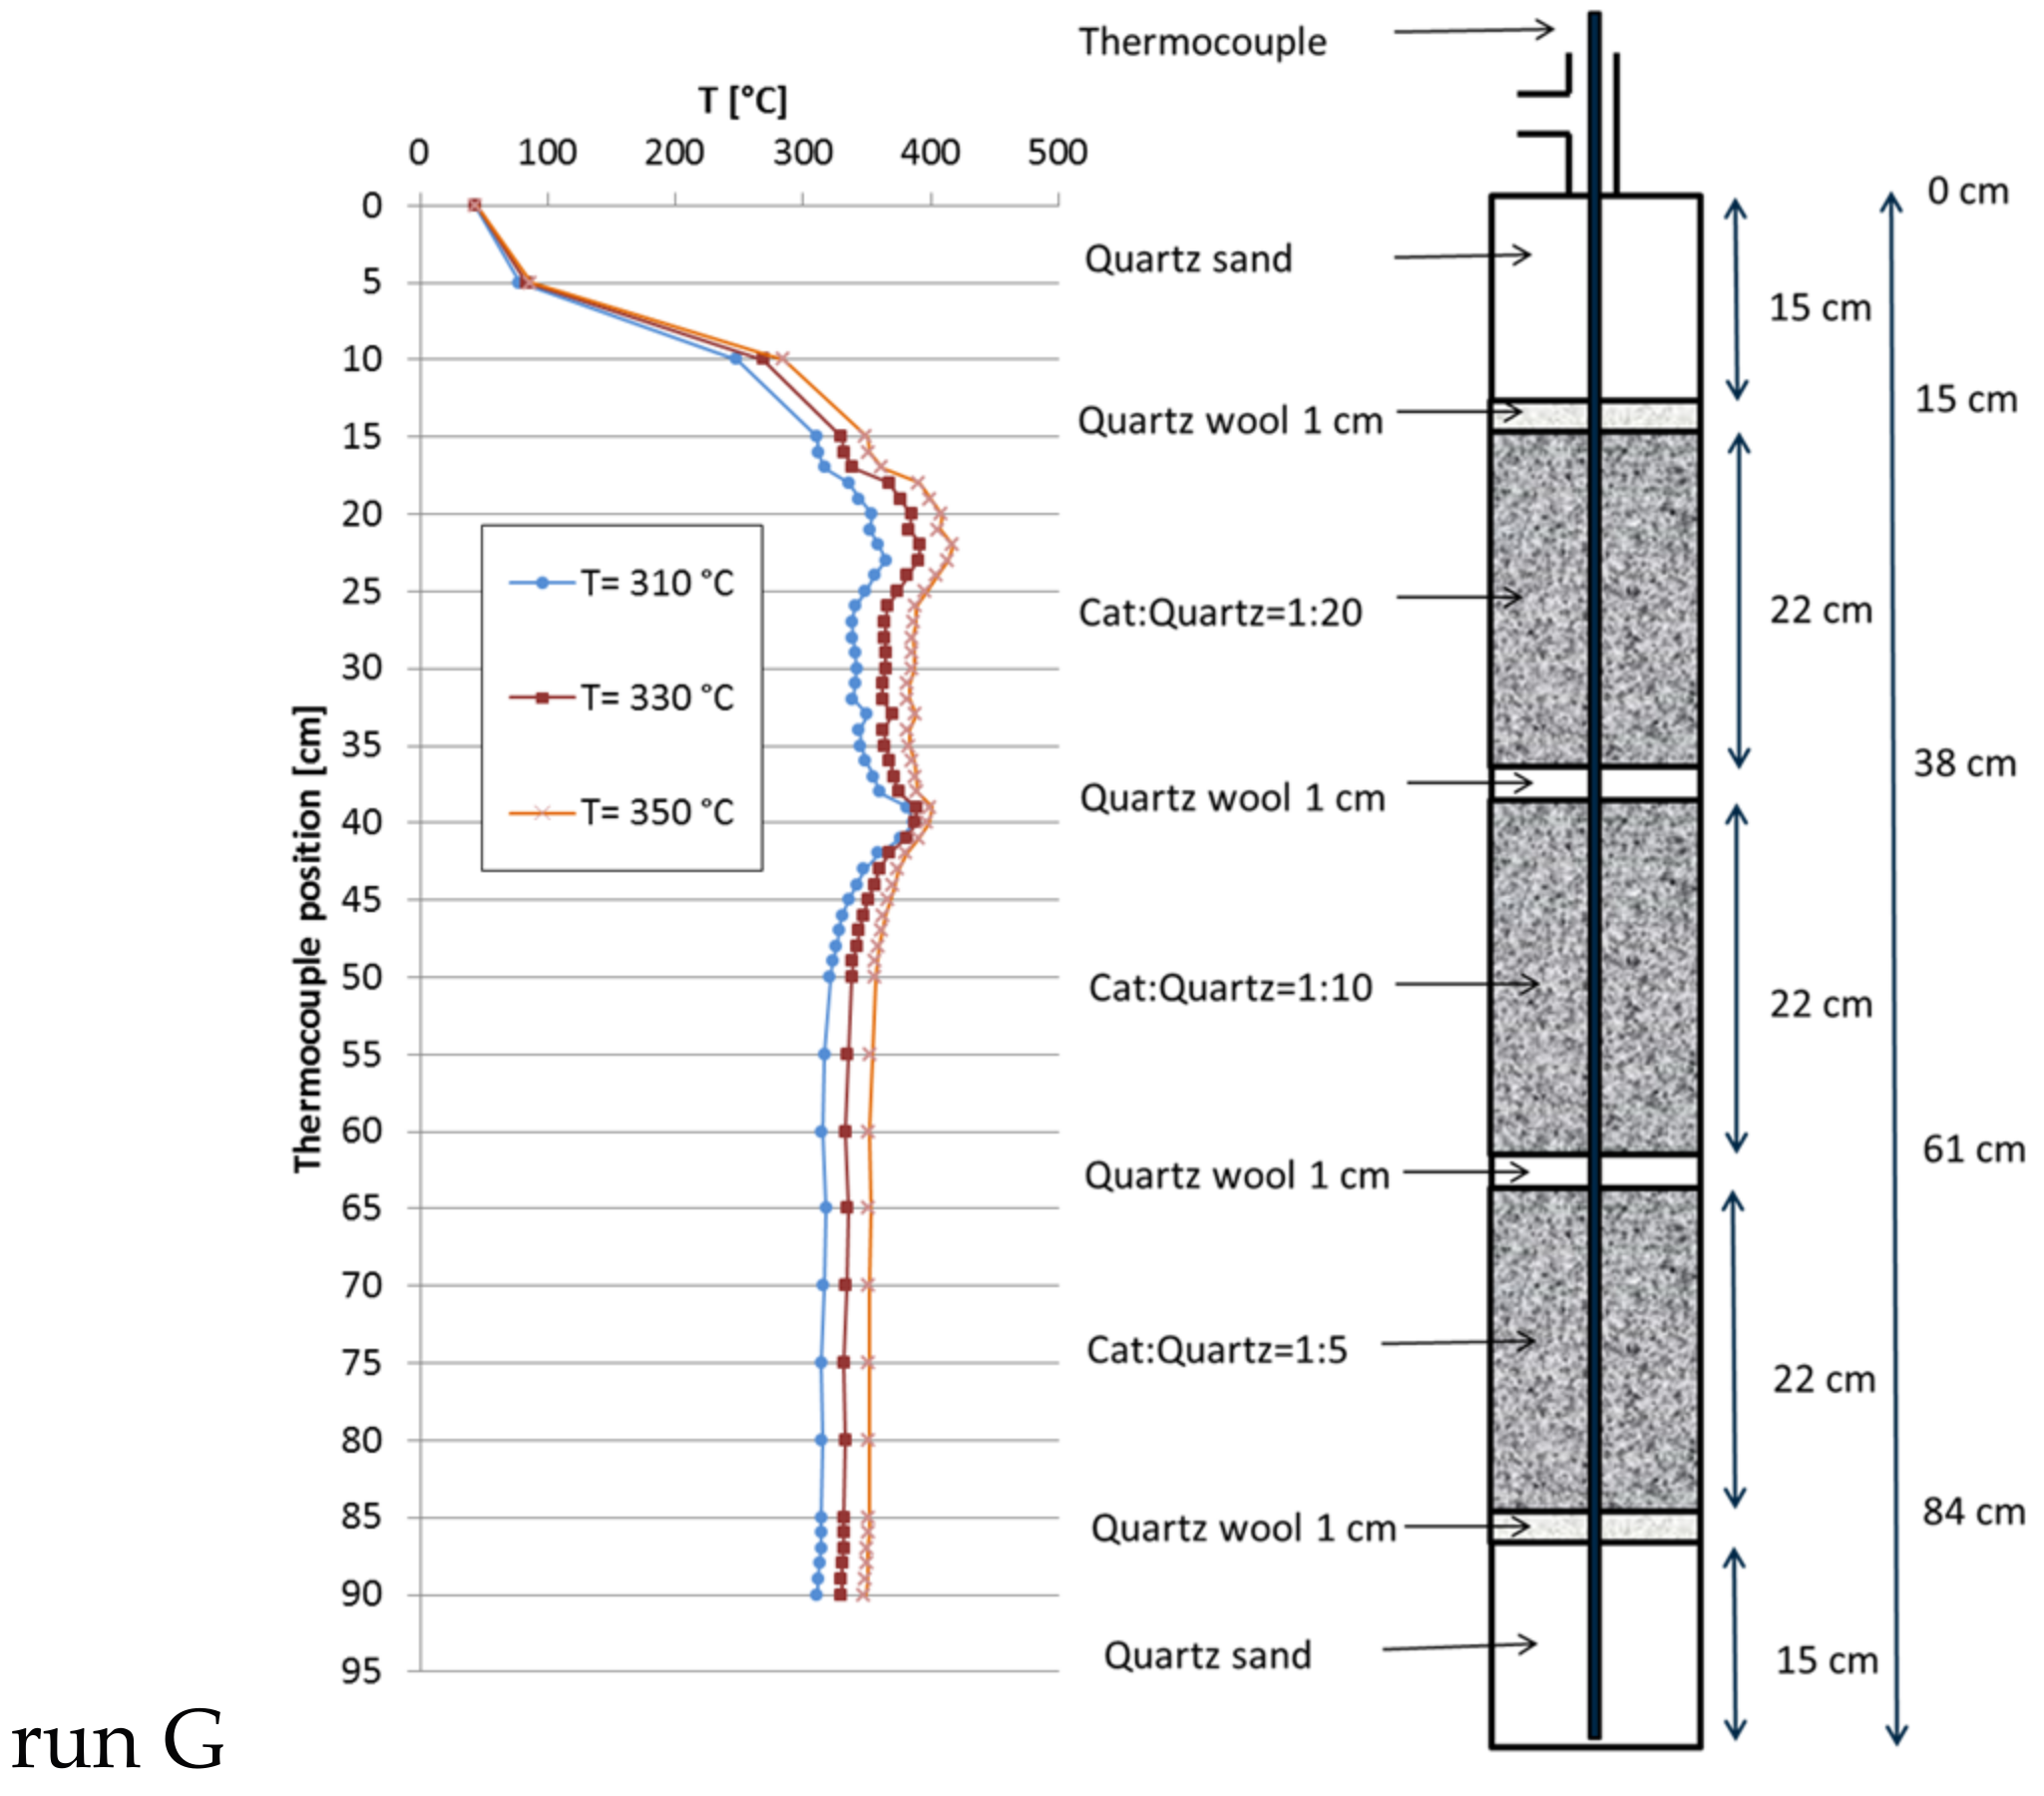
The preferred configuration in the bench-scale reactor consisted of a triple fixed-bed with descending catalyst dilution (run E, Figure 4), because in comparison to run B, the hot spot was only half as high. This scheme was now scaled up with the large reactor. Several catalyst dilutions were tested to modify the heat distribution along the catalyst bed. At the end the compositions given in Figure 7 lead to a satisfactory temperature profile along the tube reactor (run G). The observed height of the hot spot was drastically reduced from 160 K to 62 K compared to the single-bed reactor. This is noteworthy as this remarkable improvement was obtained though the space velocity was elevated to 10,000 h−1 (total flow = 301.6 L/h; CO2:H2:N2 = 1.8:7.2:1) and the methane productivity grew up to 50 L/h together with a proportional increase in total heat of reaction. As run G was the one with the highest gas throughput, the specific pressure drop was estimated by means of Ergun equation to be approximately 10.5 mbar/m. This configuration was tested at three set point temperatures: at 310 °C the overall methane productivity was 50.5 L/h (XCO2 = 93.1%) and the hot spot was 78 K above set point. At 330 °C, the methane productivity reached 50.3 L/h (XCO2 = 92.7%, hot spot + 62 K) and, at 350 °C, the methane flow reached 49.8 L/h (XCO2 = 91.7%, hot spot + 68 K). At all temperatures, the selectivity to CH4 was always above 99.9% (Table 4).
Regarding the results from run G, obtained with triple-bed configuration, it has to be considered that the increased methane formation compared to reference run F is mostly caused by the higher throughput since at the same time CO2 conversion dropped slightly (at 310 °C set point temperature from 96.2% to 93.1%). This is also overlapped by the effect of higher linear flow rate, which affects the shape of the temperature profiles by convective heat transfer. However, the most important result at this stage is an improved hot spot control during methanation at high throughput by stacking various fixed-beds with different catalyst dilutions which leads to saver operation conditions for both catalyst and reactor material.
In addition to discussing catalyst efficiency in terms of conversion and selectivity, the specific methane production per catalyst was used as criterion for comparison of the various reactor configurations (Table 5). For each of the configurations, only the temperature set point with the highest productivity was considered. The runs with the bench-scale reactor in single-bed configuration (runs A–C) show direct proportionality between catalyst amount and reactor productivity, coming along with extreme rise of hot-spot temperatures. Run D with half the catalyst load gives the same reactor productivity as run A but without any hot-spot and doubled catalyst productivity, due to efficient catalyst dilution. Comparison of runs B and E confirms that, at similar GHSV, temperature and catalyst load but appropriate bed structure, the hot spot can be reduced from 40 to 20 K at comparable productivity.
Run F with the large reactor can be seen as equivalent to run D with a catalyst dilution of 1:9 in a single-bed as well. By dividing the bed into three parts with descending dilution (run G), the productivity and STY is increased compared to reference run F whereas the hot spot is drastically lowered by approximately 100 K. This indicates that the concept is successfully adapted to the larger scale although the relative gain in productivity is lower than at bench-scale.
2.5. Catalyst Stability
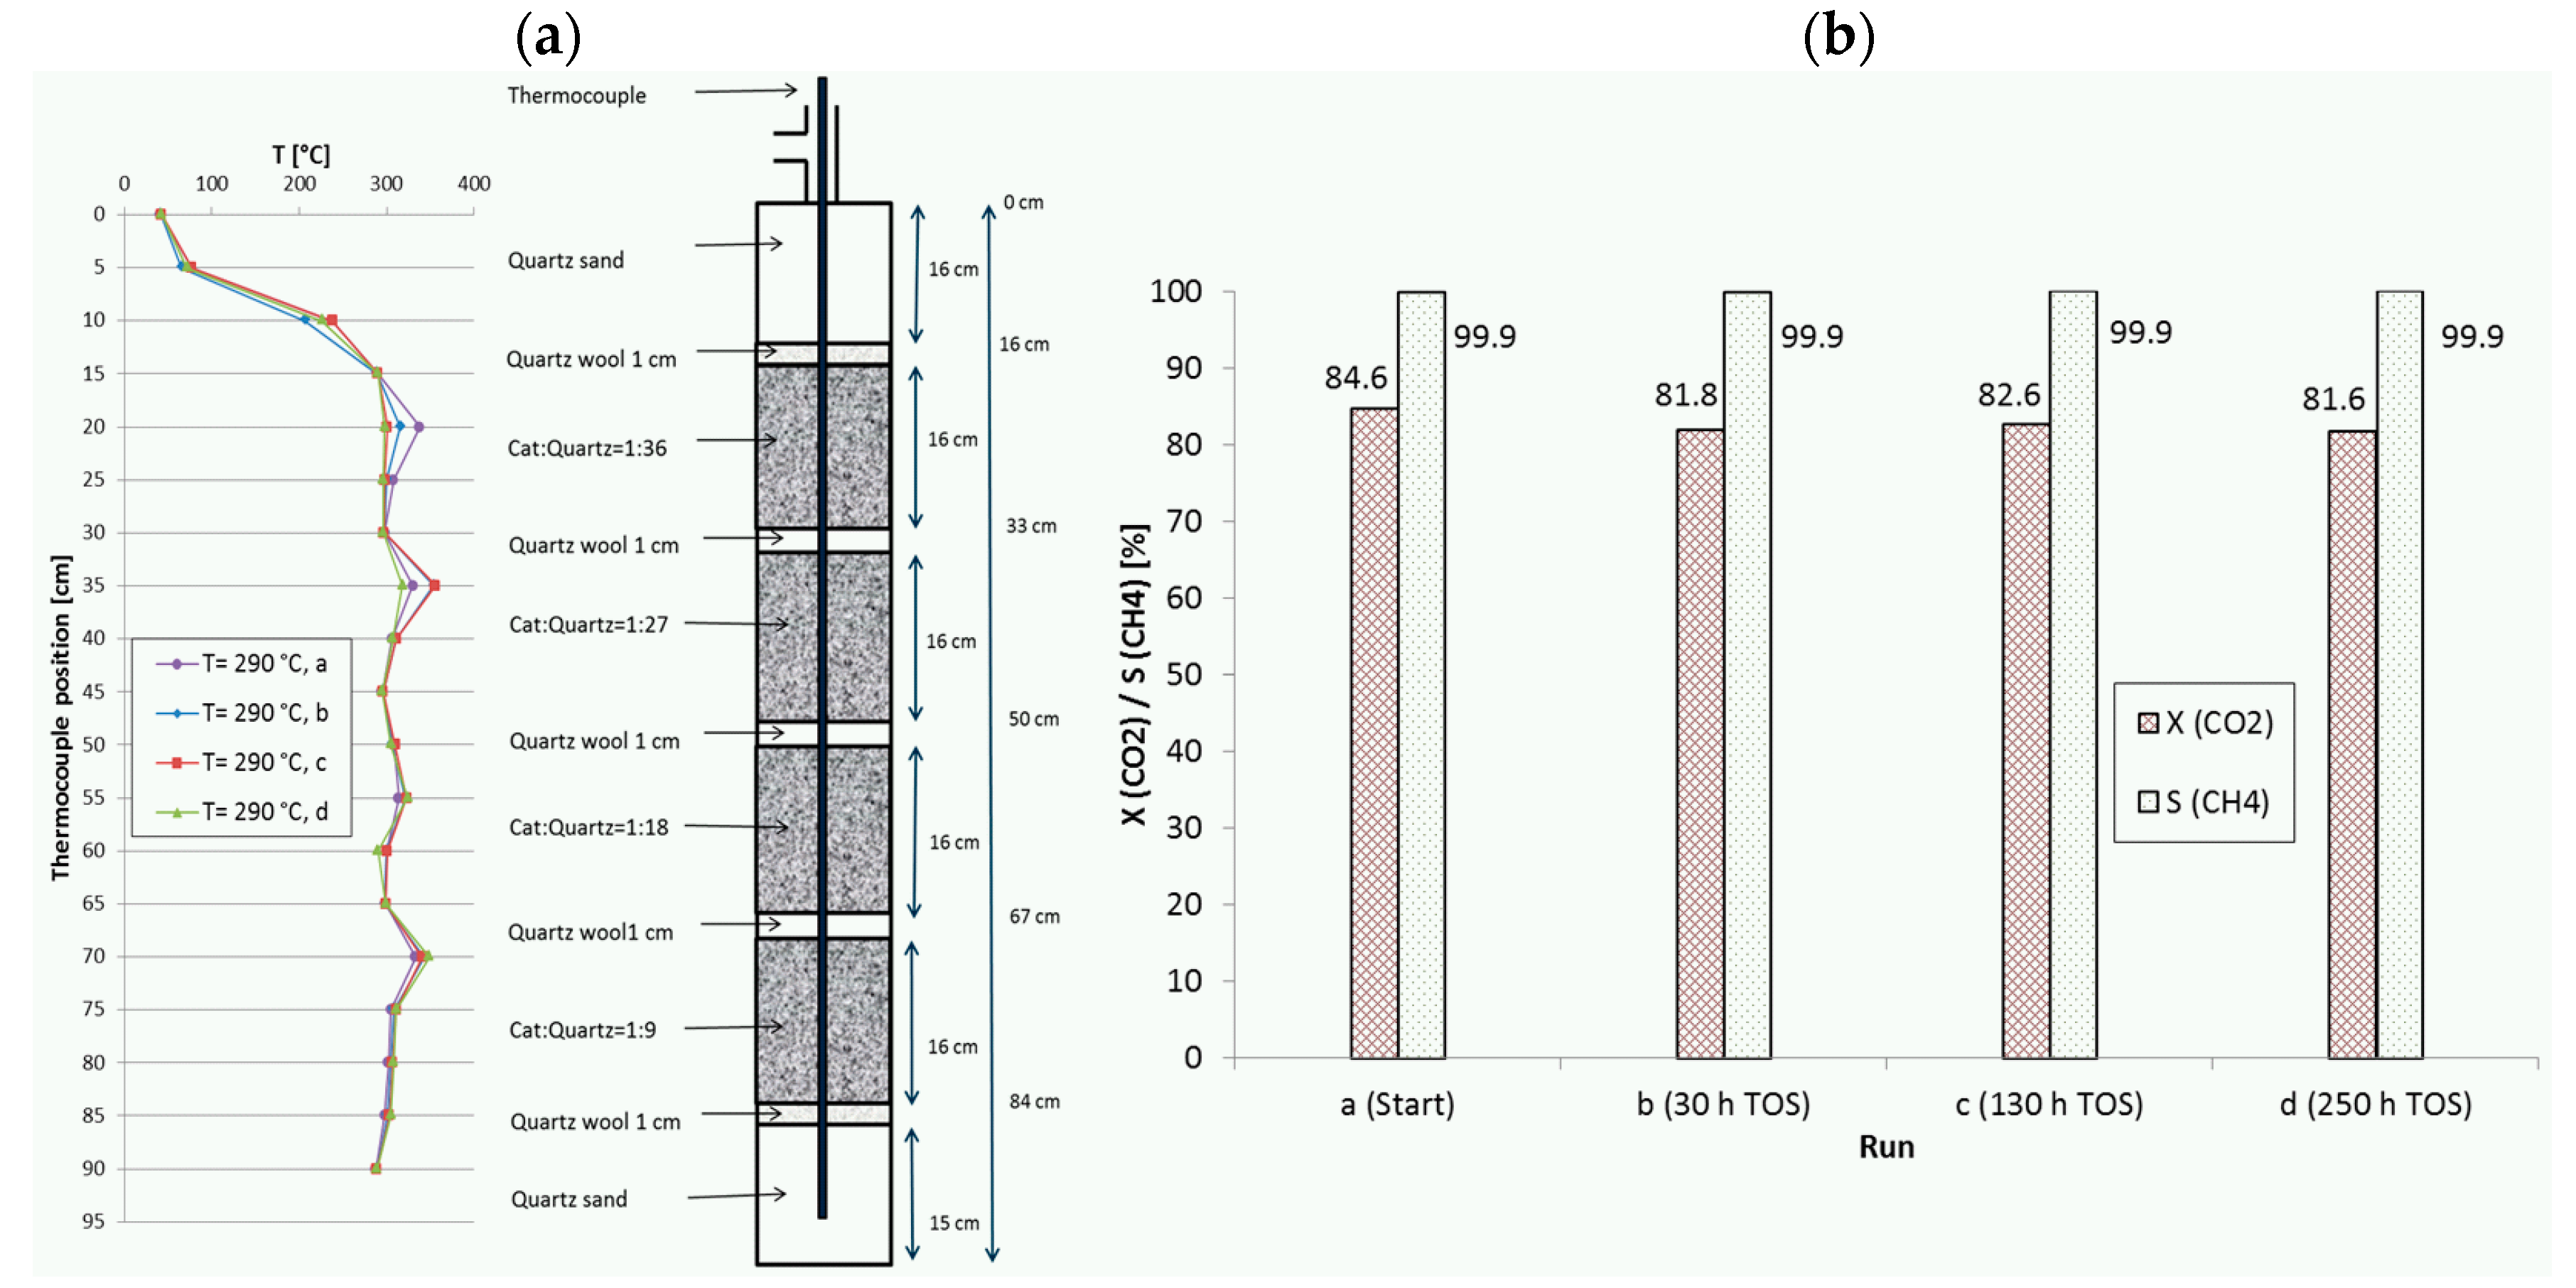
During extended studies of certain reactor configurations, the catalyst stability was checked routinely by repeating the first set point of the measurement campaign. Since not all configurations were tested on the same elongated time scale, only those configurations with a very long time on stream will be highlighted here. Figure 8 shows such a stability control series for a configuration with four fixed beds (run H, with descending catalyst dilution) together with the corresponding temperature profiles recorded at 290 °C set point temperature. The test campaign included intermediate changes in temperature (including repeated shut down and reactivation from room temperature to 350 °C), space velocity (10,000–20,000 h−1) and pressure (5–15 bar). Thus, the catalyst was also exposed to more severe reaction conditions as described before. Measurement “a” was performed directly after the in situ activation of the catalyst at the campaign start, “b” after 30 h TOS, “c” after 130 h and “d” after 250 h. CO2 conversion decreased within the first 30 h and was later nearly constant over 220 h. The temperature profiles reveal that the hot spot in the first fixed-bed seems to have wandered slightly downwards, whereas the other three fixed-beds did not change. Maximum temperatures were 338 °C, 356 °C, 324 °C and 349 °C from first to last bed.
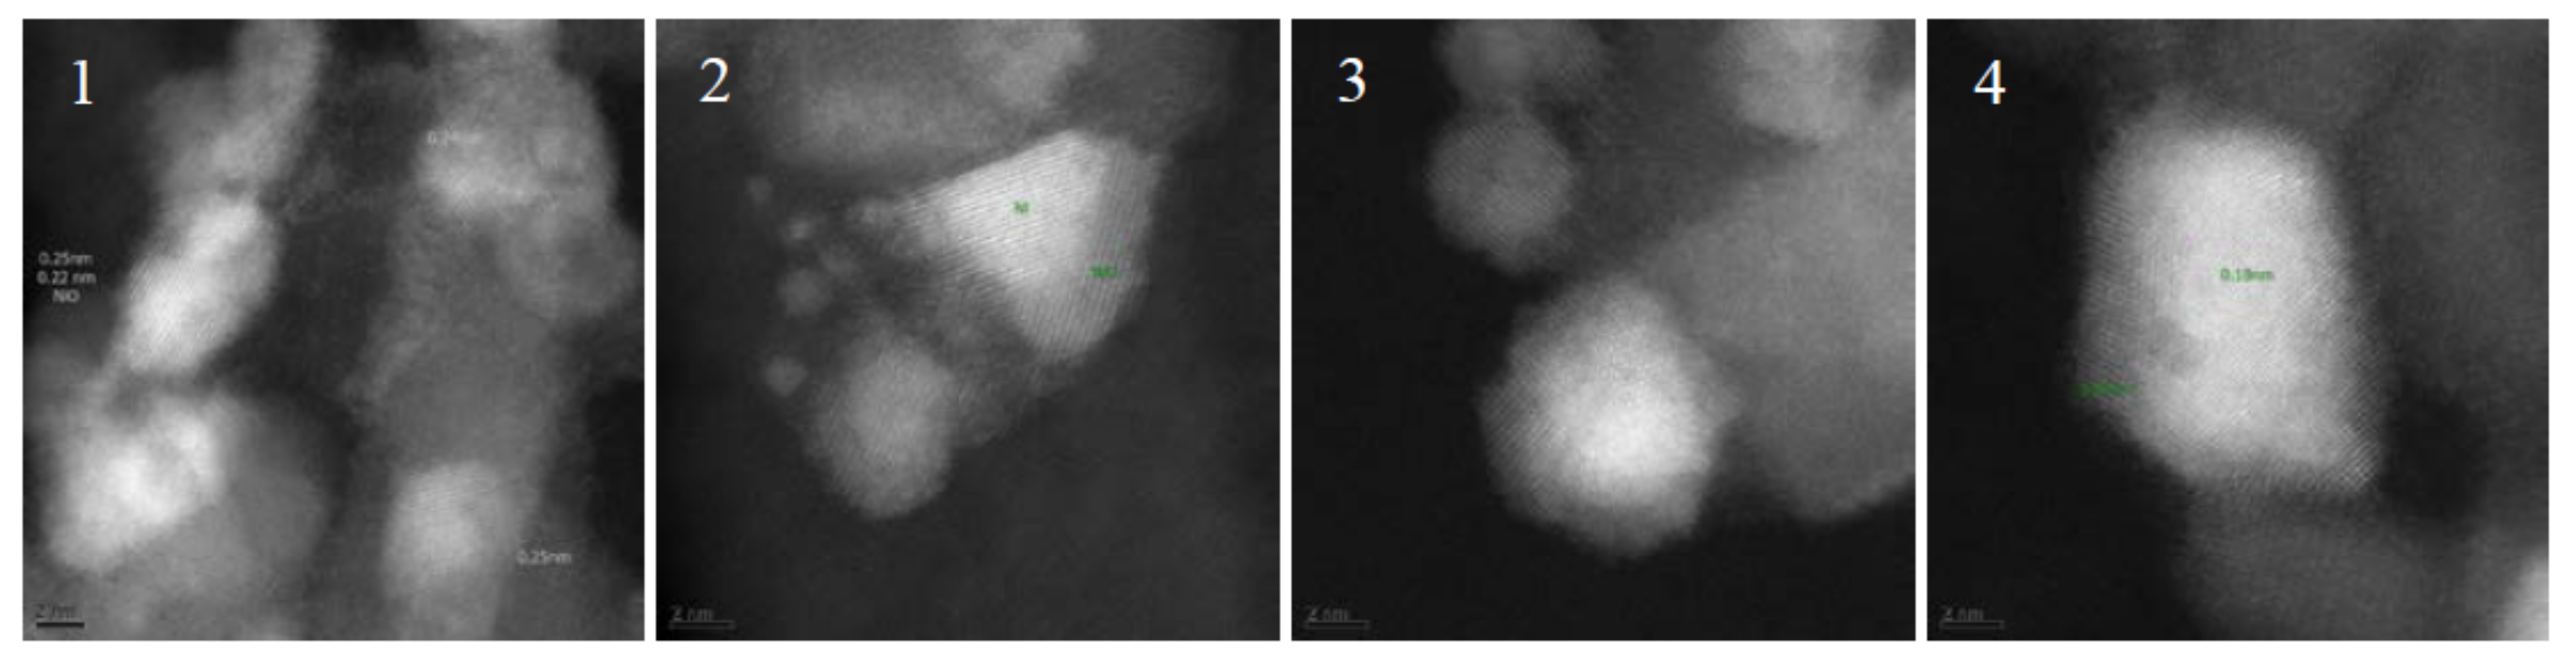
Results from TEM imaging after long term testing (run H) showed no deposits on the catalyst (Figure 9) but Ni coated in NiO, which is proven by the measured lattice distances of 0.25 and 0.18 nm. The area of the catalyst surface was investigated with BET method and revealed a minor loss from 125 to 120 m2/g.
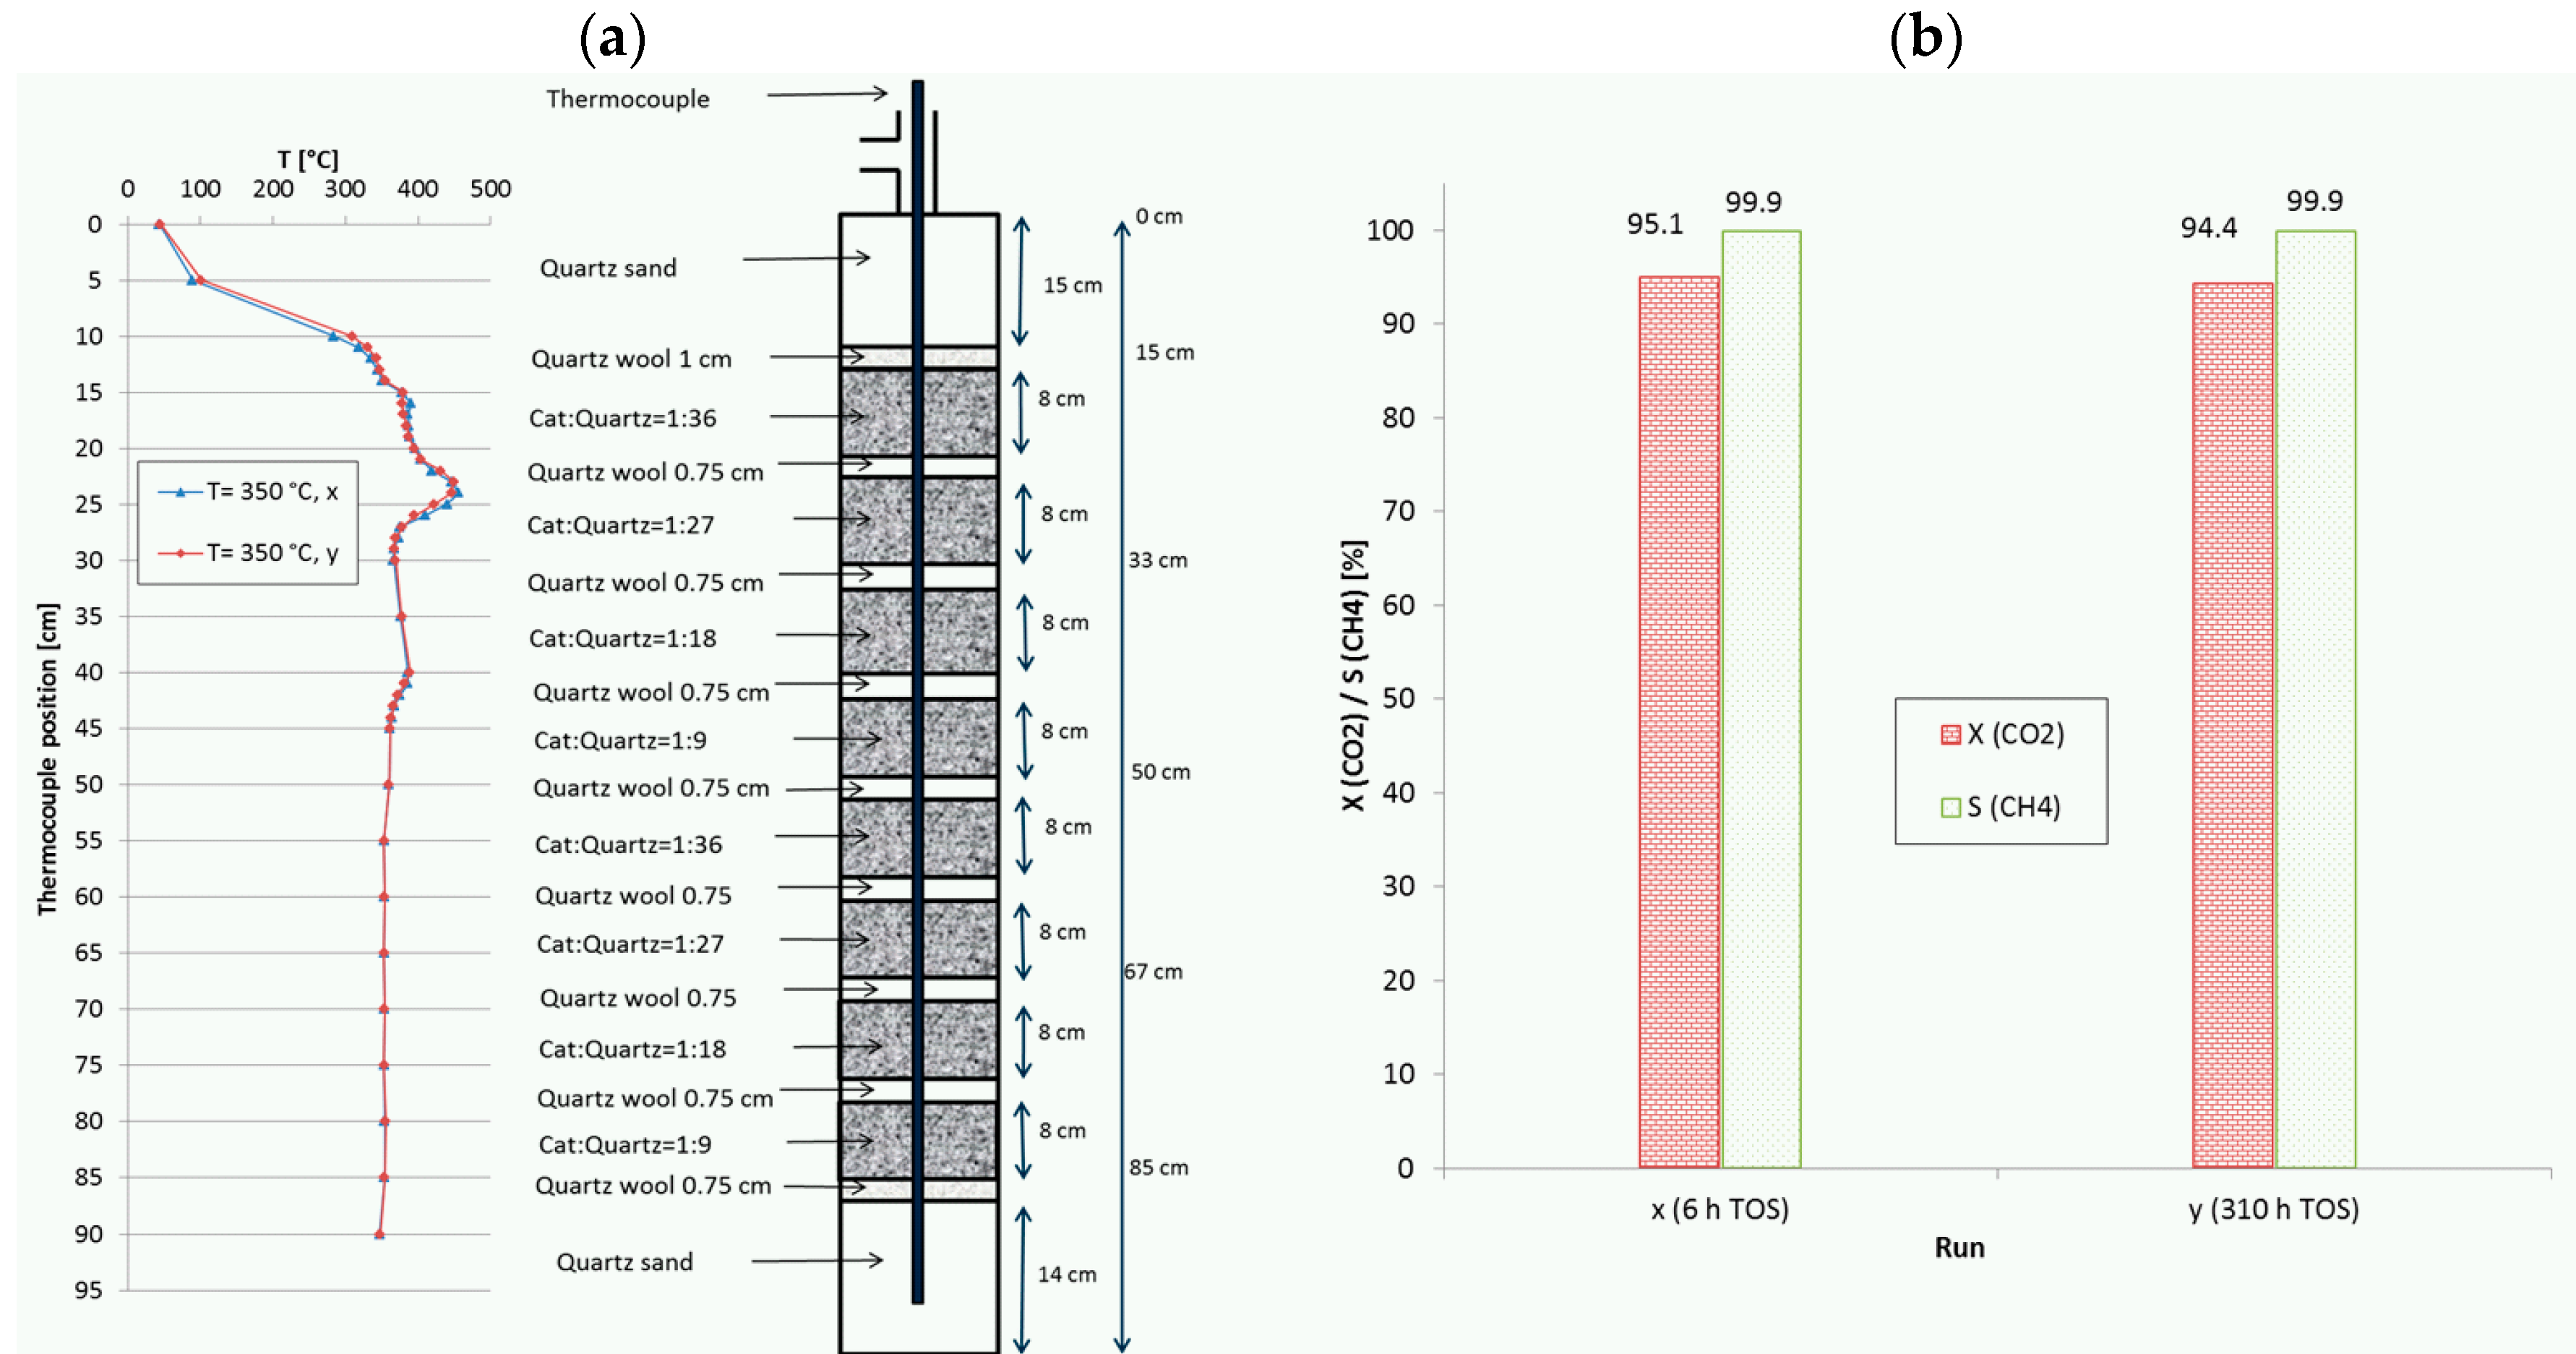
Another, even more complex example, denoted as run I, is given in Figure 10, where two equal stacks of four fixed-beds with descending catalyst dilution similar to run H (Figure 8) were combined. With this configuration (8 beds), the initial CO2 conversion at a remarkably high GHSV of 20,000 h−1 was increased from 84.6% (4 beds) to 95.1%. The set point temperature was 350 °C and the total TOS was more than 310 h. In this case the CO2 conversion remained nearly constant and the methane selectivity stayed above 99.9%. At the same time, the temperature profiles were almost identical, i.e., no shift of hot spots was observed. The maximum measured temperatures reached values of 456 °C and 389 °C. Similar to run H, the test campaign included changes in temperature (repeated shutdown and reactivation to 350 °C), space velocity (10,000–20,000 h−1) and pressure (5 bar to 15 bar). However, such gain in activity and productivity is only possible with higher complexity of reactor configuration. These two last runs illustrate the potential of appropriate catalyst bed arrangement to improve the reactor performance as well as to reduce the permanent stress and to slow down deactivation.
3. Materials and Methods
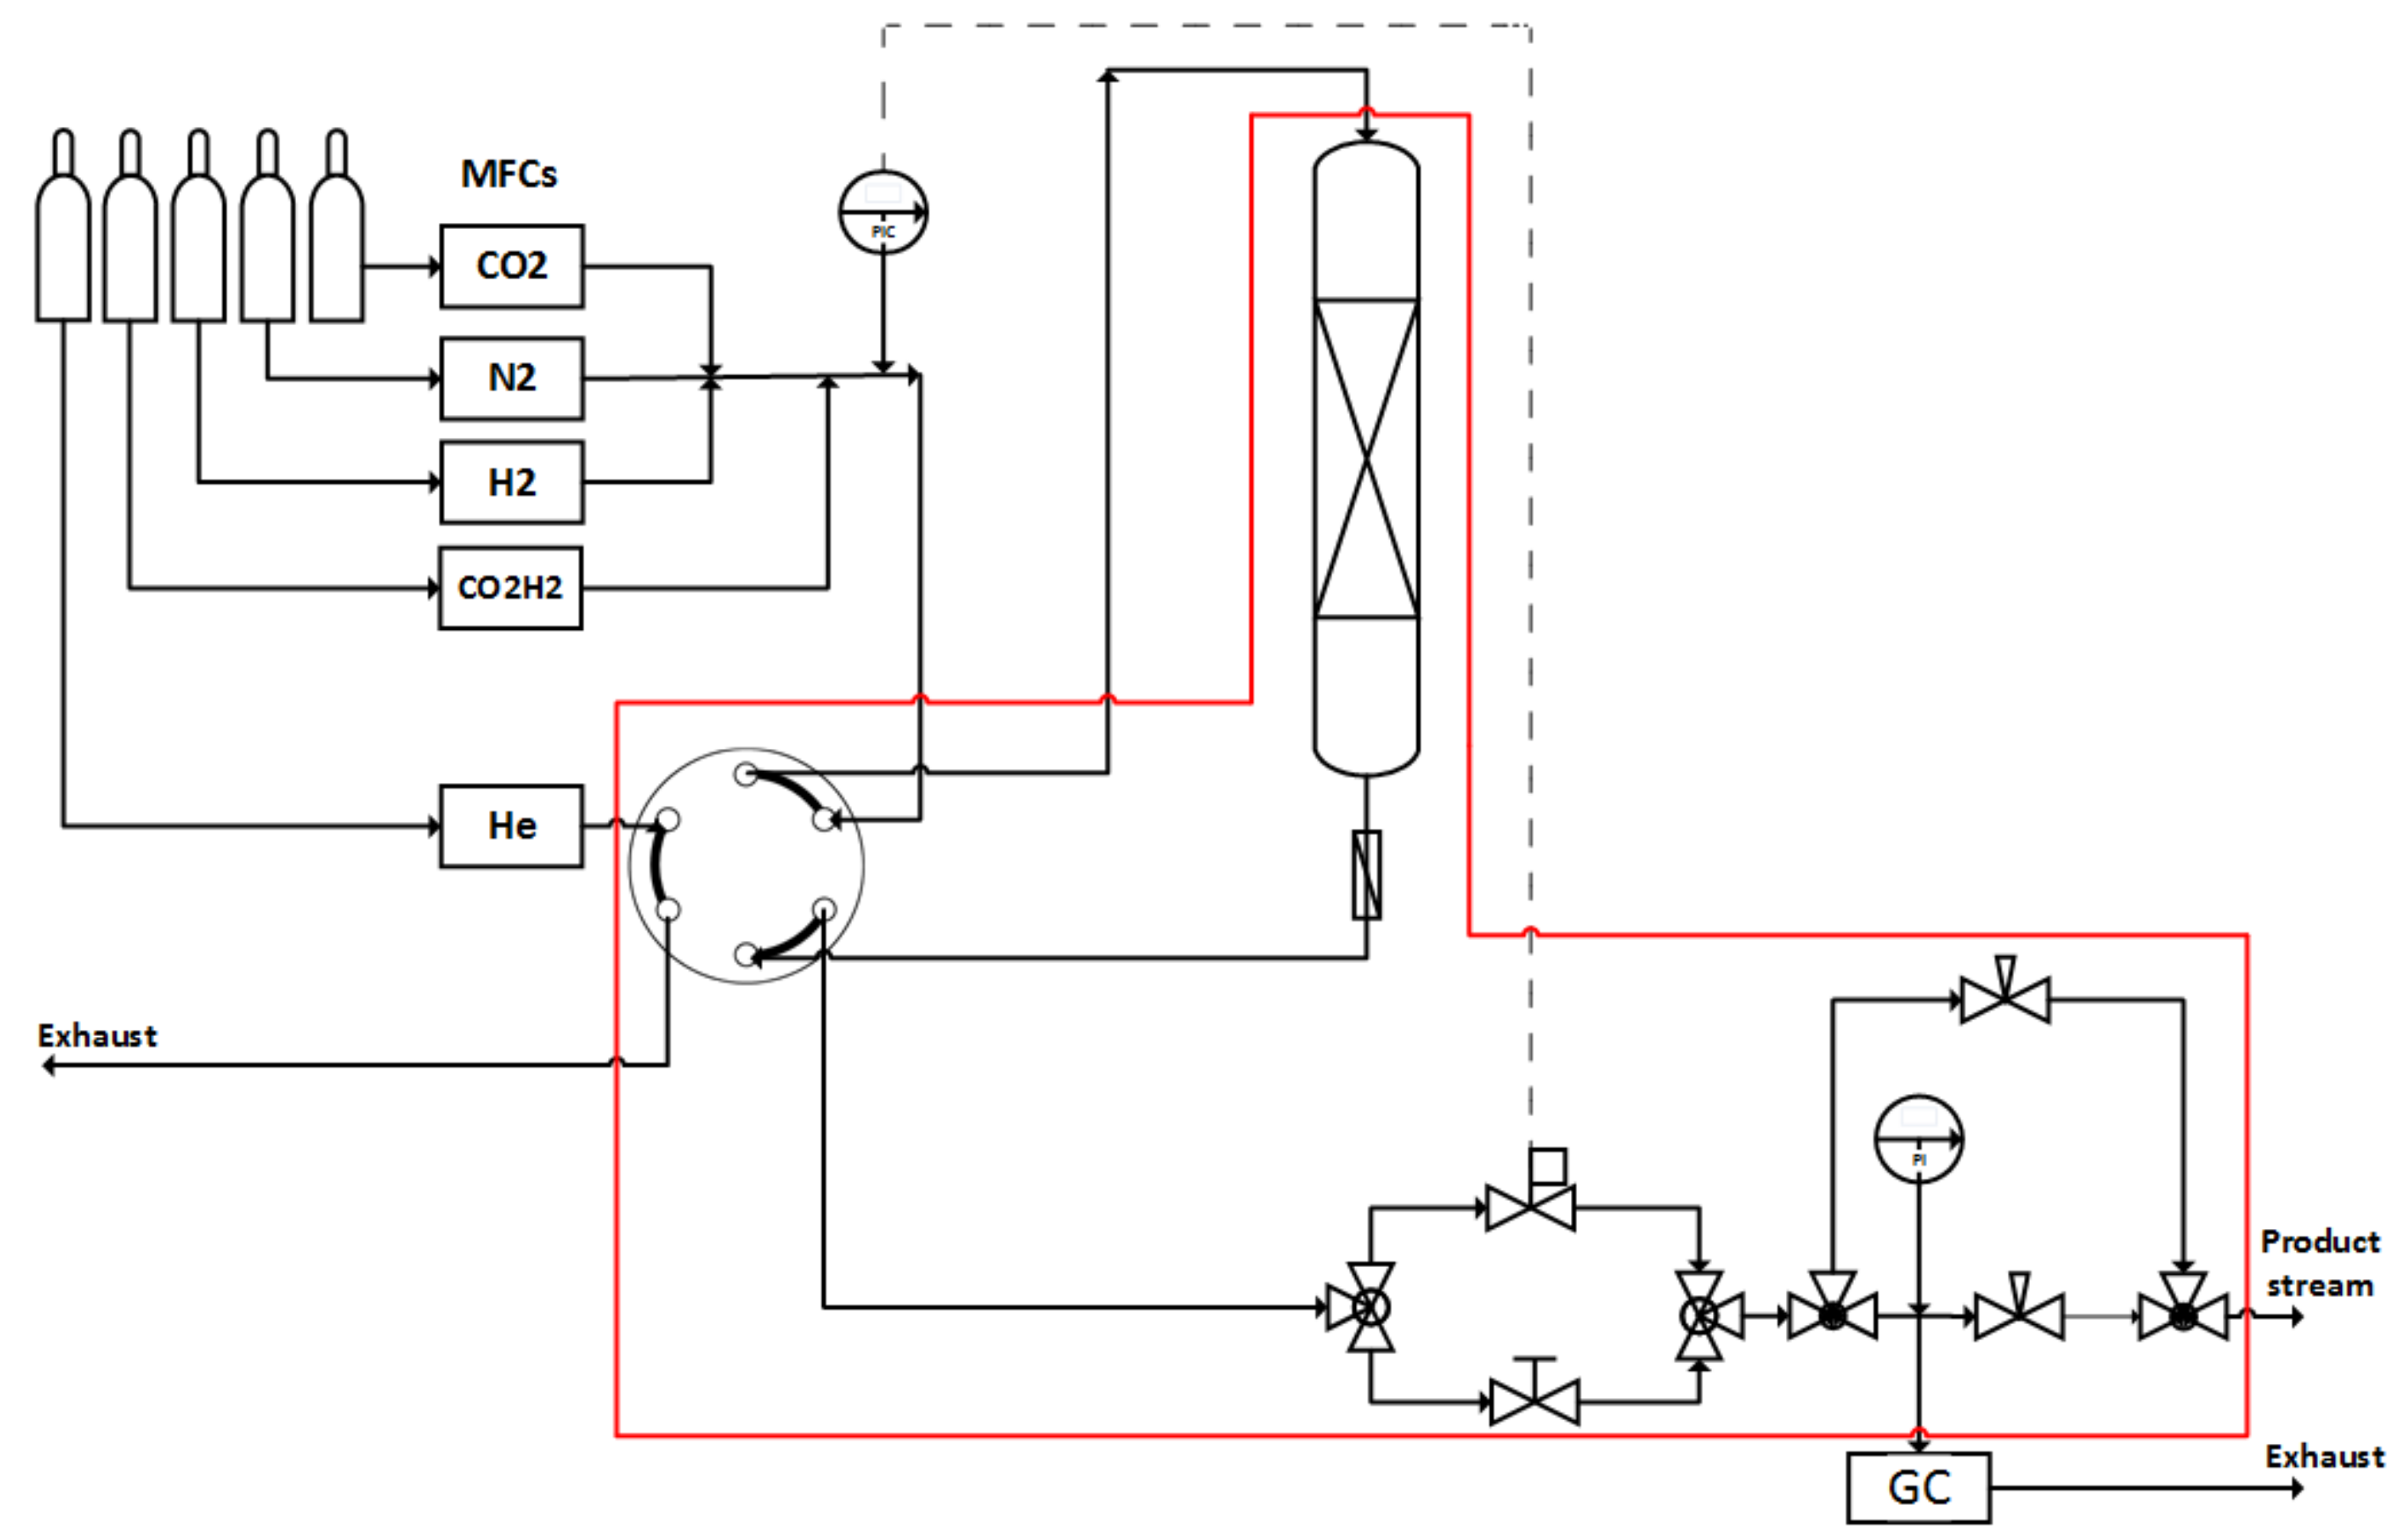
Two stainless steel tubes ((a) L = 276 mm, ID = 7.6 mm, V = 12.5 cm3 denoted as bench-scale reactor and (b) L = 1000 mm, ID = 24.8 mm, V = 483 cm3 for upscaling experiments) served as reactors for the catalyst screening. The small tube was heated with an isolated electrical heating cord, the big one with heat carrier oil in the heating jacked. Temperature profiles were recorded in both reactors through stepwise movement of a thermocouple in a guiding tube which was centered in the reactor. The difference between measured and set point temperature is denoted as hot spot in Kelvin. Both reactors can be mounted alternatively into the same test rig which allowed comparison of results with minimum uncertainty. A scheme of the laboratory test rig shows Figure 11.
Ni/Al2O3 catalyst (commercial catalyst with 18 wt % Ni on alumina; original size: 2.5 mm × 3–5 mm extruded pellets) was used for all catalytic runs with respect to temperature profile recording. The catalyst particles were crushed and sieved, and a fraction of 500–800 µm was used for the screenings in the bench-scale reactor while the original particle size was kept in the large reactor. For advantageous flow conditions and the prevention of channeling a reactor diameter to particle size ratio of 10 was chosen for both set ups as recommended in [34]. Quartz split of same size was used for catalyst dilution. Before catalytic tests, the catalyst was in-situ activated in flowing hydrogen. Feed gas flow was metered by MFCs and the pressure was controlled with an electrically driven needle valve. All flow rates and GHSV data given in this study are referred to STP conditions (0 °C, 1 bar). The downstream pipes and valves were located in a heated oven box (180 °C) to avoid water condensation. Gas analytics were done with an on line-gas chromatograph (HP5890 II) which contained two lines with argon as carrier gas. Columns: HP Plot Q (30 m × 0.53 mm × 40 µm, for CO2, CO, CH4) and HP-Plot molecular sieve (30 m × 0.53 mm × 50 µm, for N2 and H2). Detection was done by FID and TCD respectively. Most of the runs reported here were carried out under the following conditions: T = 250–400 °C (set point temperature), p = 10 bar, GHSV = 6000–20,000 h−1, CO2:H2 = 1:4. In addition, N2 (10 vol %) was always present as internal standard to evaluate volume contraction during reaction. Each set point was held for at least two hours and at least 5 chromatograms were recorded at stationary operation conditions.
Carbon dioxide conversion (XCO2) and methane selectivity (SCH4) were determined from mole streams () and stoichiometric coefficients (ν) as follows:
4. Conclusions
While exothermicity plays no big role in the conversion of low amounts of CO2, production of SNG at industrial scale has to face this issue. In this study, we scaled up previously reported tests with a commercial alumina supported nickel catalyst (18 wt % load) from bench-scale to technically relevant reactor diameter, as used, e.g., in tube bundle reactors. Already, the appropriate arrangement of several fixed-beds combined with variable catalyst dilution in each bed allows significant lowering of hot-spot temperatures inside the reactor by nearly 100 K. This comparatively simple measure also shows potential to increase the specific productivity of the catalyst at the same time, as the catalyst can operate at thermodynamically more favored conditions.
Furthermore, some long-term campaigns aiming at stressing the catalyst (higher set point temperature, change of load, pressure variation) evidenced that the initial activity of the catalyst is much better preserved with such a smart catalyst distribution. A minor loss in surface area was observed over 250 h TOS, but catalyst deactivation was negligible. Finally, a production rate of 50 L/h SNG (500 Wel) was reached while the temperature hot-spot did not exceed 62 K. At these settings, specific methane productivity of the catalyst could be improved to 1.7 L/(mLcat × h).
The reported results fulfill specified requirements to implement methanation for energy storage purpose in a small decentralized unit and are currently being developed to application by a small enterprise. Apart from the achieved state, further studies will focus on modeling of the up-scaled reactor with regard to optimization of the heat management.
Acknowledgments
The authors thank M.-M. Pohl and C. Kreyenschulte for TEM studies and D. Linke for model calculation. Financial support by LIKAT, Federal state of Mecklenburg-Western Pomerania and European Regional Development Fund (V-630-S-152-2012/141) is gratefully acknowledged.
Author Contributions
D.T., U.A., H.M. and A.M. conceived and designed the experiments; D.T. and H.M. performed the experiments; D.T., H.M. and U.A. analyzed the data; and D.T., U.A. and A.M. wrote the paper.
Conflicts of Interest
The authors declare no conflict of interest.
References
- German Government on the Change of Energy Supply. Available online: https://www.bundesregierung.de/Content/DE/tatischeSeiten/Breg/Energiekonzept/0-Buehne/ma%C3%9Fnahmen-im-ueberblick.html (accessed on 1 March 2017).
- BP Statistical Review of World Energy, June 2016. Available online: http://www.bp.com/content/dam/bp/pdf/energy-economics/statistical-review-2016/bp-statistical-review-of-world-energy-2016-full-report.pdf (accessed on 1 March 2017).
- Bundesministerium für Wirtschaft und Energie (BMWI), Federal Ministry of Economics and Energy, Germany. Dossier Erneuerbare Energien. Available online: https://www.bmwi.de/Redaktion/DE/Dossier/erneuerbare-energien.html (accessed on 1 March 2017).
- Eurostat Statistics Explained. Available online: http://ec.europa.eu/eurostat/statistics-explained/index.php/Energy_production_and_imports/de (accessed on 1 March 2017).
- Bajohr, S.; Götz, M.; Graf, F.; Ortloff, F. Speicherung von regenerativ erzeugter elektrischer Energie in der Erdgasinfrastruktur. Gwf-Gas Erdgas 2011, 152, 200–210. [Google Scholar]
- Valentin, F.; von Bredow, H. Power-to-Gas: Rechtlicher Rahmen für Wasserstoff und synthetisches Gas aus erneuerbaren Energien. Energiewirtschaftliche Tagesfragen 2011, 61, 99–105. [Google Scholar]
- Sabatier, P.; Senderens, J.B. Nouvelles syntheses du methane. C. R. Acad. Sci. 1902, 134, 514–516. [Google Scholar]
- Sabatier, P.; Senderens, J.B. Hydrogénation directe des oxydes du carbone en présence de divers métaux divisés. C. R. Acad. Sci. 1902, 134, 689–691. [Google Scholar]
- Nørskov, J.K.; Bligaard, T.; Hvolbæk, B.; Abild-Pedersen, F.; Chorkendorff, I.; Christensen, C.H. The nature of the active site in heterogeneous metal catalysis. Chem. Soc. Rev. 2008, 37, 2163–2171. [Google Scholar] [CrossRef] [PubMed]
- Garbarino, G.; Bellotti, D.; Riani, P.; Magistri, L.; Busca, G. Methanation of carbon dioxide on Ru/Al2O3 and Ni/Al2O3 catalysts at atmospheric pressure: Catalysts activation, behavior and stability. Int. J. Hydrog. Energy 2015, 40, 9171–9182. [Google Scholar] [CrossRef]
- Peebles, D.E.; Goodman, D.W.; White, J.M. Methanation of carbon dioxide on nickel(100) and the effects of surface modifiers. J. Phys. Chem. 1983, 27, 4378–4387. [Google Scholar] [CrossRef]
- Wang, W.; Gong, J. Methanation of carbon dioxide: an overview. Front. Chem. Sci. Eng. 2011, 5, 2–10. [Google Scholar]
- Van der Laan, G.P.; Beenackers, A.A.C.M. Kinetics and Selectivity of the Fischer-Tropsch Synthesis: A Literature Review. Catal. Rev. Sci. Eng. 1999, 41, 255–318. [Google Scholar] [CrossRef]
- Yang, J.; Ma, W.; Chen, D.; Holmen, A.; Davis, B.H. Fischer-Tropsch synthesis: A review of the effect of CO conversion on methane selectivity. Appl. Catal. A Gen. 2014, 470, 250–260. [Google Scholar] [CrossRef]
- Renewable Energy Concepts. Available online: http://www.renewable-energy-concepts.com/german/bioenergie/biogas-basiswissen/biogaszusammensetzung.html (accessed on 1 March 2017).
- European Biogas Association. EBA Biomethane & Biogas Report 2015. Available online: http://european-biogas.eu/2015/12/16/biogasreport2015/ (accessed on 2 March 2017).
- Fachverband Biogas e.V. Available online: http://www.biogas.org/edcom/webfvb.nsf/id/DE-Zahlen-und-Fakten (accessed on 2 March 2016).
- Mills, G.A.; Steffgen, F.W. Catalytic methanation. Catal. Rev. Sci. Eng. 1974, 8, 159–210. [Google Scholar] [CrossRef]
- Garbarino, G.; Riani, P.; Magistri, L.; Busca, G. A study of the methanation of carbon dioxide on Ni/Al2O3 catalysts at atmospheric pressure. Int. J. Hydrog. Energy 2014, 39, 11557–11565. [Google Scholar] [CrossRef]
- Aziz, M.A.A.; Jalil, A.A.; Triwahyono, S.; Ahmad, A. CO2 methanation over heterogeneous catalysts: recent progress and future prospects. Green Chem. 2015, 17, 2647–2663. [Google Scholar] [CrossRef]
- Car Manufacturer Audi: Audi E-Gas Project. Available online: http://www.audi-cr2014.de/uploads/files/901411328702714676-umweltbilanz-e-gas-project.pdf (accessed on 2 March 2017).
- Clariant Supplies Catalyst for Audi’s German Methanation Plant. Available online: http://www.chemicals-technology.com/news/news-clariant-catalyst-audi-german-methanation-plant (accessed on 2 March 2017).
- World’s Largest SNG Plant Goes On-Stream in China with Catalysts and Process Technology from Haldor Topsoe A/S. Available online: http://www.topsoe.com/content/world%E2%80%99s-largest-sng-plant-goes-stream-china-catalysts-and-process-technology-haldor-tops%C3%B8e (accessed on 2 March 2017).
- Younas, M.; Kong, L.L.; Bashir, M.J.K.; Nadeem, H.; Shehzad, A.; Sethupathi, S. Recent Advancements, Fundamental Challenges, and Opportunities in Catalytic Methanation of CO2. Energy Fuels 2016, 30, 8815–8831. [Google Scholar] [CrossRef]
- Kienberger, T.; Karl, J. Substitute natural gas (SNG)—Stand der Technik, theoretische Grundlagen, Forschung am Institut für Wärmetechnik. In Proceedings of the 11th Symposium Energieinnovation, Graz, Austria, 10–12 February 2010. [Google Scholar]
- Sudiro, M.; Bertucco, A. Natural Gas; Sciyo: Rijeka, Croatia, 2010; pp. 105–126. [Google Scholar]
- Hydrogen Energy. Available online: http://www.netl.doe.gov/research/coal/energy-systems/gasification/gasifipedia/coal-to-sng (accessed on 2 March 2017).
- Brooks, K.P.; Hu, J.; Zhu, H.; Kee, R.J. Methanation of carbon dioxide by hydrogen reduction using the Sabatier process in microchannel reactors. Chem. Eng. Sci. 2007, 62, 1161–1170. [Google Scholar] [CrossRef]
- Schoder, M.; Armbruster, U.; Martin, A. Heterogen-katalysierte Hydrierung von CO2 zu Methan unter erhöhten Drücken. Chem. Ing. Tech. 2013, 82, 344–352. [Google Scholar] [CrossRef]
- Lange, F.; Armbruster, U.; Martin, A. Heterogeneously-catalyzed hydrogenation of carbon dioxide to methane over RuNi-bimetallic catalysts. Energy Technol. 2015, 3, 55–62. [Google Scholar] [CrossRef]
- Martin, A.; Türks, D.; Mena, H.; Armbruster, U. Hydrogenation of Carbon Dioxide to Synthetic Natural Gas: Impact of Catalyst Bed Arrangement. JECM 2016, 3, 25–30. [Google Scholar]
- Reschetilowski, W. Einführung in Die Heterogene Katalyse; Springer: Berlin/Heidelberg, Germany, 2015. [Google Scholar]
- Weatherbee, G.D.; Bartholomew, C.D. Hydrogenation of CO2 on group VIII metals. J. Catal. 1981, 68, 67–76. [Google Scholar] [CrossRef]
- Dautzenberg, F.M. Ten Guidelines for Catalyst Testing. In Characterization and Catalyst Development; ACS Symposium Series; American Chemical Society: Washington, DC, USA, 1989; Volume 411, pp. 99–119. [Google Scholar]
Figure 1.
(a) Scheme of the bench-scale reactor with catalyst bed (18Ni/Al2O3) and quartz fillings. (b) CO2 conversion and CH4 selectivity in runs with different catalyst loadings (run A: 1 mL of catalyst; run B: 2.5 mL of catalyst; run C: 4 mL of catalyst) in dependence on temperature.
Figure 1.
(a) Scheme of the bench-scale reactor with catalyst bed (18Ni/Al2O3) and quartz fillings. (b) CO2 conversion and CH4 selectivity in runs with different catalyst loadings (run A: 1 mL of catalyst; run B: 2.5 mL of catalyst; run C: 4 mL of catalyst) in dependence on temperature.
Figure 2.
Recorded temperature profiles for methanation on 18Ni/Al2O3. Run A: 1 mL catalyst + 4 mL quartz; run B: 2.5 mL catalyst + 2.5 mL quartz; run C: 4 mL catalyst + 1 mL quartz (GHSV ≅ 6000 h−1; CO2:H2:N2 = 1.8:7.2:1; 10 bar).
Figure 2.
Recorded temperature profiles for methanation on 18Ni/Al2O3. Run A: 1 mL catalyst + 4 mL quartz; run B: 2.5 mL catalyst + 2.5 mL quartz; run C: 4 mL catalyst + 1 mL quartz (GHSV ≅ 6000 h−1; CO2:H2:N2 = 1.8:7.2:1; 10 bar).
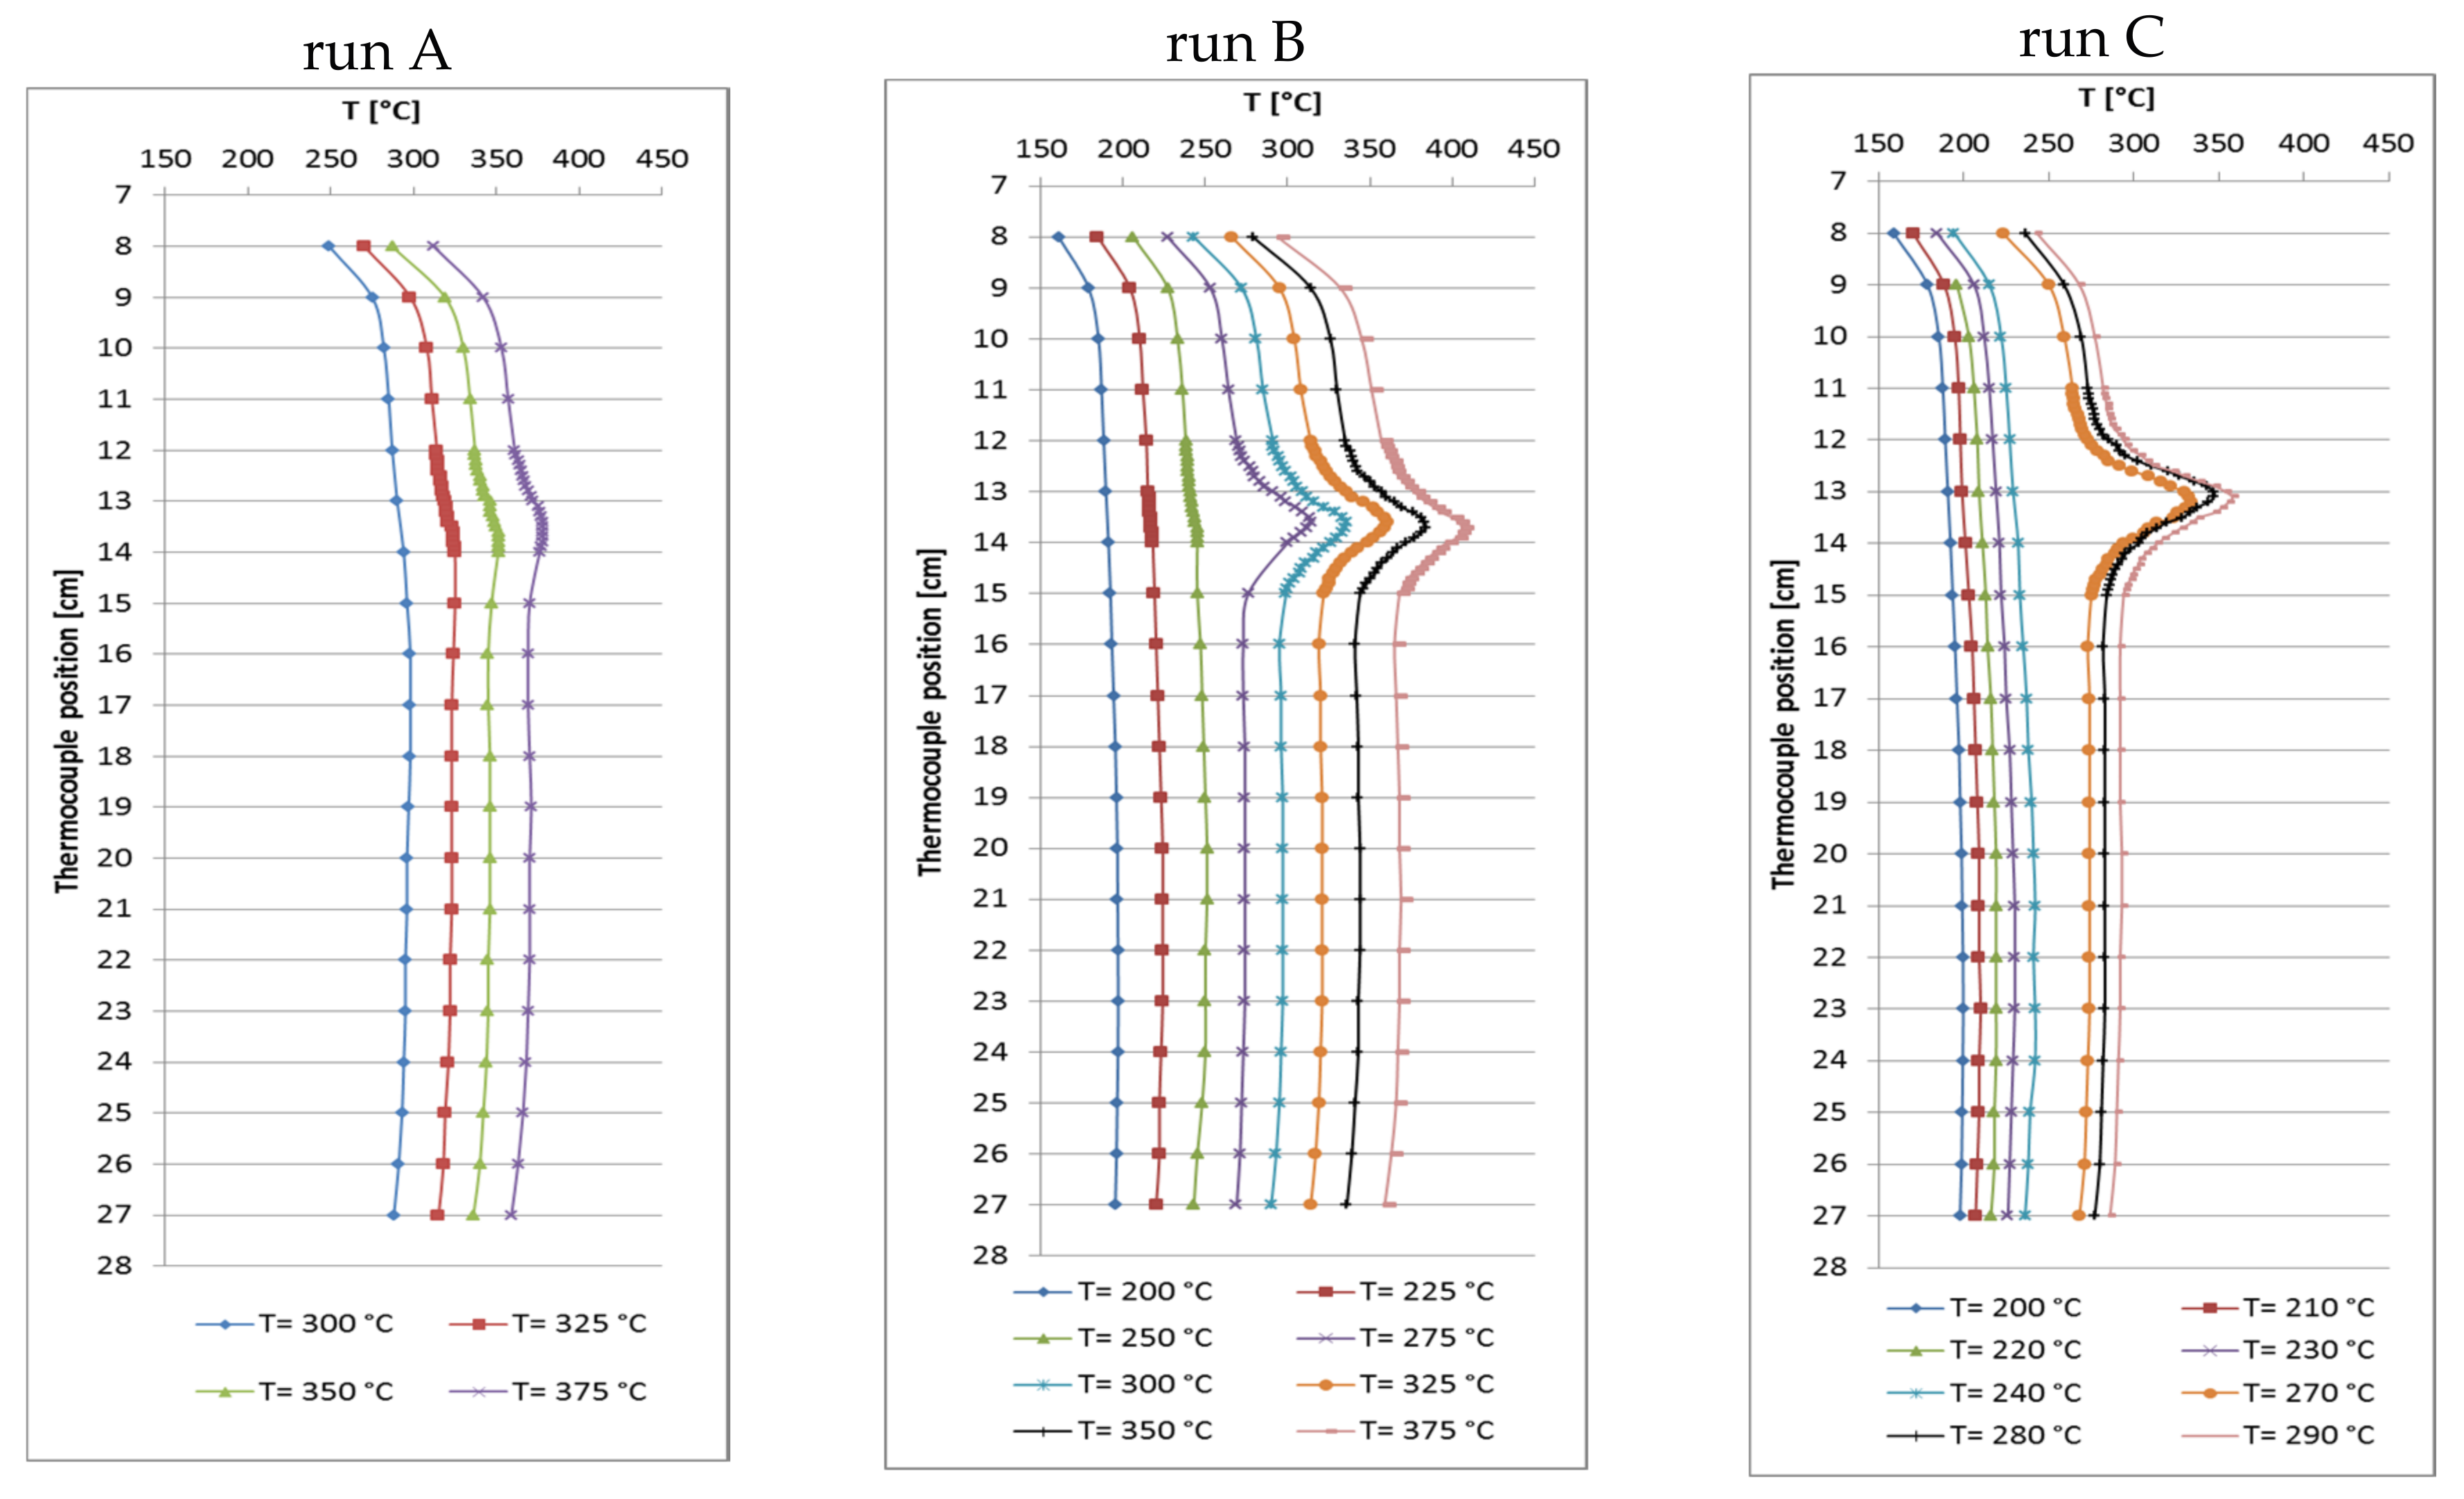
Figure 3.
Recorded temperature profiles for methanation on 18Ni/Al2O3 with 0.5 mL catalyst + 4.5 mL quartz (GHSV = 12,000 h−1; CO2:H2:N2 = 1.8:7.2:1; 10 bar).
Figure 3.
Recorded temperature profiles for methanation on 18Ni/Al2O3 with 0.5 mL catalyst + 4.5 mL quartz (GHSV = 12,000 h−1; CO2:H2:N2 = 1.8:7.2:1; 10 bar).
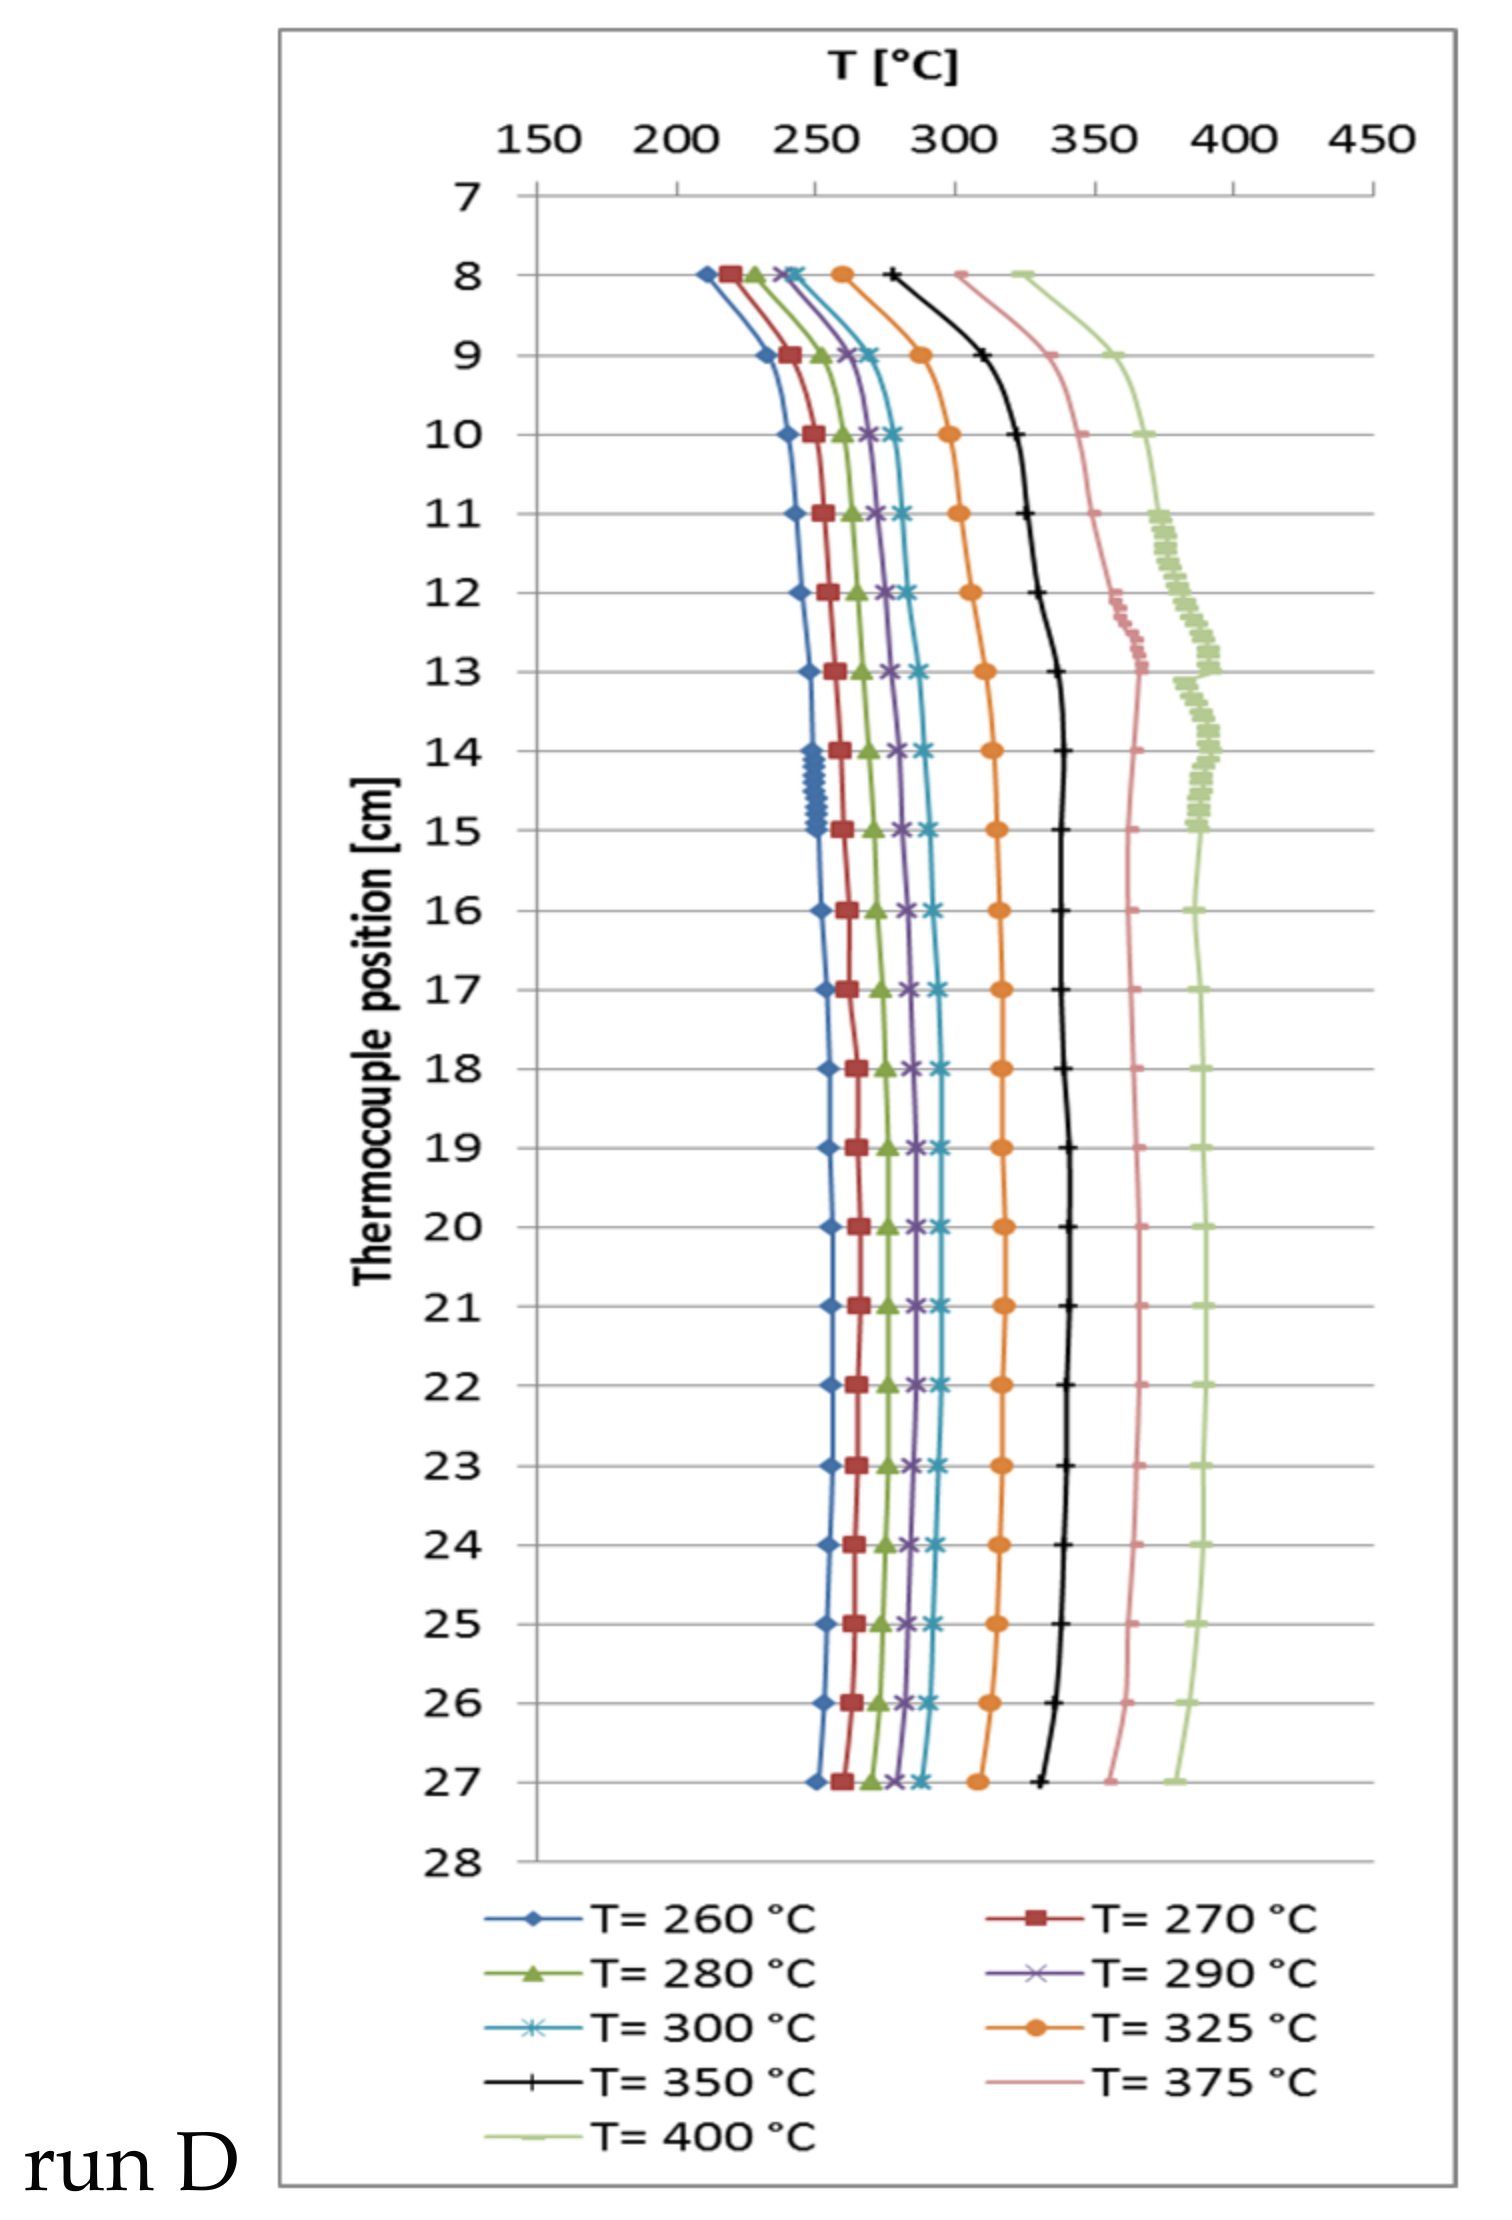
Figure 4.
Recorded temperature profiles for methanation on 18Ni/Al2O3 in a triple-bed reactor (catalyst:quartz = 1:4, 1:1, 4:1; 1.7 mL each zone; GHSV = 6000 h−1; CO2:H2:N2 = 1.8:7.2:1; 10 bar).
Figure 4.
Recorded temperature profiles for methanation on 18Ni/Al2O3 in a triple-bed reactor (catalyst:quartz = 1:4, 1:1, 4:1; 1.7 mL each zone; GHSV = 6000 h−1; CO2:H2:N2 = 1.8:7.2:1; 10 bar).
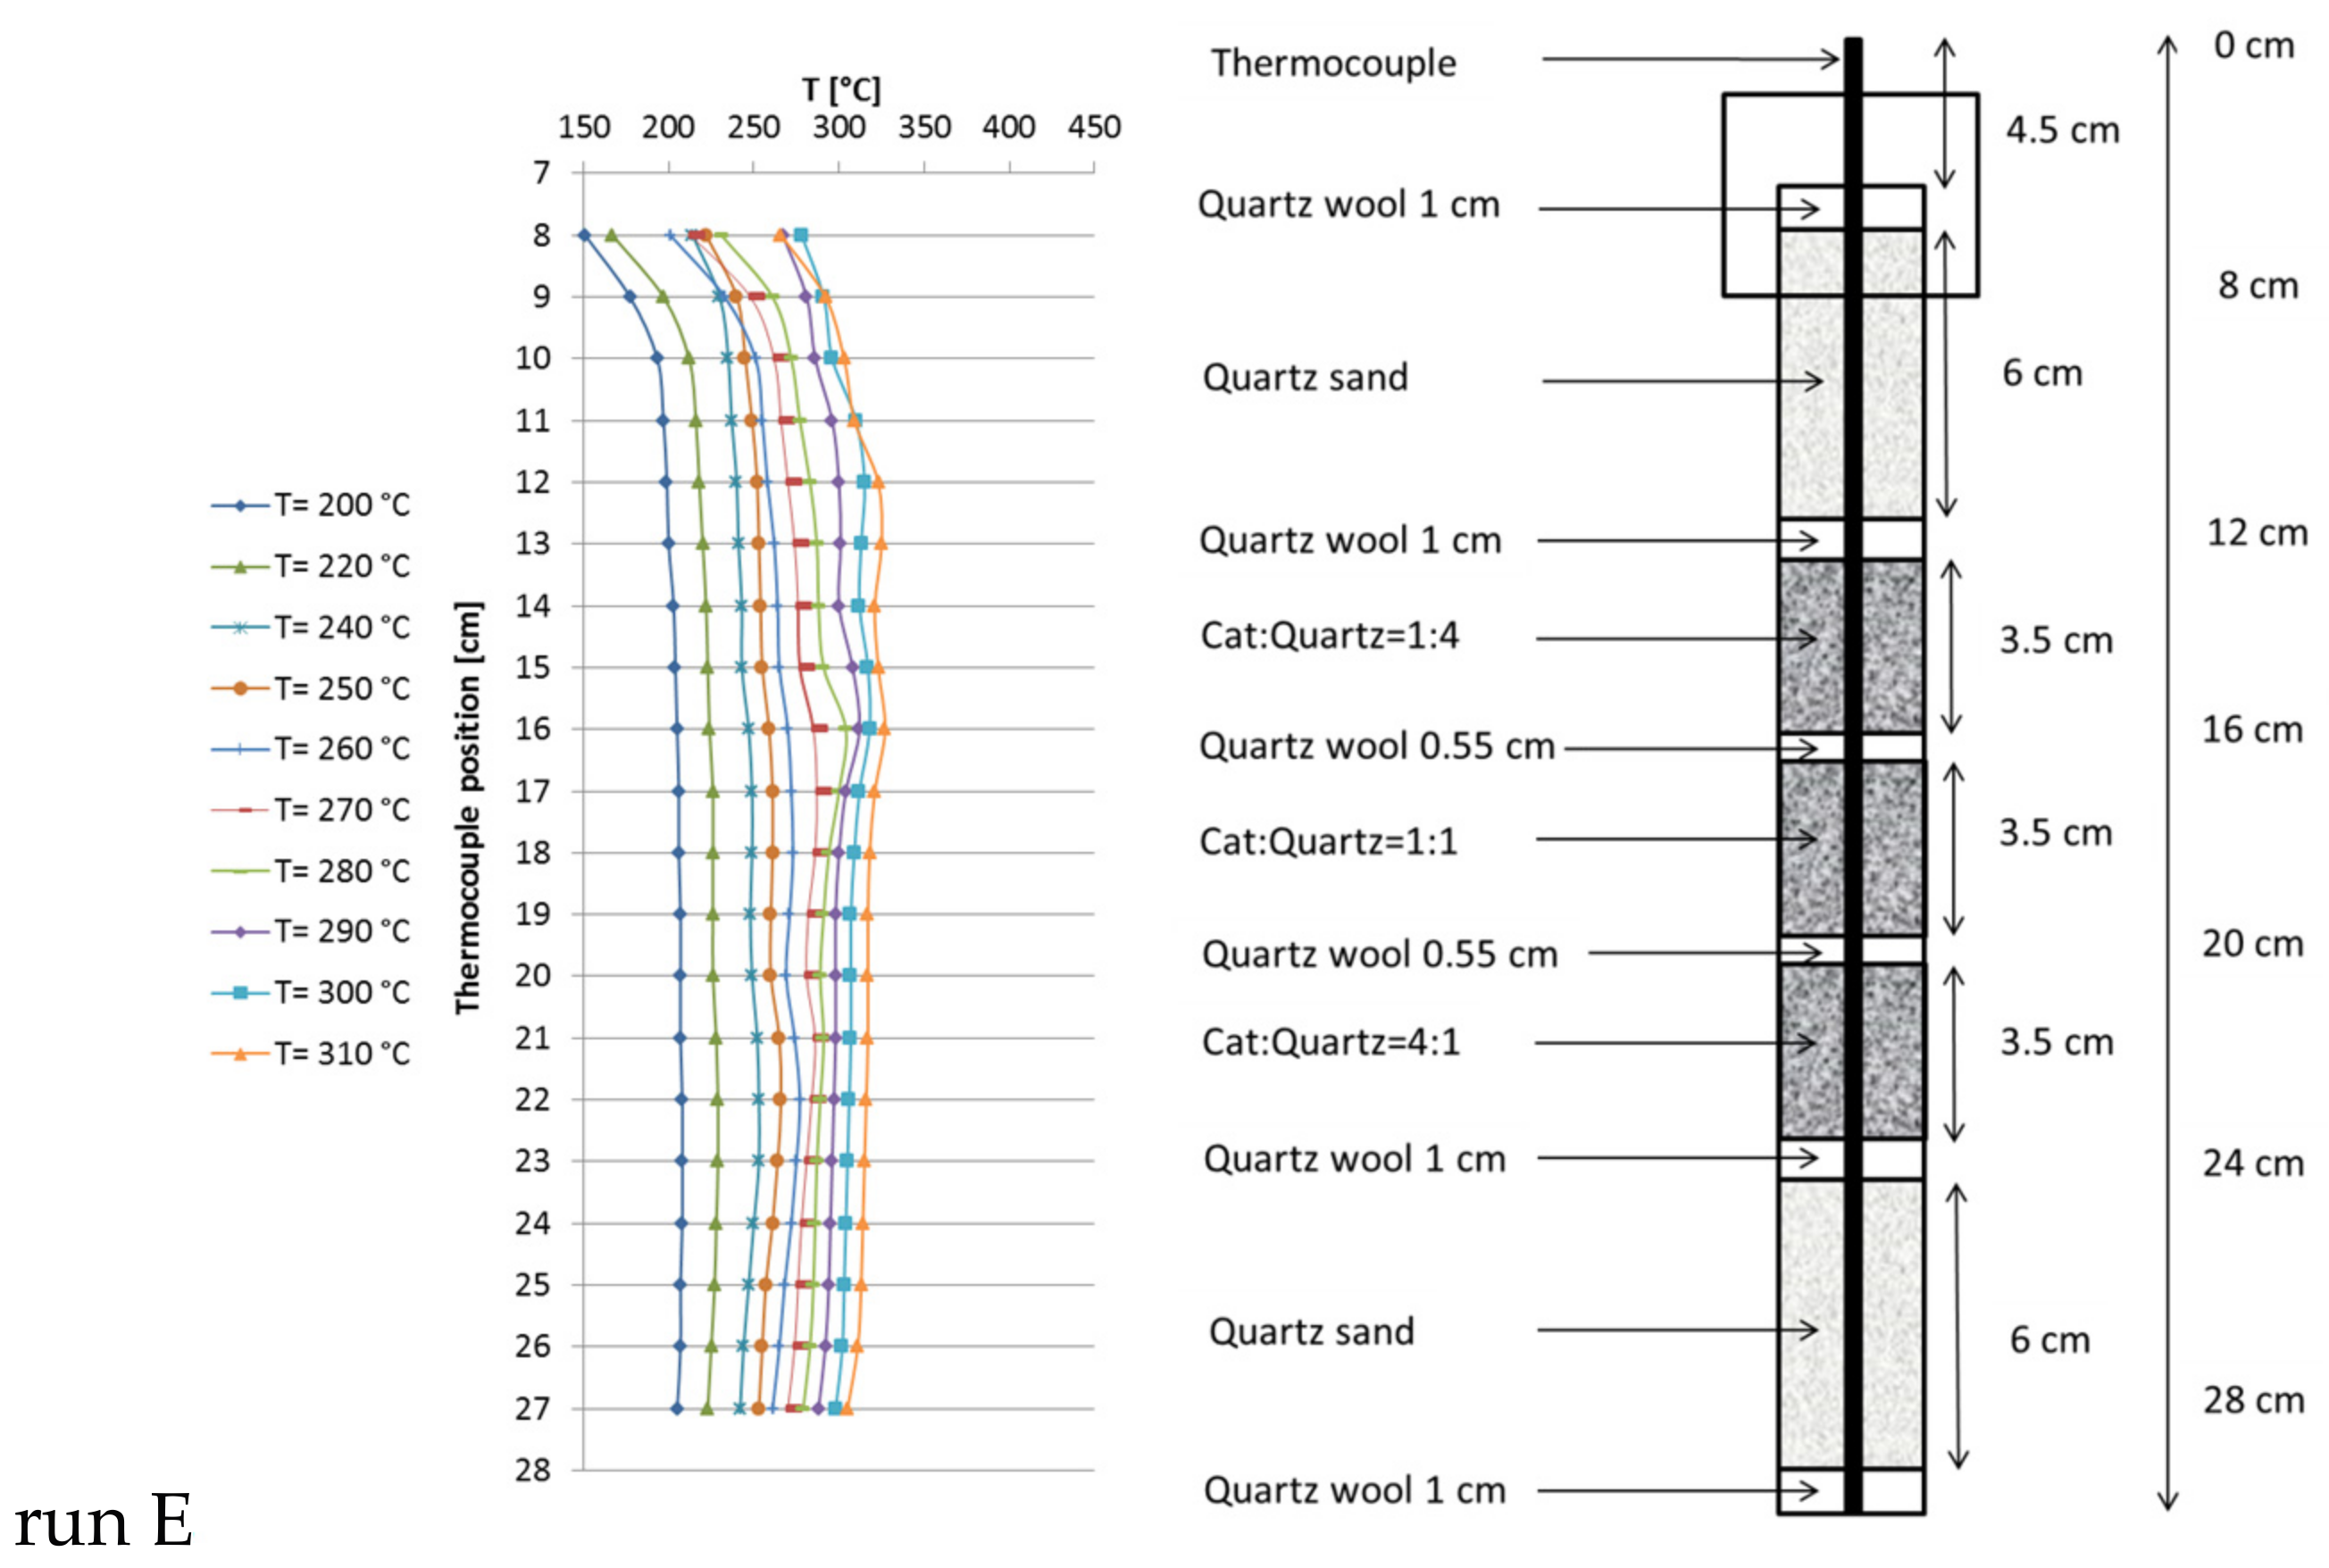
Figure 5.
Arrhenius plot for the calculation of the apparent activation energy for CO2 methanation on 18Ni/Al2O3.
Figure 5.
Arrhenius plot for the calculation of the apparent activation energy for CO2 methanation on 18Ni/Al2O3.
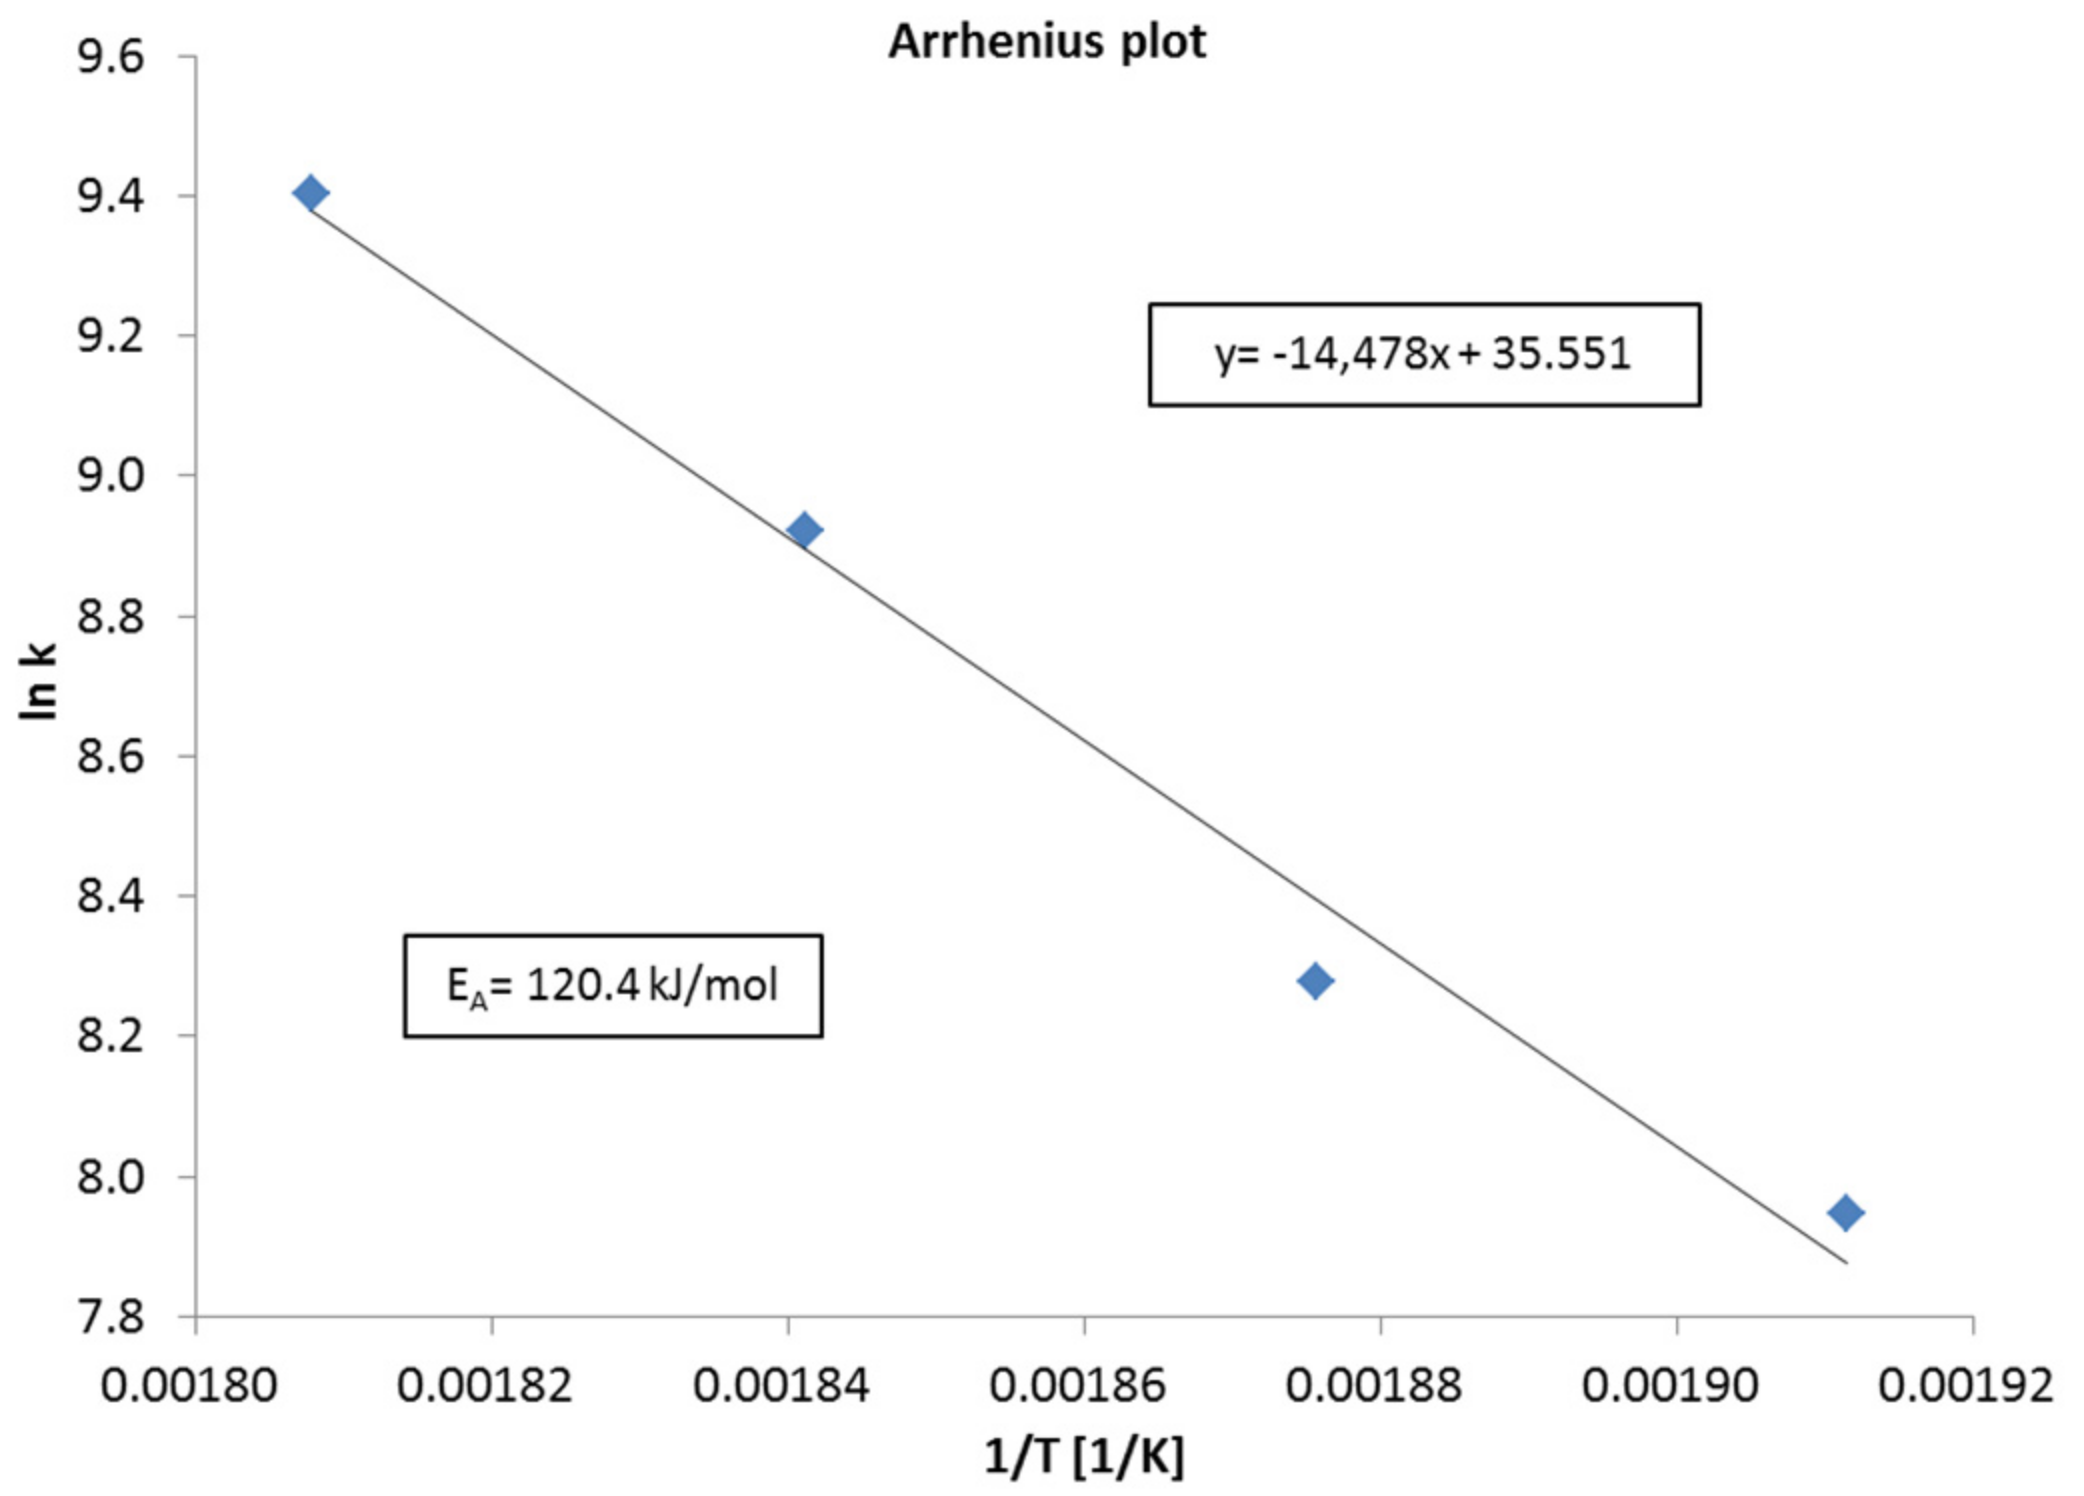
Figure 6.
Recorded temperature profiles for methanation on 18Ni/Al2O3 in a single fixed-bed used as reference run (catalyst:quartz = 1:9; total bed volume 306 mL; GHSV = 8000 h−1; CO2:H2:N2 = 1.8:7.2:1; 10 bar).
Figure 6.
Recorded temperature profiles for methanation on 18Ni/Al2O3 in a single fixed-bed used as reference run (catalyst:quartz = 1:9; total bed volume 306 mL; GHSV = 8000 h−1; CO2:H2:N2 = 1.8:7.2:1; 10 bar).

Figure 7.
Recorded temperature profiles for methanation on 18Ni/Al2O3 in a triple fixed-bed (30 mL of catalyst; catalyst:quartz = 1:20, 1:10, 1:5; 301 mL total; GHSV = 10,000 h−1; CO2:H2:N2 = 1.8:7.2:1; 10 bar).
Figure 7.
Recorded temperature profiles for methanation on 18Ni/Al2O3 in a triple fixed-bed (30 mL of catalyst; catalyst:quartz = 1:20, 1:10, 1:5; 301 mL total; GHSV = 10,000 h−1; CO2:H2:N2 = 1.8:7.2:1; 10 bar).
Figure 8.
(a) Recorded temperature profiles for methanation on 18Ni/Al2O3 in a reactor with four fixed-beds. (b) CO2 conversion and CH4 selectivity in dependence of TOS. Catalyst:quartz = 1:36, 1:27, 1:18, 1:9; 280 mL total; GHSV = 20,000 h−1; CO2:H2:N2 = 1.8:7.2:1; 10 bar.
Figure 8.
(a) Recorded temperature profiles for methanation on 18Ni/Al2O3 in a reactor with four fixed-beds. (b) CO2 conversion and CH4 selectivity in dependence of TOS. Catalyst:quartz = 1:36, 1:27, 1:18, 1:9; 280 mL total; GHSV = 20,000 h−1; CO2:H2:N2 = 1.8:7.2:1; 10 bar.

Figure 9.
TEM images of fresh and spent catalyst after >250 h TOS in run H. Catalyst before reaction: (1) catalyst as delivered, partly reoxidized; and (2) after in situ reduction. Catalyst after reaction: (3) the top most bed; and (4) second catalyst bed.
Figure 9.
TEM images of fresh and spent catalyst after >250 h TOS in run H. Catalyst before reaction: (1) catalyst as delivered, partly reoxidized; and (2) after in situ reduction. Catalyst after reaction: (3) the top most bed; and (4) second catalyst bed.

Figure 10.
(a) Recorded temperature profiles for methanation on 18Ni/Al2O3 in a reactor with 8 fixed-beds. (b) CO2 conversion and CH4 selectivity in dependence of TOS (catalyst:quartz varied from 1:36 to 1:9; 280 mL total; GHSV = 20,000 h−1; CO2:H2:N2 = 1.8:7.2:1; 10 bar).
Figure 10.
(a) Recorded temperature profiles for methanation on 18Ni/Al2O3 in a reactor with 8 fixed-beds. (b) CO2 conversion and CH4 selectivity in dependence of TOS (catalyst:quartz varied from 1:36 to 1:9; 280 mL total; GHSV = 20,000 h−1; CO2:H2:N2 = 1.8:7.2:1; 10 bar).

Figure 11.
Scheme of the test rig. The set-up is constructed to mount both reactors alternatively. Red line: heated oven box (180 °C).
Figure 11.
Scheme of the test rig. The set-up is constructed to mount both reactors alternatively. Red line: heated oven box (180 °C).


Table 1.
Carbon dioxide conversion and methane selectivity at 300–400 °C at different reaction pressure (1 mL 5 wt % Ni/ZrO2 + 4 mL quartz diluent, GHSV = 6000 h−1, CO2:H2:N2 = 1:4:5).
Table 1.
Carbon dioxide conversion and methane selectivity at 300–400 °C at different reaction pressure (1 mL 5 wt % Ni/ZrO2 + 4 mL quartz diluent, GHSV = 6000 h−1, CO2:H2:N2 = 1:4:5).
| Temperature (°C) | Xeq (CO2) (%) | X1 bar (CO2) (%) | X10 bar (CO2) (%) | S1 bar (CH4) (%) | S10 bar (CH4) (%) |
|---|---|---|---|---|---|
| 300 | 98.5 | 19.5 | 96.7 | 99.0 | 99.8 |
| 325 | 97.7 | 38.5 | 96.8 | 99.5 | 99.9 |
| 350 | 96.5 | 54.3 | 95.9 | 99.6 | 100 |
| 375 | 95.5 | 66.0 | 94.6 | 99.2 | 99.9 |
| 400 | 94.0 | 71.1 | 93.2 | 98.9 | 99.9 |
Table 2.
Carbon dioxide conversion and methane selectivity during runs with decreasing catalyst dilution (18Ni/Al2O3; GHSV ≅ 6000 h−1; CO2:H2:N2 = 1.8:7.2:1; run A: catalyst:quartz = 1:4, feed = 6 L/h; run B: catalyst:quartz = 1:1, feed = 15 L/h; run C: catalyst:quartz = 4:1, feed = 26.4 L/h).
Table 2.
Carbon dioxide conversion and methane selectivity during runs with decreasing catalyst dilution (18Ni/Al2O3; GHSV ≅ 6000 h−1; CO2:H2:N2 = 1.8:7.2:1; run A: catalyst:quartz = 1:4, feed = 6 L/h; run B: catalyst:quartz = 1:1, feed = 15 L/h; run C: catalyst:quartz = 4:1, feed = 26.4 L/h).
| Set Point Temperature | XCO2 (%) | SCH4 (%) | Hot Spot (K) 1 | ||||||
|---|---|---|---|---|---|---|---|---|---|
| (°C) | A | B | C | A | B | C | A | B | C |
| 270 | - | - | 96.5 | - | - | 99.9 | - | - | 64 |
| 280 | - | - | 96.7 | - | - | 99.9 | - | - | 67 |
| 290 | - | - | 97.4 | - | - | 99.9 | - | - | 68 |
| 300 | 96.5 | 97.3 | - | 99.9 | 99.9 | - | - | 36 | - |
| 325 | 96.9 | 96.8 | - | 99.9 | 99.9 | - | - | 36 | - |
| 350 | 96.1 | 96.5 | - | 99.9 | 99.9 | - | 1 | 34 | - |
| 375 | 95.1 | 95.4 | - | 99.9 | 99.9 | - | 3 | 31 | - |
1 difference between set point and measured reaction temperatures.
Table 3.
CO2 conversion and methane selectivity on 18Ni/Al2O3 in the bench-scale reactor with single bed (run D: catalyst:quartz = 1:9; total 5 mL; GHSV = 12,000 h−1) and triple-bed configuration (run E: catalyst:quartz = 1:4, 1:1, 4:1, total 5 mL; GHSV = 6000 h−1); CO2:H2:N2 = 1.8:7.2:1; 10 bar.
Table 3.
CO2 conversion and methane selectivity on 18Ni/Al2O3 in the bench-scale reactor with single bed (run D: catalyst:quartz = 1:9; total 5 mL; GHSV = 12,000 h−1) and triple-bed configuration (run E: catalyst:quartz = 1:4, 1:1, 4:1, total 5 mL; GHSV = 6000 h−1); CO2:H2:N2 = 1.8:7.2:1; 10 bar.
| Temperature | XCO2 (%) | SCH4 (%) | Hot Spot (K) 1 | |||
|---|---|---|---|---|---|---|
| (°C) | D | E | D | E | D | E |
| 250 | - | 72.6 | - | 99.9 | - | 16 |
| 260 | 43.6 | 90.9 | 99.9 | 99.9 | - | 17 |
| 270 | 55.3 | 93.6 | 99.9 | 99.9 | - | 16 |
| 280 | 68.6 | 97.2 | 99.9 | 99.9 | - | 20 |
| 290 | 81.9 | 97.5 | 99.9 | 99.9 | - | 23 |
| 300 | 85.5 | 97.5 | 99.9 | 99.9 | - | 18 |
| 310 | - | 97.5 | - | 99.9 | - | 17 |
| 325 | 96.3 | - | 99.9 | - | - | - |
| 350 | 96.6 | - | 99.9 | - | - | - |
| 375 | 95.8 | - | 99.9 | - | - | - |
| 400 | 94.7 | - | 99.9 | - | - | - |
1 difference between set point and measured reaction temperatures.
Table 4.
CO2 conversion and methane selectivity on 18Ni/Al2O3 in the large reactor with single bed (run F: GHSV = 8000 h−1) and triple fixed-bed with varying catalyst distribution (run G: GHSV = 10,000 h−1; catalyst:quartz = 1:20, 1:10, 1:5). Vcat = 30 mL, Vquartz = 270 mL; CO2:H2:N2 = 1.8:7.2:1, 10 bar).
| Temperature | XCO2 (%) | SCH4 (%) | Hot Spot (K) 1 | |||
|---|---|---|---|---|---|---|
| (°C) | F | G | F | G | F | G |
| 250 | 43.0 | - | 99.9 | - | - | - |
| 290 | 96.1 | - | 99.9 | - | 160 | - |
| 310 | 96.2 | 93.1 | 99.9 | 99.9 | 160 | 78 |
| 325 | - | 92.7 | - | 99.9 | - | 62 |
| 330 | - | 91.1 | - | 99.9 | - | 68 |
1 difference between set point and measured reaction temperatures.
Table 5.
Comparison of reactor configurations at the temperature set points with highest productivity (CO2:H2:N2 = 1.8:7.2:1, 10 bar).
Table 5.
Comparison of reactor configurations at the temperature set points with highest productivity (CO2:H2:N2 = 1.8:7.2:1, 10 bar).
| Run | Vcat | Vdil | GHSV | T | XCO2,max | ∆Tmax | STY | Productivity |
|---|---|---|---|---|---|---|---|---|
| (mL) | (mL) | (h−1) | (°C) | (%) | (K) | (L/(mLcat × h)) | (L/h) | |
| A | 1 | 4 | 6000 | 300 | 96.5 | 5 | 1.1 | 1.1 |
| B | 2.5 | 2.5 | 6000 | 275 | 97.4 | 40 | 1.1 | 2.6 |
| C | 4 | 1 | 6588 | 270 | 96.5 | 65 | 1.2 | 4.6 |
| D | 0.5 | 4.5 | 12,000 | 350 | 96.6 | - | 2.2 | 1.1 |
| E | 2.3 | 2.3 | 6000 | 280 | 97.2 | 20 | 1.1 | 2.4 |
| F | 30 | 270 | 8000 | 310 | 96.2 | 160 | 1.4 | 42.5 |
| G | 30 | 271 | 10,000 | 350 | 92.5 | 62 | 1.7 | 50 |
© 2017 by the authors. Licensee MDPI, Basel, Switzerland. This article is an open access article distributed under the terms and conditions of the Creative Commons Attribution (CC BY) license (http://creativecommons.org/licenses/by/4.0/).
Share and Cite
MDPI and ACS Style
Türks, D.; Mena, H.; Armbruster, U.; Martin, A. Methanation of CO2 on Ni/Al2O3 in a Structured Fixed-Bed Reactor—A Scale-Up Study. Catalysts 2017, 7, 152. https://doi.org/10.3390/catal7050152
AMA Style
Türks D, Mena H, Armbruster U, Martin A. Methanation of CO2 on Ni/Al2O3 in a Structured Fixed-Bed Reactor—A Scale-Up Study. Catalysts. 2017; 7(5):152. https://doi.org/10.3390/catal7050152
Chicago/Turabian StyleTürks, Daniel, Hesham Mena, Udo Armbruster, and Andreas Martin. 2017. "Methanation of CO2 on Ni/Al2O3 in a Structured Fixed-Bed Reactor—A Scale-Up Study" Catalysts 7, no. 5: 152. https://doi.org/10.3390/catal7050152
Note that from the first issue of 2016, this journal uses article numbers instead of page numbers. See further details here.