
Methanol Steam Reforming: Na Doping of Pt/YSZ Provides Fine Tuning of Selectivity

Center for Applied Energy Research, University of Kentucky, 2540 Research Park Dr., Lexington, KY 40511, USA
*
Author to whom correspondence should be addressed.
Catalysts 2017, 7(5), 148; https://doi.org/10.3390/catal7050148
Submission received: 14 March 2017
/
Revised: 10 April 2017
/
Accepted: 3 May 2017
/
Published: 10 May 2017
(This article belongs to the Special Issue Commemorative Issue in Honor of Professor Emeritus Calvin H. Bartholomew in Anticipation of His 75th Birthday)
Abstract
:In this work, we found that sodium doping can be used to improve CO2 selectivity for supported Pt catalyst during methanol steam reforming. These materials are usually very active in the low temperature range; however, they are characterized by high selectivity of CO, which is a poison in downstream polymer electrolyte membrane fuel cells (PEM-FC) application. With Na doping, we found that CO2 selectivity was higher than 90% when 2.5 wt.% of sodium was added to Pt/YSZ. We have speculated that the different product distribution is due to a different reaction pathway being opened for CH3OH decomposition. Methanol decarbonylation was favored when Na was absent or low, while a formate decarboxylation pathway was favored when Na content reached 2.5 wt.%. The proposal is rooted in the observed weakening of the C-H bond of formate, as demonstrated in in situ diffuse reflectance infrared Fourier transform spectroscopy (DRIFTS) and kinetic isotope effect (KIE) experiments for the water-gas shift reaction conducted at low temperature. When adsorbed methoxy, produced when methanol is dissociatively adsorbed, was converted in the presence of H2O in DRIFTS spectroscopy, formate species were prevalent for a 2% Pt–2.5% Na/YSZ catalyst, while only a minor contribution was observed for 2% Pt/YSZ. Moreover, the formate produced on Na-doped Pt/YSZ exhibited ν(CH) stretching bands at low wavenumber, consistent with C–H bond weakening, thus favoring dehydrogenation (and decarboxylation). It is proposed that when Na is present, formate is likely an intermediate, and because its dehydrogenation is favored, selectivity can be fine-tuned between decarbonylation and decarboxylation based on Na dopant level.

1. Introduction
Fuel cells are a promising and relatively environmentally benign technology for producing electrical power. Polymer electrolyte membrane fuel cells (PEM-FC) may become convenient devices for portable power generation and transportation. However, they require H2 as fuel, and hydrogen storage remains a significant challenge [1]. Methanol has several advantages as a liquid chemical carrier of hydrogen for PEM-FC applications [2]. In fact, methanol has a H/C ratio (4:1) that is the same as methane; it is liquid at 1 atm and ambient temperature with a low boiling point (65 °C) and a low melting point (−144 °C); also, it is biodegradable. Methanol can be produced by renewable and fossil resources, and can be synthesized from CO or CO2 [2,3]. Moreover, the steam reforming reaction occurs at a low temperature (200–300 °C) compared to other fuels (>500 °C) because no strong C–C bonds need to be broken. Methanol steam reforming (MSR) can be described by Equations (1) and (2), while water-gas shift (WGS) is given in Equation (3):
Copper-based catalysts are the most commonly used for MSR due to their high activity and selectivity [4,5,6,7,8,9]. However, these catalysts have a number of drawbacks, including deactivation in excess steam, pyrophoricity, as well as complicated preconditioning steps that impact start-up/shutdown cycles [10,11]. Group VIII metals (e.g., Pd, Pt and Ni) were studied as possible alternatives to copper-based catalysts [12,13,14,15,16,17]. These materials are very attractive because of their thermal stability at higher temperature; however, a high fraction of CO is usually produced by the decomposition of methanol (Equation (2)). This can preclude their use when hydrogen production is desired. Iwasa et al. [15,18,19] reported that Pd/ZnO has high CO2 selectivity. The formation of PdZn alloy phase, pre-reduced at high temperatures, has been implicated as the cause for the high selectivity to CO2. The preparation of bimetallic PdZn is highly sensitive to the preparation procedure and the formation of metallic Pd compromises the catalyst performance by increasing the CO selectivity. MSR on Pt catalysts have also been reported in literature [20,21,22,23,24]. Liu et al. [20] found that when Al2O3 is doped with In2O3 a strong interaction between Pt and In2O3 is observed. Consequently, CO selectivity is minimized and catalyst stability is enhanced. Recently, Martinelli et al. [23] have found that sodium doping of Pt promoted yttrium stabilized zirconia (YSZ) improves CO2 selectivity during both MSR and steam assisted formic acid decomposition (SAFAD). CO-free hydrogen production during SAFAD has been also reported by Bulushev et al. [25] on Au/Al2O3 catalyst doped with potassium.
The development of alkali-doped Pt/ZrO2 catalysts has its roots in WGS catalysis. Iwasawa [26] proposed that the rate-limiting step of WGS for a number of partially reducible oxides with or without supported metal particles was C-H bond breaking of formate. After joint research between Honda Research USA, Inc. and Symyx using a combinatorial catalysis approach [27] discovered that addition of light alkali to metal/zirconia catalysts resulted in a significant increase in the low temperature water gas shift rate. Joint research between Honda Research USA, Inc. and UK-CAER [28,29] demonstrated that surface formates were significantly more reactive through: (1) forward formate decomposition experiments in H2O; (2) formate H/D exchange experiments; (3) the observed weakening of the formate ν(CH) bond as observed in infrared spectroscopy; and (4) 13CO isotopic switching experiments. More recently, the catalyst was improved by doping 10% (molar) Y to Zr [30]. Doping of the larger Y3+ cation to the lattice was confirmed by a shift in 2θ in XRD to lower values. Adding Y3+ generated additional vacancy sites for dissociation of H2O, as confirmed by the more significant bridging OH band intensity (a negative band) during CO adsorption and the significant increase in the formate/Pt-CO ratio (25% higher) for the 0.5% Pt/YSZ catalyst as compared to the 0.5% Pt/ZrO2 catalyst. Increased surface O-mobility due to lattice strain was also suggested as the formates, bound by their O atoms to the surface of the catalyst, were transported to the metal-support interface and decomposed more rapidly. These aspects were proposed to contribute to the higher WGS activity (e.g., 67% increase in CO conversion at 300 °C) of the 0.5% Pt/YSZ catalyst compared to the 0.5% Pt/ZrO2 catalyst.
More recently [31], addition of 2.5% Na to 2% Pt/ZrO2 or 2% Pt/YSZ catalyst was found to shift the light-off curve for low temperature shift to lower temperature by Δ 40 °C. The best catalyst was one containing both Na and Y. Diffuse reflectance infrared Fourier transform spectroscopy (DRIFTS) of adsorbed CO were used to probe the defect-associated bridging OH groups following activation/steaming, and the formate ν(CH) band was shifted from 2880 cm−1 to 2802 cm−1 by adding Na. Switching from H2O + CO to D2O + CO led to a normal kinetic isotope effect of 1.4 for the 2% Pt/YSZ catalyst and 1.2 for the 2% Pt–2.5% Na/YSZ catalyst. The electronic weakening of the formate C-H bond, as reflected in the lower wavenumber formate ν(CH) band and small kinetic isotope effect, is consistent with the proposal of Iwasawa that formate C–H bond breaking may be the rate limiting step of water gas shift. A related reaction of SAFAD was also examined, such that replacing CO (i.e., WGS) with HCOOH (i.e., SAFAD) led to higher activity [23]. Not only did Na significantly improve the rate of the reaction, but switching from H2O + HCOOH to H2O + DCOOH resulted in an identical kinetic isotope effect of 1.4 for 2% Pt/YSZ and 1.2 for 2.5% Na–2% Pt/YSZ, providing further evidence of the involvement of formate in both reactions.
In MSR, there was also an effect of the Na dopant. While conversion slightly decreased, the selectivity to CO2 increased significantly (from just 22% for 2% Pt/YSZ to >90% for 2% Pt–2.5%Na/YSZ at 300 °C). Na did not impact the normal kinetic isotope effect, suggesting that formate was probably not the rate limiting step. Nevertheless, the involvement of formate was suggested by the remarkable difference in CO2 selectivity.
The aim of this work is to probe the characteristic that defines the active site for YSZ supported Pt catalyst and understand the key factor the governs the product selectivity during MSR. In order to achieve this goal, a series of Pt/YSZ catalysts with different sodium loadings were prepared, characterized and tested. DRIFTS experiments were also carried out in order to investigate intermediate species during the reaction and determine if they can be influenced by a chemical effect of Na.
2. Results and Discussion
Adding 2 wt.% Pt to YSZ slightly decreased the BET surface area (Table 1). Assuming that YSZ contributed to the surface area, adding Pt did not result in significant pore blocking. The effect of sodium loading is reported in Table 1. The surface area passed through a maximum sodium loading increased from 0 to 2.5 wt.%, indicating Na may cause a change in the morphology of the catalyst (e.g., a narrowing of the pores). At a high Na doping level of 2.5 wt.%, some pore blocking was likely, as surface area decreased by Δ50 m2/g.
Temperature programmed reduction results are reported in Figure 1. Effects of Pt and Y-doping on TPR were presented in our previous work [30]. Pt accelerates the decomposition of surface carbonate species, as well as promotes O-vacancy and bridging OH group formation. A TPR-XANES investigation in that work demonstrated that the first peak involved platinum oxide reduction to Pt. With the addition of Na to the Pt/YSZ catalyst, the first peak increases primarily due to Pt facilitating carbonate decomposition once Pt oxide is reduced. Na, due to its basicity, systematically increases the amount of surface carbonate on the catalyst, as confirmed by DRIFTS experiments (not shown for the sake of brevity). The peak position reflected metal-support interactions and correlated with the surface area such that the lower surface area materials (2% Pt/YSZ, 2% Pt–2.5% Na/YSZ) had the first peak forming at a lower temperature. Thus, the maximum in the position of the first peak occurred when the Na loading was between 0.25 wt.% and 1 wt.% Na.
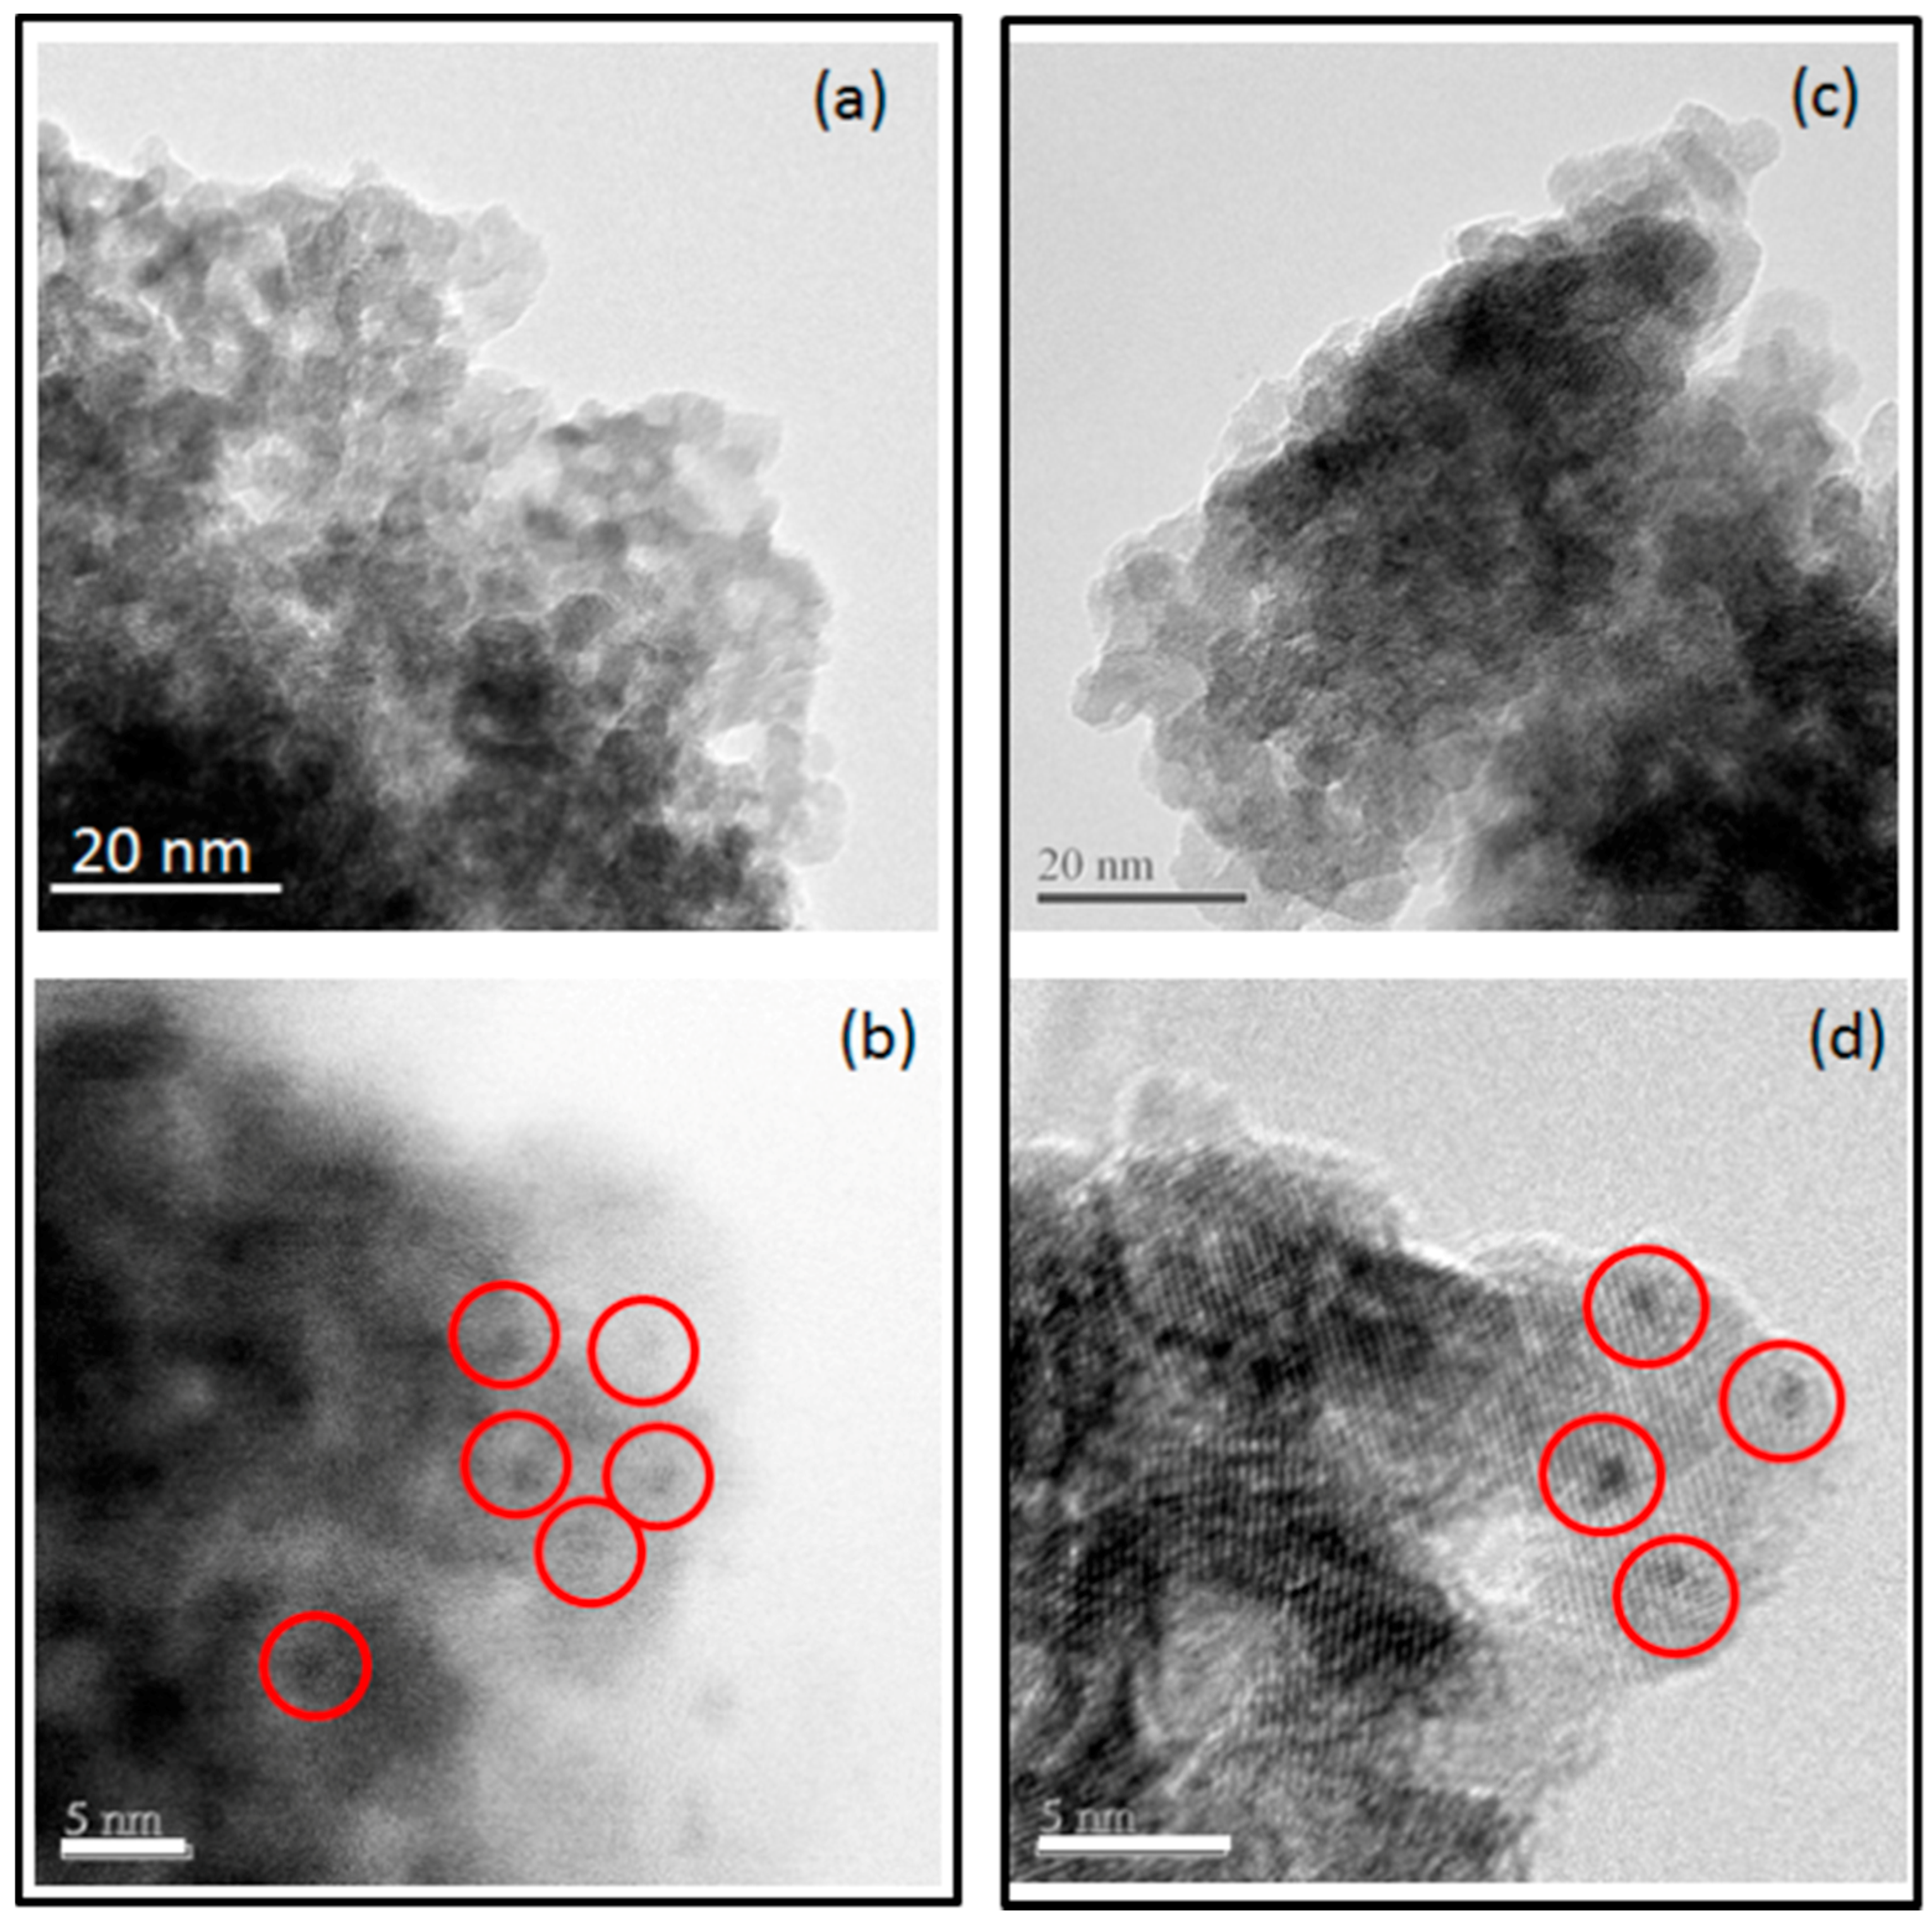
Figure 2a,b illustrate TEM and HRTEM results for Pt dispersion and particle size on catalyst support without Na. Figure 2c,d illustrate TEM and HRTEM results for Pt dispersion and particle size on catalyst support with Na. The Pt particle size range for both catalysts was similar and less than 2.5 nm.
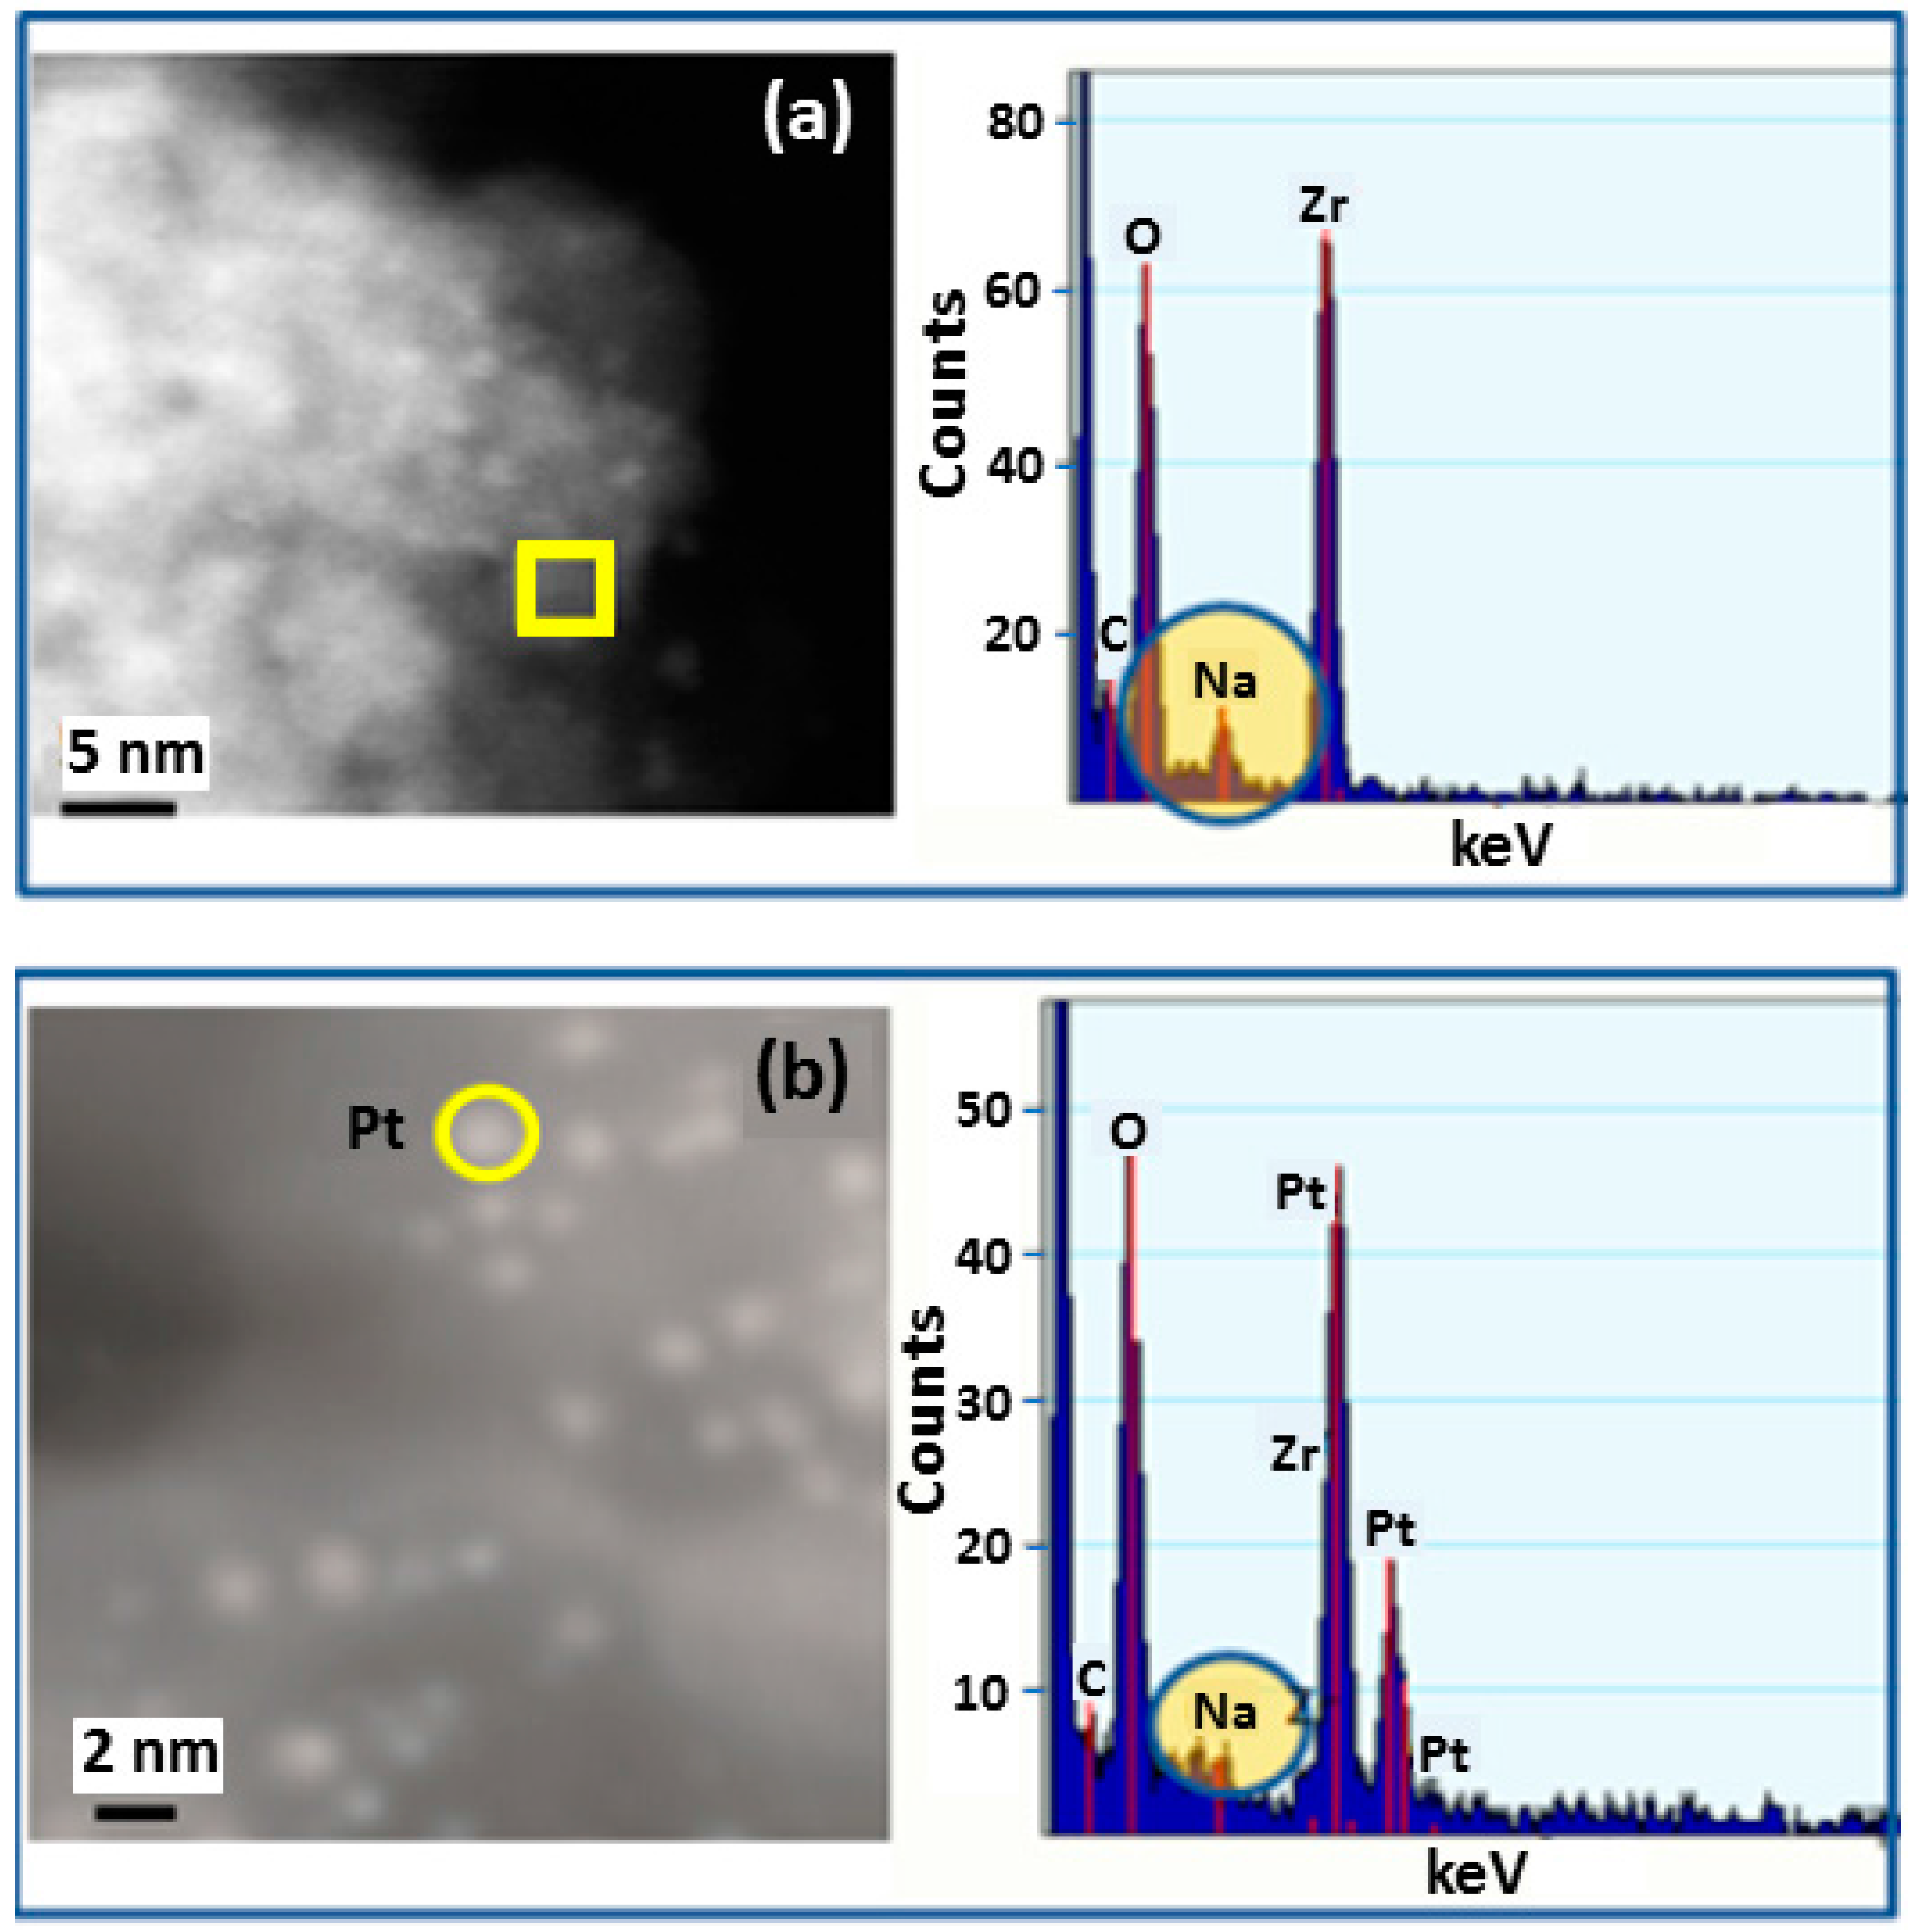
Figure 3a HR-STEM image of Pt particles on catalyst support. Individual bright spots in the image represent Pt nanoparticles. The energy dispersive X-ray spectroscopy (EDS) spectrum corresponds to the area marked with the yellow square and was selected to show the Na concentration of the support without presence of Pt particles.
Figure 3b HR-STEM image of Pt particles on catalyst support. Individual bright spots in the image represent Pt nanoparticles. The EDS spectrum corresponds to the area marked with the yellow circle and was selected to show the Na concentration where Pt particles occur on the support. Na was observed in EDS spectra to occur in both locations, with and without the presence of Pt particles.
CO is an important probe molecule for bridging OH groups on active oxides, producing surface formates [32]. In Figure 4 (left) DRIFTS of adsorbed CO reveals, in addition of Pt carbonyl bands, ν(CH) and ν(OCO) asymmetric and symmetric stretching bands of formate. The ν(CH) band of the Na-doped catalyst were at lower wavenumbers, consistent with our earlier findings [28,29]. Therefore, DRIFTS—in agreement with EDS results—provides evidence that Na is located on the support. Figure 4 (right) demonstrates that adding Na affects the Pt-carbonyl bands, systematically shifting them to lower temperature. This may be due to a geometric or electronic effect, such as Na causing increased back-donation of electron density from Pt to the 2π* antibonding molecular orbitals of CO. This, in addition to EDS results, indicates that Na is interacting with Pt. The area intensity of the Pt carbonyl bands of the unpromoted and Na-doped 2% Pt/YSZ catalysts were virtually identical and double that of a 1% Pt/Al2O3 catalyst (completely dispersed), except for the 2.5% Na-doped case, which was 87% of the area of the other Pt/YSZ catalysts.
Carbon dioxide is acidic and thus is an excellent probe molecule for metal oxides. DRIFTS results shown in Figure 5 indicate that CO2 readily adsorbed on the activated catalyst, forming asymmetric (higher wavenumber) and symmetric (lower wavenumber) ν(OCO) stretching bands in the region between 1700 and 1200 cm−1 [32]. Figure 5 shows that there was more carbonate adsorbed on the catalysts with higher Na doping levels, indicating that Na increased the support basicity. Moreover, Figure 4 and Table 2 show that carbonate was more strongly held on the catalysts with greater Na content. For example, Table 2 shows that by 350 °C, almost 60% of the carbonate had decomposed on the catalyst without Na doping, while just 38% and 24% had decomposed on the 1% and 2.5% Na doped catalysts, respectively, at 350 °C.
Adsorption of methanol to the surface of H2-activated 2% Pt/YSZ diminished ν(OH) bands associated with bridging OH groups located at 3800–3600 cm−1 (Figure 6, bottom left) and produced bands characteristic of methoxy species (Figure 6, bottom right), including ν(OC) bands within 1175–1000 cm−1 and ν(CH) bands at 3100–2700 cm−1. The ν(OH) band intensity was lower in the case of the Na-doped catalyst (Figure 6, bottom left, spectrum b), indicating that the decrease in bridging OH groups for Na-doped catalyst was lower; this in turn suggests that Na doping may decrease the bridging OH group population on the catalyst surface. Moreover, unlike those on the Na-doped catalyst, the bridging OH groups that reacted for undoped 2% Pt/YSZ (Figure 6, bottom left, spectrum a) contained a higher fraction of Type I (3725, 3750 cm−1) rather than Type II (3650, 3690 cm−1) species. Likewise, a higher fraction of the higher wavenumber Type I [33] methoxy ν(OC) bands was observed for the undoped catalyst (Figure 6, bottom right, spectrum a), indicating that Na altered the ratio of adsorption sites to favor a higher fraction of sites with greater coordinative unsaturation.
DRIFTS results for the reaction of methoxy species with water are presented in Figure 6. At the start of steaming, the primary chemical species in the 3100–2700 cm−1 range during decomposition were methoxy species. With the undoped Pt/YSZ catalyst, a weak new band formed at 2866 cm−1 after 50% decomposition of the ν(CH) bands. This band became more pronounced at 67% and especially 88% decomposition of ν(CH) bands, and the position increased to 2868 cm−1. The band position was in good agreement with surface formate by comparison with a formate reference spectrum (pink spectrum) produced from the reaction of bridging OH groups with CO. With the Na-doped Pt/YSZ catalyst, a shift in band position to higher wavenumber from 2795 to 2801 and 2802 cm−1 in moving from methanol adsorption to 50% and 67% decomposition indicates the formation of a n species with a new chemical identity. As in the case of the undoped catalyst, a comparison with a formate reference spectrum formed by reacting CO with bridging OH groups also showed good agreement with the new chemical species. In summary, methoxy decomposition produces formate species that are similar to those observed previously in low temperature WGS studies. However, the fraction of formates on the catalyst surface was lower for the un-doped Pt/SZ than for Na-doped Pt/YSZ at similar extents of methanol decomposition. The weakening of the C-H bond of formate by Na was also observed in the case of MSR as the wavenumbers of the main ν(CH) shifts significantly, from 2869 cm−1 to 2800 cm−1.
The effect of the time on-stream (TOS.) on the conversion and product selectivity is reported in Figure 7 (left) for the undoped catalyst. The conversion is stable at each tested condition, while an evolution of the product selectivity was detected in the first few hours at 350 °C. In fact, in this condition, CO selectivity decreases from 68% to 44%, while CO2 selectivity increases from 31% to 54%. In contrast, CH4 selectivity was stable at a value of 1.2%. Liu et al. [20] have also observed that the CO selectivity decreases, while the CH3OH conversion and CO2 selectivity increases on 1Pt/30ZnO/Al2O3. The authors explained this phenomenon as an activation of the catalyst surface. At temperatures lower than 350 °C, both conversion and selectivities were stable with TOS. No deactivation phenomena were observed.
The effect of TOS on conversion and product selectivity is reported in Figure 7 (right) for the 2% Pt–2.5% Na/YSZ. In the first 2 h CH3OH conversion increases from 53% until the steady state value (58%), while CO and CO2 selectivities are stable at 10.1% and 89.7%, respectively. Steady state conversion and selectivities were reached faster when alkali was added.
CH3OH conversion systematically decreased by increasing sodium dopant from 0 to 2.5 wt.% (Table 3). This inhibition on the rate during MSR with Na doping was in sharp contrast to low temperature WGS and SAFAD results where an improvement was observed on both Pt/YSZ [23] or Pt/CeO2 [28,34]. However, the sodium addition had a beneficial effect on CO2 selectivity which was higher than 90% for 2% Pt–2.5% Na/YSZ sample in the temperature range of 275–350 °C. In contrast, only 19.7% of CO2 was detected at 275 °C for the undoped catalyst one and CO2 selectivity reached a value of 45.6% only at 350 °C. Even up to 350 °C, the CH4 selectivity remained quite low (<3% for all catalysts and <1% for the 2.5% Na doped case). Qi et al. [8] reported an enhancing of the CO2 production when Na or K is added. Contrary to our data, the authors also observed an improvement of the methanol conversion, however they used a K or Na promoted Ni/Al layered double hydroxide catalyst.
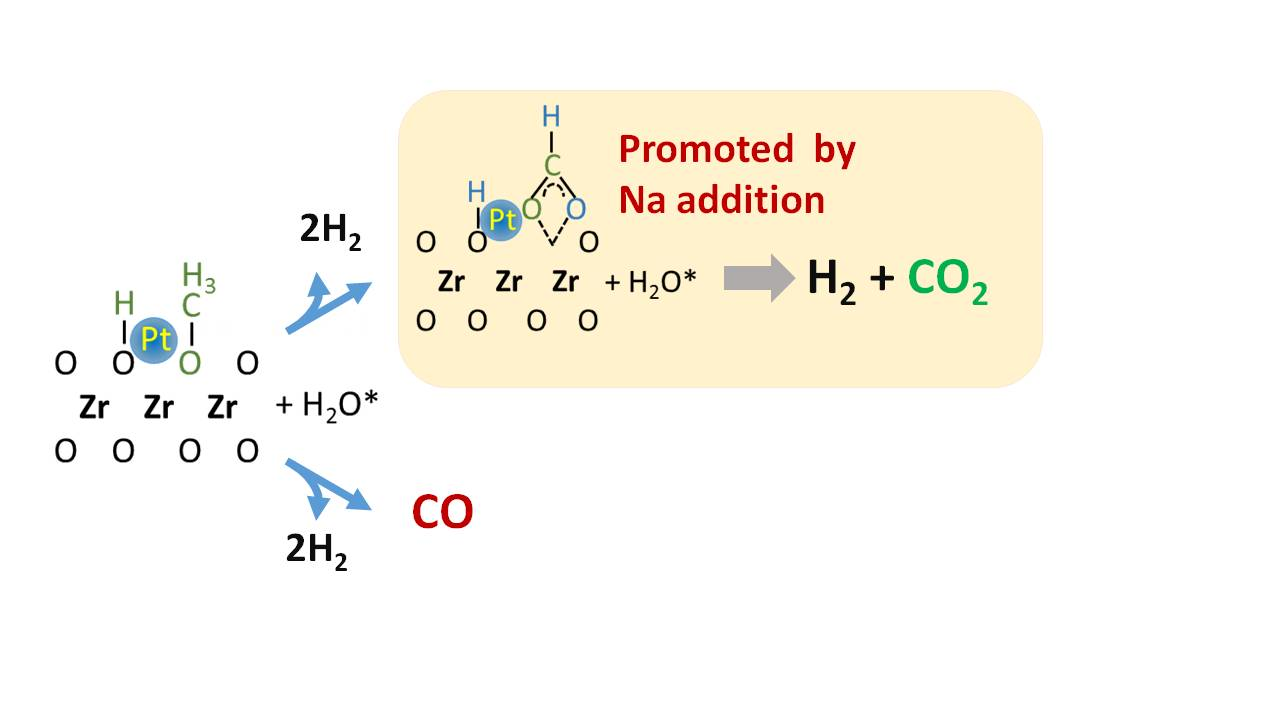
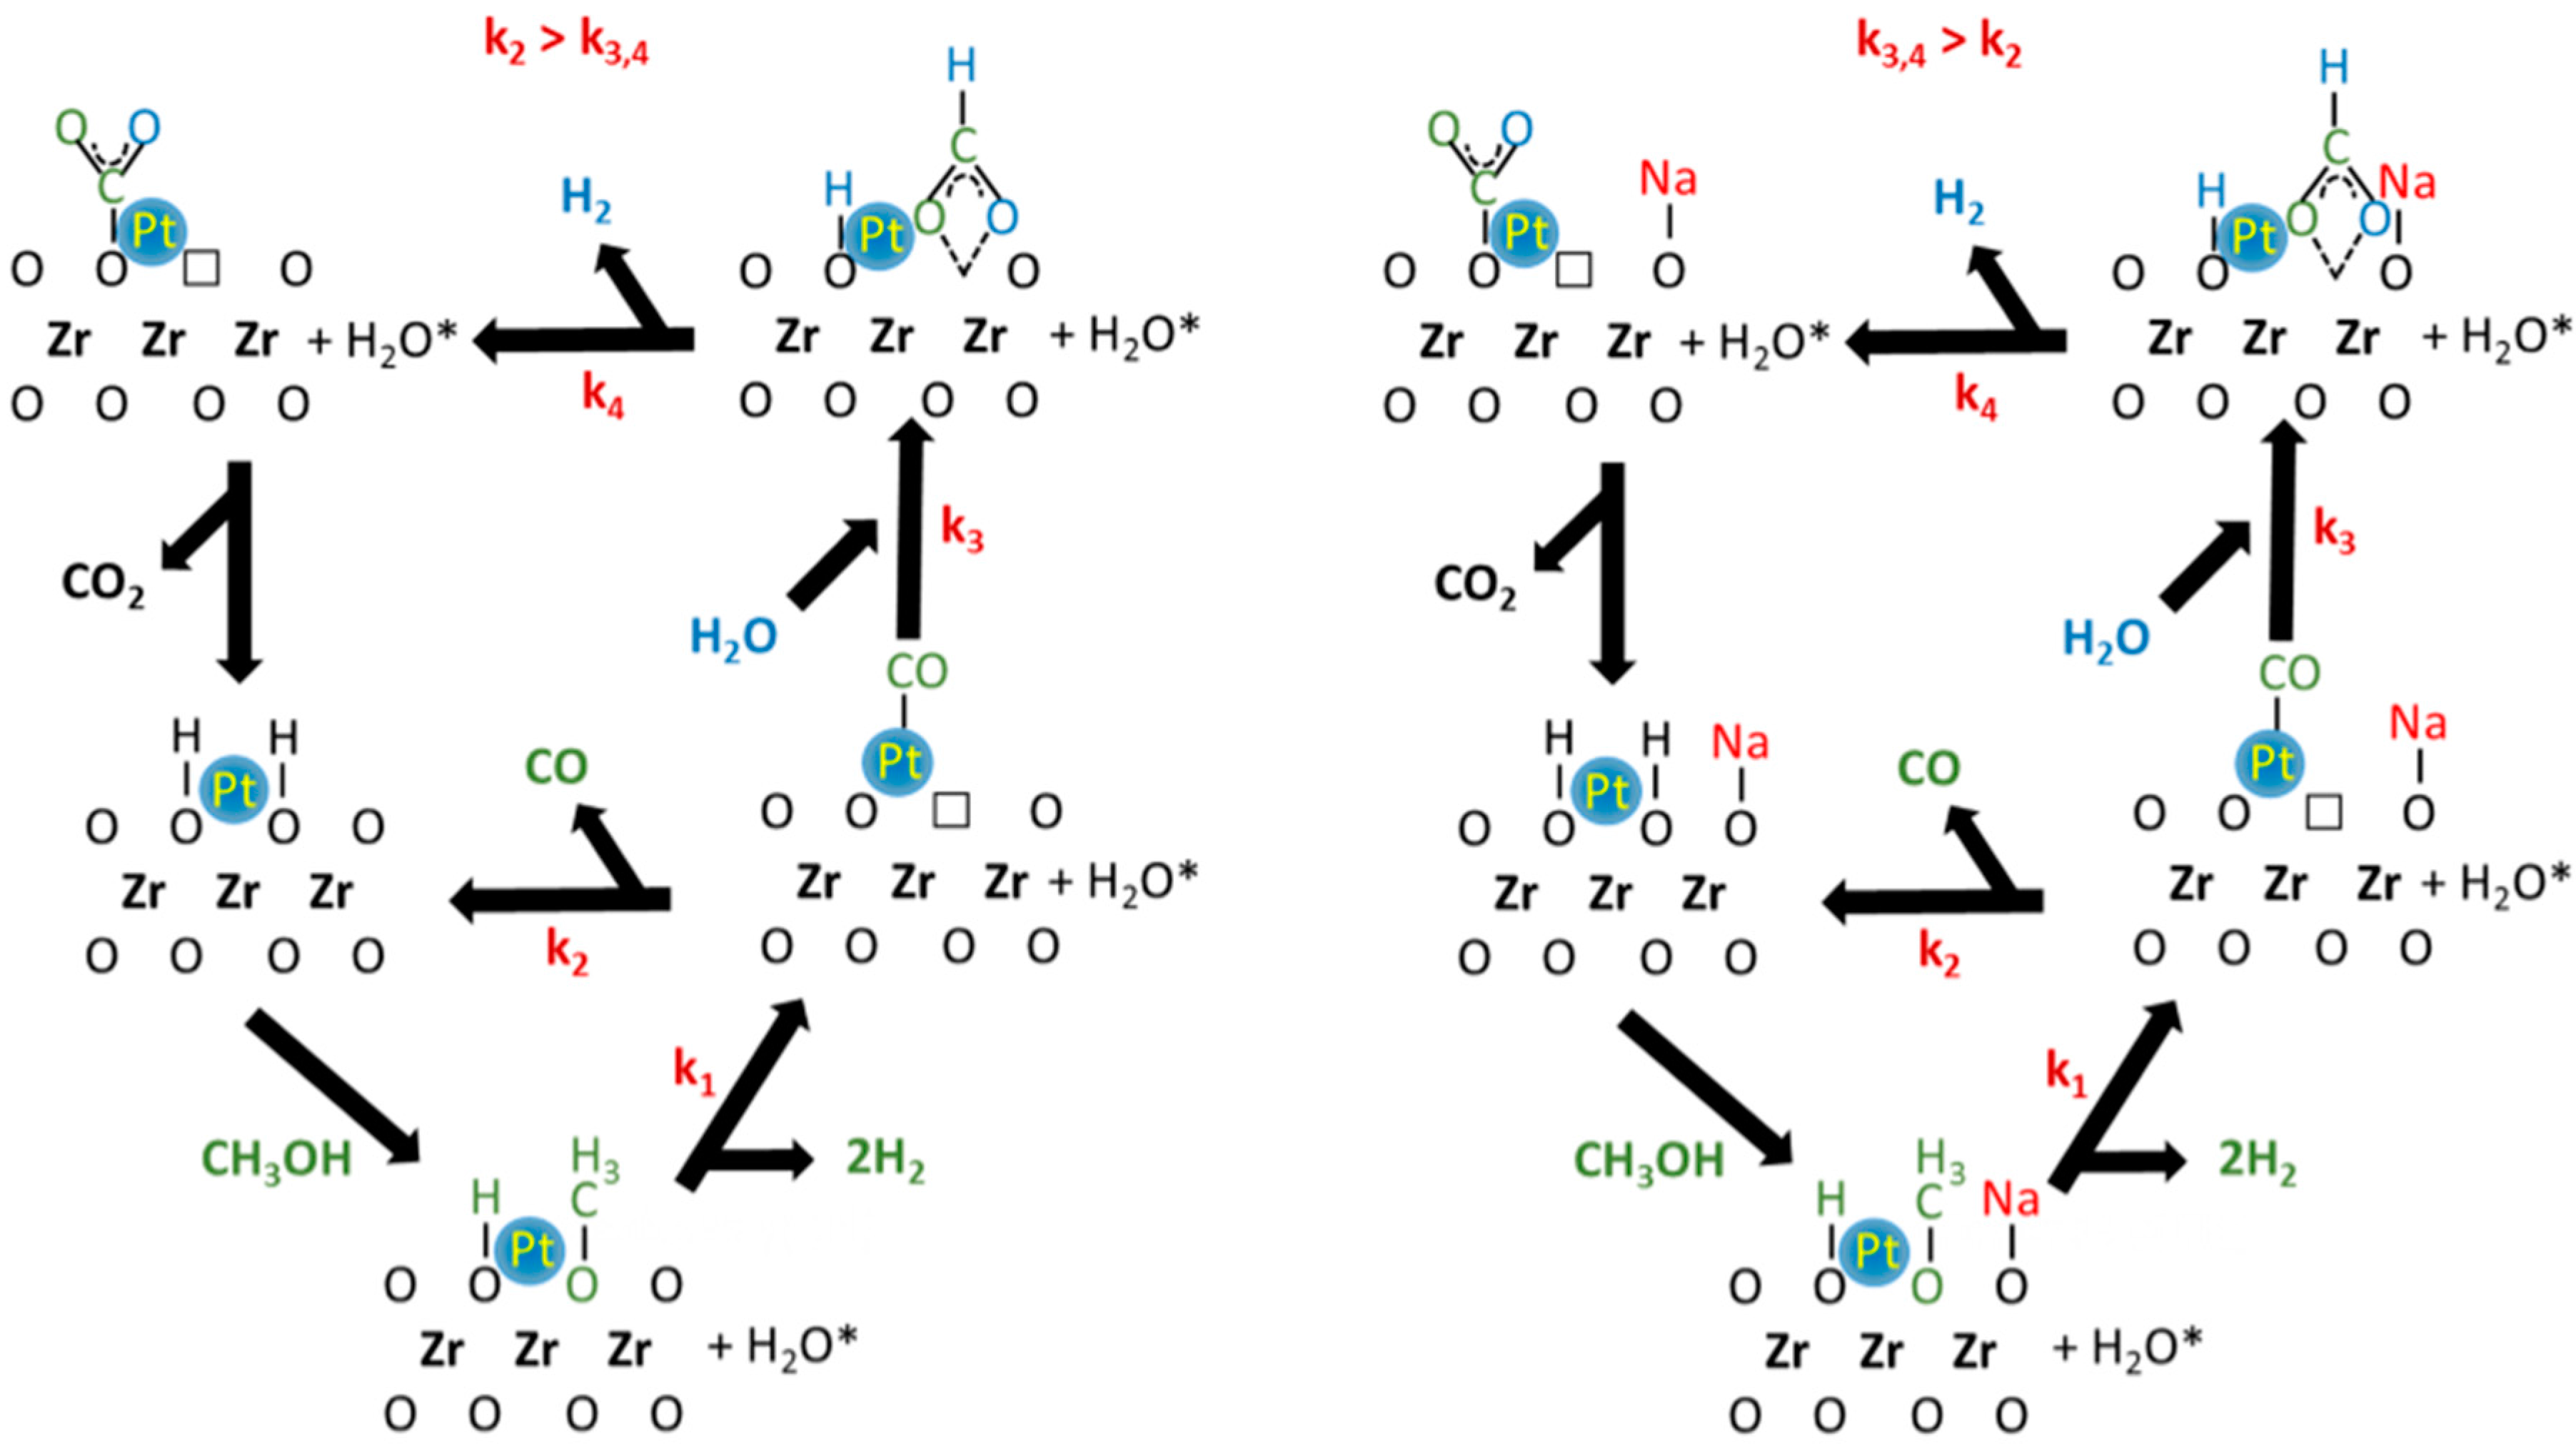
DRIFTS and catalytic activity results allow the proposal of a tentative reaction mechanism (Figure 8) involving defect sites on the oxide adjacent to metal particles. The proposed mechanism has the following steps: (1) dissociation of methanol on the defect sites of YSZ to produce adsorbed methoxy species and a bridging OH group; (2) decomposition of methoxy species to produce adsorbed CO and H2 (k1). Depending on the catalyst surface properties, adsorbed CO can desorb (k2) or can react with adsorbed H2O to produce formate species (k3). When water was present, formate species rapidly decomposed in the forward direction (k4) to produce H2 and monodentate carbonate, which then decomposes further to CO2. The different selectivity between the undoped and Na-doped catalyst may be explained by the values of the kinetic rate constants (k2, k3 or k4). In this proposal, k3,4 > k2 for the Na-doped catalyst, where CO2 is the main product detected during the activity test. Moreover, DRIFTS results suggested that a significant fraction of the methoxy species decomposed to formate. Since the C–H bond is weakened (i.e., the ν(CH) band of the formate is shifted at lower wavenumber), this increased the formate decomposition rate, promoting dehydrogenation and yielding CO2. The promoting impact of alkali on the formate decomposition rate is already well known for both WGS and SAFAD reactions [23,28,34].
The different selectivity observed for the undoped catalyst suggests that the main pathway is not the formate decomposition to CO2, but rather methanol decarbonylation (i.e., k2 > k3,4). The higher CO selectivity during MSR on group VIII has been previously reported by Iwasa and Tabezawa on Pd/Pt supported catalysts [17]. The authors explained that intermediate HCHO species rapidly decomposed due to strong back-donation of electron density from the metal to the πco* antibonding orbitals of this intermediate species. Thus, CO and H2 are primarily produced during MSR. Then, CO is then partially transformed to CO2 through the secondary WGS reaction [2]. The authors reported CO selectivity very close to 100%, but their supports that are not active for WGS. However, the YSZ support has an important role to play in the WGS mechanism, which may explain the lower CO selectivities obtained on our undoped catalyst. In contrast to Ranganathan et al. [12], we found that the more basic support was characterized by higher selectivity to CO2, but it is well known that the sodium improves the WGS rate, as well the rate and CO2 selectivity during the steam-assisted formic acid decomposition [23].
Na addition does not improve the methanol conversion rate. This is in contrast to WGS and SAFAD, where increases in the carbon-containing reactant (i.e., CO and HCOOH respectively) were observed. In those cases, formate was the primary intermediate and postulated to be involved in the rate-determining step. With MSR [23], an identical normal kinetic isotopic effect (NKIE) value was obtained for the Na-doped and the undoped catalyst during NKIE experiments, suggesting that the rate determining step, contrary to WGS and SAFAD, is not the formate decomposition, but more likely the methoxy dehydrogenation step (k1). However, Na-doping plays a critical role in selectivity control.
3. Materials and Methods
3.1. Catalyst Preparation
Yttria stabilized zirconia (YSZ), having a Y/Zr molar ratio of 0.11, was prepared by homogeneous precipitation. Zirconyl (Sigma Aldrich, 99%, St. Louis, MO, USA) and yttrium nitrates (Alfa Aesar, 99.9%, Haverhill, MA, USA) served as precursors and were precipitated with 1 M sodium hydroxide (Fisher Chemical, >97%, Hampton, NH, USA) following the procedure reported in [30]. The precipitate was filtered, washed, dried at 110 °C overnight, and then calcined at 400 °C (4 h). To this support, 2% by weight Pt was added by incipient wetness impregnation (IWI), and the catalyst dried (110 °C, overnight) and calcined (350 °C, 4 h). The prepared material was promoted with different sodium loadings (0.25, 0.5, 1 and 2.5 wt.%) by IWI of Na(NO3) solution (Alfa Aesar, 99.99%, Haverhill, MA, USA). Finally, the catalysts were dried at 110 °C (overnight) and re-calcined (300 °C, 3 h). The samples were sieved to 63 μm < ϕ < 106 μm for catalyst testing.
3.2. Catalyst Characterization
3.2.1. BET Analysis
BET surface area was measured using Micromeritics TRISTAR 3000 instrument (Micromeritics, Norcross, GA, USA). Approximately 300 mg of material was used. N2 (Scott-Gross Co., UHP, Lexington, KY, USA) served as the adsorption gas and analysis was conducted at the boiling point of liquid N2. Samples were outgased in vacuum for 12 h at 160 °C before conducting the physisorption measurements. Specific surface areas were assessed using the Brunauer-Emmett-Teller (BET) approach.
3.2.2. Temperature Programmed Reduction
Temperature programmed reduction (TPR) was performed on a Zeton-Altamira AMI-200 instrument (Altamira Instruments, Pittsburgh, PA, USA). Argon served as the reference gas, and 10% H2 in Ar (Scott-Gross Co., UHP, Lexington, KY, USA) was flowed at 30 cm3/min while temperature was ramped from 50 to 950 °C at 10 °C/min. The thermocouple was positioned within the catalyst bed; 100 mg of sample was used.
3.2.3. Scanning Transmission Electron Microscopy (STEM)
Catalyst powders were collected on copper grids for scanning transmission electron microscopy (STEM) analysis (200-mesh, Ted Pella, Inc., Redding, CA, USA). Transmission electron microscopy (TEM) imaging was performed using a JEOL 2010F (JEOL USA, Inc., Peabody, MA, USA) field-emission gun transmission electron microscope (accelerating voltage of 200 keV and magnification ranging from 50 K to 1000 K). A symmetrical multi-beam illumination was used for high-resolution imaging (HRTEM) with a beam resolution of 0.5 nm. Images were recorded with a Gatan Ultrascan 4 k × 4 k CCD camera (Gatan, Pleasanton, CA, USA). All data processing and analysis was performed using Gatan Digital Micrograph software (Gatan, Pleasanton, CA, USA). STEM imaging was performed with a high angle annular dark field (HAADF) detector and Gatan imaging filter (GIF, Gatan, Pleasanton, CA, USA).
3.2.4. Diffuse Reflectance Fourier Transform Infrared Spectroscopy
A Nicolet Nexus 870 IR spectrometer (ThermoFischer, Waltham, MA, USA) with a DTGS-TEC detector was utilized. A reaction cell with ZnSe windows served as the reactor for in situ measurements. Experimental procedures are detailed in reference [35].
H2 or CO chemisorption are not recommended for these systems due to the possibility of adsorption of both gases on ceria or zirconia [36,37]. In order to measure the Pt dispersion, CO adsorption experiments have been carried out for the prepared samples, and the intensity of the Pt carbonyl bands have been compared to those obtained for a Pt/Al2O3 reference sample. Firstly, the dispersion of Pt/Al2O3 was determined by H2 chemisorption. The catalyst was reduced in 100 cm3/min of 25% H2 (balance He Scott-Gross Co., UHP, Lexington, KY, USA) at 350 °C and then cooled in 100 cm3/min of helium (Scott-Gross Co., UHP, Lexington, KY, USA) to 50 °C. 100 cm3/min of 1% CO in helium (Scott-Gross Co., UHP, Lexington, KY, USA) was adsorbed for 20 min and then a purge in flowing helium (100 cm3/min) was carried out for 20 min at the same temperature.
For CO2 adsorption experiments, the catalyst was reduced in 100 cm3/min of 25% H2 (balance He, Scott-Gross Co., UHP, Lexington, KY, USA) at 350 °C and then cooled in 100 cm3/min of helium to 50 °C. 100 cm3/min of 5% CO2 in helium (Scott-Gross Co., UHP, Lexington, KY, USA) was adsorbed for 30 min and then a temperature programmed reduction (TPD) in flowing helium (100 cm3/min) was carried out, with scans performed at 50 °C, 100 °C, 200 °C, 300 °C, and 350 °C.
In the transient methanol decomposition test, the catalyst was activated in H2 (100 cm3/min, Scott-Gross Co., UHP, Lexington, KY, USA) at 350 °C for 1 h and cooled to 160 °C in flowing He (100 cm3/min). Methanol (Alfa Aesar, 99%, Haverhill, MA, USA) was adsorbed by flowing 82 cm3/min of helium through a bubbler to saturate the surface of the reduced catalyst with methoxy species at 160 °C. Decomposition of adsorbed methanol was performed by flowing 90 cm3/min of helium through a saturator filled with distilled water.
3.3. Reaction Testing
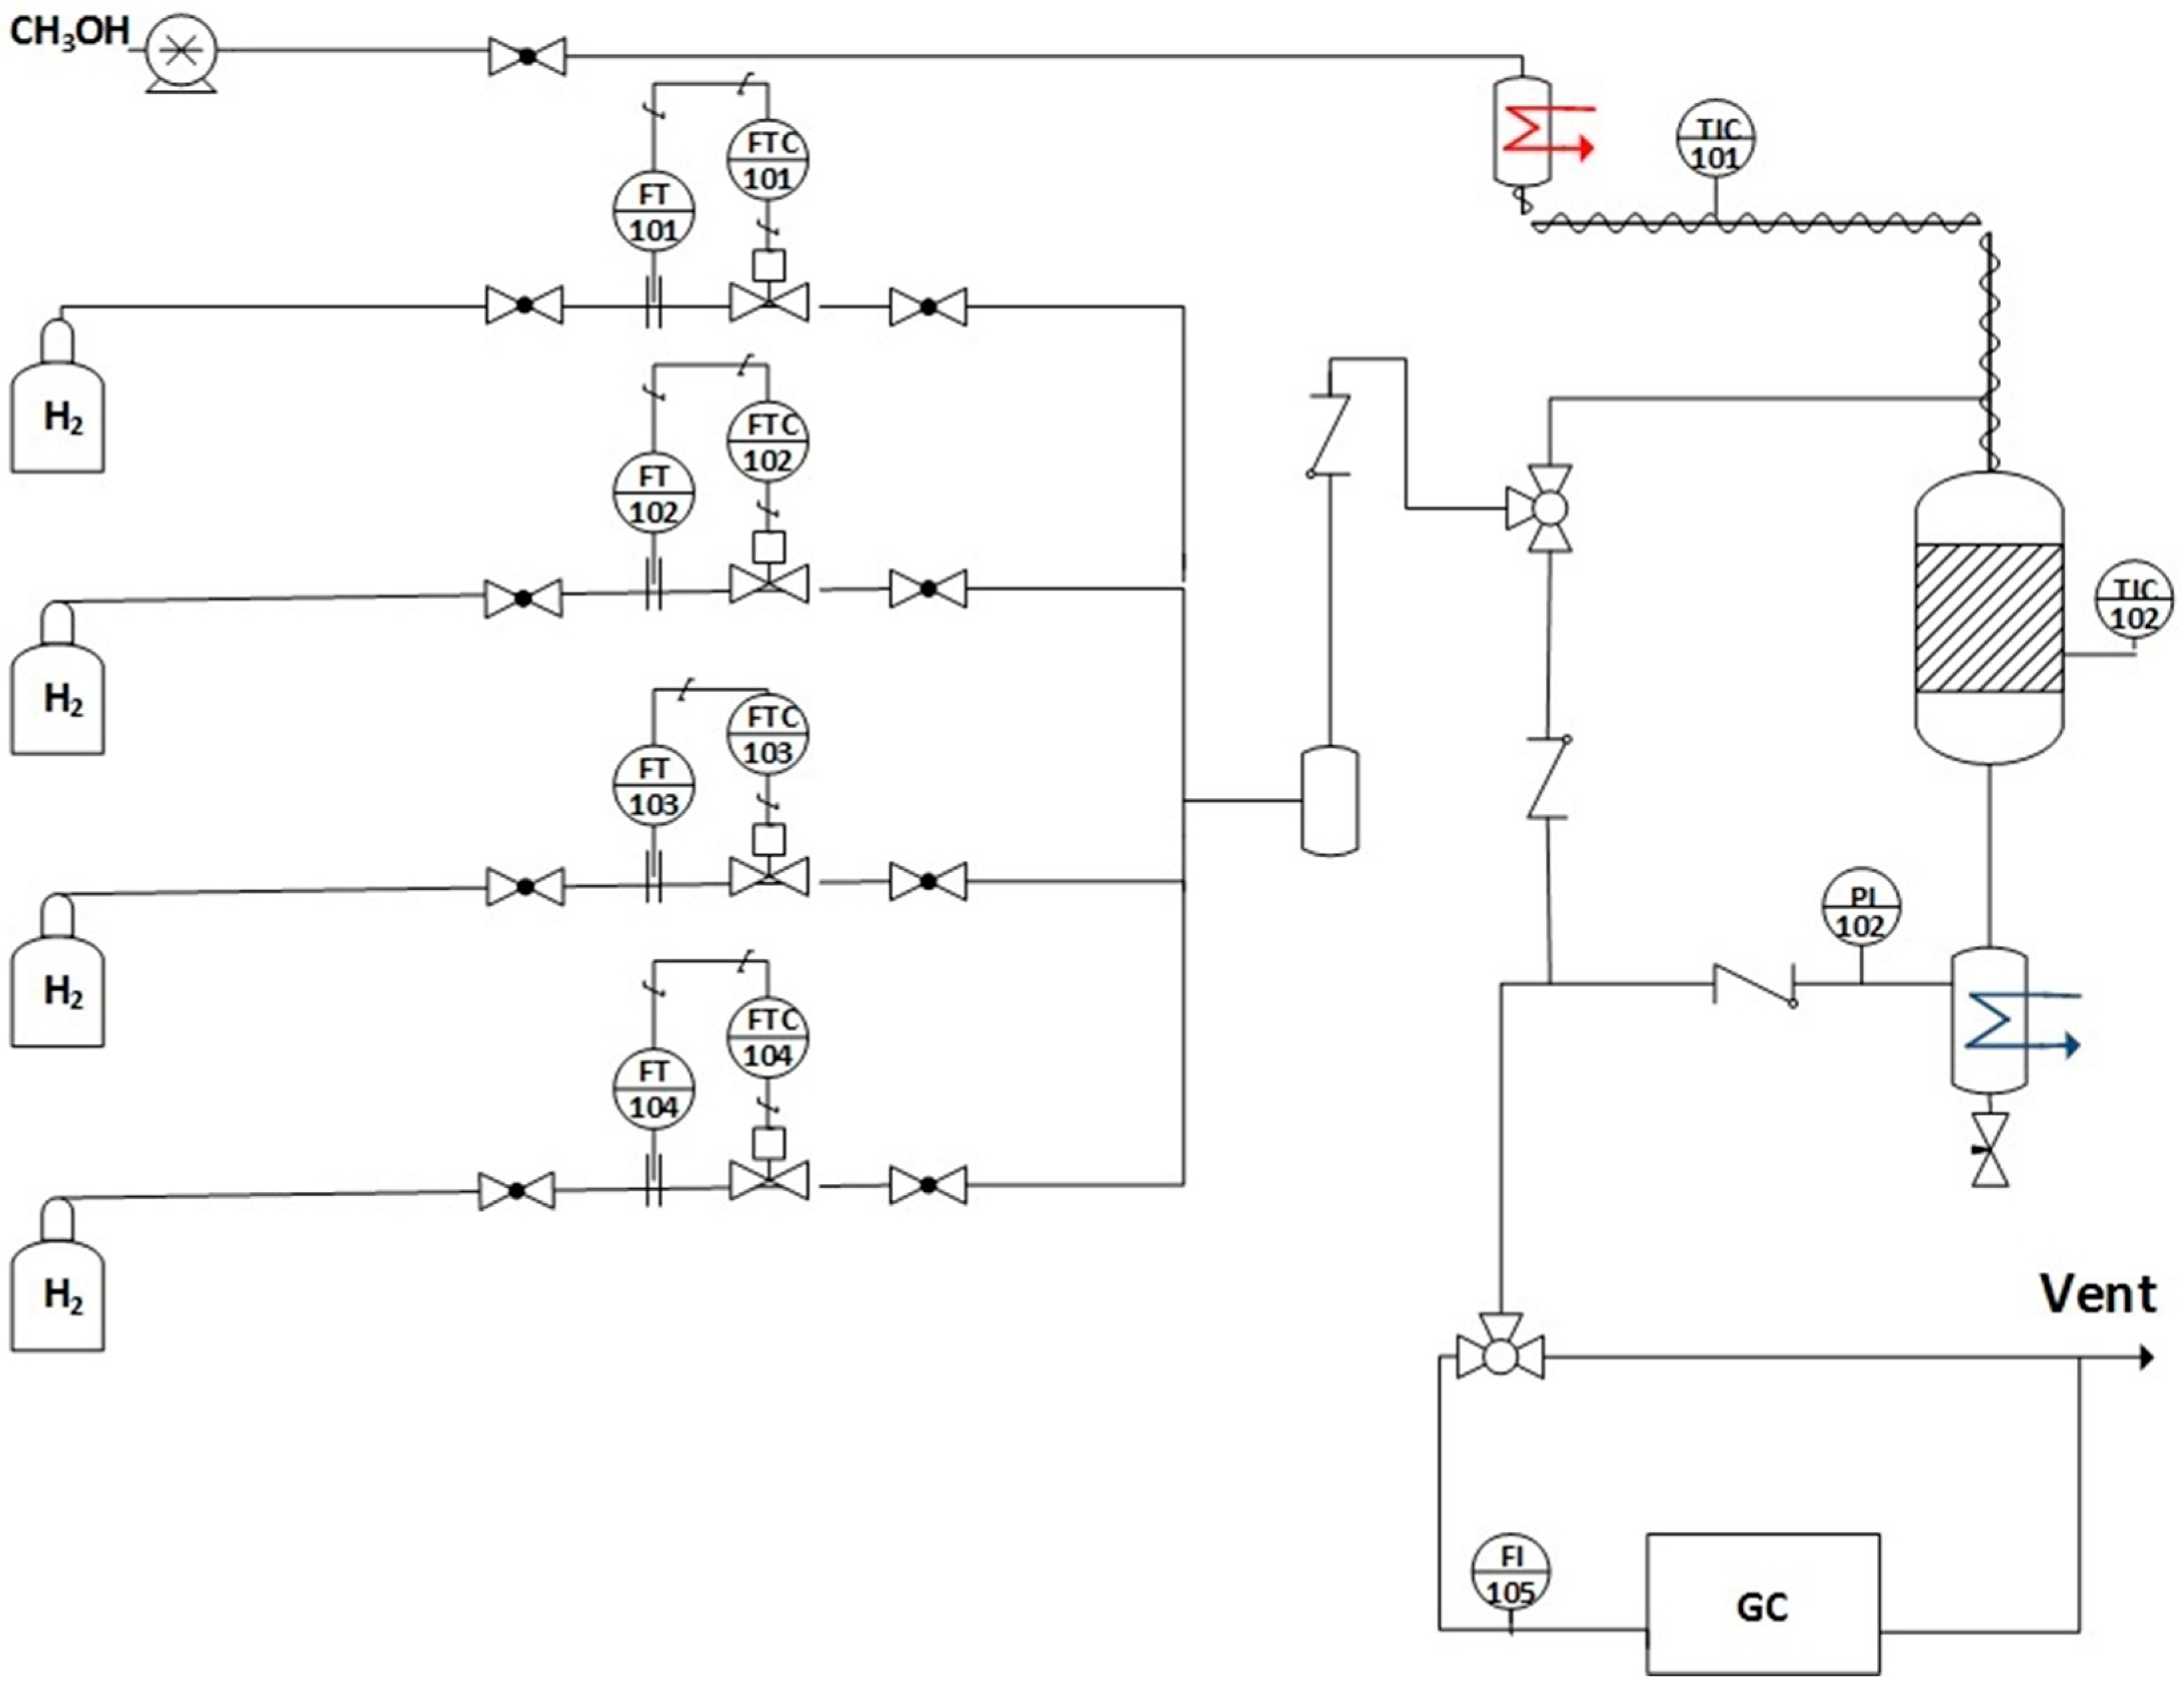
Catalytic tests were performed in a stainless steel tubular reactor (0.444 in. i.d.) with a fixed bed at steady state. The experimental setup, which was used for the reaction test, is sketched in Figure 9; additional details can be found elsewhere [23]. In a typical run, 40 mg of catalyst sample (63–106 µm) diluted with 500 mg of SiO2 beads (60–80 µm) were activated in hydrogen (100 cm3/min) at 350 °C for 1 h (ramp rate = 4 °C/min). Then, the gas was switched to a mixture containing 2.9% CH3OH (Alfa Aesar, 99%, Haverhill, MA, USA), 26.1% H2O, 29.9% H2, 4.3% N2 (balance He) at P = 1 atm, GHSV = 381,000 h−1, and T = 275–350 °C. Products passed through a cold trap (cooled to 0 °C) to collect condensable compounds and the gas phase was analyzed by on-line GC. The SRI 8610 GC has two columns (i.e., a 3.658 m silica gel packed column and a 1.829 m molecular sieve packed column) as well as two detectors (i.e., FID and TCD). To improve the sensitivity of the CO and CO2 signals, the SRI GC includes a methanizer (SRI, Torrance, CA, USA), so that analysis can be made by FID.
4. Conclusions
Na doping of Pt/YSZ was found to change the morphological properties as well as the reducibility profile. The reaction testing results demonstrate that CO2 selectivity can be boosted remarkably by simply increasing the sodium loading. Indeed, CO2 selectivity higher than 90% can be reached when the Na loading is 2.5 wt.% DRIFTS experiments have shown that adsorbed formates likely participate in the reaction pathway of Na-promoted Pt/YSZ catalysts. Furthermore, the formate produced on Na-doped Pt/YSZ exhibited ν(CH) stretching bands at low wavenumber, consistent with C-H bond weakening, favoring the formation of hydrogen and CO2. Consequently, the reaction of adsorbed CO with water to produce formate species, which subsequently decomposes to CO2, is favored over CO desorption (i.e., which occurs predominantly on the undoped catalyst). DRIFTS of adsorbed CO2 showed that the basicity of the catalyst is increased, while DRIFTS of adsorbed CO and STEM/EDS data indicated that Na was located on the support and in interaction with Pt nanoparticles (<2.5 nm).
Acknowledgments
This work was funded by the Commonwealth of Kentucky.
Author Contributions
All authors conceived and designed the experiments; M.M., G.J. and U.M.G. performed the experiments and analyzed the data; B.H.D. contributed reagents/materials/analysis tools; all authors wrote the paper.
Conflicts of Interest
The authors declare no conflict of interest.
References
- Ramirez, D.; Beites, L.F.; Blazquez, F.; Ballesteros, J.C. Distributed generation system with PEM fuel cell for electrical power quality improvement. Int. J. Hydrog. Energy 2008, 33, 4433–4443. [Google Scholar] [CrossRef]
- Palo, D.R.; Dagle, R.A.; Holladay, J.D. Methanol steam reforming for hydrogen production. Chem. Rev. 2007, 107, 3992–4021. [Google Scholar] [CrossRef] [PubMed]
- Olah, G.A. After oil and gas: Methanol economy. Catal. Lett. 2004, 93, 1–2. [Google Scholar] [CrossRef]
- Lindström, B.; Pettersson, L.J. Hydrogen generation by steam reforming of methanol over copper-based catalysts for fuel cell applications. Int. J. Hydrog. Energy 2001, 26, 923–933. [Google Scholar] [CrossRef]
- Papavasiliou, J.; Avgouropoulos, G.; Ioannides, T. Steady-state isotopic transient kinetic analysis of steam reforming of methanol over Cu-based catalysts. Appl. Catal. B Environ. 2009, 88, 490–496. [Google Scholar] [CrossRef]
- Peppley, B.A.; Amphlett, J.C.; Kearns, L.M.; Mann, R.F. Methanol–steam reforming on Cu/ZnO/Al2O3. Part 1: The reaction network. Appl. Catal. A Gen. 1999, 179, 21–29. [Google Scholar] [CrossRef]
- Peppley, B.A.; Amphlett, J.C.; Kearns, L.M.; Mann, R.F. Methanol–steam reforming on Cu/ZnO/Al2O3 catalysts. Part 2. A comprehensive kinetic model. Appl. Catal. A Gen. 1999, 179, 31–49. [Google Scholar] [CrossRef]
- Qi, C.; Amphlett, J.C.; Peppley, B.A. K (Na)-promoted Ni, Al layered double hydroxide catalysts for the steam reforming of methanol. J. Power Source 2007, 171, 842–849. [Google Scholar] [CrossRef]
- Jiang, C.J.; Trimm, D.L.; Wainwright, M.S.; Cant, N.W. Kinetic study of steam reforming of methanol over copper-based catalysts. Appl. Catal. A Gen. 1993, 93, 245–255. [Google Scholar] [CrossRef]
- Yao, C.; Wang, L.; Liu, Y.; Wu, G.; Cao, Y.; Dai, W.; He, H.; Fan, K. Effect of preparation method on the hydrogen production from methanol steam reforming over binary Cu/ZrO2 catalysts. Appl. Catal. A Gen. 2006, 297, 151–158. [Google Scholar] [CrossRef]
- Karim, A.M.; Conant, T.; Datye, A.K. Controlling ZnO morphology for improved methanol steam reforming reactivity. Phys. Chem. Chem. Phys. 2008, 10, 5584–5590. [Google Scholar] [CrossRef] [PubMed]
- Ranganathan, E.S.; Bej, S.K.; Thompson, L.T. Methanol steam reforming over Pd/ZnO and Pd/CeO2 catalysts. Appl. Catal. A Gen. 2005, 289, 153–162. [Google Scholar] [CrossRef]
- Conant, T.; Karim, A.M.; Lebarbier, V.; Wang, Y.; Girgsdies, F.; Schlögl, R.; Datye, A. Stability of bimetallic Pd–Zn catalysts for the steam reforming of methanol. J. Catal. 2008, 257, 64–70. [Google Scholar] [CrossRef]
- Suwa, Y.; Ito, S.-I.; Kameoka, S.; Tomishige, K.; Kunimori, K. Comparative study between Zn–Pd/C and Pd/ZnO catalysts for steam reforming of methanol. Appl. Catal. A Gen. 2004, 267, 9–16. [Google Scholar] [CrossRef]
- Iwasa, N.; Masuda, S.; Ogawa, N.; Takezawa, N. Steam reforming of methanol over Pd/ZnO: Effect of the formation of PdZn alloys upon the reaction. Appl. Catal. A Gen. 1995, 125, 145–157. [Google Scholar] [CrossRef]
- Jacobs, G.; Davis, B.H. In situ DRIFTS investigation of the steam reforming of methanol over Pt/ceria. Appl. Catal. A Gen. 2005, 285, 43–49. [Google Scholar] [CrossRef]
- Takezawa, N.; Iwasa, N. Steam reforming and dehydrogenation of methanol: Difference in the catalytic functions of copper and group VIII metals. Catal. Today 1997, 36, 45–56. [Google Scholar] [CrossRef]
- Iwasa, N.; Mayanagi, T.; Nomura, W.; Arai, M.; Takezawa, N. Effect of Zn addition to supported Pd catalysts in the steam reforming of methanol. Appl. Catal. A Gen. 2003, 248, 153–160. [Google Scholar] [CrossRef]
- Iwasa, N.; Yoshikawa, M.; Nomura, W.; Arai, M. Transformation of methanol in the presence of steam and oxygen over ZnO-supported transition metal catalysts under stream reforming conditions. Appl. Catal. A Gen. 2005, 292, 215–222. [Google Scholar] [CrossRef]
- Liu, D.; Men, Y.; Wang, J.; Kolb, G.; Liu, X.; Wang, Y.; Sun, Q. Highly active and durable Pt/In2O3/Al2O3 catalysts in methanol steam reforming. Int. J. Hydrog. Energy 2016, 41, 21990–21999. [Google Scholar] [CrossRef]
- Kaftan, A.; Kusche, M.; Laurin, M.; Wasserscheid, P.; Libuda, J. KOH-promoted Pt/Al2O3 catalysts for water gas shift and methanol steam reforming: An operando DRIFTS-MS study. Appl. Catal. B Environ. 2017, 201, 169–181. [Google Scholar] [CrossRef]
- Wichert, M.; Zapf, R.; Ziogas, A.; Kolb, G.; Klemm, E. Kinetic investigations of the steam reforming of methanol over a Pt/In2O3/Al2O3 catalyst in microchannels. Chem. Eng. Sci. 2016, 155, 201–209. [Google Scholar] [CrossRef]
- Martinelli, M.; Jacobs, G.; Shafer, W.D.; Davis, B.H. Effect of alkali on CH bond scission over Pt/YSZ catalyst during water-gas-shift, steam-assisted formic acid decomposition and methanol steam reforming. Catal. Today 2016. [Google Scholar] [CrossRef]
- Iwasa, N.; Mayanagi, T.; Ogawa, N.; Sakata, K.; Takezawa, N. New catalytic functions of Pd–Zn, Pd–Ga, Pd–In, Pt–Zn, Pt–Ga and Pt–In alloys in the conversions of methanol. Catal. Lett. 1998, 54, 119–123. [Google Scholar] [CrossRef]
- Bulushev, D.A.; Zacharska, M.; Guo, Y.; Beloshapkin, S.; Simakov, A. CO-free hydrogen production from decomposition of formic acid over Au/Al2O3 catalysts doped with potassium ions. Catal. Commun. 2017, 92, 86–89. [Google Scholar] [CrossRef]
- Iwasawa, Y. Surface catalytic reactions assisted by gas phase molecules. Acc. Chem. Res. 1997, 30, 103–109. [Google Scholar] [CrossRef]
- Brooks, A.H.C.J.; Yaccato, K.; Carhart, R.; Herrman, M.; Lesik, A.; Strasser, P.; Volpe, A.; Turner, H.; Weinberg, H. Combinatorial methods for the discovery of novel catalysts for the WGS reaction. In Proceedings of the 19th Meeting of the North American Catalysis Society, Philadelphia, PA, USA, 22–27 May 2005. [Google Scholar]
- Pigos, J.M.; Brooks, C.J.; Jacobs, G.; Davis, B.H. Low temperature water-gas shift: Characterization of Pt-based ZrO2 catalyst promoted with Na discovered by combinatorial methods. Appl. Catal. A Gen. 2007, 319, 47–57. [Google Scholar] [CrossRef]
- Davis, B.H.; Occelli, M.L. Advances in Fischer-Tropsch Synthesis, Catalysts, and Catalysis; CRC Press: Boca Raton, FL, USA, 2010; pp. 365–394. [Google Scholar]
- Martinelli, M.; Jacobs, G.; Graham, U.M.; Shafer, W.D.; Cronauer, D.C.; Kropf, A.J.; Marshall, C.L.; Khalid, S.; Visconti, C.G.; Lietti, L.; et al. Water-gas shift: Characterization and testing of nanoscale YSZ supported Pt catalysts. Appl. Catal. A Gen. 2015, 497, 184–197. [Google Scholar] [CrossRef]
- Davis, B.H.; Occelli, M.L. Fischer-Tropsch Synthesis, Catalysts and Catalysis: Advances and Applications; CRC Press: Boca Raton, FL, USA, 2016; pp. 309–326. [Google Scholar]
- Lavalley, J.C. Infrared spectrometric studies of the surface basicity of metal oxides and zeolites using adsorbed probe molecules. Catal. Today 1996, 27, 377–401. [Google Scholar] [CrossRef]
- Binet, C.; Daturi, M.; Lavalley, J.-C. IR study of polycrystalline ceria properties in oxidised and reduced states. Catal. Today 1999, 50, 207–225. [Google Scholar] [CrossRef]
- Pigos, J.M.; Brooks, C.J.; Jacobs, G.; Davis, B.H. Low temperature water–Gas shift: The effect of alkali doping on the CH bond of formate over Pt/ZrO2 catalysts. Appl. Catal. A Gen. 2007, 328, 14–26. [Google Scholar] [CrossRef]
- Jacobs, G.; Williams, L.; Graham, U.; Thomas, G.A.; Sparks, D.E.; Davis, B.H. Low temperature water–Gas shift: In situ DRIFTS-reaction study of ceria surface area on the evolution of formates on Pt/CeO2 fuel processing catalysts for fuel cell applications. Appl. Catal. A Gen. 2003, 252, 107–118. [Google Scholar] [CrossRef]
- Rogemond, E.; Essayem, N.; Frety, R.; Perrichon, V.; Primet, M.; Mathis, F. Characterization of model three-way catalysts. J. Catal. 1997, 166, 229–235. [Google Scholar] [CrossRef]
- Pantu, P.; Gavalas, G.R. Methane partial oxidation on Pt/CeO2 and Pt/Al2O3 catalysts. Appl. Catal. A Gen. 2002, 223, 253–260. [Google Scholar] [CrossRef]
Figure 1.
Results of temperature programmed reduction (a) 2% Pt/YSZ (b) 2% Pt–0.25 Na/YSZ (c) 2% Pt–0.5% Na/YSZ (d) 2% Pt–1% Na/YSZ (e) 2% Pt–2.5% Na/YSZ (heating from room temperature to 950 °C at 10 °C/min, 30 cm3/min, H2/He 10/90 v/v).
Figure 1.
Results of temperature programmed reduction (a) 2% Pt/YSZ (b) 2% Pt–0.25 Na/YSZ (c) 2% Pt–0.5% Na/YSZ (d) 2% Pt–1% Na/YSZ (e) 2% Pt–2.5% Na/YSZ (heating from room temperature to 950 °C at 10 °C/min, 30 cm3/min, H2/He 10/90 v/v).
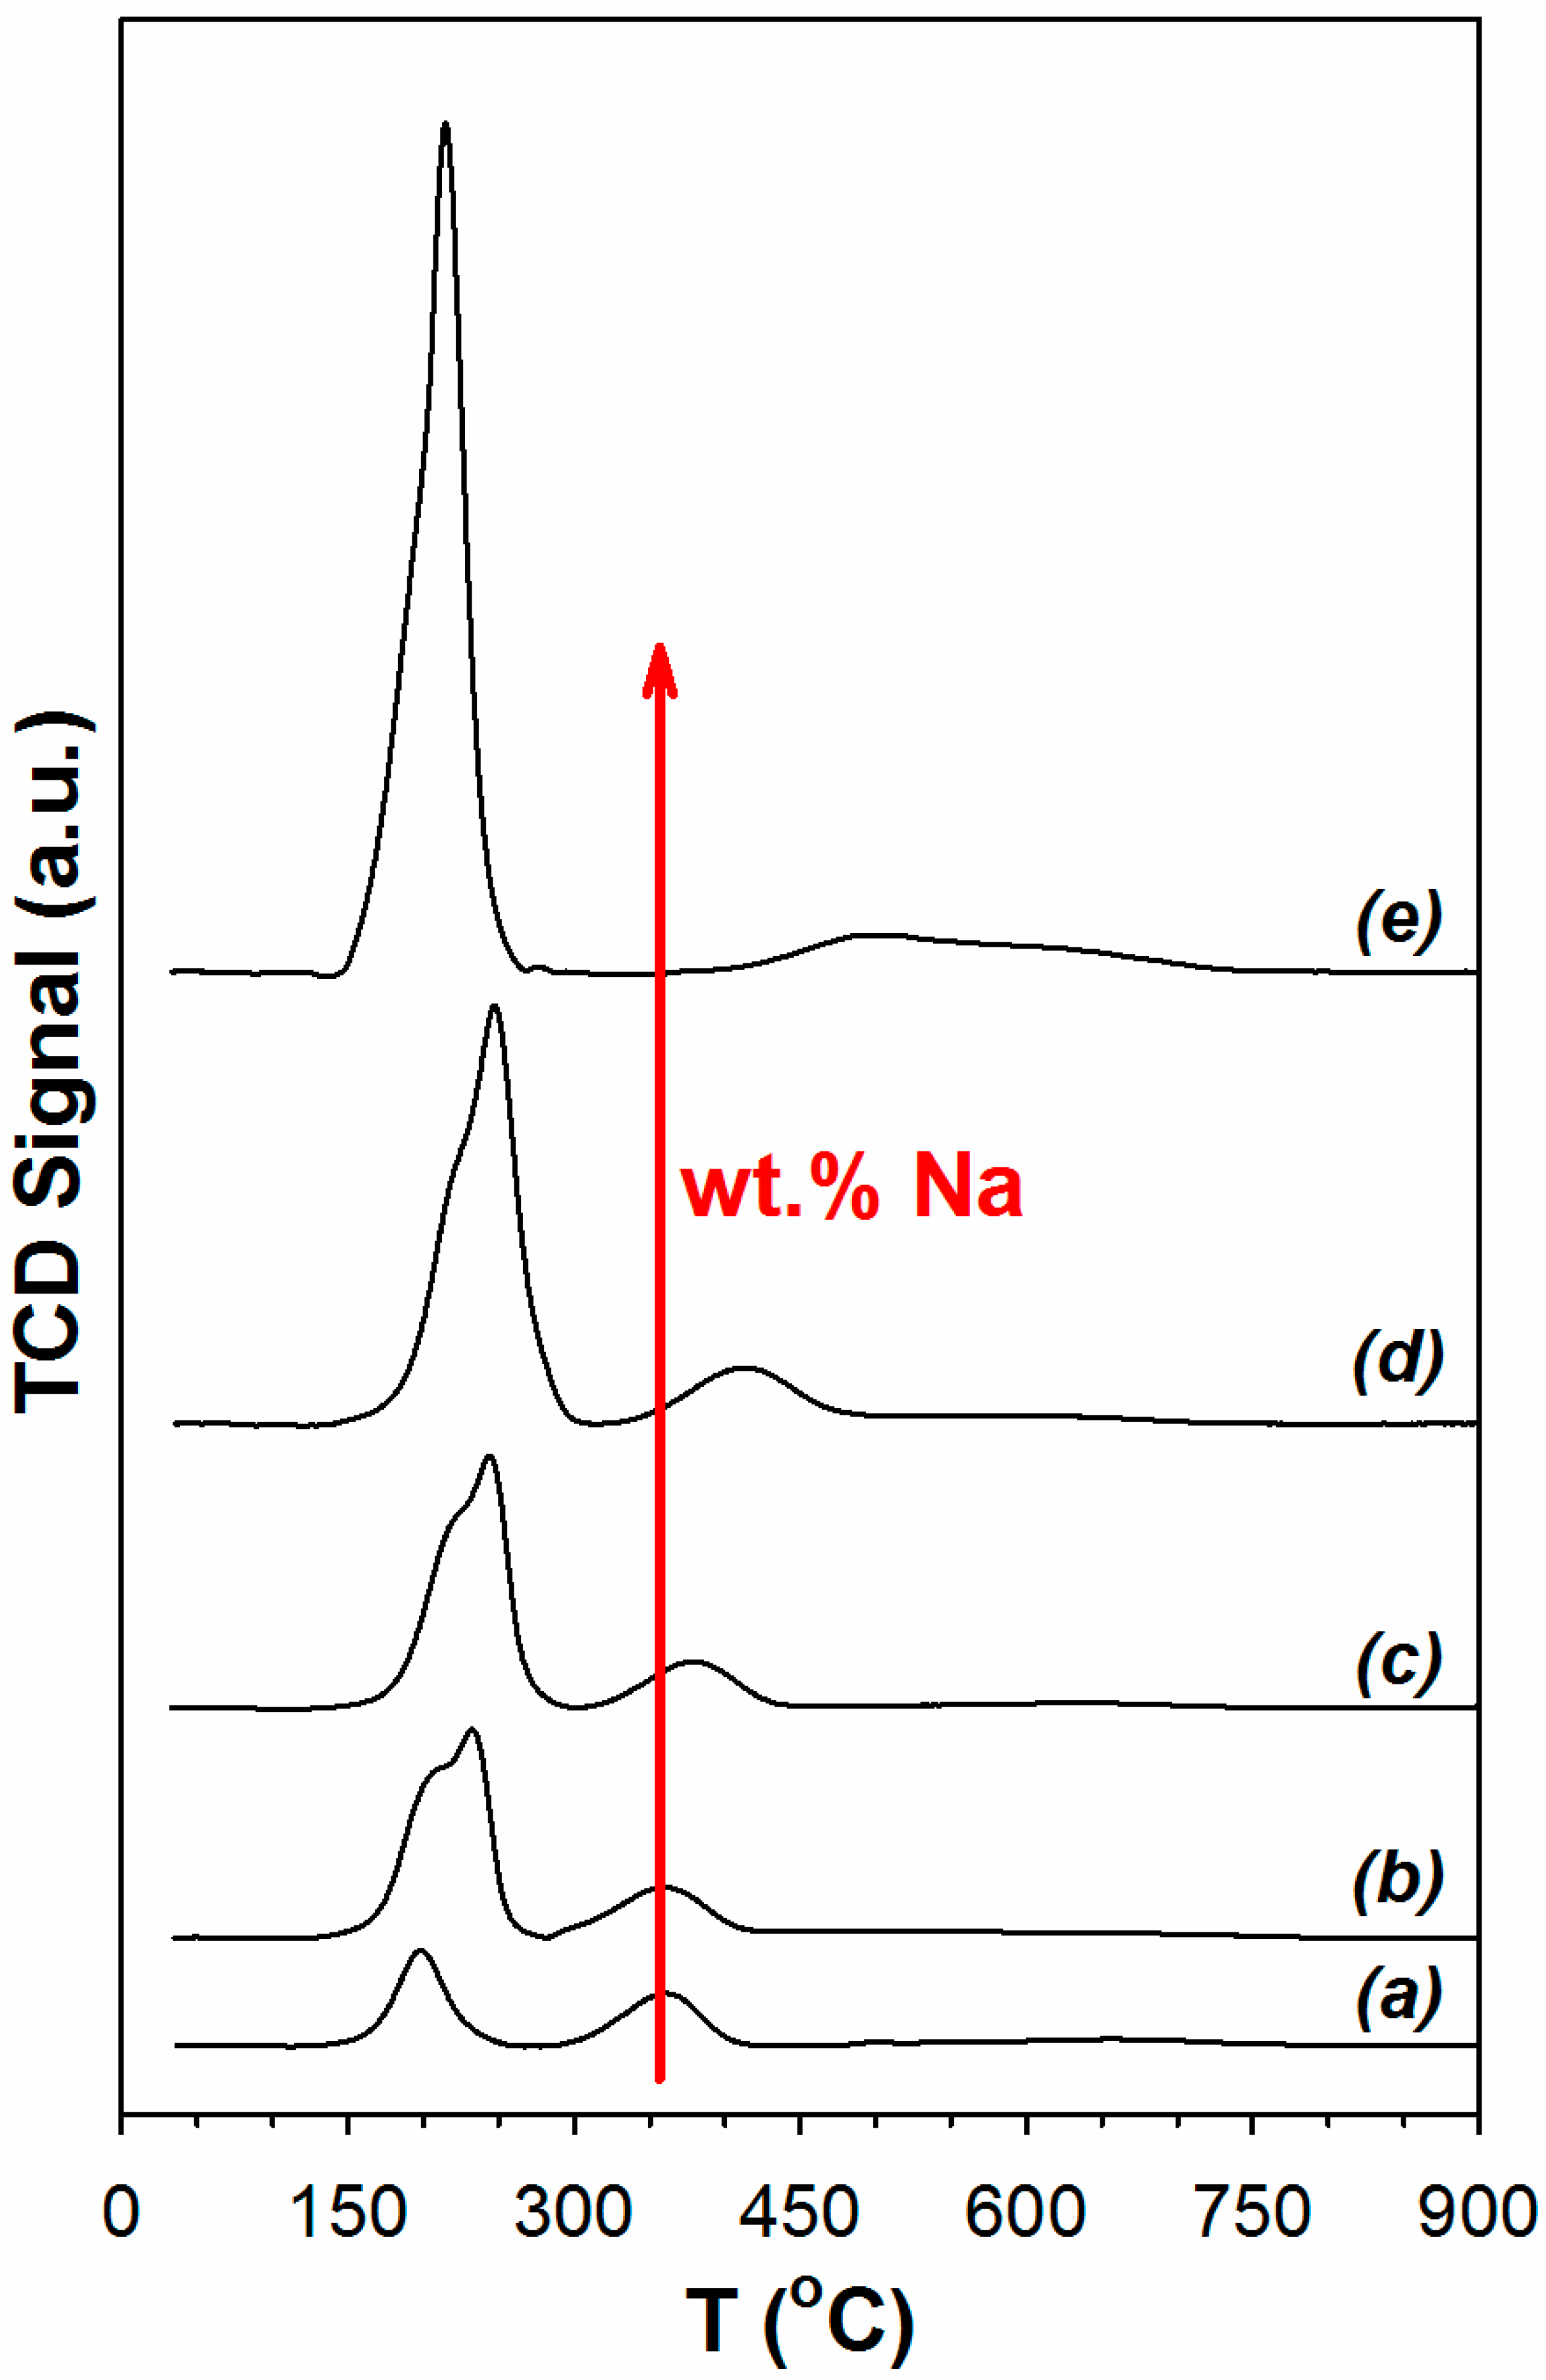
Figure 2.
Transmission electron microscopy (TEM) (a) and high-resolution transmission electron microscopy (HRTEM) (b) images of yttrium stabilized zirconia support with Pt nanoparticle dispersion. TEM (c) and HRTEM (d) images of Na-yttrium stabilized zirconia support with Pt nanoparticle dispersion.

Figure 3.
High resolution scanning transmission electron microscopy (STEM) and energy dispersive X-ray spectroscopy (EDS) analysis: (a) analysis in area without Pt nanoparticle on Na-Yttrium stabilized zirconia support; (b) analysis over area with 2.5 nm Pt nanoparticle.
Figure 3.
High resolution scanning transmission electron microscopy (STEM) and energy dispersive X-ray spectroscopy (EDS) analysis: (a) analysis in area without Pt nanoparticle on Na-Yttrium stabilized zirconia support; (b) analysis over area with 2.5 nm Pt nanoparticle.
Figure 4.
(left) Diffusive reflectance infrared Fourier transform spectroscopy (DRIFTS) of adsorbed CO shows ν(CH) and ν(OCO) asymmetric and symmetric stretching bands of formate; (right) Adding Na shifts the Pt-carbonyl bands systematically to lower T. Following the arrow, this includes undoped and Na-doped Pt/YSZ with 0.25, 0.5, 1, and 2.5 wt.% Na.
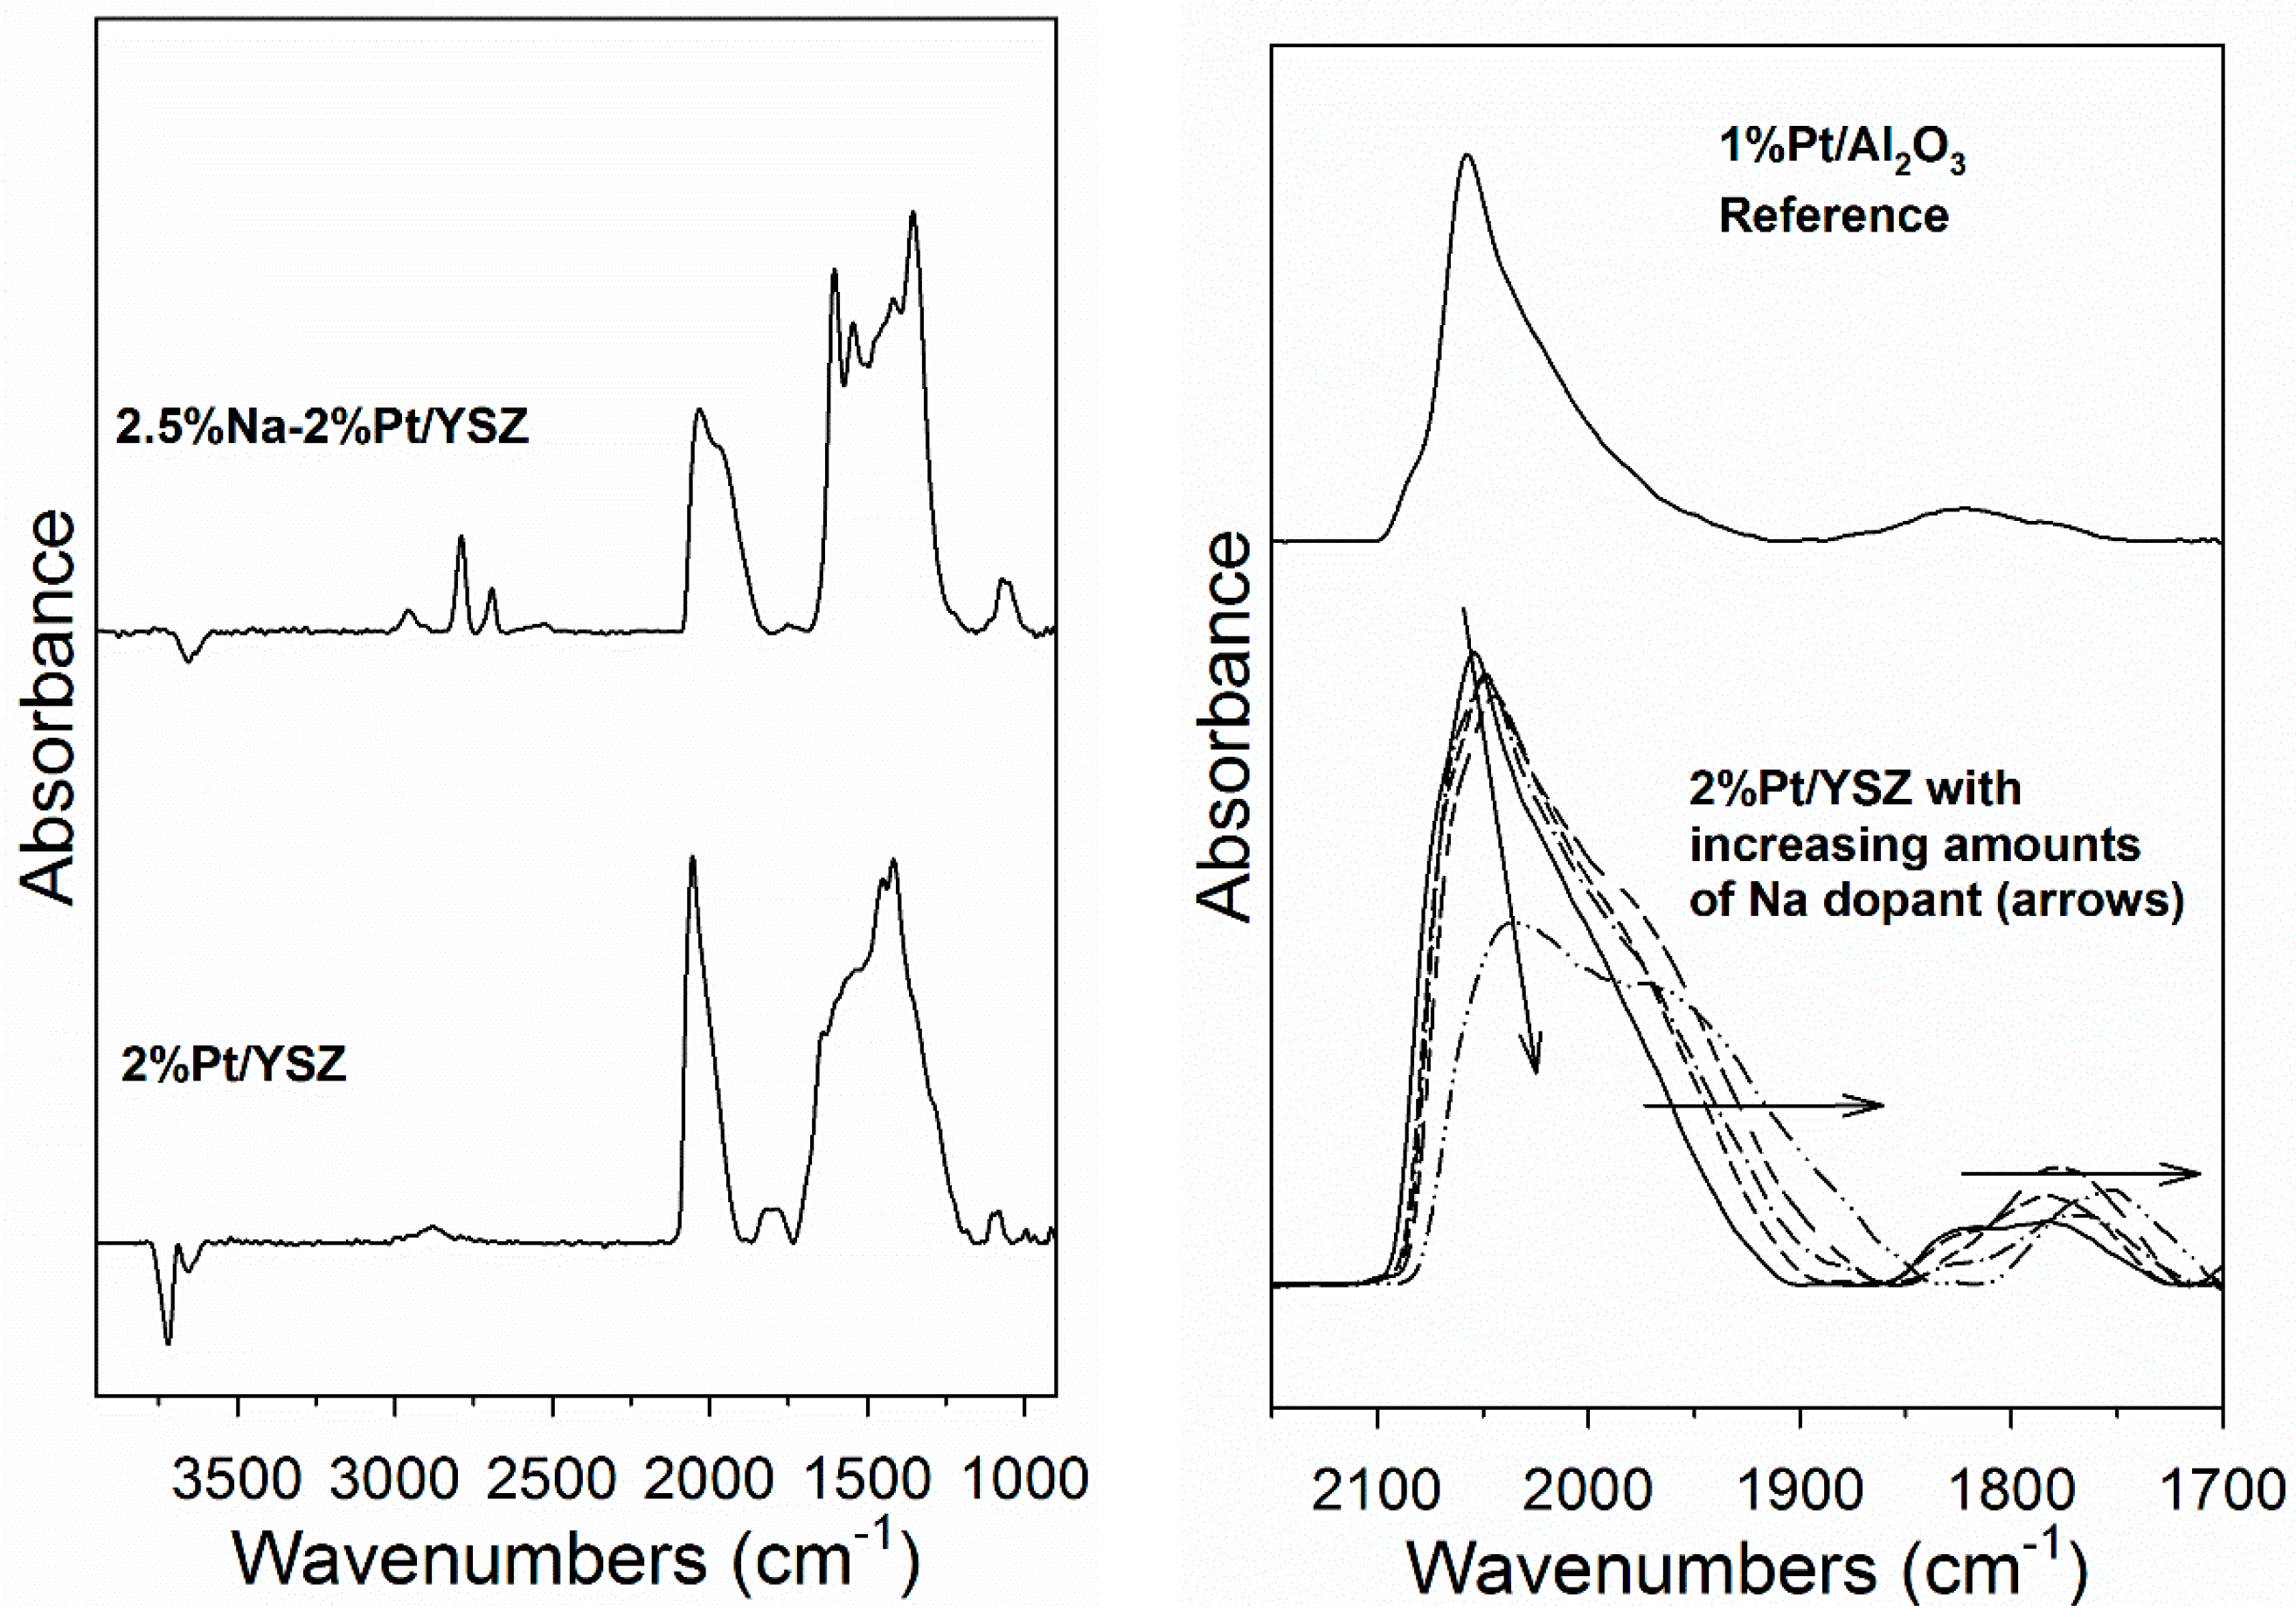
Figure 5.
DRIFTS spectra during CO2 temperature programmed desorption (TPD) for 2% Pt/YSZ (dashed line), 2% Pt–1% Na/YSZ (solid line) and 2% Pt–2.5% Na/YSZ (dashed-dotted line) catalyst following reduction in 25% H2 at 350 °C.
Figure 5.
DRIFTS spectra during CO2 temperature programmed desorption (TPD) for 2% Pt/YSZ (dashed line), 2% Pt–1% Na/YSZ (solid line) and 2% Pt–2.5% Na/YSZ (dashed-dotted line) catalyst following reduction in 25% H2 at 350 °C.
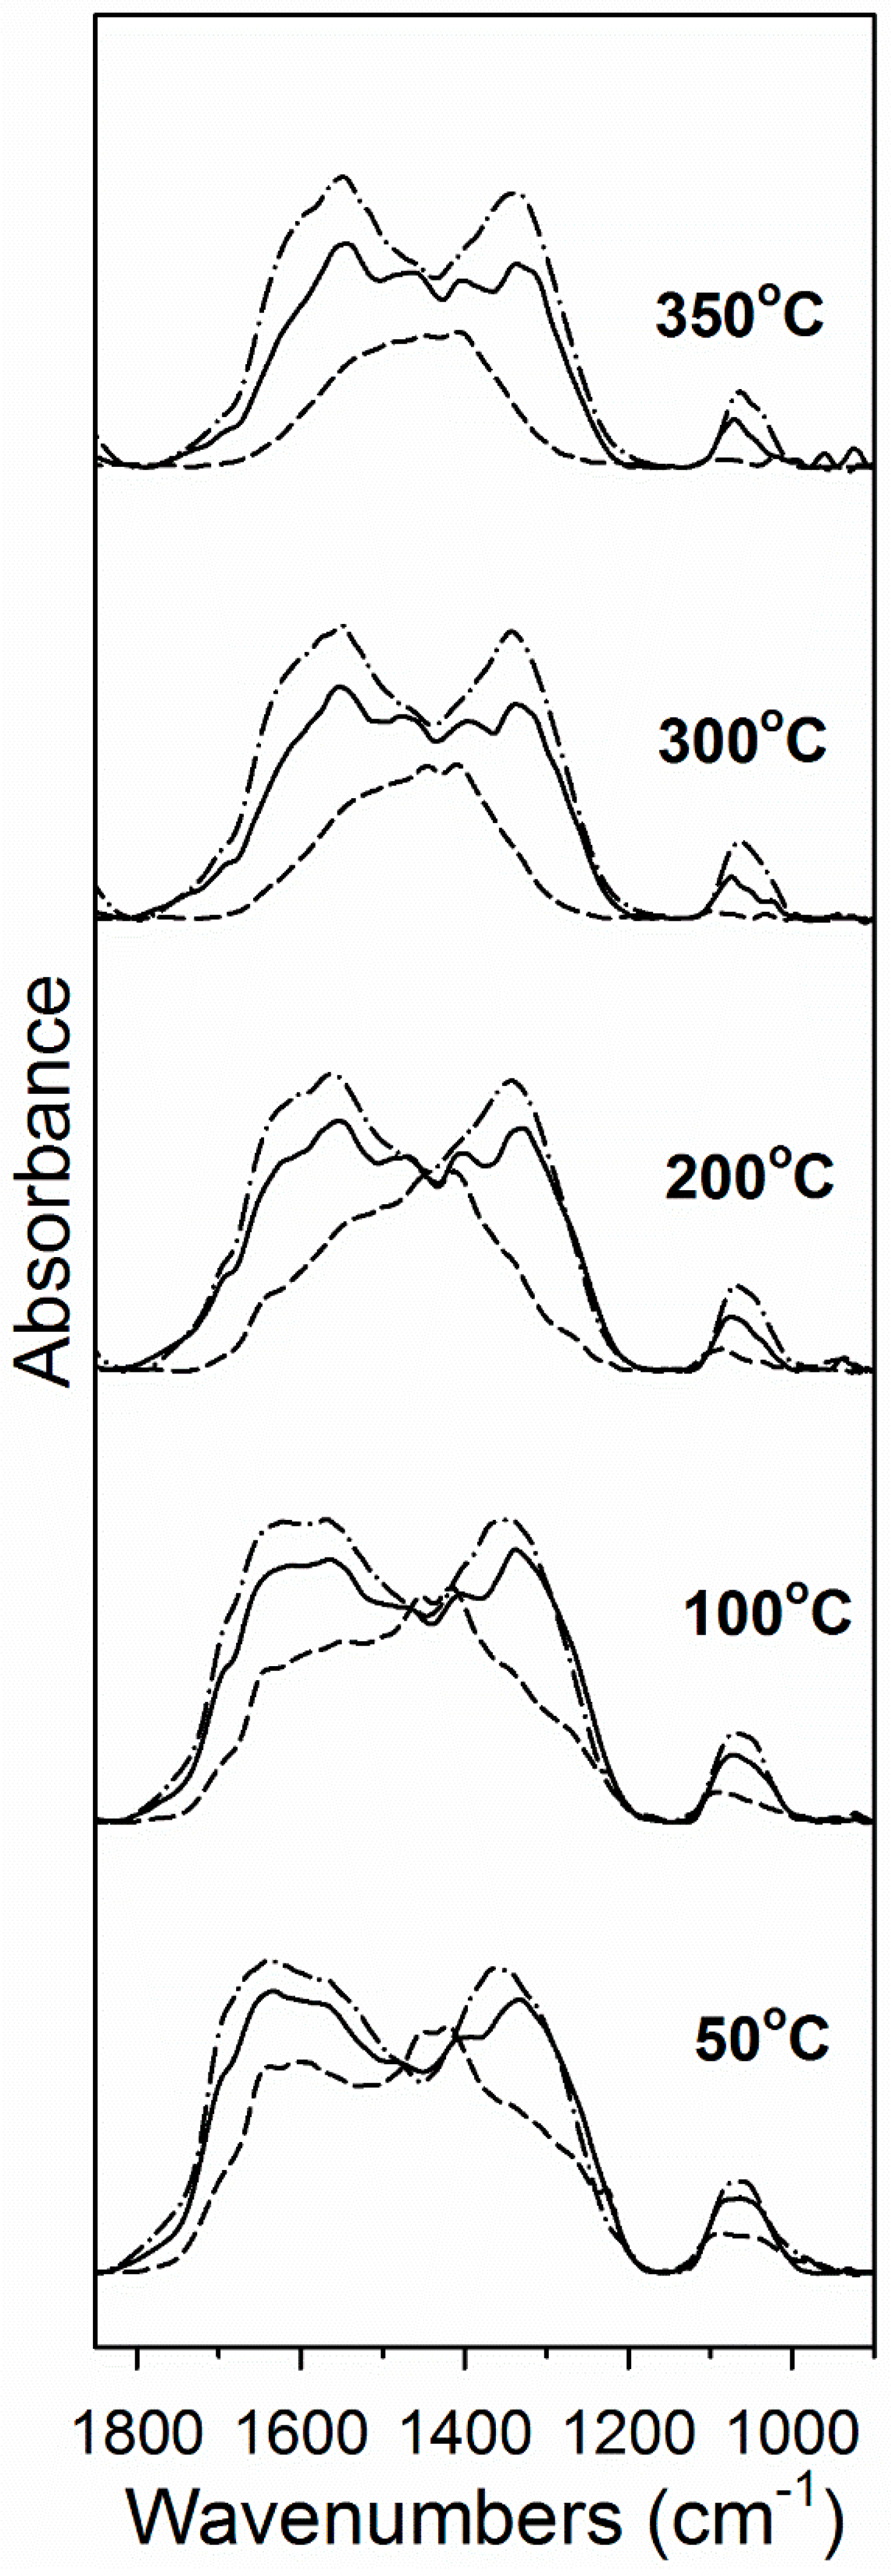
Figure 6.
(Top) DRIFTS spectra in the ν(CH) region after (red) adsorption of MeOH; (pink) formation of formate from reacting CO with bridging OH species; catalyst after (blue) 50%, (green) 67%, or (cyan) 88% of ν(CH) region bands decomposed in H2O, including (top left) 2% Pt/YSZ and (top right) 2% Pt–2.5% Na/YSZ. Bands were normalized by area in the range 2725–3100 cm−1 for the purpose of comparison. (Bottom left) Decrease in ν(OH) bands and (bottom right) formation of methoxy ν(OC) bands during adsorption of MeOH for (a) 2% Pt/YSZ and (b) 2% Pt–2.5% Na/YSZ.
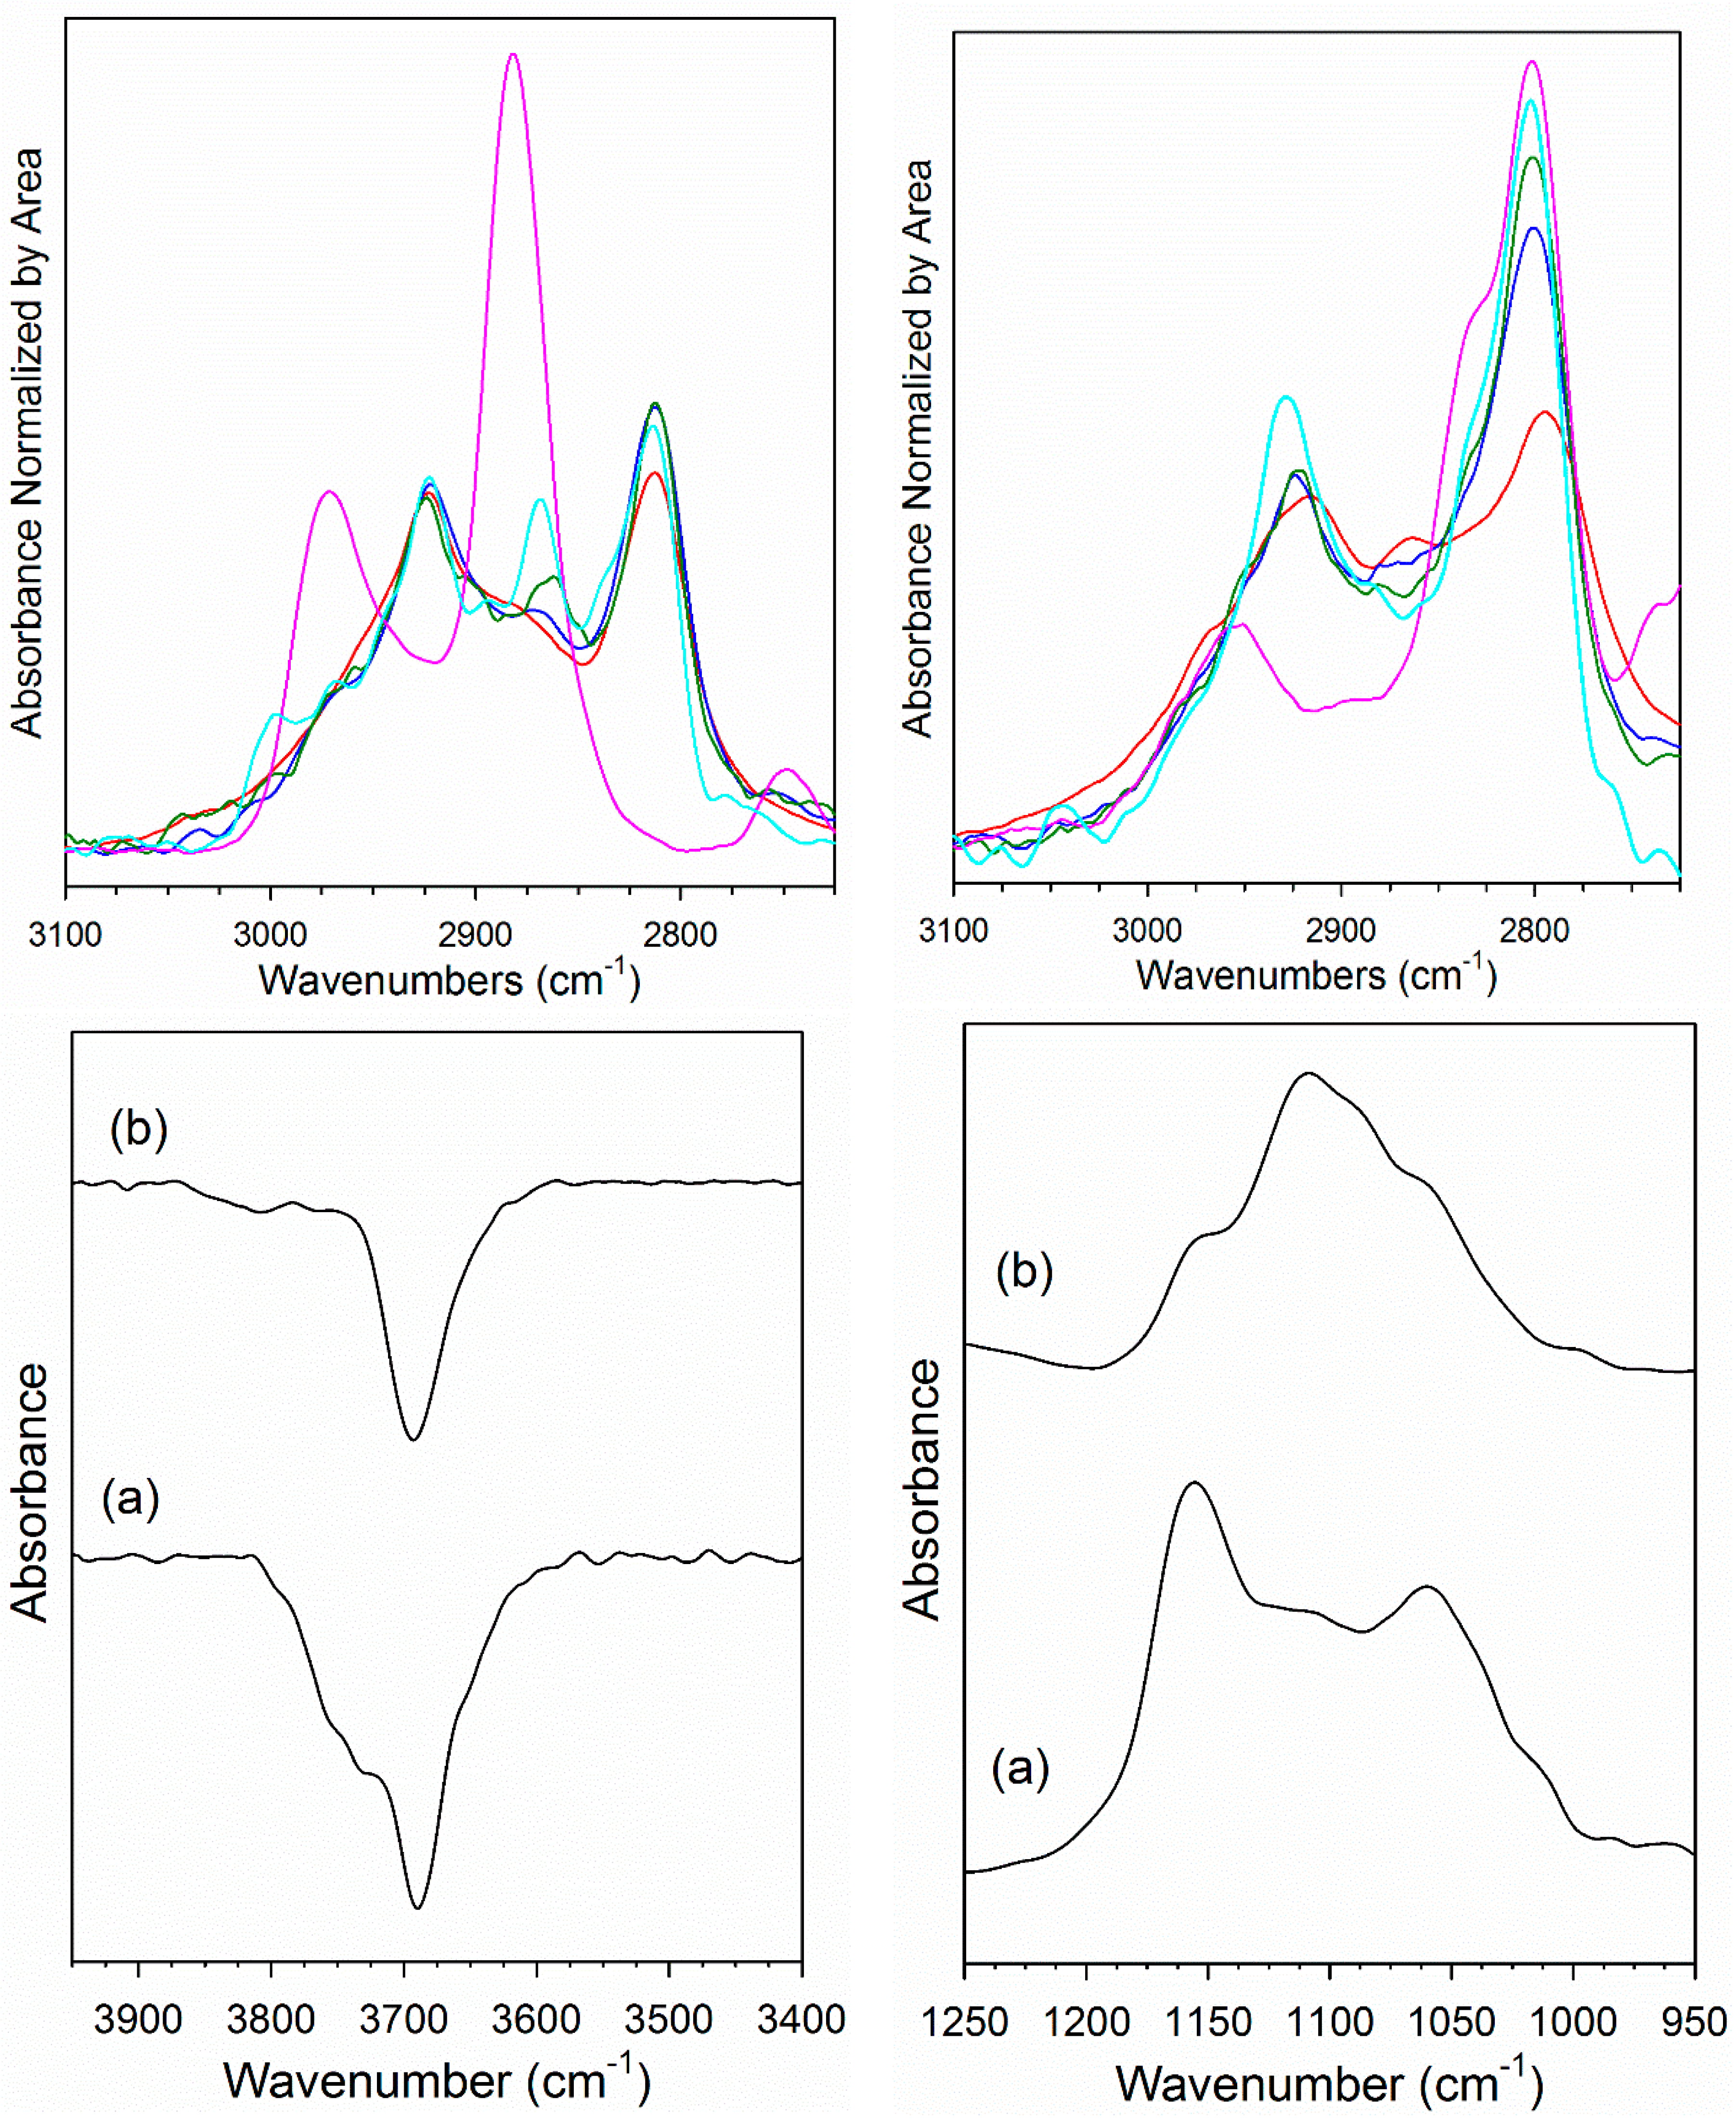
Figure 7.
Evolution with time on-stream (TOS) of CH3OH conversion and product selectivity for 2% Pt/YSZ (left) and 2% Pt–2.5% Na/YSZ (right).
Figure 7.
Evolution with time on-stream (TOS) of CH3OH conversion and product selectivity for 2% Pt/YSZ (left) and 2% Pt–2.5% Na/YSZ (right).
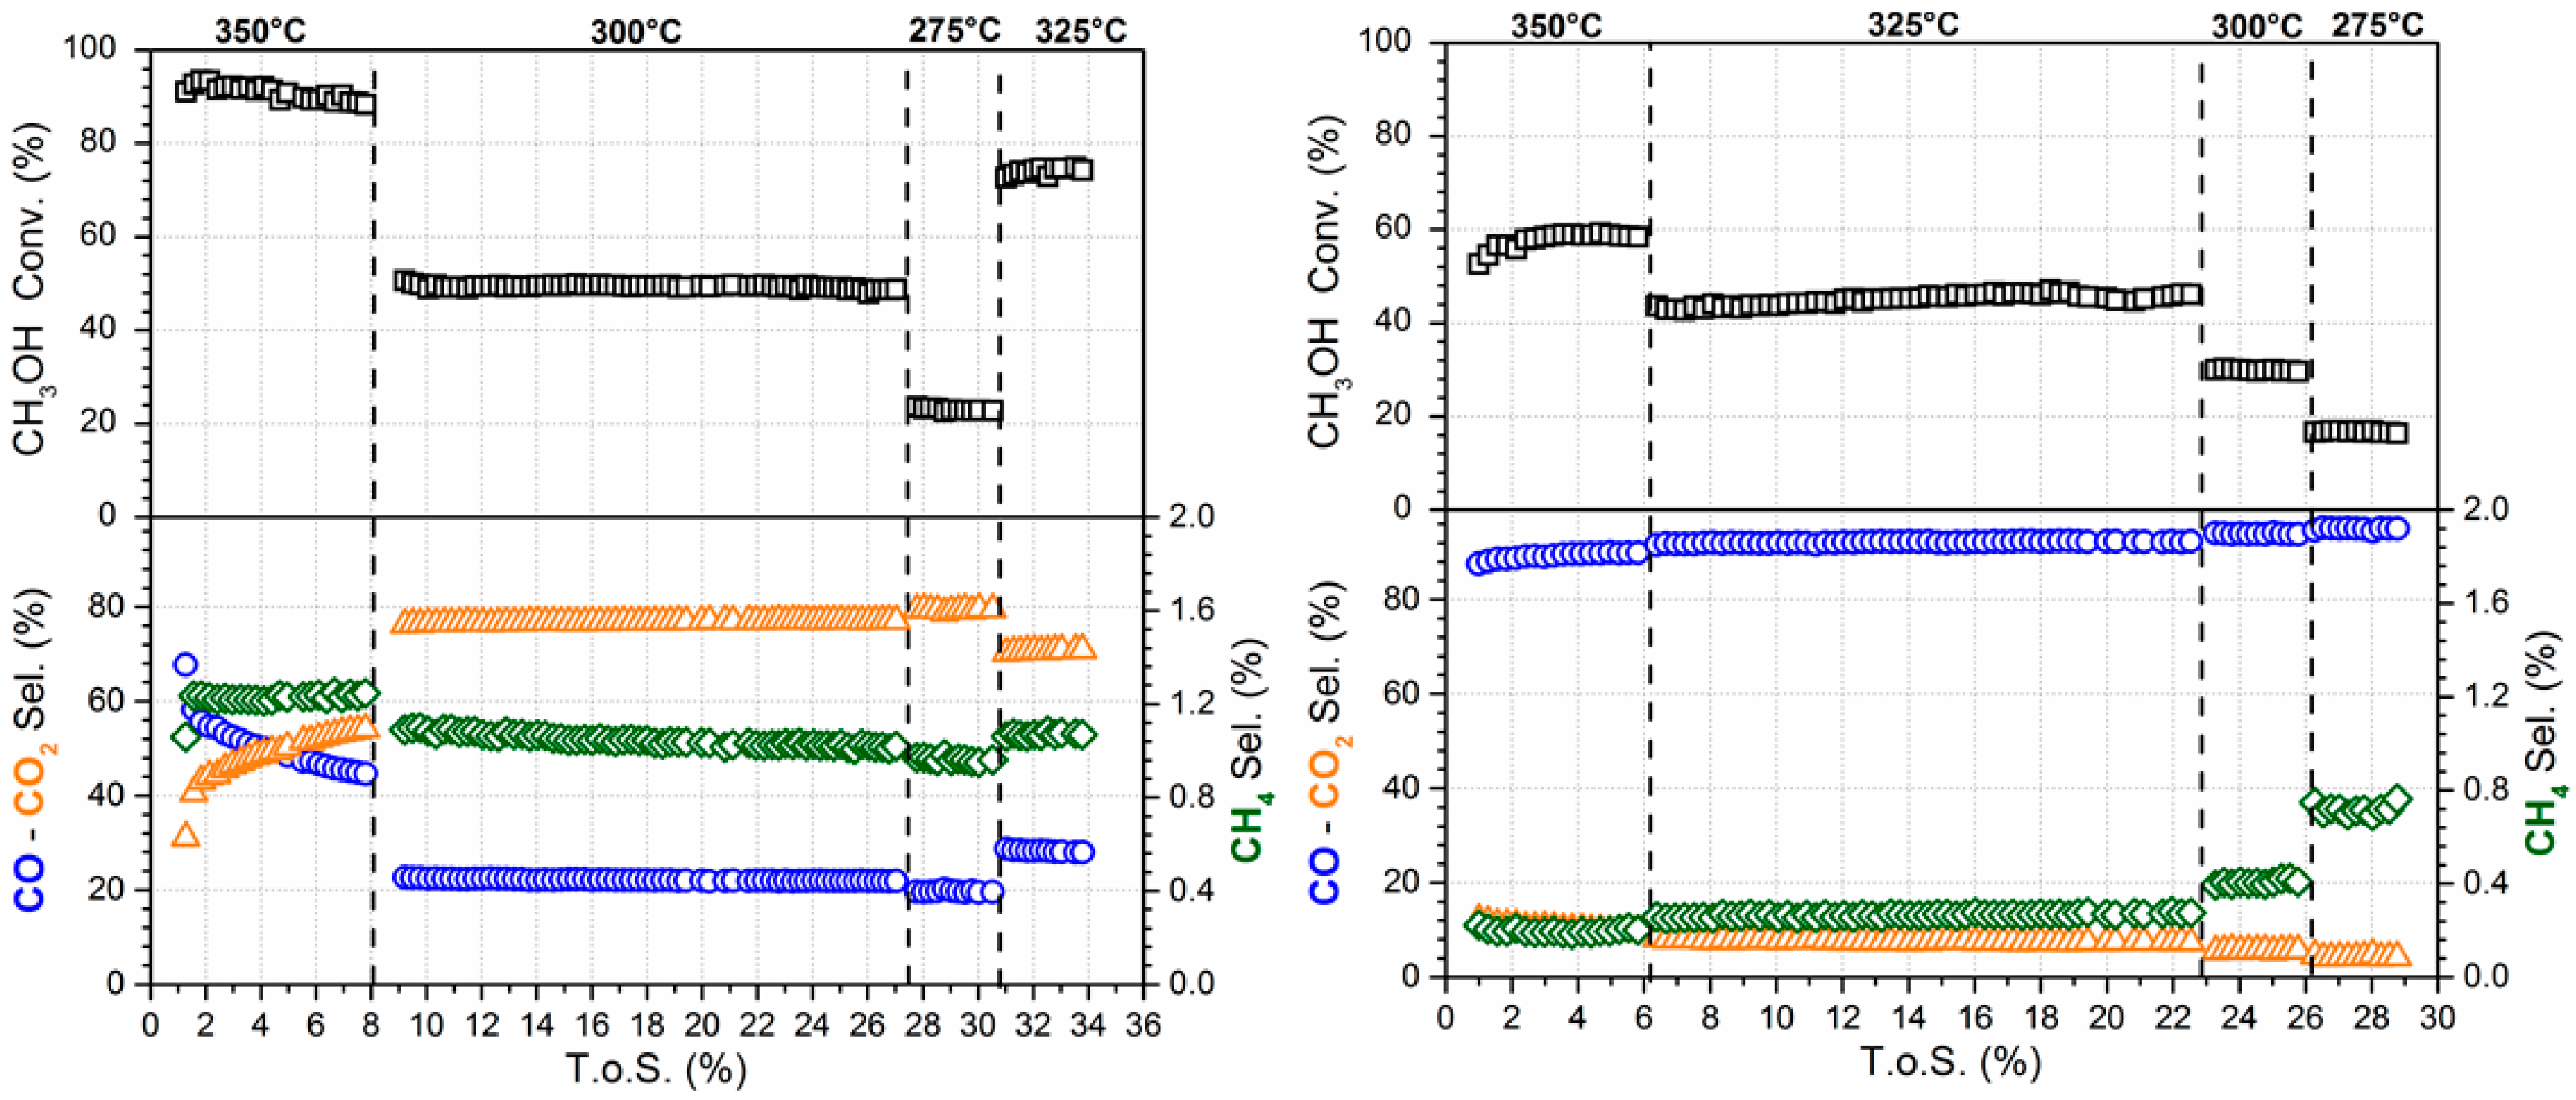
Figure 8.
Proposed methanol steam reforming (MSR) pathways on (right) undoped Pt/YSZ and (left) Na-doped Pt/YSZ.
Figure 8.
Proposed methanol steam reforming (MSR) pathways on (right) undoped Pt/YSZ and (left) Na-doped Pt/YSZ.

Figure 9.
Experimental setup for the methanol steam reforming.

Table 1.
Brunauer-Emmett-Teller (BET) surface area and porosity data from physisorption measurements of nitrogen at 77 K.
Table 1.
Brunauer-Emmett-Teller (BET) surface area and porosity data from physisorption measurements of nitrogen at 77 K.
| Sample Description | Catalyst Composition | BET SA (m2/g) | Single Point Average Pore Volume (cm3/g) | Single Point Average Pore Diameter (nm) |
|---|---|---|---|---|
| YSZ | Zr0.9Y0.1O1.95 | 149.2 | 0.19 | 3.6 |
| 2% Pt/YSZ | 2% Pt/Zr0.9Y0.1O1.95 | 143.6 | 0.18 | 3.6 |
| 2% Pt–0.25% Na/YSZ | 2% Pt–0.25% Na/Zr0.9Y0.1O1.95 | 163.6 | 0.16 | 4.0 |
| 2% Pt–0.5% Na /YSZ | 2% Pt–0.5% Na/Zr0.9Y0.1O1.95 | 150.5 | 0.15 | 4.0 |
| 2% Pt–1% Na/YSZ | 2% Pt–1% Na/Zr0.9Y0.1O1.95 | 145.4 | 0.14 | 4.0 |
| 2% Pt–2.5% Na /YSZ | 2% Pt–2.5% Na/Zr0.9Y0.1O1.95 | 94.9 | 0.13 | 3.4 |
Table 2.
DRIFTS analysis of CO2 TPD on undoped and Na-doped 2% Pt/YSZ catalysts.
| TPD T (°C) | 2% Pt/YSZ (% of Band at 50 °C) | 2% Pt–1%Na/YSZ (% of Band at 50 °C) | 2% Pt–2.5% Na/YSZ (% of Band at 50 °C) |
|---|---|---|---|
| 50 | 100 | 100 | 100 |
| 100 | 85 | 93 | 95 |
| 200 | 58 | 80 | 84 |
| 300 | 41 | 68 | 80 |
| 350 | 37 | 62 | 76 |
Table 3.
Conversion and selectivities during MSR. Process conditions: P = 1 atm; GHSV = 381,000 h−1; 2.9% CH3OH: 4.3% N2: 29.9% H2: 26.1% H2O:36.8% He.
Table 3.
Conversion and selectivities during MSR. Process conditions: P = 1 atm; GHSV = 381,000 h−1; 2.9% CH3OH: 4.3% N2: 29.9% H2: 26.1% H2O:36.8% He.
| Catalyst | T (°C) | % CH3OH Conv. | % CO Select. | % CO2 Select. | % CH4 Select. |
|---|---|---|---|---|---|
| 2% Pt/YSZ | 275 | 21.6 ± 0.1 | 79.3 ± 0.1 | 19.7 ± 0.1 | 1.0 ± 0.005 |
| 300 | 49.4 ± 0.1 | 76.8 ± 0.05 | 22.1 ± 0.05 | 1.1 ± 0.005 | |
| 325 | 74.1 ± 0.3 | 70.5 ± 0.1 | 28.5 ± 0.1 | 1.1 ± 0.003 | |
| 350 | 89.1 ± 0.5 | 53.2 ± 0.6 | 45.6 ± 0.5 | 1.2 ± 0.02 | |
| 2% Pt–0.25% Na/YSZ | 275 | 21.5 ± 0.1 | 76.2 ± 0.1 | 23.1 ± 0.1 | 0.8 ± 0.02 |
| 300 | 44.2 ± 0.2 | 74.3 ± 0.1 | 24.9 ± 0.1 | 0.8 ± 0.01 | |
| 325 | 68.7 ± 0.6 | 68.2 ± 0.1 | 30.9 ± 0.1 | 0.9 ± 0.02 | |
| 350 | 87.8 ± 0.3 | 55.9 ± 0.9 | 43.2 ± 0.9 | 1.0 ± 0.01 | |
| 2% Pt–0.5% Na /YSZ | 275 | 20.6 ± 0.1 | 71.0 ± 0.1 | 28.2 ± 0.1 | 0.7 ± 0.01 |
| 300 | 41.1 ± 0.1 | 67.9 ± 0.05 | 31.2 ± 0.05 | 0.8 ± 0.01 | |
| 325 | 63.3 ± 0.5 | 59.2 ± 0.05 | 40.0 ± 0.05 | 0.9 ± 0.01 | |
| 350 | 79.9 ± 0.6 | 38.9 ± 0.4 | 60.2 ± 0.4 | 2.8 ± 0.02 | |
| 2% Pt–1% Na/YSZ | 275 | 14.4 ± 0.1 | 60.0 ± 0.2 | 38.0 ± 0.1 | 0.5 ± 0.06 |
| 300 | 31.9 ± 0.10 | 59.7 ± 0.1 | 39.3 ± 0.1 | 0.6 ± 0.01 | |
| 325 | 53.6 ± 0.4 | 55.6 ± 0.05 | 43.3 ± 0.06 | 0.7 ± 0.02 | |
| 350 | 80.9 ± 0.3 | 43.2 ± 0.5 | 60.6 ± 0.5 | 0.8 ± 0.02 | |
| 2% Pt–2.5% Na /YSZ | 275 | 16.7 ± 0.1 | 4.3 ± 0.1 | 95.0 ± 0.1 | 0.7 ± 0.01 |
| 300 | 29.9 ± 0.1 | 5.7 ± 0.1 | 94.0 ± 0.1 | 0.4 ± 0.004 | |
| 325 | 45.2 ± 0.2 | 7.6 ± 0.1 | 92.2 ± 0.1 | 0.3 ± 0.002 |
© 2017 by the authors. Licensee MDPI, Basel, Switzerland. This article is an open access article distributed under the terms and conditions of the Creative Commons Attribution (CC BY) license (http://creativecommons.org/licenses/by/4.0/).
Share and Cite
MDPI and ACS Style
Martinelli, M.; Jacobs, G.; Graham, U.M.; Davis, B.H. Methanol Steam Reforming: Na Doping of Pt/YSZ Provides Fine Tuning of Selectivity. Catalysts 2017, 7, 148. https://doi.org/10.3390/catal7050148
AMA Style
Martinelli M, Jacobs G, Graham UM, Davis BH. Methanol Steam Reforming: Na Doping of Pt/YSZ Provides Fine Tuning of Selectivity. Catalysts. 2017; 7(5):148. https://doi.org/10.3390/catal7050148
Chicago/Turabian StyleMartinelli, Michela, Gary Jacobs, Uschi M. Graham, and Burtron H. Davis. 2017. "Methanol Steam Reforming: Na Doping of Pt/YSZ Provides Fine Tuning of Selectivity" Catalysts 7, no. 5: 148. https://doi.org/10.3390/catal7050148
Note that from the first issue of 2016, this journal uses article numbers instead of page numbers. See further details here.