Article

Highly Selective Solid Acid Catalyst H1−xTi2(PO4)3−x(SO4)x for Non-Oxidative Dehydrogenation of Methanol and Ethanol

by
Gheorghiţa Mitran
1,*,
Daniel G. Mieritz
2 and
Dong-Kyun Seo
2,*
1
Laboratory of Chemical Technology and Catalysis, Department of Organic Chemistry, Biochemistry & Catalysis, Faculty of Chemistry, University of Bucharest, 4-12, Blv. Regina Elisabeta, 030018 Bucharest, Romania
2
School of Molecular Sciences, Arizona State University, Tempe, AZ 85287-1604, USA
*
Authors to whom correspondence should be addressed.
Catalysts 2017, 7(3), 95; https://doi.org/10.3390/catal7030095
Submission received: 21 February 2017 / Revised: 13 March 2017 / Accepted: 16 March 2017 / Published: 22 March 2017

Abstract

:
The conversion of alcohols towards aldehydes in the presence of catalysts by non-oxidative dehydrogenation requires special importance from the perspective of green chemistry. Sodium (Na) super ionic conductor (NASICON)-type hydrogen titanium phosphate sulfate (HTPS; H1−xTi2(PO4)3−x(SO4)x, x = 0.5–1) catalysts were synthesized by the sol-gel method, characterized by N2 gas sorption, X-ray powder diffraction (XRD), scanning electron microscopy (SEM), transmission electron microscopy (TEM), NH3 temperature-programmed desorption (NH3-TPD), ultraviolet–visible (UV-VIS) spectroscopy, and their catalytic properties were studied for the non-oxidative dehydrogenation of methanol and ethanol. The ethanol is more reactive than methanol, with the conversion for ethanol exceeding 95% as compared to methanol, where the conversion has a maximum value at 55%. The selectivity to formaldehyde is almost 100% in methanol conversion, while the selectivity to acetaldehyde decreases from 56% to 43% in ethanol conversion, when the reaction temperature is increased from 250 to 400 °C.

Graphical Abstract

1. Introduction

Dehydrogenation of alcohols to aldehydes is important for producing the precursors for manufacturing downstream products, including fine chemicals, pharmaceuticals, polymers, and inks. Demand for formaldehyde is increasing, and currently exceeds 30 MT/year [1], while demand for acetaldehyde is around 1 MT/year, while unregenerable catalysts are unable to support these requirements. Recently, considerable interest is being paid to the dehydrogenation of methanol and ethanol due to the safety and sustainability aspects of the reaction compared to the oxidative route. Avoiding the use of oxygen removes the explosion risk, and the byproduct, hydrogen, is one of the most promising clean energy sources [2] and a component of syngas. Ethanol, a platform chemical for biorenewable-based chemical industry [3], is also gaining interest as a substrate for dehydrogenation.
In a thermodynamic consideration of dehydrogenation, conversion of methanol to formaldehyde is 20% at 400 °C and increases to 87% at 600 °C [4]. However, this reaction becomes insignificant when the competing full dehydrogenation to carbon monoxide is included. Catalysts based on transition metals, such as copper, are very active for alcohol dehydrogenation, but the main products are hydrogen and carbon monoxide [5]. Establishing kinetic control by employing catalysts is needed to enhance conversions at low temperatures and to suppress competing reactions. Other side reactions, such as the formation of coke, also need to be eliminated [6].
Even when catalysts are employed, appreciable yields of formaldehyde generally require higher temperatures (~600–900 °C) [7,8,9,10]. Supported Cu(0) nanoparticle catalysts on fluoro tetrasilicic mica have been reported as having 100% selectivity for formaldehyde, with conversions as high as 6% at 400 °C [6,8], but methyl formate is produced in the presence of Cu(I) or Cu(II). Copper phosphate supported on SiO2 markedly increased the catalytic performance with a P/Cu ratio = 0.2; reported was the selectivity of 92% and 25% conversion at 500 °C with a ratio of catalyst mass to substrate flow rate (W/F, gcat·h/molMeOH) of 0.8, and 84% conversion with 52% selectivity at W/F = 4.2 [11]. Supported metal nanoparticles can be effective for ethanol conversion as well. For example, Cu/mesoporous carbon [12], Au/MoO3 [13], and Au/MgCuCr2O4 [14] have been reported to show high conversions/selectivities of (83.3%–98%)/(94%–99%) at temperatures between 240 and 290 °C. When up to 20 wt % silver was added to SiO2–MgO, SiO2–Al2O3, and Al4Si4O10(OH)8, they showed conversions above 90% and selectivities for formaldehyde above 70% at 625–650 °C [15,16,17]. However, the limited span of their high activities has been a challenging issue [18].
Other than metallic particles, metal oxides are active for methanol dehydrogenation at relatively high temperatures. Na0.5Li0.5AlO2 showed 98% conversion and 74% selectivity with W/F = 9.3 at 900 °C [19]. Such high-temperature conditions are required to avoid formation of coke, which deactivates the catalyst. Ag2O, ZnO, NaMgPO4, and Na2CO3 could be also used at the temperatures in 600–900 °C [9,20,21]. On the sodium-modified silicalite-1, studied for methanol and ethanol dehydrogenation [5], it was confirmed that the active sites are Si-O-Si bridges generated by surface dehydration, and not sodium ions, which were proven to be non-reactive. The 13X zeolites exchanged with Zn2+ ions showed 67% selectivity and 34% conversion at 600 °C [6,9]. Interestingly, although the selectivity was still low, the study found that at relatively low temperatures the residual solid acidity in the aluminosilicate framework was important in preventing the complete dehydrogenation of formaldehyde to carbon monoxide. More recently, the sodium (Na) super ionic conductor (NASICON)-type nickel titanium phosphate (Ni0.5Ti2(PO4)3, showed a selectivity around 80% for formaldehyde and total conversion around 70% at relatively low temperatures (340–360 °C) but, unfortunately, the stability of the catalyst was not reported [22]. While good performance was attributed to redox activity, it is worth noting the expected acidity of the titanium phosphate framework structure.
Herein we report NASICON-type hydrogen titanium phosphate sulfate (HTPS; H1−xTi2(PO4)3−x(SO4)x, x = 0.5–1) as the first metal-free solid acid catalyst that is highly efficient for dehydrogenation of methanol to formaldehyde and also for conversion of ethanol to acetaldehyde and ethylene, in the absence of O2. In our previous report [23] we described the preparation by the sol-gel method and characterization of nanoporous HTPS. Structural protons in the NASICON-channels were detected by magic angle spinning nuclear magnetic resonance (MAS-NMR) spectroscopy. The strongly-polarizing nature of the sulfate ligand should increase the acidity of structural protons and, yet, the reducibility of Ti4+ to Ti3+ may play a role in non-oxidative dehydrogenation as indicated previously [22]. The current studies indicate that HTPS shows an excellent performance in methanol dehydrogenation to formaldehyde, and in the conversion of ethanol through non-oxidative dehydrogenation and dehydration.

2. Results and Discussion

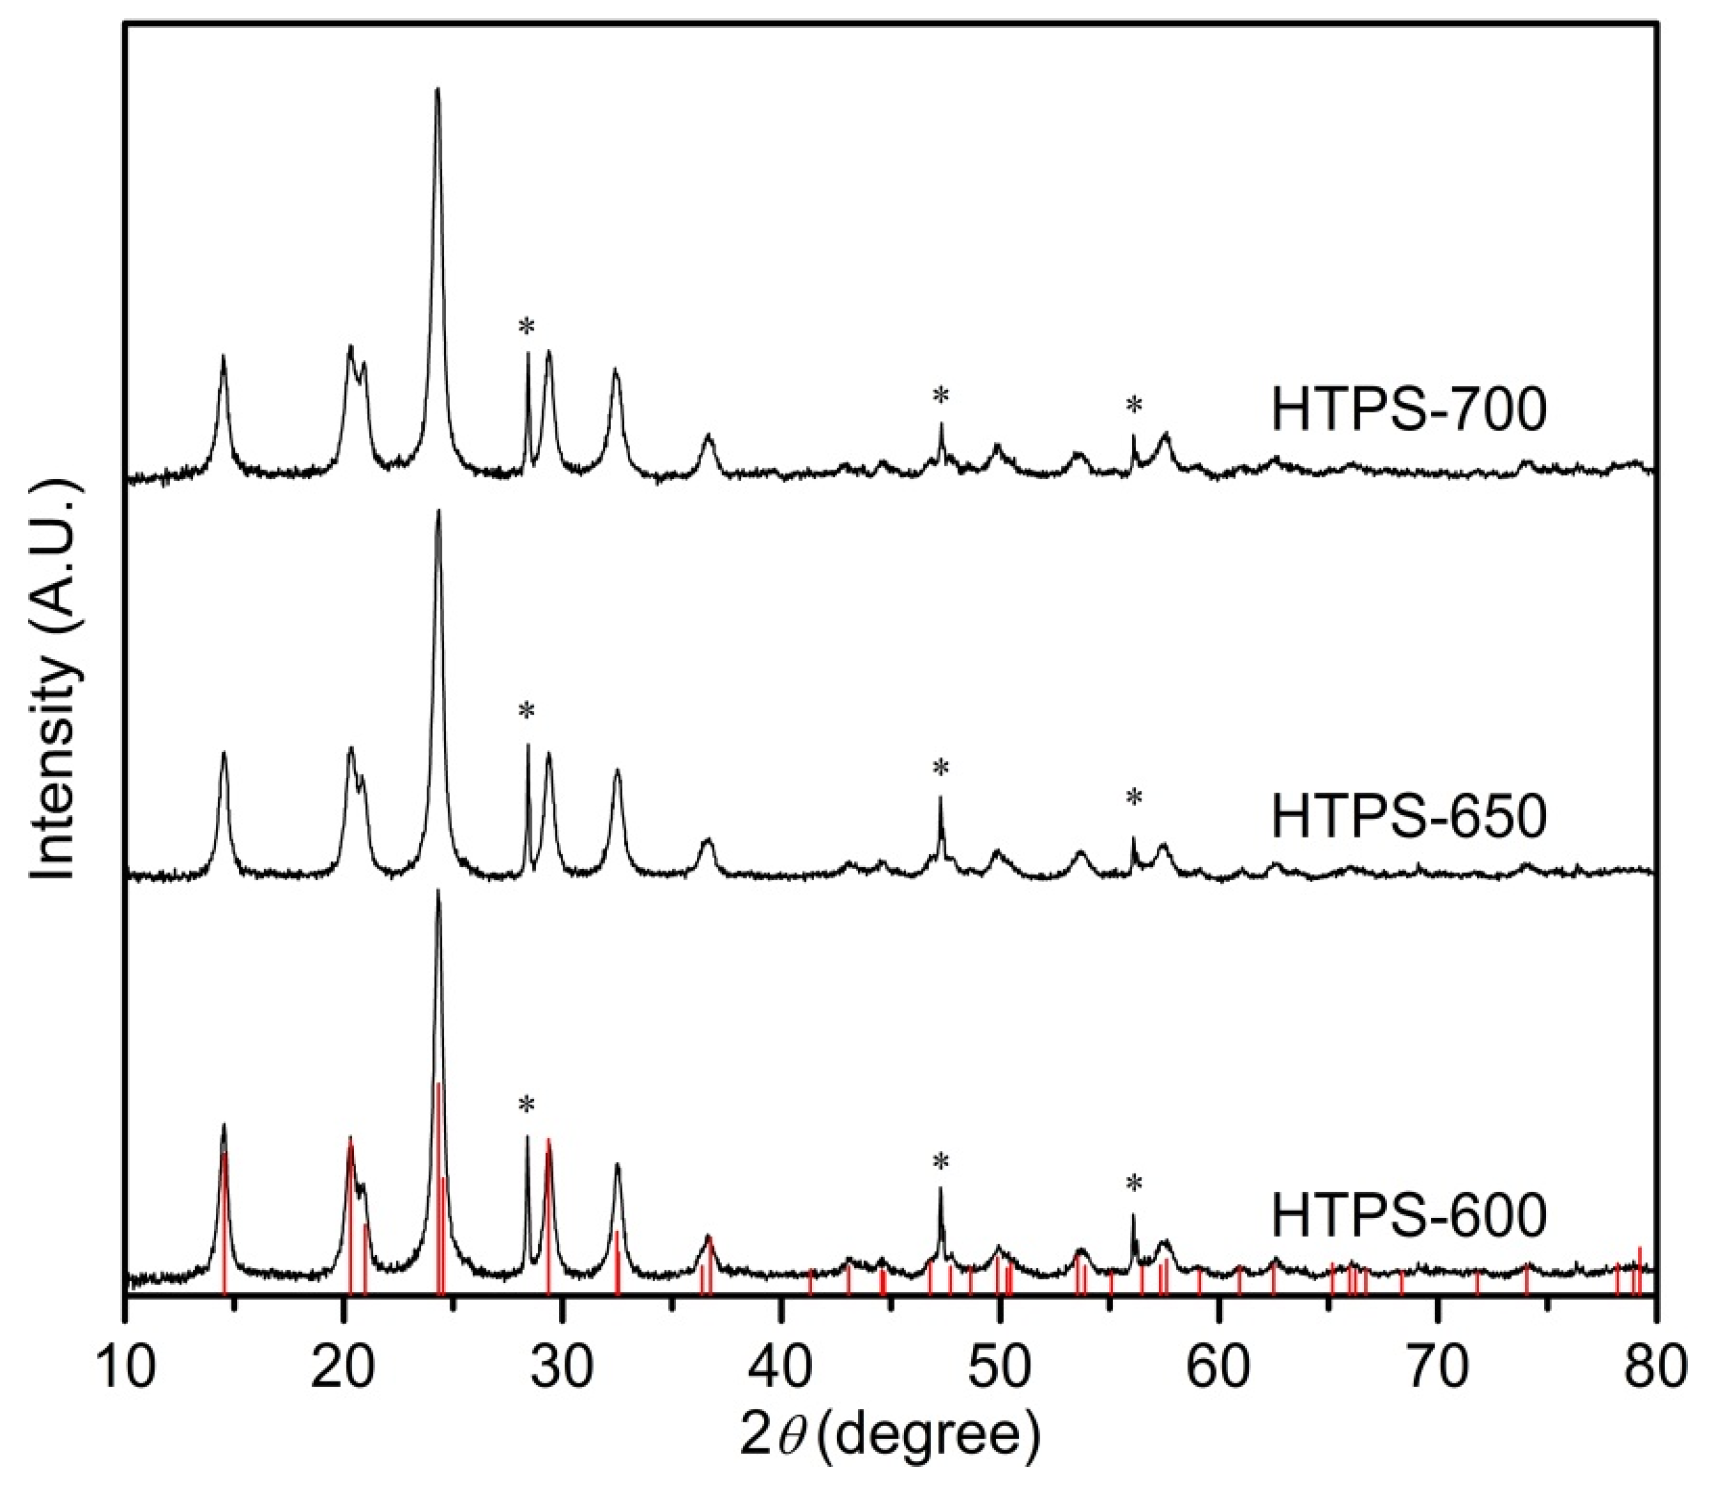
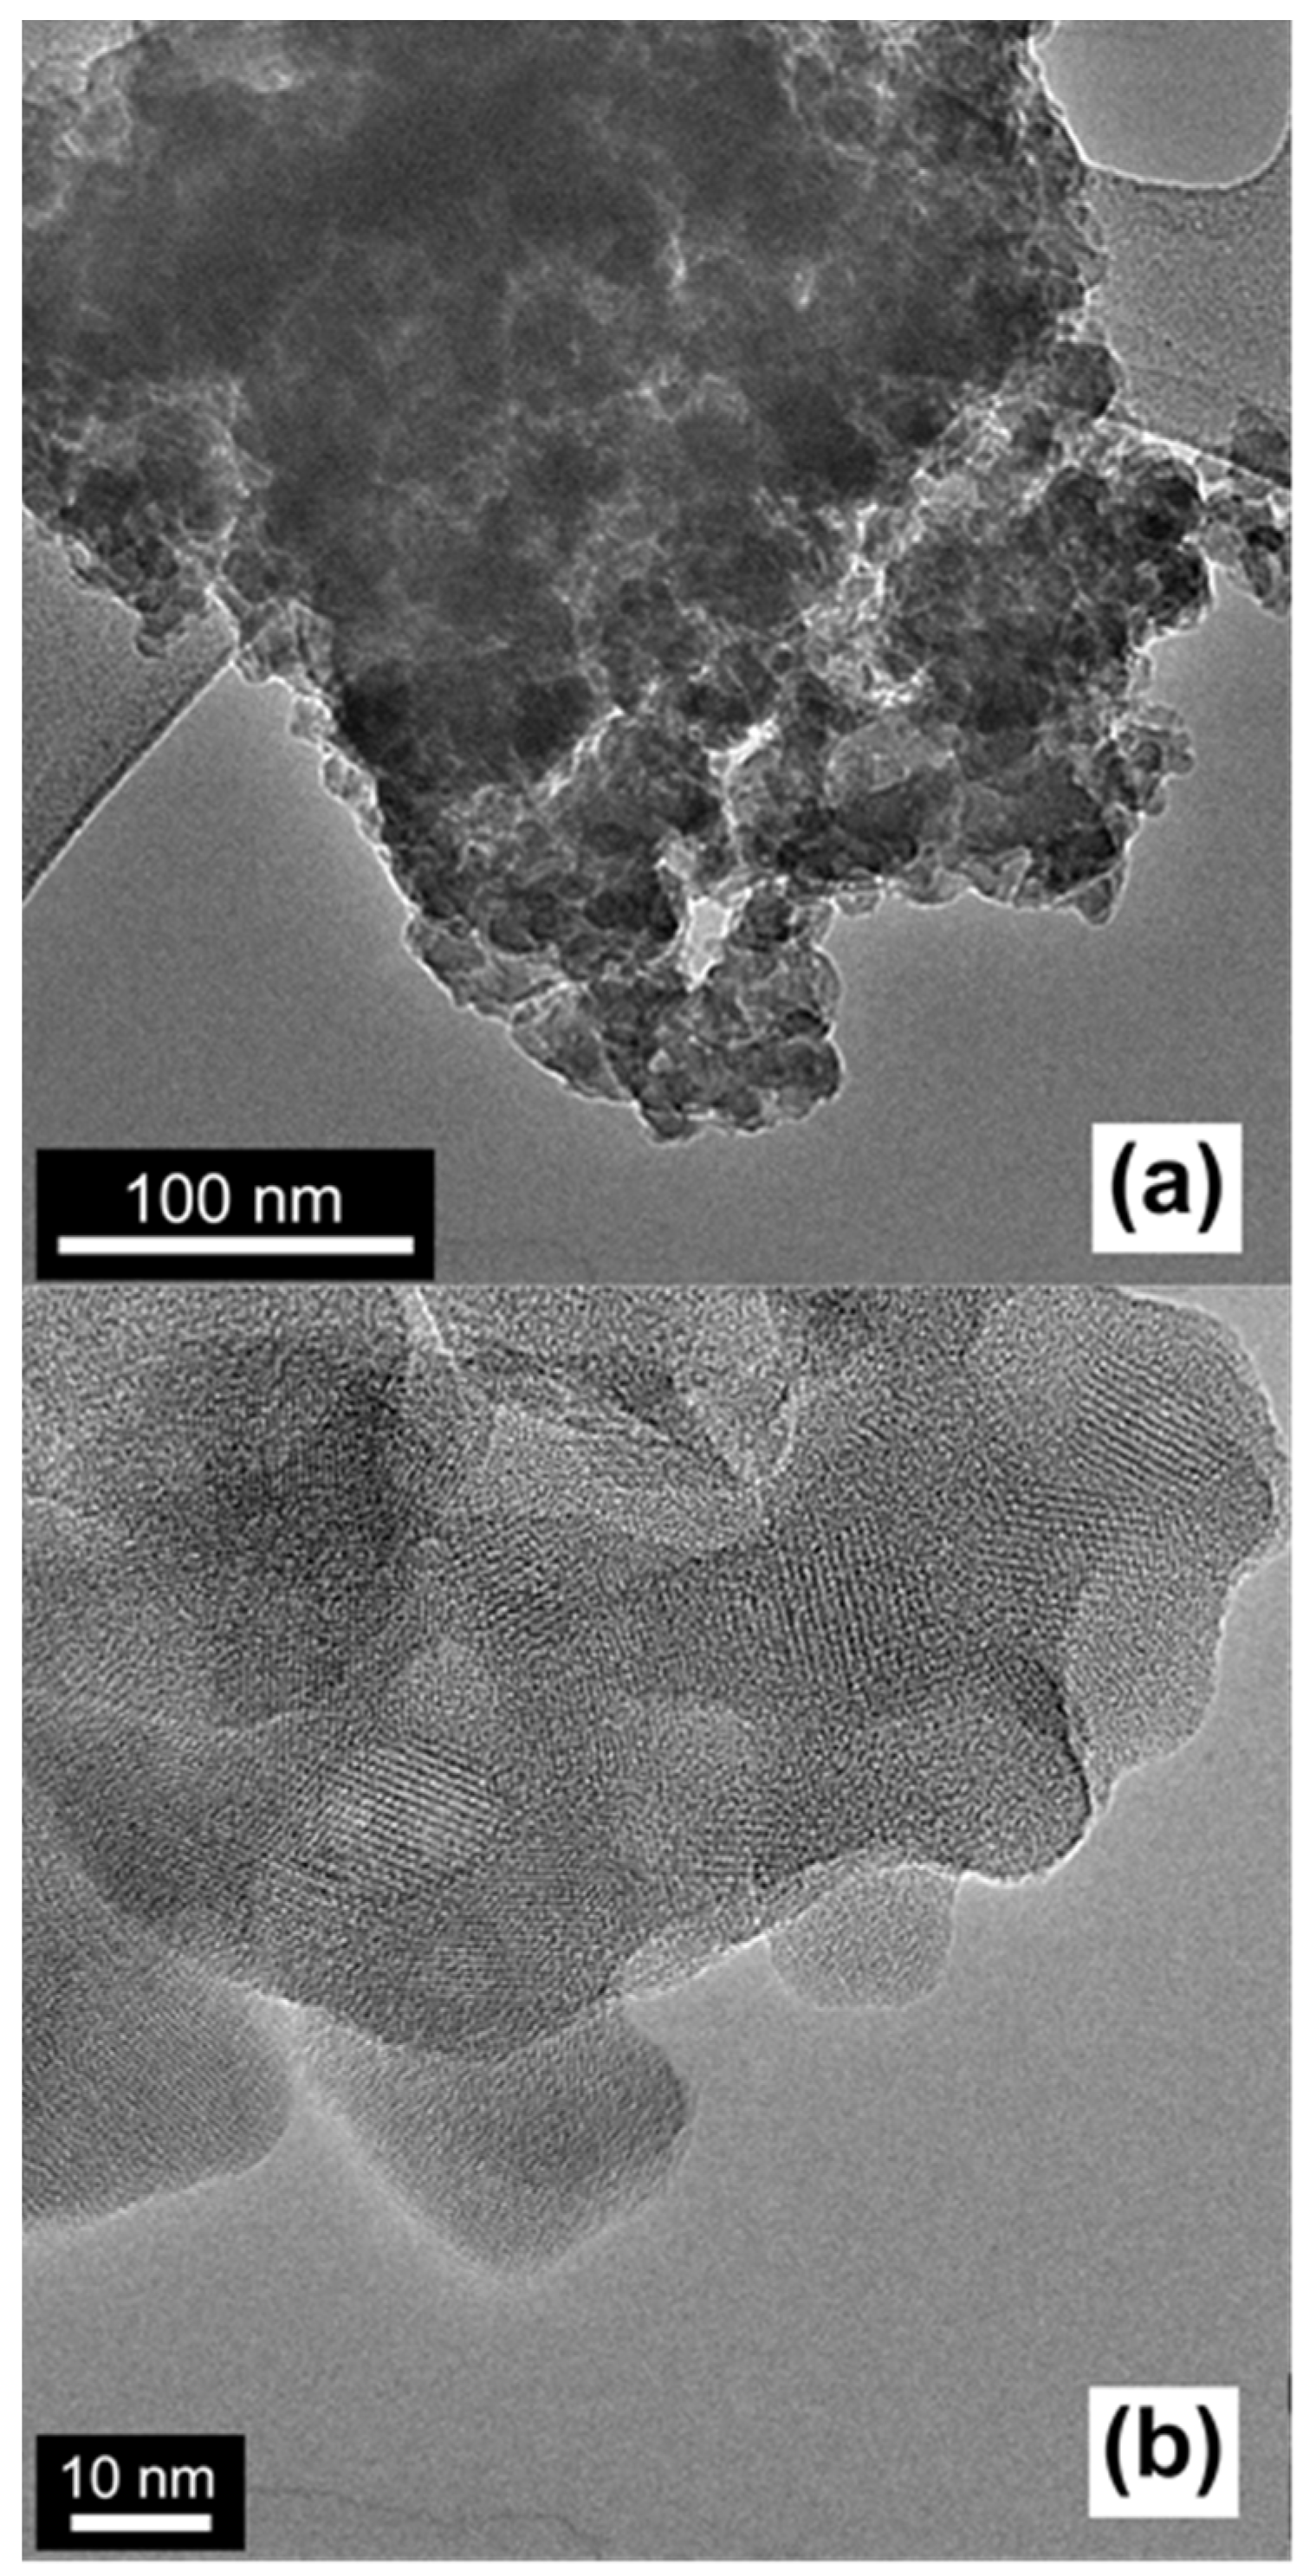
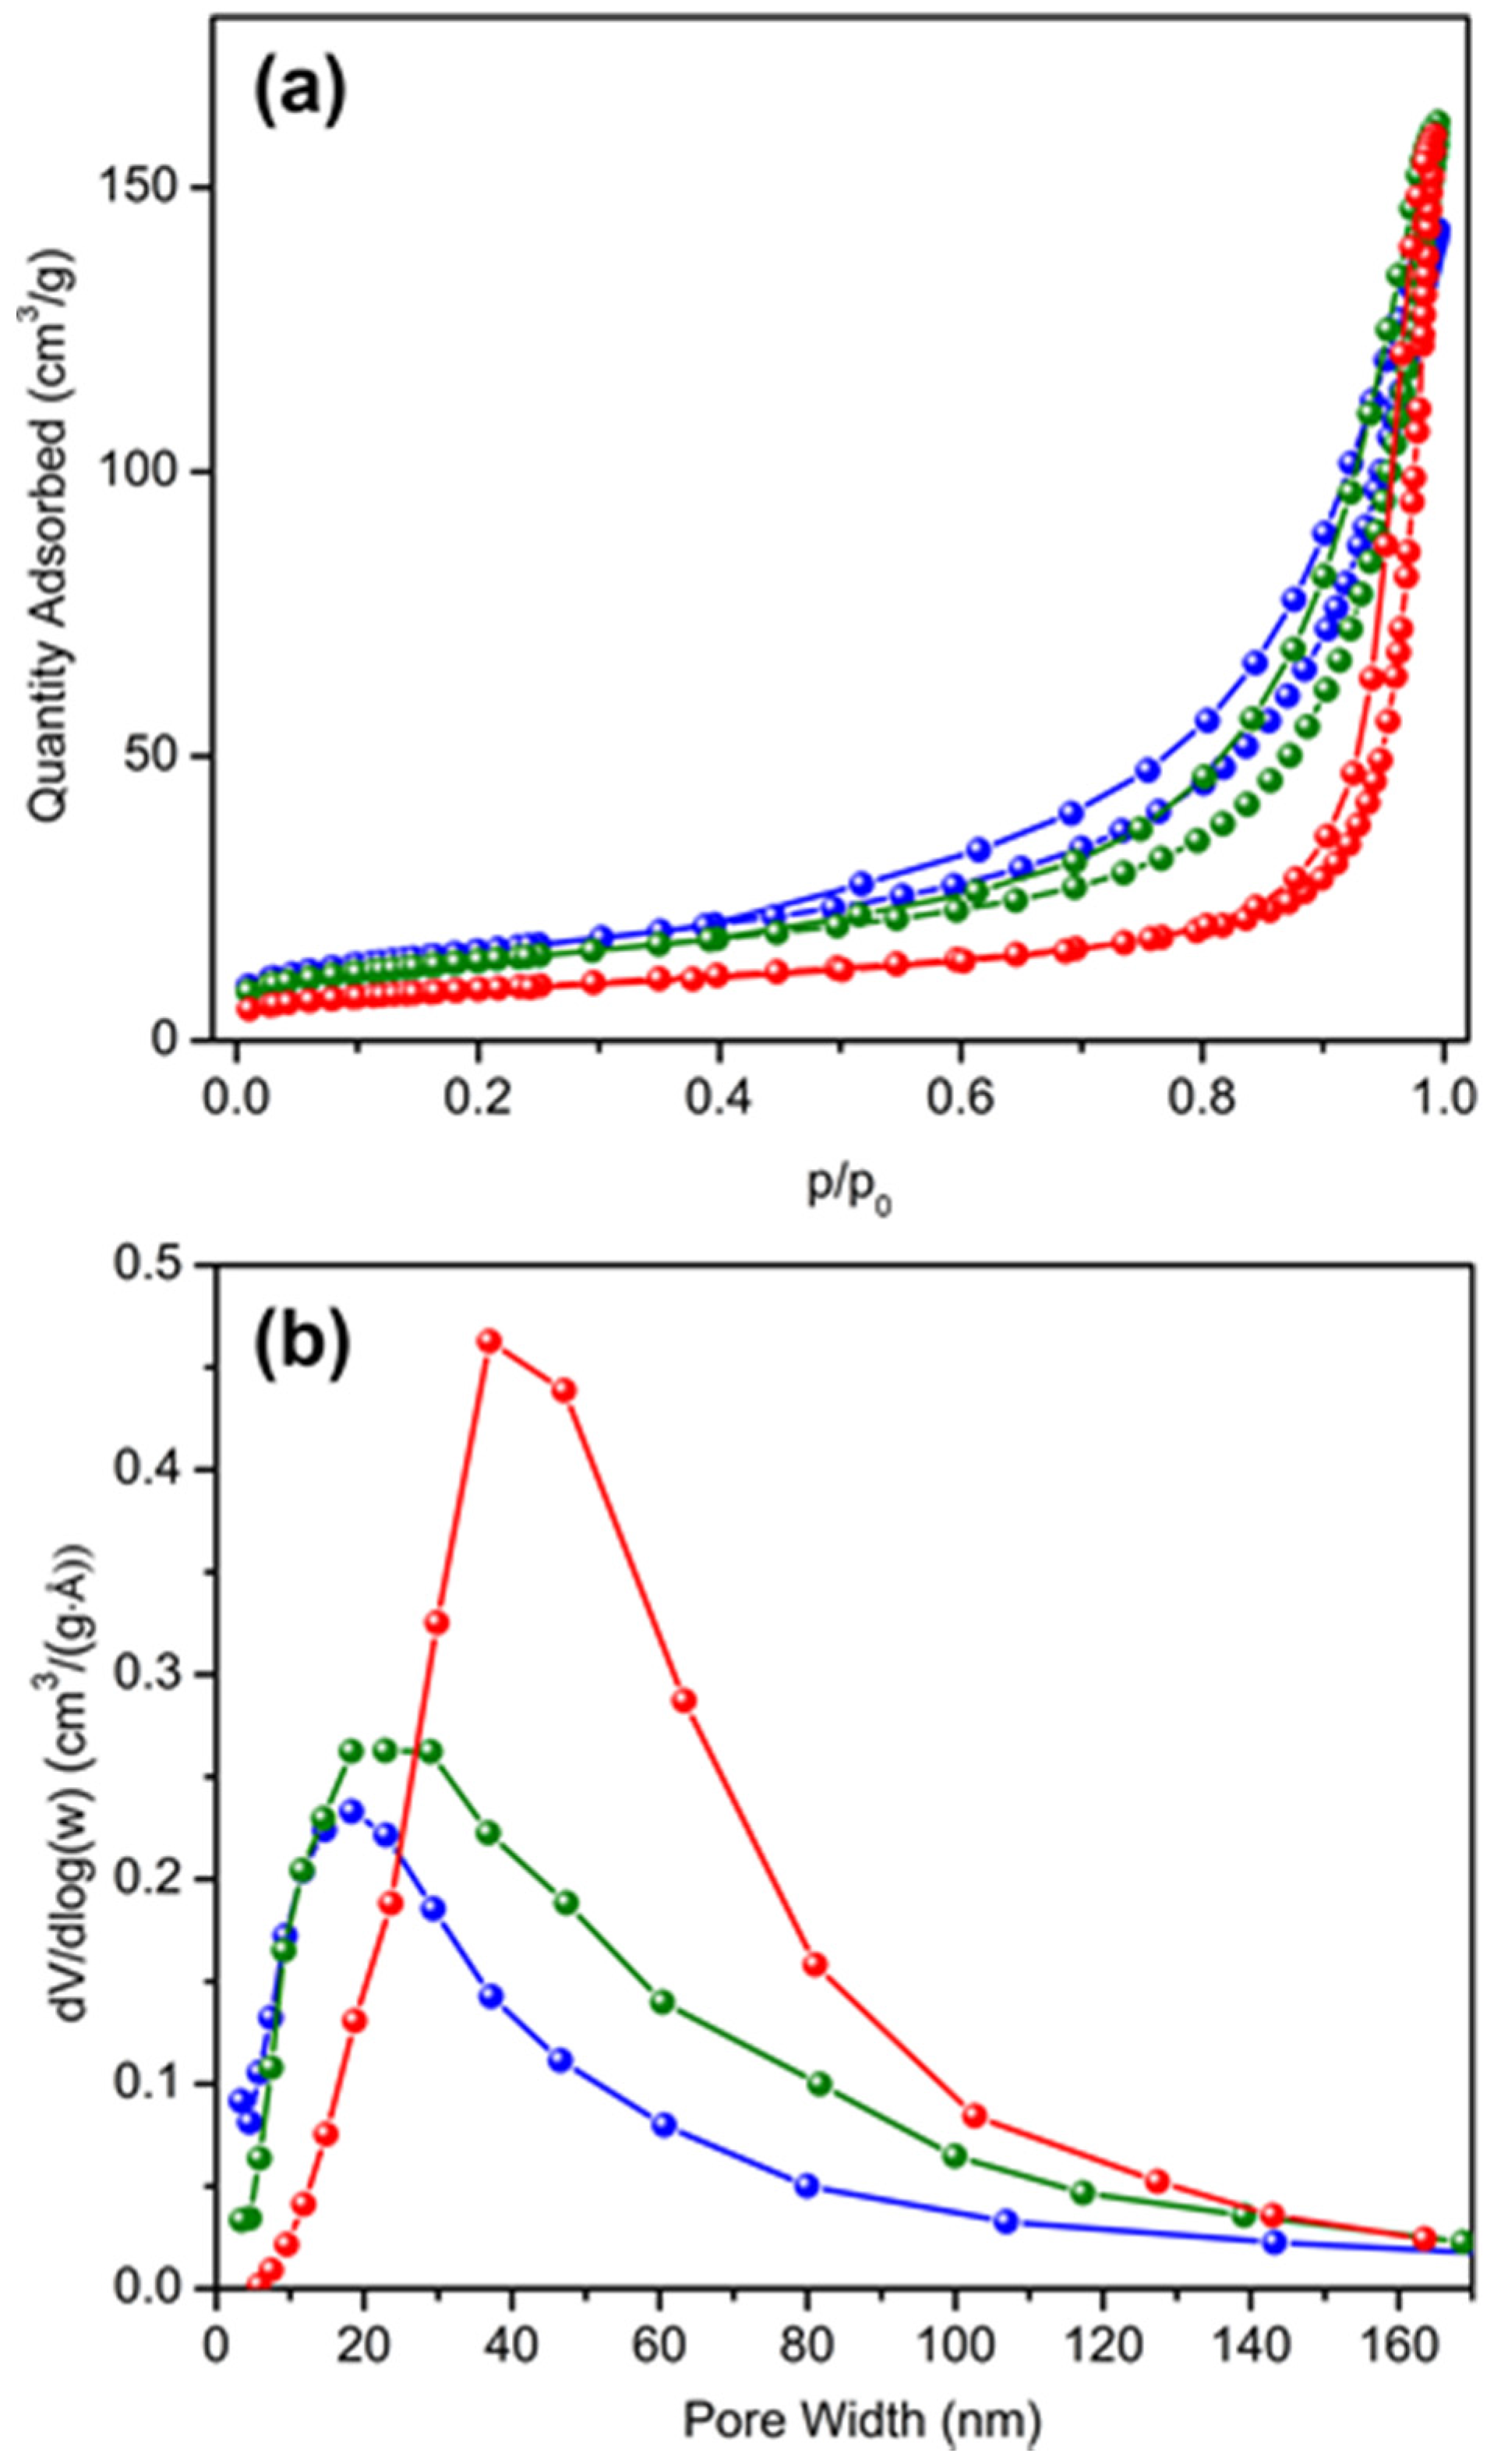
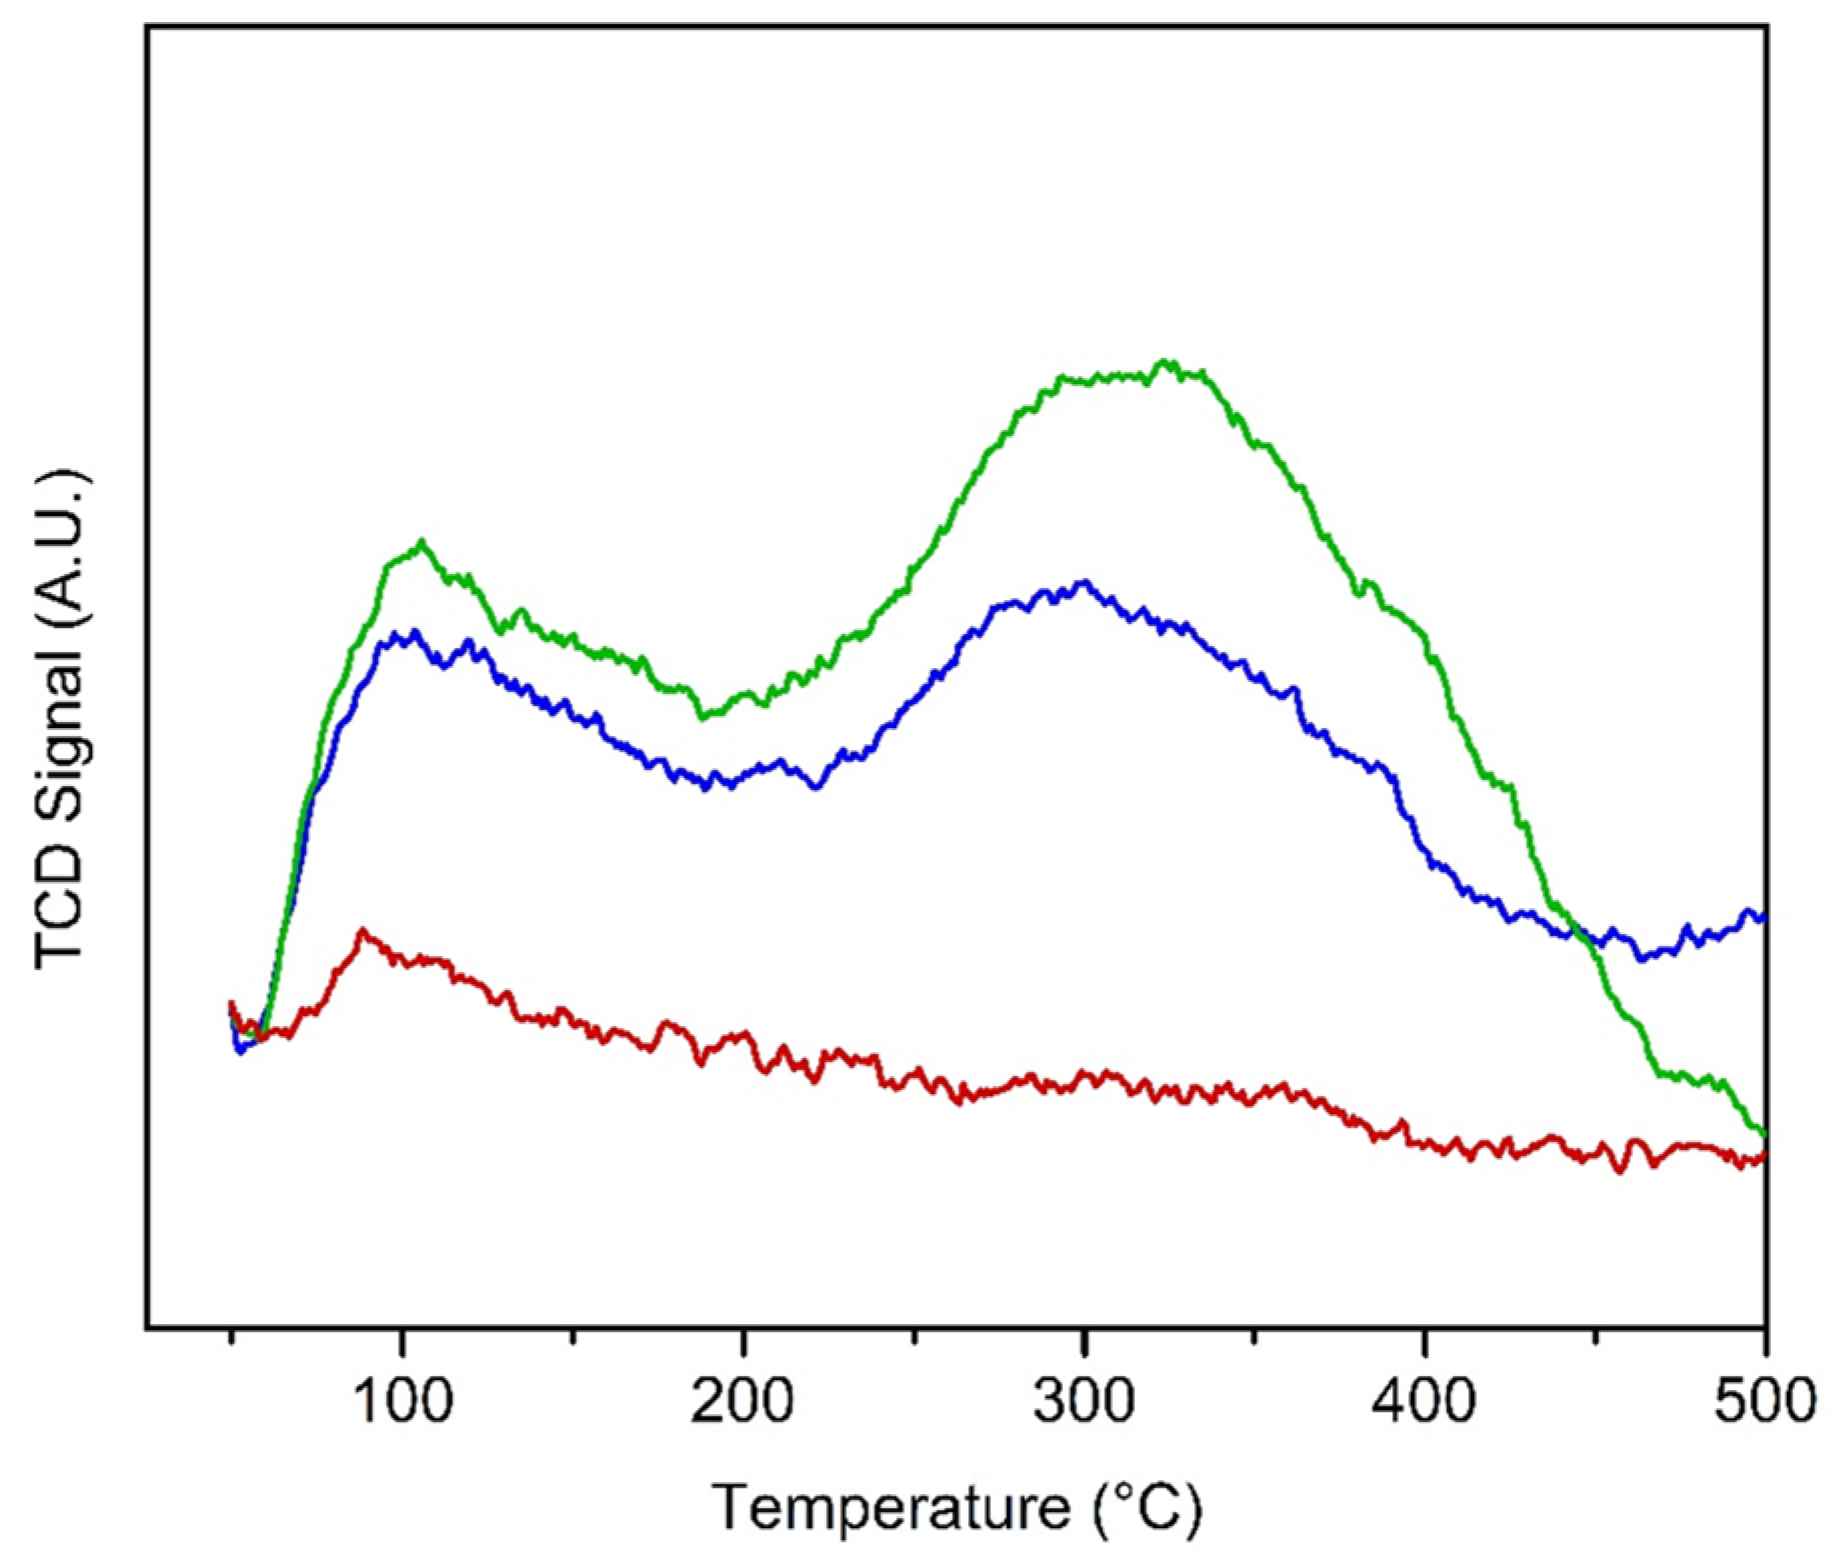
2.1. Characterization of the Catalysts

Powder X-ray powder diffraction (PXRD) diffraction patterns of catalysts, HTPS-600, -650, and -700, are shown in Figure 1, and the drop-lines show the reference PXRD pattern of HTPS-600 (Space Group: R 3 ¯ c; a = 8.4717 Å; c = 21.663 Å). All of the Bragg peaks could be assigned as the ones from HTPS. The unit cell refinement gave a = 8.472 Å; c = 21.66 Å for HTPS-600, 8.482 Å; 21.64 Å for HTPS-650 and 8.484 Å; 21.76 Å for HTPS-700, while the Scherrer equation estimated similar average crystallite sizes, 16, 15, and 17 nm, respectively (Table 1). As previously reported, sintering during calcination at 700 °C coincides with an increase in the crystallite size as well as the enlargement of the unit cell volume which is associated with sulfate loss [23].
The morphology and microstructure of the catalysts were characterized with scanning electron microscopy (SEM) and transmission electron microscopy (TEM) by using HTPS-650 as the representative. The SEM image in Figure 2a indicates that the HTPS is formed into isotropically-shaped particles of 1–2 µm in diameter. At a high magnification ratio (Figure 2b), the particles exhibit a nanostructured surface texture indicative of aggregated nanoparticles with interparticles textural pores which can be clearly seen in the TEM images (Figure 3). A closer look with high resolution TEM (HRTEM) images indicate that the primary nanoparticles are 20–50 nm in diameter, although fused together strongly, and they exhibit well-developed lattice fringes (Figure 3b). The primary particle sizes and the high crystallinity are in agreement with the results from the XRD patterns in Figure 1.
Characteristics of the textural pores in the aggregates were further studied by nitrogen sorption measurements. Nitrogen sorption isotherms and Barrett–Joyner–Halenda (BJH) pore size distributions of the catalysts are shown in Figure 4a,b. The sorption isotherms are a combination of type-III and type-V, and show a type H3 hysteresis indicating that both mesopores and macropores are present [24]. BJH pore size distributions (Figure 4b), show peak maxima of 18, 23, and 40 nm for HTPS-600, -650, and -700, respectively, and the average pore widths are 16, 20, and 29 nm. In addition to shifting to wider pore sizes, the peaks become broadened with higher calcination temperatures. Despite a broader distribution of pore sizes, the pore volumes were comparable between HTPS-650 and -700, with pore volumes of 0.25 and 0.24 cm3/g, respectively, although the sample HTPS-600 had slightly lower value (0.22 cm3/g). While pore coarsening occurs to a larger extent with higher calcination temperatures, the primary crystallite size does not significantly increase, which suggests that the increased pore widths may be associated with widening of the necks between connected primary particles due to the greater extent of sintering. Brunauer–Emmett–Teller (BET) surface areas (SBET) and pore characteristics are summarized in Table 1.
The NH3-TPD profiles for adsorbed ammonia are presented in Figure 5 for the temperature region from room temperature to 700 °C where the catalysts are thermally stable. An initial desorption peak was observed near 90 °C for all samples, which is due to physisorbed ammonia. HTPS-600 shows a broad peak from 200 to 400 °C with a maximum at 300 °C and the acid site concentration was estimated to be 21 µmol/g (Table 1). The same broad peak appears in the TPD profile of HTPS-650 from 200 to 500 °C with a slightly higher peak position (335 °C) and a higher acid site concentration (25.4 µmol/g), indicating that HTPS-650 has a slightly stronger acidity than HTPS-600. Meanwhile, HTPS-700 does not show any peak in that temperature region and, thus, the presence of acid sites with moderate strength is not apparent. It can be concluded that calcination at 650 °C leads to the highest acidity for the HTPS system. The lack of acid sites in HTPS-700 is consistent with our previous results on thermal stability of the structural sulfates in HTPS [23]. Elemental analysis showed a decrease in the sulfate content with a higher calcination temperature. It is noted that HTPS is more thermally stable than sulfated titania, which can be a desirable catalyst for the dehydrogenation and dehydration of alcohols. When the sulfated titania was calcined to 700 °C, its NH3-sorption capacity was greatly diminished and it showed almost no surface acid sites due to the thermal instability of surface sulfates [25].
The comparison of UV-VIS spectra (Figure 6) of all samples demonstrates that they are shifted toward the higher wavelengths for the catalyst calcinated at 650 °C. The bands situated in the range of 210–215 nm correspond to presence of isolated tetrahedral Ti(IV) species [26], while the bands located at 270–280 nm have been attributed to penta- or hexacoordinated polymeric Ti species [27]. The inset in Figure 6 shows a high-resolution X-ray photoelectron spectroscopy (XPS) spectrum of HTPS-650 around Ti 2p. In agreement with the UV-VIS spectral analysis, both Ti 2p1/2 and for Ti 2p3/2 peaks could be deconvoluted with only one component that corresponds to Ti(IV), which is consistent with the previous report by some of the authors [28].

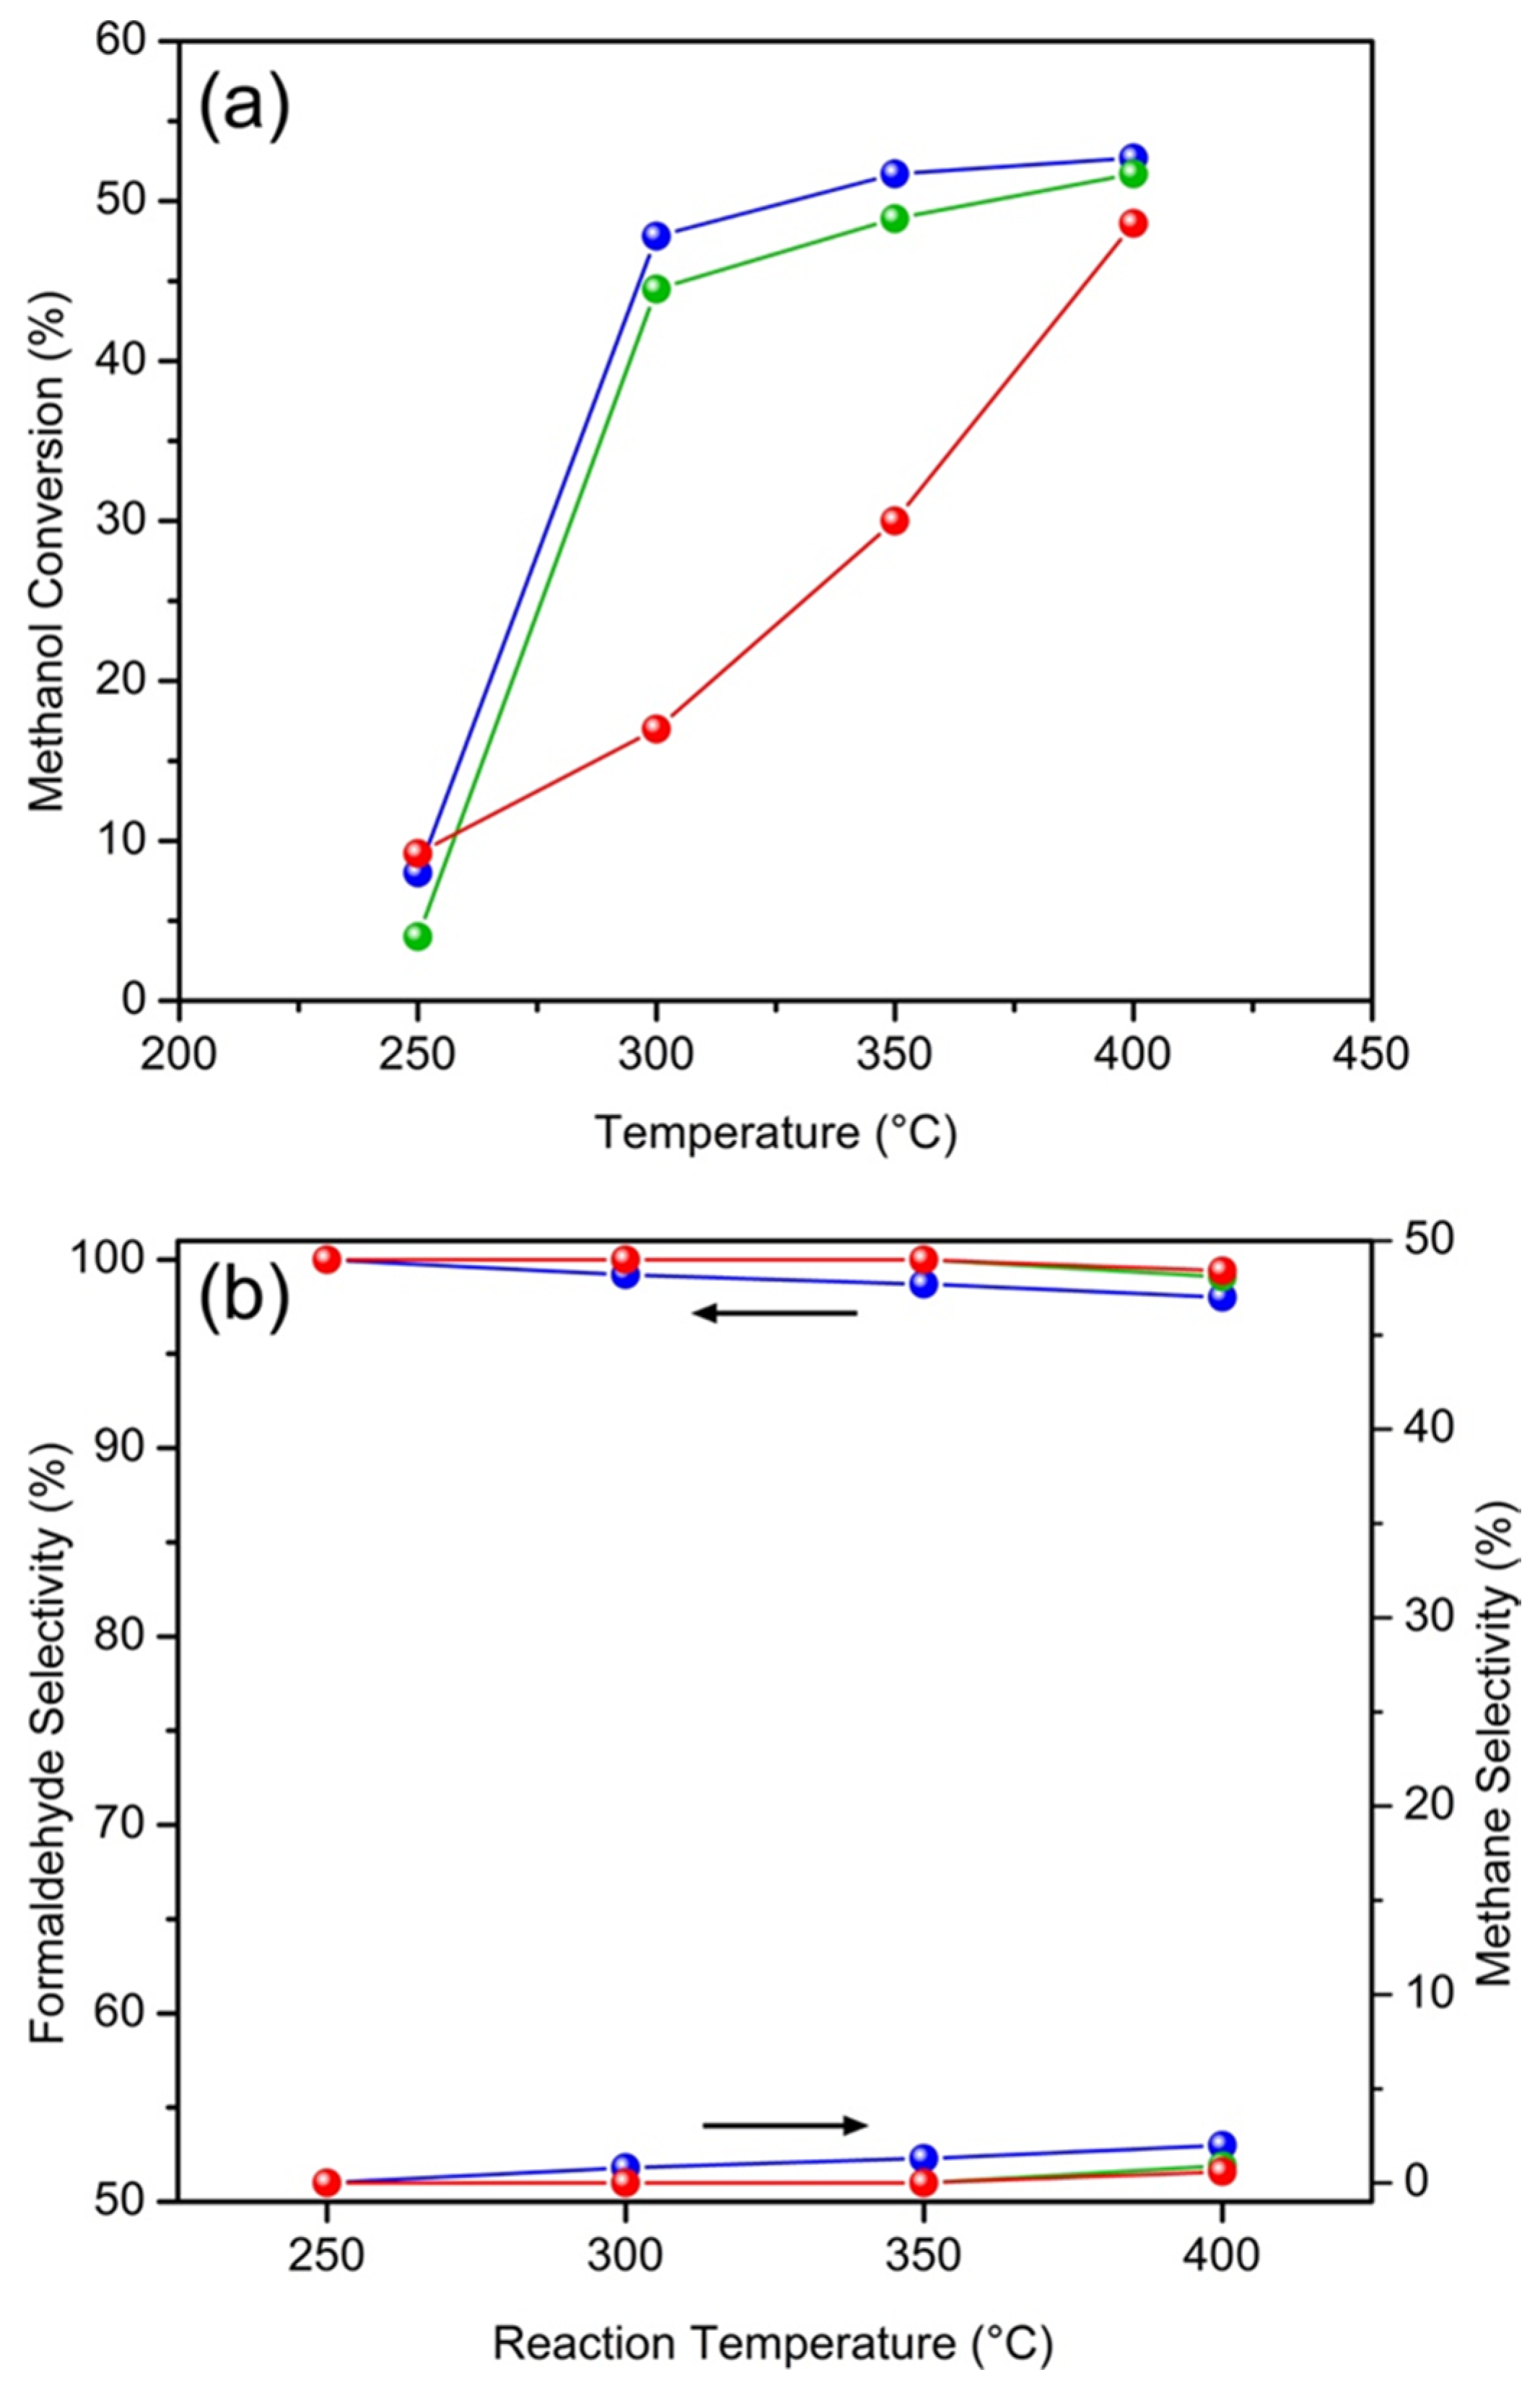
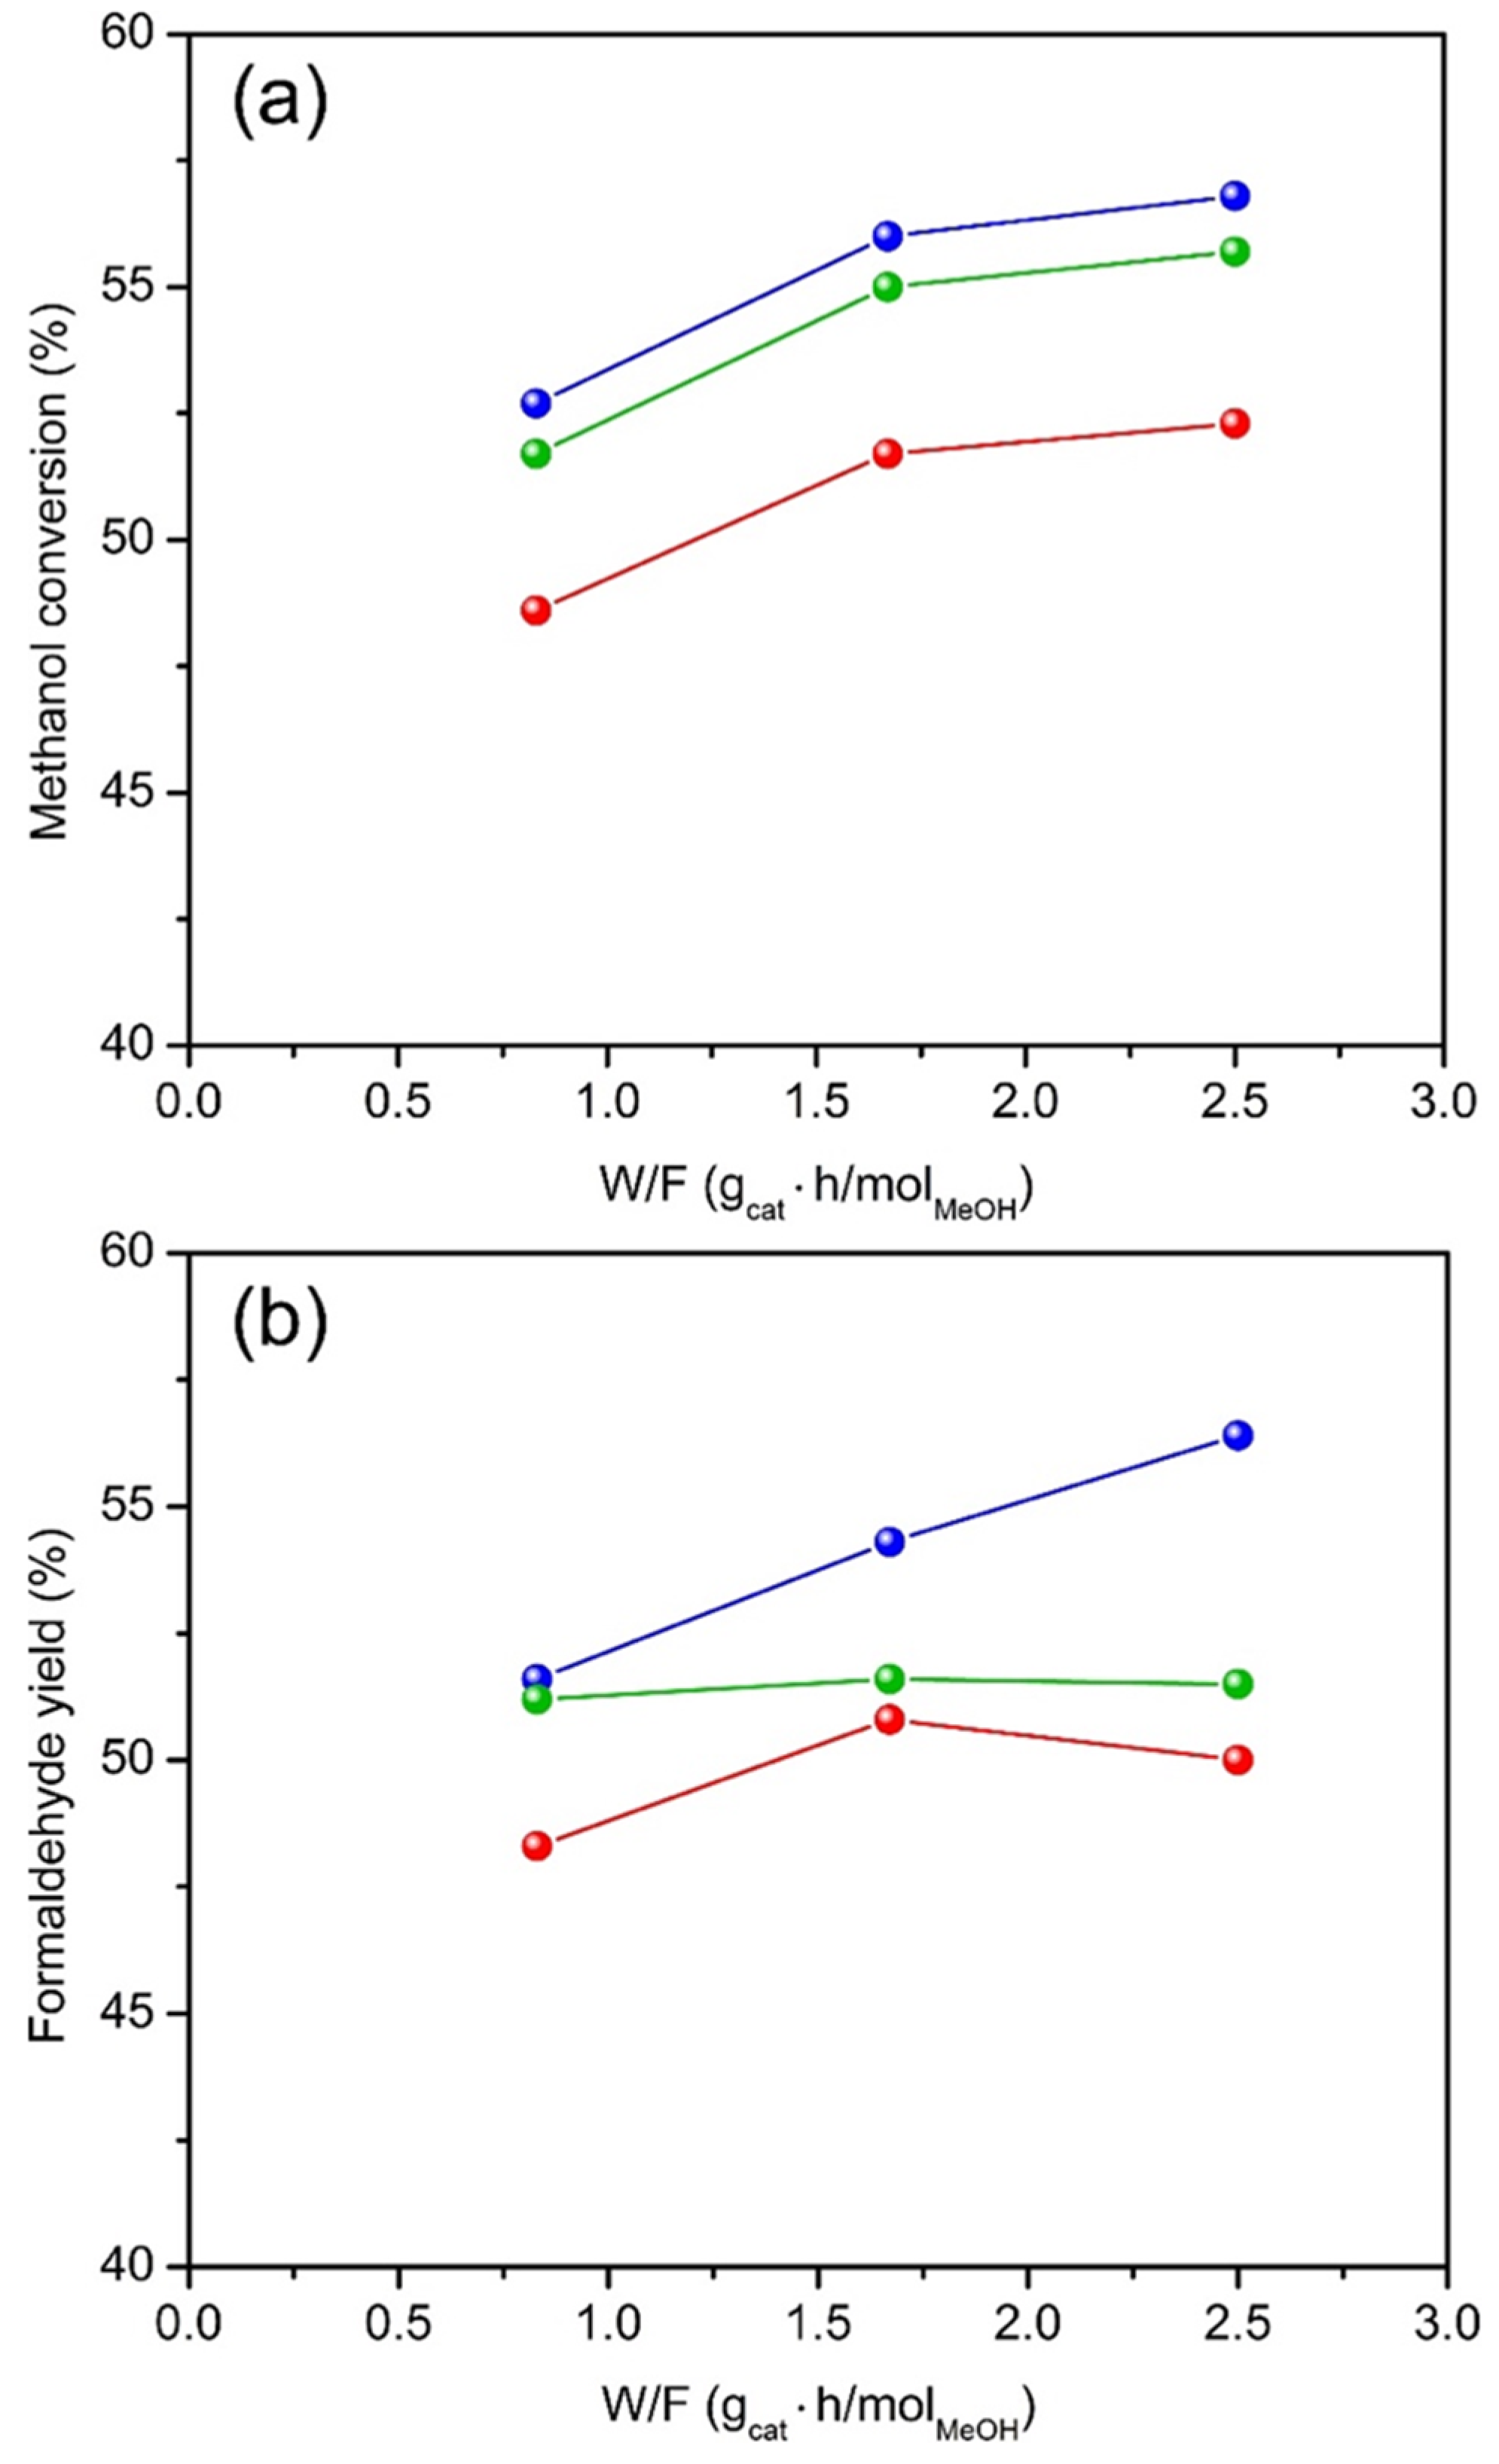
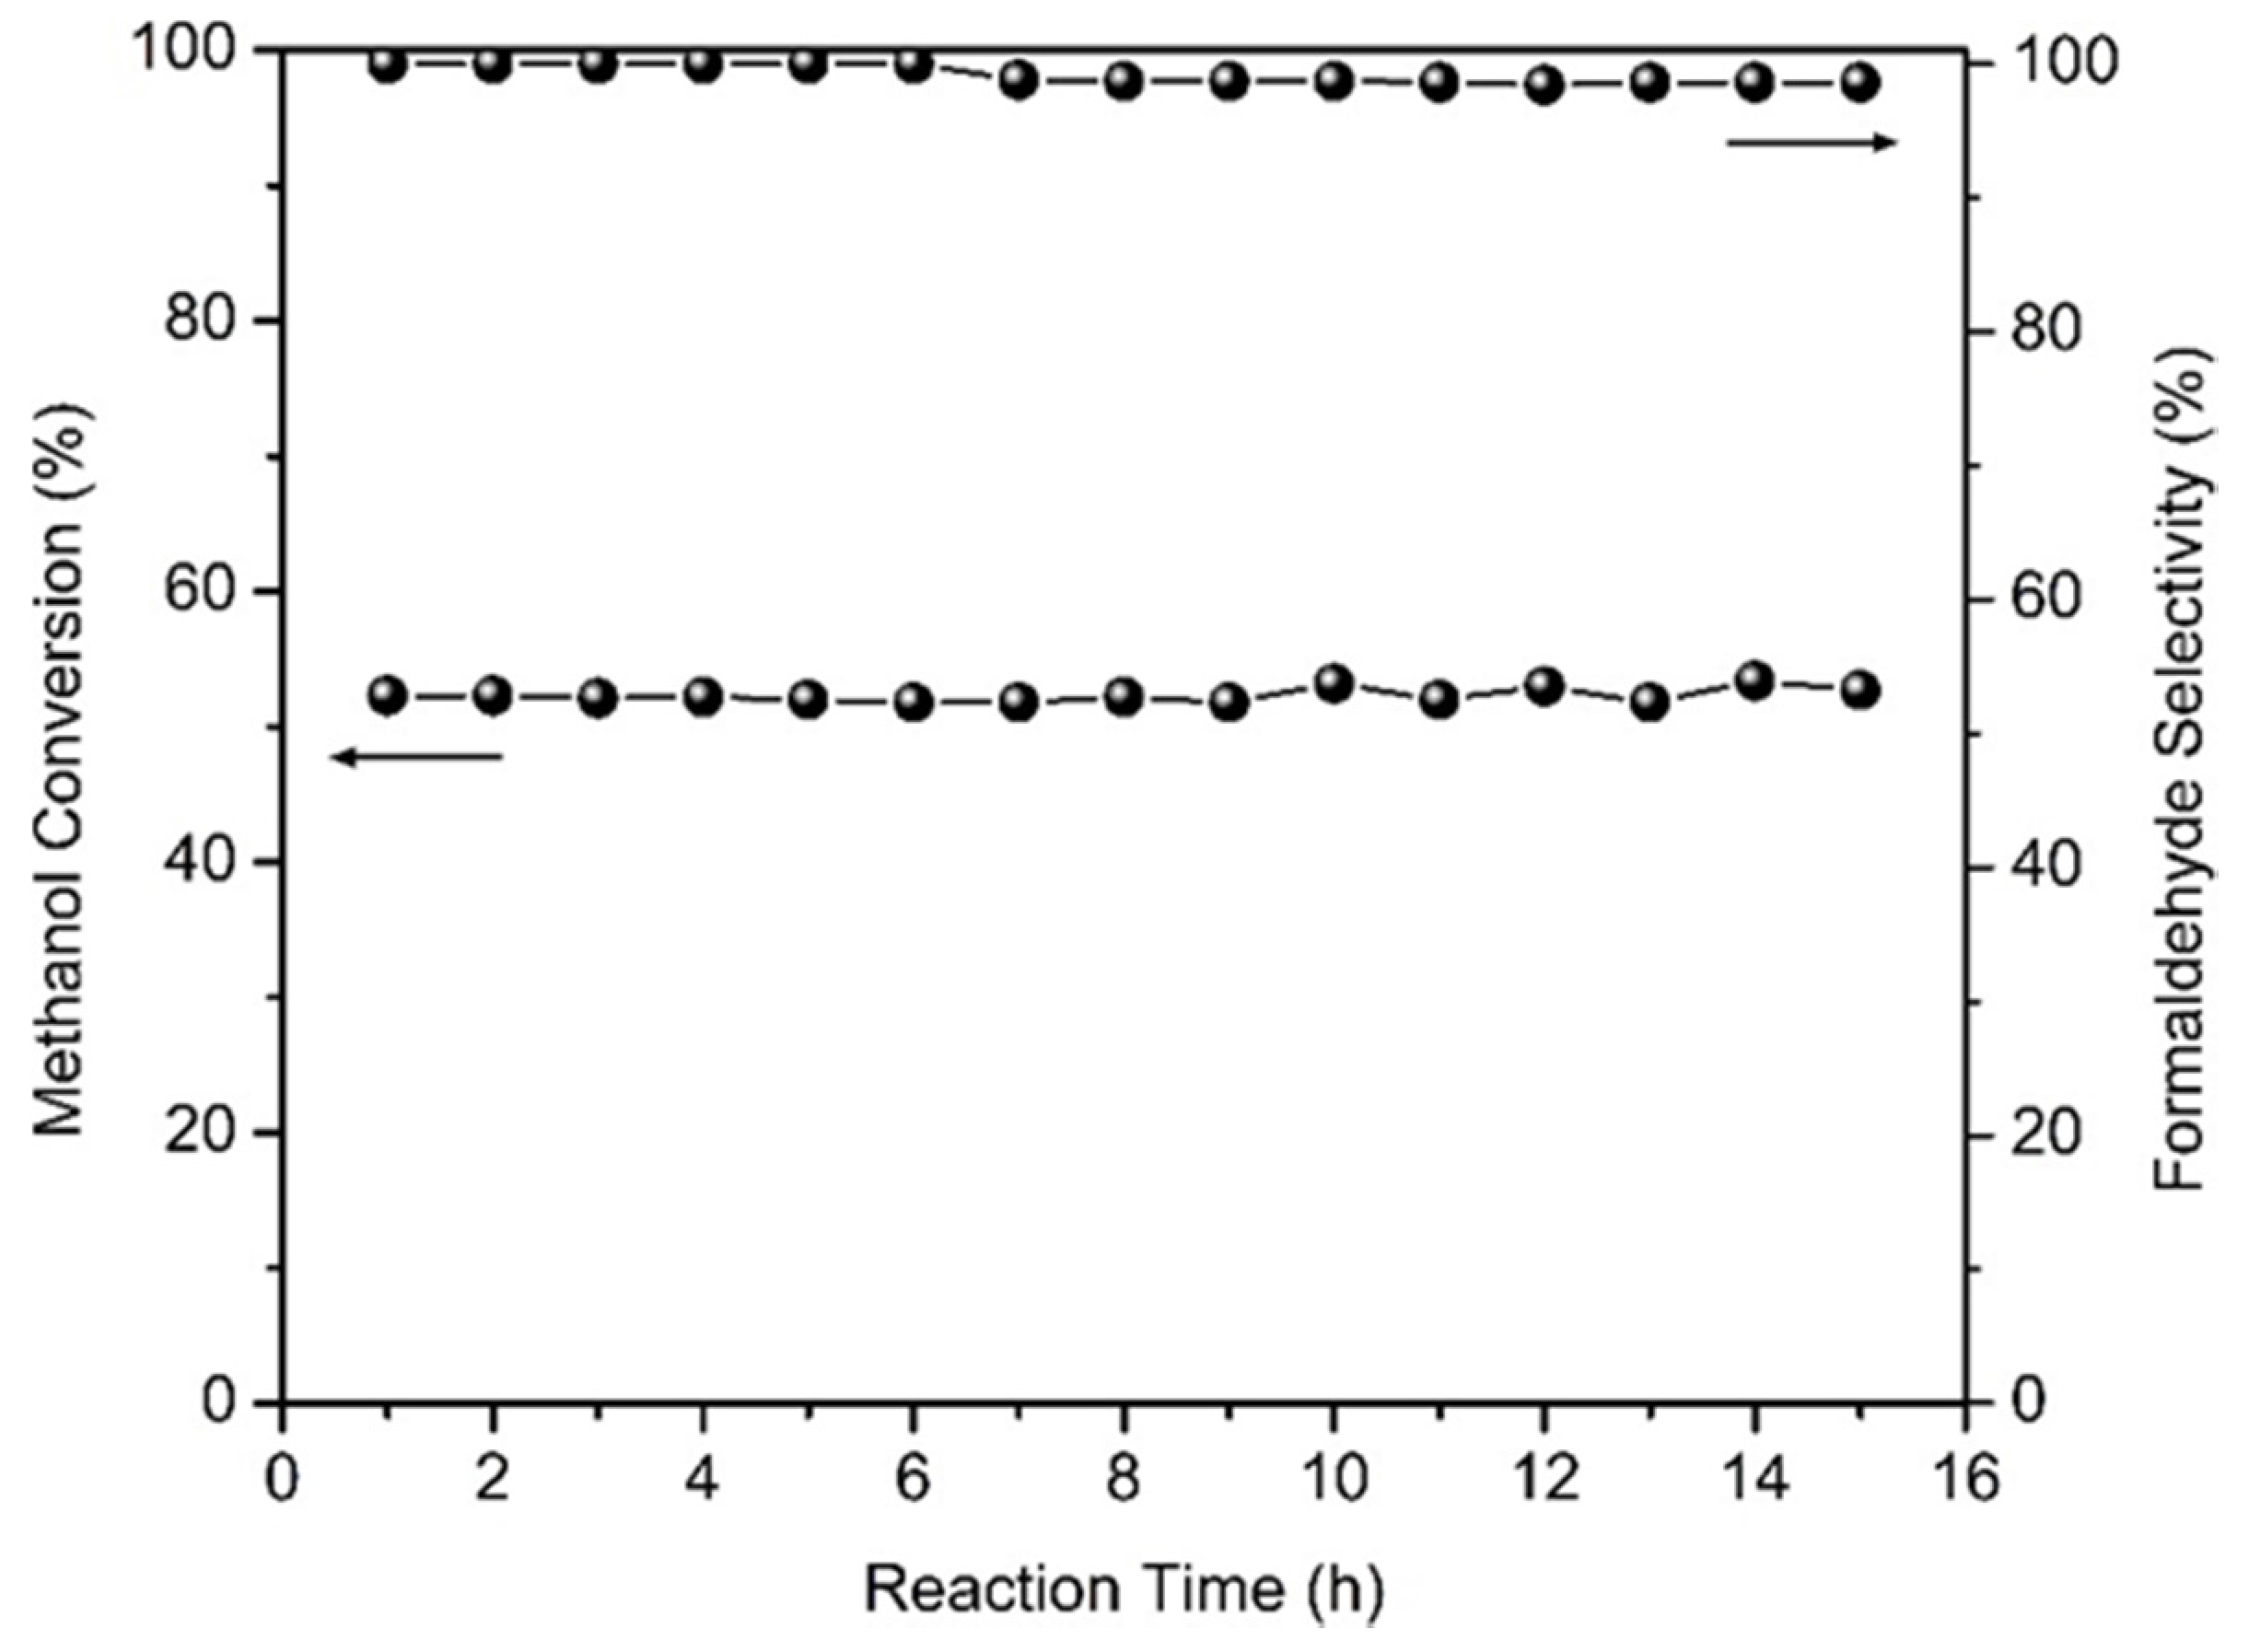
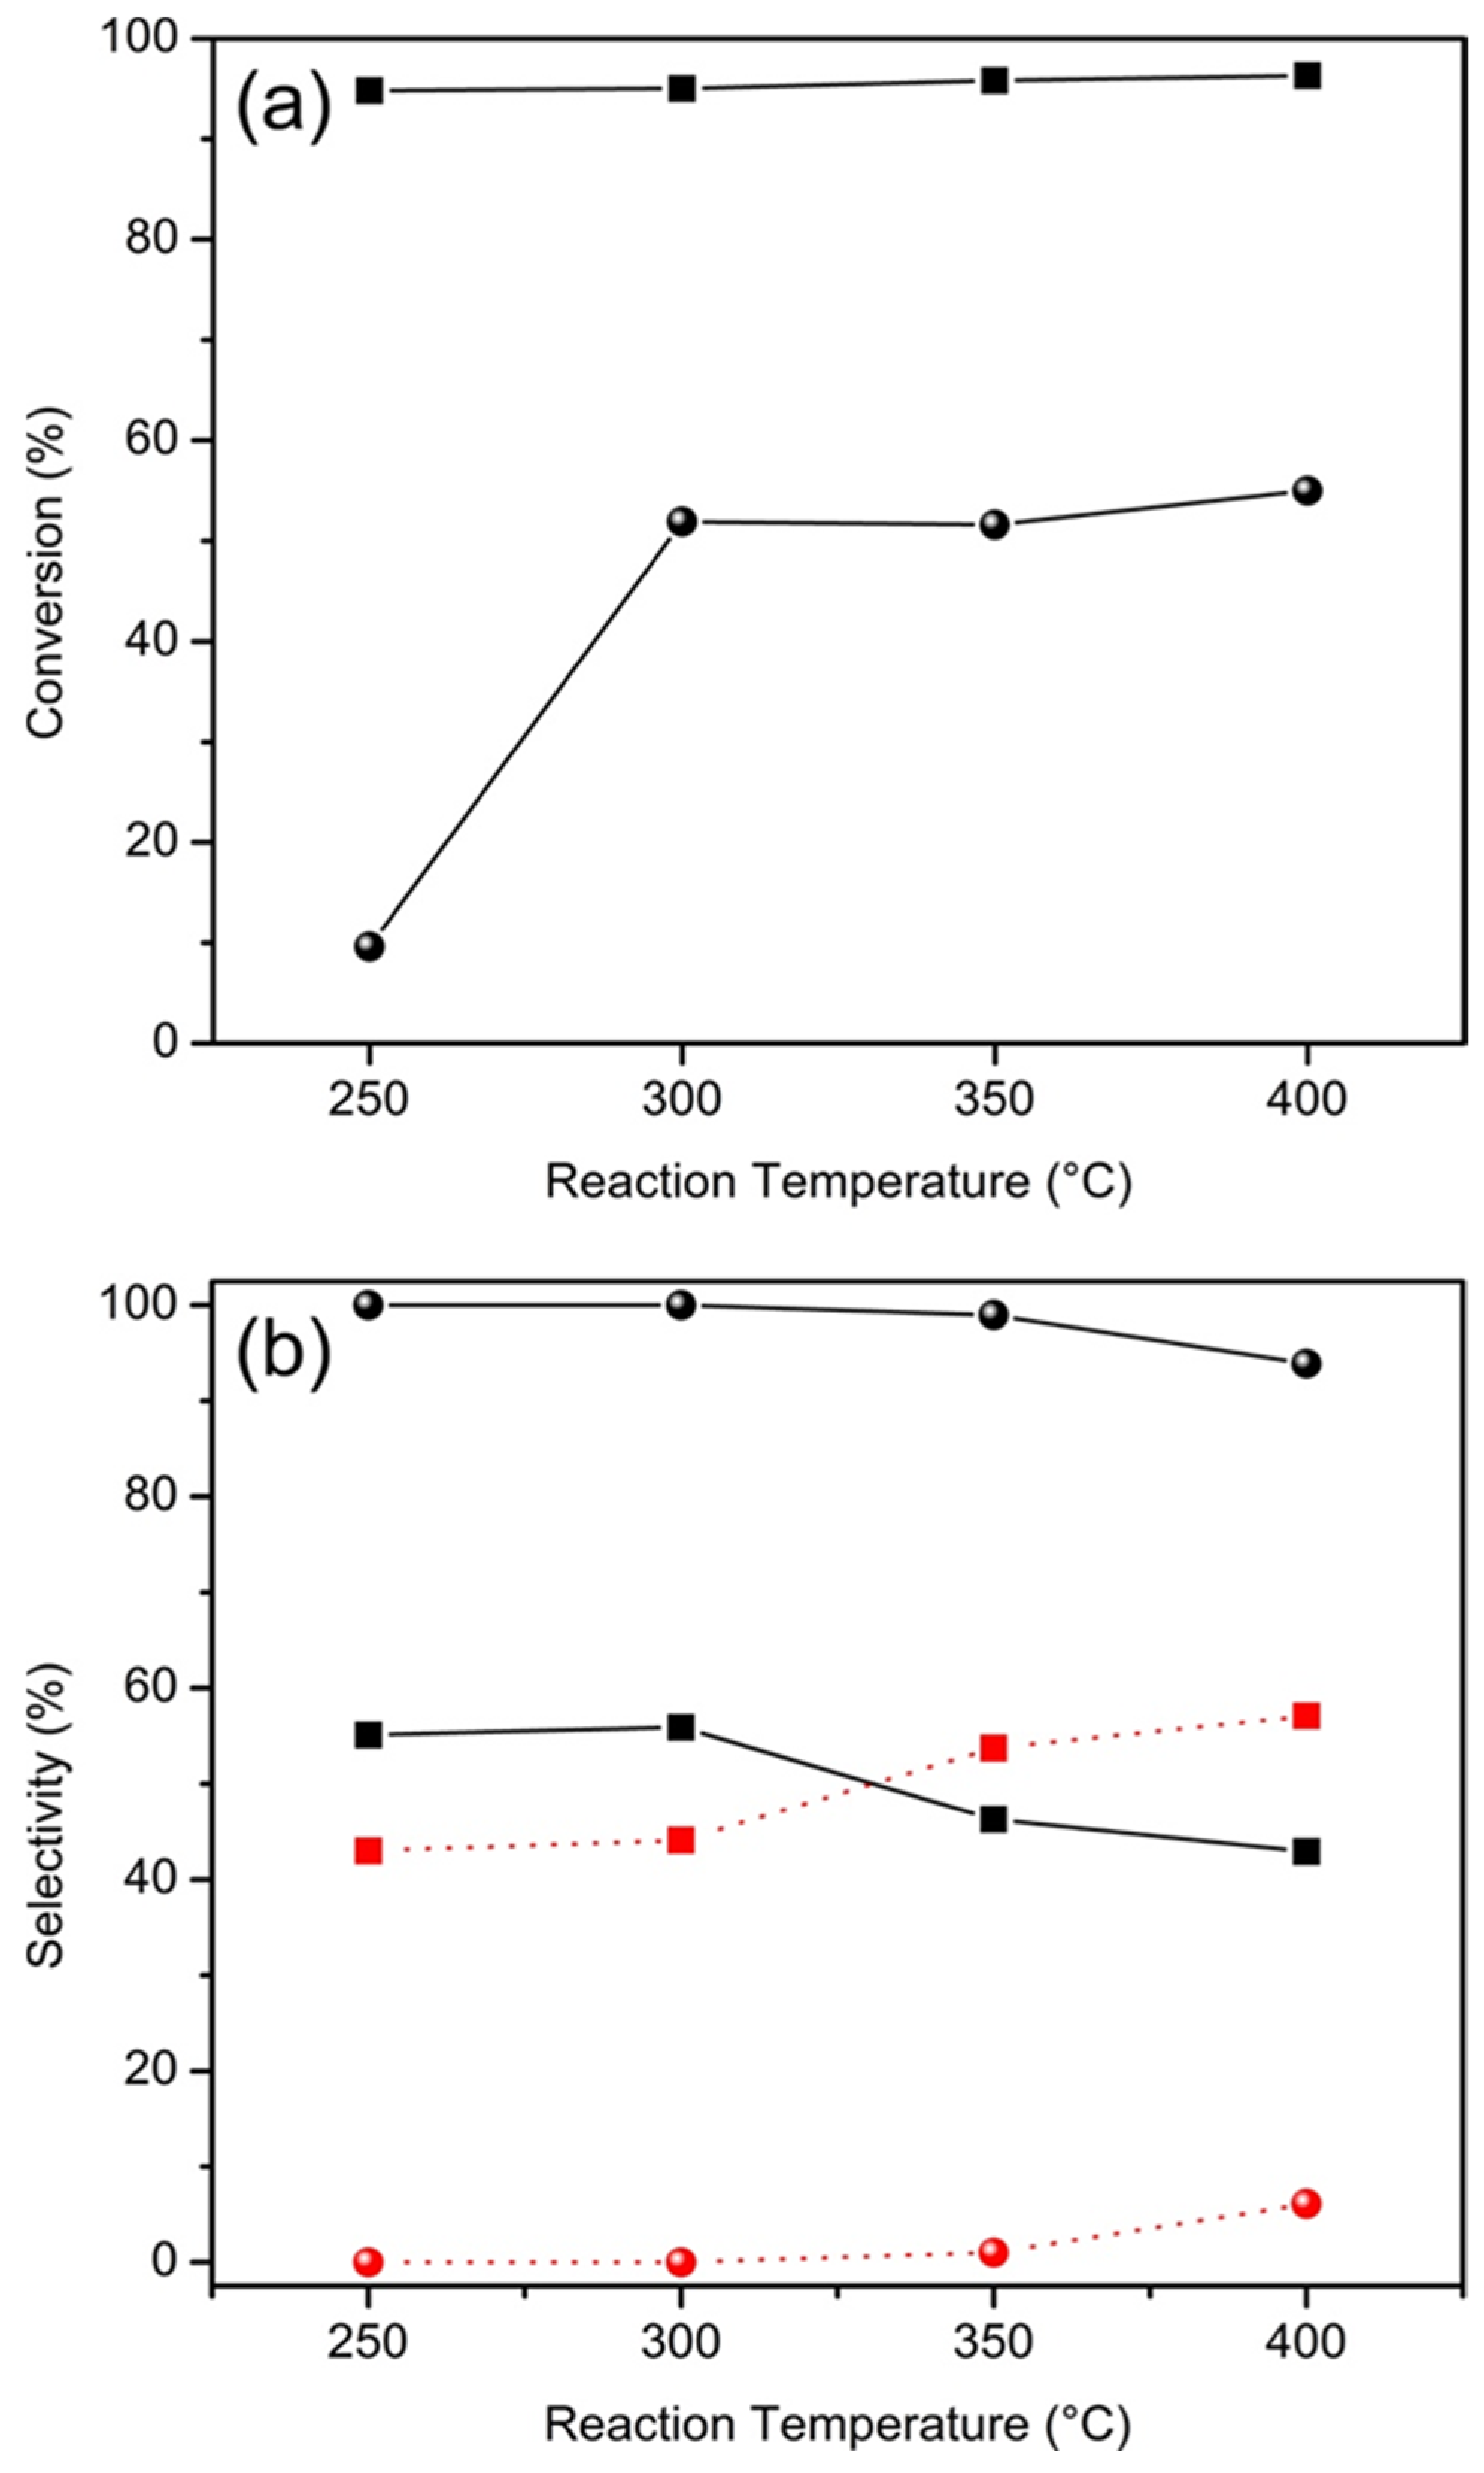
2.2. Catalytic Properties

In order to evaluate the catalytic activity of HTPS samples for methanol dehydrogenation, the catalytic tests were performed at various temperatures between 250 and 400 °C. The alcohol flow rate was 0.08 mL/min and the catalyst mass was 0.1 g. Under these conditions, formaldehyde and hydrogen were the main products, and CH4 was observed as a side product. The methanol conversion and product selectivities as a function of reaction temperature are shown in Figure 7. Figure 7a shows that all of the samples exhibit catalytic activities for the reaction. For both HTPS-600 and -650, the conversion increases sharply at 300 °C to over 45% and reaches 52% at 400 °C. However, HTPS-700 shows a, more or less, linear increase in the same temperature range and the conversion becomes comparable only at 400 °C. On the contrary, the selectivity to formaldehyde is the same (~100%) for all of the samples in the entire temperature range (Figure 7b), which cannot be correlated with either the surface acidity or the specific surface area of the HTPS catalysts. The significantly lower methanol conversion by HTPS-700 in the low temperature region is puzzling but may be due to either the low surface acidity or the low surface area compared to HTPS-600 and -650.
Solid acids are not generally associated with the non-oxidative dehydrogenation of alcohols, but with dehydration, although there have been exceptions. For example, non-oxidative dehydrogenation of ethanol has been carried out over mildly acidic NASICON-type compounds Li0.9Zr2(PO4)2.9(MoO4)0.1 and Li1Zr1.8In0.1Nb0.1(PO4)3 [29]. They showed conversions of 100% and acetaldehyde selectivities of ~60% and 80%, respectively, although the catalyst activity was attributed mainly to redox chemistry of the high-oxidation transition metal ions in the catalysts. Relatively mild surface acidity may be beneficial based on the results obtained by Florek-Milewska et al. [30] who noted that the stronger acidity of the catalyst did not allow CH2O molecules to desorb from the surface in the gas phase leading to the formation of methyl formate, which was not observed for our catalysts. The importance of solid acidity for the non-oxidative dehydrogenation was also mentioned for the Na-ZSM-5 catalysts [9], although the specific role of the acid site during dehydrogenation has not been established.
The influence of contact time on methanol conversion and formaldehyde yield over the three catalysts is shown in Figure 8. With higher calcination temperatures, the catalysts exhibit lower methanol conversion and formaldehyde yield. Methanol conversion increases with surface area and is always the highest for HTPS-600, and increases rapidly with contact time from a W/F (g·h/mol) of 0.75 to 1.75, beyond which the change is less rapid. Formaldehyde yield shows different trends for the catalyst. It increases linearly for HTPS-600, while it does not change for HTPS-650 or shows a maximum at 1.75 g∙h/mol for HTPS-700.
Figure 9 presents results of stability experiments for non-oxidative dehydrogenation of methanol that were conducted over HTPS 600 at 350 °C for 15 h, with a methanol flow rate 0.08 mL/min and a catalyst loading of 0.3 g. The methanol conversion is constant around 52% and the selectivity remains at 100% for 7 h, after which it decreases to 99% where it remains stable. The unchanging conversion and selectivity are quite remarkable considering the rapid deterioration of catalytic activities of other catalysts reported in the literature through various different mechanisms. Catalyst deactivation is, generally, most pronounced during the initial hours, as observed for ZnO-based catalysts at 600 °C where the Zn2+ is reduced to Zn0 and then evaporates. Zeolite-based catalysts are deactivated due to coking at 500–600 °C [9]. High activity of Ag–SiO2–MgO–Al2O3 catalyst disappears upon deleterious appearance and growth of silver nanoparticles during the catalytic reaction [16]. In contrast, HTPS-600 retains its methanol conversion and selectivity for formaldehyde, and this indicates the robustness of the chemical structure and morphologies of the catalyst during operation. The results obtained for methanol dehydrogenation are summarized and compared with other catalysts from the literature in Table 2.
HTPS-650 catalyst was further tested for non-oxidative dehydrogenation of ethanol and the results are presented in Figure 10. Acetaldehyde is produced by the reaction: C2H5OH ⇄ C2H4O + H2, while dehydration side reaction results in ethylene (C2H5OH ⇄ C2H4 + H2O). In comparison to methanol conversion, the ethanol conversion is much more effective, exceeding 95% even at 250 °C. However, the selectivity to acetaldehyde remains moderate at 43%–56%. The relatively low selectivity for acetaldehyde, the dehydrogenation product, is a stark contrast against the near 100% selectivity for formaldehyde in methanol conversion. The significant dehydration side reaction is consistent with the facts that solid acids are effective for dehydration [31] and that the hydroxyl group of ethanol is electron-richer and, thus, more easily protonated than that of methanol. Nevertheless, HTPS is more active than another known NASICON-type compound, Li0.9Zr2(PO4)2.9(MoO4)0.1, which showed conversion of ethanol around 30% to 100%, with the selectivity for acetaldehyde decreasing from 20% to <5%, while selectivity to ethylene increased from 1% to 30% with other side products such as diethyl ether and C4 hydrocarbons [32]. HTPS exhibits a high conversion at lower temperatures and a simple two-component effluent mixture of only acetaldehyde and ethylene which can be easily separated due to the significant difference in their boiling points (20.2 vs. −103.7 °C).

3. Experimental Methods

3.1. Materials Synthesis

Catalysts were prepared under the same sol-gel conditions, but at three different calcination temperatures, and were named accordingly. For a typical synthesis, TiOSO4 dissolved in water was obtained from 4.41 g of TiOSO4·0.18H2SO4·3.11H2O (Sigma-Aldrich, St. Louis, MO, USA) in 3.43 g of deionized water with magnetic stirring in an 80 mL glass jar. Then, 3.82 g of 27 wt % H2O2 (Alfa Aesar, Haverhill, MA, USA) was added slowly, to give the Ti/H2O2 molar ratio of 1.8. To the solution, 2.77 g of polyethylene glycol bisphenol A epichlorohydrin copolymer (~98% polyethylene glycol (PEG)) (15–20 kDa, 45.5 wt %, Sigma-Aldrich) was added while stirring to result in 10 wt % PEG compound solution. Finally, 2.44 g of 83.3 wt % H3PO4 solution (Alfa Aesar) was introduced under stirring, and the final titanium concentration was 2.1 M. The glass jar was covered and heated in a lab oven at 60 °C for 40 h. After that, the sample was uncovered and was heated at the same conditions for 12 h to yield an orange crumbling dry gel, followed by calcination at different temperatures for 10 h in an ashing furnace (Carbolite, Hope Valley, UK, AAF1100) with a heating rate of 100 °C/h to produce a porous white compound.

3.2. Materials Characterization

The X-ray diffraction patterns were determined with a PANalytical X’Pert Pro MRD diffractometer (PANalytical, Almelo, the Netherlands) using Cu Kα radiation. The sample was crushed together with internal standard (Si, a = 5.4301 Å), and spread on a zero-background quartz sample holder. Data was acquired by scanning 2θ from 10° to 90° with a step size of 0.0251° and a scan time of 30 min.
Scanning electron microscopy (SEM) imaging studies were obtained with an XL-30 Environmental SEM (FEI Company, Hillsboro, OR, USA) using 20 keV electrons on lightly ground samples.
Transmission electron microscopy (TEM) studies were performed on finely ground catalysts that were dusted on to TEM grids. High resolution TEM images were collected on a JEOL 2010F (JEOL, Arvada, CO, USA) at an accelerating voltage of 200 kV. For the elemental analysis a Thermo iCAP6300 inductively-coupled plasma optical emission spectrometer (ICP-OES, ThermoFisher Scientific, Waltham, MA, USA) was used.
For sorption measurements, samples were first degassed under vacuum at 200 °C for 8 h. Nitrogen sorption isotherms were obtained on a Micromeritics ASAP 2020 Surface Area and Porosity Analyzer (Micromeritics, Norcross, GA, USA) at 77 K. The BET model was applied to the partial pressure range of 0.05–0.2 of the adsorption branch to calculate surface area. The desorption branch was used for analysis of the pore characteristics. To estimate the pore size distribution, the BJH model using the Halsey thickness curve, heterogeneous surfaces and Faass correction to account for multilayer desorption, was applied [33]. For the total pore volume determination, the total quantity of gas adsorbed at p/p0 ≈ 0.98 was used.
The NH3-TPD measurements were realized with a Micromeritics Auto-ChemII apparatus (Micromeritics, Madrid, Spain) equipped with a programmable temperature furnace and thermal conductivity detector. An amount of the sample (0.05 g) was purged for 2 h with 40 mL/min He. Under the same He flow, the temperature was increased from ambient to 500 °C using a heating rate of 5 °C/min, followed by decreasing the temperature to 40 °C. The sample was further flushed with 3% NH3/He for 30 min at 40 °C, and purged with 40 mL/min He at 40 °C for 1 h. The temperature was increased from 40 to 700 °C at 10 °C/min, while measuring the amount of ammonia at the exit flow. At temperatures below 350 °C corresponds weak acidity, between 350 and 500 °C medium, and strong acidities were assigned above 500 °C [34].
The UV-VIS spectra were determined with a UV3600 spectrophotometer (Shimadzu, Osaka, Japan) with a Shimadzu ISR-3100 integrating sphere attachment having an angle of incident light of 0°–8°, a wavelength range of 200–800 nm, with a wavelength step of 2 nm, and having a slit width of 8 nm. For the sample dilution, barium sulfate has been used (purchased from Nacalai Tesque, Kyoto, Japan). XPS was performed using a VG ESCALAB 220i-XL with an Al Kα anode (1486.6 eV) at 60 W and 12 kV, with 0.7 eV line width. The X-ray takeoff angle was set to 45° and data were acquired near the sample edge, and charge compensation was used. Calibration was performed about the hydrocarbon peak at 284.5 eV, and peak fitting was performed using CasaXPS software (version 2.3.16 PR 1.6, CASA Software Ltd., Teignmouth, Devon, UK, 1999–2011).

3.3. Measurements of Catalytic Activity

The measurements for methanol and ethanol dehydrogenation were realized using a continuous-flow, tubular fixed-bed glass reactor (10 mm i.d., University of Bucharest, Bucharest, Romania) at temperatures between 250 and 400 °C, at atmospheric pressure. Before the reaction, the reactor was purged with N2 to remove air. The catalyst weight was 0.1–0.3 g and the methanol flow rate was from 0.08 to 0.3 mL/min. Reaction products were collected every 30 min and were analyzed by a gas chromatograph TRACE GC Ultra (Thermo Finnigan, Bucharest, Romania) equipped with a hydrogen flame ionization detector (FID), a capillary column with a DB5 stationary phase (30 m length and 0.324 mm diameter), and highly pure N2 (99.999%) as the carrier gas.

4. Conclusions

The non-oxidative dehydrogenation of methanol and ethanol to the respective aldehydes was carried out over a new titanium phosphate sulfate catalyst, H1−xTi2(PO4)3−x(SO4)x, which has a high surface area and high porosity.
The catalytic activity increasing depends on a variety of factors, such as (i) the presence of isolated tetrahedral species; (ii) higher surface area, which leads to more active sites on the surface; and (iii) the presence of a weak and medium acidity making the catalysts calcinated at 600 and 650 °C, more active than the one calcinated at 700 °C.
With methanol, selectivity for formaldehyde was nearly 100% and, at temperatures above 300 °C, the conversion was higher than 50%. The catalyst performance was steady for at least 15 h at 350 °C. In contrast, the catalyst showed over 95% conversion of ethanol even at temperatures as low as 250 °C, with selectivity for acetaldehyde up to 56%. The compounds are the first examples of solid acids that efficiently catalyze non-oxidative dehydrogenation of alcohols. Their robust catalytic activities warrant further exploration of similar solid acids in search for ideal catalysts for the reactions.

Acknowledgments

Daniel G. Mieritz was partly funded by the DOD MURI award W911NF-12-1-0420. We gratefully acknowledge the use of facilities within the LeRoy Eyring Center for Solid State Science at Arizona State University and University of Bucharest for facilities.

Author Contributions

Gheorghiţa Mitran performed catalytic reactions and interpretation of results; Daniel G. Mieritz performed synthesis and material characterization of the catalysts and contributed in experimental design and writing; Dong-Kyun Seo conceived and designed the original synthesis, contributed reagents/materials/analysis tools for synthesis, data analysis and writing.

Conflicts of Interest

The authors declare no conflict of interest.

References

  1. Brookes, C.; Bowker, M.; Wells, P.P. Catalysts for the selective oxidation of methanol. Catalysts 2016, 6, 92. [Google Scholar] [CrossRef]
  2. Jiang, Z.; Wang, B.; Fang, T. A theoretical study on the complete dehydrogenation of methanol on Pd (100) surface. Appl. Surf. Sci. 2016, 364, 613–619. [Google Scholar] [CrossRef]
  3. Sun, J.; Wang, Y. Recent advances in catalytic conversion of ethanol to chemicals. ACS Catal. 2014, 4, 1078–1090. [Google Scholar] [CrossRef]
  4. Ruf, S.; May, A.; Emig, G. Anhydrous formaldehyde by sodium catalysis. Appl. Catal. A 2001, 213, 203–215. [Google Scholar] [CrossRef]
  5. Matsumura, Y.; Hashimoto, K.; Yoshida, S. Active sites for methanol dehydrogenation to formaldehyde on sodium-modified silicalite-1. J. Catal. 1991, 131, 226–233. [Google Scholar] [CrossRef]
  6. Usachev, N.Y.; Krukovskii, I.M.; Kanaev, S.A. The nonoxidative methanol dehydrogenation to formaldehyde (A review). Pet. Chem. 2004, 44, 379–394. [Google Scholar]
  7. El-Molla, S.A.; Mahmoud, H.R. Synthesis, textural and catalytic properties of nanosized Fe2O3/MgO system. Mater. Res. Bull. 2013, 48, 4105–4111. [Google Scholar] [CrossRef]
  8. Takagi, K.; Morikawa, Y.; Ikawa, T. Catalytic activities of coppers in the various oxidation states for the dehydrogenation of methanol. Chem. Lett. 1985, 14, 527–530. [Google Scholar] [CrossRef]
  9. Muŝiĉ, A.; Batista, J.; Levec, J. Gas-phase catalytic dehydrogenation of methanol to formaldehyde over ZnO/SiO2 based catalysts, zeolites, and phosphates. Appl. Catal. A 1997, 165, 115–131. [Google Scholar]
  10. Ilolov, A.M.; Tret’yakov, V.F.; Talyshinskii, R.M.; Lermontov, A.S. Thermodynamic analysis of the feasibility of coupled nonoxidative dehydrogenation of methanol into formaldehyde. Pet. Chem. 2009, 49, 127–132. [Google Scholar] [CrossRef]
  11. Yamamoto, T.; Shimoda, A.; Okuhara, T.; Misono, M.A. A promoting effect of phosphorus-addition to Cu/SiO2 on selective synthesis of formaldehyde by dehydrogenation of methanol. Chem. Lett. 1988, 17, 273–276. [Google Scholar] [CrossRef]
  12. Wang, Q.N.; Shi, L.; Lu, A.H. Highly selective copper catalyst supported on mesoporous carbon for the dehydrogenation of ethanol to acetaldehyde. ChemCatChem 2015, 7, 2846–2852. [Google Scholar] [CrossRef]
  13. Takei, T.; Iguchi, N.; Haruta, M. Support effect in the gas phase oxidation of ethanol over nanoparticulate gold catalysts. New J. Chem. 2011, 35, 2227–2233. [Google Scholar] [CrossRef]
  14. Liu, P.; Zhu, X.; Yang, S.; Li, T.; Hensen, E.J.M. On the metal–support synergy for selective gas-phase ethanol oxidation over MgCuCr2O4 supported metal nanoparticle catalysts. J. Catal. 2015, 331, 138–146. [Google Scholar] [CrossRef]
  15. Cao, Y.; Dai, W.-L.; Deng, J.-F. The synthesis, characterization and application of Ag–SiO2–Al2O3 sol–gel composites. Mat. Lett. 2001, 50, 12–17. [Google Scholar] [CrossRef]
  16. Ren, L.-P.; Dai, W.-L.; Cao, Y.; Li, H.; Fan, K. First observation of highly efficient dehydrogenation of methanol to anhydrous formaldehyde over novel Ag–SiO2–MgO–Al2O3 catalyst. Chem. Commun. 2003, 24, 3030–3031. [Google Scholar] [CrossRef]
  17. Dong, Y.; Dai, W.-L.; Li, J.-L.; Deng, J.-F. Direct dehydrogenation of methanol to formaldehyde over novel Ag-containing ceramics. Chem. Lett. 2001, 30, 534–535. [Google Scholar] [CrossRef]
  18. Li, H.-J.; Lausche, A.C.; Peterson, A.A.; Hansen, H.A.; Studt, F.; Bligaard, T. Using microkinetic analysis to search for novel anhydrous formaldehyde production catalysts. Surf. Sci. 2015, 641, 105–111. [Google Scholar] [CrossRef]
  19. Wiesgickl, G.; Beck, H.P.; Emig, G. Novel type of catalyst for the pure dehydrogenation of methanol to formaldehyde. Appl. Catal. 1990, 59, L1–L7. [Google Scholar] [CrossRef]
  20. Su, S.; Prairie, M.R.; Renken, A. Reaction mechanism of methanol dehydrogenation on a sodium carbonate catalyst. Appl. Catal. A 1992, 91, 131–142. [Google Scholar] [CrossRef]
  21. Ren, L.-P.; Dai, W.-L.; Yang, X.-L.; Cao, Y.; Li, H.; Fan, K.-N. Novel highly active Ag–SiO2–Al2O3–ZnO catalyst for the production of anhydrous HCHO from direct dehydrogenation of CH3OH. Appl. Catal. A 2004, 273, 83–88. [Google Scholar] [CrossRef]
  22. Asabina, E.A.; Orekhova, N.V.; Ermilova, M.M.; Pet’kov, V.I.; Glukhova, I.O.; Zhilyaeva, N.A.; Yaroslavtsev, A.B. Synthesis and catalytic properties of MFeTi(PO) (M = Co, Ni, Cu; 0 ≤ x ≤ 2) for methanol conversion reactions. Inorg. Mater. 2015, 51, 793–798. [Google Scholar] [CrossRef]
  23. Mieritz, D.; Davidowski, S.K.; Seo, D.-K. Accessing alkali-free NASICON-type compounds through mixed oxoanion sol–gel chemistry: Hydrogen titanium phosphate sulfate, H1−xTi2(PO4)3−x(SO4)x (x = 0.5–1). J. Solid State Chem. 2016, 242, 116–125. [Google Scholar]
  24. Alothman, Z. A review: Fundamental aspects of silicate mesoporous materials. Materials 2012, 5, 2874–2902. [Google Scholar] [CrossRef]
  25. Zhao, H.; Jiang, P.; Dong, Y.; Huang, M.; Liu, B. A high-surface-area mesoporous sulfated nano-titania solid superacid catalyst with exposed (101) facets for esterification: facile preparation and catalytic performance. New J. Chem. 2014, 38, 4541–4548. [Google Scholar] [CrossRef]
  26. Cruz, P.; Pérez, Y.; del Hierro, I. Titanium alkoxides immobilized on magnetic mesoporous silica nanoparticles and their characterization by solid state voltammetry techniques: Application in ring opening polymerization. Micro. Meso. Mater. 2017, 240, 227–235. [Google Scholar] [CrossRef]
  27. Kimbombo, H.; Peng, R.; Rasalingam, S.; Koodali, R. Versatility of heterogeneous photocatalysis: synthetic methodologies epitomizing the role of silica support in TiO2 based mixed oxides. Catal. Sci. Technol. 2012, 2, 1737–1766. [Google Scholar] [CrossRef]
  28. Zhao, R.; Mieritz, D.; Seo, D.-K.; Chan, C.K. New hydrogen titanium phosphate sulfate electrodes for Li-ion and Na-ion batteries. J. Power Sources 2017, 343, 197–206. [Google Scholar] [CrossRef]
  29. Ilin, A.B.; Orekhova, N.V.; Ermilova, M.M.; Yaroslavtsev, A.B. Catalytic activity of LiZr2(PO4)3 nasicon-type phosphates in ethanol conversion process in conventional and membrane reactors. Catal. Today 2016, 268, 29–36. [Google Scholar] [CrossRef]
  30. Florek-Milewska, J.; Decyk, P.; Ziolek, M. Catalytic properties of Cu/SBA-3 in oxidative dehydrogenation of methanol—The effect of the support composition. Appl. Catal. A 2011, 393, 215–224. [Google Scholar] [CrossRef]
  31. Hattori, H.; Ono, Y. Solid Acid Catalysis: From Fundamentals to Applications; Pan Stanford Publishing: Singapore, Singapore, 2015. [Google Scholar]
  32. Il’in, A.B.; Ermilova, M.M.; Orekhova, N.V.; Yaroslavtsev, A.B. Synthesis of framework lithium zirconium molybdate phosphates and their catalytic properties in ethanol conversion reactions. Inorg. Mater. 2015, 51, 711–717. [Google Scholar] [CrossRef]
  33. Halsey, G. Physical adsorption on non-uniform surfaces. J. Chem. Phys. 1948, 16, 931–938. [Google Scholar] [CrossRef]
  34. Liu, D.; Yuan, P.; Liu, H.; Cai, J.; Tan, D.; He, H.; Zhu, J.; Chen, T. Quantitative characterization of the solid acidity of montmorillonite using combined FTIR and TPD based on the NH3 adsorption system. Appl. Clay Sci. 2013, 80–81, 407–412. [Google Scholar] [CrossRef]
Figure 1. PXRD patterns of the catalysts hydrogen titanium phosphate sulfate (HTPS)-600 (bottom), HTPS-650 (middle), and HTPS-700 (top).
Catalysts 07 00095 g001
Figure 2. Scanning electron microscopy (SEM) micrographs of HTPS-650; scale bars are 5 µm for (a) and 500 nm for (b).
Catalysts 07 00095 g002
Figure 3. Transmission electron microscopy (TEM) and high resolution TEM (HRTEM) micrographs of HTPS-650; scale bars are 100 nm for (a) and 10 nm for (b).
Catalysts 07 00095 g003
Figure 4. (a) Nitrogen sorption isotherms and (b) Barrett–Joyner–Halenda (BJH) pore size distributions for the samples HTPS-600 (blue), HTPS-650 (green), and HTPS-700 (red).
Catalysts 07 00095 g004
Figure 5. NH3 temperature-programmed desorption (NH3-TPD) profiles of HTPS-600 (blue), HTPS-650 (green), and HTPS-700 (red).
Catalysts 07 00095 g005
Figure 6. UV-VIS spectra of HTPS-600 (blue), HTPS-650 (green), and HTPS-700 (red), with a high-resolution X-ray photoelectron spectroscopy (XPS) spectrum around Ti 2p of HTPS-650 in the inset.
Catalysts 07 00095 g006
Figure 7. Effect of the temperature on the methanol conversion (a) and formaldehyde (H2) and methane selectivity (b) over HTPS-600 (blue), HTPS-650 (green), and HTPS-700 (red) (methanol flow rate 0.08 mL/min, catalyst loading 0.1 g).
Catalysts 07 00095 g007
Figure 8. The methanol conversion (a) and formaldehyde yield (b) as a function of methanol contact time W/F, at 400 °C for HTPS-600 (blue), HTPS-650 (green), and HTPS-700 (red).
Catalysts 07 00095 g008
Figure 9. Stability of methanol conversion and selectivity for formaldehyde on HTPS-600 at 350 °C (flow rate 0.08 mL/min, catalyst mass 0.3 g).
Catalysts 07 00095 g009
Figure 10. (a) Effect of the temperature on conversion of ethanol (square) in comparison to methanol (filled sphere) over HTPS-650 catalysts (flow rate 0.08 mL/min, catalyst loading 0.2 g); and (b) the effect of the temperature on selectivities for acetaldehyde (black square) and ethylene (red square) in ethanol conversion in comparison to those for formaldehyde (black sphere) and methane (red sphere) in methanol conversion.
Catalysts 07 00095 g010
Table 1. Surface areas, pore characteristics, and surface acid site concentrations of the hydrogen titanium phosphate sulfate (HTPS) catalysts.
Samplea (Å)c (Å)Crystallite Size (nm)SBET (m2/g)Pore Volume (cm3/g)Average Pore Size (nm)Surface Acid Site (µmol/g)
MediumTotal
HTPS-6008.47221.6616560.22162137.6
HTPS-6508.48221.6415500.25202532.5
HTPS-7008.48421.7617320.2429-4.8
Table 2. Performance of various catalysts for methanol dehydrogenation to formaldehyde (reaction condition in this work: flow rate 0.08 mL/min, catalyst mass 0.1 g, time 30 min).
CatalystTemperature (°C)Methanol Conversion (%)H2CO Selectivity (%)TON 1 (10−4)Reference
HTPS-60040053981.5This work
HTPS-65040052991.2This work
HTPS-70040049990.6This work
Cu(0)-TSM 24006100-[8]
Cu/SiO25003082-[11]
Ag/SiO2-Al2O36507097.5-[16]
Ce-ZnO/SiO26004032-[9]
Na-ZnO/SiO26003830-[9]
1 Turnover number (TON) = moles of methanol converted/moles of active sites (acidity); 2 TSM, fluoro tetrasilicic mica.

