Synthesis of Phase Pure Hexagonal YFeO3 Perovskite as Efficient Visible Light Active Photocatalyst

1
Institute of Chemistry, Chemical Technology 1, Carl von Ossietzky University Oldenburg, Carl-von-Ossietzky-Str. 9-11, 26129 Oldenburg, Germany
2
National Institute of Oceanography and Fisheries, El Kasr Ainy St. 101, Cairo 11562, Egypt
*
Author to whom correspondence should be addressed.
Catalysts 2017, 7(11), 326; https://doi.org/10.3390/catal7110326
Submission received: 10 October 2017
/
Revised: 25 October 2017
/
Accepted: 30 October 2017
/
Published: 3 November 2017
(This article belongs to the Special Issue Photocatalytic materials alternative to TiO2 for environmental remediation, sustainable chemistry and energy conversion)
Abstract
:Hexagonal perovskite YFeO3 was synthesized by a complex-assisted sol-gel technique allowing crystallization at calcination temperatures below 700 °C. As determined by diffuse reflectance spectroscopy (DRS) and Tauc plots, the hexagonal YFeO3 exhibits a lower optical band gap (1.81 eV) than the orthorhombic structure (about 2.1 eV or even higher) being typically obtained at elevated temperatures (>700 °C), and thus enables higher visible light photocatalysis activity. Structure and morphology of the synthesized YFeO3 perovskites were analyzed by powder X-ray diffraction (XRD) and nitrogen adsorption, proving that significantly smaller crystallite sizes and higher surface areas are obtained for YFeO3 with a hexagonal phase. The photocatalytic activity of the different YFeO3 phases was deduced via the degradation of the model pollutants methyl orange and 4-chlorophenol. Experiments under illumination with light of different wavelengths, in the presence of different trapping elements, as well as photoelectrochemical tests allow conclusions regarding band positions of YFeO3 and the photocatalytic degradation mechanism. X-ray photoelectron spectroscopy indicates that a very thin layer of Y2O3 might support the photocatalysis by improving the separation of photogenerated charge carriers.

1. Introduction
Visible light photocatalysis is a well-known technique for the purification of environmental contaminations [1,2,3]. Many studies were carried out in the last few years in order to develop new compounds with narrow band gaps to increase the visible light response of photocatalysts [4,5]. Due to their high chemical stability, oxides are the most attractive class of compounds; the use of mixed metal oxides allows for an effective tailoring of the physicochemical properties. Oxides with perovskite structure are of special interest, since they show some important features with respect to catalysis, optics, and magnetism [6,7]. The fact that the perovskite structure is highly flexible allows more than 90% of the metallic elements in the periodic table to be stable in this structure. This lead to a wide variety of compositions with varying A: B ratios which deviate from the expected ideal ABO3. Such compositional variations are accompanied by the formation of cation and oxygen vacancies which control the transport, adsorption, and optical properties of the material [8]. Even after consideration of the Goldschmidt tolerance factor (an empirical indicator for the stability of crystal structures of perovskites, ABO3) [9], a wide variation of the cations on the A and B positions is possible, allowing a rational design of the band structure, i.e., the band gap as well as the energetic band positions. Perovskites with small band gaps are of special interest; ferrites are one class of them. Review papers summarizing the actual status on photocatalysis with ferrites with respect to hydrogen formation as well as decontamination of water have been authored by Dillert et al. and Sharma et al. [10,11]. The photoelectrochemical behavior and theoretical investigations related to solar water splitting was also summarized recently by Taffa et al. [12]. Yttrium ferrite is a magnetic material which is of practical advantage since it can be simply recovered from catalysis suspensions by use of external magnets [13,14]. Besides its magnetic and magneto-optical properties, YFeO3 is also used in environmental monitoring applications such as sensors, anode material for batteries, lasers, and catalysis [15].
YFeO3 exhibits a narrow band gap rendering it interesting for photocatalysis [16,17]. It was shown that the photocatalytic properties strongly depend on the particle size which is influenced by the chosen preparation method [1,4,18]. However, despite its advantages, the numbers of studies done on YFeO3 are still limited because quite challenging synthesis methods [19] such as a KCl-assisted solution combustion synthesis (SSCS) [16] or microwave-assisted methods are required [1]. Most of the current approaches for synthesis of single phase perovskite YFeO3 require a calcination process at a high temperature causing a growth of large particles. Furthermore, according to the phase diagram, the structure of YFeO3 is thermodynamically quite unstable and converts easily to more stable compounds like Y3Fe5O12 or Fe2O3, this hampers, for example, the microwave-assisted method [1,13]. In order to prevent particle agglomeration and sintering, different fuels and adjustment of fuel-to-oxidant molar ratios were chosen in the combustion process of ferrites, however, in many cases, more nanophases rather than individual nano-sized particles were obtained [20]. Therefore, controlled synthesis of ferrite and especially YFeO3 nanoparticles with defined crystal structure is still an experimental challenge.
Sol-gel technique is in general a very effective method to synthesize nanomaterials at low temperatures, leading to higher purity and improved homogeneity of the prepared compounds [21]. Quite often in photocatalytic studies of YFeO3, orthorhombic or hexagonal structures are reported to be present together [22,23]. However, Zhang et al. reported a citric acid assisted sol-gel method to synthesize pure hexagonal and orthorhombic YFeO3 displaying low surface areas (<5 m2/g). Their photoactivities were tested towards the degradation of methyl orange using a 400 W halogen lamp and a 420 nm cut-off filter [18]. In this study, we applied the same synthesis route, but altered temperature and duration of the thermal treatment. We found that the pyrolysis step is crucial to obtain hexagonal YFeO3 with high surface area (ca. 25 m2/g). Similar to Zhang et al., the degradation of methyl orange was used for the investigation of the photocatalytic activities with visible light, but we also extended the tests to 4-chlorophenol (4-CP) as a colorless organic pollutant not absorbing in the visible light range. Thus, it proves that direct excitation of the photocatalyst YFeO3 by the applied light with wavelengths of 420 nm and higher is responsible for the photodegradation. Additionally, the main reactive oxygen species are identified and photoelectrochemical data are presented to support the enhanced visible activity of hexagonal over orthorhombic YFeO3.
2. Results and Discussion
2.1. Structural, Optical, and Electrochemical Characterization of Hexagonal YFeO3
The XRD patterns of the synthesized YFeO3 samples calcined at different temperatures are shown in Figure 1. For calcination temperatures of up to 650 °C, no distinct reflexes are observable in the XRD patterns, showing that the samples are amorphous. The broad signal at around 2θ = 30–35° already indicates the start of the formation of YFeO3 crystallite, but the crystallite size is too small to form well separated reflexes. From the XRD patterns, the formation of the perovskite YFeO3 structure is revealed after post-thermal treatment at 675 °C and 700 °C. All the reflexes are indexed to the hexagonal YFeO3 structure (International Center of Diffraction Data (ICDD)-00-048-0529, 2009). There are no other extra reflexes detected, proving the effective preparation of single phase perovskite YFeO3 without any impurities by the citric acid assisted sol-gel route. By increasing the calcination temperature to 800 or 900 °C, the hexagonal to orthorhombic phase transformation of YFeO3 takes place (ICDD-00-011-0558, 2009). Thus, the structure of YFeO3 can be simply tailored by the calcination temperature; the hexagonal phase is metastable and converts to the thermodynamically more stable orthorhombic phase at higher temperature [22]. Previous studies based on the thermal decomposition of yttrium nitrate and iron nitrate reported the same phase transformation, but only mixtures of hexagonal and orthorhombic crystals were obtained at 675 to 750 °C. After further heating to 800 °C, the orthorhombic YFeO3 phase contaminated with impurities of Y2O3 was obtained [24]. In contrast, the sol-gel route applied here leads to pure phases. It is worth mentioning that the stability of the hexagonal phase depends not only on the calcination temperatures but also on the particle size, metal-to-fuel ratios, and the method of synthesis [25,26].
With increasing temperature, the intensity of the XRD reflexes increases and gets sharper, indicating a higher degree of crystallization. By use of the Scherrer equation:
where τ is average crystallite size, λ is the X-ray wavelength (nm), B is the peak width at half maxima of the diffraction pattern (in radians) and K is a constant related to crystallite shape generally taken as 0.9, the crystallite size of 14.7 nm is observed for sample hex-675 with hexagonal structure and 46.8 nm for sample orth-900 with orthorhombic structure. The reflexes with the highest intensity at around 2θ = 33° were selected for calculating the crystallite size of both samples. Furthermore, the SEM micrographs (Figure S1a,b) show small domain sizes for the hex-675 sample and the domain sizes increase for the orth-900 sample due to thermal sintering of the particles. Additionally, the energy-dispersive X-ray spectroscopy (EDXS) analysis (Figure S1c) show the presence of Fe:Y with a ratio of almost 1:1, and the O amount is slightly higher than the stoichiometric values.
τ = Kλ/Bcosθ
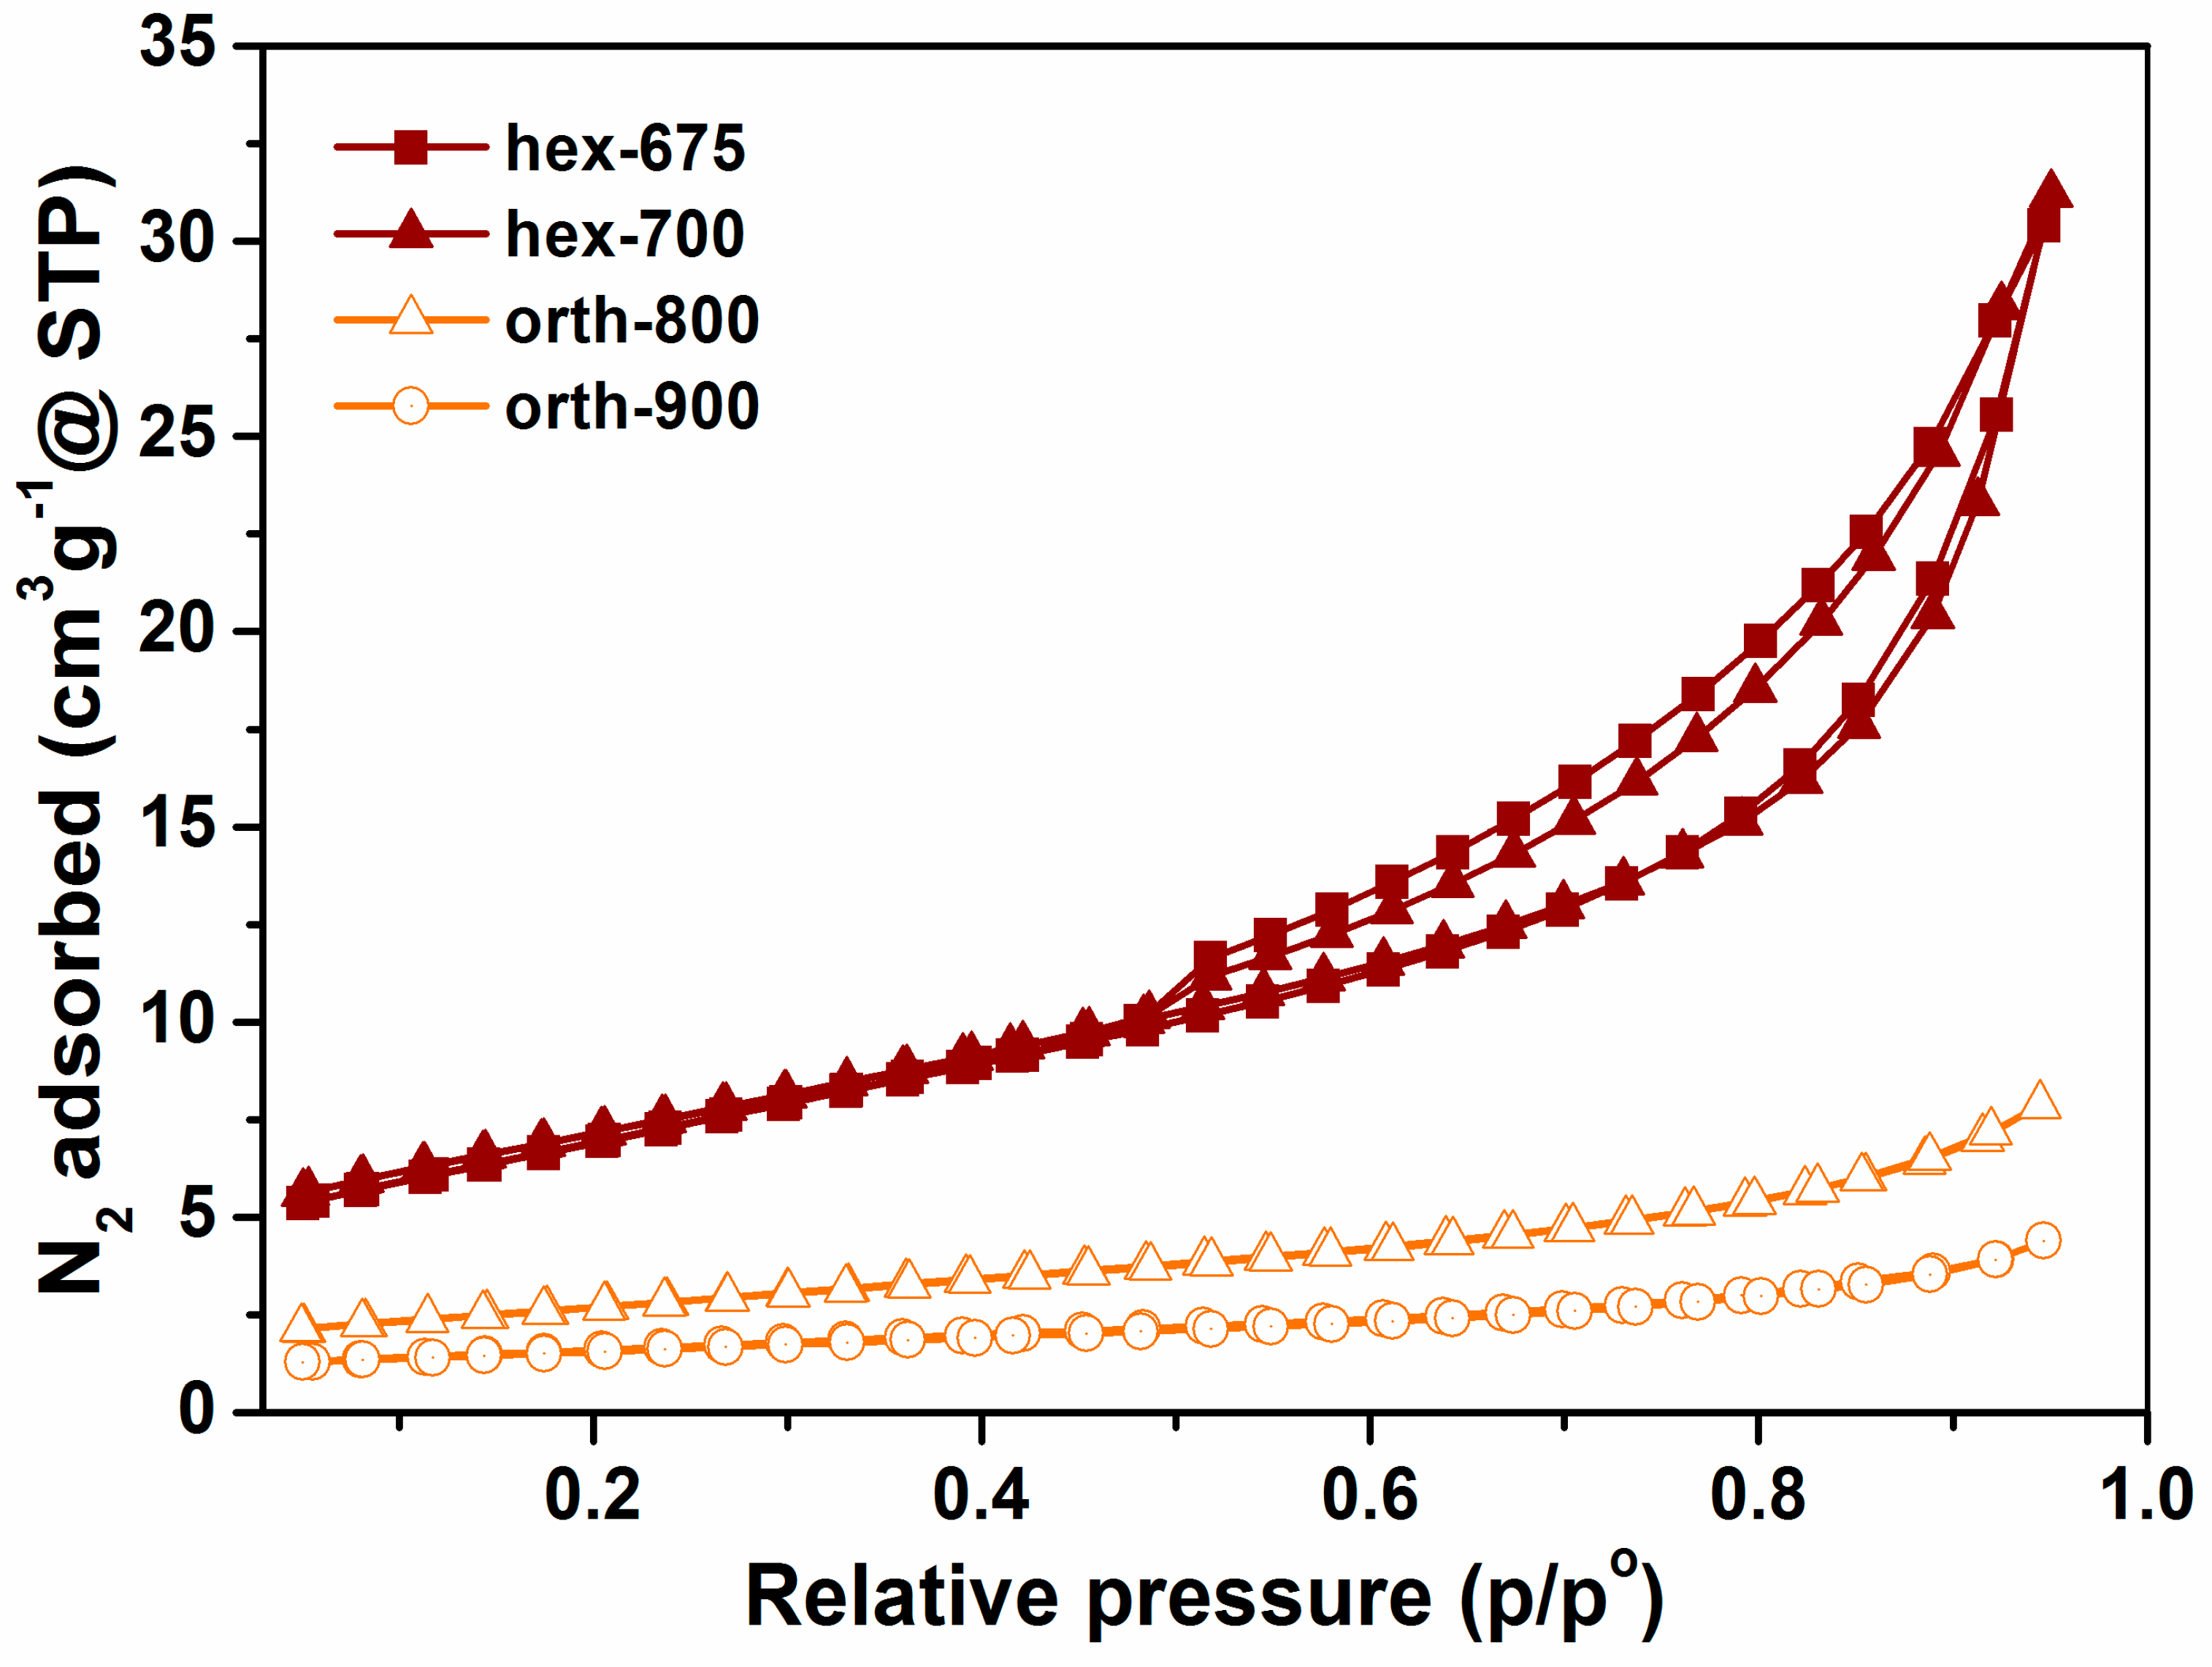
Surface areas were determined from N2 adsorption-desorption isotherms. Classical type IV isotherms with a H3 hysteresis loop were obtained for hex-675 and hex-700, reflecting the presence of a mesoporous material (Figure 2). According to International Union of Pure and Applied Chemistry (IUPAC) reports, this kind of hysteresis is exhibited by non-rigid aggregates of plate-like particles or incomplete pore filling of a network consisting of macropores [27]. For orth-800 and orth-900, the adsorption was much lower, reflecting low surface area solid material with type Ia isotherms (Figure 2). The applied complex-assisted sol-gel synthesis route and the low calcination temperature of 675 °C lead to a high surface area (24.7 m2/g), exceeding data reported from other studies (11.7 m2 g−1) [1]. With increasing calcination temperature, the surface area decreases continuously, reaching a value of 5.6 m2/g for YFeO3 calcined at 900 °C (orth-900). This agrees with the increase of the crystallite sizes as estimated from the Scherrer equation. The form of the isotherms indicates that mostly mesoporous interparticle voids are present. Furthermore, the steep increases at very low partial pressures for hex-675 and hex-700 resulting from the filling of micropores with diameters of a of maximum 1 nm might not only result from voids of the 15 nm small crystallites in the hexagonal phase, but might additionally indicate the presence of some structural micropores in the crystallites.
To estimate the optical properties of the YFeO3 synthesized at different calcination temperatures, their visible light absorption spectra were studied by measuring the diffuse reflectance mode and are shown in Figure 3a. YFeO3 with the hexagonal phase (hex-675 and orth-700) clearly exhibits absorption edges closer to 700 nm, enabling the use of a higher fraction of the solar visible light spectrum for photocatalysis.
In Figure 3b the Tauc plots obtained from the absorption data by plotting of (F(R)*hν)1/2 versus the photon energy (hν) are shown, where F(R) is the Kubelka-Munk function. The band gap energies Egap obtained from the intercepts with the energy axis [28] show a difference of about 0.3 eV for the hexagonal and the orthorhombic YFeO3 phase. With respect to the band gap of Fe2O3 of 2.1 eV, the introduction of yttrium ions leading to the hexagonal perovskite phase causes a shift of the band gap to a lower energy. For YFeO3 prepared by a microwave-assisted approach, a band gap of 2.43 eV was reported [1]; for nanocrystalline YFeO3 prepared via a hydrothermal route and subsequent calcination at 800 °C, a band gap of 2.37 eV was found [29]. These higher values are caused by the presence of the orthorhombic phase or a mixture of hexagonal and orthorhombic phases, and agree roughly with our findings for the pure orthorhombic phase.
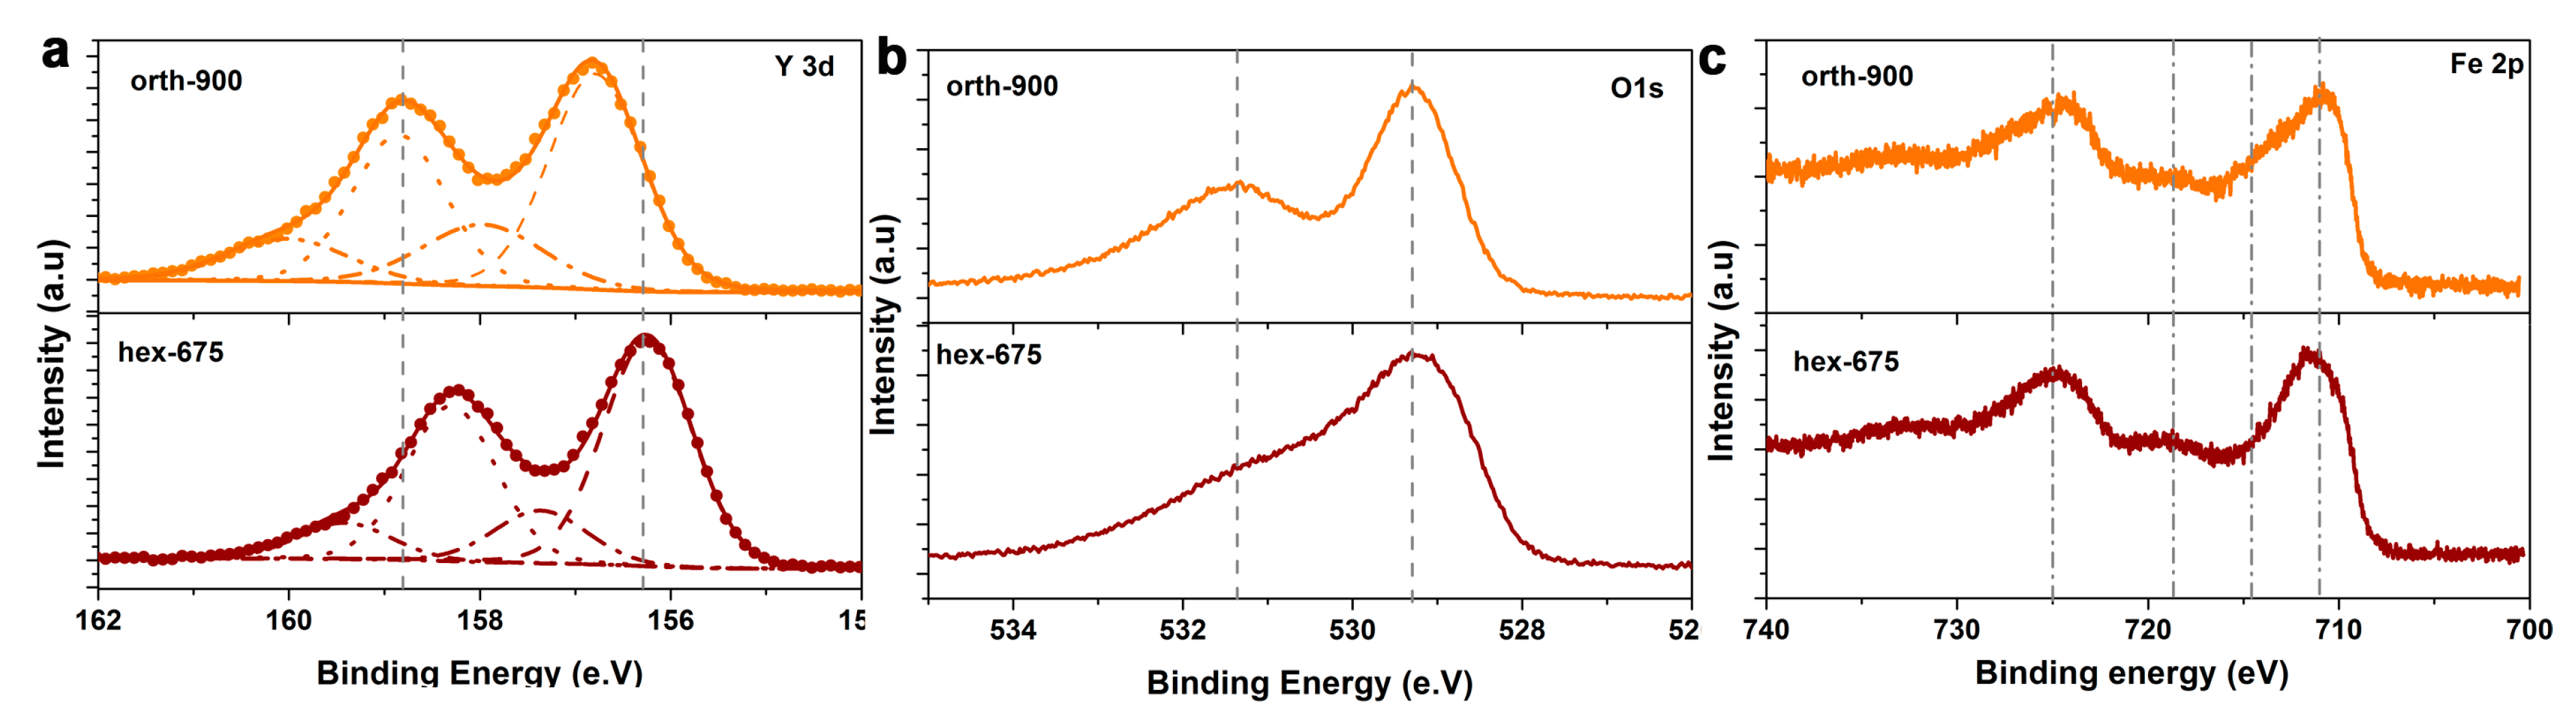
The surface composition and the chemical states of Fe and Y in both hexagonal (hex-675) and orthorhombic (orth-900) YFeO3 samples were investigated by X-ray photoelectron spectroscopy (XPS). Figure 4a shows the high resolution Y 3d region with two spin-orbit doublets with the main peaks located at binding energies of 156.3 and 158.3 eV for hex-675 and at 156.8 and 158.8 eV for orth-900, respectively. In general, the reported Y 3d5/2 peak position varies between 156 and 157 eV and the measured binding energies at 156.3 and 156.8 eV are in good agreement with reported values for Y2O3 [30,31]. The Y 3d peak can further be resolved into minor doublets at 157.4 and 159.4 eV and 157.8 and 160.0 eV for hex-675 and orth-900, respectively. They are assigned to the underlying YFeO3, and the Y 3d5/2 peak positions at 157.4 and 157.8 are close to the reported values. [32] A shift to higher binding energy (0.4 eV) for the orthorhombic phase may arise from the high coordination of Y with O compared to lower coordination in the hexagonal phase. In Figure 4b, the main O1s photoelectron lines at 529.13 and 529.27 eV are assigned to the lattice oxygen in hexagonal (hex-675) and orthorhombic (orth-900) YFeO3, respectively [33]. The broad peak centered at 531.3 eV is assigned to surface O due to hydroxides species or origination from the Y2O3 top layer [27]. From Figure 4c, the Fe 2p consists of Fe 2p3/2 and Fe 2p1/2 doublets and satellite features due to spin orbit coupling. The Fe 2p3/2 peak positions at 710.13 and 710. 26 eV show the presence of Fe3+ species in both hex-675 and orth-900 samples, respectively [22]. Additionally, for the orth-900 sample, the intensity loss and shift of the satellite feature to lower binding energy may indicate the presence of Fe2+ or low coordinated Fe in the orthorhombic YFeO3. The surface composition was calculated using the integrated peak areas under the Fe 3p and Y 3s peaks and showed a slight excess of Y consistent with the presence of a thin Y2O3 top layer (Table 1). It is noteworthy to mention that Y2O3 as a wide band gap material (Egap = 5.5–5.7 eV) [34,35] is not involved in the light absorption process, however, such thin insulating metal oxides, including Y2O3, are commonly used to passivate surface electron traps on various semiconductor surfaces and might lead to enhanced charge carrier separation [36,37]. Hence, the presence of a thin Y2O3 layer may be beneficial for the photocatalysis process (see below).
In order to gain further insights into the effect of thermal annealing and the accompanied phase transformation on the photoactivity of YFeO3 samples, photoelectrochemical studies were performed on doctor-bladed YFeO3 films by Mott-Schottky (MS) analysis, chopped light voltammetry (CLV), and electrochemical impedance spectroscopy (EIS). According to MS analysis [38] donor densities (ND) and the flat band potential (Efb) of planar semiconductor electrodes can be obtained by measuring the frequency dependent space charge capacitance employing Equation (2).
C is the capacitance of the space charge layer, ɛ0 the vacuum permittivity, ɛ the dielectric constant of the semiconductor, e the elementary charge, Efb the flat band potential, T the temperature, and k the Boltzmann constant.
In Figure 5a,b, MS plots for both types of YFeO3 samples (hex-675 and orth-900) show a positive slope indicating that the hexagonal as well as the orthorhombic YFeO3 are n-type semiconductors. However, due to surface states and non-uniformity of the films, the two frequencies measured (1 kHz for hex-675 and 5 kHz for orth-900) lead to slightly different intercepts showing deviation from the ideal MS assumption. From the extrapolation to 1/C2 = 0, the flat band potential can be estimated, and the obtained values for the hexagonal phase and the orthorhombic phase are 0.4 V and 0.35 V vs. reversible hydrogen electrode (RHE), respectively. For n type semiconductors, the Efb is located close to the bottom of the conduction band (CB); typically it is assumed that CB is 0.1 V more negative than Efb [39], resulting in CB edges at about 0.3 V and 0.25 V vs. RHE, respectively. These values are significantly different from the negative potential of −0.19 V given for orthorhombic YFeO3 by Lu et al. [33], which was empirically computed, and explain why YFeO3 is not able to catalyze light-induced hydrogen formation. The potential of the valence band can be calculated according to the equation [40], resulting in about Evb = 2.1 V for sample hex-675.
For an n-type semiconductor under illumination and potential bias, an anodic photocurrent is expected when the bias is large enough (Ebias > Efb) to cause sufficient band bending, hence the onset of the photocurrent is closer to the Efb in the presence of a good electron/hole acceptor. In order to cross-check the values obtained from MS, we performed CLV in 0.1 M Na2SO4/0.1 M Na2SO3 solution (Figure 5c). The onsets of the photocurrent lie between 0.4 V and 0.5 V vs. RHE and are, thus, close to the values obtained from MS. Photoelectrochemical impedance spectroscopy (Figure 5d) shows two semi-circles indicating two capacitive time constants related to surface charging/film resistance and a charge transfer process associated to the oxidation of SO3−. Qualitatively, sample hex-675 shows a lower charge transfer barrier to the oxidation of SO32− compared to orth-900. Thus, the hexagonal YFeO3 in hex-675 exhibits better charge transport properties which will enhance the photocativity (see below).
2.2. Photocatalytic Activity of Hexagonal YFeO3
The photocatalytic activities of YFeO3 formed at different temperatures in visible light were evaluated by decomposition of the model organic pollutant methyl orange (MO). Prior to turning on the light for photocatalytic degradation, the adsorption-desorption equilibrium of MO on the YFeO3 surface was established by stirring the photocatalyst/MO mixture in the dark for 40 min. Figure 6a shows the decrease in the absorbance of MO with time of illumination over the hexagonal YFeO3 photocatalyst hex-675. The absorption maximum at 464 nm results from the azo groups (N=N) which are connected to aromatic sp2-hybridized carbon in the MO [41]. The cleavage of this azo group is the first step in the photocatalytic decomposition of MO under illumination.
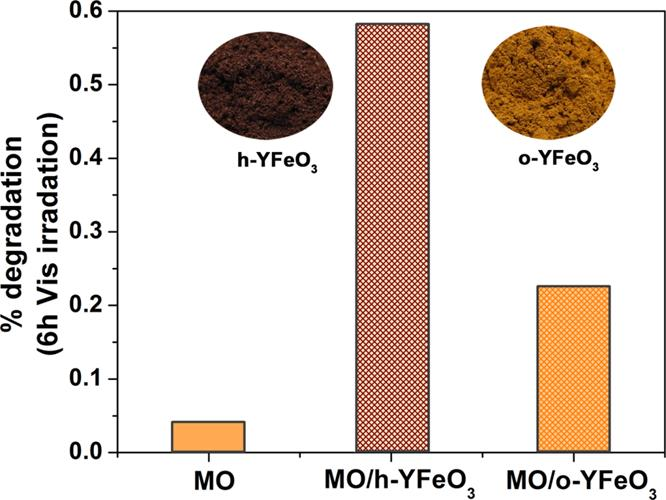
Figure 6b shows the comparison of the photoactivity of different YFeO3 photocatalysts towards the degradation of MO under visible light. Self-degradation (photolysis) was found to be very low under the experimental conditions (MO-blank). In presence of photocatalysts, the degradation efficiency decreased with increasing calcination temperature of YFeO3, reaching 57.5%, 49.3%, 33.1%, and 36.7% after 6 h for hex-675, hex-700, orth-800, and orth-900, respectively.
The results document that the activity of the YFeO3 prepared at low calcination temperature, exhibiting the hexagonal phase, is higher than for that of the orthorhombic phase. Possible reasons are the smaller crystallite sizes, lower band gaps (Figure 3), and higher surface areas (Figure 2). Smaller particle size decreases the probability of recombination of photo-generated charge carriers during transfer from the bulk to the surface of the catalyst. Moreover, the high surface area leads to more substrate adsorption. The narrower band gap energy allows the hexagonal phase to harvest the visible light more efficiently. Additionally, based on the XPS analysis, the higher amount of Y in orth-900 may lead to a thicker Y2O3 coating, which hinders the tunneling of holes, resulting in a higher electron-hole recombination rate [42]. As a result, the order of the photocatalytic activity follows the order hex-675 > hex-700 > orth-800 > orth-900.
As shown in the absorption spectra of MO in Figure 6a, the MO has two absorption maxima located at 464 nm and at 280 nm; this absorption in the UV probably leads to self-excitation or photolysis. The blank curve in Figure 5b rules out that this ultraviolet (UV) absorption leads to a photochemical self-destruction, since in absence of a photocatalyst, the MO concentration remains practically unchanged.
However, a sensitization of the YFeO3 photocatalyst by the MO might nevertheless be possible; in this case, the excited state of MO might allow electron transfer to the conduction band of YFeO3 and initiate the degradation process. Thus, a control degradation experiment with pure UV light (λ < 350 nm) was performed. The 280 nm absorption was still excited, but its intensity was by a factor of 3 lower compared to the absorption at 464 nm (Figure 6a). Thus, if sensitization would be an important factor in the degradation process, the photocatalytic activity should decrease. However, Figure 5b shows that for the most active YFeO3 sample, hex-675, the photocatalytic activity under UV light is enhanced by about 10%. Furthermore, degradation experiments using a bandpass filter (center wavelength at 400 nm, where MO does not absorb) shows degradation activity higher than activity from pure Vis irradiation but lower than activity from pure UV excitation. Thus, sensitization by the MO itself should not be a dominant factor for the degradation; light absorption by yttrium ferrite and subsequent formation of reactive species is much more likely responsible for most of the light-induced MO degradation.
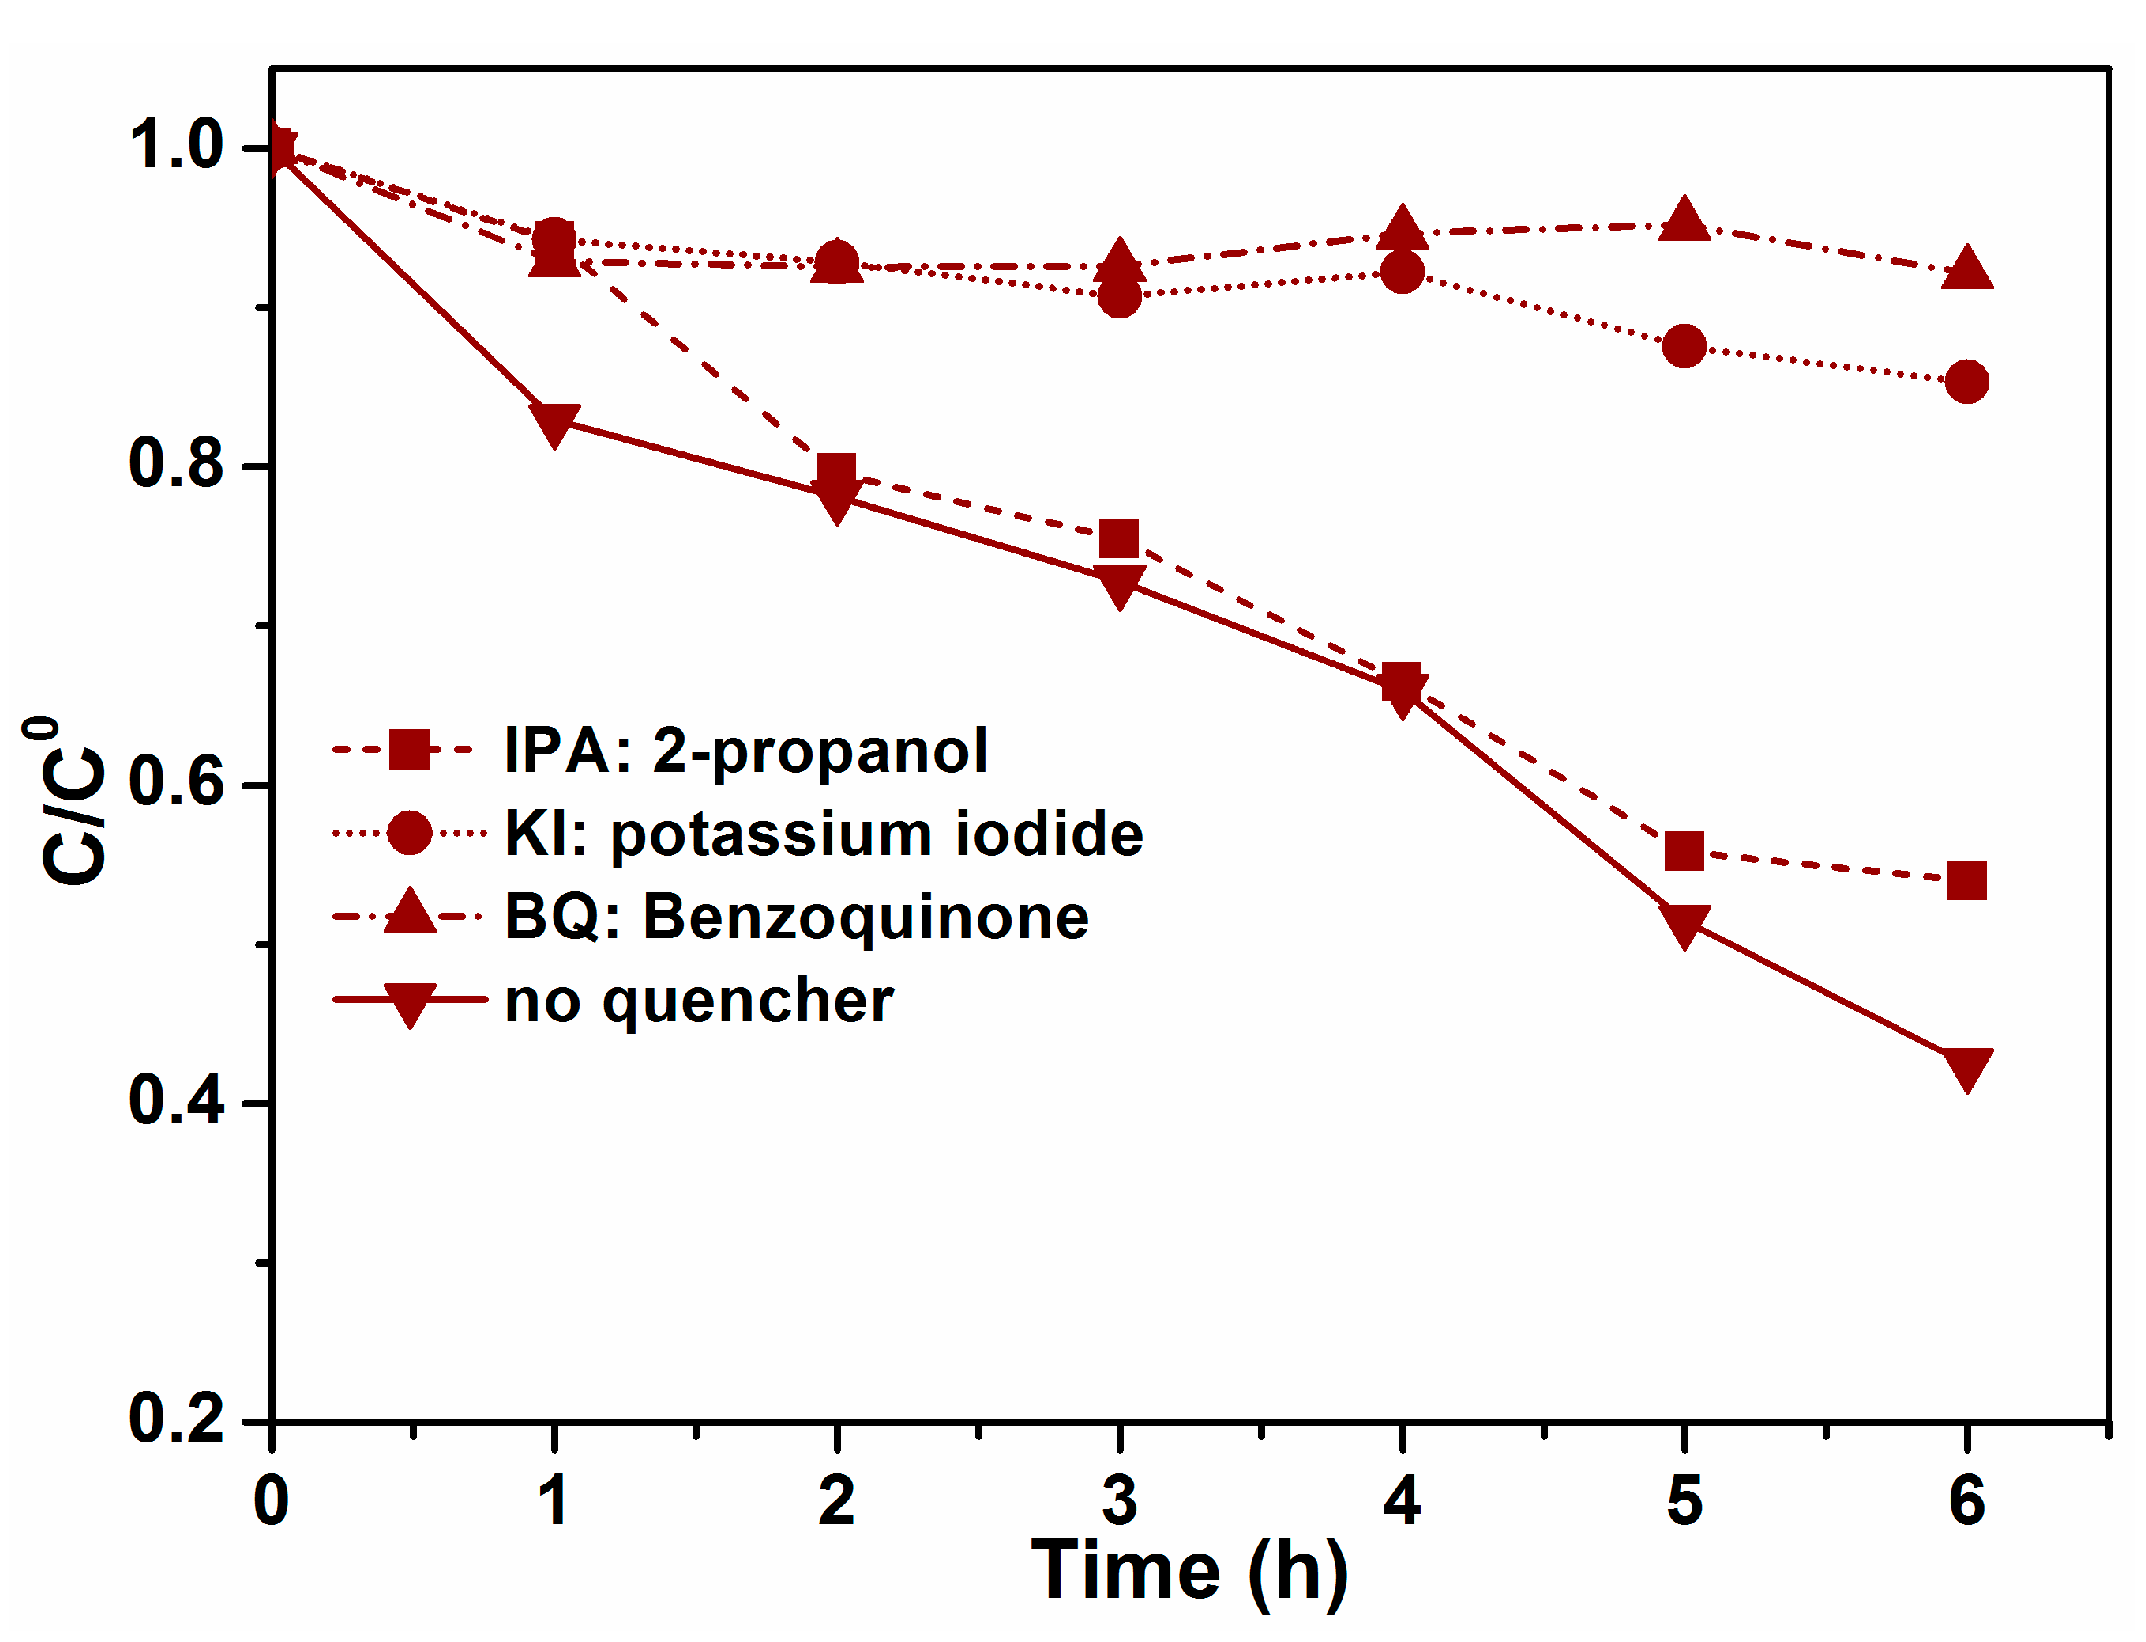
Reactive oxygen species (e.g., ·OH−, ·O2−) are strong oxidizing agents and play a vital role in the photo-assisted degradation of organic contaminants [43,44]. For the photocatalytic degradation of rhodamine B with YFeO3 under visible light, Chen et al. identified photo-generated holes and hydroxyl radicals as the main active species [15]. However, since the detailed mechanism of the photocatalytic process can vary for different pollutants, further tests were performed in order to identify the reactive species in case of MO degradation. The conversion of terephthalic acid (TA) to a fluorescence active 2-hydroxy terephthalic acid is used to quantify the formation of ·OH radicals [45]. In order to check the light induced formation of hydroxyl radicals (·OH), a suspension of an aqueous solution of terephthalic acid and the YFeO3 photocatalysts was irradiated with visible light (λ > 420 nm). The hydroxyl radical formation was determined by measuring the intensity of the fluorescence maximum of 2-hydroxyterephthalic acid at 425 nm [27]. Very low fluorescence intensity at 426 nm was observed after 4.5 h of irradiation, suggesting slow hydroxyl radical formation (Figure S2). Further tests with different scavenger molecules added to the degradation experiments were performed (Figure 7). Almost no degradation was observed if potassium iodide (10 mM KI) acting as a hole scavenger [46] was added to the photocatalytic reaction mixture. This indicates that direct oxidation by the photogenerated holes is involved in the degradation of MO. Since the oxidation power of the holes formed on the YFeO3 surface is high, this mechanism is very likely.
However, with benzoquinone (10 mM BQ), typically acting as a scavenger for superoxide radicals [47], the degradation is strongly reduced (Figure 7). This would imply that the degradation proceeds via superoxide radicals being produced by reaction of adsorbed O2 molecules with excited electrons from the conduction band of the yttrium ferrites. This is, however, quite unlikely for an irradiation with visible light, since their potential is about 0.3 V which is not negative enough to reduce O2 and form superoxide radicals, which requires a potential of EO2/O2− = −0.046 V [48]. However, superoxide radicals might be formed by different routes such as illumination with UV light exciting electrons to states at negative potential deep in the conduction band from where a reaction with adsorbed oxygen is possible, excitation via MO molecules, or even via a self-excitation of the benzoquinone. Such excitation of adsorbed aromatic systems was, for example, reported by Neubert et al. [49]. Superoxide radicals (·O2−) would react further with water molecules to hydroxyl radicals. This reaction, however, seems not to take place to a large extent due to very slow formation of the hydroxyl radical in the terephthalic acid test, indicating that involvement of superoxide radicals in the degradation mechanism is not dominant. Thus, the competition of BQ and MO which hampers the MO degradation, might have another reason, probably a blocking of active sites by BQ molecules. With the addition of isopropanol (10% of total volume), a scavenger for hydroxyl radicals [50], only a slight decrease in degradation activity was observed, confirming again that ·OH radicals are not the dominant active species in the degradation mechanism.
Additionally, in order to further prove the visible photoactivity of these catalysts, the photocatalytic degradation of colorless substrates (e.g., 4-CP) was tested. As shown in Figure S3 48% of the 4-CP degraded after 5 h of visible light illumination. Other catalytic testes and strategies to improve the photoactivity are currently under study.
3. Materials and Methods
3.1. Materials
All the reagents in this study were commercial products and were used without any purification. The following were purchased from Sigma-Aldrich (Schnelldorf, Germany): iron (III) nitrate nonahydrate (Fe(NO3)3·9H2O (99%)) and citric acid (C6H8O7 (99%)). The following were purchased from Alfa Aesar (Karlsruhe, Germany): yttrium nitrate hexahydrate (Y(NO3)3·6H2O (99.9%)) and methyl orange (C14H14N3NaO3S, analytical grade). Deionized water (>18 MΩ cm) was obtained from a Sartorius water purification system.
3.2. Synthesis of YFeO3
A modified sol-gel route was used to synthesize hexagonal and/or orthorohmbic YFeO3 powders [16]. In a typical synthesis, Fe(NO3)3·9H2O, Y(NO3)3·6H2O, and citric acid were separately dissolved in deionized water under stirring with 1:1:4 molar ratio. Citric acid was used as a complexing agent to chelate metal cations and prevent precipitation, thus, it was needed in surplus. The obtained brown solution was clear and transparent. From the mixture, the gel was obtained by heating at 300 °C for 2–3 h under magnetic stirring. Subsequently, the solvent was evaporated by combustion in a pyrolysis step at 400 °C for 1 h. The resulting fluffy powder was crushed to fine powder and subsequently calcined at different temperatures for 10 h in air. After calcination and cooling, the obtained samples were characterized and tested in the photocatalytic degradation. They were named as amo-650, hex-675, hex-700, orth-800, and orth-900 according to their phase modifications (amorphous, hexagonal, and orthorhombic) and the calcination temperature (in °C) applied.
3.3. Characterization
Powder X-ray diffraction patterns were recorded with a PANalytical X’pert PRO theta-theta X-ray diffraction system (PANalytical, Almelo, The Netherlands) with Cu Kα radiation (λ = 1.540598 nm) operating at 40 kV and 40 mA. The UV-vis diffuse reflectance spectra (DRS) and UV-vis absorption spectra were measured with a VARIAN Cary 4000 (Varian, Mulgrave, Australia) equipped with an integrating sphere. Magnesium oxide (MgO) was used as a white standard and the spectral range was chosen between 200 and 800 nm. The photoluminescence (PL) spectrum was recorded on a VARIAN Cary Eclipse Fluorescence Spectrophotometer (Varian, Mulgrave, Australia). The Brunauer-Emmett-Teller (BET) surface areas were calculated from nitrogen adsorption-desorption isotherms recorded on a Tri Star II or an ASAP 2020 (Micromeretics GmbH, Aachen, Germany). Scanning electron microscopy (HITACHI, S-3200N, Hitachi, Krefeld, Germany) and energy-dispersive X-ray spectroscopy (EDX Oxford INCAx-act, Oxford Instruments, Abingdon, UK) were used to study the sample morphology and the atomic ratio of the sample, respectively. Electrochemical impedance spectroscopy (EIS) and photocurrent measurements were performed using a ZAHNER Zennium potentiostat (Zahner Elektrik GmbH, Kronach, Germany) running under Thales software (version 4.12). A standard three electrode configuration with Ag/AgCl (3 M NaCl), coiled Pt-wire, and YFeO3 coated fluorine-doped tin oxide (FTO) were used as the reference, counter, and working electrodes, respectively. For the preparation of the working electrodes, fluorine-doped tin oxide (FTO) glass slides (Pilkington, Weiherhammer, Germany) with a size of 2 × 6 cm2 were cleaned with 0.1 M HCl, 0.1 M NaOH, acetone, and ethanol each for 10 min in an ultrasonic bath. Then, 0.1 g of the respective sample were dispersed in 500 μL ethanol in an ultrasonic bath for 30 min, and 200 μL of the obtained suspension were coated on the FTO glass substrate using doctor blade method. Finally, the FTO substrate was dried in a furnace for 30 min at 80 °C and calcined for 3 h at 600 °C. As electrolyte 0.1 M Na2SO4 or 0.1 M Na2SO4/0.1 M Na2SO3 aqueous solution were used. X-ray photoelectron spectroscopy (XPS) measurements were carried out in an ultra-high vacuum set-up, ESCALAB 250 Xi (Thermo-Fisher, East Grinstead, UK) equipped with a monochromatic Al Kα X-ray source (hν = 1486.6 eV). The high resolution spectra for the C 1s, O 1s, N 1s, and Fe 2p photoelectron lines were recorded with pass energy of 20 eV and step size of 0.1 eV. The binding energy scales were corrected to the charge shift by referring the most intensive C 1s contribution to 284.8 eV. The spectra were analyzed using Avantage software (version 5.951).
3.4. Photocatalytic Degradation Activity Measurement
Methyl orange (MO) was used as a model organic pollutant for the photocatalytic degradation under visible light irradiation. In a typical test, 0.1 g of YFeO3 was dispersed in 100 mL of 10−5 M MO aqueous solution under stirring in a water-cooled (10 °C) double wall 250 mL Pyrex glass reactor. The mixture was further stirred for 40 min in the dark to establish the adsorption-desorption equilibrium between the photocatalyst and the MO dye. Then, the samples were illuminated with a 150 W Xe lamp equipped with a 420 nm cut-off filter to have visible light irradiation only. Every hour, a part of the probe was taken out, filtered, and analyzed by UV-vis absorption measurement; the degradation was evaluated from the decrease of the intensity of the absorption maxima of MO at 464 nm.
For the photocatalytic degradation of 4-CP, 0.05 g of the catalyst was suspended in 100 mL of 10−4 M 4-CP aqueous solution. Then, the experimental procedure and the set-up used were similar to the photodegradation of MO.
4. Conclusions
Pure phase hexagonal YFeO3 was successfully synthesized by the citric acid assisted sol-gel technique and evaluated in photocatalysis. The complexing agents enable the use of moderate calcination temperatures; with that, the hexagonal perovskite structure could be stabilized as a pure phase. As long as calcined at 700 °C or lower, YFeO3 crystallizes in the hexagonal structure; only at higher temperatures the thermodynamically favored orthorhombic structure is formed. With respect to photocatalysis, the formed hexagonal YFeO3 has the advantages of an approximately 0.3 eV smaller optical band gap enabling use of a higher fraction of the visible light, smaller size of the crystallites, and a higher surface area facilitating adsorption of reagents. XPS measurements suggest that the photocatalytic activity might also be enhanced by the presence of a thin film of Y2O3 on the YFeO3 nanoparticles. Mott-Schottky plots and impedance measurements reveal a potential of the CB around 0.3 V, explaining the inactivity for photocatalytic hydrogen evolution. The photocatalytic oxidation reactions to degrade pollutants, as tested with methyl orange and 4-chlorophenol, occur mainly via direct reaction of the photogenerated holes.
Supplementary Materials
The following are available online at www.mdpi.com/2073-4344/7/11/326/s1, Figure S1: SEM micrographs of (a) hex-675 and (b) orth-900. (c) The EDXS analysis showing the elemental composition, Figure S2: Fluorescence spectral changes observed during visible light illumination of hex-675 sample in terephthalic acid (TA) solution (3 mM TA/10 mM NaOH M, excitation at 320 nm). The spectra were recorded at intervals of 1.5 h, Figure S3: Photocatalytic degradation curves for 4-CP (1 × 10⁻³ M) using hex-675. Light source: 150 W Xe arc lamp with cut-off filter λ > 420 nm.
Acknowledgments
Financial support by the Phoenix Scholarship program (PX14DF0164) for MI, and the Deutsche Forschungsgemeinschaft (DFG, WA 1116/28) is gratefully acknowledged.
Author Contributions
Mohammed Ismael performed the catalyst preparation, structural characterization (XRD, BET, DRS, and SEM), and photocatalytic test experiments. Electrochemical and XPS data were collected and interpreted by Dereje H. Taffa. Engy Elhaddad prepared the first draft of the manuscript. This work was carried out under the supervision of Michael Wark and Dereje H. Taffa, who also structured the discussion of the data and prepared the final version of the manuscript.
Conflicts of Interest
The authors declare no conflict of interest.
References
- Tang, P.; Chen, H.; Cao, F.; Pan, G. Magnetically recoverable and visible-light-driven nanocrystalline YFeO3 photocatalysts. J. Catal. Sci. Technol. 2011, 1, 1145–1148. [Google Scholar] [CrossRef]
- Li, X.; Kikugawa, N.; Ye, J. Nitrogen-doped lamellar niobic acid with visible light-responsive photocatalytic activity. J. Adv. Mater. 2008, 20, 3816–3819. [Google Scholar] [CrossRef]
- Varghese, O.K.; Paulose, M.; La Tempa, T.J.; Grimes, C.A. High-rate solar photocatalytic conversion of CO2 and water vapor to hydrocarbon fuels. Nano Lett. 2009, 9, 731–737. [Google Scholar] [CrossRef] [PubMed]
- Yu, J.; Zhang, Y.; Kudo, A. Synthesis and photocatalytic performances of BiVO4 by ammonia co-precipitation process. J. Solid State Chem. 2009, 182, 223–228. [Google Scholar] [CrossRef]
- Konta, R.; Ishii, T.; Kato, H.; Kudo, A. Photocatalytic Activities of Noble Metal Ion Doped SrTiO3 under Visible Light Irradiation. J. Phys. Chem. B 2004, 108, 8992–8995. [Google Scholar] [CrossRef]
- Dho, J.; Qi, X.; Kim, H.; MacManus-Driscoll, J.L.; Blamire, M.G. Large electric polarization and exchange bias in multiferroic, BiFeO3. Adv. Mater. 2006, 18, 1445–1448. [Google Scholar] [CrossRef]
- Pimenov, A.; Mukhin, A.A.; Ivanov, V.Y.; Travkin, V.D.; Balbashov, A.M.; Loidl, A. Possible evidence for electromagnons in multiferroic manganites. Nat. Phys. 2006, 2, 97–100. [Google Scholar] [CrossRef]
- Peña, M.A.; Fierro, J.L.G. Chemical Structure and Performance of Pervoskite Oxides. Chem. Rev. 2001, 101, 1981–2018. [Google Scholar] [CrossRef] [PubMed]
- Goldschmidt, M.V. Die Gesetze der Kristallochemie. Die Naturwissenschaften 1926, 14, 477–485. [Google Scholar] [CrossRef]
- Dillert, R.; Taffa, D.H.; Wark, M.; Bredow, T.; Bahnemann, D.W. Research Update: Photoelectrochemical water splitting and photocatalytic hydrogen production using ferrites (MFe2O4) under visible light irradiation. APL Mater. 2015, 3. [Google Scholar] [CrossRef] [Green Version]
- Sharma, K.V.; He, C.; Doong, R.; Dionysiou, D.D. Green Materials for Energy, Products and Depollution. In Environmental Chemistry for a Sustainable World; Lichtfouse, E., Schwarzbauer, J., Robert, D., Eds.; Springer: Berlin, Germany, 2013; Chapter 4; Volume 3, pp. 135–150. [Google Scholar]
- Taffa, D.H.; Dillert, R.; Ulbe, A.C.; Bauerfeind, K.C.L.; Bredow, T.; Bahnemann, D.W.; Wark, M. Photoelectrochemical and theoretical investigations of spinel type ferrites (MxFe3−xO4) for water splitting: A mini-review. J. Photon. Energy 2016, 7. [Google Scholar] [CrossRef]
- Mathur, S.; Veith, M.; Rapalaviciute, R.; Shen, H.; Goya, G.F.; Fliho, W.M.; Berquo, T.S. Molecule derived synthesis of nanocrystalline YFeO3 and investigations on its weak ferromagnetic behavior. Chem. Mater. 2004, 16, 1906–1913. [Google Scholar] [CrossRef]
- Maiti, R.; Basu, S.; Chakravorty, D. Synthesis of nanocrystalline YFeO3 and its magnetic properties. J. Magn. Mater. 2009, 321, 3274–3277. [Google Scholar] [CrossRef]
- Shen, H.; Xu, J.; Wu, A.; Zhao, J.; Shi, M. Magnetic and thermal properties of perovskite YFeO3 single crystals. Mater. Sci. Eng. B 2009, 157, 77–80. [Google Scholar] [CrossRef]
- Chen, Y.; Yang, J.; Wang, X.; Feng, F.; Zhang, Y.; Tang, Y. Synthesis YFeO3 by salt-assisted solution combustion method and its photocatalytic activity. J. Ceram. Soc. Jpn. 2014, 122, 146–150. [Google Scholar] [CrossRef]
- Wang, W.; Li, S.; Wen, Y.; Gong, M.; Zhang, L.; Yao, Y. Synthesis and characterization of TiO2/YFeO3 and its photocatalytic oxidation of gaseous benzene. Acta Phys. Chim. Sin. 2008, 24, 1761–1766. [Google Scholar] [CrossRef]
- Zhang, Y.; Yang, J.; Xu, J.; Gao, Q. Controllable synthesis of hexagonal and orthorhombic YFeO3 and their visible-light photocatalytic activity. Mater. Lett. 2012, 81, 1–4. [Google Scholar] [CrossRef]
- Lu, X.; Xie, J.; Shu, H.; Liu, J.; Yin, G.; Lin, J. Microwave-assisted synthesis of nanocrystalline YFeO3 and study of its photoactivity. Mater. Sci. Eng. B 2007, 138, 289–292. [Google Scholar] [CrossRef]
- Yan, C.-H.; Xu, Z.-G.; Cheng, F.-X.; Wang, Z.-M.; Sun, L.-D.; Liao, C.-S.; Jia, J.-T. Nanophased CoFe2O4 prepared by combustion method. Solid State Commun. 1999, 111, 287–291. [Google Scholar] [CrossRef]
- Zhang, R.; Chen, C.; Jin, K.; Niu, L.; Xing, H.; Luo, B. Dielectric behavior of hexagonal and orthorhombic YFeO3 prepared by modified sol-gel method. J. Electroceram. 2014, 32, 187–191. [Google Scholar] [CrossRef]
- Wu, L.; Yu, J.; Zhang, L.; Wang, X.; Li, S. Selective self-propagating combustion synthesis of hexagonal and orthorhombic nanocrystalline yttrium iron oxide. J. Solid State Chem. 2004, 177, 3666–3674. [Google Scholar] [CrossRef]
- Downie, L.J.; Goff, R.J.; Kockelmann, W.; Forder, S.D.; Parker, J.E.; Morrison, F.D.; Lightfoot, P. Structural, magnetic and electrical properties of the hexagonal ferrites MFeO3 (M = Y, Yb, In). J. Solid State Chem. 2012, 190, 52–60. [Google Scholar] [CrossRef]
- Gil, D.; Navarro, C.; Cristina, A.; Lagarrigue, C.; Guimpel, J.; Carbonio, R.; Gomez, I. Synthesis and structural characterization of perovskite YFeO3 by thermal decomposition of a cyano complex precursor, Y[Fe(CN)6]·4H2O. J. Therm. Anal. Calorim. 2011, 103, 889–896. [Google Scholar] [CrossRef]
- Popkov, V.I.; Almjasheva, O.V.; Gusarov, V.V. The Investigation of the Structure Control Possibility of Nanocrystalline Yttrium Orthoferrite in Its Synthesis from Amorphous Powders. Russ. J. Appl. Chem. 2014, 2, 1417–1421. [Google Scholar] [CrossRef]
- Nishimura, T.; Hosokawa, S.; Masuda, Y.; Wada, K.I. Masashi, Synthesis of metastable rare-earth-iron mixed oxide with the hexagonal crystal structure. J. Solid State Chem. 2013, 197, 402–407. [Google Scholar] [CrossRef]
- Thommes, M.; Kaneko, K.; Neimark, A.A.; Olivier, J.P.; Rodriguez-Reinoso, F.; Rouquerol, J.; Sing, K.S.W. Physisorption of gases, with special reference to the evaluation of surface area and pore size distribution. Pure Appl. Chem. 2015, 87, 1051–1069. [Google Scholar] [CrossRef]
- Marschall, R.; Soldat, J.; Wark, M. Enhanced photocatalytic hydrogen generation from barium tantalate composites. Photochem. Photobiol. Sci. 2013, 12, 671–677. [Google Scholar] [CrossRef] [PubMed]
- Tang, P.; Sun, H.; Chen, H.; Cao, F. Hydrothermal processing-assisted synthesis of nanocrystalline YFeO3 and its visible-light photocatalytic activity. Curr. Nanosci. 2012, 8, 64–67. [Google Scholar] [CrossRef]
- Majumdar, D.; Chatterjee, D. X-ray photoelectron spectroscopic studies on yttria, zirconia, and yttria-stabilized zirconia. J. Appl. Phys. 1991, 70, 988–992. [Google Scholar] [CrossRef]
- Vasquez, R.P.; Foote, M.C.; Hunt, B.D. Reaction of non-aqueous halogen solutions with YBa2Cu3O7−x. J. Appl. Phys. 1989, 66, 4867–4877. [Google Scholar] [CrossRef]
- Li, J.; Singh, U.G.; Schladt, T.U.; Stalick, J.K.; Scott, S.L.; Seshadri, R. Hexagonal YFe1−x PdxO3−δ: Nonperovskite Host Compounds for Pd2+ and Their Catalytic Activity for CO Oxidation. Chem. Mater. 2008, 20, 6567–6576. [Google Scholar] [CrossRef]
- Lu, X.; Liu, J.; Zhu, J.; Jiang, D.; Xie, J. Preparation and characterization of heterojunction semiconductor YFeO3/TiO2 with an enhanced photocatalytic activity. J. Mater. Res. 2010, 25, 104–109. [Google Scholar] [CrossRef]
- Wang, C.W.; Badylevich, M.; Afanasev, V.V.; Stesmans, A.; Adelmann, C.; Van Elshocht, S.; Kittl, T.A.; Lukosius, M.; Walczyk, C.; Wenger, C. Band alignment and electron traps in Y2O3 layers on (100) Si. Appl. Phys. Lett. 2009, 95. [Google Scholar] [CrossRef]
- Zhao, Y.; Kita, K.; Kyuno, K.; Toriumi, A. Design of higher-k and more stable rare earth oxides as gate dielectrics for advanced CMOS devices. Appl. Phys. Lett. 2009, 94, 1413–1438. [Google Scholar] [CrossRef]
- Hisatomi, T.; Formal, F.L.; Cornuz, M.; Brillet, J.; Tetreault, N.; Sivula, K.; Graetzel, M. Cathodic shift in onset potential of solar oxygen evolution on hematite by 13-group oxide overlayers. Energy Environ. Sci. 2011, 4, 2512–2515. [Google Scholar] [CrossRef]
- Kay, A.; Graetzel, M. Dye-sensitized core-shell nanocrystals: Improved efficiency of mesoporous tin oxide electrodes coated with a thin layer of an insulating oxide. Chem. Mater. 2002, 14, 2930–2935. [Google Scholar] [CrossRef]
- Wu, W.; Liang, S.; Shen, L.; Ding, Z.; Zheng, H.; Su, W.; Wu, L. Preparation, characterization and enhanced visible light photocatalytic activities of polyaniline/Bi3NbO7 nanocomposites. J. Alloys Compod. 2012, 520, 213–219. [Google Scholar] [CrossRef]
- Yu, L.; Zhang, X.; Li, G.; Cao, Y.; Shao, Y.; Li, D. Highly efficient Bi2O2CO3/BiOCl photocatalyst based on heterojunction with enhanced dye-sensitization under visible light. Appl. Catal. B Environ. 2016, 187, 301–309. [Google Scholar] [CrossRef]
- Chen, X.; Zhou, B.; Yang, S.; Wu, H.; Wu, L.; Pan, J.; Xiong, X. In Situ construction of an SnO2/g-C3N4 heterojunction for enhanced visible-light photocatalytic activity. RSC Adv. 2015, 5, 68953–68963. [Google Scholar] [CrossRef]
- Xu, N.; Shi, Z.; Fan, Y.; Dong, J.; Shi, J.; Hu, M. Effects of Particle Size of TiO2 on Photocatalytic Degradation of Methylene Blue in Aqueous Suspensions. Ind. Eng. Chem. Res. 1999, 38, 373–379. [Google Scholar] [CrossRef]
- Ghobadi, A.; Gamze Ulusoy, T.; Garifullin, R.; Mustafa, O.G.; Okyay, A.K. Heterojunction Design of Single Layer Hole Tunneling ZnO Passivation Wrapping around TiO2 Nanowires for Superior Photocatalytic Performance. Sci. Rep. 2016, 6. [Google Scholar] [CrossRef] [PubMed]
- Krumova, K.; Cosa, G. Overview of reactive oxygen species. In Singlet Oxygen, Applications in Biosciences and Nanosciences; Nonell, S., Flors, C., Eds.; Royal Society of Chemistry: London, UK, 2016; Chapter 1; Volume 1, pp. 1–21. [Google Scholar]
- Liu, W.; Wang, M.; Xu, C.; Chen, S. Facile synthesis of g-C3N4/ZnO composite with enhanced visible light photooxidation and photoreduction properties. Chem. Eng. J. 2012, 209, 386–393. [Google Scholar] [CrossRef]
- Ju, L.; Chen, Z.; Fang, L.; Dong, W.; Zheng, F.; Shen, M. Sol-gel synthesis and Photo-Fenton-like catalytic activity of EuFeO3 nanoparticles. J. Am. Ceram. Soc. 2011, 94, 3418–3424. [Google Scholar] [CrossRef]
- Wang, X.; Zhang, L.; Lin, H.; Nong, Q.; Wu, Y.; Wu, T.; He, Y. Synthesis and characterization of a ZrO2/g-C3N4 composite with enhanced visible-light photoactivity for rhodamine degradation. RSC Adv. 2014, 4, 40029–40035. [Google Scholar] [CrossRef]
- Yang, X.; Cui, H.; Li, Y.; Qin, J.; Zhang, R.; Tang, H. Fabrication of Ag3PO4-graphene composites with highly efficient and stable visible light photocatalytic performance. ACS Catal. 2013, 3, 363–369. [Google Scholar] [CrossRef]
- Wang, D.; Kako, T.; Ye, J. Efficient photocatalytic decomposition of acetaldehyde over a solid-solution perovskite (Ag0.75Sr0.25)(Nb0.75Ti0.25)O3 under visible-light irradiation. J. Am. Chem. Soc. 2008, 130, 2724–2725. [Google Scholar] [CrossRef] [PubMed]
- Neubert, S.; Ramakrishnan, A.; Strunk, J.; Mei, B.; Wang, L.; Bledowski, M.; Guschin, D.A.; Wang, Y.; Muhler, M.; Beranek, R. Surface-modified TiO2 photocatalysts prepared by a photosynthetic route: Mechanism, enhancement and limits. ChemPlusChem 2013, 79, 163–170. [Google Scholar] [CrossRef]
- Cui, M.; Nong, Q.; Yu, J.; Lin, H.; Wu, Y.; Jiang, X.; Liu, X.; He, Y. Preparation, characterization, and photocatalytic activity of CdV2O6 nanorods decorated g-C3N4 composite. J. Mol. Catal. A Chem. 2016, 423, 240–247. [Google Scholar] [CrossRef]
Figure 1.
XRD patterns of YFeO3 calcined at different temperatures. The peak positions in reference diffraction patterns of the hexagonal (ICDD-00-048-0529) and orthorhombic (ICDD-00-011-0558) YFeO3 are also indicated by gray and black lines, respectively.
Figure 1.
XRD patterns of YFeO3 calcined at different temperatures. The peak positions in reference diffraction patterns of the hexagonal (ICDD-00-048-0529) and orthorhombic (ICDD-00-011-0558) YFeO3 are also indicated by gray and black lines, respectively.
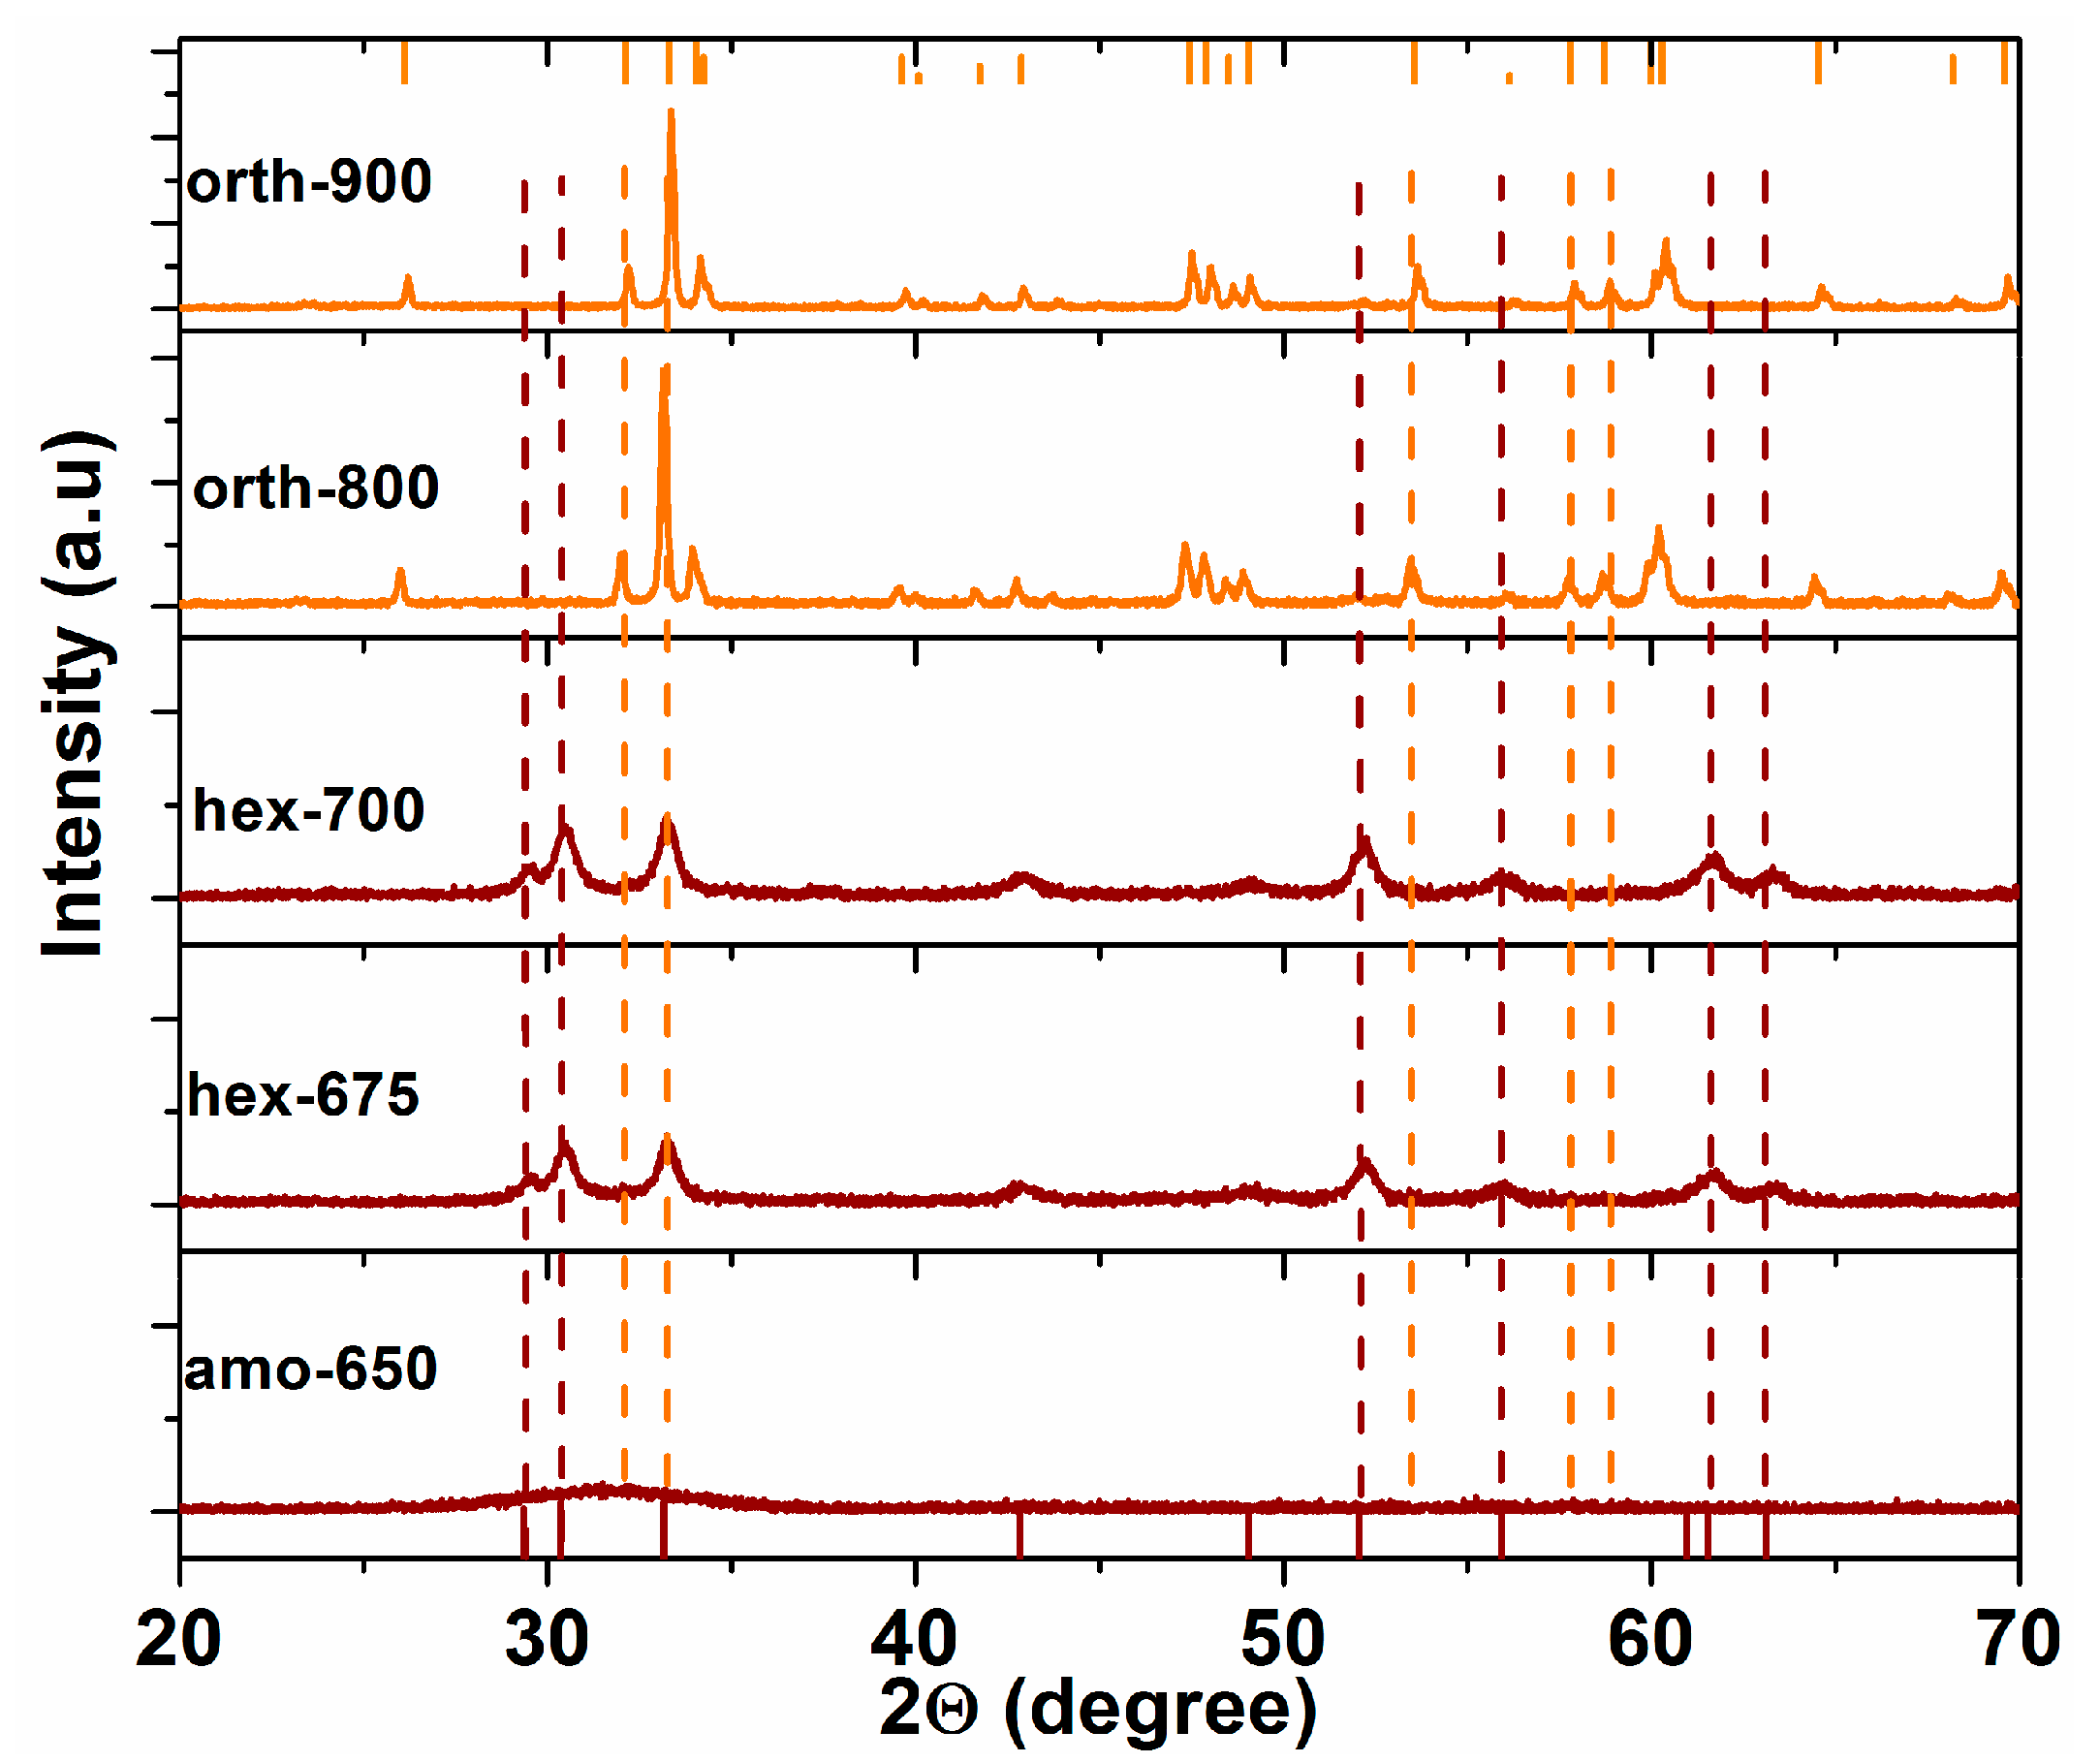
Figure 2.
N2 adsorption isotherms for Brunauer-Emmett-Teller (BET) surface area determination of YFeO3 calcined at the indicated temperatures.
Figure 2.
N2 adsorption isotherms for Brunauer-Emmett-Teller (BET) surface area determination of YFeO3 calcined at the indicated temperatures.

Figure 3.
(a) Kubelka-Munk function (F(R)) vs. wavelength, showing the absorption onsets. The insets show the colors of the YFeO3 powders (b) Tauc plots for indirect band gap determination of the YFeO3 samples.
Figure 3.
(a) Kubelka-Munk function (F(R)) vs. wavelength, showing the absorption onsets. The insets show the colors of the YFeO3 powders (b) Tauc plots for indirect band gap determination of the YFeO3 samples.
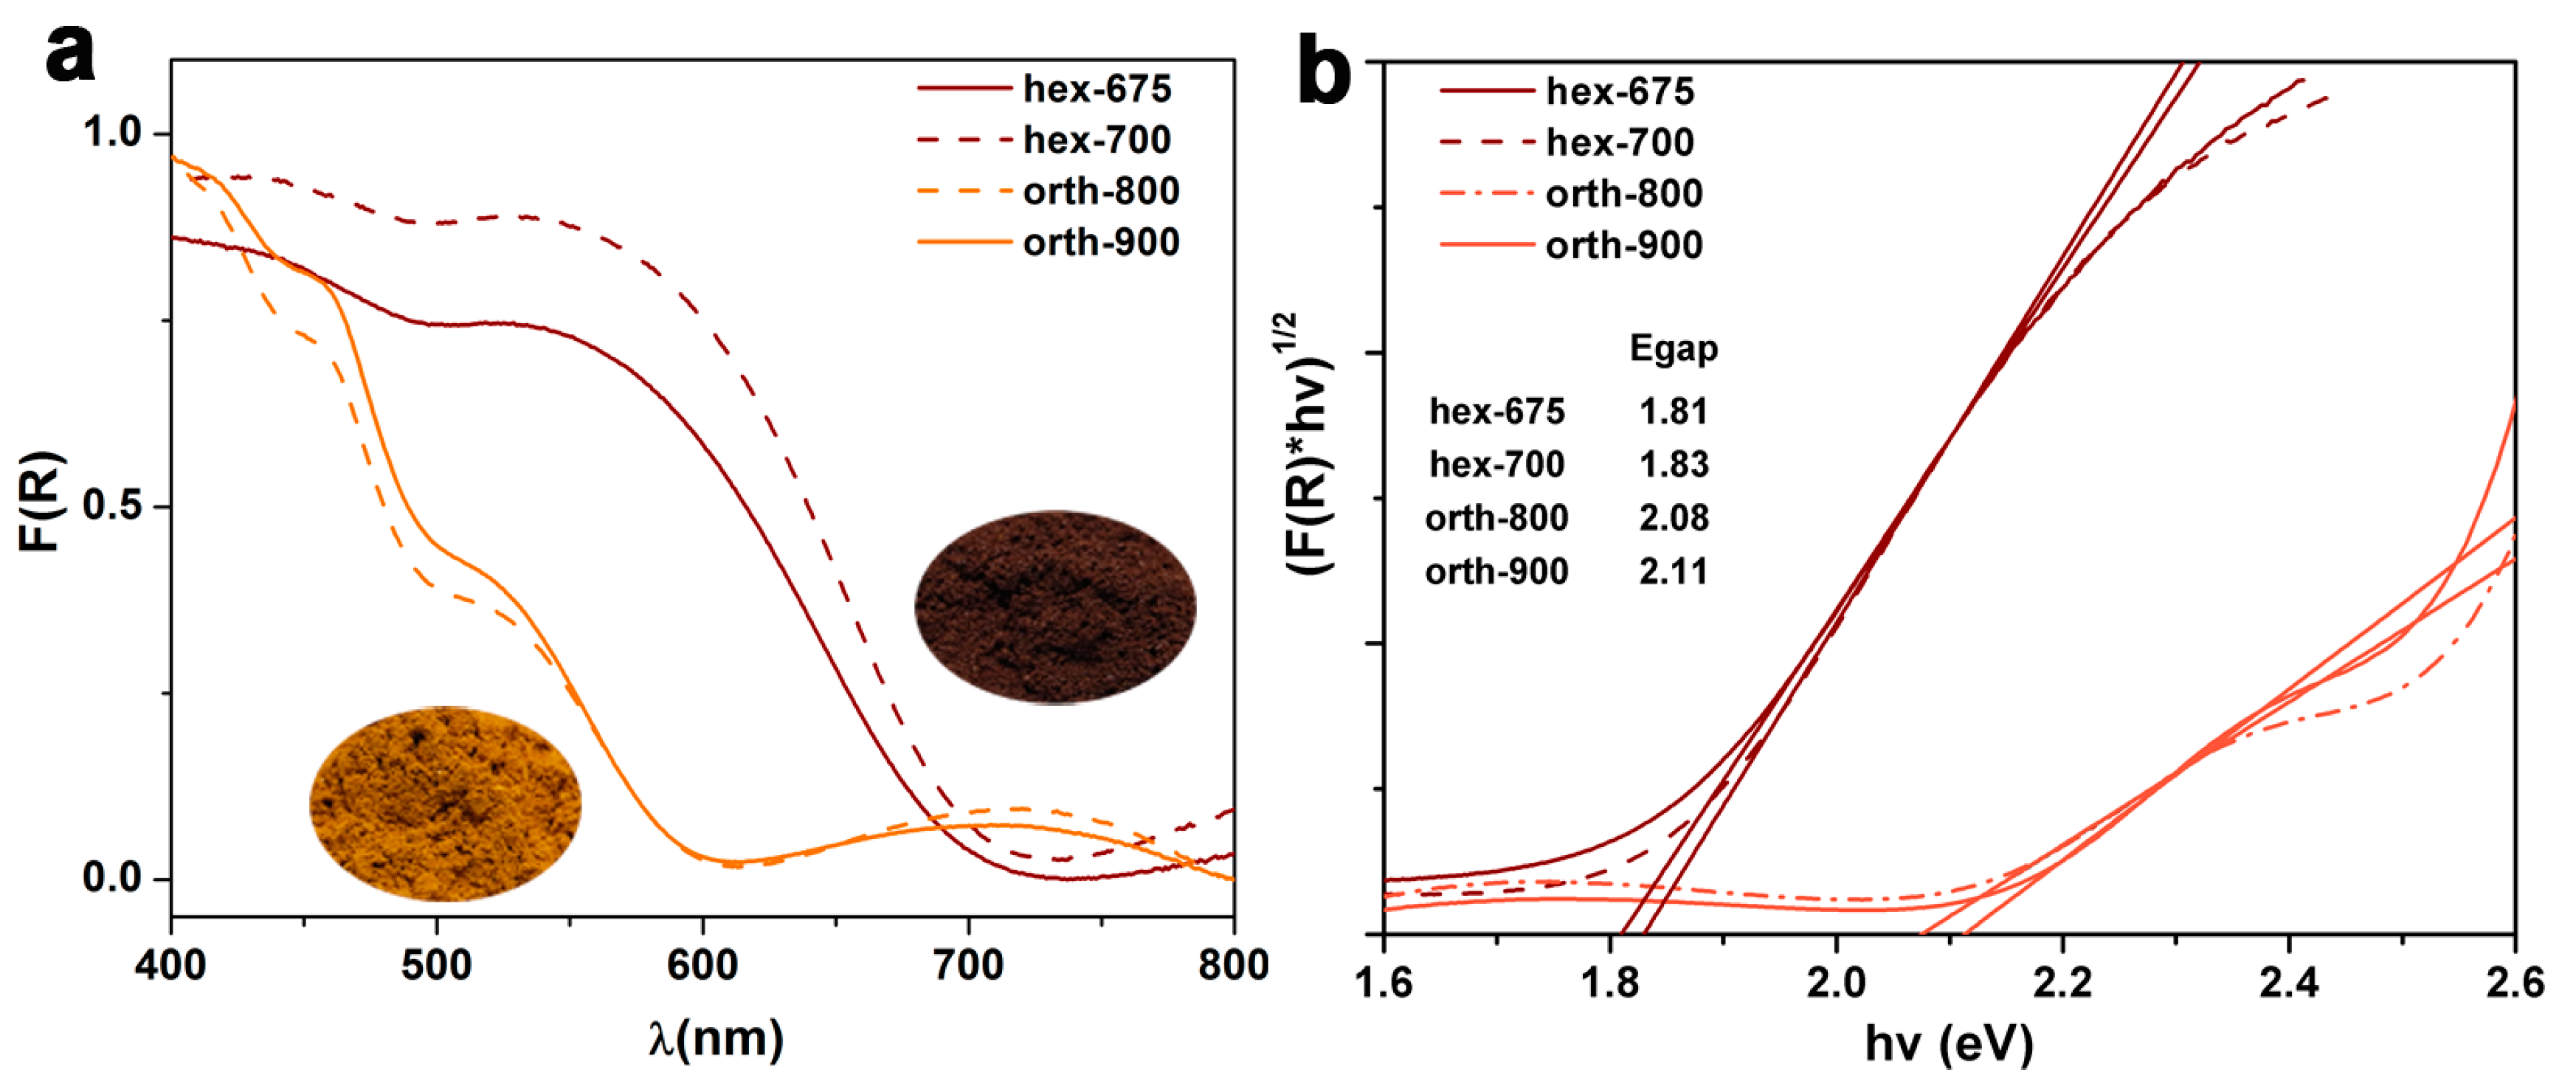
Figure 4.
High resolution X-ray photoelectron spectroscopy (XPS) scans of hexagonal and orthorhombic YFeO3. (a) Y 3d; (b) O 1s, and (c) Fe 2p region.
Figure 4.
High resolution X-ray photoelectron spectroscopy (XPS) scans of hexagonal and orthorhombic YFeO3. (a) Y 3d; (b) O 1s, and (c) Fe 2p region.

Figure 5.
Mott-Schottky plots at 1 kHz and 5 kHz of (a) hex-675, (b) orth-900, (c) chopped light photocurrent measurements in 0.1 M Na2SO4/0.1 M Na2SO3 solution (pH = 5.6) under white light emitting diode (LED) illumination, and (d) Nyquist plot of hex-675 and orth-900 in 0.1 M Na2SO4 (pH = 5.6) at 0.1 V vs. Ag/AgCl.
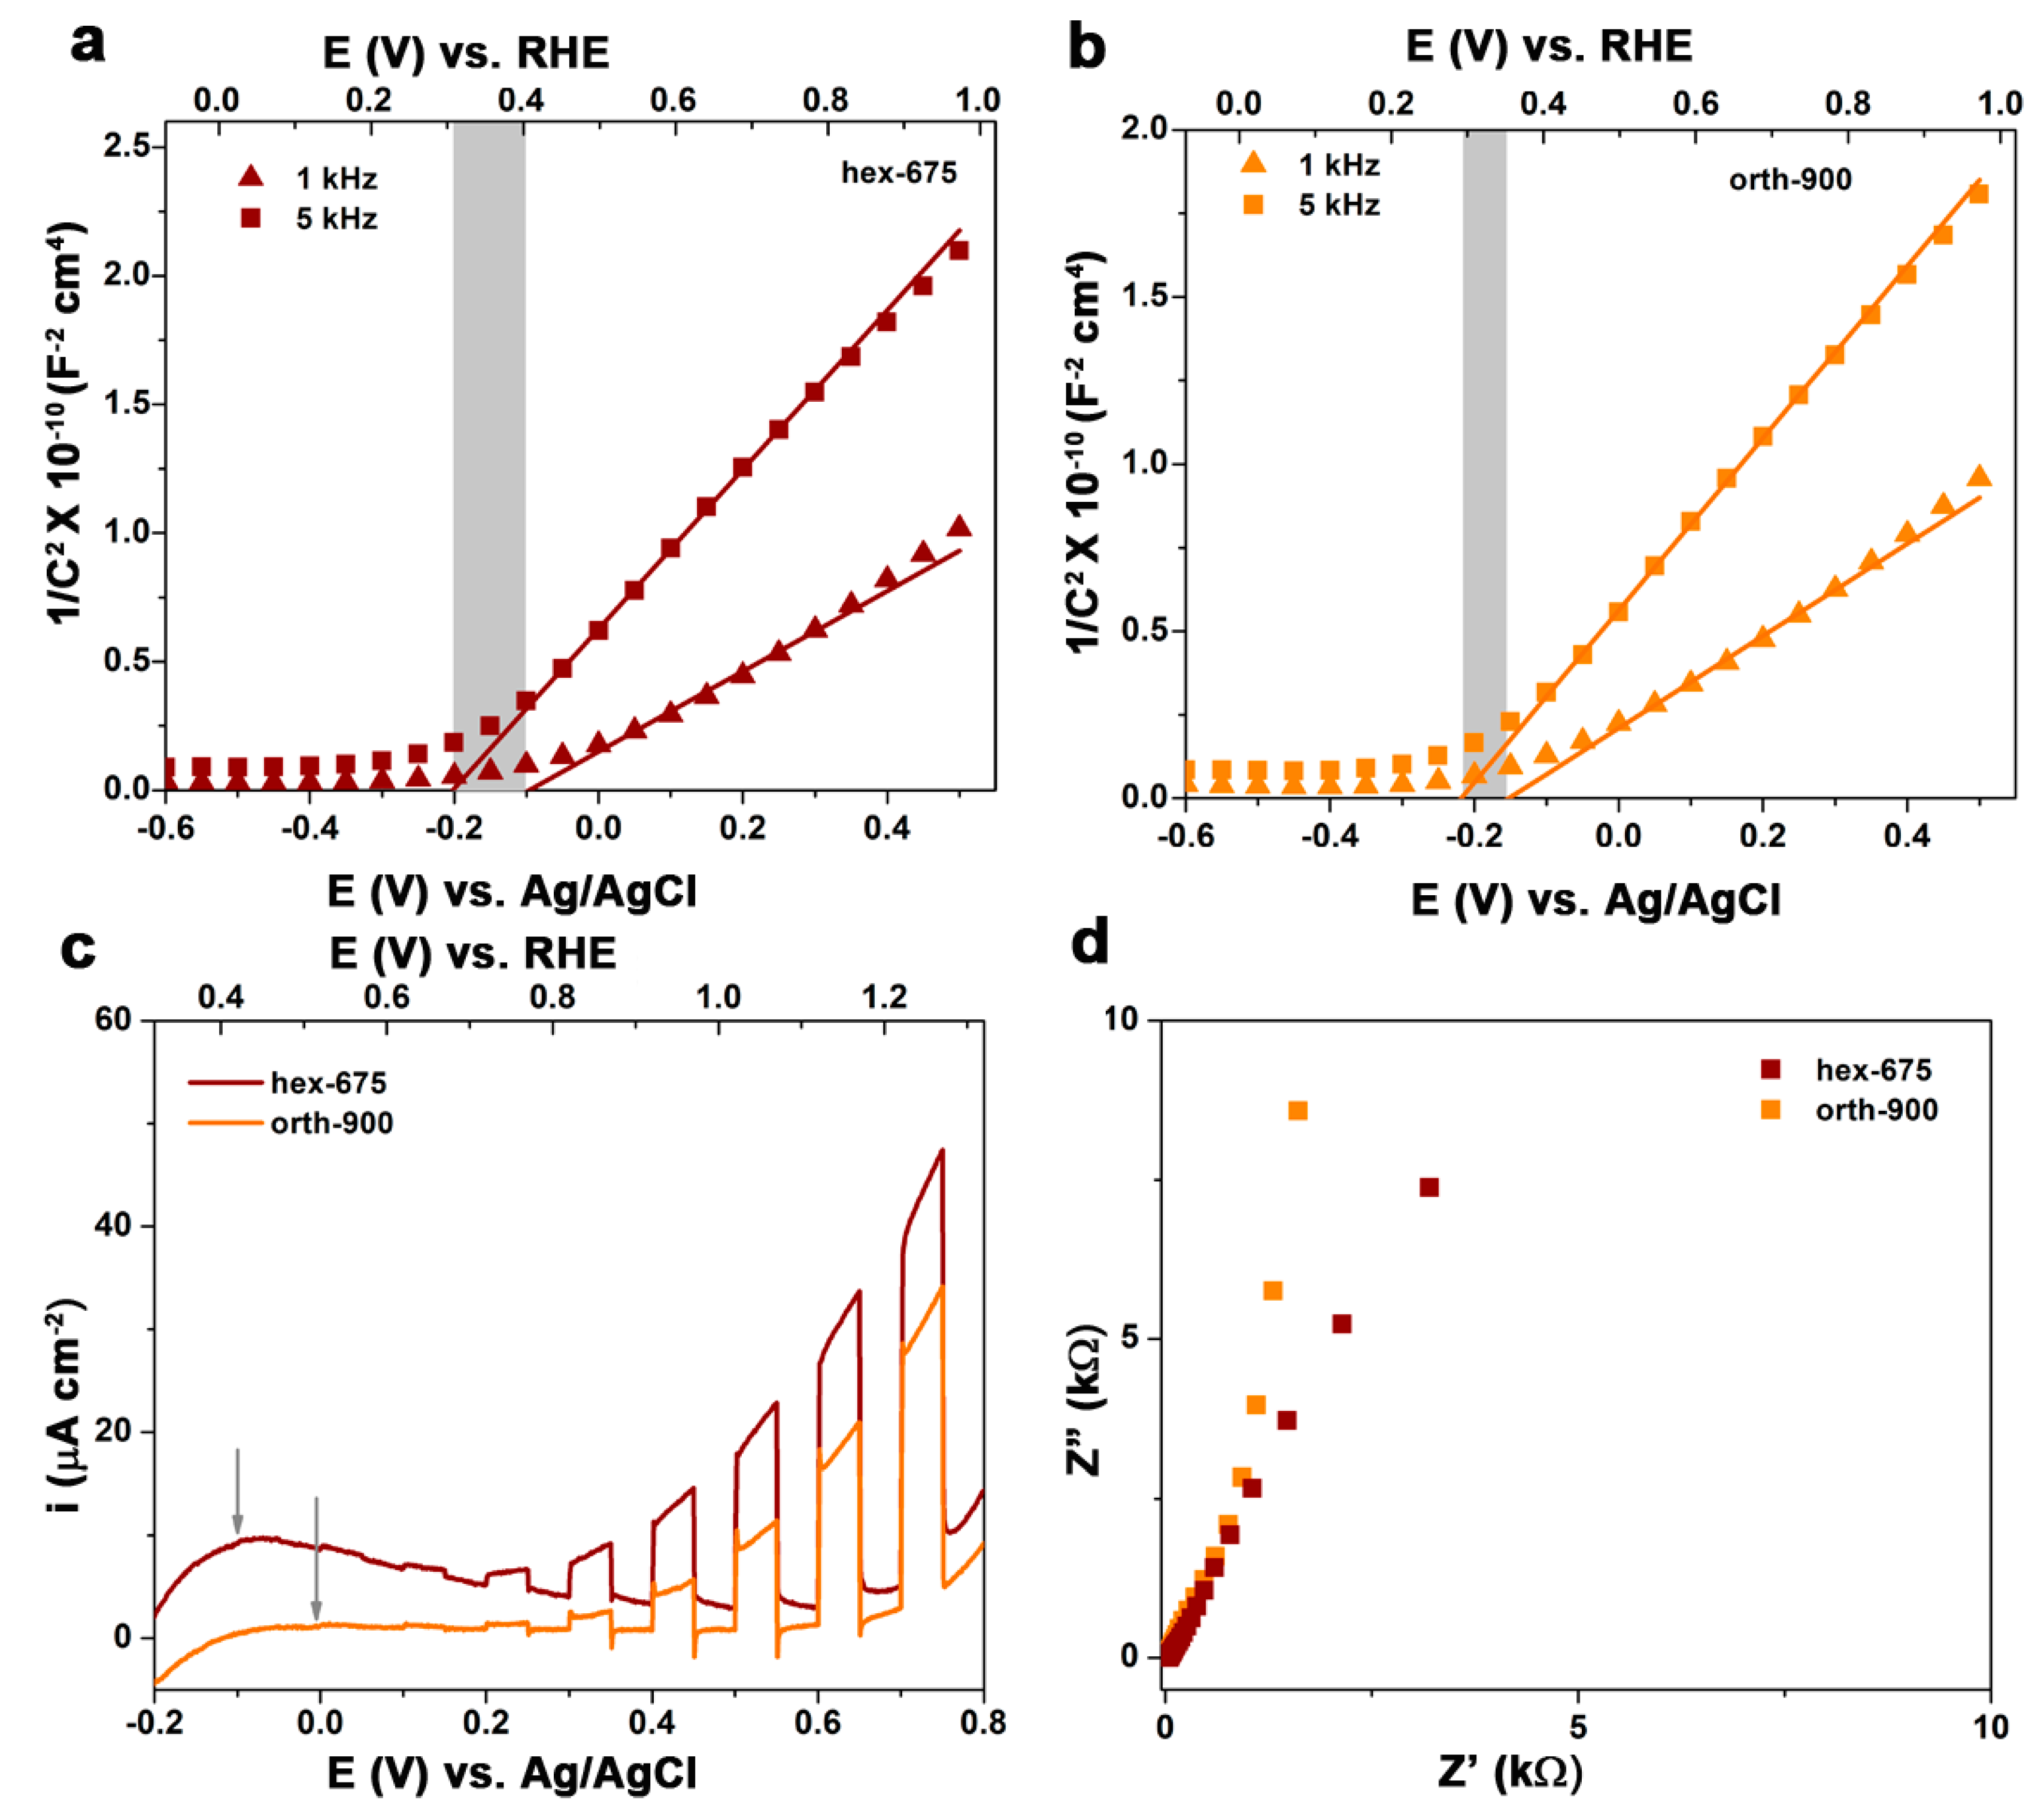
Figure 6.
Photocatalytic degradation tests of methyl orange (MO): (a) The loss of absorbance at 464 nm using hex-675 YFeO3 and (b) comparison of the normalized concentration changes over the different YFeO3 samples and different conditions of illumination for hex-675. Light source: 150 W Xe arc lamp with cut-off filter λ > 420 nm.
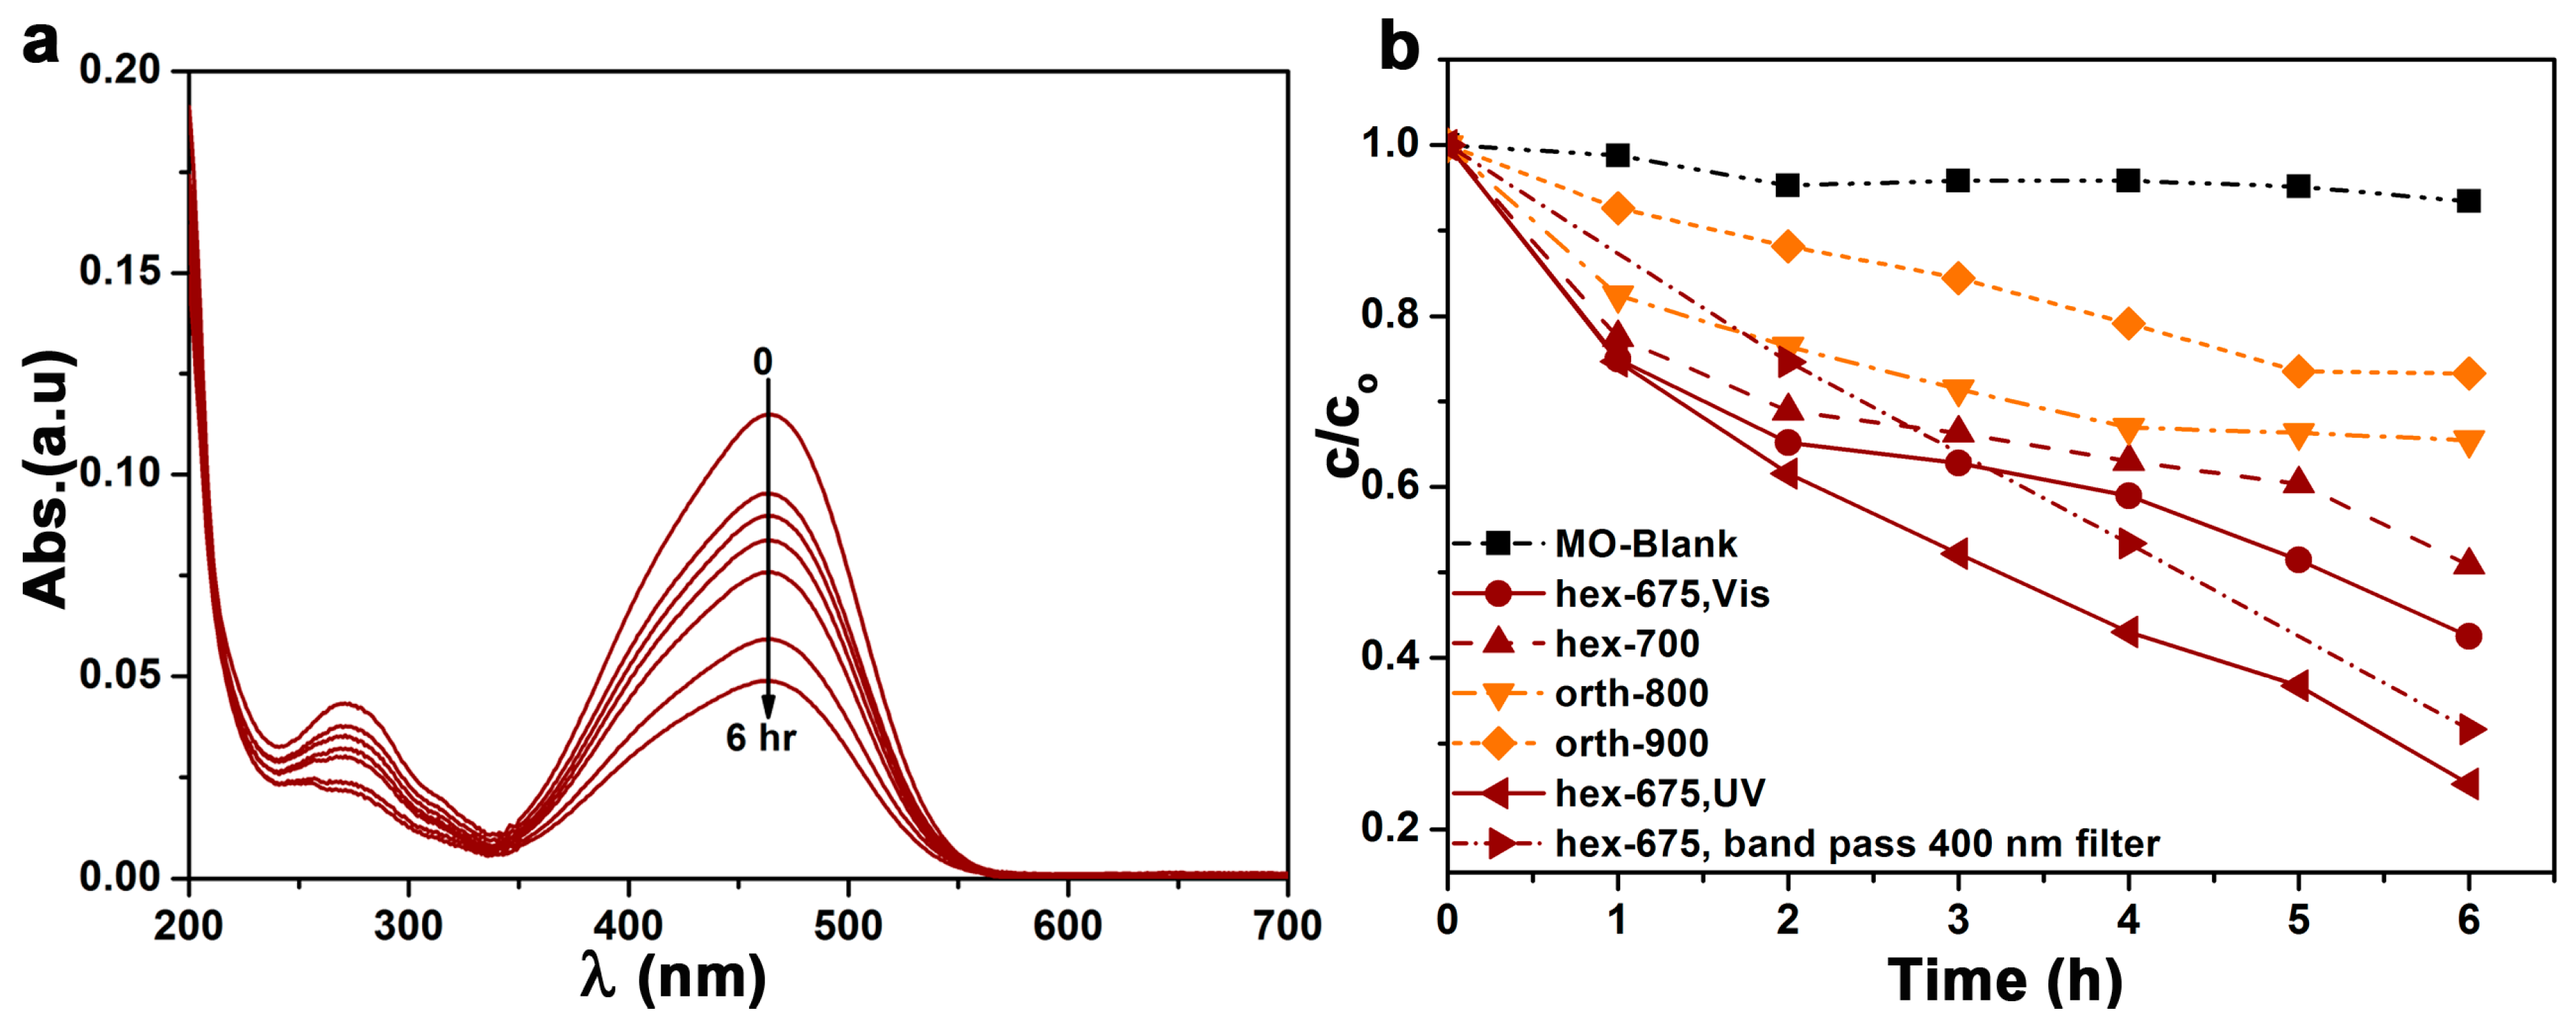
Figure 7.
Photocatalytic degradation of MO under visible light (λ > 420 nm) over YFeO3 hex-675 after addition of several trapping reagents in order to identify the active species.
Figure 7.
Photocatalytic degradation of MO under visible light (λ > 420 nm) over YFeO3 hex-675 after addition of several trapping reagents in order to identify the active species.

Table 1.
XPS surface atomic ratios for hexagonal and orthorhombic YFeO3.
| Samples | % Fe | % Y | % O |
| hex-675 | 20.2 | 26.6 | 53.2 |
| orth-900 | 20.1 | 27.6 | 52.2 |
© 2017 by the authors. Licensee MDPI, Basel, Switzerland. This article is an open access article distributed under the terms and conditions of the Creative Commons Attribution (CC BY) license (http://creativecommons.org/licenses/by/4.0/).
Share and Cite
MDPI and ACS Style
Ismael, M.; Elhaddad, E.; Taffa, D.H.; Wark, M. Synthesis of Phase Pure Hexagonal YFeO3 Perovskite as Efficient Visible Light Active Photocatalyst. Catalysts 2017, 7, 326. https://doi.org/10.3390/catal7110326
AMA Style
Ismael M, Elhaddad E, Taffa DH, Wark M. Synthesis of Phase Pure Hexagonal YFeO3 Perovskite as Efficient Visible Light Active Photocatalyst. Catalysts. 2017; 7(11):326. https://doi.org/10.3390/catal7110326
Chicago/Turabian StyleIsmael, Mohammed, Engy Elhaddad, Dereje H. Taffa, and Michael Wark. 2017. "Synthesis of Phase Pure Hexagonal YFeO3 Perovskite as Efficient Visible Light Active Photocatalyst" Catalysts 7, no. 11: 326. https://doi.org/10.3390/catal7110326
Note that from the first issue of 2016, this journal uses article numbers instead of page numbers. See further details here.