Article

In Situ FTIR Analysis of CO-Tolerance of a Pt-Fe Alloy with Stabilized Pt Skin Layers as a Hydrogen Anode Catalyst for Polymer Electrolyte Fuel Cells

1
Special Doctoral Program for Green Energy Conversion Science and Technology, Interdisciplinary Graduate School of Medicine and Engineering, University of Yamanashi, 4 Takeda, Kofu 400-8510, Japan
2
Fuel Cell Nanomaterials Center, University of Yamanashi, 4 Takeda, Kofu 400-8510, Japan
3
Department of Applied Chemistry, Faculty of Engineering, University of Yamanashi, 4 Takeda, Kofu 400-8510, Japan
4
Clean Energy Research Center, University of Yamanashi, 4 Takeda, Kofu 400-8510, Japan
*
Author to whom correspondence should be addressed.
Catalysts 2017, 7(1), 8; https://doi.org/10.3390/catal7010008
Submission received: 25 November 2016 / Revised: 22 December 2016 / Accepted: 24 December 2016 / Published: 29 December 2016

Abstract

:
The CO-tolerance mechanism of a carbon-supported Pt-Fe alloy catalyst with two atomic layers of stabilized Pt-skin (Pt2AL–PtFe/C) was investigated, in comparison with commercial Pt2Ru3/C (c-Pt2Ru3/C), by in situ attenuated total reflection Fourier transform infrared (ATR-FTIR) spectroscopy in 0.1 M HClO4 solution at 60 °C. When 1% CO (H2-balance) was bubbled continuously in the solution, the hydrogen oxidation reaction (HOR) activities of both catalysts decreased severely because the active sites were blocked by COad, reaching the coverage θCO ≈ 0.99. The bands in the IR spectra observed on both catalysts were successfully assigned to linearly adsorbed CO (COL) and bridged CO (COB), both of which consisted of multiple components (COL or COB at terraces and step/edge sites). The Pt2AL–PtFe/C catalyst lost 99% of its initial mass activity (MA) for the HOR after 30 min, whereas about 10% of the initial MA was maintained on c-Pt2Ru3/C after 2 h, which can be ascribed to a suppression of linearly adsorbed CO at terrace sites (COL, terrace). In contrast, the HOR activities of both catalysts with pre-adsorbed CO recovered appreciably after bubbling with CO-free pure H2. We clarify, for the first time, that such a recovery of activity can be ascribed to an increased number of active sites by a transfer of COL, terrace to COL, step/edge, without removal of COad from the surface. The Pt2AL–PtFe/C catalyst showed a larger decrease in the band intensity of COL, terrace. A possible mechanism for the CO-tolerant HOR is also discussed.

1. Introduction

For the applications of fuel cell vehicles (FCVs) and stationary cogeneration systems (FC-CG), polymer electrolyte fuel cells (PEFCs) have been actively developed. In 2014, a strategic roadmap for hydrogen and fuel cells was formulated by the Agency for Natural Resources and Energy, the Ministry of Economy, Trade, and Industry (METI), Japan [1]. Its Phase 1 is an expansion of the scope of applications for FCVs and FC-CG to achieve dramatic energy conservation. While the number of residential PEFC systems installed has been increasing continuously in Japan and has also commenced to increase in Europe, the reduction of the system cost is essential for larger scale commercialization, while maintaining the performance and durability.
Therefore, far, Pt-Ru alloy anode catalysts have been employed for the hydrogen oxidation reaction (HOR) to lessen the poisoning by low concentrations of CO contained in the reformate (hydrogen-rich gas produced by reforming hydrocarbons, followed by a purification). Indeed, the state-of-the-art commercial anode catalyst used in the commercial FC-CG system Ene·Farm® is nano-sized Pt2Ru3 dispersed on high-surface-area carbon black (c-Pt2Ru3/C). However, because the CO-tolerant HOR mass activity (based on the mass of both noble metals, Pt and Ru) and durability of c-Pt2Ru3/C are not sufficient, it is very important to develop novel anode catalysts, which would simplify the system, leading to cost reduction. As the support or co-catalyst for Pt-Ru alloys, the use of metal oxide materials has been effective in increasing the CO-tolerance [2,3,4,5,6,7]. It was found in our previous work that the CO-tolerance of Pt2Ru3 nanoparticles was improved by the use of an Sb-SnO2 support, in place of the conventional carbon black support [7]. By use of in situ attenuated total reflection Fourier transform infrared reflection-adsorption spectroscopy (ATR-FTIRAS), we clarified that the adsorption states of CO were changed due to electronic modification by the Sb-SnO2 support. Regarding the improvement of durability of c-Pt2Ru3/C, the instability of Ru at high potentials E > 0.8 V (vs. reversible hydrogen electrode, RHE) is difficult to overcome: the Ru component leaches into the electrolyte membrane, migrating and depositing at the cathode catalyst layer made from Pt or Pt-alloy. Thus, the loss of Ru reduces the cell performance by decreases in not only the CO-tolerance of the anode but also the activity for the oxygen reduction reaction (ORR) at the cathode. Hsieh et al. reported CO-tolerance of Pt shell/Ru core catalysts designed to suppress the dissolution of Ru [8], but it is expected to be difficult to completely protect Ru from dissolution.
Recently, a new Ru-free hydrogen anode catalyst has been developed in our laboratory. Carbon-supported PtCo alloy particles with two atomic layers of stabilized Pt skin (Pt2AL–PtCo/C) exhibited high mass activity MA for the CO-tolerant HOR, together with high robustness versus air exposure [9]. Very recently, we have reported our research on the effect of the non-noble metal species M (M = Fe, Co, Ni) in Pt2AL–Pt-M/C on CO-tolerance and the robustness by the use of channel flow electrode (CFE) method in 0.1 M HClO4. It was found that Pt2AL–PtFe/C exhibited the highest CO-tolerant HOR activity (with respect to the area-specific activity js and the MA). We considered the possibility that such a CO-tolerance could be ascribed to a modification of the electronic structure of the Pt-skin layer due to the presence of the alloy beneath the surface [10], but this needs to be analyzed experimentally.
In the present research, we have investigated the CO-tolerance mechanism on Pt2AL–PtFe/C and c-Pt2Ru3/C by the use of in situ ATR-FTIRAS in 0.1 M HClO4 at 60 °C. We, for the first time, demonstrate that the recovery of the HOR activity that occurs on these catalysts when changing the gas from CO/H2 to pure H2 can be ascribed to the mobility of adsorbed CO, resulting in increased numbers of active sites.

2. Results and Discussion

2.1. FTIR Analysis of CO Adsorption on Catalysts

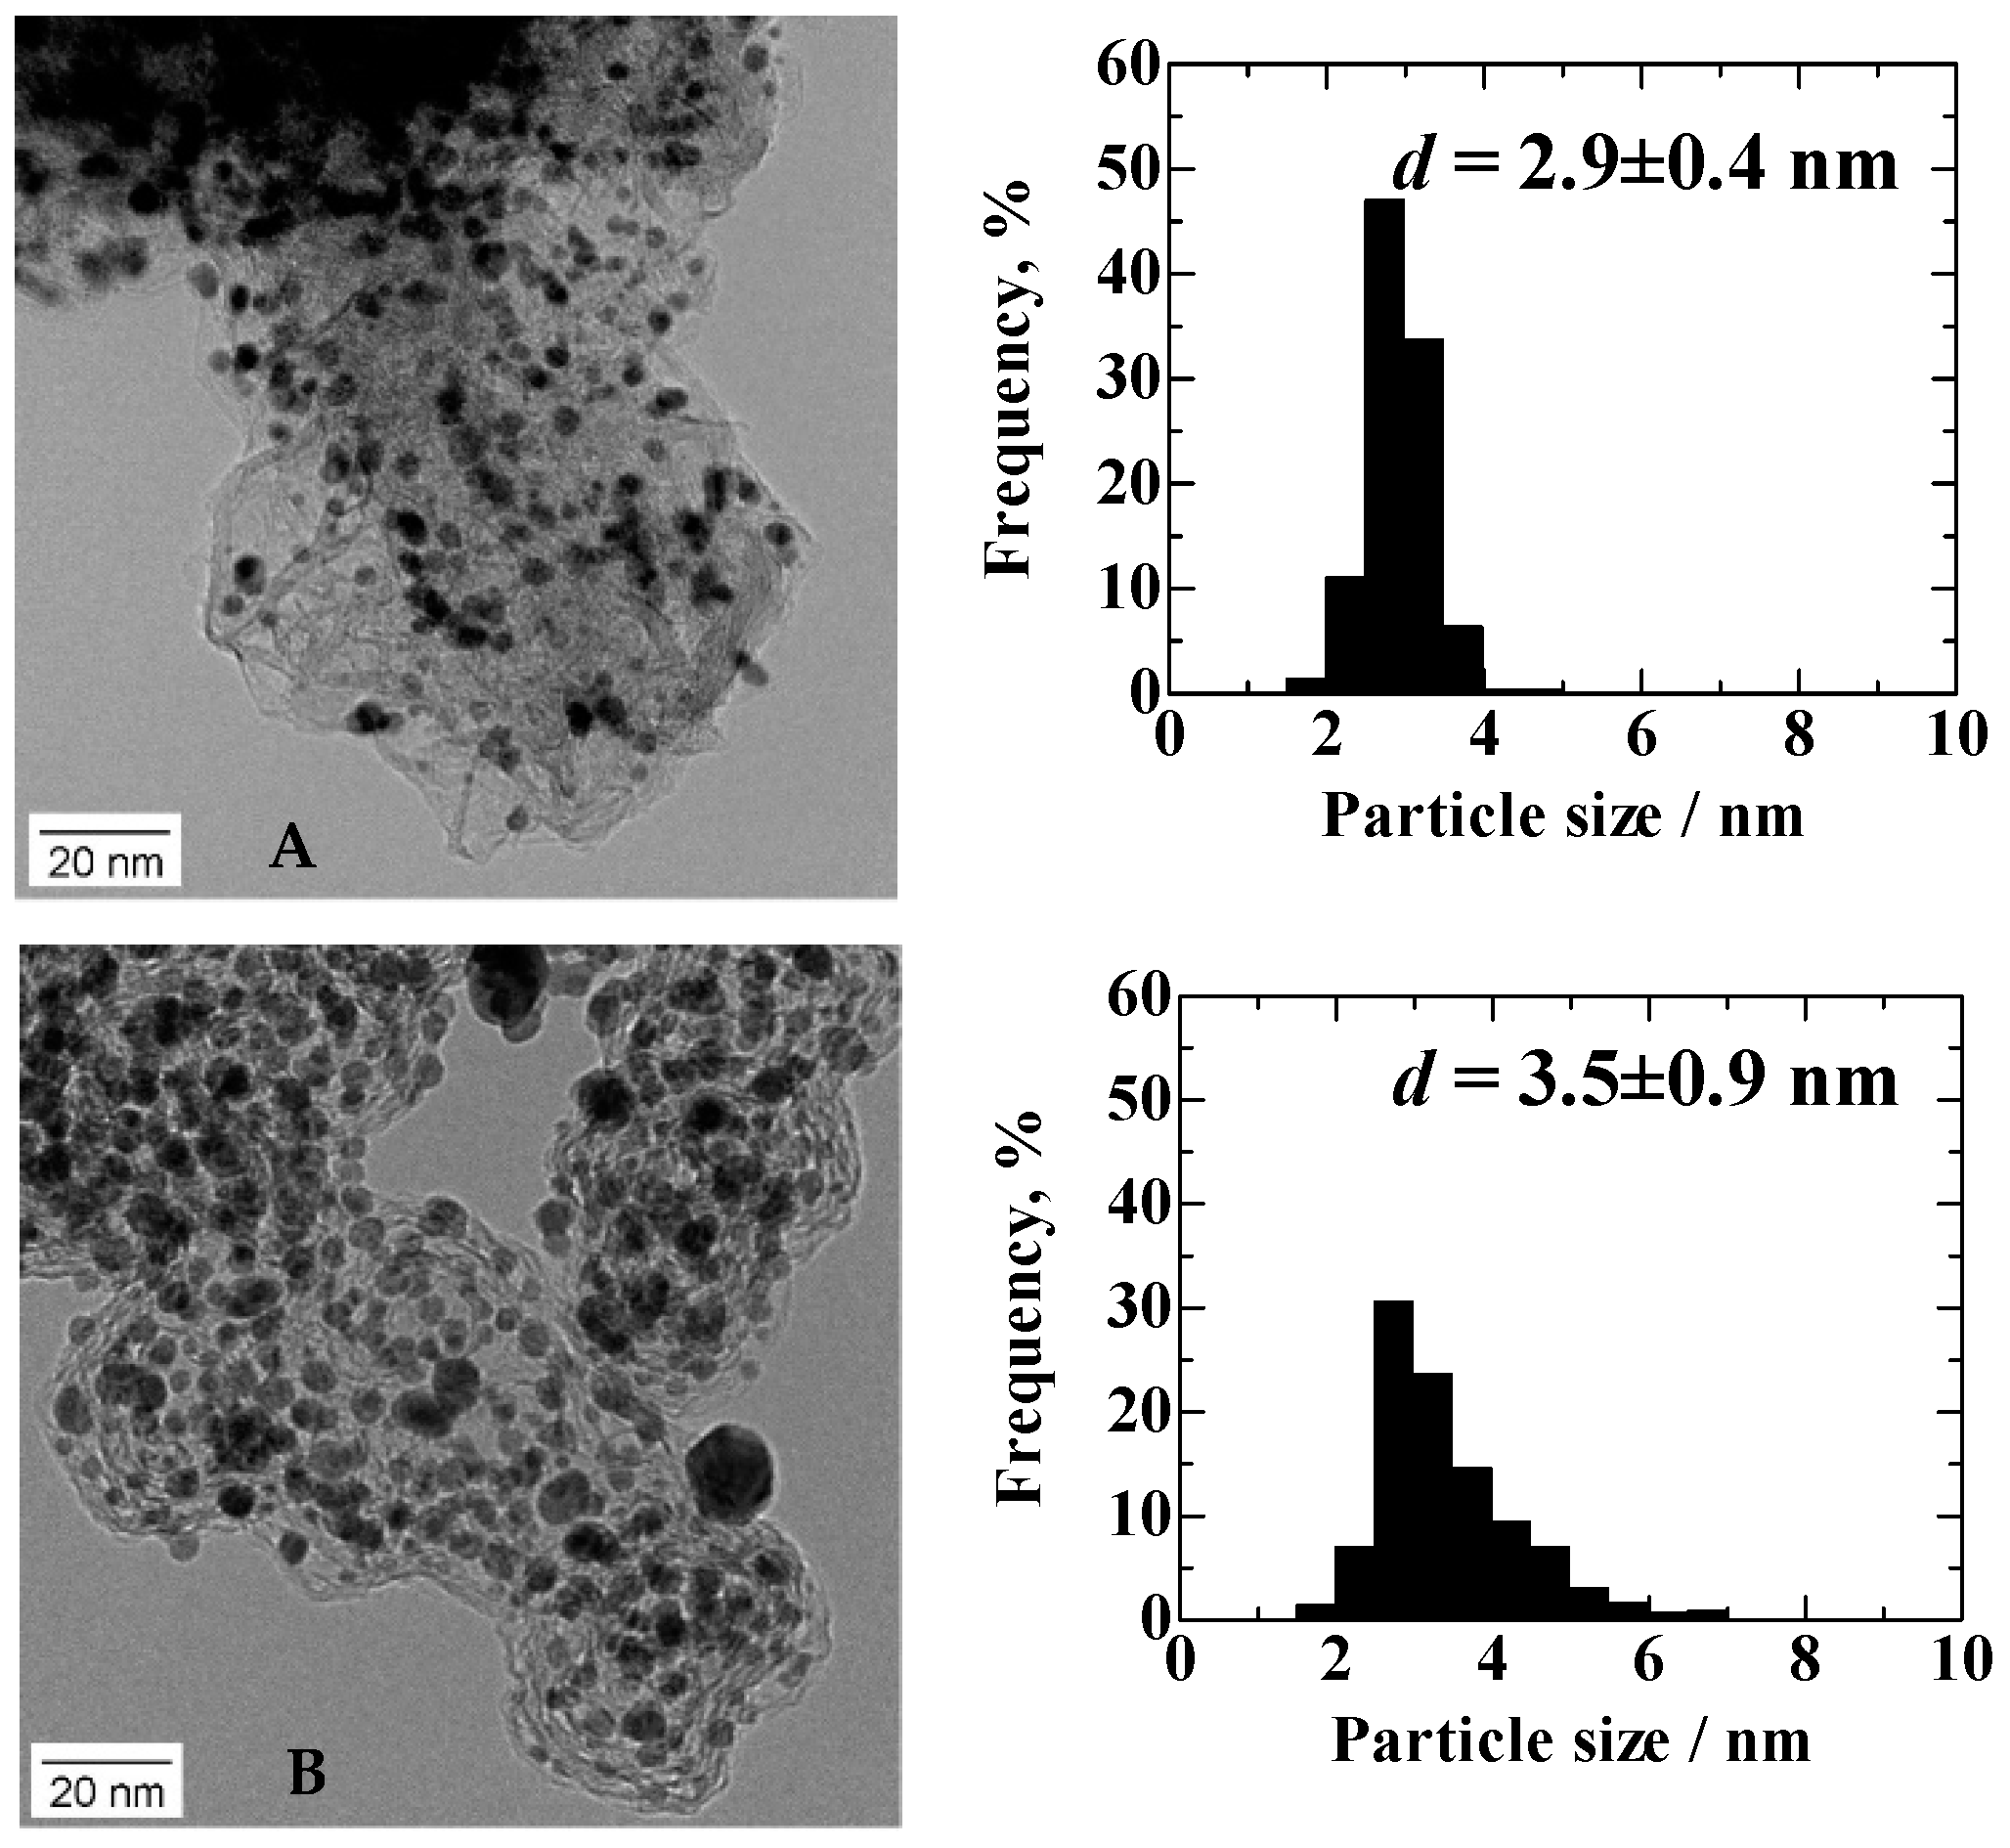
TEM images and particle size distribution histograms of Pt2AL–PtFe/C and c-Pt2Ru3/C (Figure 1) show that the average particle sizes and the standard deviations (σd) of the Pt2AL–PtFe/C and c-Pt2Ru3/C, which were determined from 500 particles in several TEM images, were 2.9 ± 0.4 nm and 3.5 ± 0.9 nm, respectively. As reported previously [11], the Pt2AL–PtFe nanoparticles were more uniform in size (smaller σd) and highly dispersed on the carbon black support, compared with c-Pt2Ru3/C.
By the use of an in situ FTIR cell with the attenuated total reflection configuration (ATR-FTIR) [7,12], the IR spectra on both catalysts at 0.02 V (practical operating potential in PEFCs) versus an RHE and 60 °C by bubbling 1% CO (H2-balance) continuously in 0.1 M HClO4 solution were measured together with the HOR current. The electrolyte solution was first saturated with pure H2 to measure the initial HOR current and the reference IR spectrum at 0.02 V, followed by changing the gas to 1% CO/H2. 
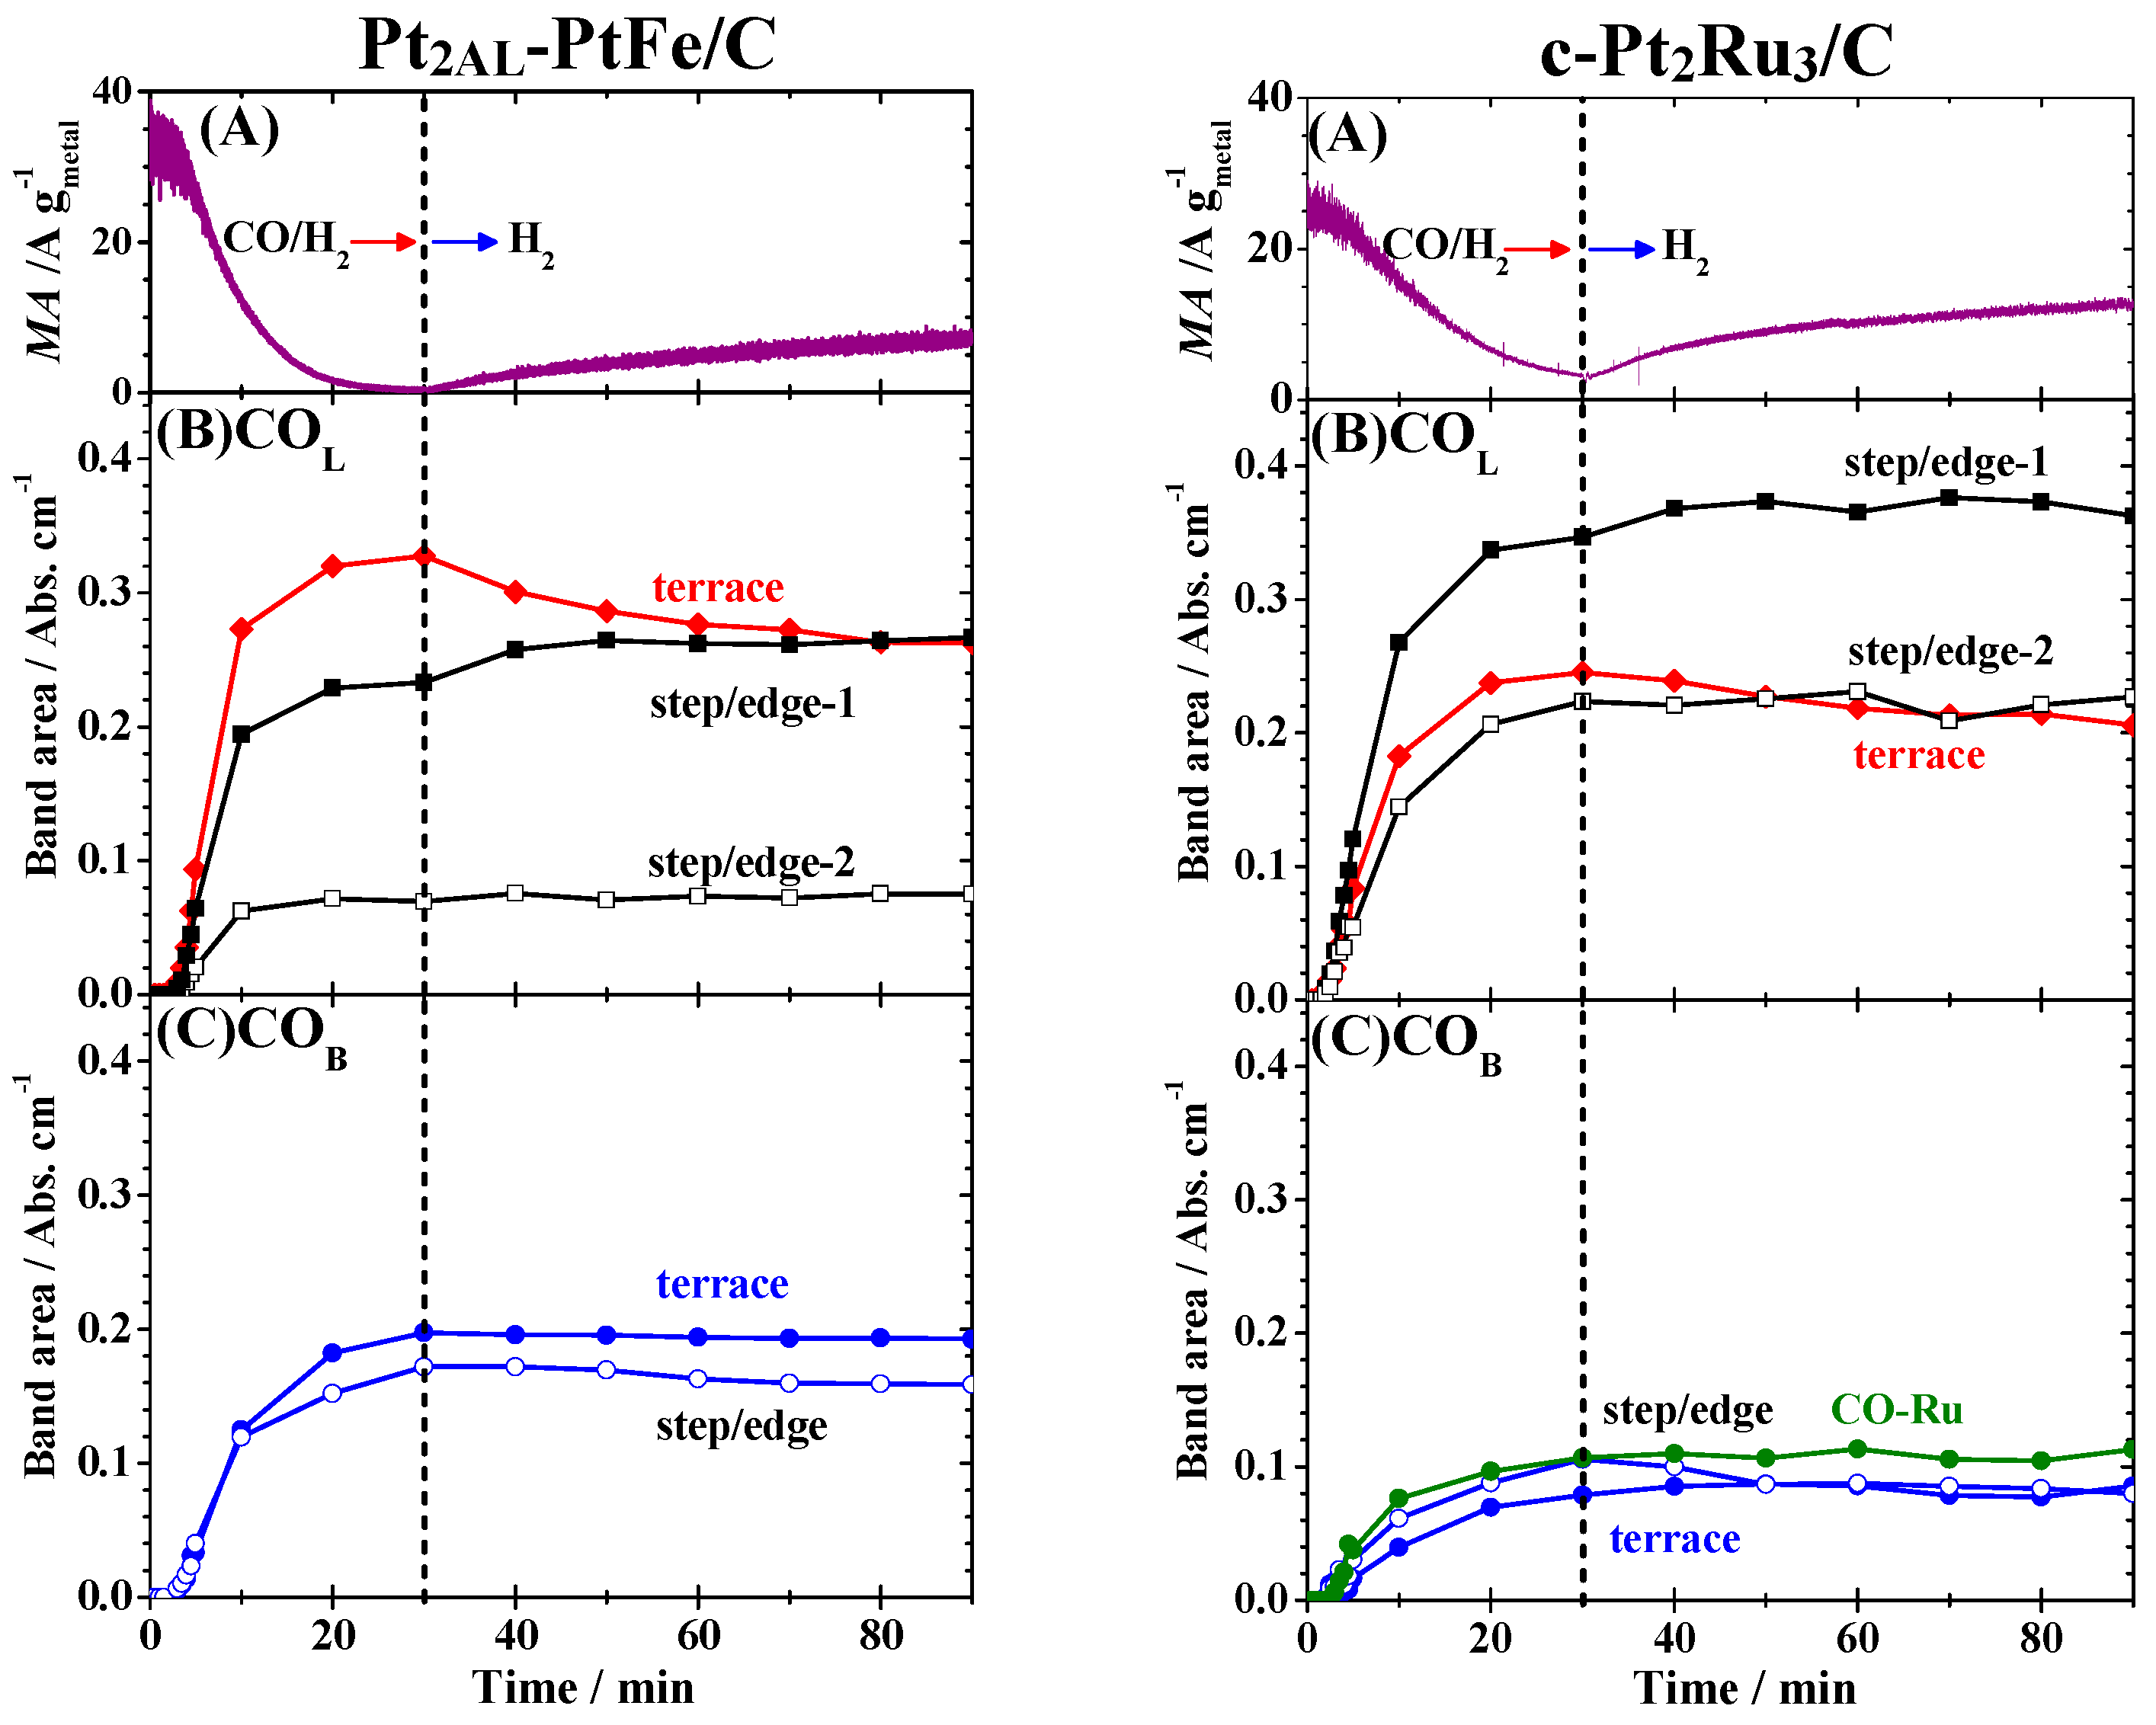
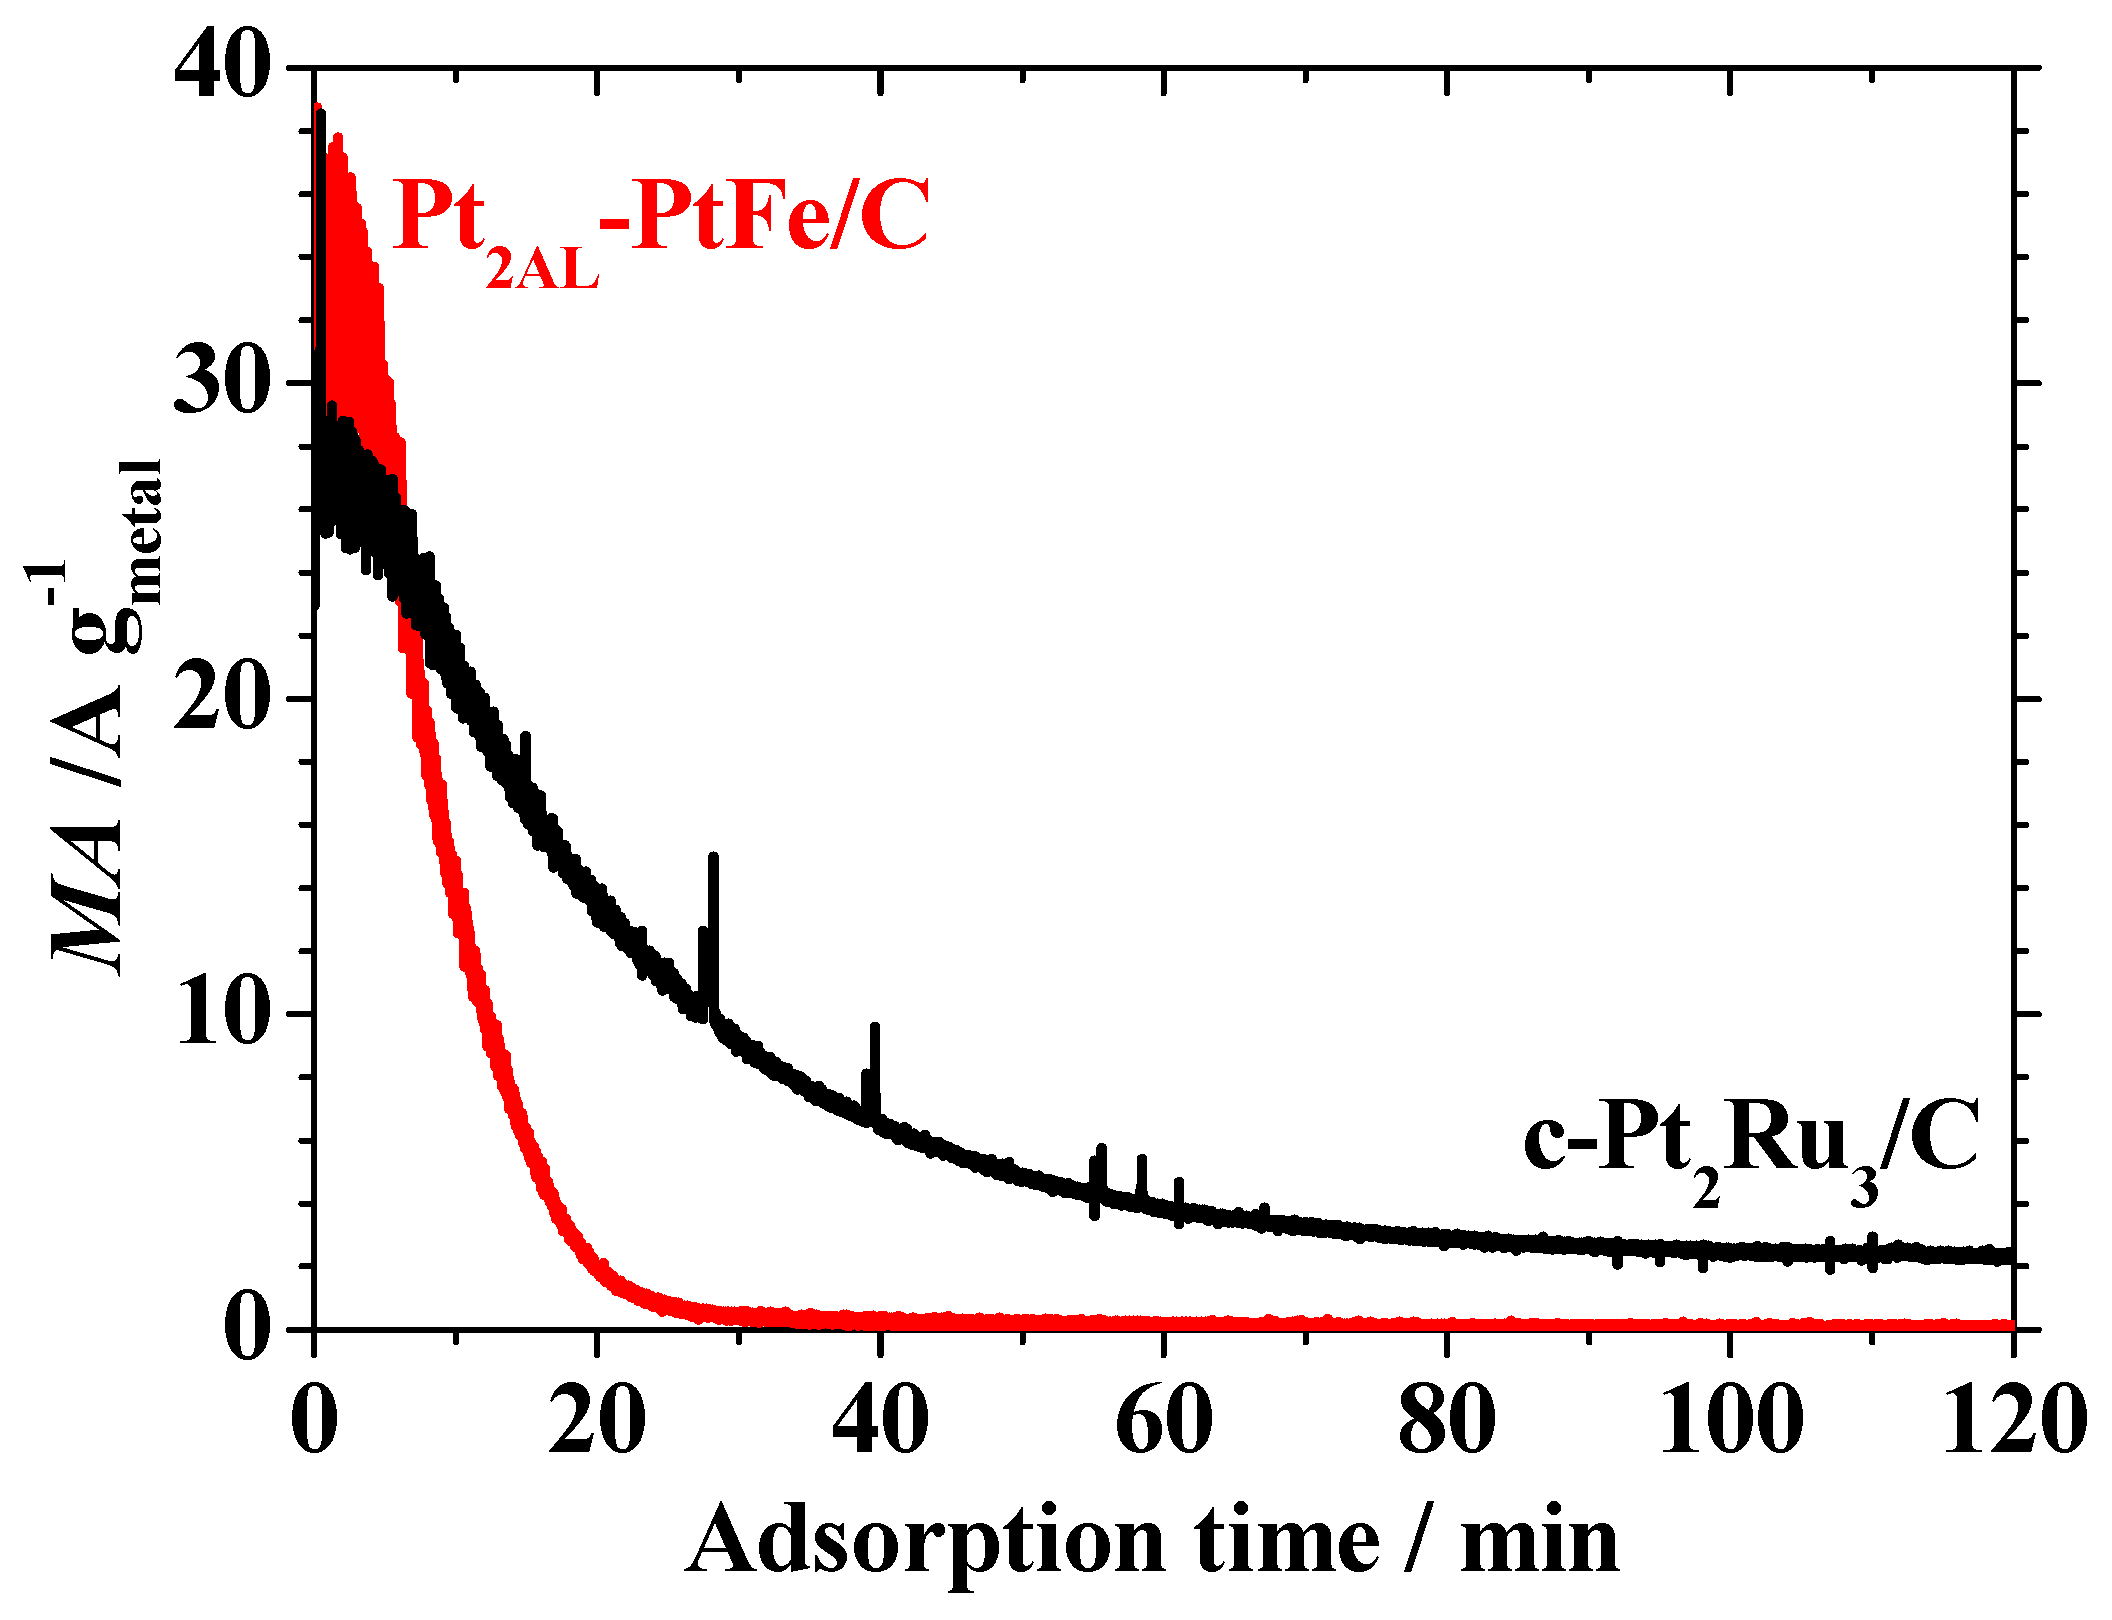
Figure 2 shows change in the HOR mass activity (MA, HOR current per unit metal mass) at 0.02 V vs. RHE during the in situ ATR-FTIR measurement of CO adsorption. The initial MA value (measured in pure H2-saturated solution) on the Pt2AL–PtFe/C catalyst (35 A gmetal−1) was ca. 1.3 times larger than that on the c-Pt2Ru3/C. Such an enhancement factor in the MA for the HOR of pure H2 on the Pt2AL–PtFe/C was smaller than that (ca. 2.5 times) measured in the CFE at 70 and 90 °C [10]. This is ascribed with certainty to the fact that it is difficult for all of the catalyst particles to work effectively for the HOR, because the thickness of the catalyst layer loaded on the ATR prism corresponded to about 6.5 monolayers of the carbon black particles (to increase the signal/noise ratio of the IR spectrum), whereas the amount of the catalyst loaded in the CFE cell was ca. two monolayers of carbon black particles to obtain the HOR activity in the ideal electrochemical condition. Focusing on the changes in the MA values during CO adsorption on both catalysts in Figure 2, the CO-poisoning rate at the Pt2AL–PtFe/C was rapid, losing 99% of MA after 30 min, whereas that at the c-Pt2Ru3/C was slower, so that about 10% of the initial 
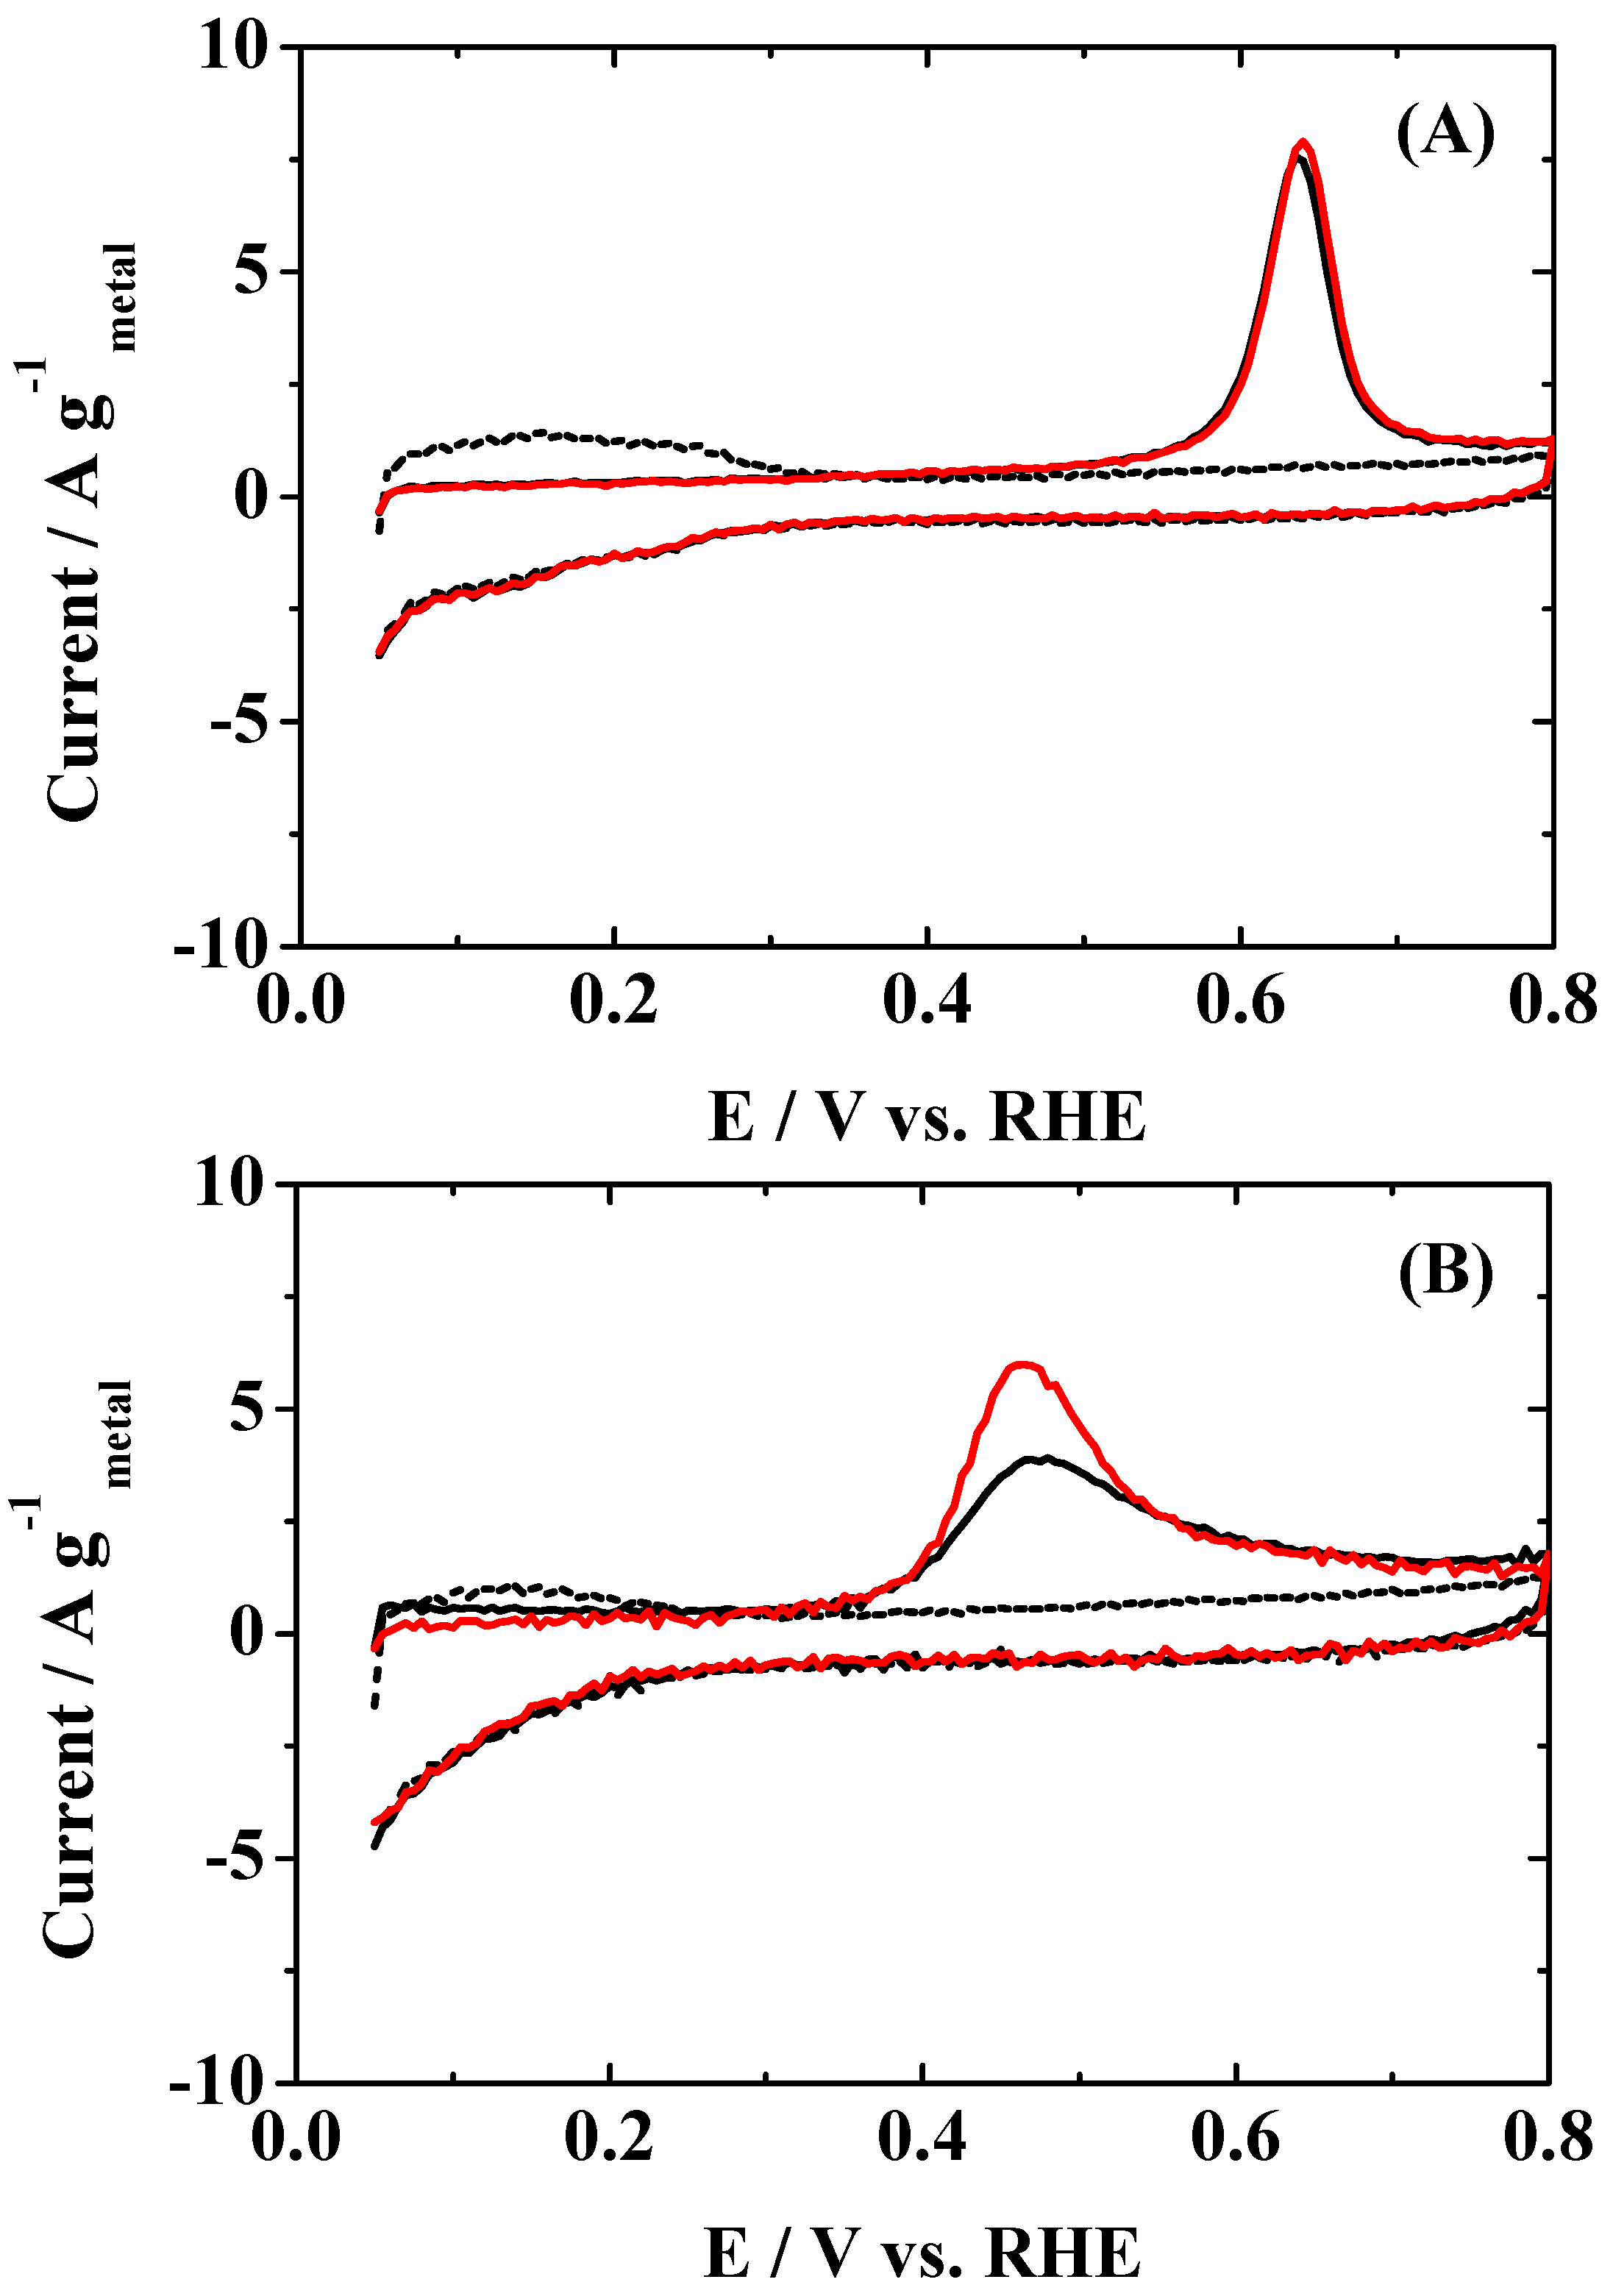
MA was still maintained after 2 h. Then, the CO coverage θCO on the surface just after the in situ ATR-FTIR measurement was evaluated from the CO-stripping voltammogram in N2-purged solution, as shown in Figure 3. The loss of MA on the Pt2AL–PtFe/C catalyst is reasonably explained by the θCO value of 0.99. The value of θCO on the c-Pt2Ru3/C catalyst was also 0.99, but, as stated above, the HOR activity was still maintained. It is clear that the adsorbed CO (COad) cannot be oxidized during the HOR at 0.02 V, even on c-Pt2Ru3/C, because the values of onset potential for the COad oxidation on Pt2AL–PtFe/C and c-P2tRu3/C were ca. 0.50 V and 0.33 V, respectively. The difference in the CO-tolerance will be discussed in more detail below.
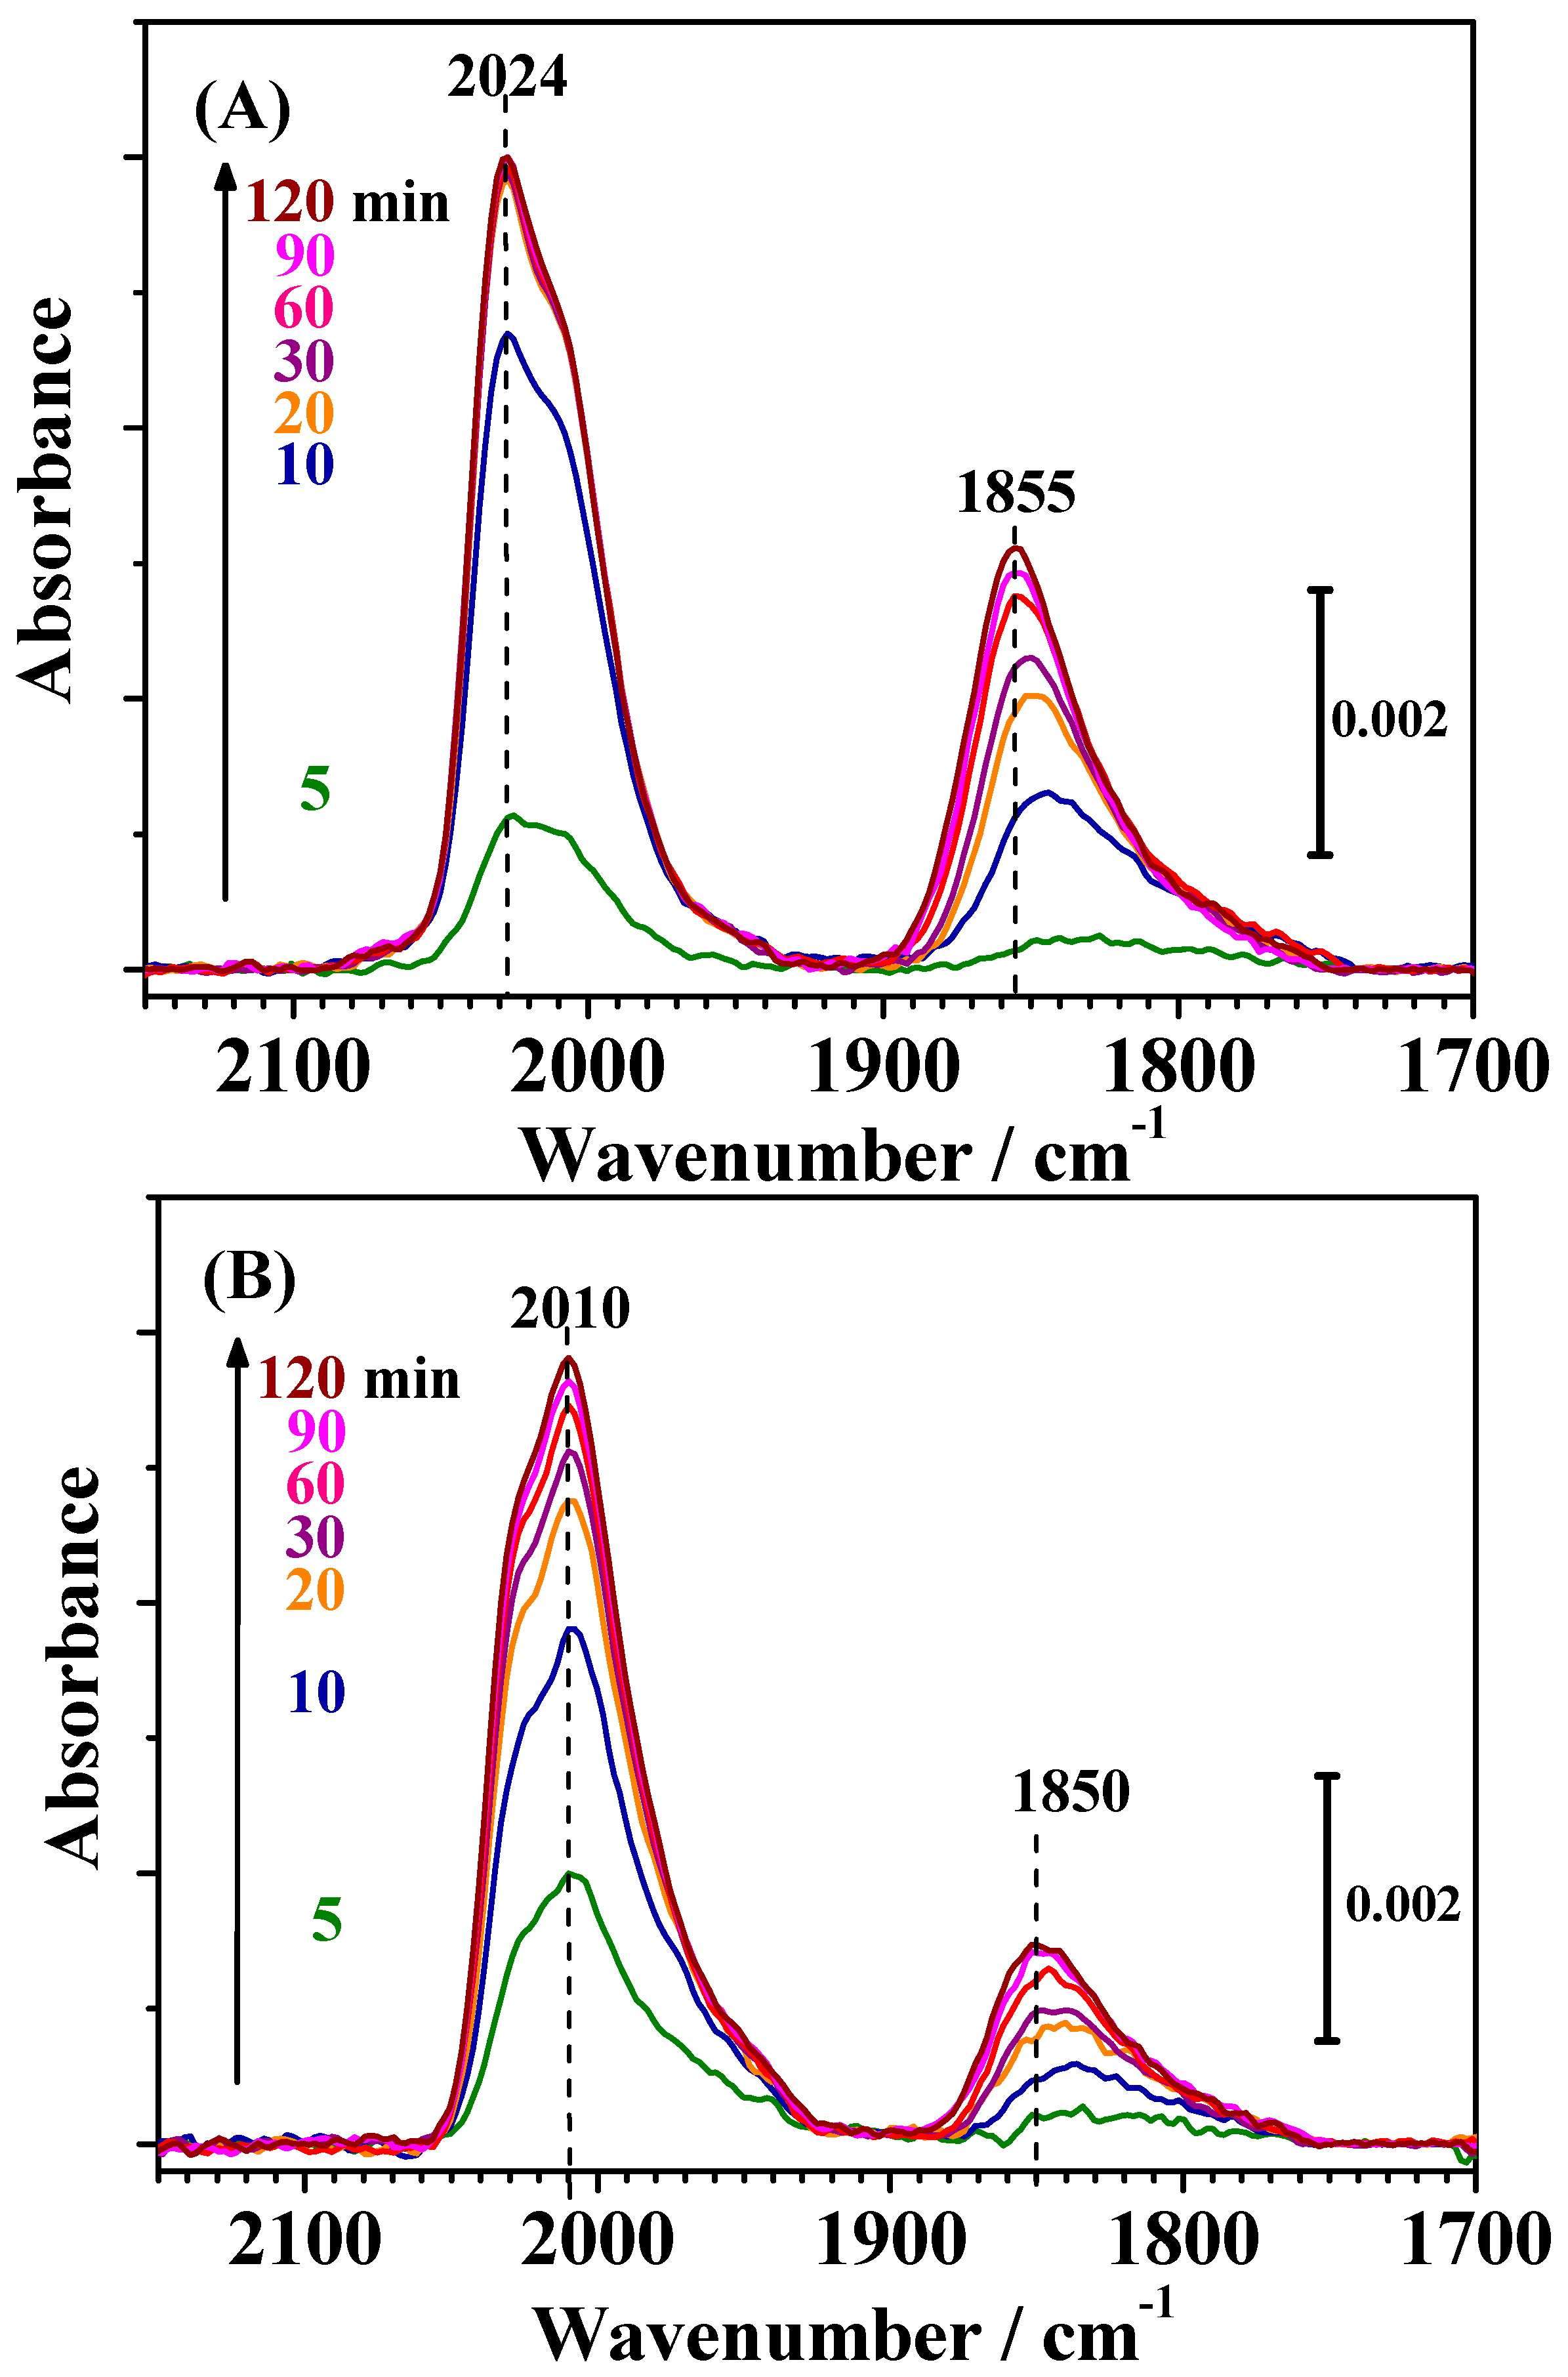
Figure 4 shows changes in the IR spectra observed on both catalysts during CO adsorption measured simultaneously with the HOR current shown in Figure 2. The bands observed for both catalysts around 2050–1950 cm−1 and 1900–1750 cm−1 were assigned to linearly adsorbed (on-top) CO on Pt [COL] and bridged CO on Pt-Pt pair sites [COB(Pt-Pt)], respectively [7,12,13,14]. A small band around 1950 cm−1 on c-Pt2Ru3/C (see Figure 5) was assigned to COad in a bridged configuration on Pt-Ru and/or Ru-Ru sites [CO-Ru, COB(Pt-Ru) or COB(Ru-Ru)] [13].
A nearly identical CO-Ru band around 1950 to 2020 cm−1 at high CO coverage was reported, but it was previously assigned to on-top CO on Ru sites for Ru-decorated Pt [15]. However, based on FTIR experiments carried out by the use of size-controlled Pt, Ru, and Pt-Ru particles, Baranova et al. clearly assigned such a band to COad bridged on Pt-Ru and/or Ru-Ru sites [16]. As has been observed for the CO adsorption process on various catalysts, the changes in the IR spectra in Figure 4 indicate that the bands consists of multiple components, which can be ascribed to COad in slightly different configurations or environments, specifically, terraces or step/edge sites [12,13].
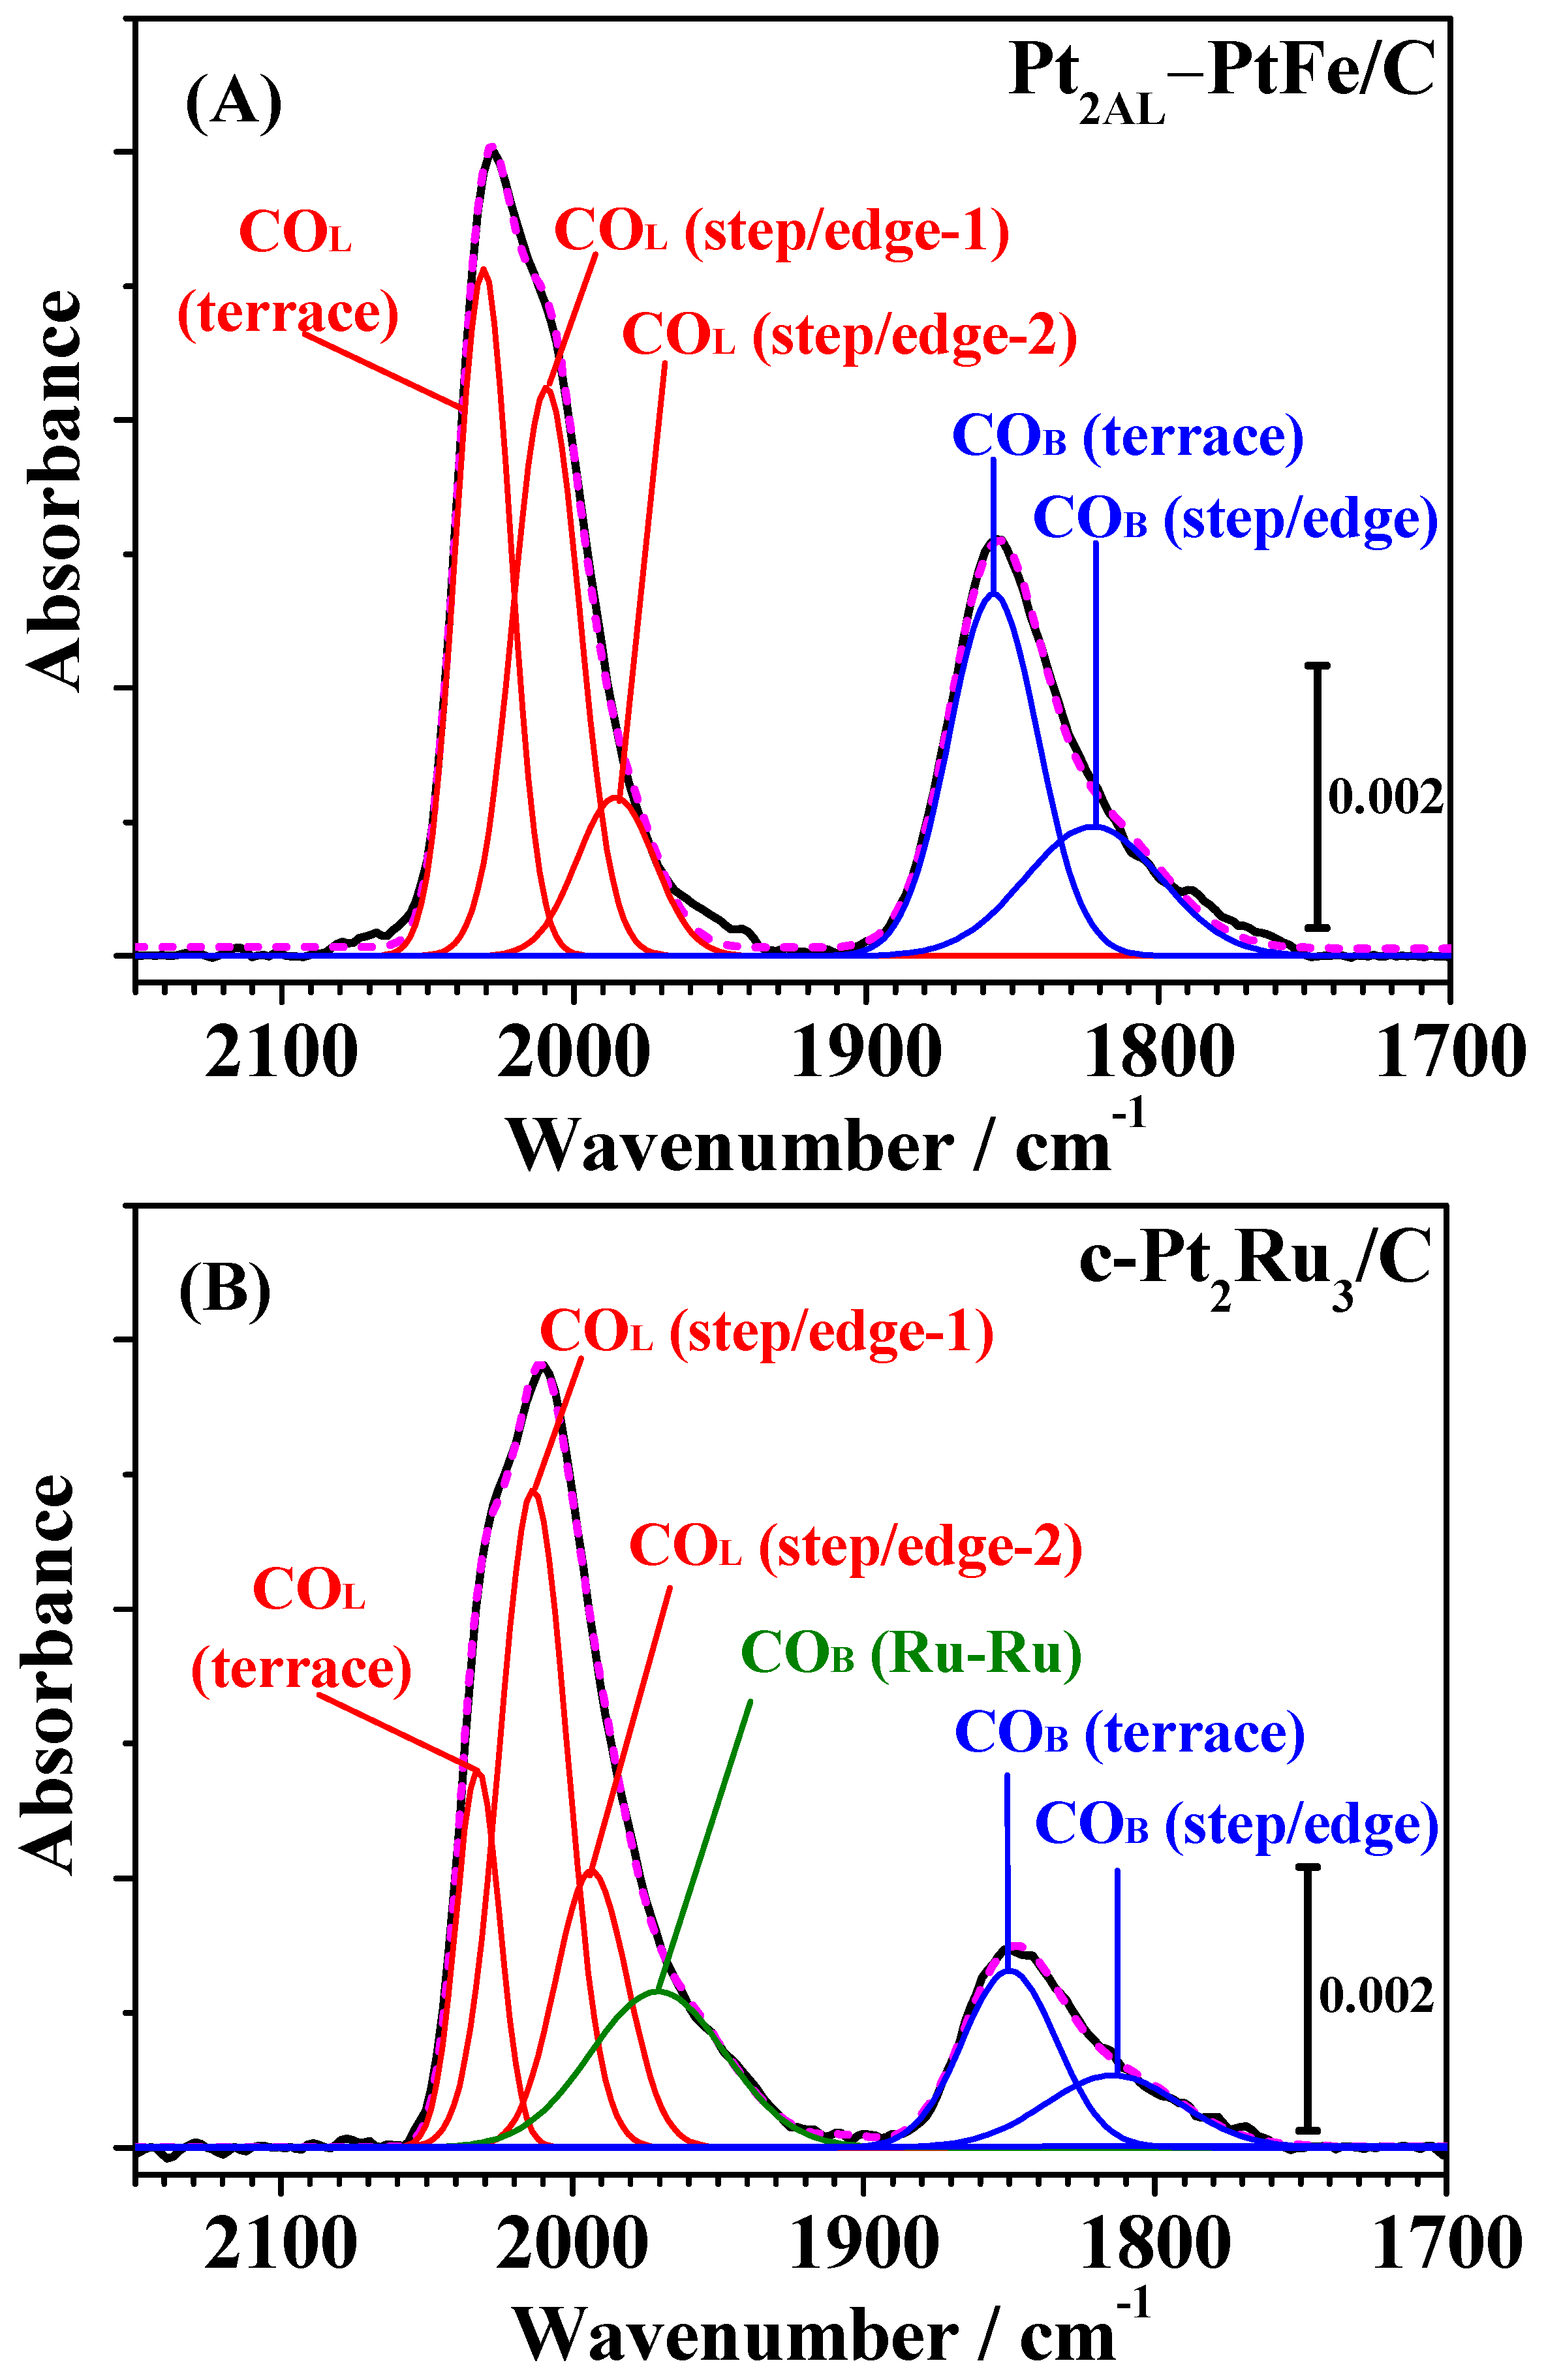
Then, these bands were deconvoluted into several symmetric Gaussian peaks, and curve fitting was carried out for all spectra assuming the full width at half maximum (FWHM) to be constant and allowing the peak maxima (wavenumber) and areas to vary, as described our previous work [7,12,13]. As shown in Figure 5, the FTIR spectra on Pt2AL–PtFe/C and c-Pt2Ru3/C were successfully deconvoluted into five and six components, respectively, with close correspondence between the fitted and measured spectra (see also Figure S2 in the Supplementary Materials, as another example of deconvolution of FTIR spectra measured after 1 h). The values of peak wavenumber and FWHM of all peaks are summarized in Table S1 in the Supplementary Materials. The COL band on c-Pt2Ru3/C was deconvoluted into three components, i.e., COL on Pt terrace sites (COL, terrace, 2031 cm−1) and two types of COL, on Pt step/edge sites (COL, step/edge-1, 2011 cm−1 and COL, step/edge-2, 1993 cm−1). These peak wavenumbers were very close to those previously reported for c-Pt2Ru3/C (same composition, but different lot number) measured at 25 °C [13]. The values of peak wavenumbers for the three types of COL on Pt2AL–PtFe/C were similar to those of c-Pt2Ru3/C. However, the ratio of integrated intensities of COL components was quite different so that the intensity of COL, terrace, I[COL, terrace], on c-Pt2Ru3/C was smaller than that for Pt2AL–PtFe/C. With respect to the ratio I[COL, step/edge] to I[COL, terrace], the number of atoms on the terraces and step/edges was calculated, based on a cuboctahedral model, for simplicity, for the fcc nanoparticles Pt2AL–PtFe with d = 2.9 nm and Pt2Ru3 with d = 3.5 nm. The calculation method [17,18] is shown in Section S1 in the Supplementary Materials. The number ratio of atoms at the step/edge to those at the terrace for Pt2AL–PtFe/C was calculated to be 57% (see in Table S2), which is in accord with the percentage of I[COL, step/edge]/I[COL, terrace] of 57% after CO adsorption for 2 h. In contrast, the value of I[COL, step/edge]/I[COL, terrace] at c-Pt2Ru3/C was as large as 73%, although the number ratio of atoms at the step/edge to those at the terrace was estimated to be 45%. Hence, even at θCO ≈ 0.99, the adsorption of COL at the terrace sites was suppressed on c-Pt2Ru3/C. This effect of the suppression of COL, terrace will be discussed later.
The bridged COad on Pt-Ru and/or Ru-Ru sites was approximated by a broad single band with a peak at 1967 cm−1, which will be denoted as CO-Ru. The COB(Pt-Pt) band on both catalysts was deconvoluted into two components: COB on Pt-Pt pairs on terraces and step/edges. The integrated intensity of COB(Pt-Pt), specifically on terraces, on the Pt2AL–PtFe/C was larger than that on c-Pt2Ru3/C, which is ascribed to the fact that two atomic layers of Pt-skin layers were formed on the PtFe alloy. However, it should be noted that the intensity ratio of I[COB(Pt-Pt)s] to I[COLs] observed on c-Pt2Ru3/C in Figure 3 and Figure 4 was larger than that reported previously [13], suggesting that a Pt-rich surface layer was formed on the present c-Pt2Ru3/C catalyst, while Ru sites were still present on the surface, because CO-Ru was observed. Thus, we found definite differences in the adsorption state of CO on Pt2AL–PtFe/C and c-Pt2Ru3/C in the CO adsorption experiment using in situ ATR-FTIR.

2.2. FTIR Analysis of Recovery of HOR Activity on CO-Adsorbed Catalysts

It is important to note that the apparently inferior CO-tolerance of the Pt2AL–PtFe/C catalyst is entirely inconsistent with that evaluated by the CFE [10]. Specifically, there were three differences in experimental conditions, i.e., temperatures (60 °C in the present work vs. 70 and 90 °C for the CFE experiment), CO concentrations (1% vs. 0.1%), and protocols. In the CFE experiment, CO was adsorbed on the catalysts by flowing 0.1 M HClO4 solution saturated with 0.1% CO/H2 for various time intervals, and the HOR activity was evaluated by a hydrodynamic voltammogram in pure H2-saturated solution, followed by the CO-stripping voltammogram in N2-purged solution to evaluate θCO. This protocol was employed to determine the dependence of HOR activity on θCO with a minimum change in θCO during the HOR measurement with a slow potential scan rate (1 mV·s−1). Then, we adopted a similar dynamic change of the atmosphere to the present in situ ATR-FTIR measurements at 60 °C. After CO adsorption by bubbling 1% CO/H2 for 30 min, pure H2 was introduced to saturate the electrolyte solution, to remove dissolved CO. Lastly, the θCO values on the catalyst were evaluated by measuring the CO-stripping voltammogram.
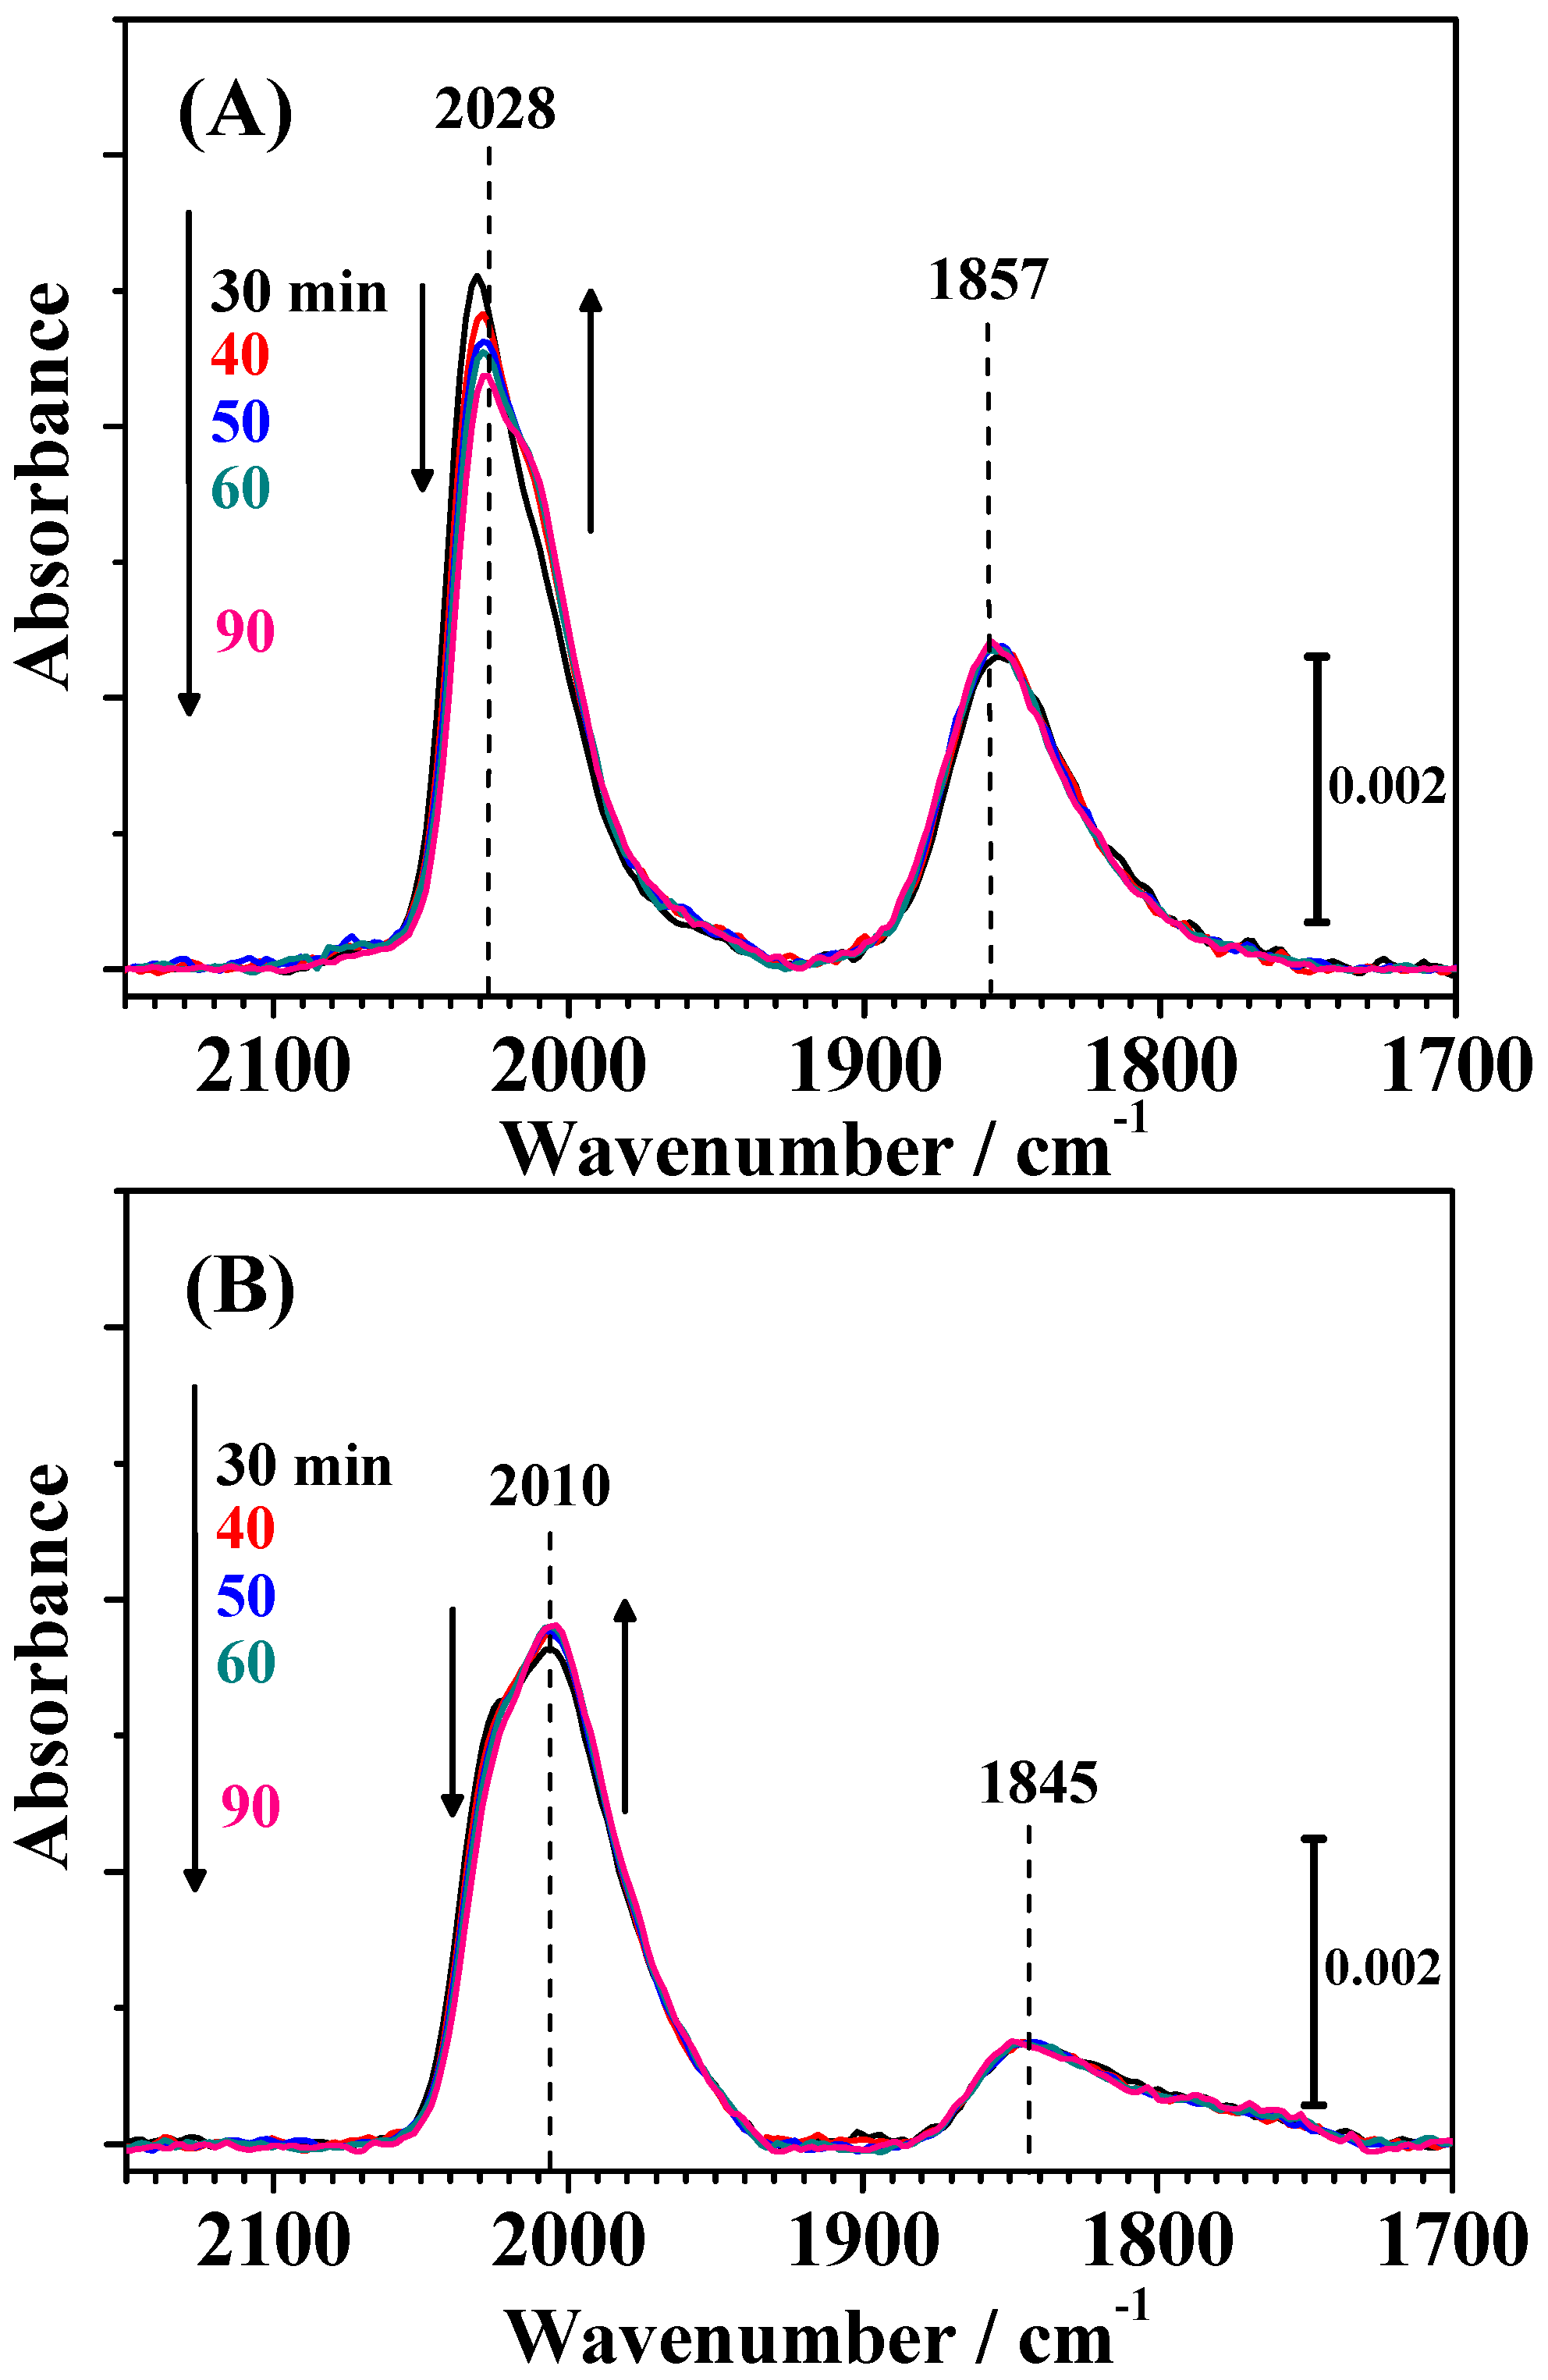
Changes in the IR spectra during CO adsorption on both catalysts for 30 min (shown in Figure S1 in the Supplementary Materials) were, of course, nearly identical with the corresponding time intervals shown in Figure 4. As shown in Figure 6, small changes in the shape of the COL band were observed by the introduction of pure H2 in the solution. The MA for the HOR on both catalysts decreased by CO adsorption similarly to the case of Figure 2, but the MA recovered appreciably just after bubbling pure H2, as shown in Figure 7A. For example, the MA on the Pt2AL–PtFe/C increased from only 1% of the initial value to as high as 22%. To examine the changes in the IR spectra, time courses of integrated intensities of all peaks were plotted in Figure 7B,C. When the CO-adsorbed Pt2AL–PtFe/C catalyst was contacted with CO-free pure H2, the I[COL, terrace] decreased by ca. 20% after 60 min of H2 bubbling, accompanied by an increase in I[COL, step/edge-1] by ca. 13%. Only a slight decrease in I[COB, step/edge] was seen, while I[COB, terrace] was nearly unchanged. It is striking that the θCO evaluated (solid black line in Figure 3A) was still 0.99 even after H2 bubbling for 60 min, suggesting that the recovery of the HOR activity can be ascribed to a transfer of COad within the surface, not by a removal of COad from the surface. For the case of c-Pt2Ru3/C, the MA increased from 14% of the initial value to 52% after 60 min of H2 bubbling, where I[COL, terrace] decreased by ca. 12% with an increase in I[COL, step/edge-1] by 8%. The I[CO-Ru] was nearly unchanged during the recovery of the MA. A decrease in I[COB, step/edge] (about 10%) was larger than that for Pt2AL–PtFe/C. Because the value of θCO evaluated was 0.74, in accord with the remaining MA (24%) at 30 min of CO adsorption, the θCO on c-Pt2Ru3/C was, with certainty, unchanged even after H2 bubbling for 60 min, similar to the case for Pt2AL–PtFe/C.
Here, we discuss a mechanism for the recovery of the HOR activity on CO-adsorbed catalysts by contacting with CO-free pure H2. It has been reported for Pt2Ru3/C catalysts that the presence of a Pt-rich surface overlaid upon Pt-Ru alloy was essential in providing the HOR active sites by weakening the CO adsorption on Pt [13]. The Pt-rich surface of the present c-Pt2Ru3/C satisfies this criterion. In our previous work on the CO-tolerance of Pt2Ru3 nanoparticles dispersed on carbon black and Sb-SnO2, we proposed a possible mechanism that the electronic modification (ligand effect) of Pt2Ru3 nanoparticles by the Sb-SnO2 support gave rise to a weakening of the COL, terrace adsorption and suppression of COL, step/edge [7]. In ref. [19], the Pt(110) surface exhibited the highest catalytic activity for the HOR, in comparison to those for Pt(111) and Pt(100). Truncated octahedral or truncated cuboctohedral Pt-based (fcc) nanoparticles include (111) and (100) terraces, with (110)-like sites at the edges between two (111) facets. In addition, (110) steps exist on the (111) terraces. Both of these types of (110) sites can be HOR-active. Thus, we considered that, in order to improve CO-tolerant HOR activity on the Pt2Ru3/Sb-SnO2 catalyst, lowering the coverage of COL, step/edge could be beneficial. However, very recently, we proposed a modified HOR mechanism [10] in which, after H2 dissociates at the step/edges, the dissociated H atoms can “spill over” to the (111) terraces, which can accommodate larger numbers of atoms, prior to oxidative desorption:
H2,sol → H2,ad(step)
H2,ad(step) → 2Had(step) (Tafel step)
2Had(step) → 2Had(terrace) (spillover step)
2Had(terrace) → 2H+sol + 2e (Volmer step)
In this mechanism, H2 adsorbs and spontaneously dissociates at step sites due to stronger adsorption of H2 at these sites, since H2 cannot compete with water adsorption on the terraces. After dissociation, however, the H atoms can compete with water more successfully on the terraces, and, even though the adsorption strength would still be larger at the steps at the same coverage, at high coverage, decreased adsorption strength at the steps might allow H to move to the terraces.
This mechanism was derived to explain the orders of CO-tolerant HOR activities of various catalysts (Pt2AL–PtFe > Pt2AL–PtCo > Pt2AL–PtNi > PtRu > Pt) in the CFE experiments [10]. Increased HOR activity was considered to correlate with decreased H adsorption strength on (111) terraces. However, the results shown in Figure 7 can also be well explained by this HOR mechanism. The decrease in the coverage of COL, terrace would result in an increased number of active sites for reaction (4) on the terrace, assuming that the dissociation rate of H2 were maintained at the step/edge, for example, step/edge-2. A decrease in the coverage of COB, step/edge would also be beneficial for reactions (1) and (2), because two Pt active sites (Pt-Pt pair site) are formed by the desorption of one COB. Furthermore, the mobility of COad would be enhanced with increasing temperature, consistent with our observation of excellent CO-tolerance for Pt2AL–PtFe/C at 70 and 90 °C. According to our DFT calculations on nearly all of the surfaces studied, we found that at both step edges and terraces, CO adsorption is stronger by approximately 1 eV compared with the adsorption of atomic hydrogen. Hence, as is well known, the CO concentration must be maintained at very low levels in order for H to compete effectively with CO for adsorption sites.
Even though the use of 1% CO was a very challenging condition for both Pt2AL–PtFe/C and c-Pt2Ru3/C, we have, for the first time, observed the recovery of the HOR activity of these CO-adsorbed catalysts (without removal of COad) and clarified the mechanism correlated with the mobility of COad to create HOR active sites. Such an enhanced mobility of COad can be ascribed to a modification of the electronic structure of the Pt2AL skin on PtFe alloy and the Pt-rich layer on PtRu alloy.

3. Experimental Section

The Pt2AL–PtFe/C catalyst (31.5 wt. % metal loading) was prepared by the use of a high surface area (specific surface area = 780 m2·g−1) carbon black support (Denka Co. Ltd., Tokyo, Japan) in the same manner as that described previously [11,20]. A commercial catalyst c-Pt2Ru3/C (TEC61E54, 50 wt. % metal loading on high-surface-area carbon black, 800 m2·g−1, Tanaka Kikinzoku Kogyo, Japan) was used for comparison. Their microstructure was observed by transmission electron microscopy (TEM, H-9500, acceleration voltage = 200 kV, Hitachi High-Tech Co. Ltd., Tokyo, Japan).
In situ attenuated total reflection Fourier transform infrared reflection spectroscopy (ATR-FTIR) was employed to analyze the CO-tolerant mechanism at the Pt2AL–PtFe/C and c-Pt2Ru3/C catalysts at 60 °C. The spectro-electrochemical cell was first reported by Ataka et al. [21], and we modified it to measure the IR spectrum on practical electrocatalysts of Pt or Pt-alloy nanoparticles supported on carbon black. Details of the experimental setup and the procedure of the ATR-FTIR can be found in our previous paper [13]: the cell used is schematically shown in Figure S3 of the Supplementary Materials. The Nafion-coated Pt2AL–PtFe/C (15 μgPt·cm−2) or c-Pt2Ru3/C (10 μgPt·cm2) layer was prepared on an Au film electrode deposited on an Si ATR prism. This amount of catalyst was chosen to ensure a high signal/noise ratio of the IR spectrum. The average thickness of Nafion was 0.013 μm and the geometric surface area of the working electrode was 1.72 cm2. The Nafion-coated working electrode was finally heated at 130 °C for 30 min in air. The electrolyte solution used for all experiments was 0.1 M HClO4 prepared from suprapur-grade HClO4 (Merck, Frankfurt, Germany) and Milli-Q water.
The ATR-FTIR measurements were carried out in a class 1000 clean room maintaining a constant temperature of 25 °C and humidity of 40% RH. A spectrometer (FTS7000, DIGILAB, Inc., Holliston, MA, USA) with an MCT detector was used. The spectral resolution was set at 4 cm−1 with an interferometer scan of 40 kHz. All IR spectra are displayed in absorbance units, log (I0/I), where I0 and I are the spectral intensities of the reference state and the sample, respectively. The reference electrode employed was an RHE. Prior to all measurements, the working electrode surface was cleaned by repeated potential cycles of 0.05–1.00 V for Pt2AL–PtFe/C and 0.05–0.80 V vs. RHE for c-Pt2Ru3/C at 0.05 V·s−1 in N2-purged 0.1 M HClO4. Then, we measured the initial HOR current and a reference spectrum at 0.02 V in 0.1 M HClO4 saturated with H2 (UHP grade, 99.9999%) with an average of 500 interferograms.
Next, we monitored the FTIR spectra (one spectrum averaged for 10 s) and HOR current on the working electrode at 0.02 V vs. RHE during CO adsorption by two protocols. The first protocol was a simple CO adsorption experiment, in which H2 gas containing 1% CO was bubbled in the electrolyte solution at a flow rate 10 mL·min−1 continuously for 2 h. Such a high concentration of 1% CO was chosen to analyze the CO adsorption under an accelerated condition. The second protocol involved CO adsorption followed by purging with pure H2 to observe the recovery process of HOR activity. CO was adsorbed on the working electrode at 0.02 V vs. RHE by bubbling 1% CO (H2-balance) in the same manner as described above for 30 min, and CO-free pure H2 gas was bubbled in the electrolyte solution at a flow rate 10 mL·min−1 for 60 min.
Immediately after the completion of the in situ ATR-FTIR measurements, the CO coverage θCO on the catalyst surface was evaluated from the CO-stripping voltammogram. After adsorption of CO at 0.02 V, the CO dissolved in 0.1 M HClO4 was removed by bubbling N2 gas for 30 min, followed by a potential sweep from 0.05 to 0.80 V at 0.02 V·s−1. The value of θCO was defined as the ratio of the sites occupied by COad to the CO-free electrochemically active sites,
θCO = 1 − (COQH/SQH)
where COQH and SQH are the hydrogen desorption charges with and without COad, respectively.

4. Conclusions

The CO-tolerant HOR activities on Pt2AL–PtFe/C and c-Pt2Ru3/C catalysts were examined by use of in situ ATR-FTIRAS in 0.1 M HClO4 at 60 °C. In an experiment with continuous bubbling of high concentration CO (1% in H2) at 60 °C, the CO-tolerance for Pt2AL–PtFe/C was inferior to that for c-Pt2Ru3/C: the former lost 99% of the initial mass activity (MA) for the HOR after 30 min, whereas about 10% of the initial MA was maintained on the latter after 2 h. Based on the analysis of the IR spectra, this CO-tolerance was ascribed to the suppression of the adsorption of COL on terrace sites. In the second experiment, involving CO adsorption followed by introduction of CO-free H2, the HOR activities of both catalysts with high θCO were found to recover appreciably after bubbling with pure H2. Such a recovery of the HOR activity of CO-adsorbed catalysts can be ascribed to an increase in the number of open sites for the HOR, probably due to a transfer of COL, terrace to COL, step/edge, without removal of COad from the surface. This result can be explained based on a modified HOR mechanism proposed recently [10]. It was suggested that the mobility of COL, terrace on Pt2AL–PtFe/C might be high, compared with that on c-Pt2Ru3/C. Such an enhanced mobility of COad was ascribed, with a certainty, to a modification of the electronic structure of the Pt2AL skin on the PtFe alloy and the Pt-rich layer on the PtRu alloy.

Supplementary Materials

The following are available online at www.mdpi.com/2073-4344/7/1/8/s1, Table S1: Values of peak wavenumber and the full width at half maximum (FWHM) used for the deconvolution of FTIR spectra on Pt2AL–PtFe/C and c-Pt2Ru3/C shown Figure 5. The integrated intensity of each peak after 2 h of CO adsorption is also shown., Figure S1: Changes in FTIR spectra observed on Nafion-coated (A) Pt2AL–PtFe/C and (B) c-Pt2Ru3/C electrodes at 0.02 V and 60 °C during CO adsorption in 0.1 M HClO4 with bubbling 1% CO (H2 balance) for 30 min in the experiment shown in Figure 7., Figure S2: Deconvolution of FTIR spectra observed on (A) Pt2AL–PtFe/C and (B) c-Pt2Ru3/C at 0.02 V and 60 °C after 1 h of 1% CO/H2 gas bubbling in 0.1 M HClO4. Figure S3.: Schematic illustration of electrochemical cell for ATR. Section S1: Calculation of the number of atoms at terraces and step/edges of a cuboctohedral Pt2AL–PtFe and Pt2Ru3 fcc particle with the particle size d, according to the method in refs. [17,18]. Table S2: Number of atoms calculated based on a cuboctohedral shape of Pt2AL–PtFe and Pt2Ru3 fcc nanoparticles.

Acknowledgments

This work was supported by funds for the “Superlative, Stable, and Scalable Performance Fuel Cells” (SPer-FC) project from the New Energy and Industrial Technology Development Organization (NEDO) of Japan.

Author Contributions

This work was coordinated by Hiroyuki Uchida. Yoshiyuki Ogihara performed all measurements of in situ ATR-FTIR. Hiroshi Yano contributed to the preparation and characterization (STEM, TEM) of Pt2AL–PtFe/C catalysts. Takahiro Matsumoto contributed to the in situ ATR-FTIR measurement. Donald A. Tryk contributed to the analysis of the CO-tolerant HOR mechanism with DFT calculations. Akihiro Iiyama contributed to the analysis of CO-tolerance. All of the authors contributed equally to the data interpretation and discussion. Yoshiyuki Ogihara prepared the manuscript, and Hiroyuki Uchida revised the final version of the paper.

Conflicts of Interest

The authors declare no conflict of interest.

References

  1. “Summary of the Strategic Road Map for Hydrogen and Fuel Cells”, by Agency for Natural Resources and Energy (June 23, 2014, METI, Japan). Available online: http://www.meti.go.jp/english/press/2014/pdf/0624_04a.pdf (accessed on 28 December, 2016).
  2. Martínez-Huerta, M.V.; Rodríguez, J.L.; Tsiouvaras, N.; Peña, M.A.; Fierro, J.L.G.; Pastor, E. Novel Synthesis Method of CO-Tolerant PtRu-MoOx Nanoparticles: Structural Characteristics and Performance for Methanol Electrooxidation. Chem. Mater. 2008, 20, 4249–4259. [Google Scholar] [CrossRef]
  3. Takeguchi, T.; Kunifuji, A.; Narischat, N.; Ito, M.; Noguchi, H.; Uosaki, K.; Mukai, S.R. Ligand Effect of SnO2 on a Pt-Ru Catalyst and the Relationship Between Bond Strength and CO Tolerance. Catal. Sci. Technol. 2016, 6, 3214–3219. [Google Scholar] [CrossRef]
  4. Wang, G.; Takeguchi, T.; Muhamad, E.N.; Yamanaka, T.; Ueda, W. Effect of Addition of SnOx to the Pt2Ru3/C Catalyst on CO Tolerance for the Polymer Electrolyte Fuel Cell. J. Electrochem. Soc. 2011, 158, B448–B453. [Google Scholar] [CrossRef]
  5. Devaux, D.; Yano, H.; Uchida, H.; Dobois, J.-L.; Watanabe, M. Electro-Oxidation of Hydrolysed Ploy-Oxymethylene-Dimethylether on PtRu Supported Catalysts. Electrochim. Acta 2001, 56, 1460–1465. [Google Scholar] [CrossRef]
  6. Villullas, H.M.; Mattos-Costa, F.I.; Bulhoes, L.O.S. Electrochemical Oxidation of Methanol on Pt Nanoparticles Dispersed on RuO2. J. Phys. Chem. B 2004, 108, 12898–12903. [Google Scholar] [CrossRef]
  7. Ogihara, Y.; Yano, H.; Watanabe, M.; Iiyama, A.; Uchida, H. Effect of an Sb-SnO2 Support on the CO-Tolerance of Pt2Ru3 Nanocatalysts for Residential Fuel Cells. Catalysts 2016, 6, 139. [Google Scholar] [CrossRef]
  8. Hsieh, Y.C.; Zhang, Y.; Su, D.; Volkov, V.; Si, R.; Wu, L.J.; Zhu, Y.M.; An, W.; Liu, P.; He, P.; et al. Ordered Bilayer Ruthenium-Platinum Core-Shell Nanoparticles as Carbon Monoxide-Tolerant Fuel Cell Catalysts. Nat. Commun. 2013, 4, 2466. [Google Scholar] [CrossRef] [PubMed]
  9. Shi, G.Y.; Yano, H.; Tryk, D.A.; Watanabe, M.; Iiyama, A.; Uchida, H. A Novel Pt-Co Alloy Hydrogen Anode Catalyst with Superlative Activity, CO-Tolerance and Robustness. Nanoscale 2016, 8, 13893–13897. [Google Scholar] [CrossRef] [PubMed]
  10. Shi, G.Y.; Yano, H.; Tryk, D.A.; Watanabe, M.; Iiyama, A.; Uchida, H. Highly Active, CO-Tolerant and Robust Hydrogen Anode Catalysts: Pt-M (M = Fe, Co, and Ni) Alloys with Stabilized Pt Skin Layers. ACS Catal. 2017, 7, 267–274. [Google Scholar] [CrossRef]
  11. Chiwata, M.; Yano, H.; Ogawa, S.; Watanabe, M.; Iiyama, A.; Uchida, H. Oxygen Reduction Reaction Activity of Carbon-Supported Pt-Fe, Pt-Co, and Pt-Ni Alloys with Stabilized Pt-Skin Layers. Electrochemistry 2016, 84, 133–137. [Google Scholar] [CrossRef]
  12. Sato, T.; Okaya, K.; Kunimatsu, K.; Yano, H.; Watanabe, M.; Uchida, H. Effect of Particle Size and Composition on CO-Tolerance at Pt-Ru/C Catalysts Analyzed by In Situ Attenuated Total Reflection FTIR Spectroscopy. ACS Catal. 2012, 2, 450–455. [Google Scholar] [CrossRef]
  13. Sato, T.; Kunimatsu, K.; Okaya, K.; Yano, H.; Watanabe, M.; Uchida, H. In situ ATR-FTIR Analysis of the CO-Tolerance Mechanism on Pt2Ru3/C Catalysts Prepared by the Nanocapsule Method. Energy Environ. Sci. 2011, 4, 433–438. [Google Scholar] [CrossRef]
  14. Kunimatsu, K.; Sato, T.; Uchida, H.; Watanabe, M. Role of Terrace/Step Edge Sites in CO Adsorption/Oxidation on a Polycrystalline Pt Electrode Studied by In Situ ATR-FTIR Method. Electrochim. Acta 2008, 53, 6104–6110. [Google Scholar] [CrossRef]
  15. Park, S.; Wieckowski, A.; Weaver, M.J. Electrochemical Infrared Characterization of CO Domains on Ruthenium-Decorated Platinum Nanoparticles. J. Am. Chem. Soc. 2003, 125, 2282–2290. [Google Scholar] [CrossRef] [PubMed]
  16. Baranova, E.A.; Bock, C.; Ilin, D.; Wang, D.; MacDougall, B. Infrared spectroscopy on size-controlled synthesized Pt-based nano-catalysts. Surf. Sci. 2006, 600, 3502–3511. [Google Scholar] [CrossRef]
  17. Benfield, R.E. Mean Coordination Numbers and the Non-Metal Transition in Clusters. J. Chem. Soc. Faraday Trans. 1992, 88, 1107–1110. [Google Scholar] [CrossRef]
  18. Okaya, K.; Yano, H.; Kakinuma, K.; Watanabe, M.; Uchida, H. Temperature Dependence of Oxygen Reduction Reaction Activity at Stabilized Pt Skin–PtCo Alloy/Graphitized Carbon Black Catalysts Prepared by a Modified Nanocapsule Method. ACS Appl. Mater. Interfaces 2012, 4, 6982–6991. [Google Scholar] [CrossRef] [PubMed]
  19. Markovic, N.M.; Grgur, B.N.; Ross, P.N. Temperature-Dependent Hydrogen Electrochemistry on Platinum Low-Index Single-Crystal Surfaces in Acid Solutions. J. Phys. Chem. B 1997, 101, 5405–5413. [Google Scholar] [CrossRef]
  20. Watanabe, M.; Yano, H.; Tryk, D.A.; Uchida, H. Highly Durable and Active PtCo Alloy/Graphitized Carbon Black Cathode Catalysts by Controlled Deposition of Stabilized Pt Skin Layers. J. Electrochem. Soc. 2016, 163, F455–F463. [Google Scholar] [CrossRef]
  21. Ataka, K.; Yotsuyanagi, T.; Osawa, M. Potential-Dependent Reorientation of Water Molecules at an Electrode/Electrolyte Interface Studied by Surface-Enhanced Infrared Absorption Spectroscopy. J. Phys. Chem. 1996, 100, 10664–10672. [Google Scholar] [CrossRef]
Figure 1. TEM images and particle size distribution histograms of pristine (A) Pt2AL–PtFe/C and (B) c-Pt2Ru3/C.
Catalysts 07 00008 g001
Figure 2. Change in the mass activity (MA) for the HOR at 0.02 V on Nafion-coated Pt2AL–PtFe/C and c-Pt2Ru3/C electrodes at 0.02 V and 60° C in 0.1 M HClO4 during CO adsorption by bubbling 1% CO/H2.
Catalysts 07 00008 g002
Figure 3. CO stripping voltammograms at Nafion-coated (A) Pt2AL–PtFe/C and (B) c-Pt2Ru3/C electrodes measured in N2-purged 0.1 M HClO4 at 60 °C and potential sweep rate of 0.02 V·s−1. Dotted lines indicate the blank CVs on the CO-free electrodes. CVs were measured at 120 min in Figure 2 (red solid line) and 90 min in Figure 7 see below (black solid line).
Catalysts 07 00008 g003
Figure 4. Changes in FTIR spectra observed on Nafion-coated (A) Pt2AL–PtFe/C and (B) c-Pt2Ru3/C electrodes at 0.02 V and 60 °C during CO adsorption in 0.1 M HClO4 with bubbling 1% CO (H2 balance) for 120 min.
Catalysts 07 00008 g004
Figure 5. Deconvolution of FTIR spectra observed on (A) Pt2AL–PtFe/C and (B) c-Pt2Ru3/C at 0.02 V and 60 °C after 2 h of 1% CO/H2 gas bubbling in 0.1 M HClO4. The COL bands in the 2050–1950 cm−1 region were deconvoluted into three components, which were assigned to COL on terrace and step/edge sites, respectively. The COad bridged on Pt-Ru and/or Ru-Ru sites was approximated by a broad single band with peak at 1967 cm−1, which will be denoted as CO-Ru on c-Pt2Ru3/C. The COB bands in the 1850–1790 cm−1 region were also deconvoluted into two components, which were assigned to COB on terrace and step/edge sites. The experimental spectra in (A) and (B) were normalized to the total intensities of peaks assigned to COL, I[COL]; ( Catalysts 07 00008 i001) experimental spectrum, ( Catalysts 07 00008 i002) sum of all peaks, ( Catalysts 07 00008 i003) COL peaks, ( Catalysts 07 00008 i004) CO-Ru peaks, and ( Catalysts 07 00008 i005) COB peaks.
Catalysts 07 00008 g005
Figure 6. Changes in FTIR spectra observed on CO-adsorbed electrodes of (A) Pt2AL–PtFe/C and (B) c-Pt2Ru3/C at 0.02 V and 60 °C in 0.1 M HClO4 during a recovery process of HOR by bubbling CO-free pure H2 for 60 min (see Figure 7 below). CO was pre-adsorbed by bubbling 1% CO/H2 for 30 min, and time intervals shown in (A) and (B) correspond to those from 30 min, at which time the gas was changed from 1% CO/H2 to pure H2.
Catalysts 07 00008 g006
Figure 7. Time courses of the mass activity (MA) for the HOR (A) and integrated intensities of I[COL] (B), and I[COB] (C) observed at 0.02 V and 60 °C in 0.1 M HClO4. First, CO was adsorbed on the working electrode at 0.02 V by bubbling 1% CO (H2-balance) at a flow rate of 10 mL·min−1 for 30 min, and CO-free pure H2 gas was then bubbled in the solution at a flow rate 10 mL·min−1 for an additional 60 min.
Catalysts 07 00008 g007

